
Numerical Simulation on Smoke Temperature Distribution in a Large Indoor Pedestrian Street Fire
Abstract
:1. Introduction
2. Numerical Simulation Parameter Setting and Experimental Verification
2.1. Introduction of PyroSim
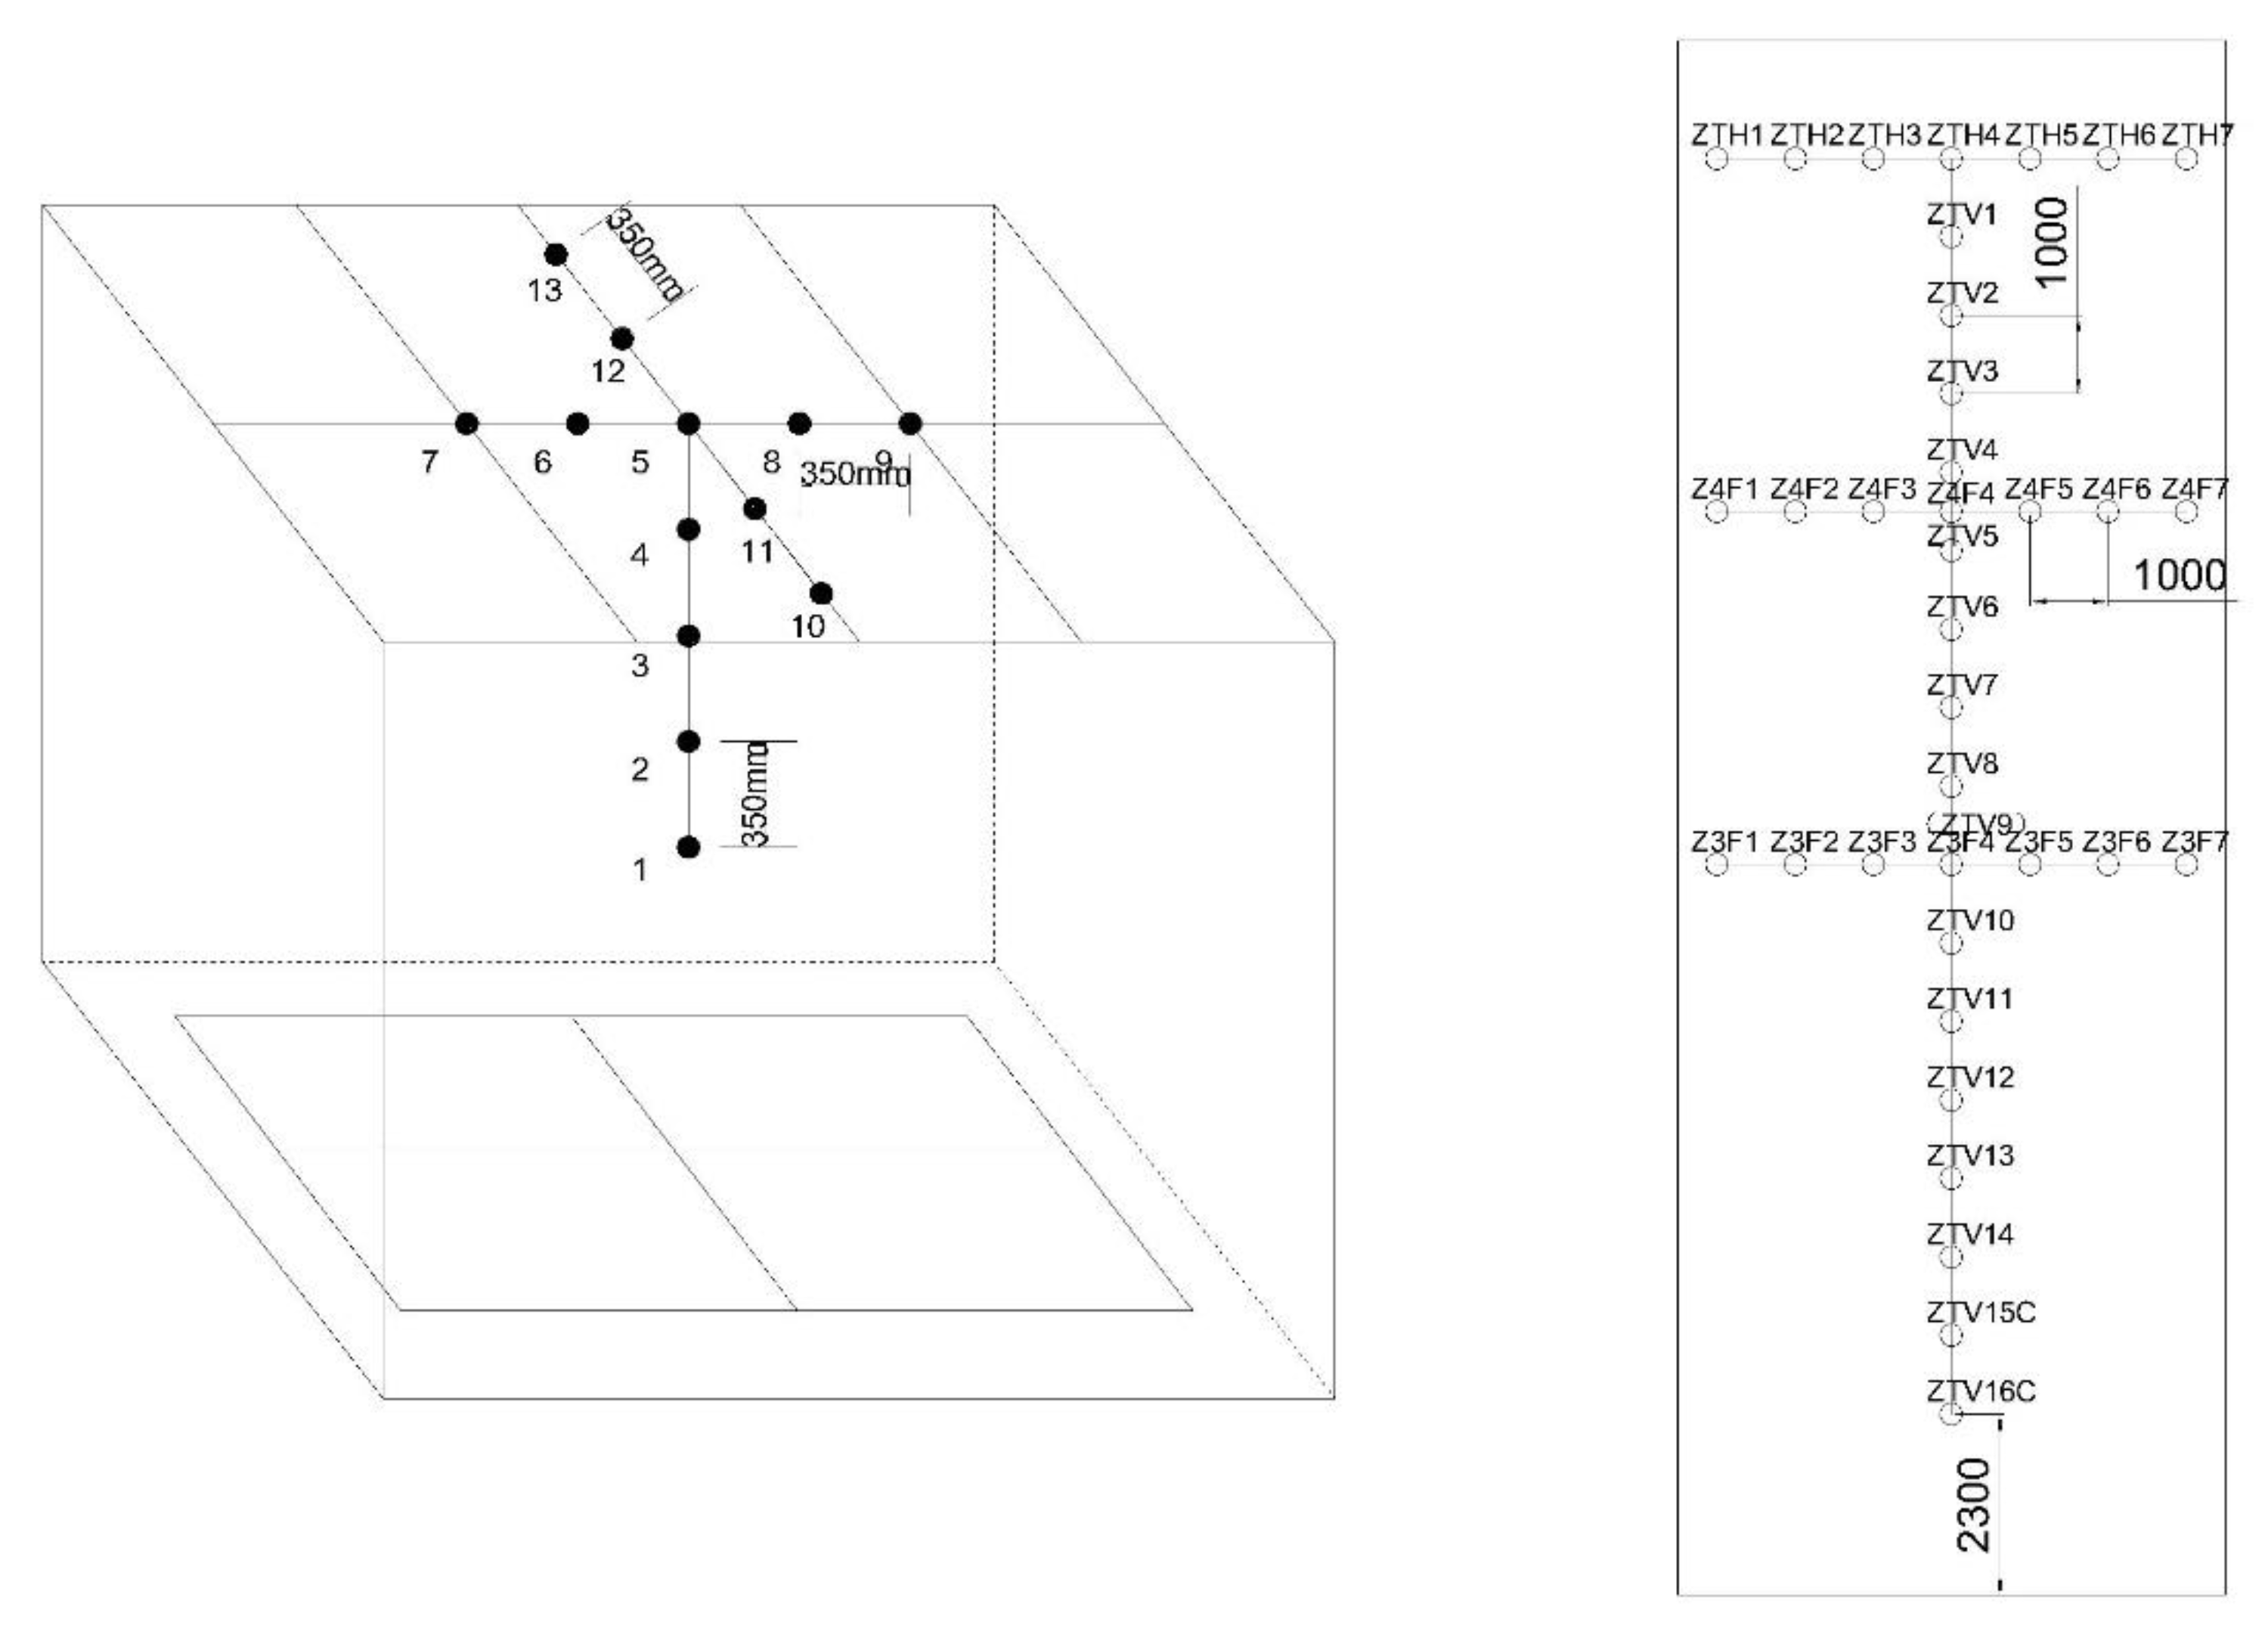
2.2. Commercial Pedestrian Street Experiment
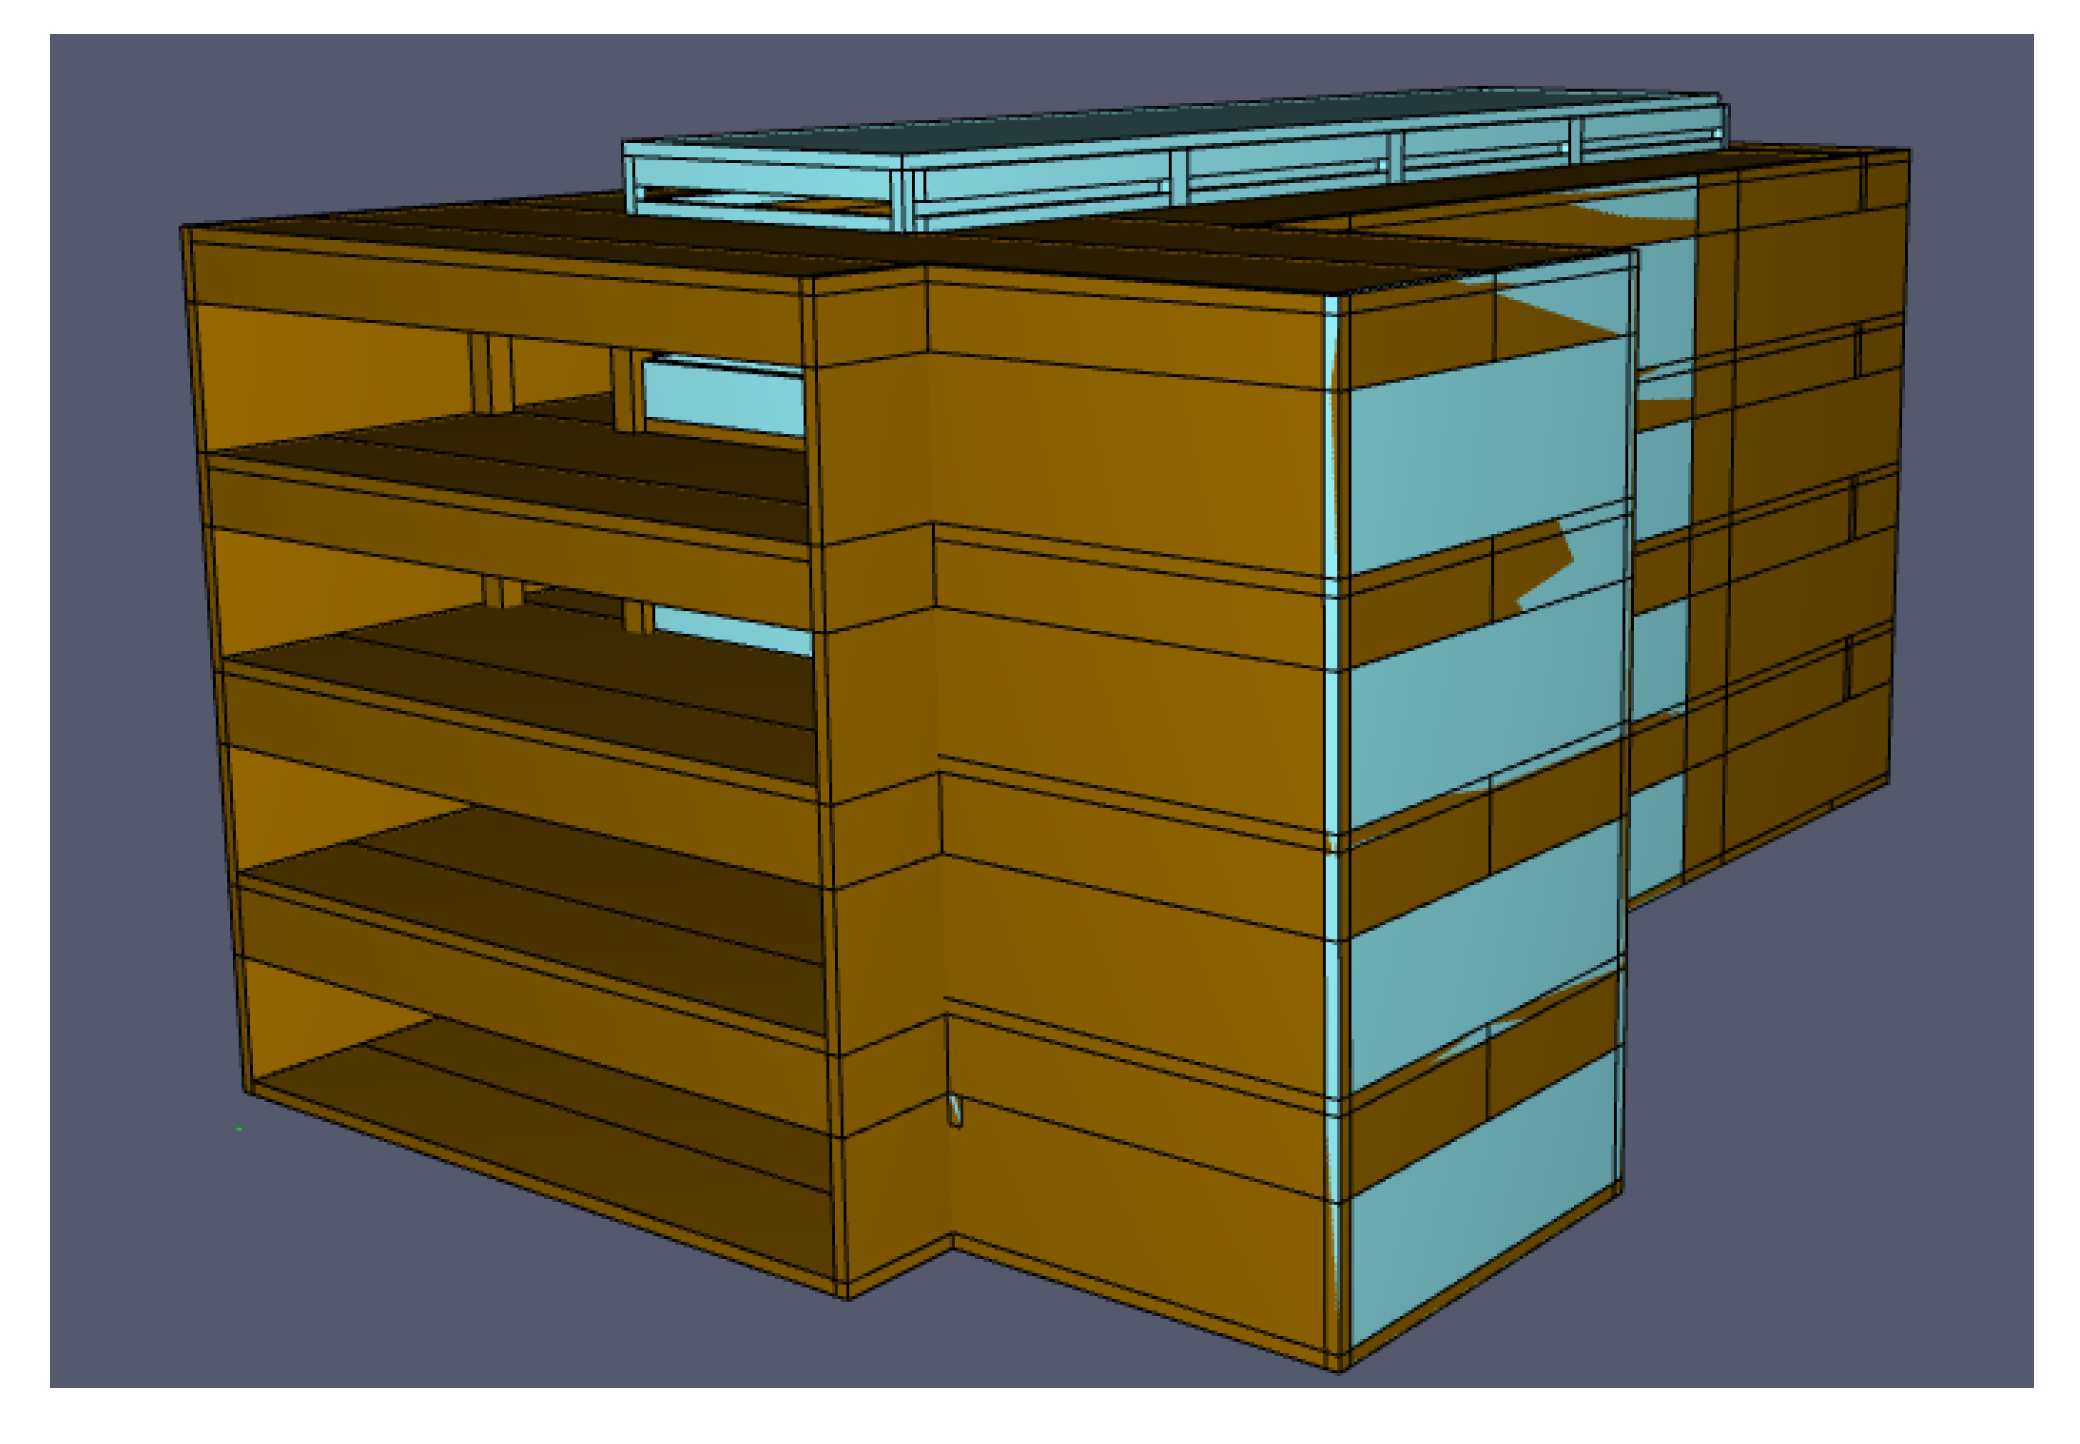
2.3. Model Parameter Setting
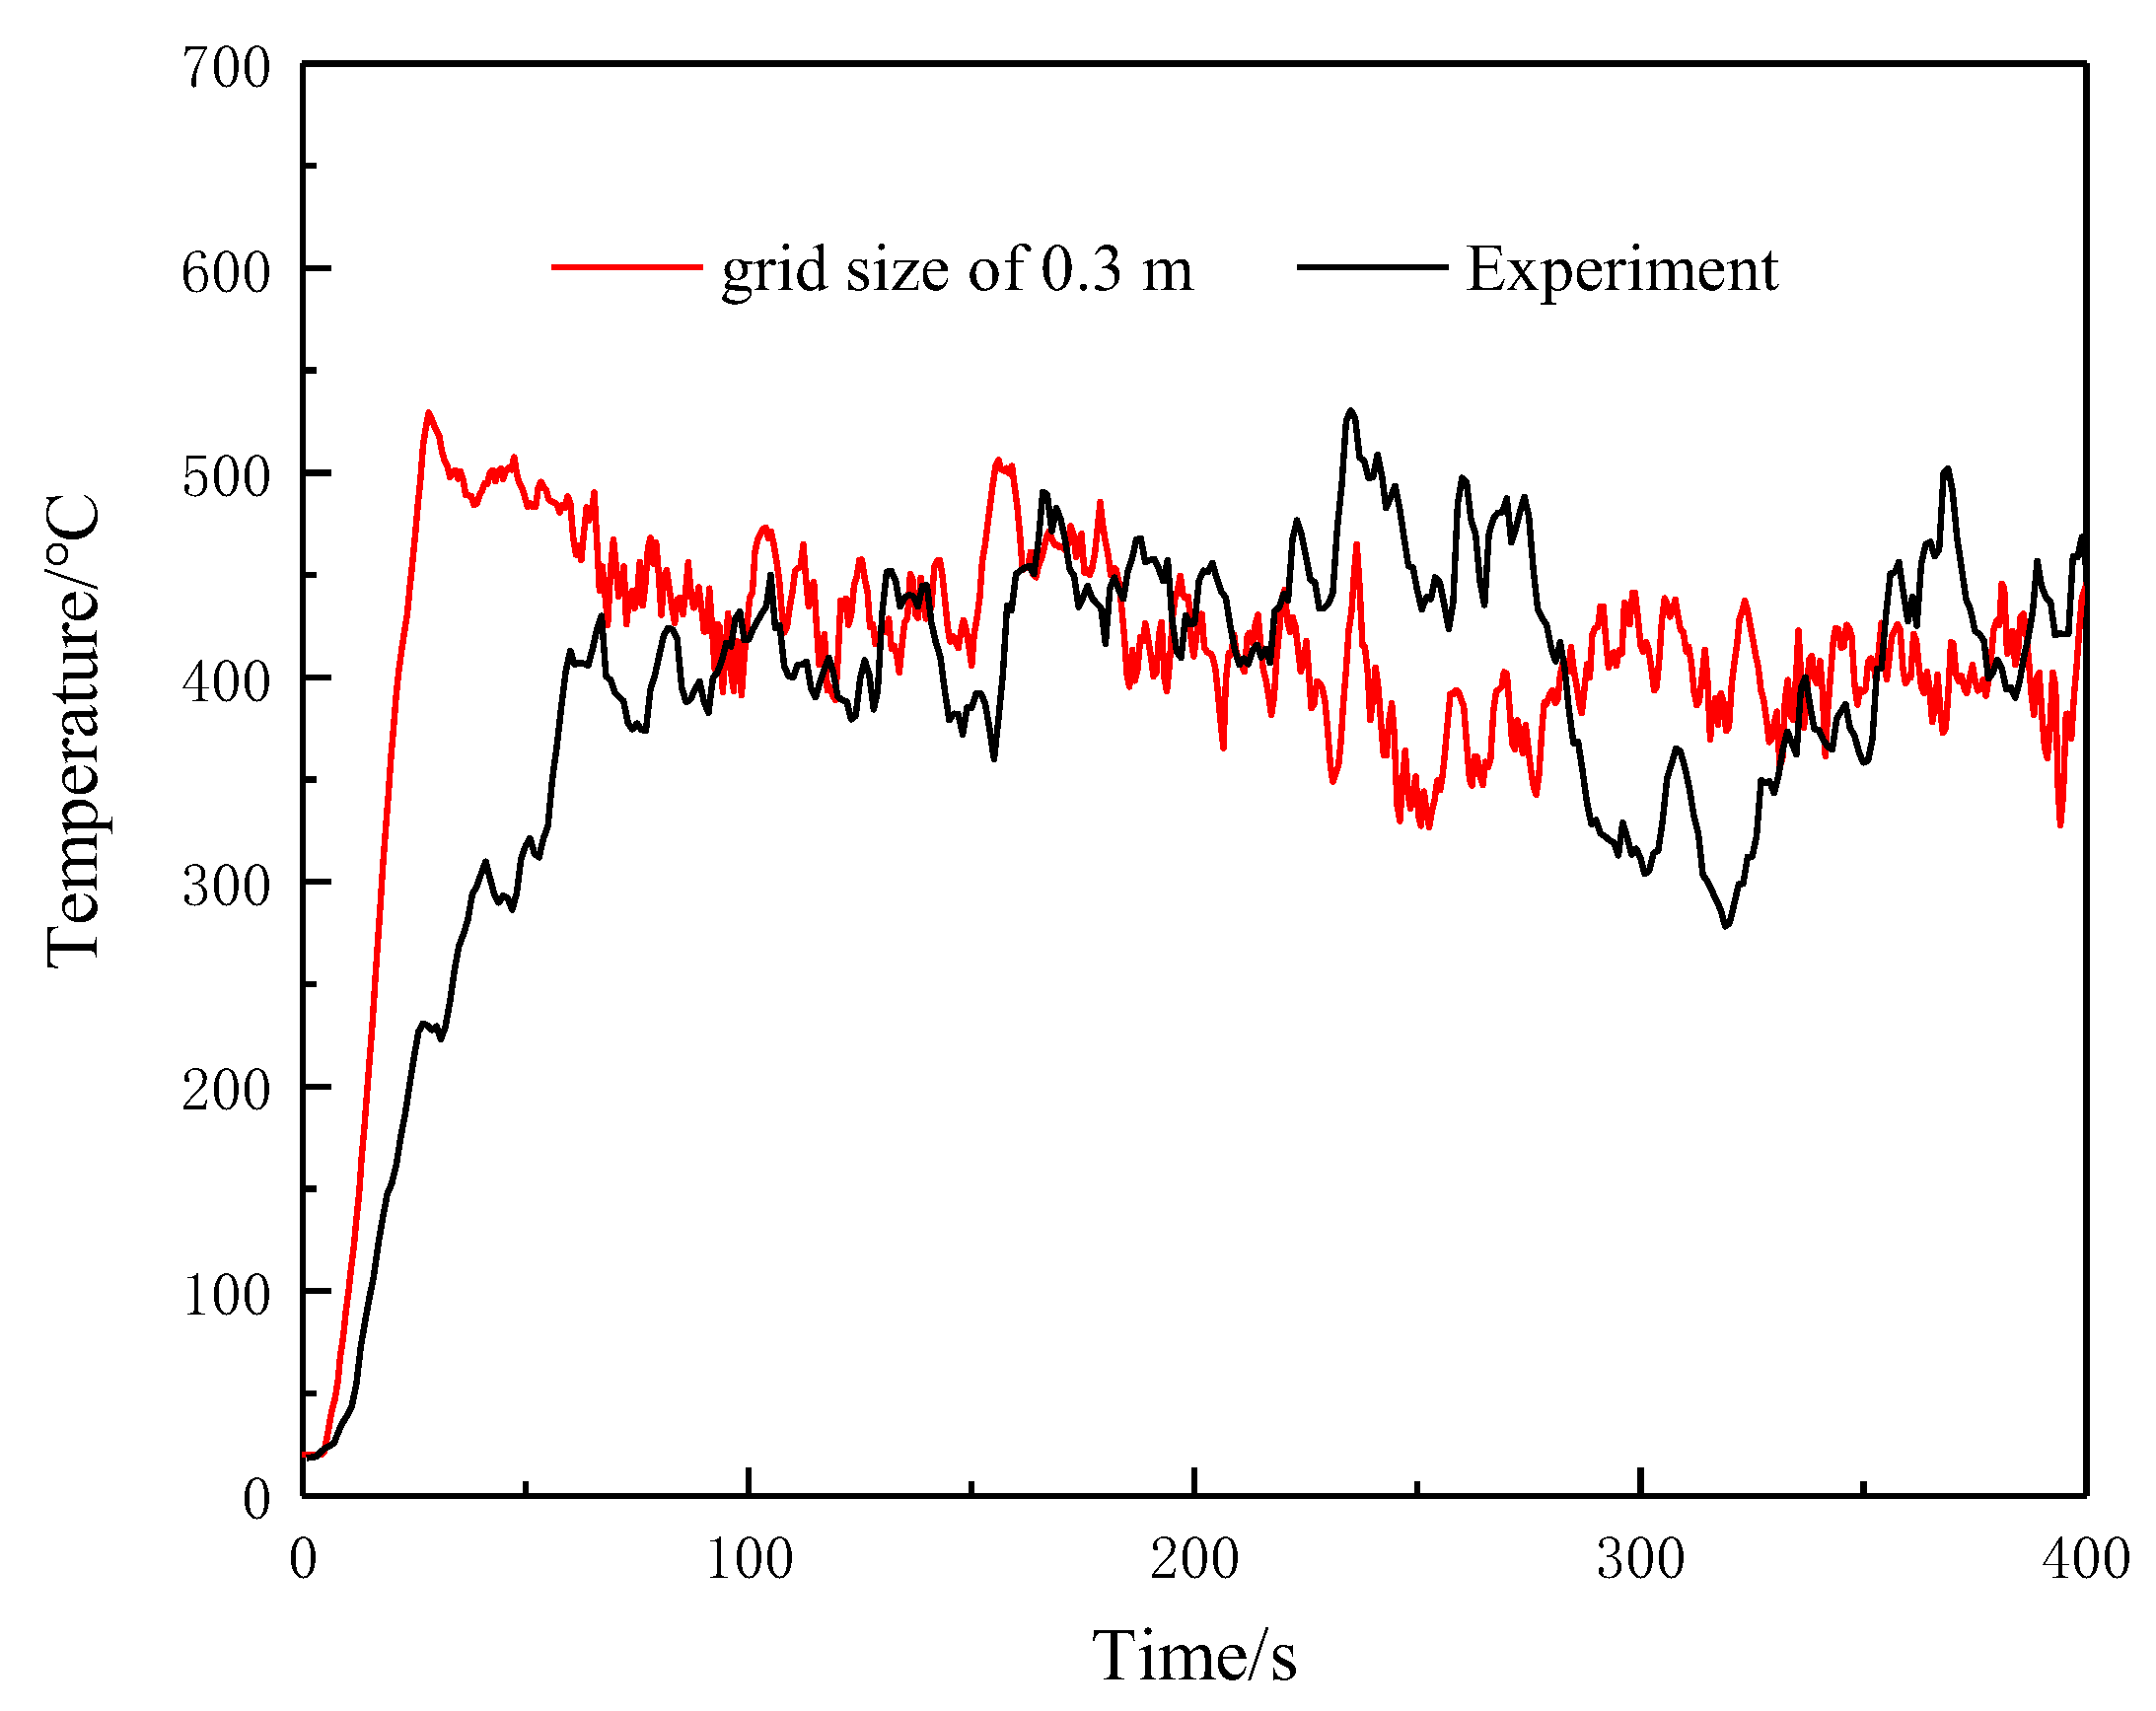
2.4. Grid Independence Analysis
2.5. Experimental Verification of Numerical Simulation Results
3. Analysis and Discussion of Numerical Simulation Results
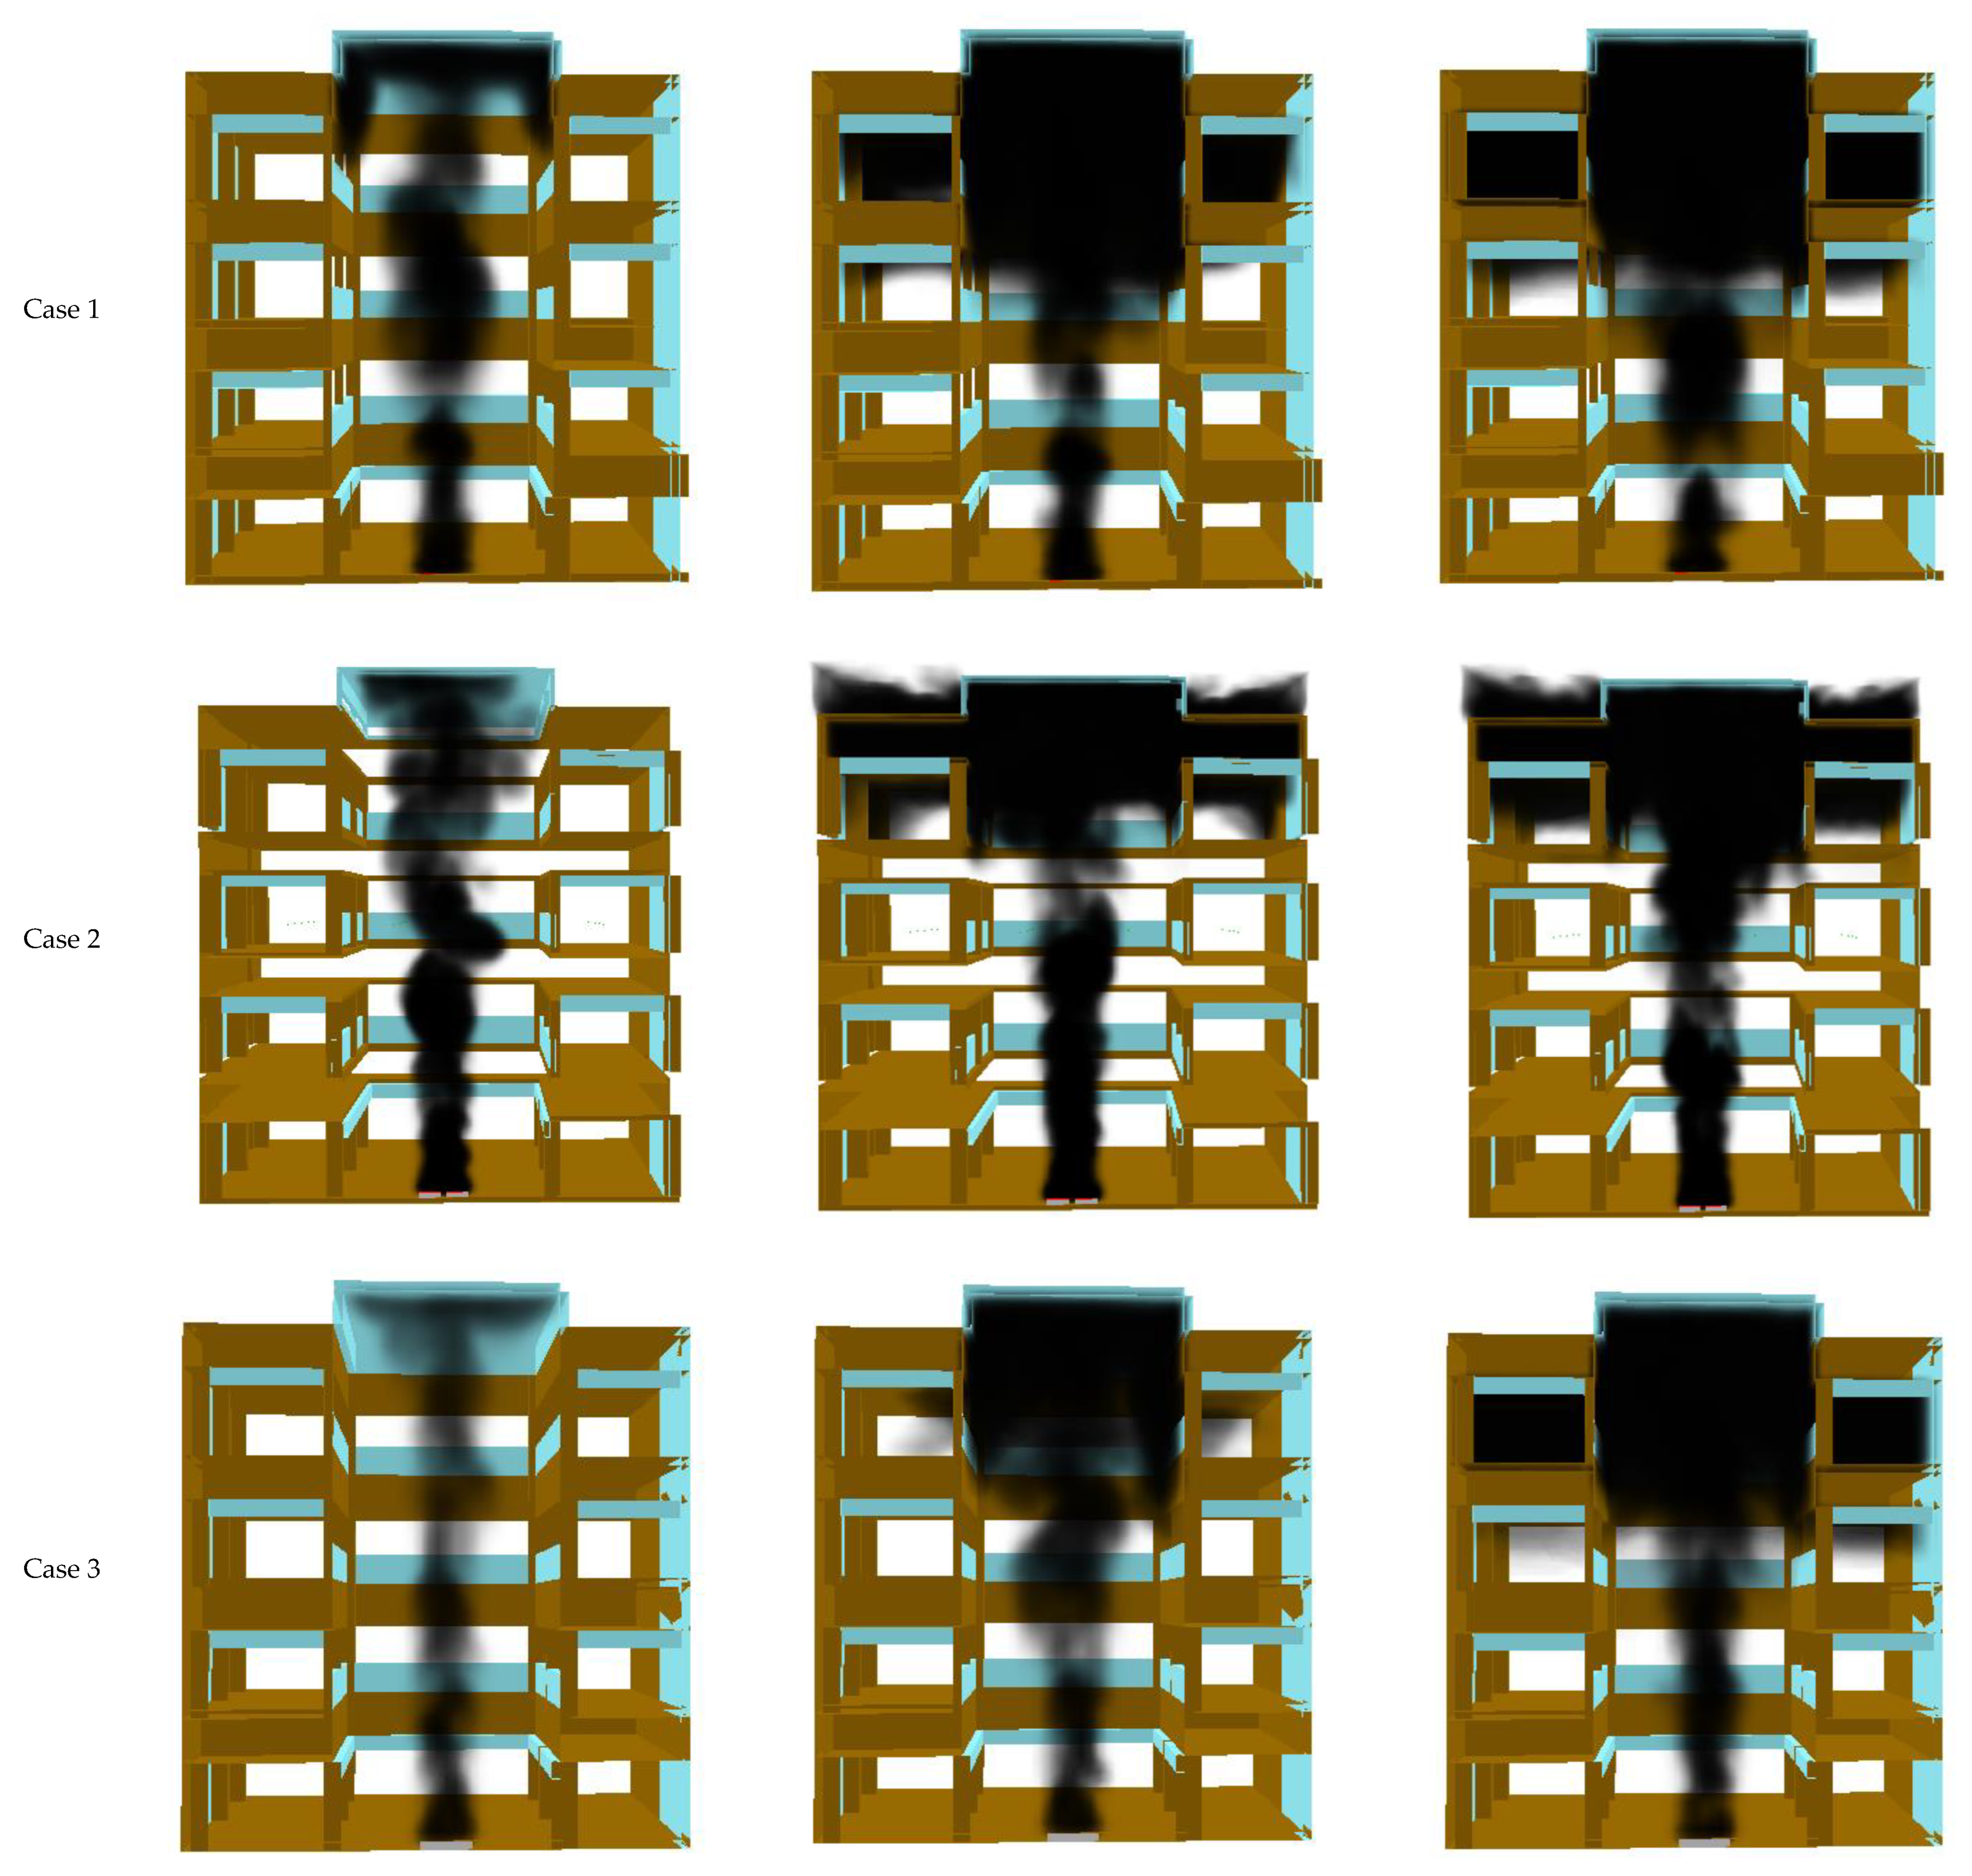
3.1. Analysis of Smoke Spread in Atrium Fire
3.2. Vertical Smoke Temperature Distribution in Atrium
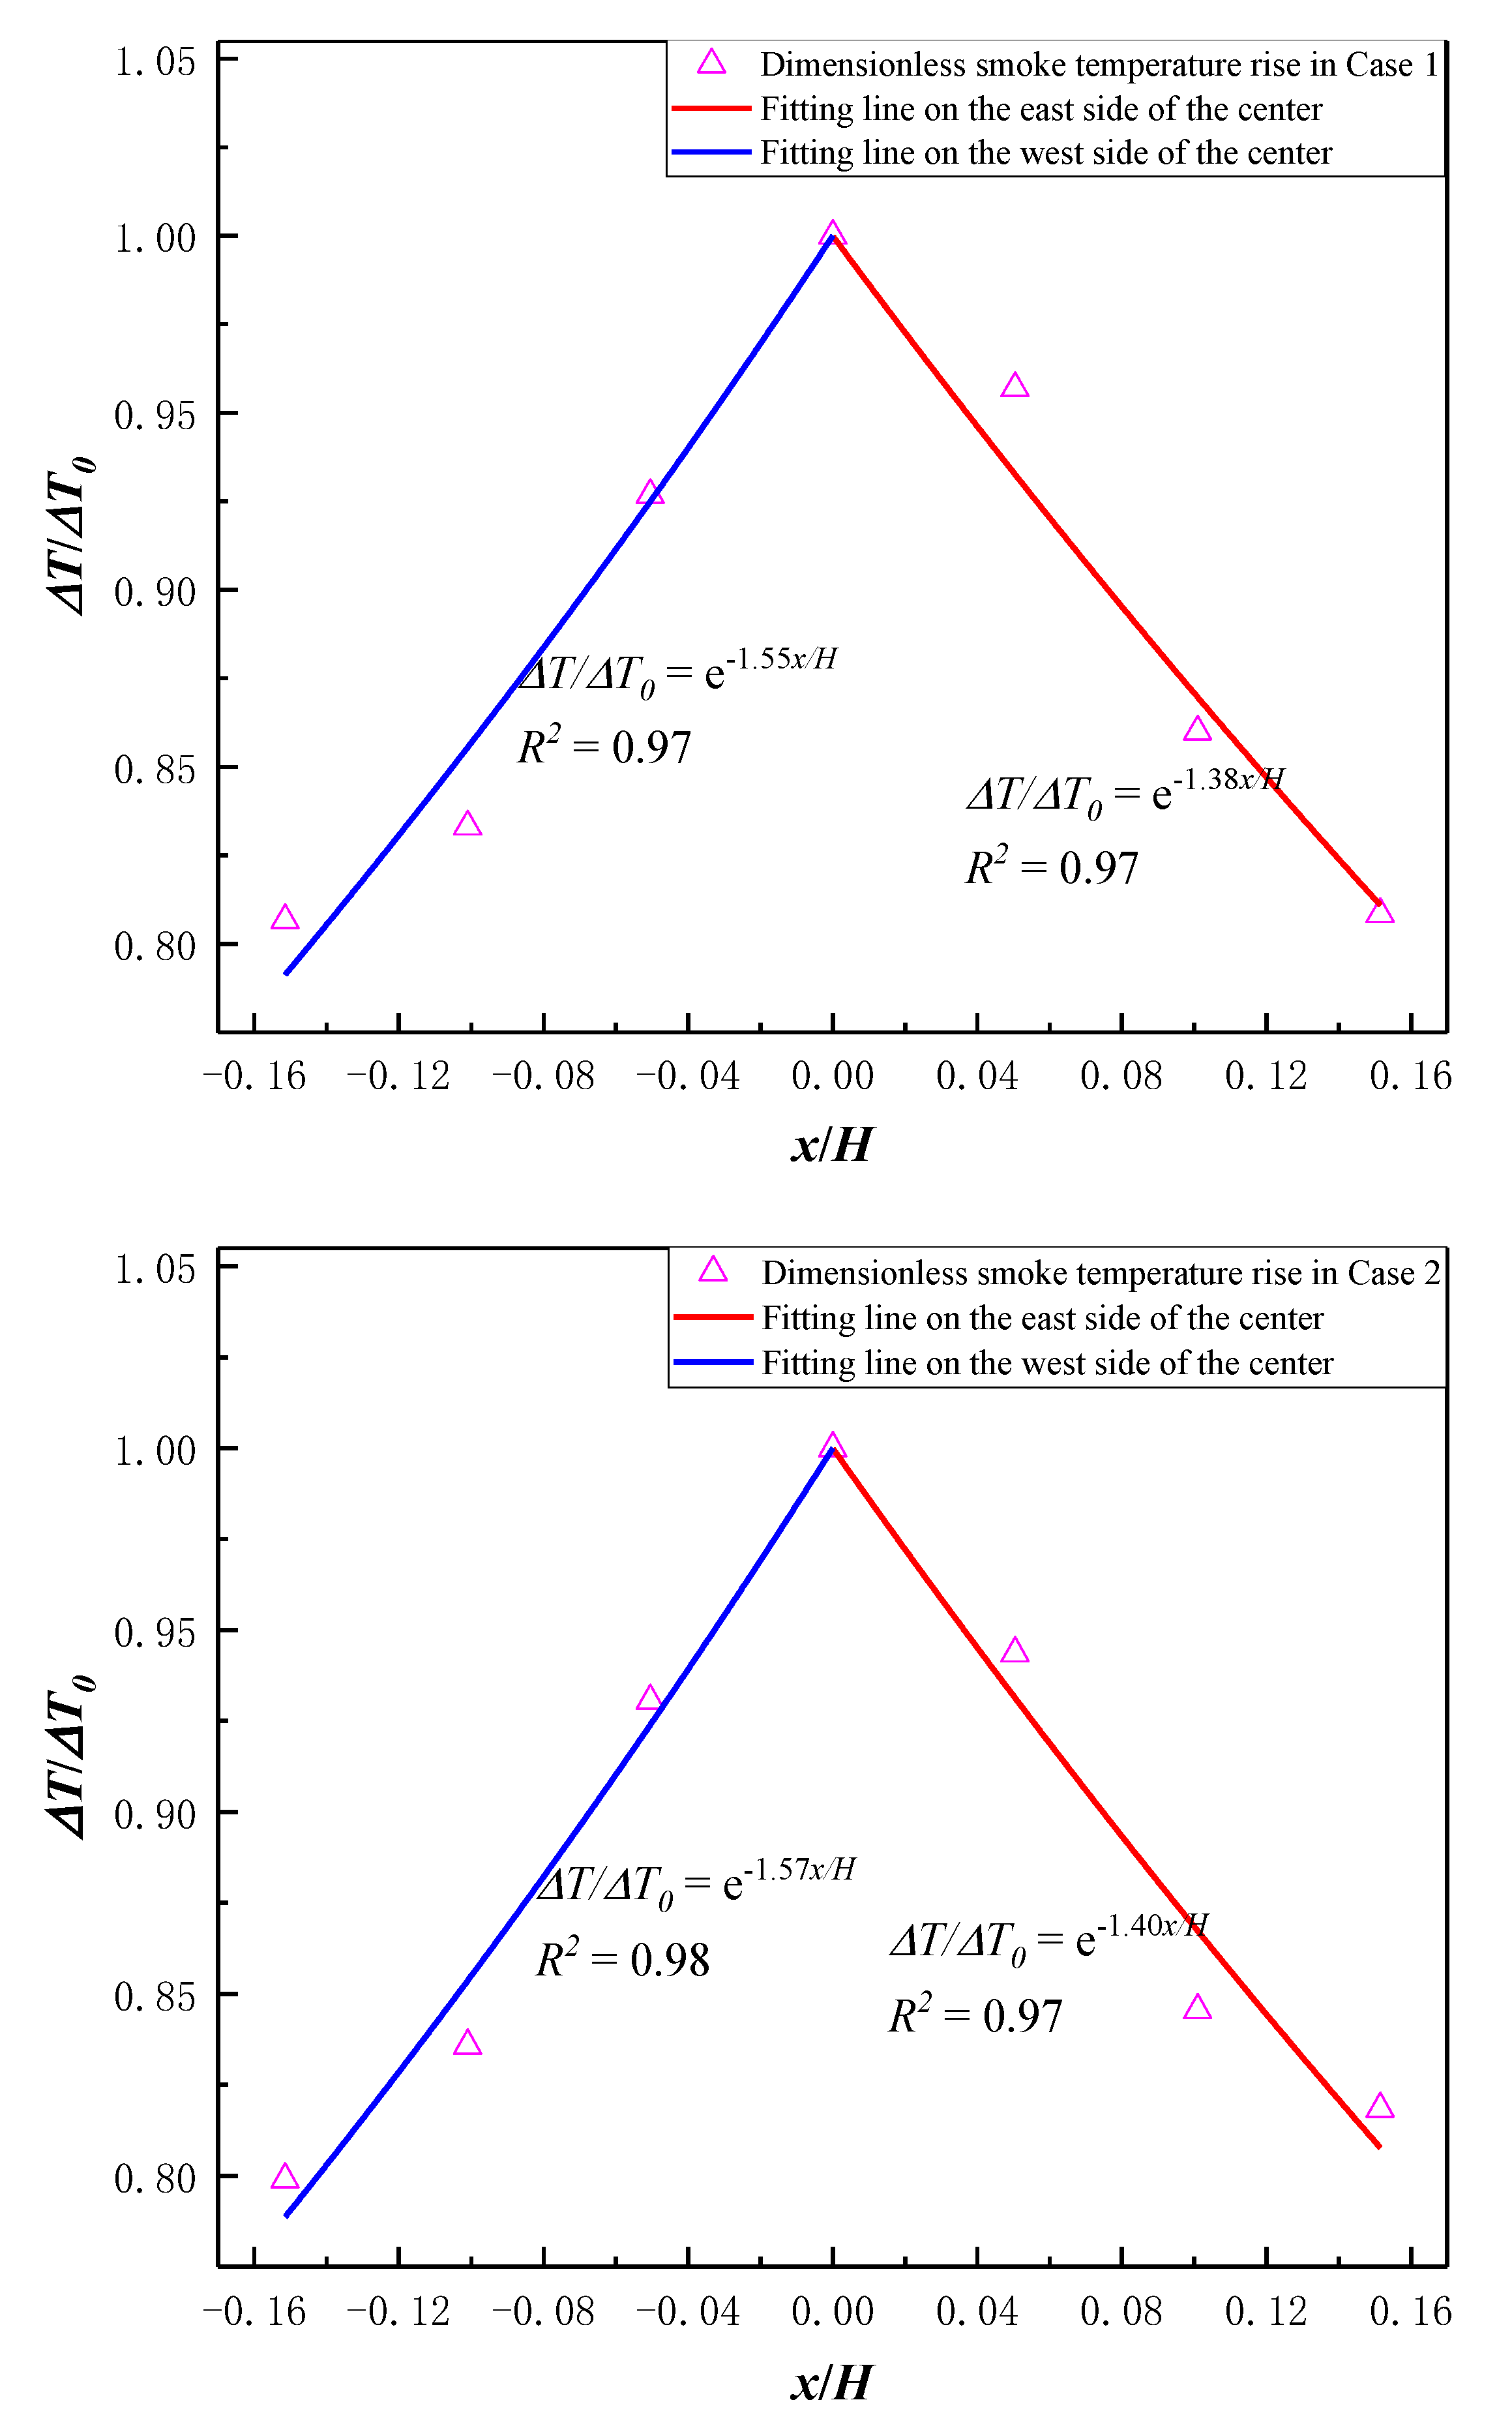
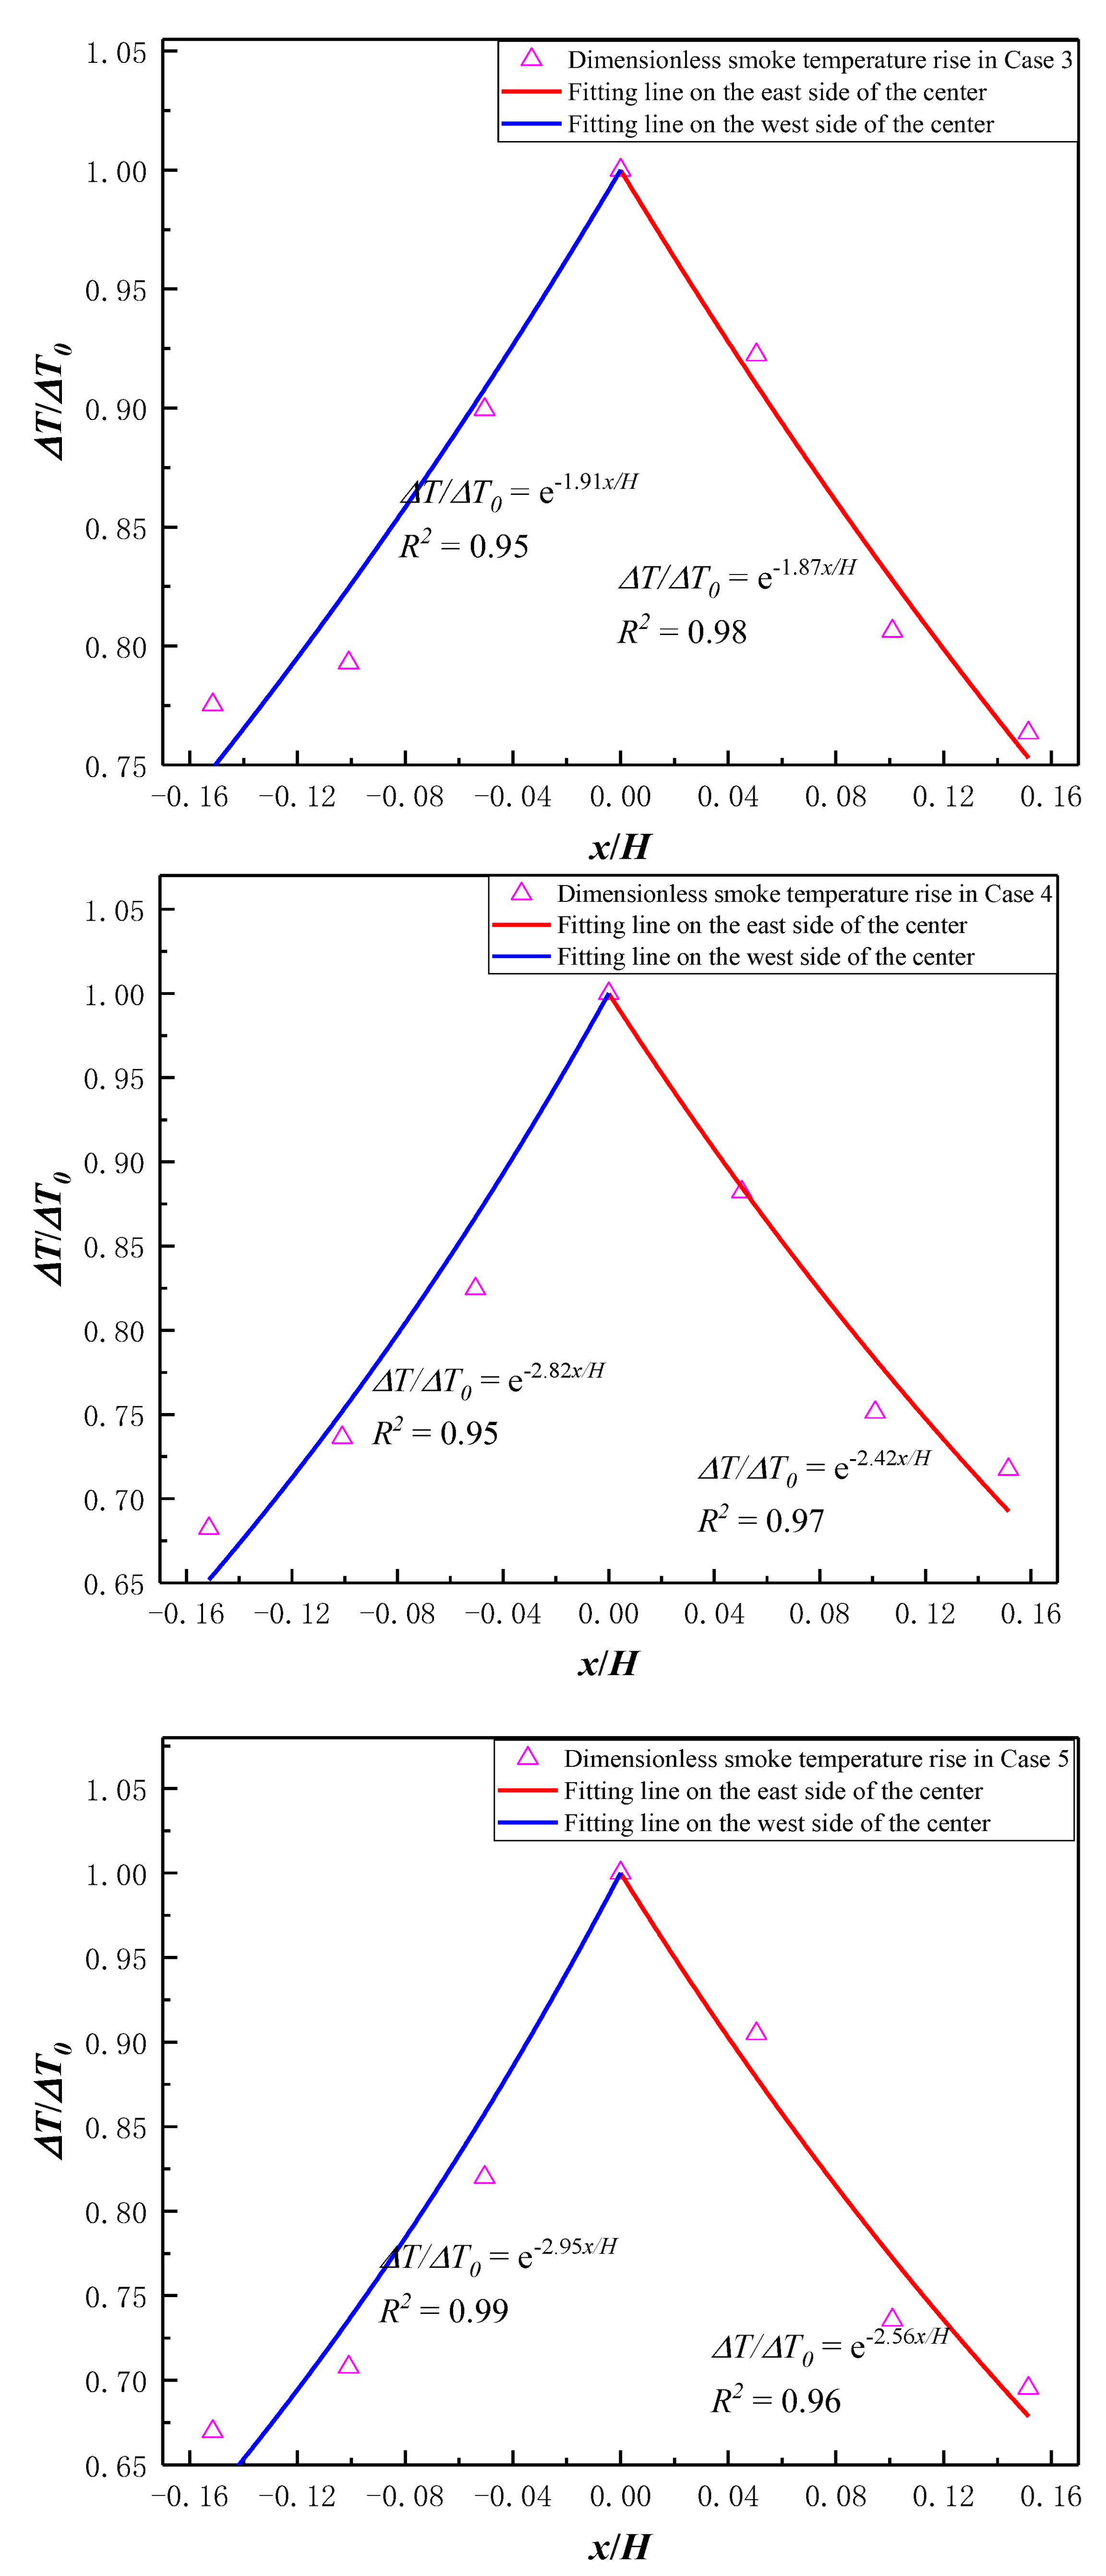
3.3. Horizontal Smoke Temperature Distribution under the Ceiling of the Atrium
4. Conclusions
- (1)
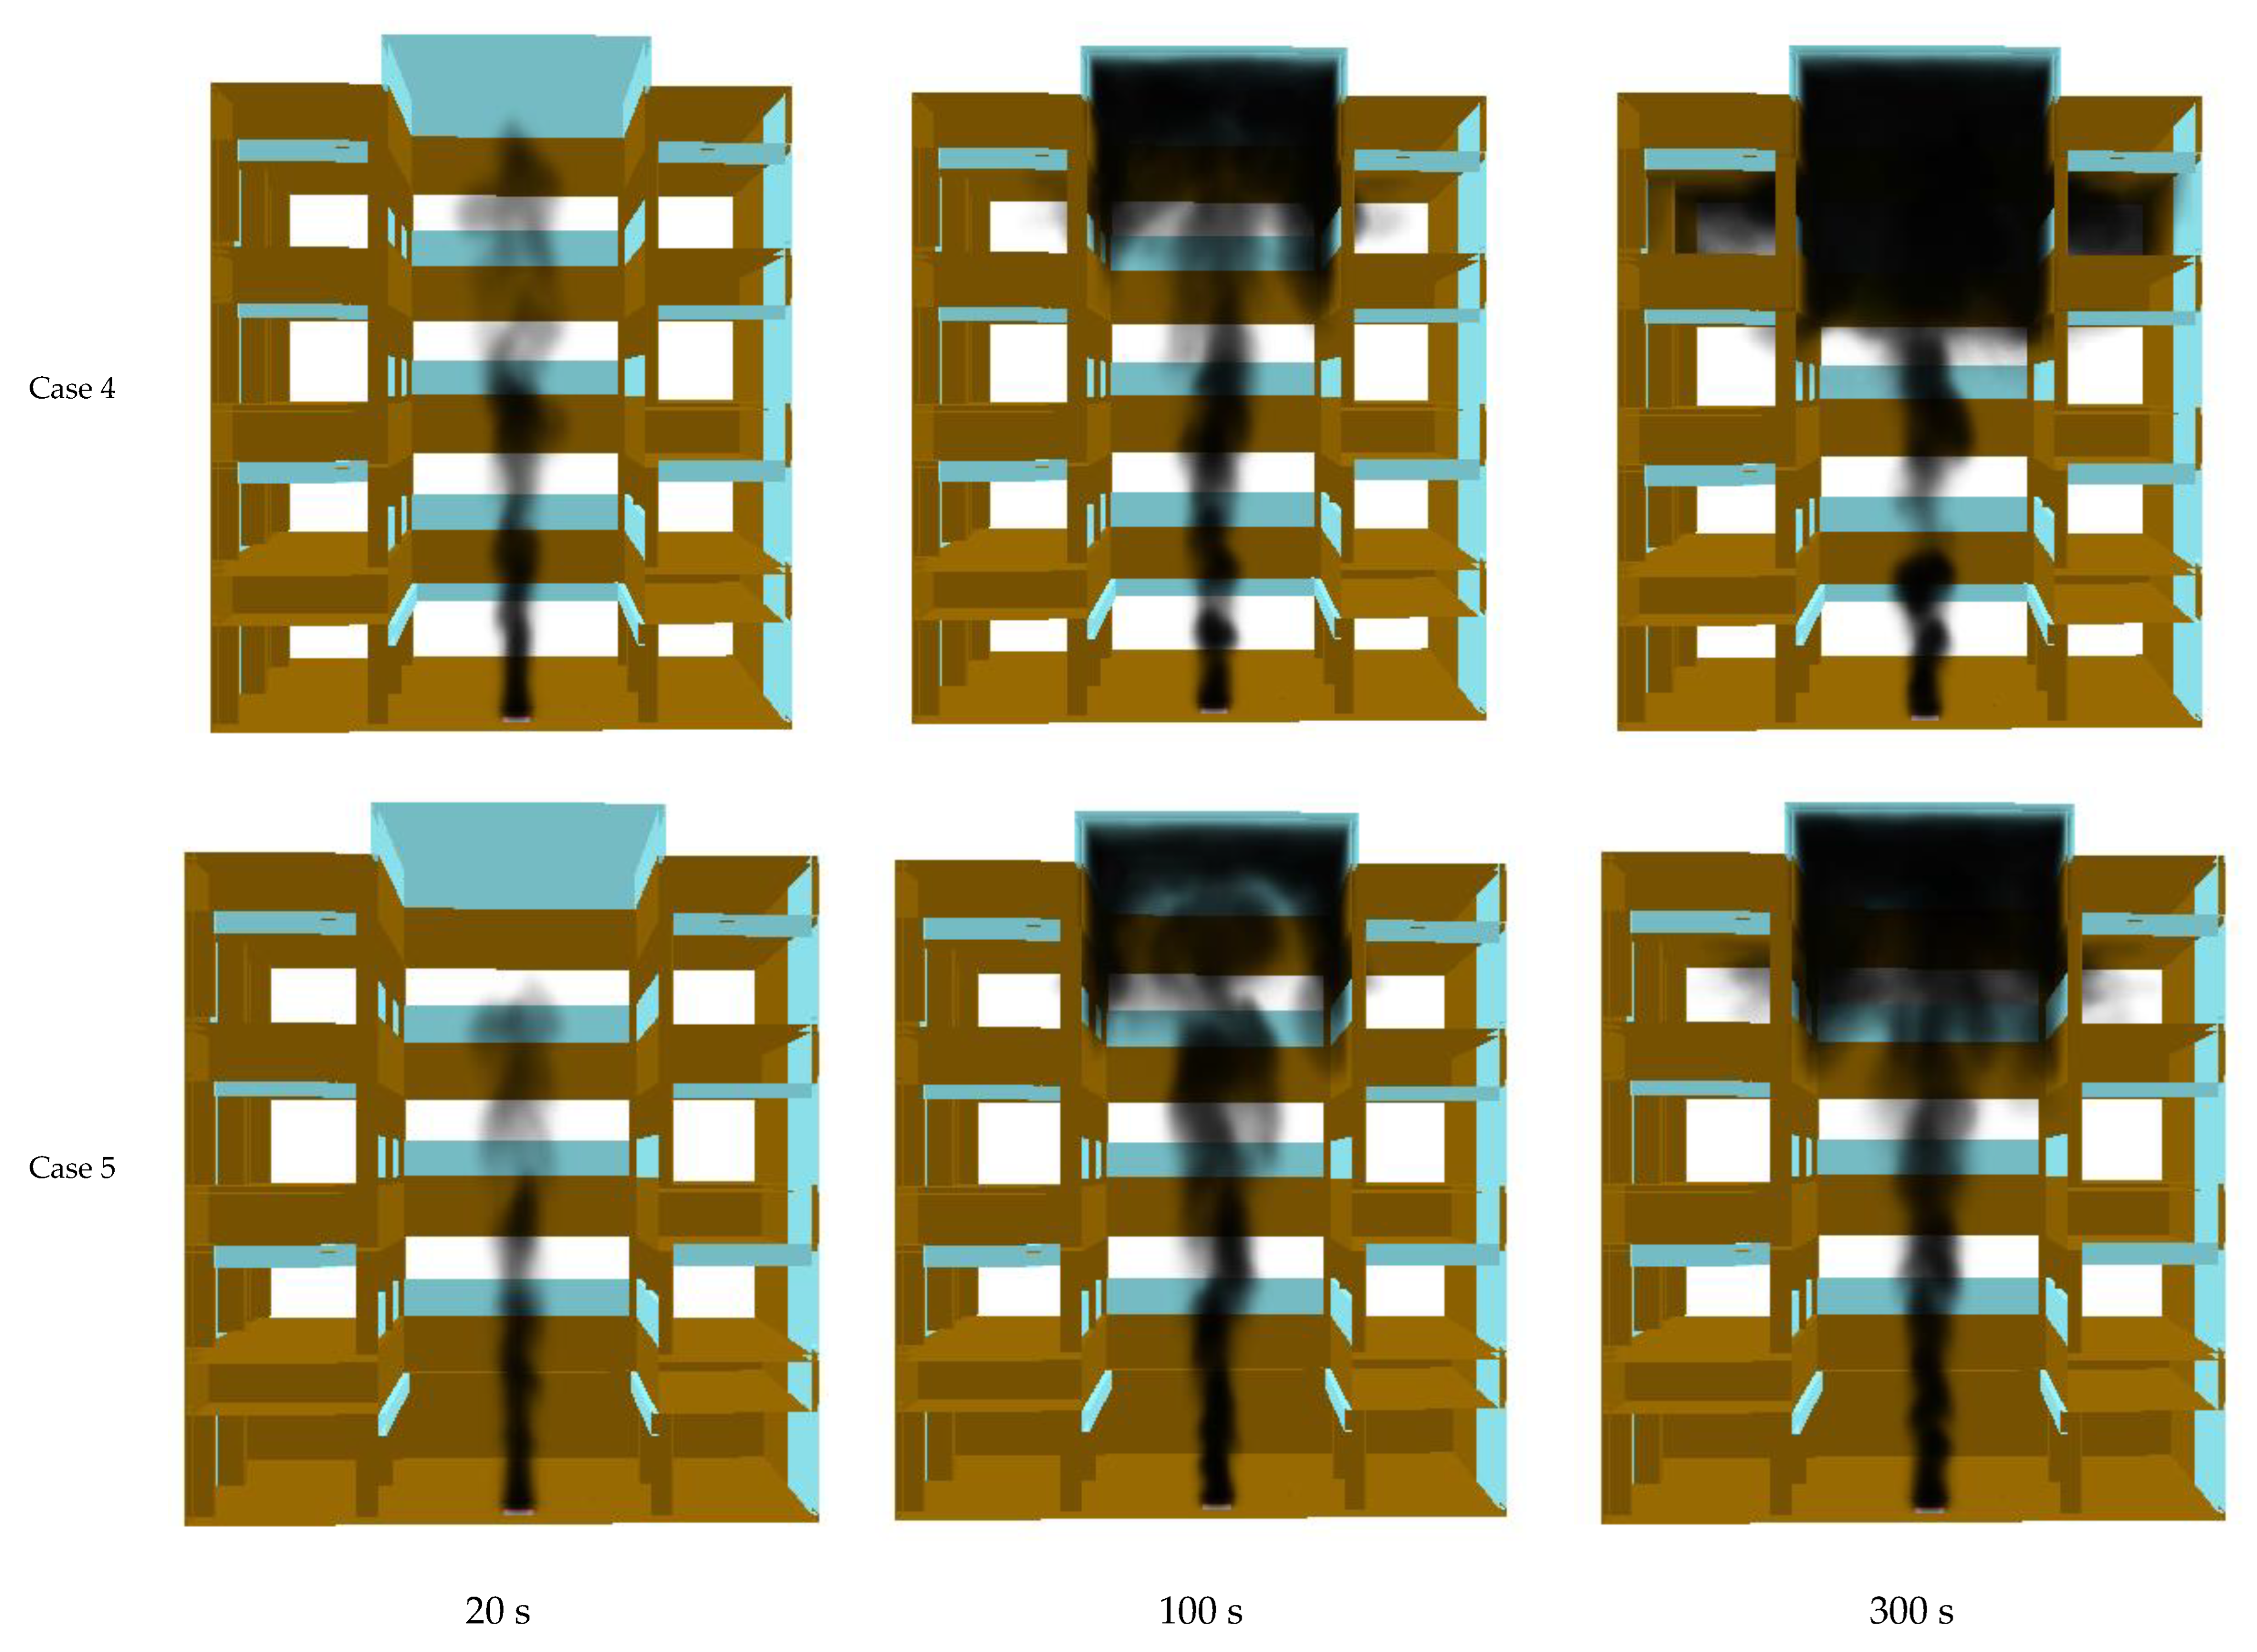
- After a series of comparative studies, it is found that the conclusions obtained from the numerical simulation study and the full-scale experimental study are in good agreement. The smoke spread rate increases with the increase of the heat release rate of the fire source, and the thickness of the stable smoke layer increases as well. When the smoke exhaust system is turned on, the smoke volume decreases rapidly, the smoke layer thickness decreases and the visibility increases.
- (2)
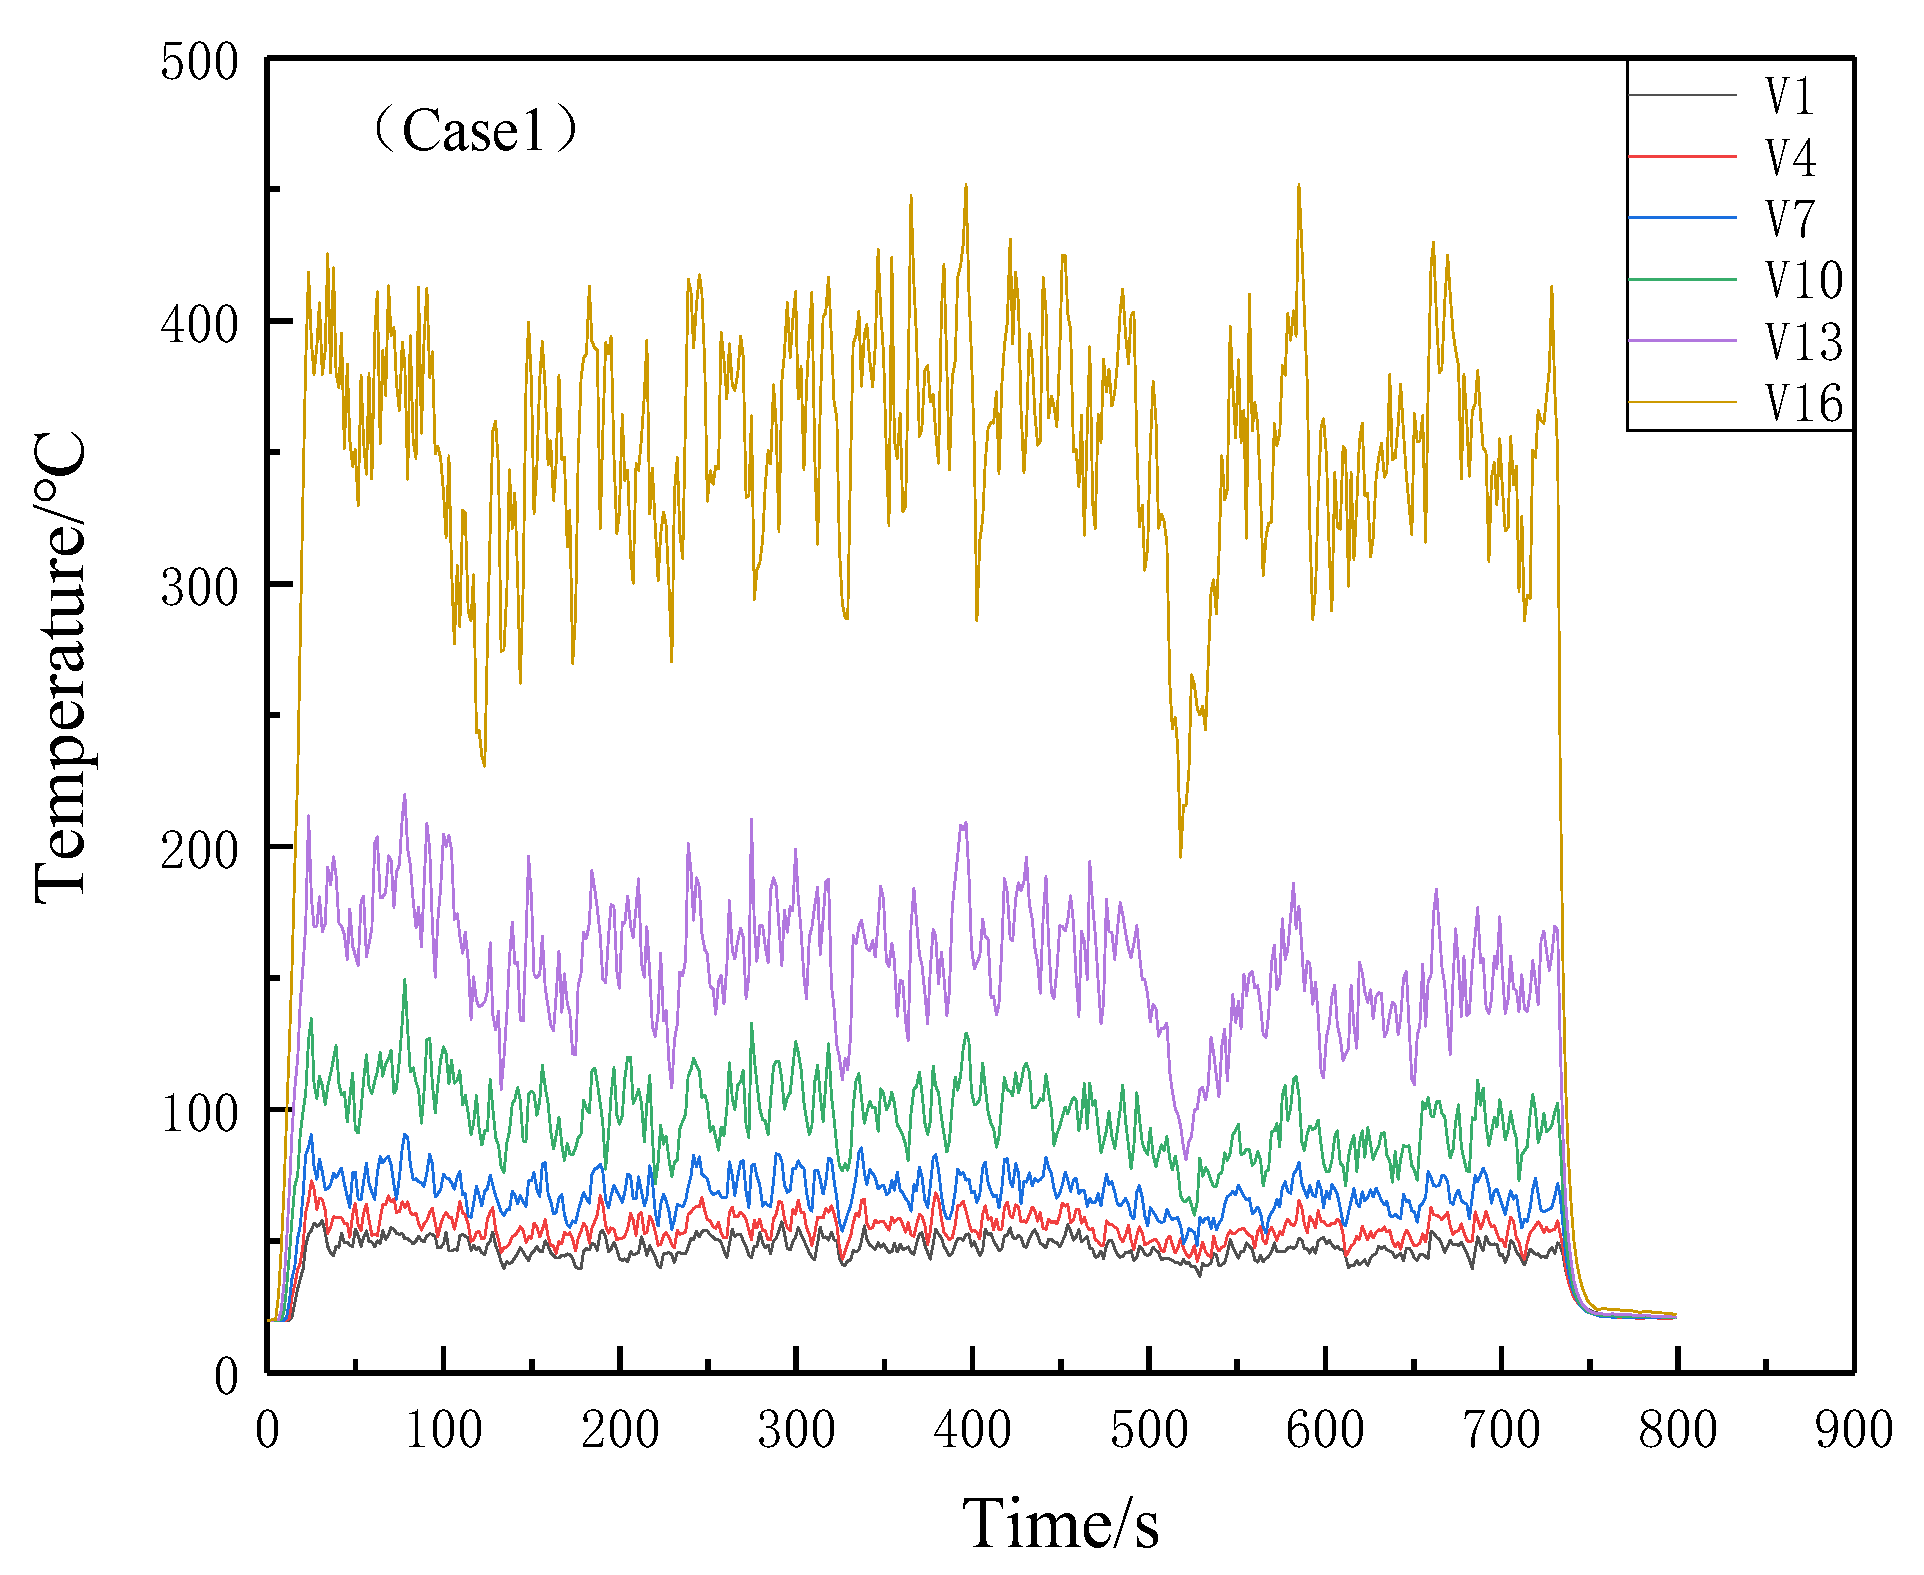
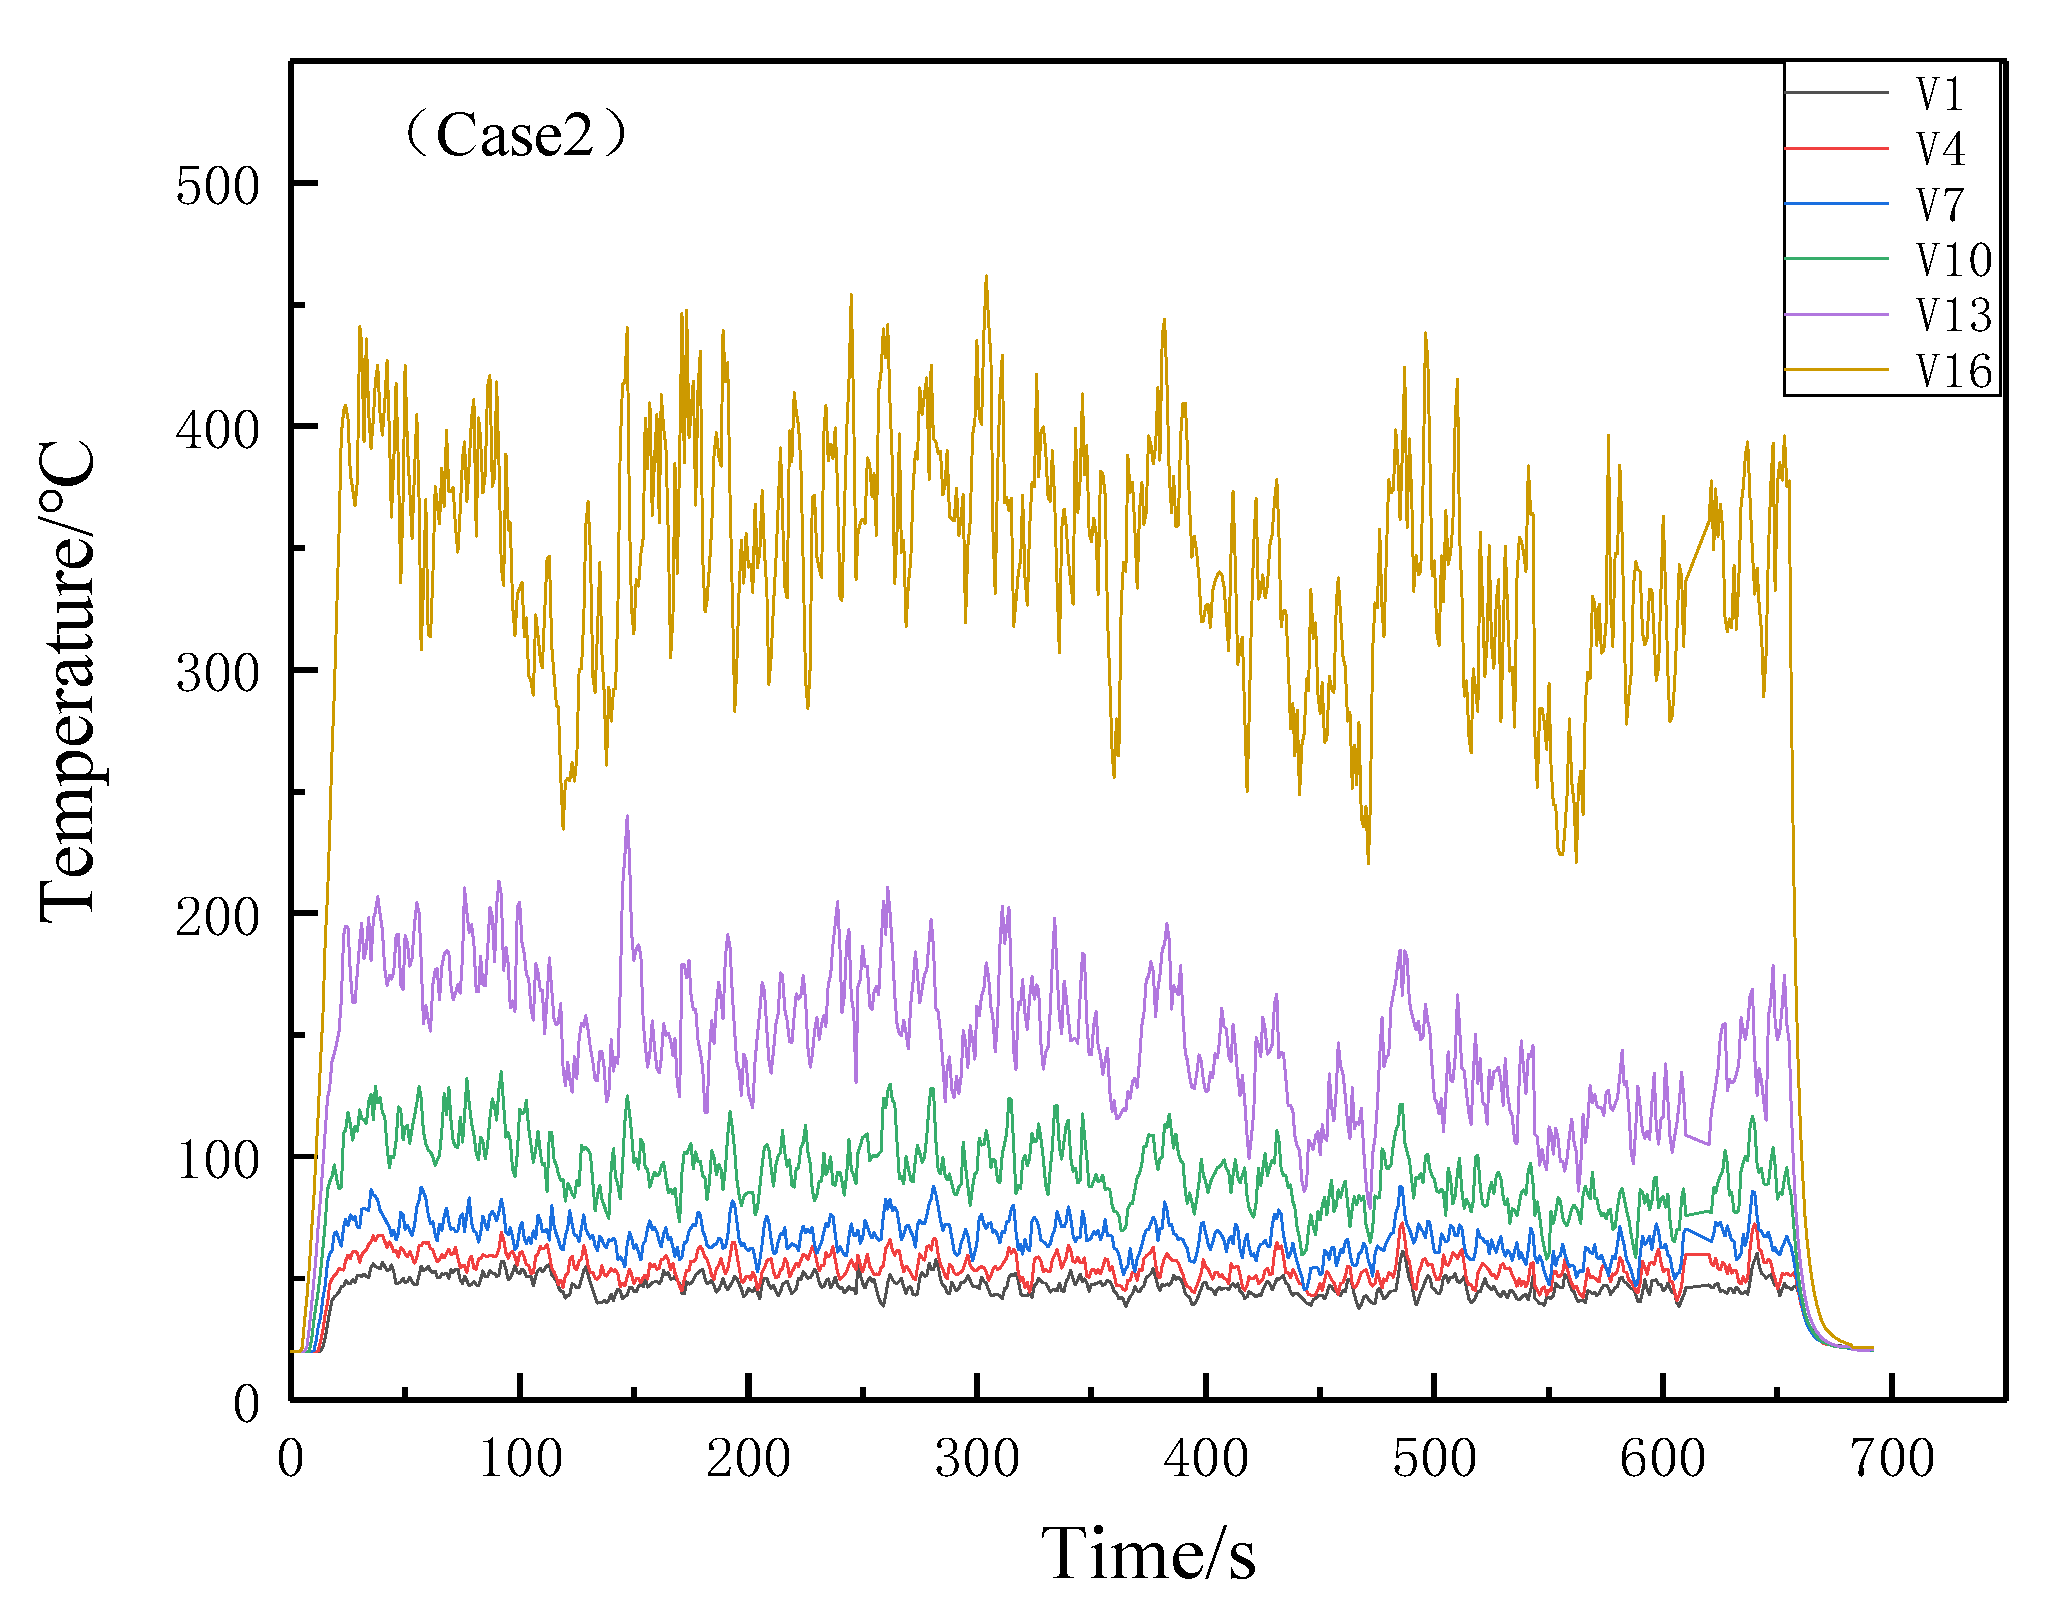
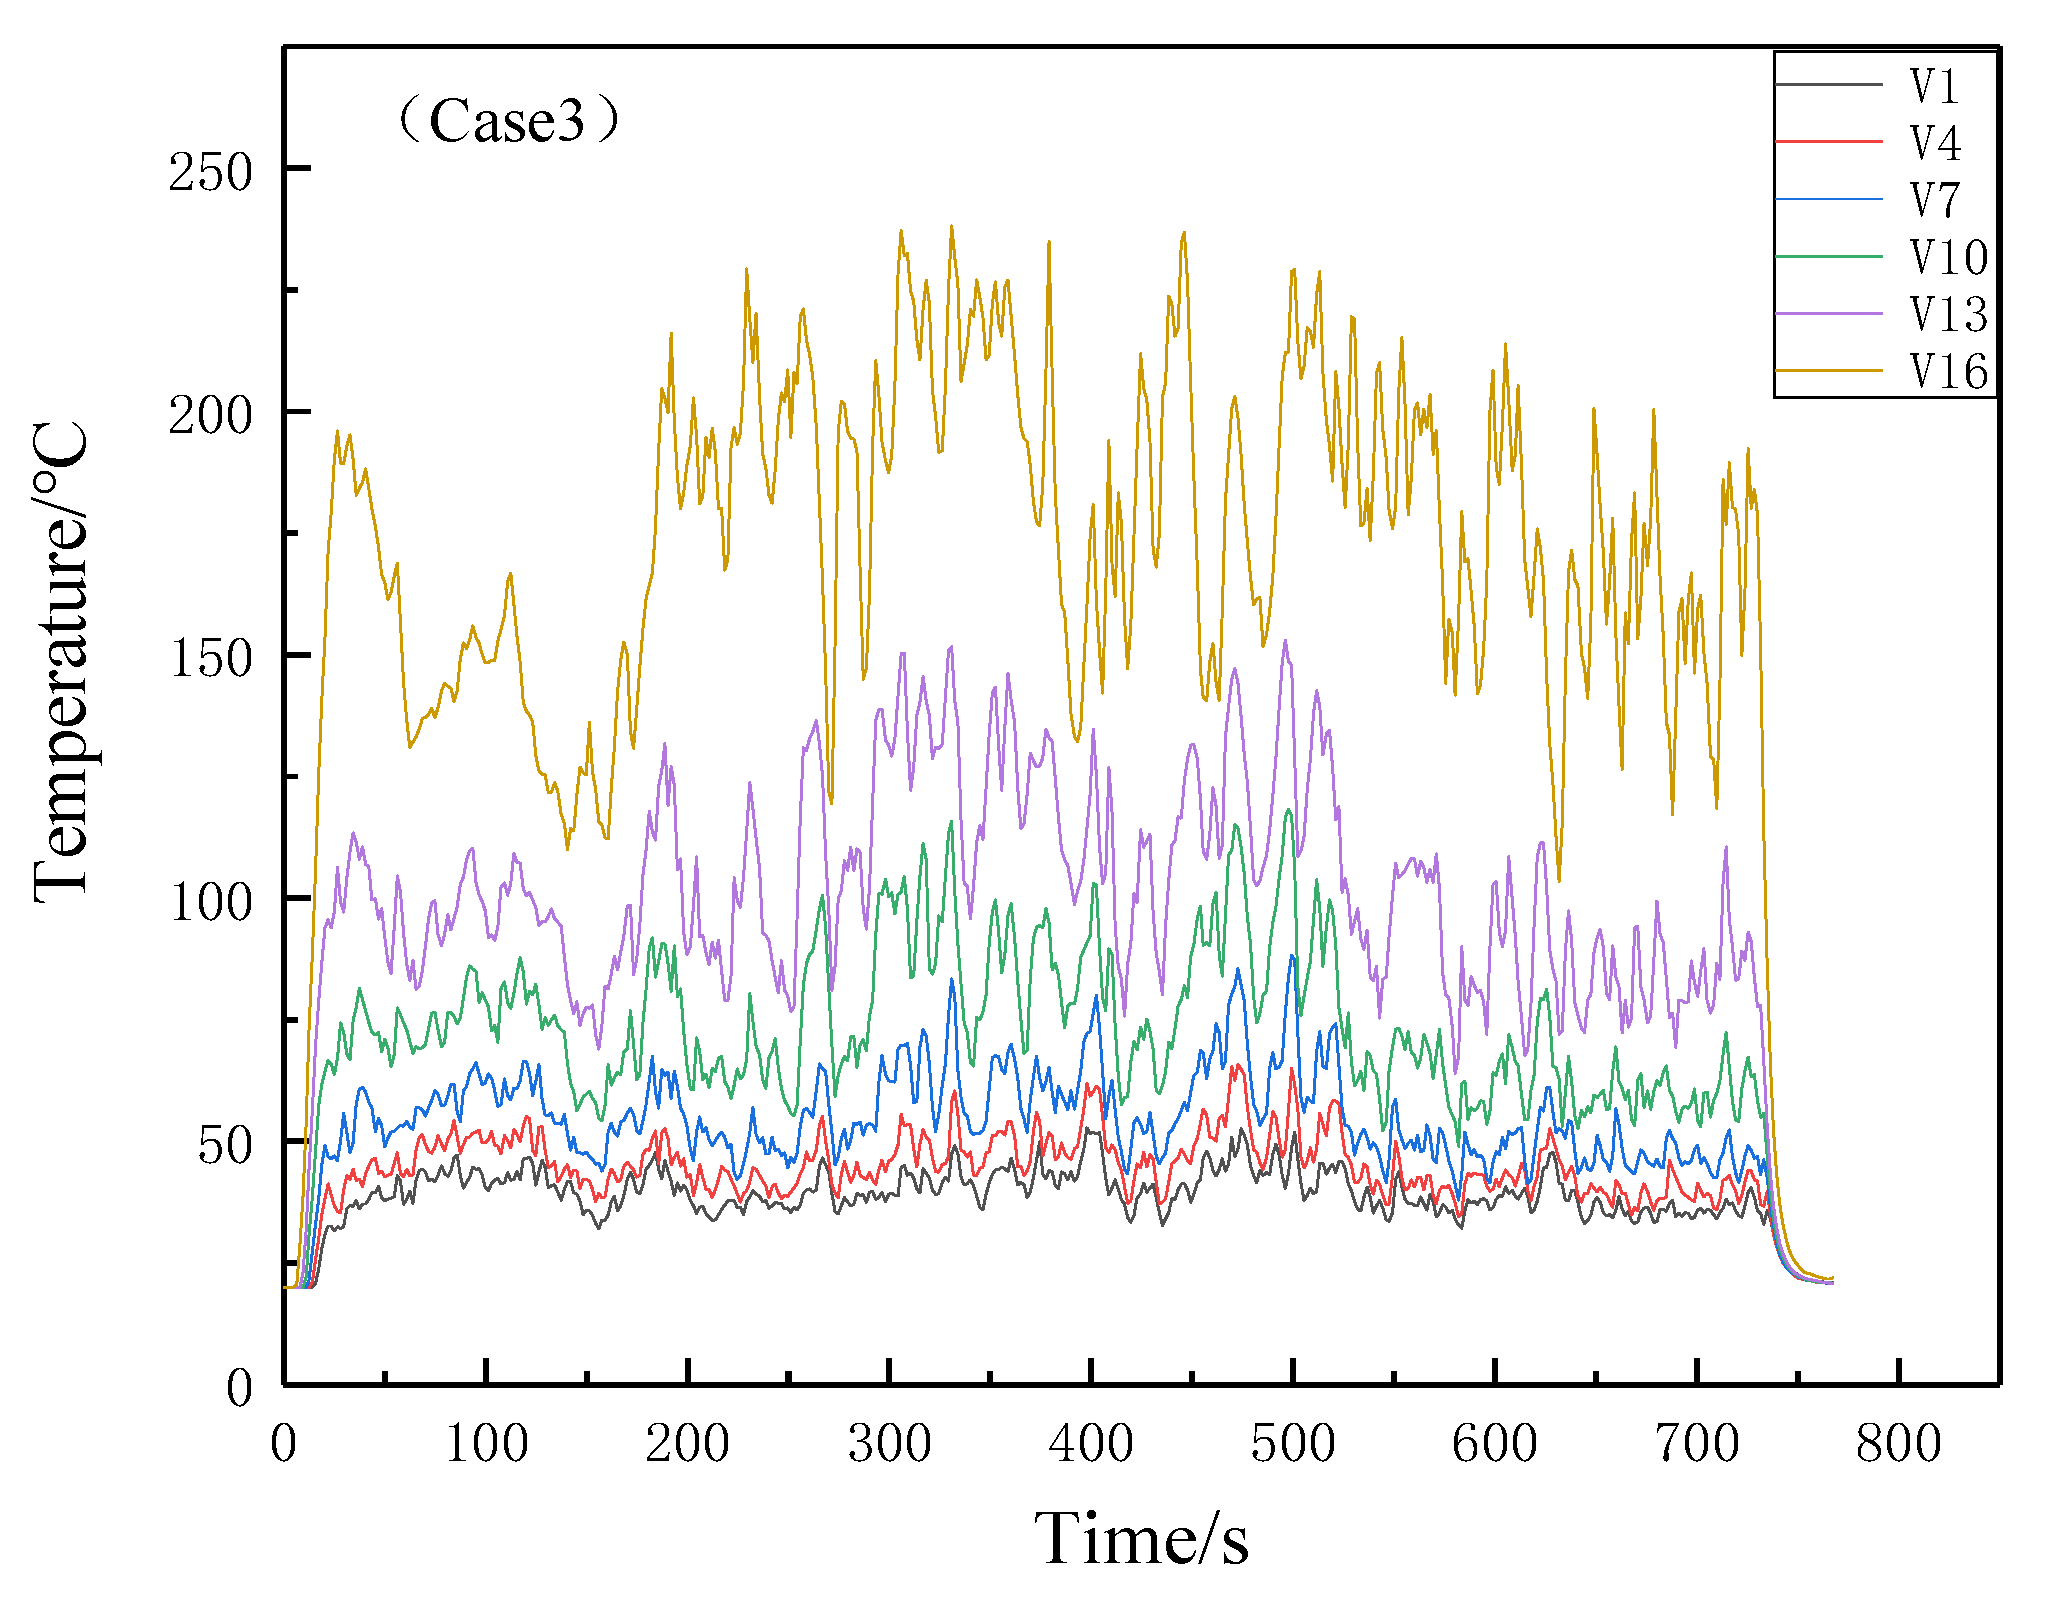
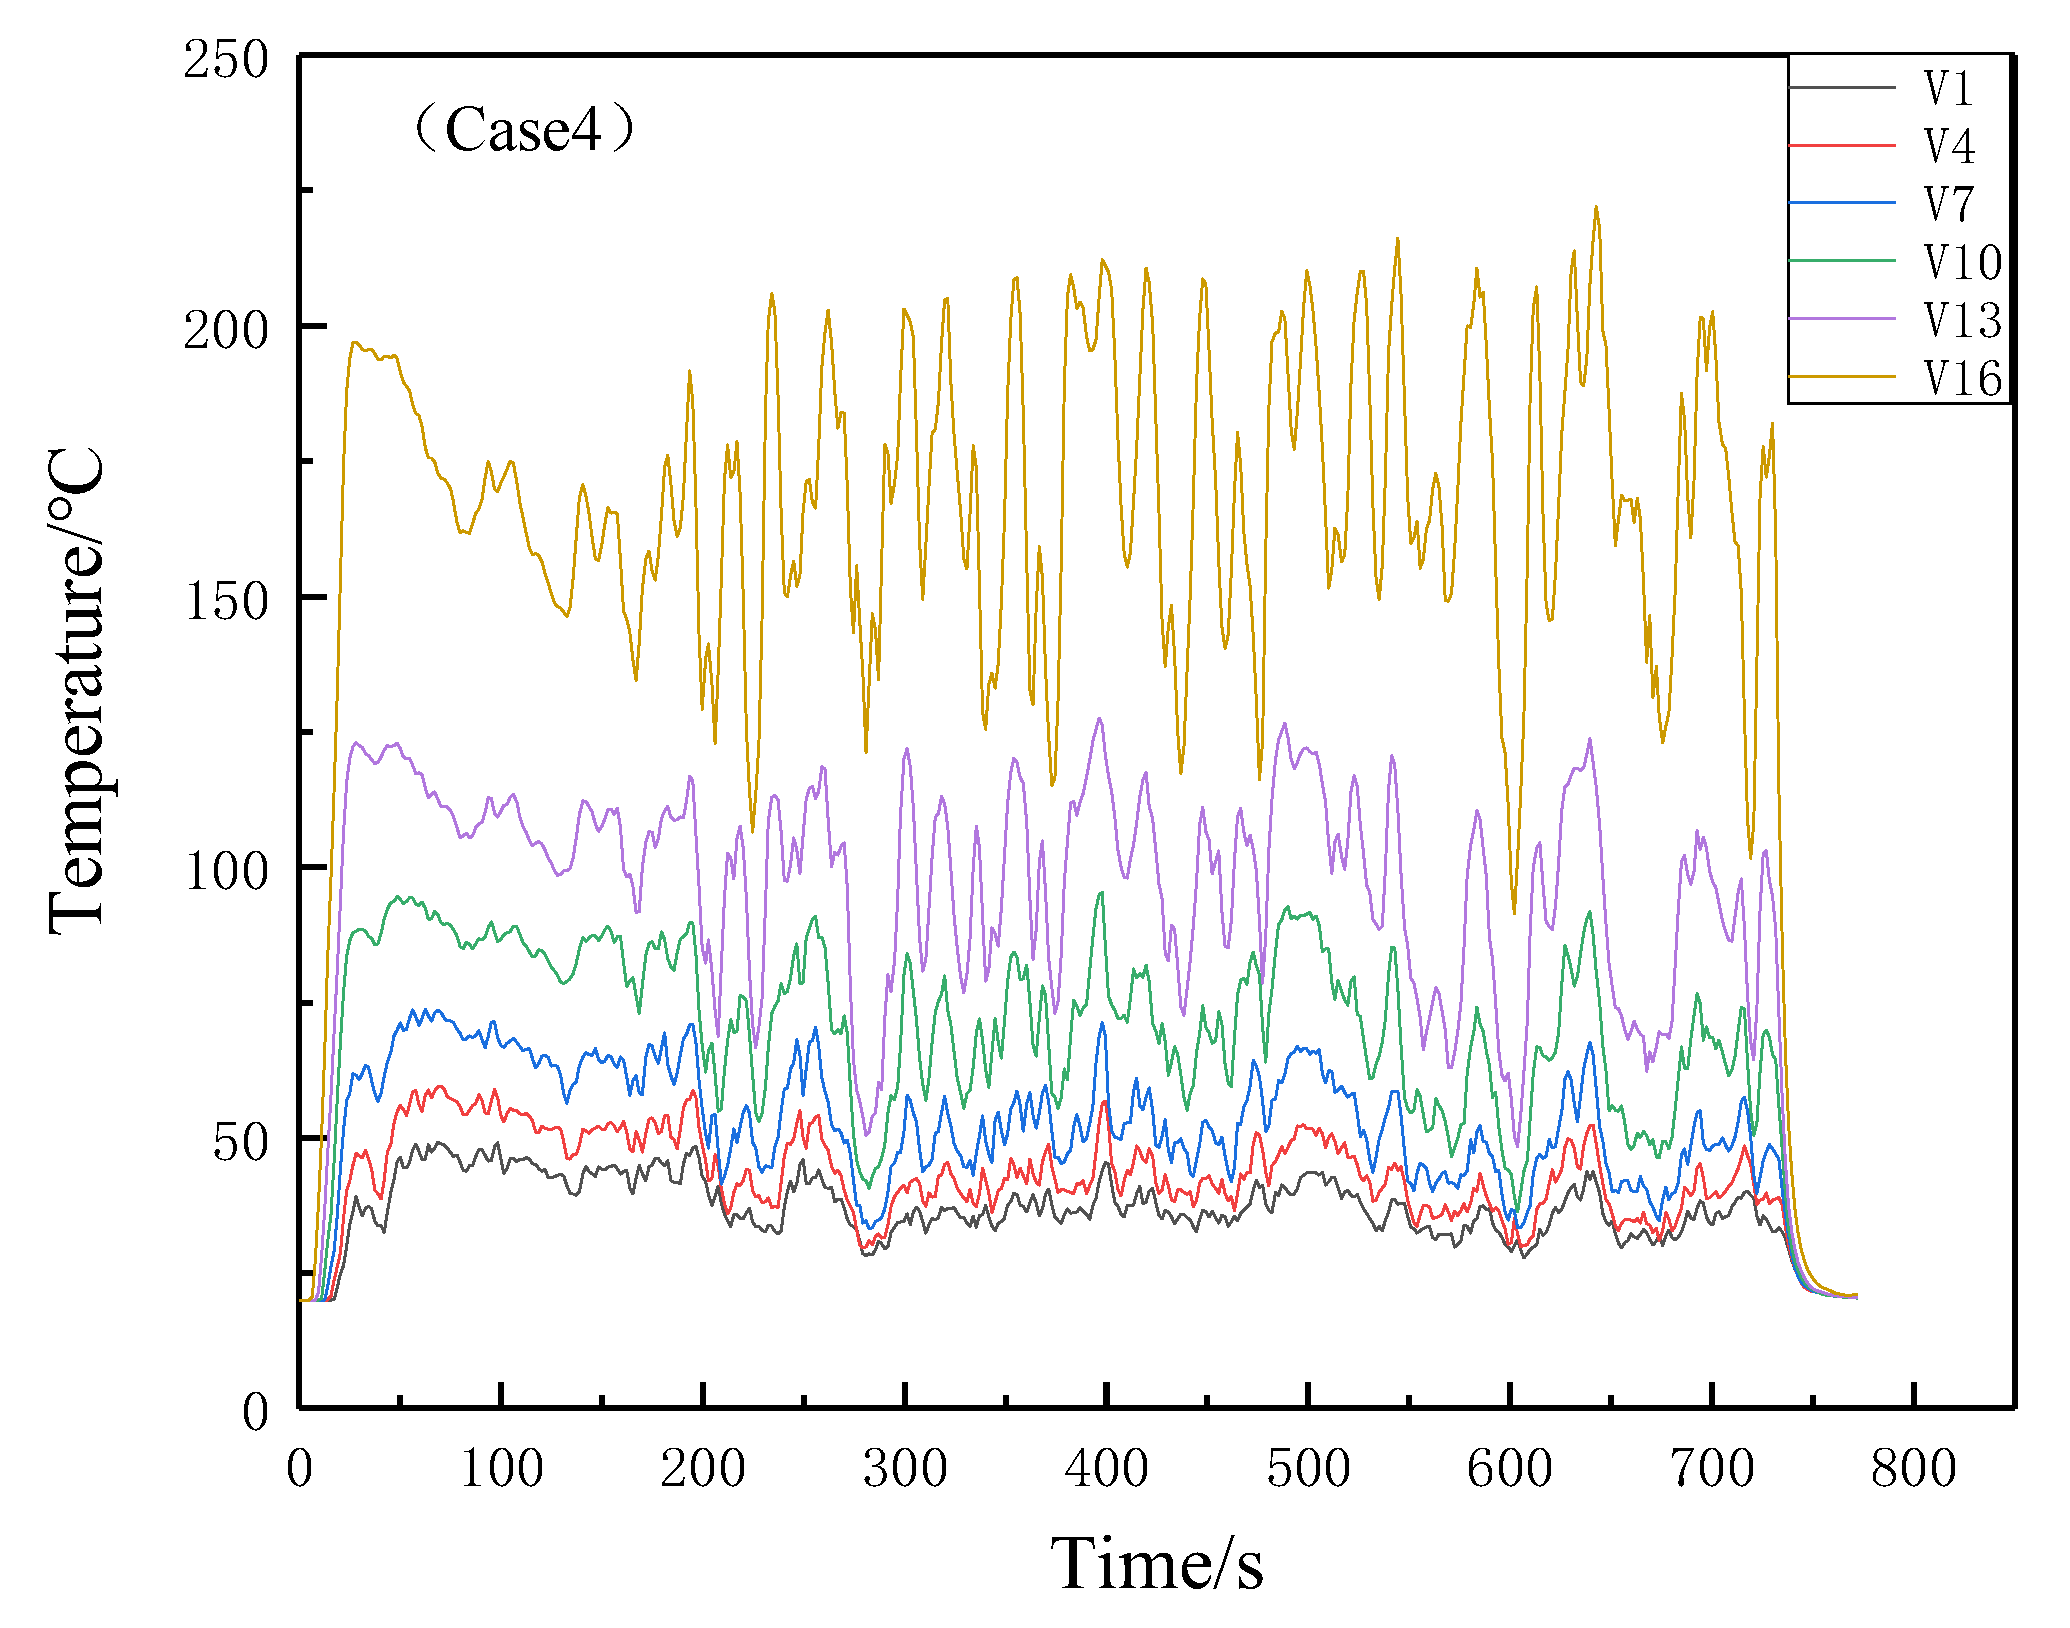
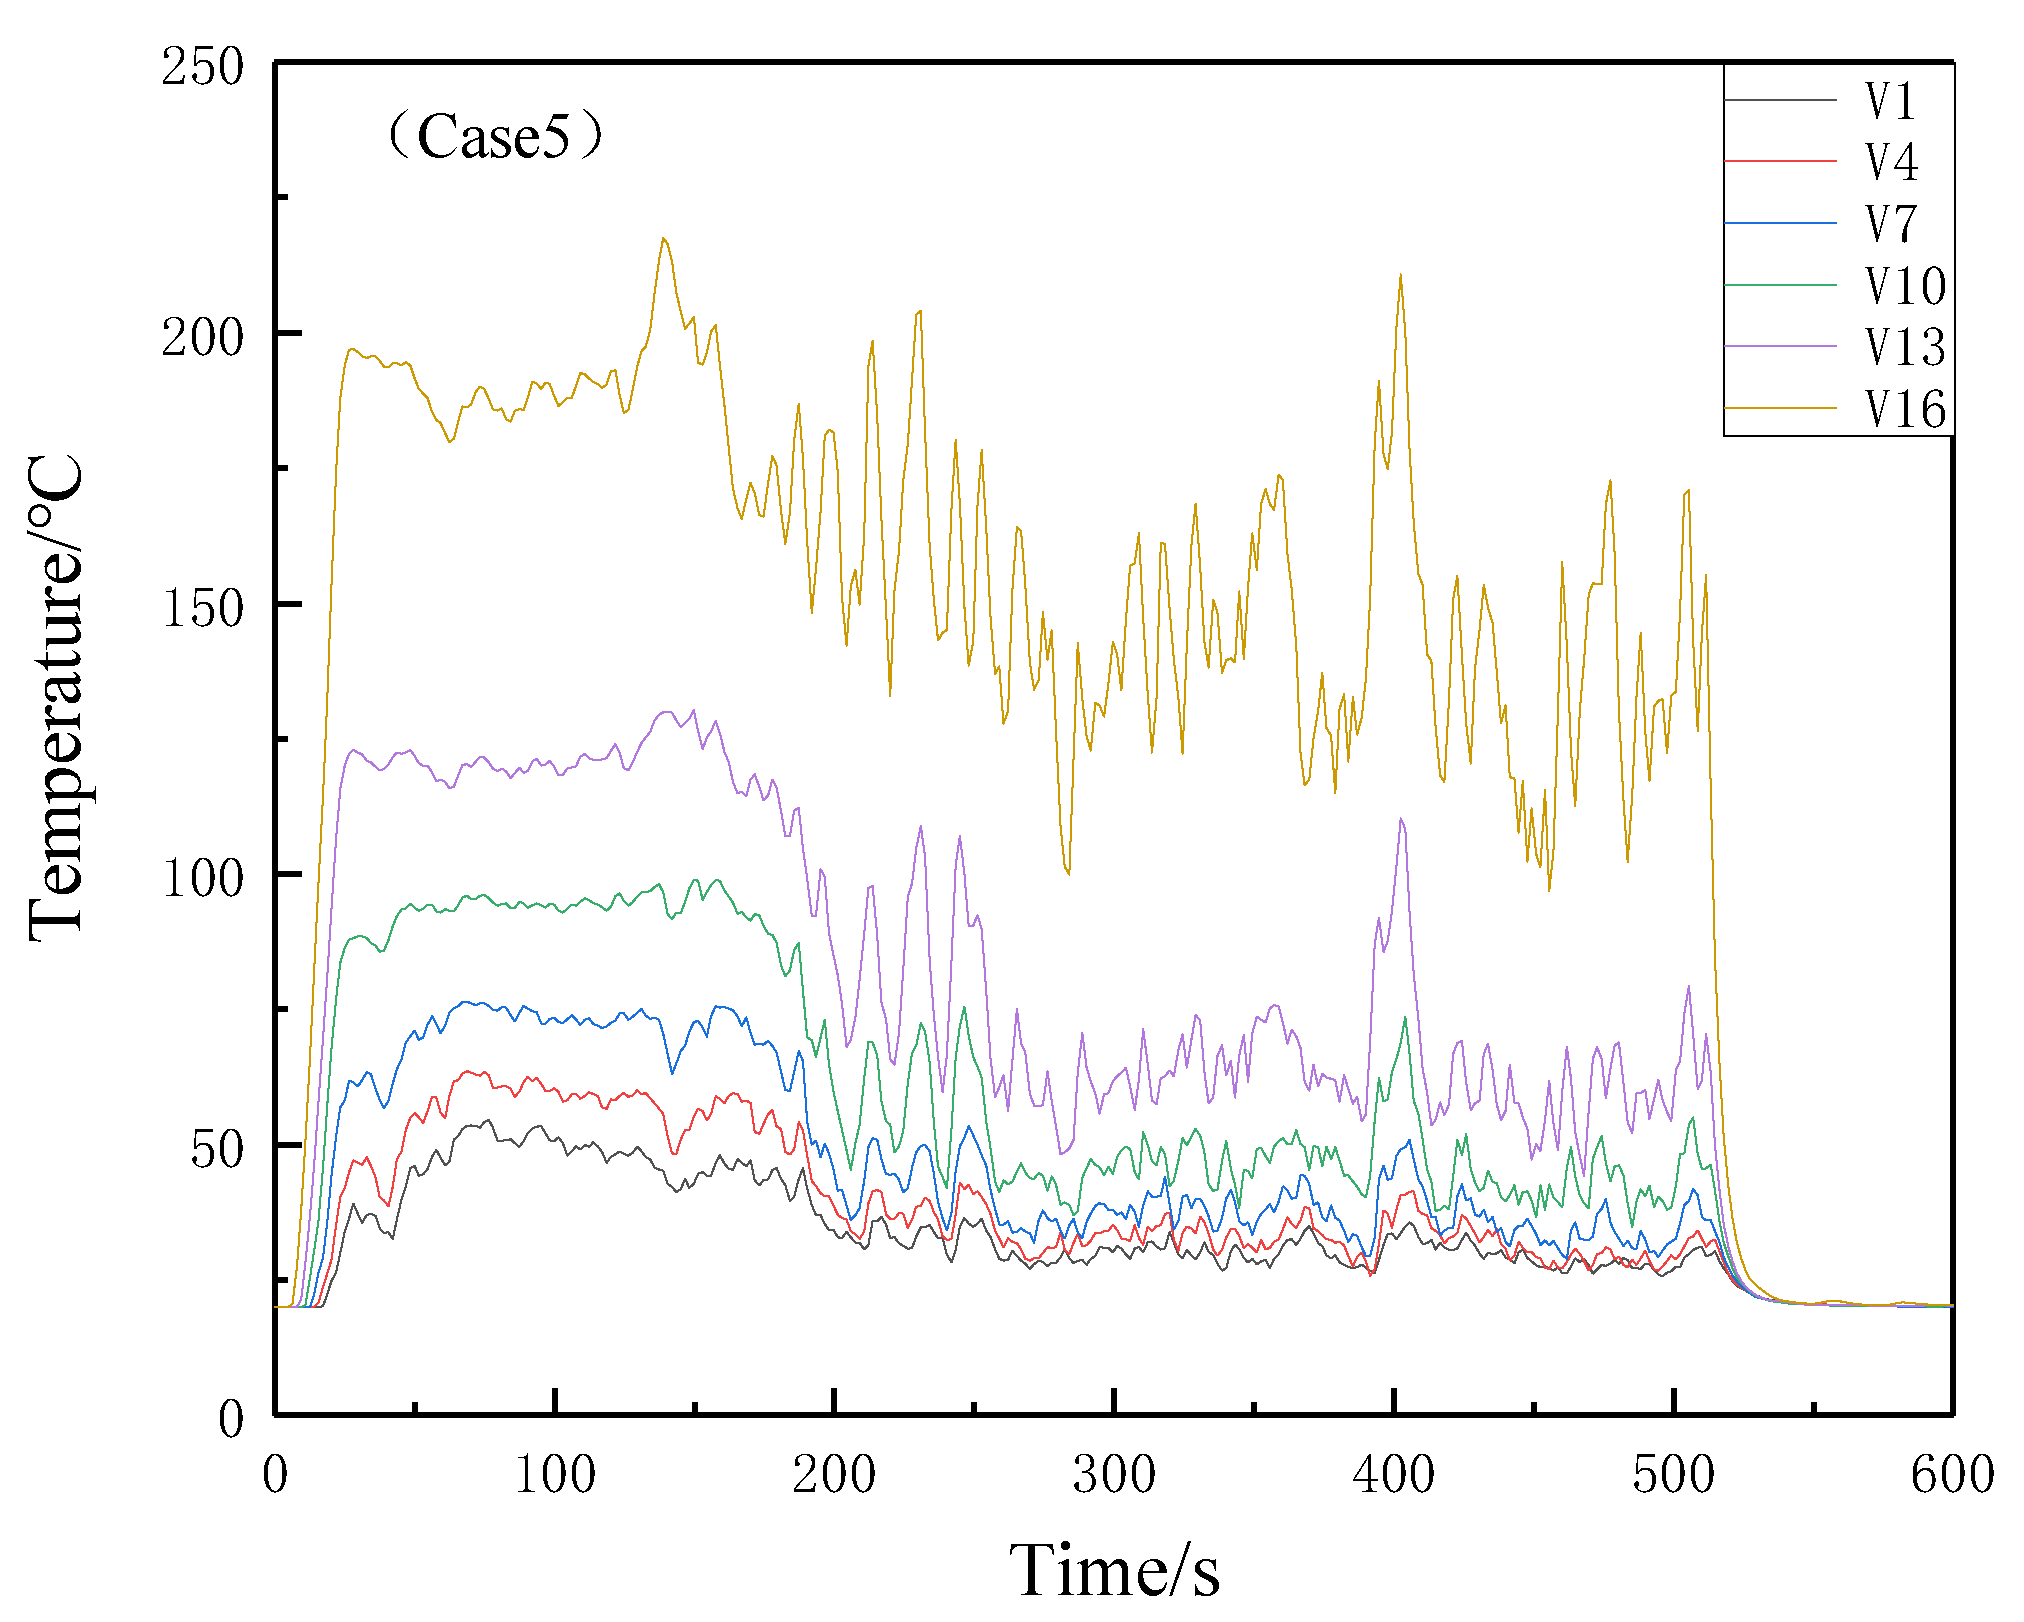
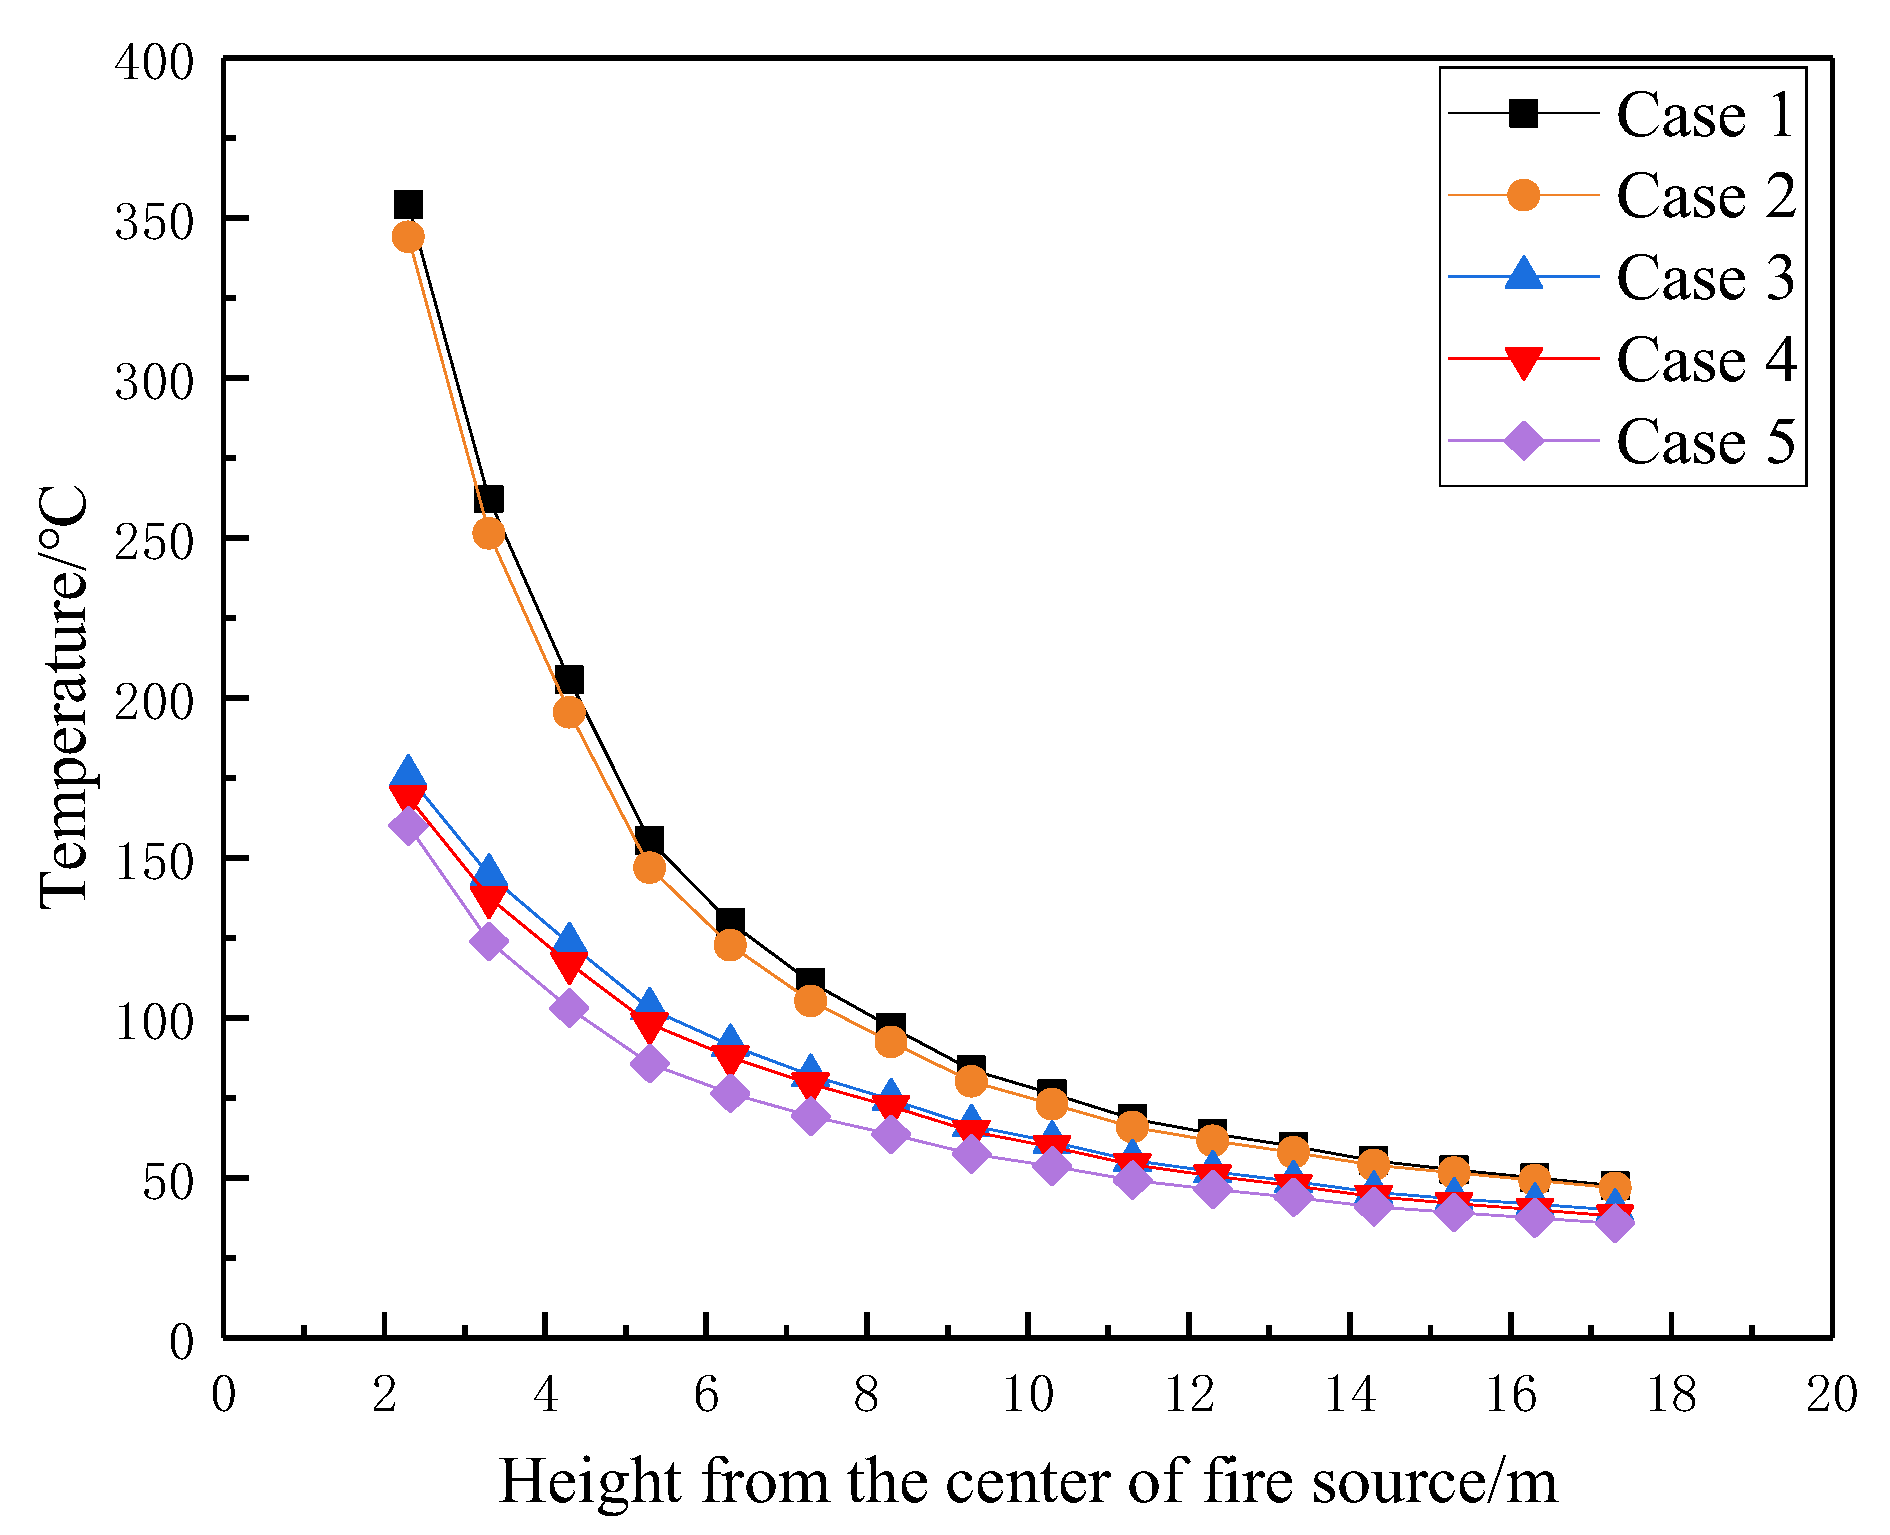
- The higher the heat release rate of the fire source, the higher the average temperature of the smoke in the atrium. There exists an obvious stabilization phase of the smoke temperature. When the smoke exhaust system is turned on, the smoke temperature decreases and the stabilization phase of the smoke temperature is shortened. In the actual scenario, the effect of multi-system cooperative smoke exhaust is better than the smoke exhaust effect of single smoke exhaust system. The smoke temperature distribution obtained from the numerical simulation agrees well with the modified McCaffrey plume model.
- (3)
- The horizontal dimensionless smoke temperature rise below the atrium ceiling changes exponentially with the dimensionless distance from the fire source. The greater the heat release rate, the greater the smoke mass flow rate and smoke spread rate, and the smaller the attenuation coefficient. The attenuation coefficient increases when the smoke exhaust system is turned on. Furthermore, this indicates that the effect of mechanical smoke exhaust is better than that of natural smoke exhaust. Among the factors related to the attenuation coefficient, the effect of the heat release rate of the fire is stronger than that of smoke exhaust. In practical applications, using low calorific value materials, reducing the stacking of combustibles and adjusting the exhaust mode and volume all contribute to the increase of the attenuation coefficient to decrease the atrium temperature as soon as possible.
Author Contributions
Funding
Institutional Review Board Statement
Informed Consent Statement
Data Availability Statement
Conflicts of Interest
References
- Xu, X.; Wang, Z.; Liu, X.; Ji, C.; Yu, N.; Zhu, H.; Li, J.; Wang, P. Study on Fire Smoke Control in Super-high Building Atrium. Procedia Eng. 2018, 211, 844–852. [Google Scholar] [CrossRef]
- Wang, R.; Lan, X.; Xu, L. Smoke spread process under different heights based on numerical simulation. Case Stud. Therm. Eng. 2020, 21, 100710. [Google Scholar] [CrossRef]
- Hu, L.H.; Huo, R.; Li, Y.Z.; Wang, H.B.; Chow, W.K. Full-scale burning tests on studying smoke temperature and velocity along a corridor. Tunn. Undergr. Space Technol. Inc. Trenchless Technol. Res. 2004, 20, 223–229. [Google Scholar] [CrossRef]
- Huo, R.; Li, Y.; Yu, M.; You, F.; Zhou, Y. Preliminary study on mechanical smoke exhaust in large-space building fire. Fire Sci. Technol. 2001, 5, 440–452. [Google Scholar]
- Rho, J.; Ryou, H. A numerical study of atrium fires using deterministic models. Fire Saf. J. 1999, 33, 213–229. [Google Scholar] [CrossRef]
- Mowrer, F.W. Enclosure smoke filling revisited. Fire Saf. J. 1999, 33, 93–114. [Google Scholar] [CrossRef]
- Rafinazari, A.; Hadjisophocleous, G.V. An investigation of the effect of make-up air velocity on smoke layer height with asymmetric openings and rotational air flow in atrium fires. J. Build. Eng. 2020, 27, 100933. [Google Scholar] [CrossRef]
- Long, Z.; Liu, C.; Yang, Y.; Qiu, P.; Tian, X.; Zhong, M. Full-scale experimental study on fire-induced smoke movement and control in an underground double-island subway station. Tunn. Undergr. Space Technol. 2020, 103, 103508. [Google Scholar] [CrossRef]
- Jiao, A.; Lin, W.; Cai, B.; Wang, H.; Chen, J.; Zhang, M.; Xiao, J.; Liu, Q.; Wang, F.; Fan, C. Full-scale experimental study on thermal smoke movement characteristics in an indoor pedestrian street. Case Stud. Therm. Eng. 2022, 34, 102029. [Google Scholar] [CrossRef]
- Tian, H.; Cai, W. Design of fire smoke control in commercial indoor pedestrian street. Fire Sci. Technol. 2013, 32, 1349–1351. [Google Scholar]
- Zhao, Z. Research on Smoke Flow and Control of Fire in Indoor Pedestrian Street; Central South University: Changsha, China, 2014. [Google Scholar]
- Jiang, C. Numerical Simulation Study on Fire Smoke Control in Atrium Space of a Shopping Mall; Anhui Jianzhu University: Hefei, China, 2018. [Google Scholar]
- McGrattan, K.; McDermott, R.; Weinschenk, C.; Forney, G. Fire Dynamics Simulator Users Guide, 6th ed.; Nist Special Publication: Washington, DC, USA, 2013. [Google Scholar]
- Lv, S. Fire and Escape Simulation Chinese Tutorial and Engineering Application; Beijing Chemical Industry Press: Beijing, China, 2014. [Google Scholar]
- GA/T 999-2012; Field Verification Method for Anti-Smoke System Performance Hot Smoke Test Method. Ministry of Public Security of the People’s Republic of China. China Standards Press: Beijing, China.
- NIST Special Publication 1019, April 2015. Fire Dynamics Simulation (Version 6.2.0)—User’s Guide; National Institute of Standards and Technology: Gaithersburg, MD, USA, 2015.
- Dai, J. Test and Correction of Heteroscedasticity in One-Way ANOVA. Stat. Decis. 2017, 8, 23–26. [Google Scholar]
- Zhong, M.; Li, P.; Liu, T. Experimental study on fire smoke movement in a multi-floor and multi-room building. Sci. China Ser. E Eng. Mater. Sci. 2005, 48, 292–304. [Google Scholar] [CrossRef]
- Karlsson, B.; Quintiere, J.G. Enclosure Fire Dynamics; CRC Press: Boca Raton, FL, USA, 1999. [Google Scholar]
- Walter, W.J.; Glenn, P.F. NISTTN1431, A Technical Reference for CFAST: An Engineering Tool for Estimating Fire and Smoke Transport; National Institute of Standards and Technology, Building and Fire Research Laboratory: Gaithersburg, MD, USA, 2000; pp. 17–77. [Google Scholar]
- Cheng, Y.; Chen, L.; Zhang, M. The Analysis and Estimation of the Plume Models in the Development Fires. Fire Saf. Sci. 2002, 11, 132–136. [Google Scholar]
- Han, R.; Zhu, G.; Zhang, G.; Zhang, Y. Optimization Design of Smoke Extraction in the High-rise Building Wit Atrium. Ind. Saf. Environ. Prot. 2013, 39, 48–51. [Google Scholar]
- Tao, Y.; Lu, K.; Chen, X.; Mao, S.; Ding, Y.; Zhao, Y. Experimental investigation on the temperature profile of large scale RP-5 aviation kerosene pool fire in an open space. Fuel 2020, 264, 116852. [Google Scholar] [CrossRef]
- Gong, L.; Jiang, L.; Li, S.; Shen, N.; Zhang, Y.; Sun, J. Theoretical and experimental study on longitudinal smoke temperature distribution in tunnel fires. Int. J. Therm. Sci. 2016, 102, 319–328. [Google Scholar] [CrossRef]


| Case | Heat Release Rates | Fire Location | Smoke Exhaust Mode |
|---|---|---|---|
| Case 1 | 1.5 MW | Atrium 2# | natural filling |
| Case 2 | 1.5 MW | Atrium 2# | natural smoke exhaust |
| Case 3 | 0.7 MW | Atrium 2# | natural filling |
| Case 4 | 0.34 MW | Atrium 2# | natural smoke exhaust |
| Case 5 | 0.34 MW | Atrium 2# | mechanical smoke exhaust |
| Error Source | Sum of Squares | Freedom | Mean Square | F | Fα(r − 1, n − r) |
|---|---|---|---|---|---|
| Intergroup differences | 2.08291 × 10⁶ | 1 | 2.08291 × 10⁶ | 113.26094 | 3.85 |
| Intragroup differences | 2.21971 × 10⁷ | 1027 | 18390.333 | ||
| Sum | 2.428 × 10⁷ | 1028 |
| Zone | [m/kW2/5] | ||
|---|---|---|---|
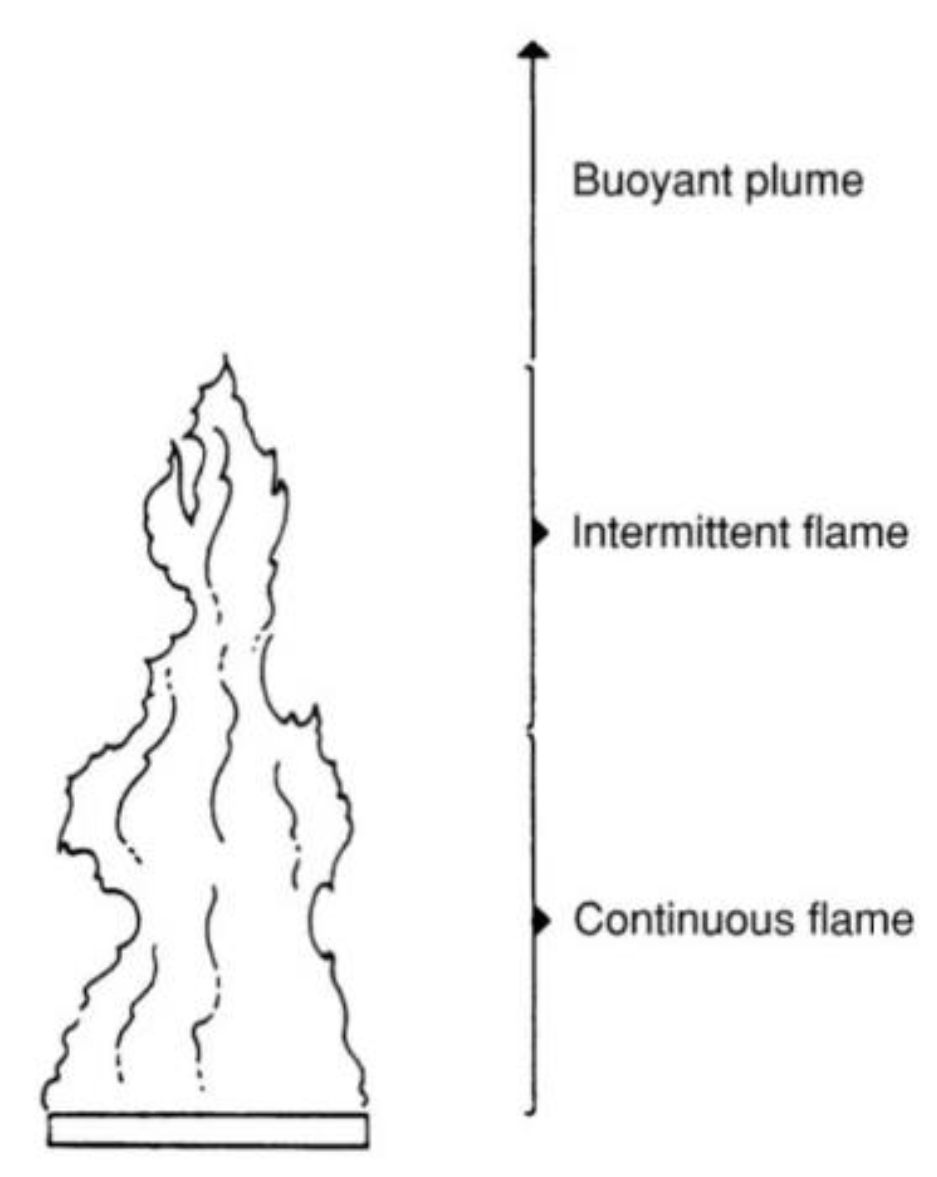
| Continuous flame zone | <0.08 | 6.8 [m1/2/s] | 1/2 |
| Intermittent flame zone | 0.08–0.2 | 1.9 [m/kW1/5 s] | 0 |
| Plume zone | >0.2 | 1.1 [m4/3/kW1/3 s] | −1/3 |
| Zone | [m/kW2/5] | ||
|---|---|---|---|
| Continuous flame zone | <0.08 | 4.84 [m1/2/s] | 0.5 |
| Intermittent flame zone | 0.08–0.2 | 1.46 [m/kW1/5 s] | 0.03 |
| Plume zone | >0.2 | 1.31 [m4/3/kW1/3 s] | −0.04 |
| Case 1 | Case 2 | Case 3 | Case 4 | Case 5 | |
|---|---|---|---|---|---|
| (East) | 1.38 | 1.40 | 1.87 | 2.42 | 2.56 |
| (West) | 1.55 | 1.57 | 1.91 | 2.82 | 2.95 |
Disclaimer/Publisher’s Note: The statements, opinions and data contained in all publications are solely those of the individual author(s) and contributor(s) and not of MDPI and/or the editor(s). MDPI and/or the editor(s) disclaim responsibility for any injury to people or property resulting from any ideas, methods, instructions or products referred to in the content. |
© 2023 by the authors. Licensee MDPI, Basel, Switzerland. This article is an open access article distributed under the terms and conditions of the Creative Commons Attribution (CC BY) license (https://creativecommons.org/licenses/by/4.0/).
Share and Cite
Lin, W.; Liu, Q.; Zhang, M.; Cai, B.; Wang, H.; Chen, J.; Zhou, Y. Numerical Simulation on Smoke Temperature Distribution in a Large Indoor Pedestrian Street Fire. Fire 2023, 6, 115. https://doi.org/10.3390/fire6030115
Lin W, Liu Q, Zhang M, Cai B, Wang H, Chen J, Zhou Y. Numerical Simulation on Smoke Temperature Distribution in a Large Indoor Pedestrian Street Fire. Fire. 2023; 6(3):115. https://doi.org/10.3390/fire6030115
Chicago/Turabian StyleLin, Weidong, Qiyu Liu, Meihong Zhang, Bihe Cai, Hui Wang, Jian Chen, and Yang Zhou. 2023. "Numerical Simulation on Smoke Temperature Distribution in a Large Indoor Pedestrian Street Fire" Fire 6, no. 3: 115. https://doi.org/10.3390/fire6030115