
Effects of Fire Location and Forced Air Volume on Fire Development for Single-Ended Tunnel Fire with Forced Ventilation
Abstract
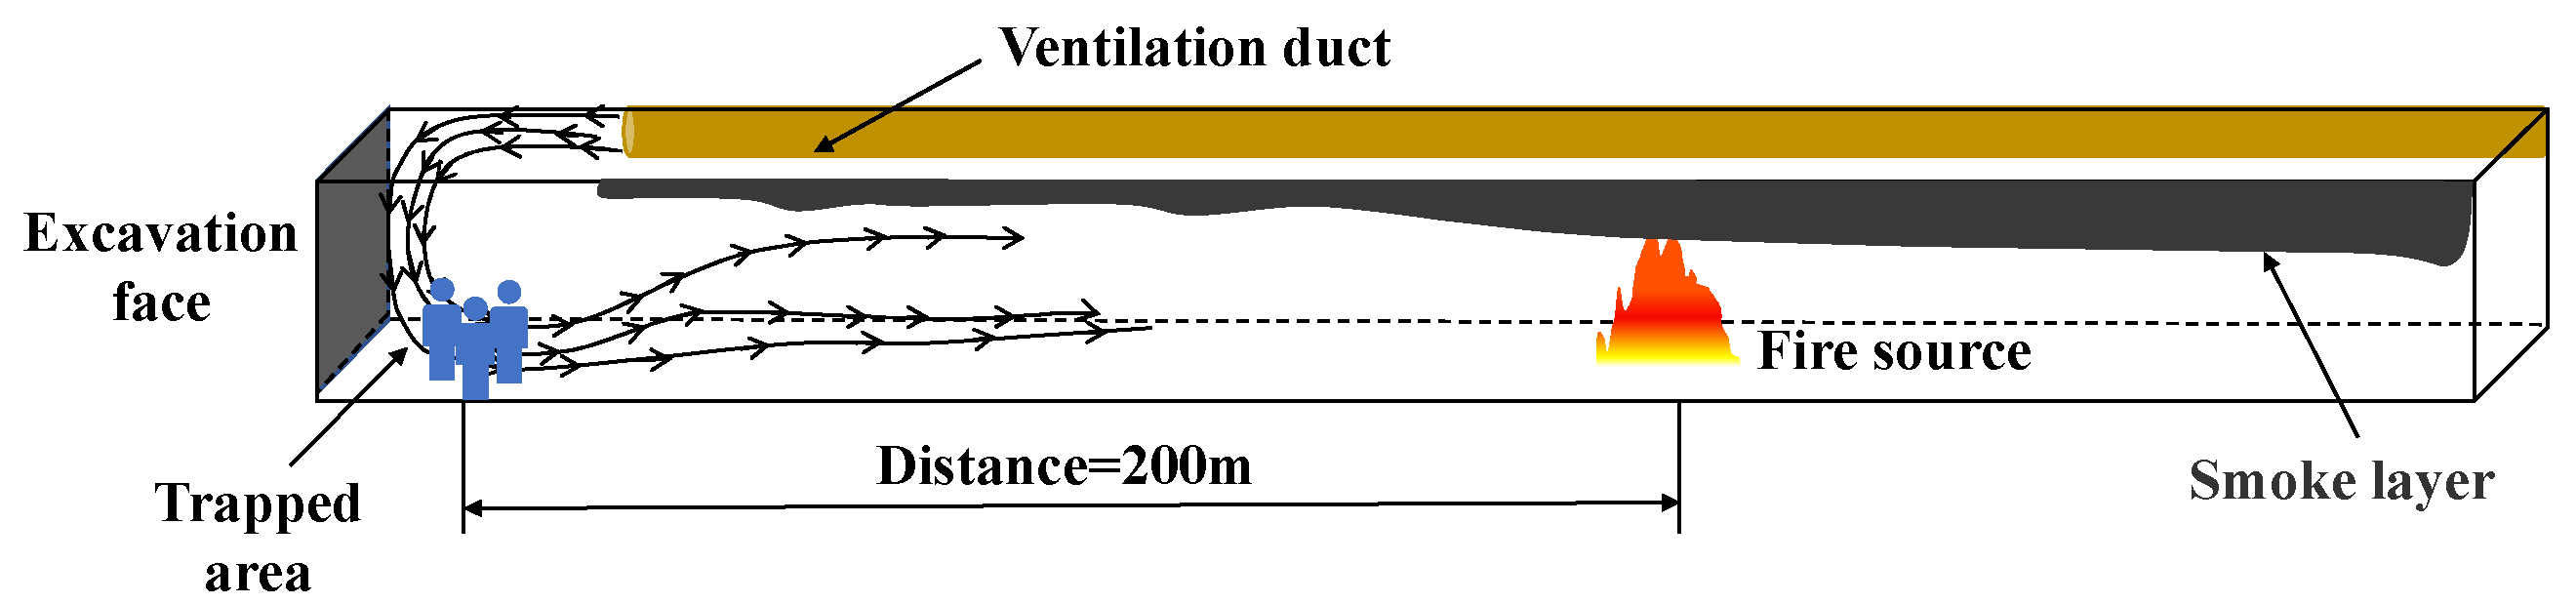
:1. Introduction
2. Numerical Model and Model Validation
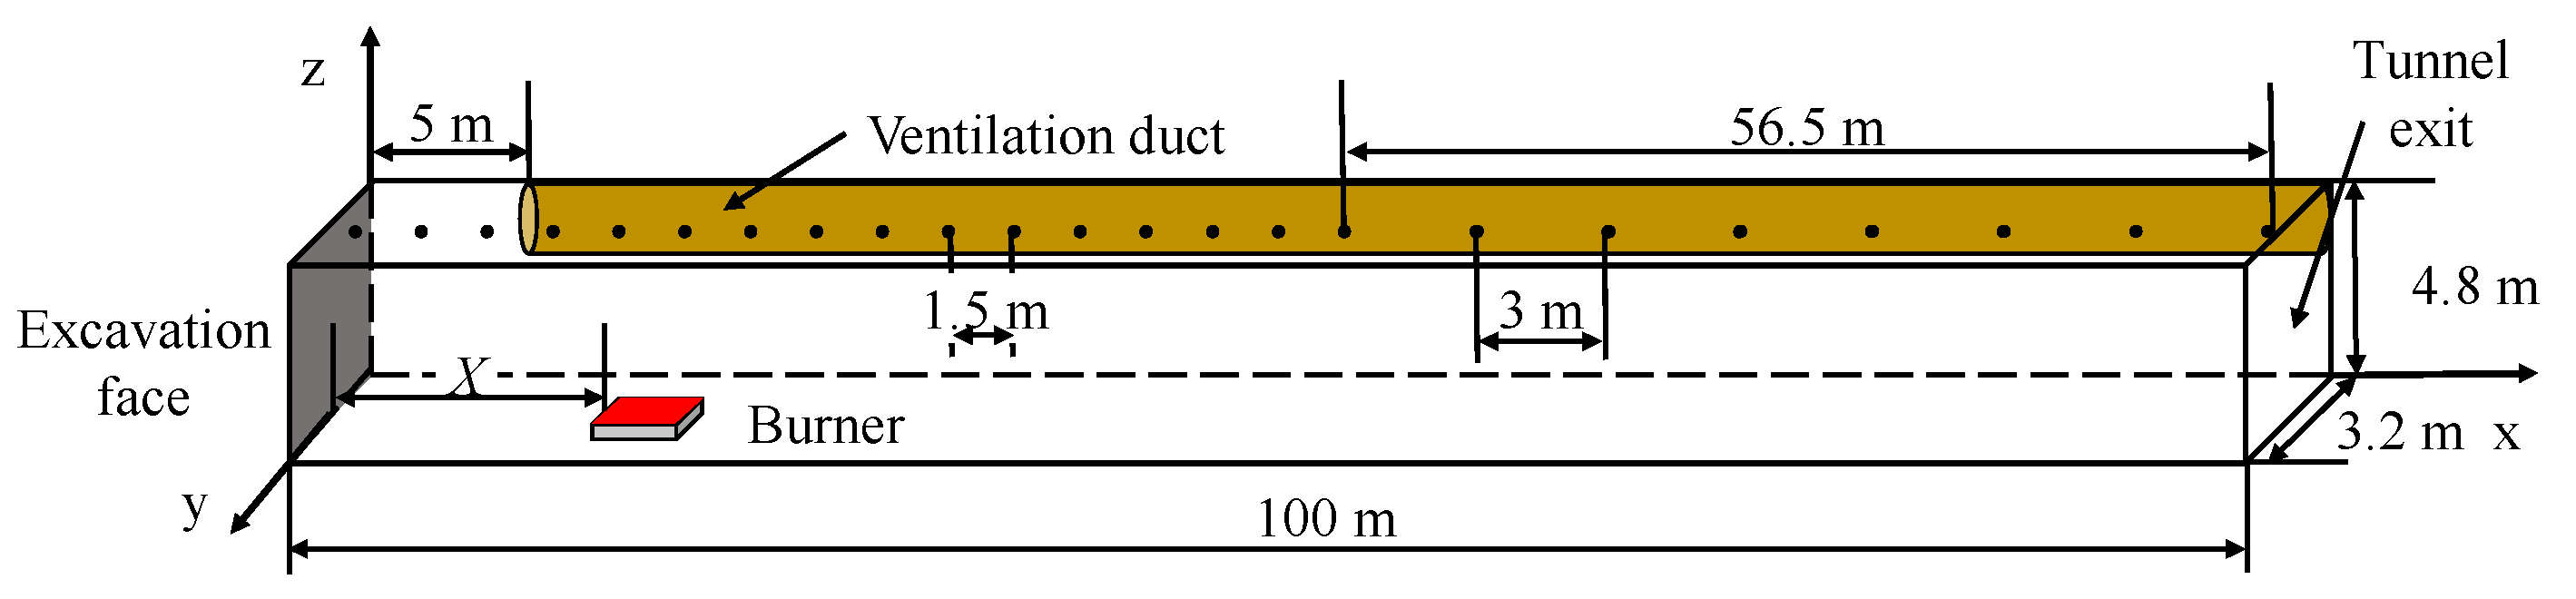
2.1. Model Construction
2.2. Fire Parameters and Boundary Conditions Setup
2.3. Meshes
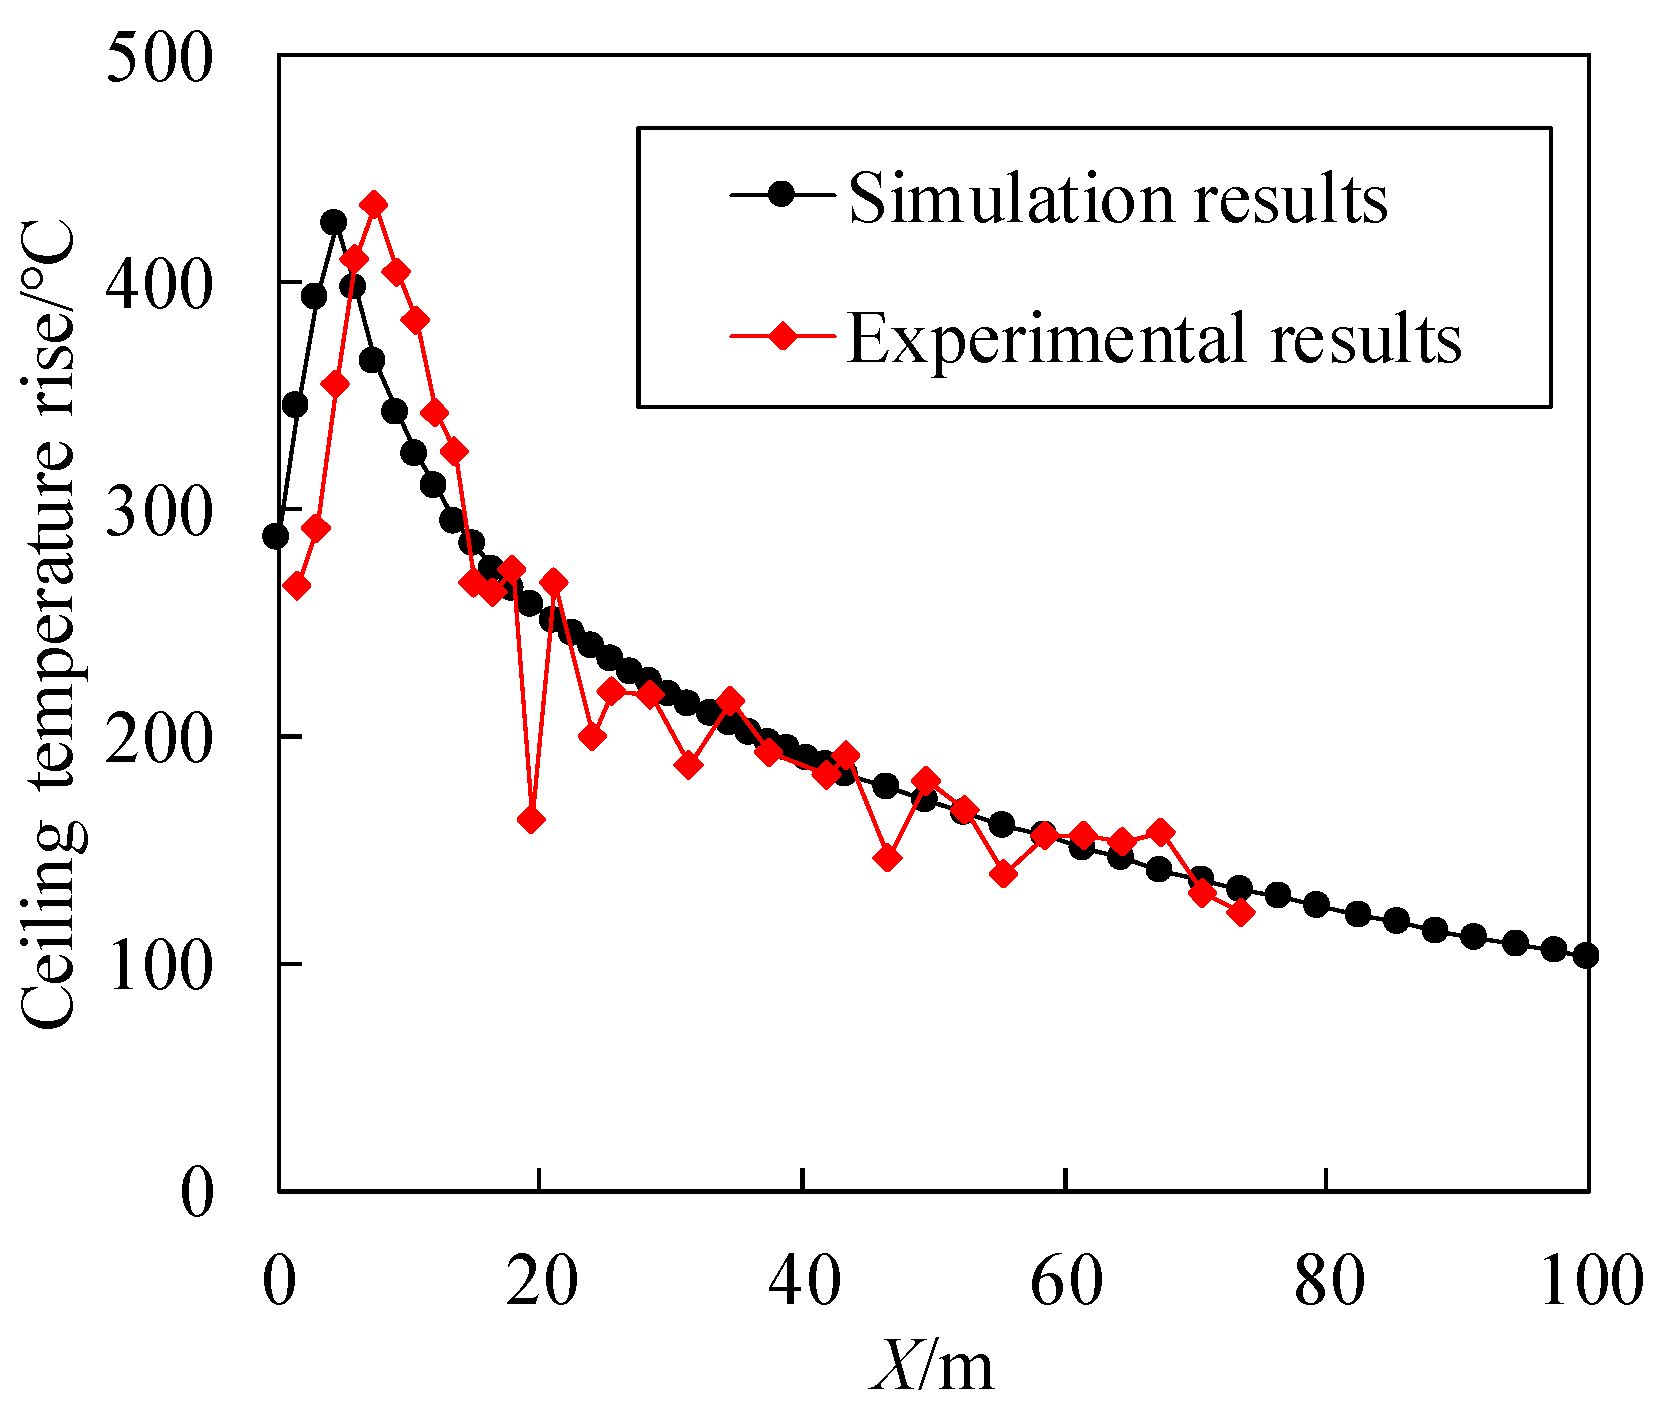
2.4. FDS Model Verification
2.5. Simulation Tests
3. Results and Discussion
3.1. Flow Field with Forced Ventilation
3.2. Fire Location Effect on the Internal Environment of Tunnel
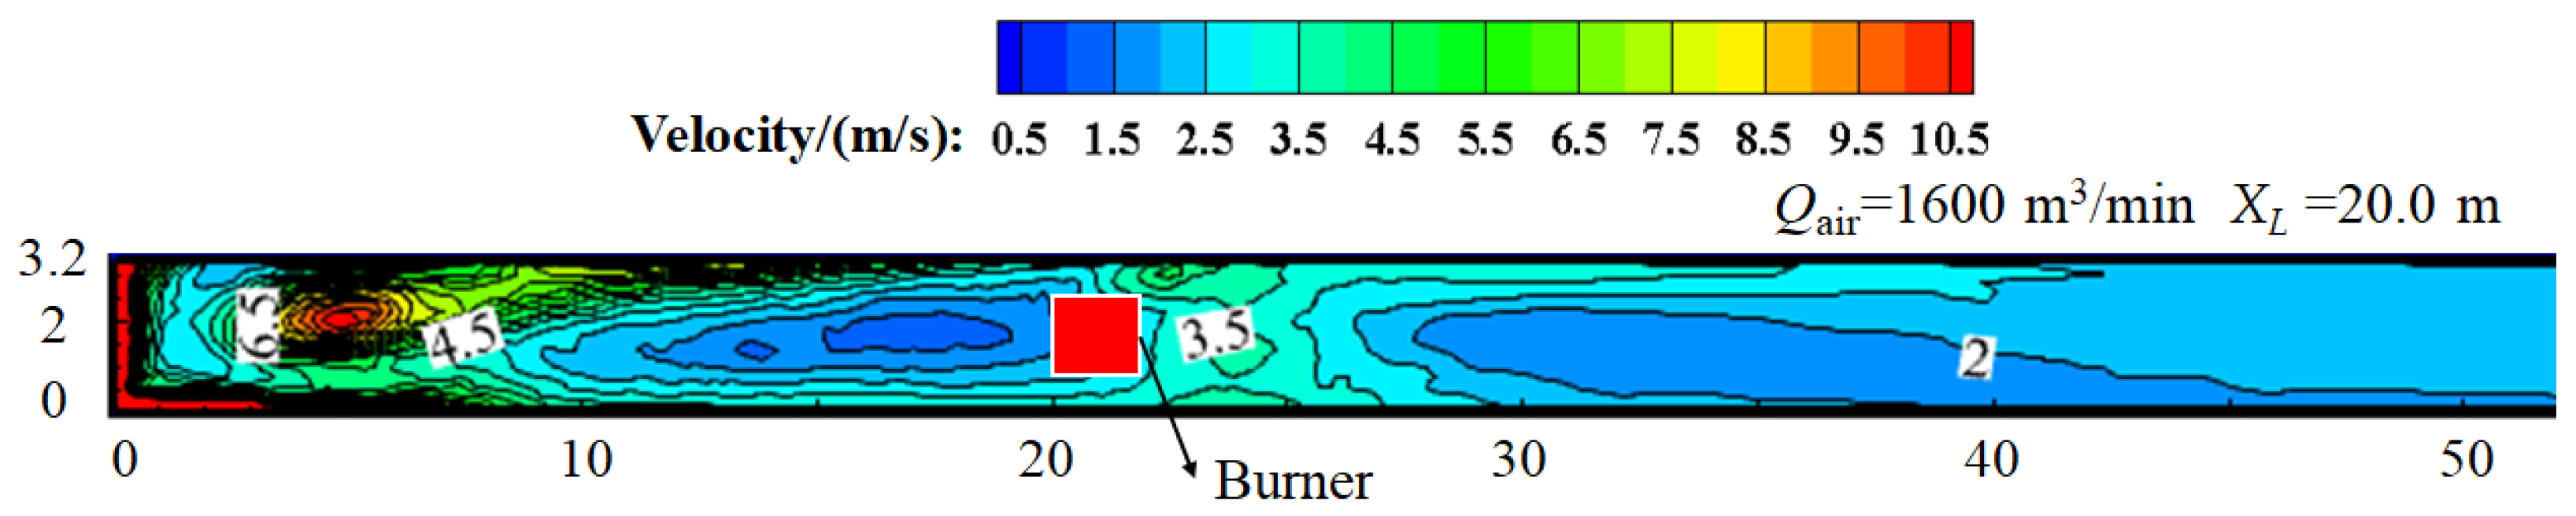
3.2.1. Fire Location Effect on the Flow Field Distribution
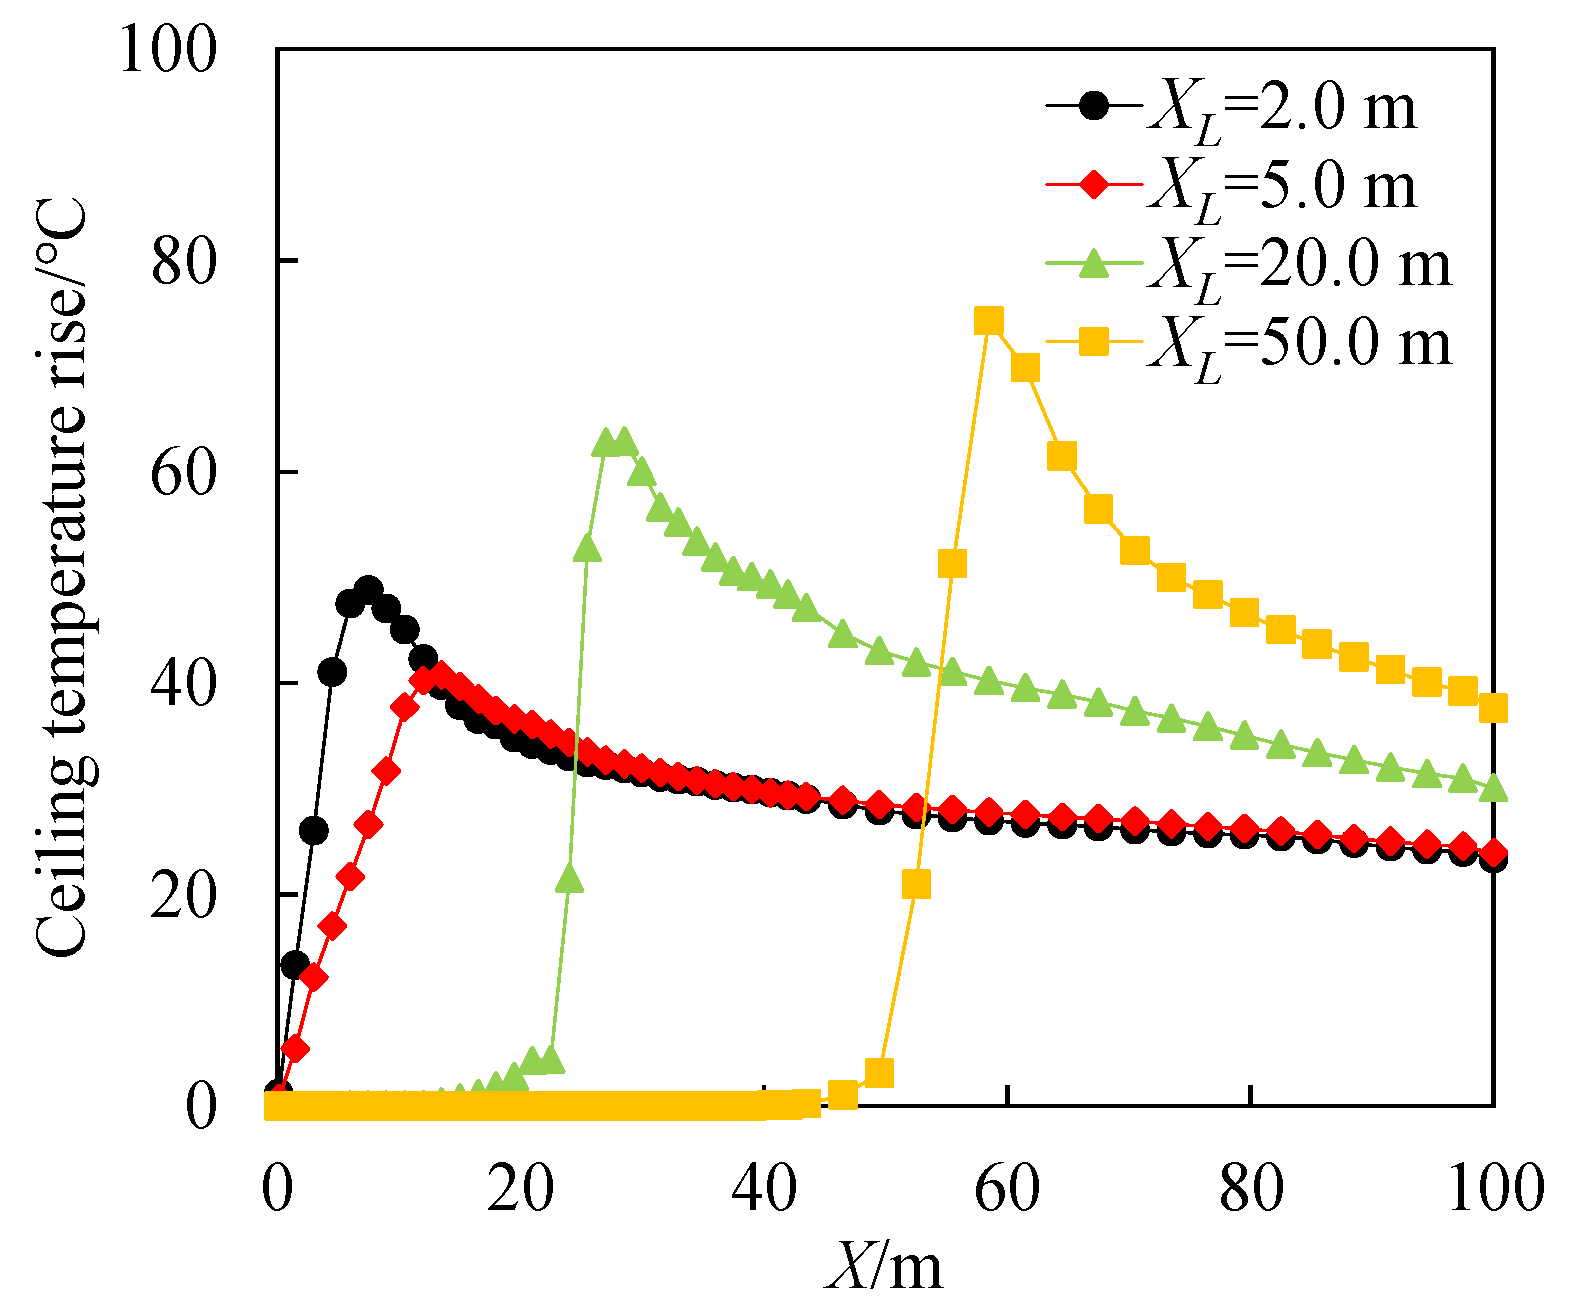
3.2.2. Fire Location Effect on the Temperature Distribution
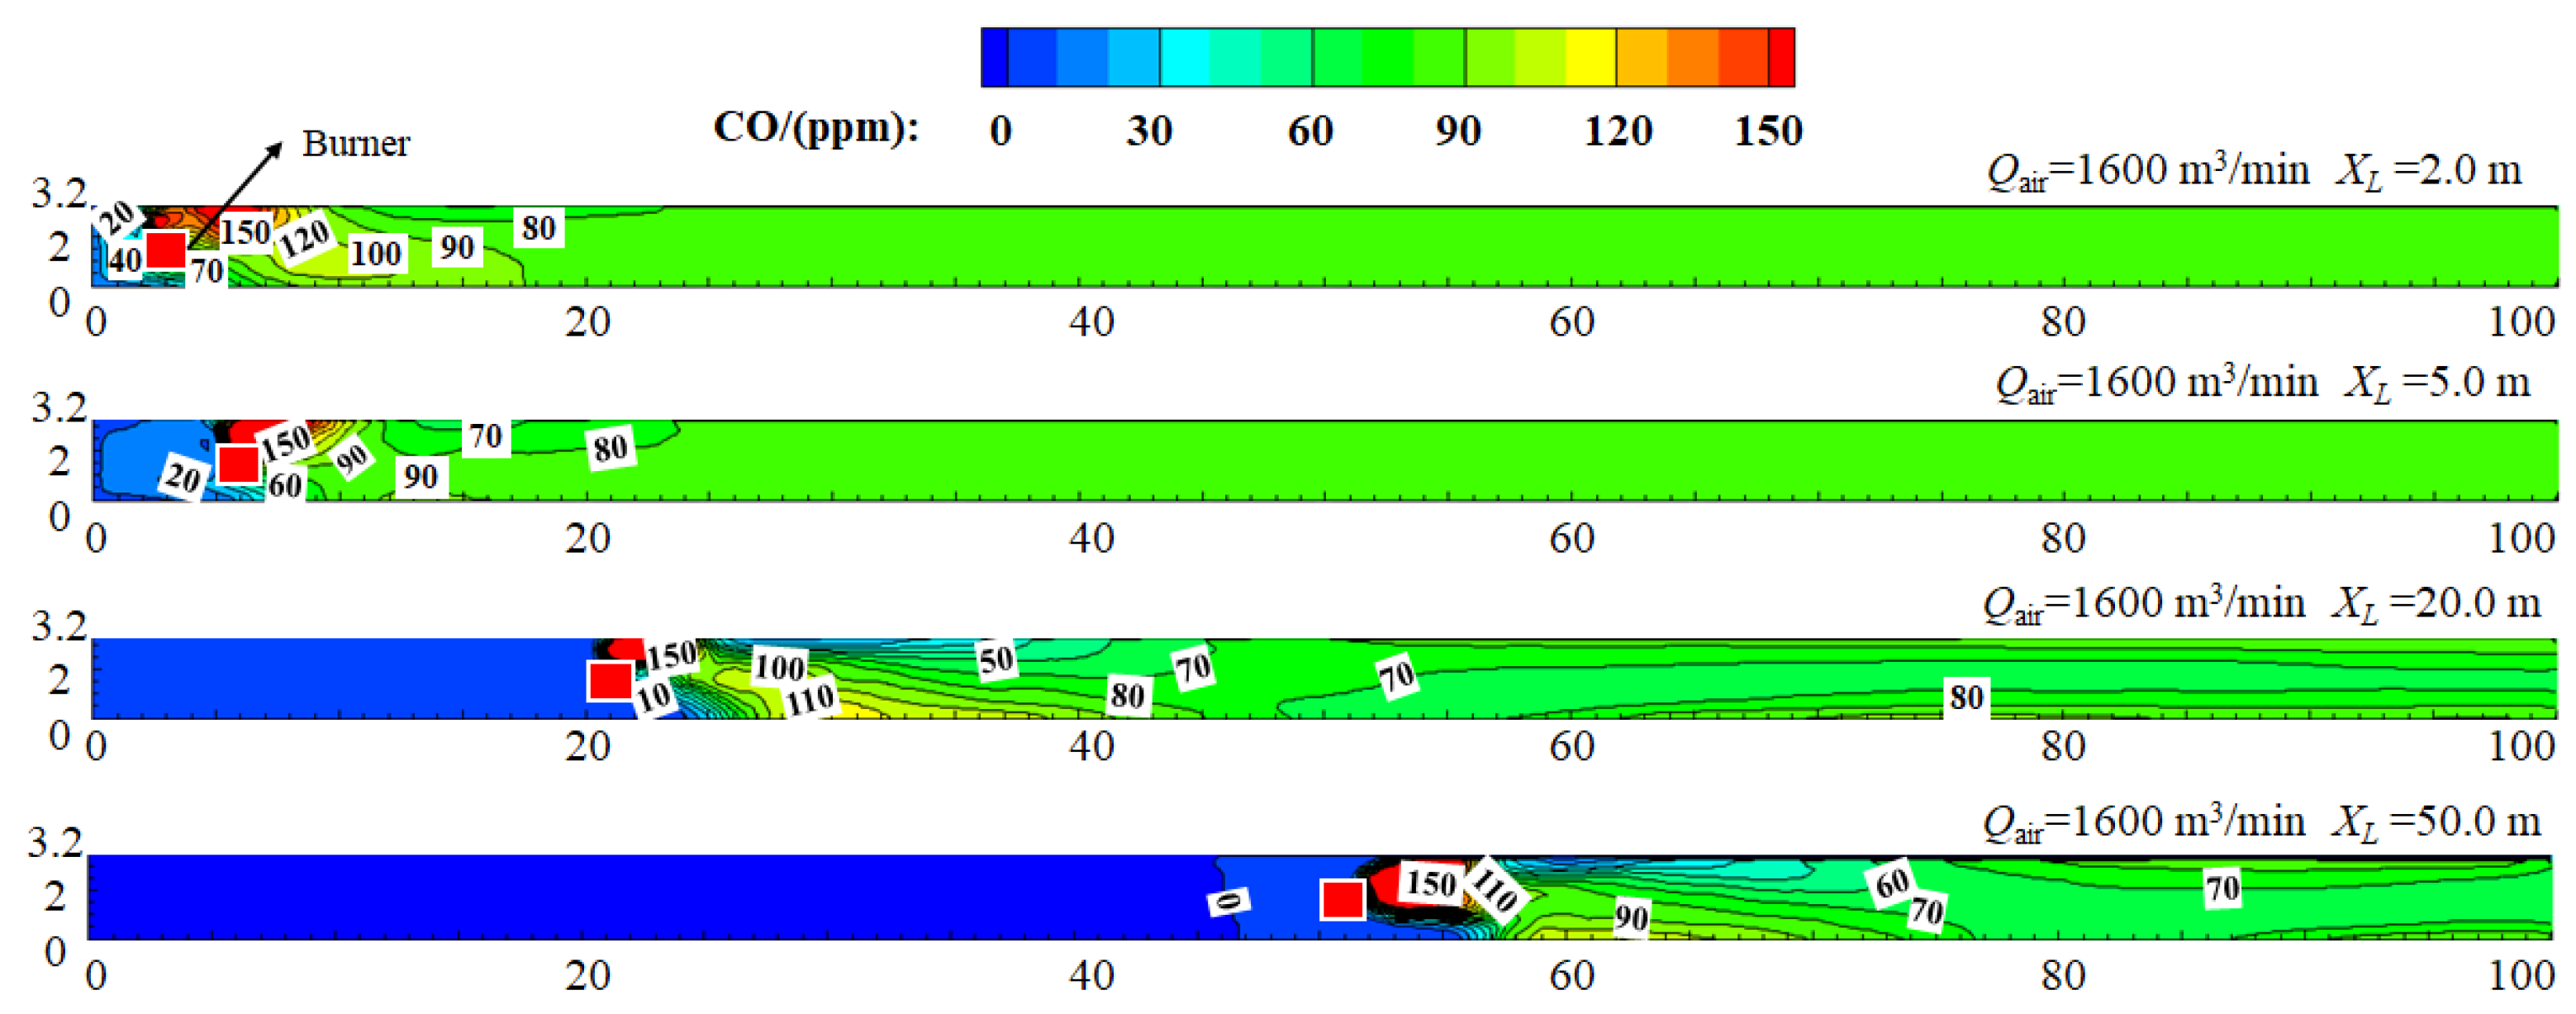
3.2.3. Fire Location Effect on the CO Concentration Distribution
3.3. Forced Air Volume Effect on the Tunnel Environment
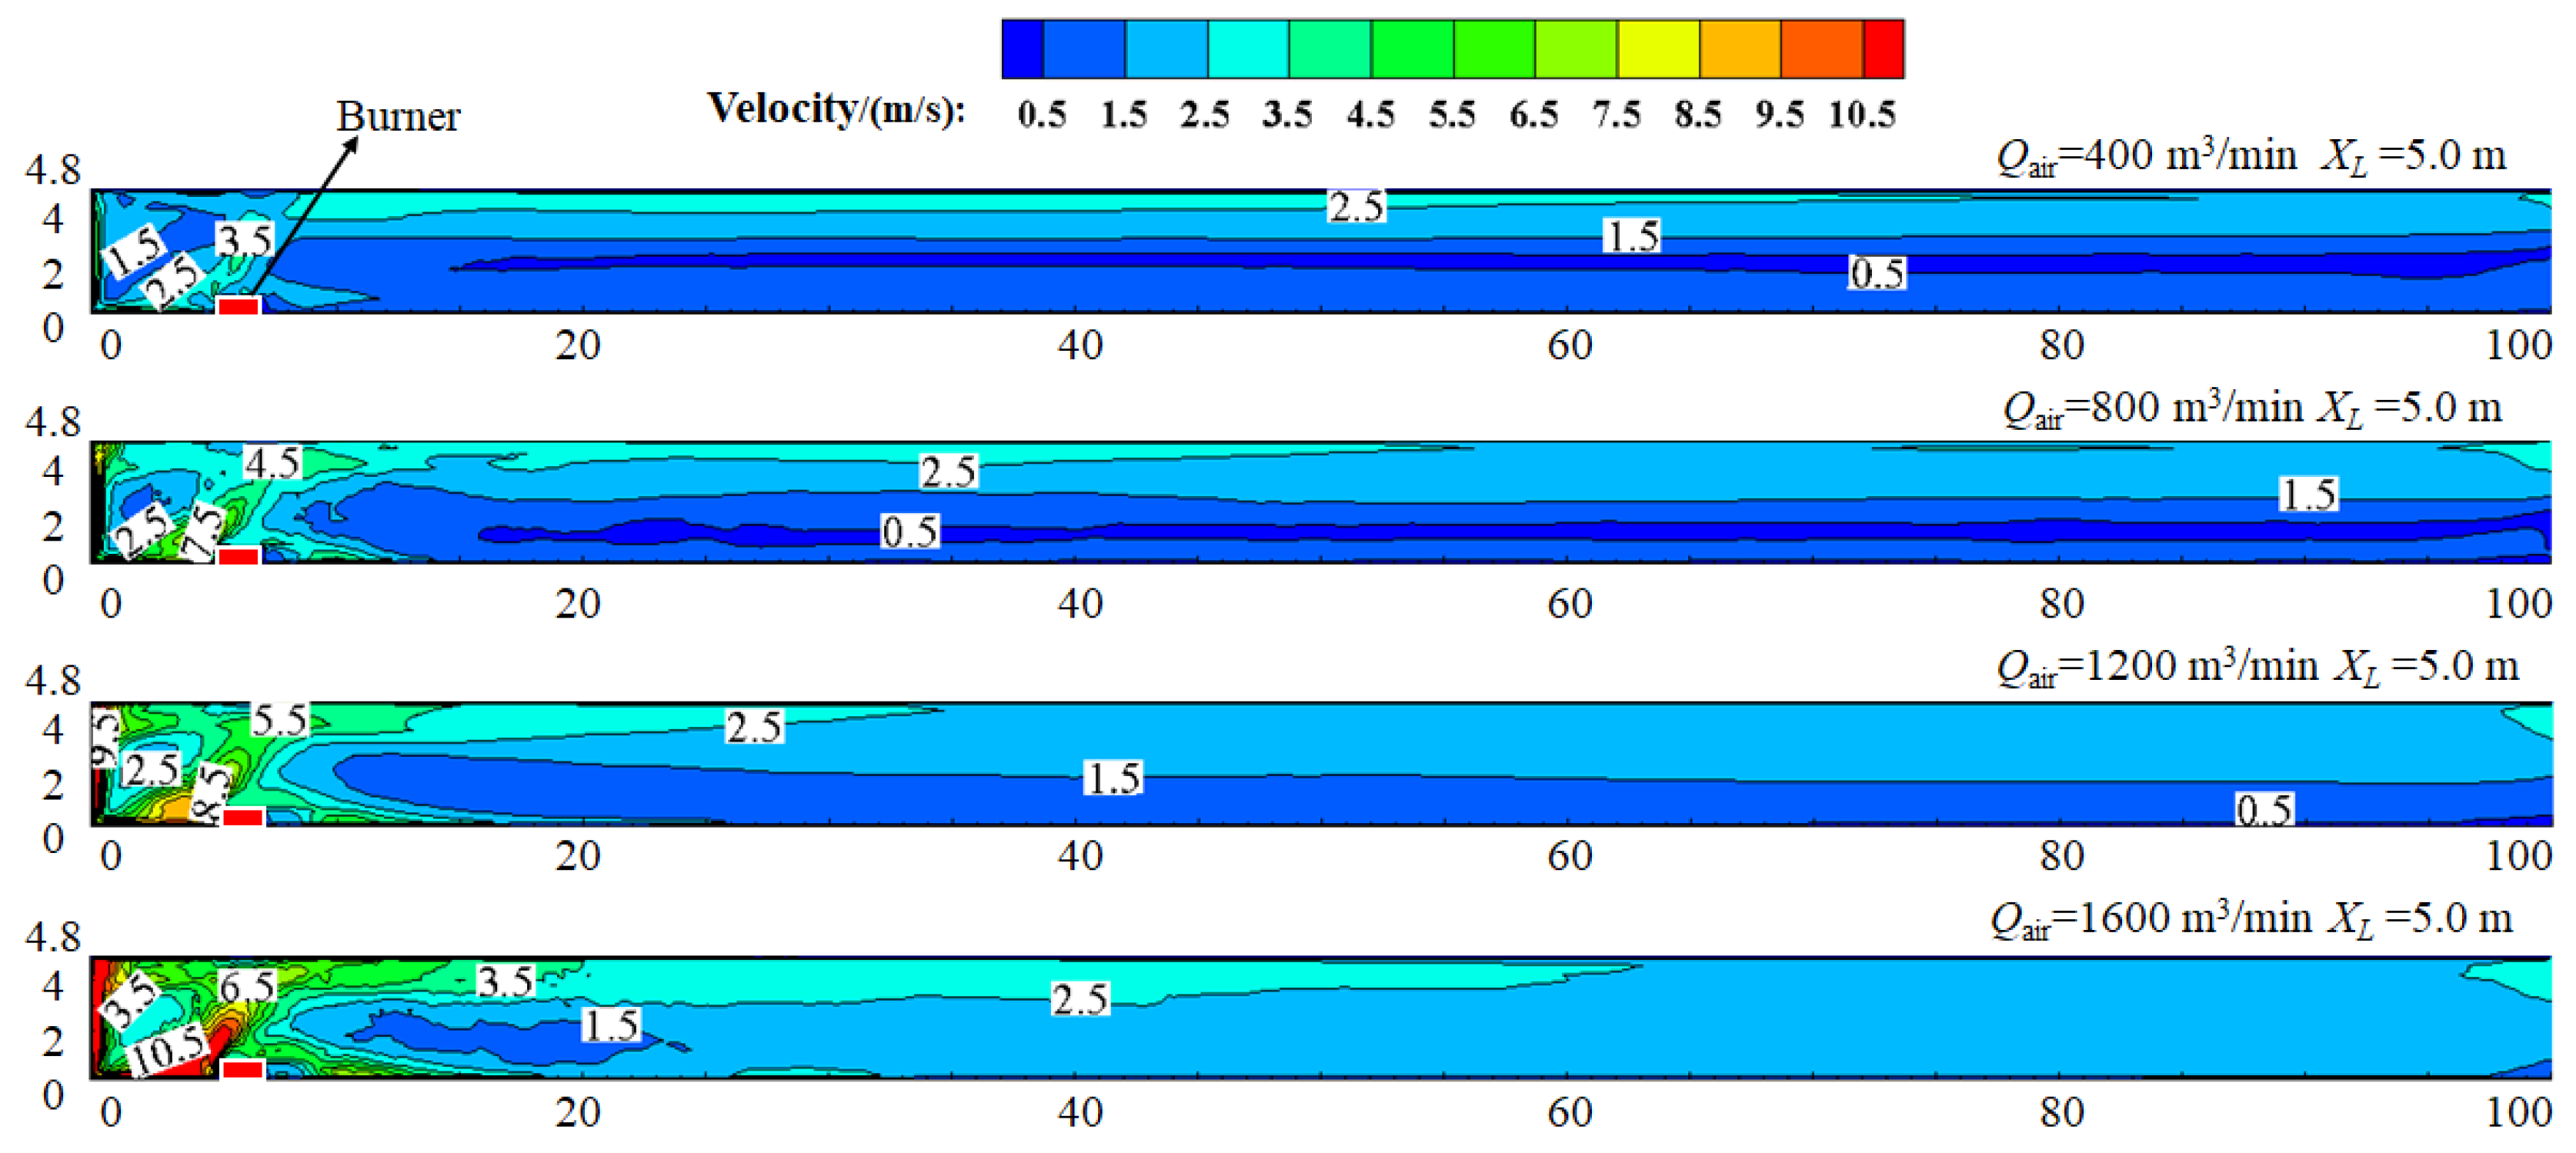
3.3.1. Forced Air Volume Effect on the Flow Field Distribution
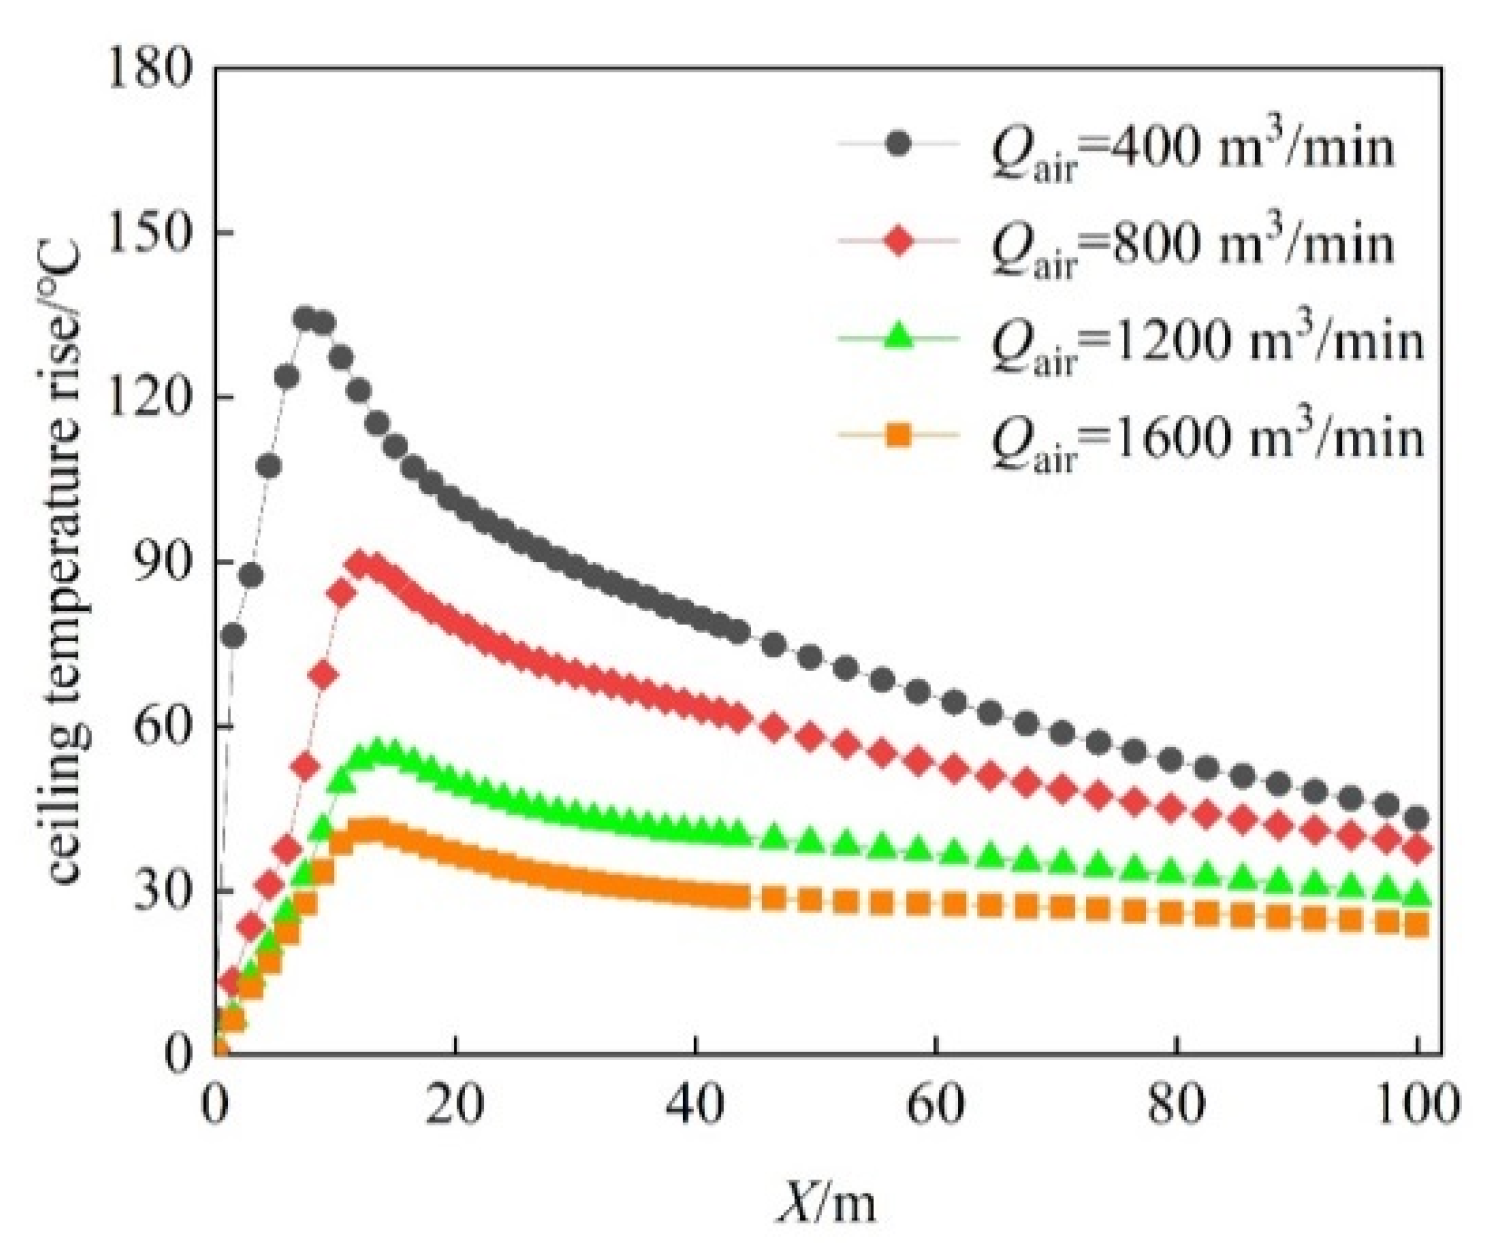
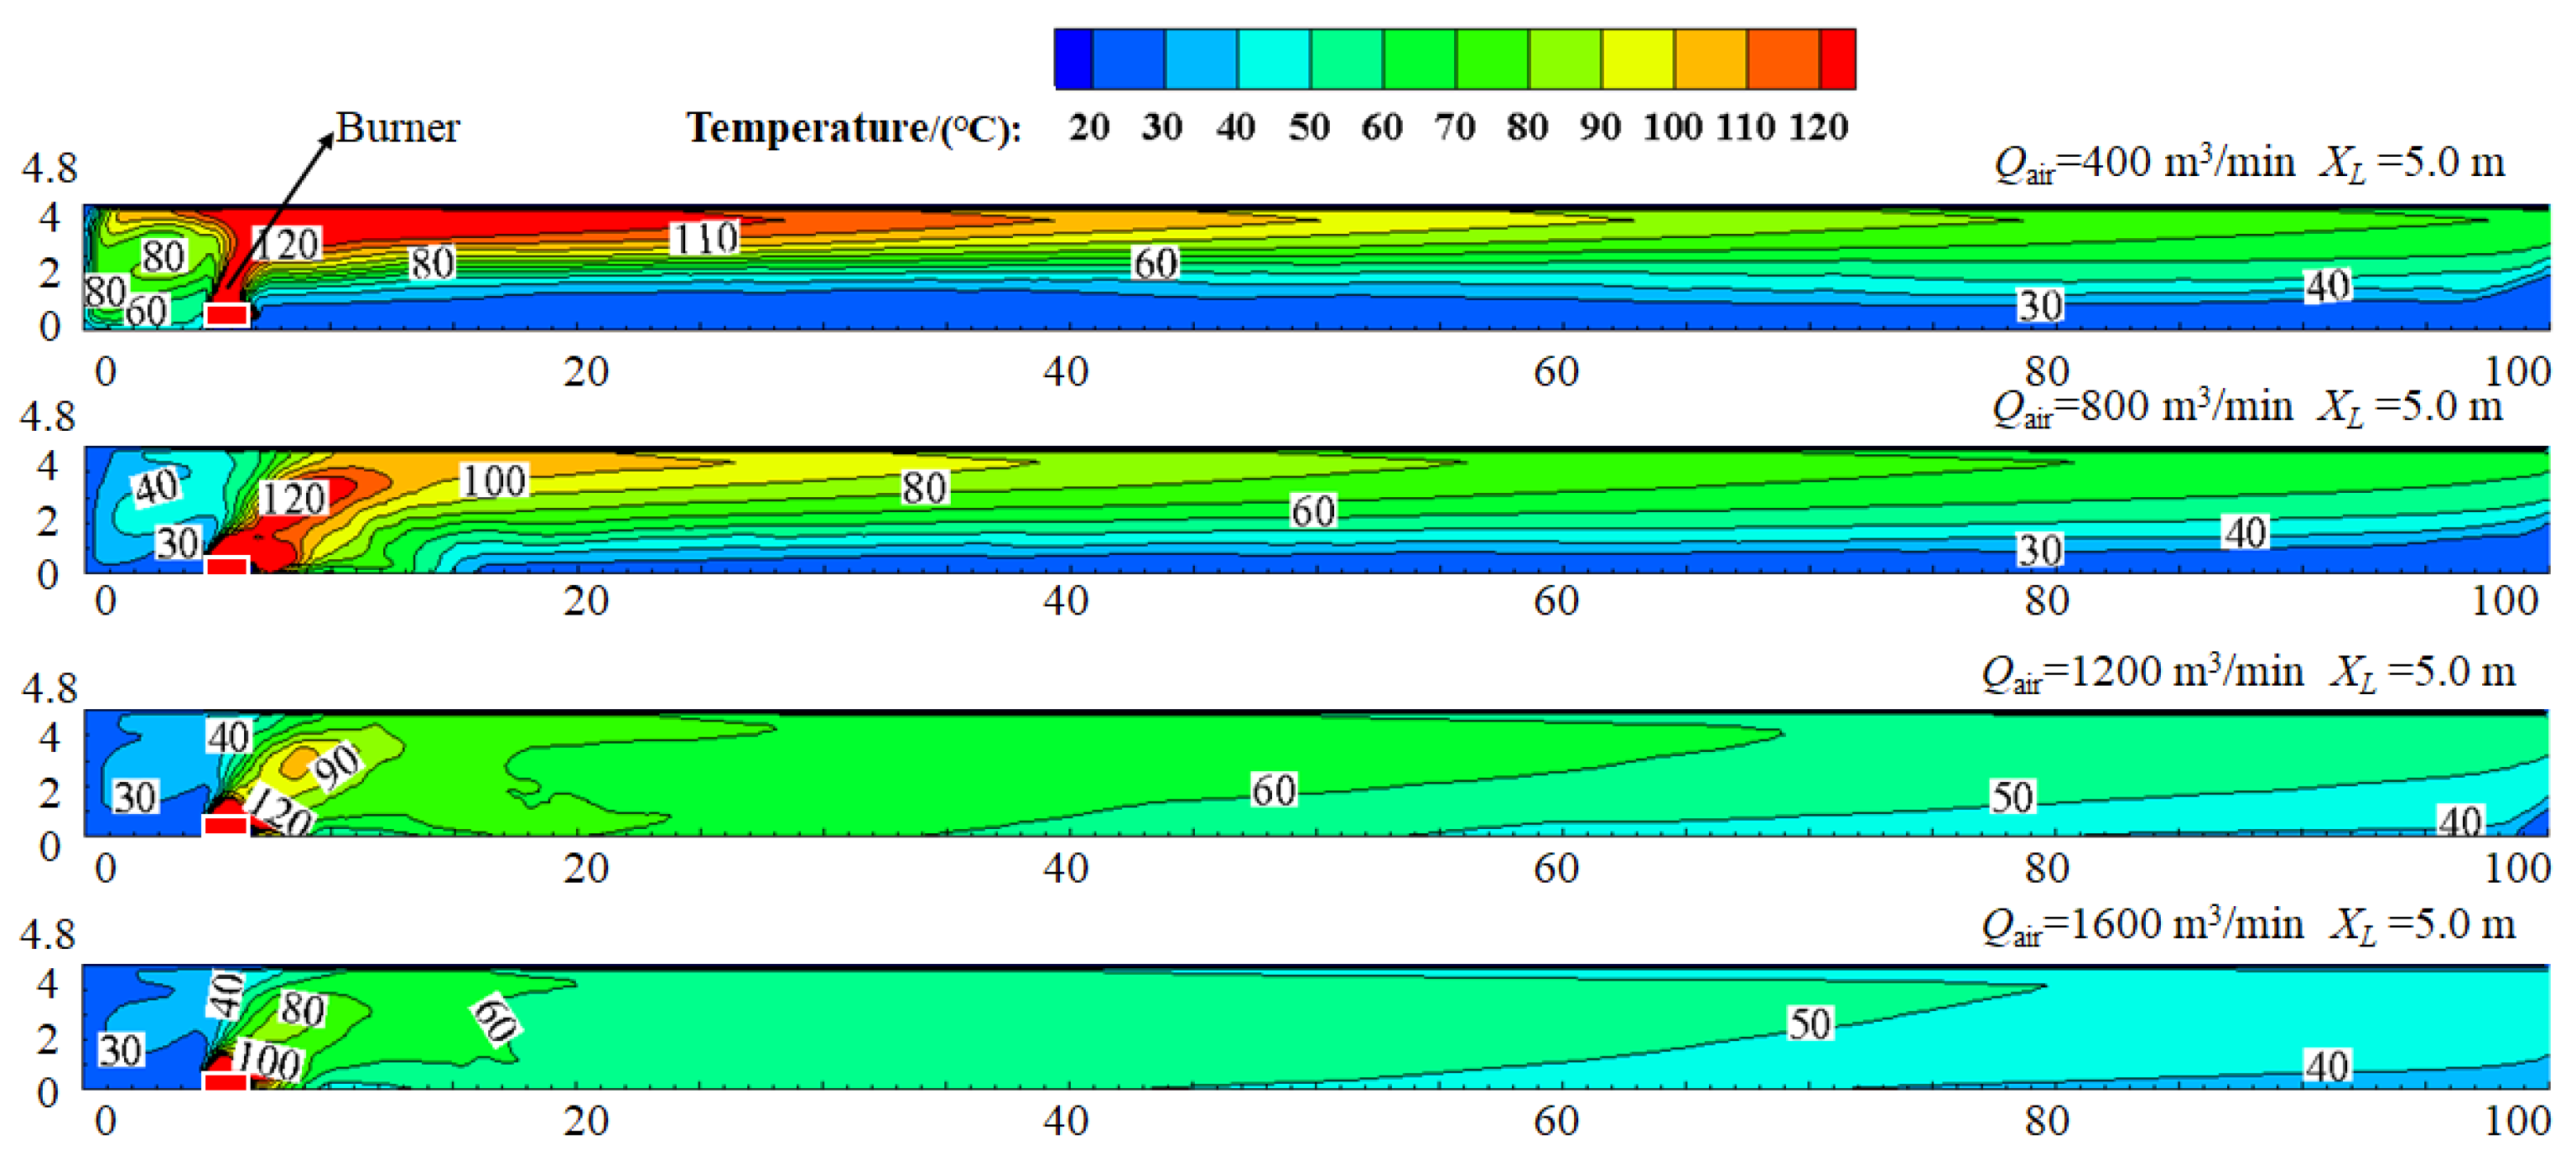
3.3.2. Forced Air Volume Effect on the Temperature Distribution
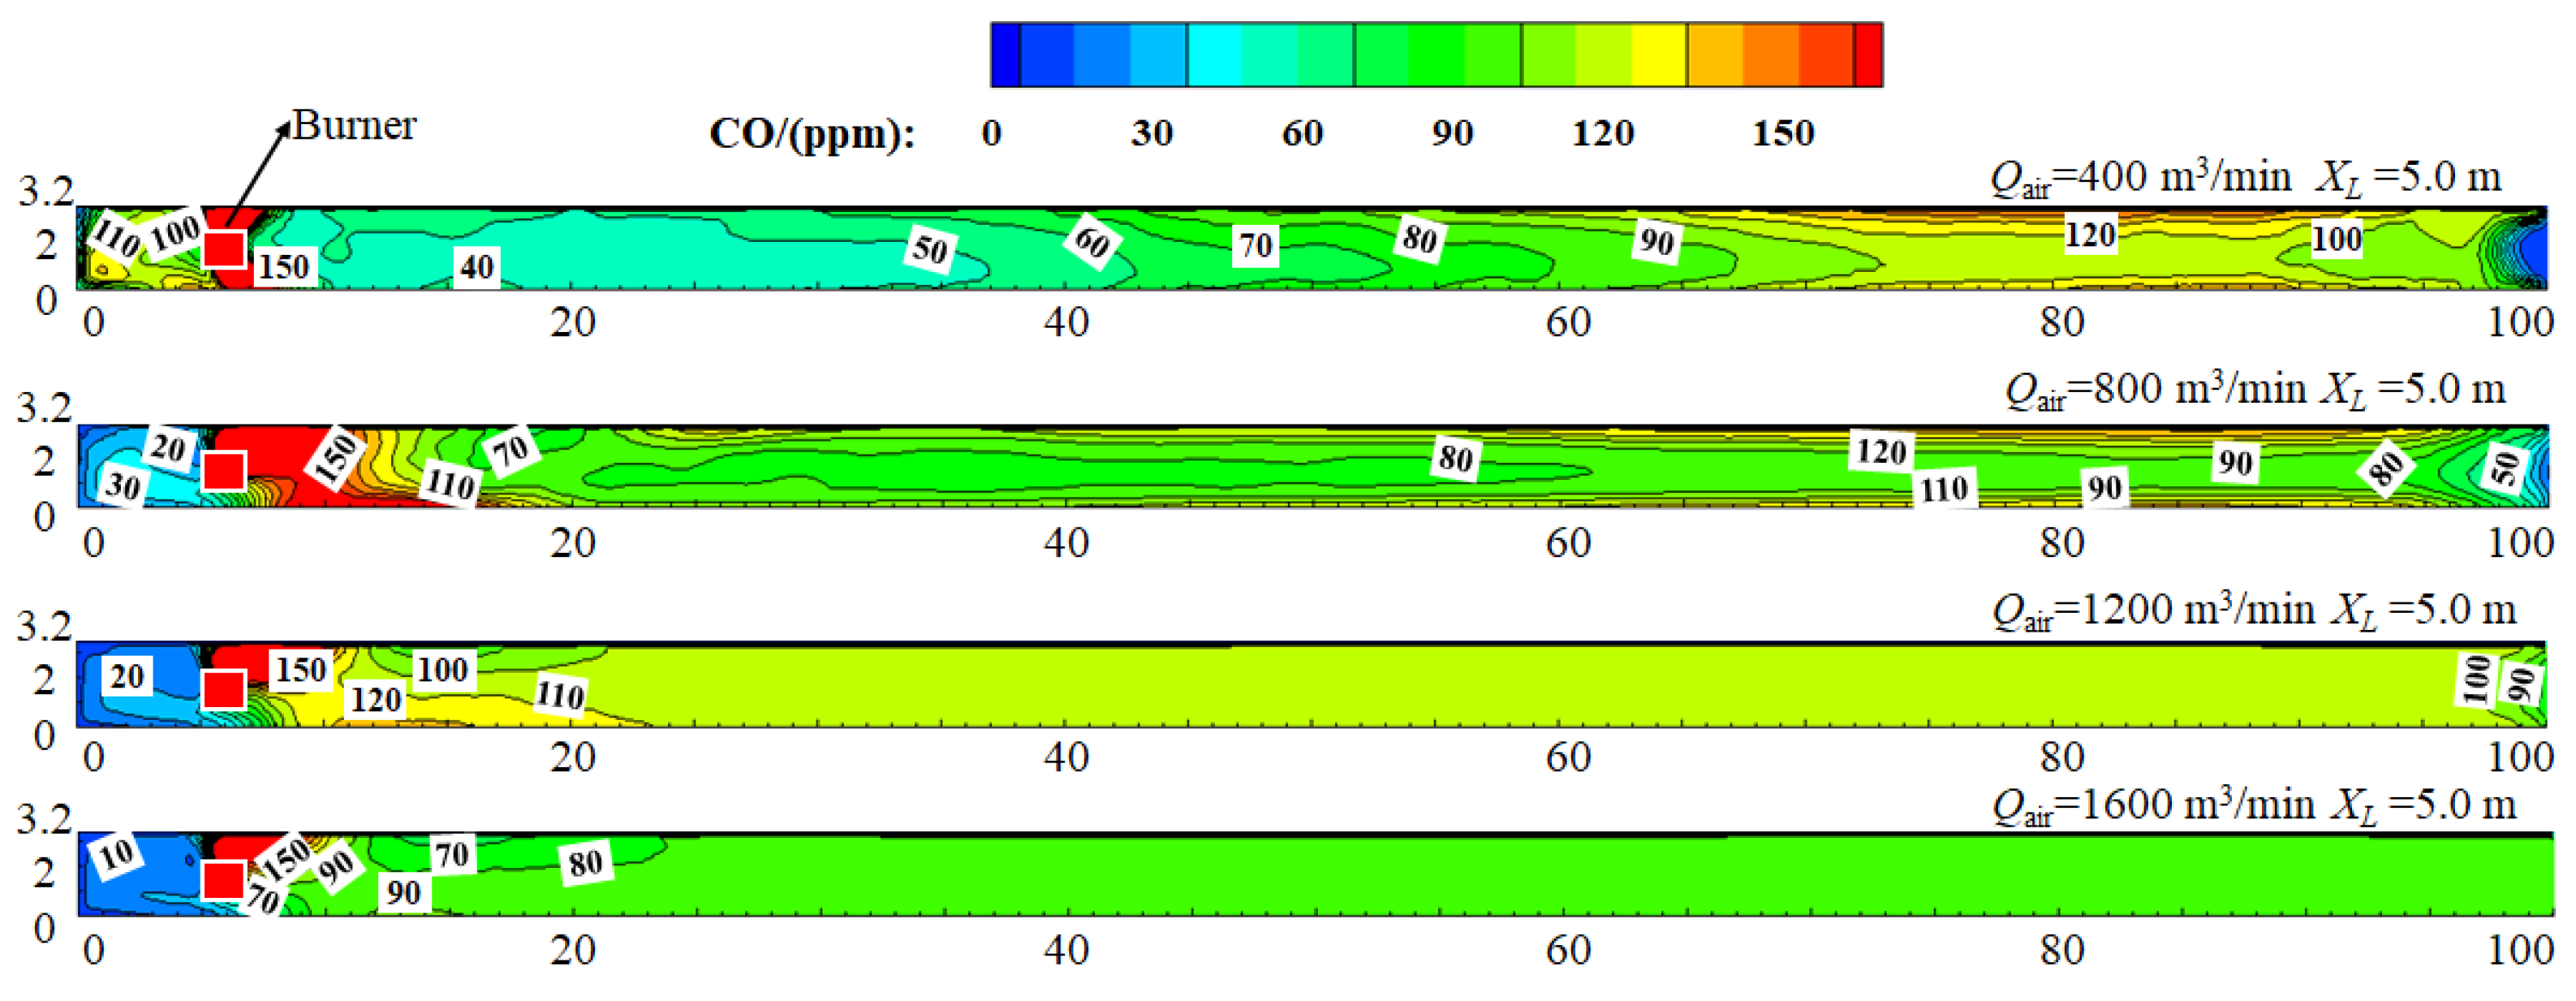
3.3.3. Forced Air Volume Effect on the CO Concentration Distribution
4. Conclusions
Author Contributions
Funding
Institutional Review Board Statement
Informed Consent Statement
Data Availability Statement
Conflicts of Interest
References
- Yang, J. Research and Application of the Technology of Forced Ventilation Diversion to Control and Reduce Dust in Comprehensive Excavation Face. IOP Conf. Ser. Earth Environ. Sci. 2021, 631, 012062. [Google Scholar] [CrossRef]
- Cui, X.Y.; Wu, B.; Jin, S. Numerical simulation of fire in pressed ventilation tunnel based on Pyrosim. Fire Sci. Technol. 2020, 39, 923–926. [Google Scholar]
- Wang, Z.; Han, J.; Wang, J.; Geng, P.; Weng, M.; Liu, F. Temperature Distribution in a Blocked Tunnel with One Closed Portal under Natural Ventilation. Tunn. Undergr. Space Technol. 2021, 109, 103752. [Google Scholar] [CrossRef]
- Chen, C.; Zhang, Y.; Lei, P.; Jiao, W. A Study for Predicting the Maximum Gas Temperature beneath Ceiling in Sealing Tactics against Tunnel Fire. Tunn. Undergr. Space Technol. 2020, 98, 103275. [Google Scholar] [CrossRef]
- Chen, C.-K.; Xiao, H.; Wang, N.-N.; Shi, C.-L.; Zhu, C.-X.; Liu, X.-Y. Experimental Investigation of Pool Fire Behavior to Different Tunnel-End Ventilation Opening Areas by Sealing. Tunn. Undergr. Space Technol. 2017, 63, 106–117. [Google Scholar] [CrossRef]
- Shi, J.-K.; Zuo, C.; Xiong, Y.-Y.; Zhou, M.; Lin, P. Experimental Study of Different Sealing Ratios on the Self-Extinction of Tunnel Fires. Tunn. Undergr. Space Technol. 2021, 112, 103894. [Google Scholar] [CrossRef]
- Han, J.; Geng, P.; Wang, Z.; Wang, F.; Weng, M.; Liu, F. Effects of Fire-Blockage Distance on Pool Fire Burning Behavior and Thermal Temperature Profiles in a Naturally Ventilated Tunnel. Tunn. Undergr. Space Technol. 2021, 117, 104131. [Google Scholar] [CrossRef]
- Han, J.; Liu, F.; Wang, F.; Weng, M.; Wang, J. Study on the Smoke Movement and Downstream Temperature Distribution in a Sloping Tunnel with One Closed Portal. Int. J. Therm. Sci. 2020, 149, 106165. [Google Scholar] [CrossRef]
- Li, L.; Zhu, D.; Gao, Z.; Xu, P.; Zhang, W. A Study on Longitudinal Distribution of Temperature Rise and Carbon Monoxide Concentration in Tunnel Fires with One Opening Portal. Case Stud. Therm. Eng. 2021, 28, 101535. [Google Scholar] [CrossRef]
- Yao, Y.; Cheng, X.; Zhang, S.; Zhu, K.; Zhang, H.; Shi, L. Maximum Smoke Temperature beneath the Ceiling in an Enclosed Channel with Different Fire Locations. Appl. Therm. Eng. 2017, 111, 30–38. [Google Scholar] [CrossRef]
- Xiao, K.; Ji, Y. The Effect of Longitudinal Ventilation System on Smoke Movement and People’s Evacuation in Tunnel Fire. IOP Conf. Ser. Earth Environ. Sci. 2021, 687, 012142. [Google Scholar] [CrossRef]
- Tao, L.; Zeng, Y.; Yang, G.; Zhao, D.; Li, J.; Fu, X. Ceiling Temperature Distribution and Decay in Tunnel Fires: Effect of Longitudinal Velocity, Bifurcated Shaft Exhaust and Fire Location. Case Stud. Therm. Eng. 2023, 41, 102651. [Google Scholar] [CrossRef]
- Kong, J.; Xu, Z.; You, W.; Wang, B.; Liang, Y.; Chen, T. Study of Smoke Back-Layering Length with Different Longitudinal Fire Locations in Inclined Tunnels under Natural Ventilation. Tunn. Undergr. Space Technol. 2021, 107, 103663. [Google Scholar] [CrossRef]
- Babrauskas, V. Book Review: Beard A and Carvel R (Eds). Handbook of Tunnel Fire Safety. J. Fire Sci. 2012, 30, 273–274. [Google Scholar] [CrossRef]
- Yao, Y.; Li, Y.Z.; Ingason, H.; Cheng, X. The Characteristics of Under-Ventilated Pool Fires in Both Model and Medium-Scale Tunnels. Tunn. Undergr. Space Technol. 2019, 87, 27–40. [Google Scholar] [CrossRef]
- Yao, Y.; Cheng, X.; Shi, L.; Zhang, S.; He, K.; Peng, M.; Zhang, H. Experimental Study on the Effects of Initial Sealing Time on Fire Behaviors in Channel Fires. Int. J. Therm. Sci. 2018, 125, 273–282. [Google Scholar] [CrossRef]
- Han, J.; Geng, P.; Wang, Z.; Lu, Y.; Wang, F.; Wen, J.; Liu, F. Effect of Ceiling Extraction on the Smoke Spreading Characteristics and Temperature Profiles in a Tunnel with One Closed End. Tunn. Undergr. Space Technol. 2022, 119, 104236. [Google Scholar] [CrossRef]
- State Administration of Work Safety. Coal Mine Safety Regulation; China Coal Industry Publishing House: Beijing, China, 2022.
- Ingason, H.; Li, Y.Z.; Lonnermark, A. Tunnel Fire Dynamics; Springer: New York, NY, USA, 2016. [Google Scholar]
- Yao, Y.; Wang, R.; Xia, Z.; Ren, F.; Zhao, J.; Zhu, H.; Cheng, X. Numerical Study of the Characteristics of Smoke Spread in Tunnel Fires during Construction and Method for Improvement of Smoke Control. Case Stud. Therm. Eng. 2022, 34, 102043. [Google Scholar] [CrossRef]
- Zhong, W.; Lv, J.; Li, Z.; Liang, T. A Study of Bifurcation Flow of Fire Smoke in Tunnel with Longitudinal Ventilation. Int. J. Heat Mass Transf. 2013, 67, 829–835. [Google Scholar] [CrossRef]
- Zhao, W.H. Numerical analysis of ventilation flow field in driving process of coal mine. Mech. Manag. Dev. 2017, 32, 4–5. [Google Scholar]
- Tang, M.B. Numerical Simulation Study on Airflow Field of Pressed Ventilation in Tunneling Face; JiangXi University of Science and Technology: JiangXi, China, 2013. [Google Scholar]
- Chen, H.H. Study on Ventilation Field Characteristics Analysis and Parameter Optimization in Gas Tunnel Construction; Guangxi Universiy: Guangxi, China, 2022. [Google Scholar]
- Nie, Q.M. Study on Control of Fire Smoke Movement in Tunnels by Water Mist Segment; Wuhan University: Wuhan, China, 2017. [Google Scholar]
- Chen, L.; Wu, C.F.; Chen, Z.Y.; Zhou, L.J.; Deng, Q.L. Numerical simulation study on the regional division of mine roadways fire safety. Fire Sci. Technol. 2016, 35, 633–636. [Google Scholar]
- Torvi, D.A.; Dale, J.D. A Finite Element Model of Skin Subjected to a Flash Fire. J. Biomech. Eng. 1994, 116, 250–255. [Google Scholar] [CrossRef]
- Wang, J.; Pan, Y.; Lu, K.; Chen, W.; Zhang, H. Investigation on the CO Concentration Decay Profile and Spread Velocity of a Ceiling Jet at Reduced Pressure in Aircraft Cargo Compartment Fires. Appl. Therm. Eng. 2017, 127, 1246–1251. [Google Scholar] [CrossRef]
- Li, J.; Zeng, Y.; Tao, L.; Liu, Z.; Li, B. Experimental Study on Temperature Decay and Smoke Control in Tunnel Fires with Combination of Multi-Point Smoke Exhaust and Longitudinal Ventilation. Int. J. Therm. Sci. 2023, 183, 107847. [Google Scholar] [CrossRef]
- Ishikawa, T.; Kasumi, K.; Tanaka, F.; Moinuddin, K.A.M. Combustion Efficiency during Fires in Tunnels with Natural Ventilation by Vitiated Air Including Descending Smoke. Fire Saf. J. 2021, 120, 103093. [Google Scholar] [CrossRef]


| Type of Unit | Scaling |
|---|---|
| Heat release rate (HRR)/(kW) | |
| Time/(s) | |
| Temperature/(K) |
| HRR/(kW) | D*/(m) | Grid Size Range/(m) |
|---|---|---|
| 2000 | 1.269 | 0.079–0.317 |
| Test No. | HRR/(kW) | XL/(m) | Qair/(m3/min) | |
|---|---|---|---|---|
| Model Validation Group | 4948.97 | 5.0 | 0 | |
| 1 | No fire control group | 400 | ||
| 2 | 800 | |||
| 3 | 1200 | |||
| 4 | 1600 | |||
| 5 | 2000 | 2.0 | 400 | |
| 6 | 800 | |||
| 7 | 1200 | |||
| 8 | 1600 | |||
| 9 | 5.0 | 400 | ||
| 10 | 800 | |||
| 11 | 1200 | |||
| 12 | 1600 | |||
| 13 | 20.0 | 400 | ||
| 14 | 800 | |||
| 15 | 1200 | |||
| 16 | 1600 | |||
| 17 | 50.0 | 400 | ||
| 18 | 800 | |||
| 19 | 1200 | |||
| 20 | 1600 | |||
Disclaimer/Publisher’s Note: The statements, opinions and data contained in all publications are solely those of the individual author(s) and contributor(s) and not of MDPI and/or the editor(s). MDPI and/or the editor(s) disclaim responsibility for any injury to people or property resulting from any ideas, methods, instructions or products referred to in the content. |
© 2023 by the authors. Licensee MDPI, Basel, Switzerland. This article is an open access article distributed under the terms and conditions of the Creative Commons Attribution (CC BY) license (https://creativecommons.org/licenses/by/4.0/).
Share and Cite
Zhao, J.; Wang, Z.; Hu, Z.; Cui, X.; Peng, X.; Zhang, J. Effects of Fire Location and Forced Air Volume on Fire Development for Single-Ended Tunnel Fire with Forced Ventilation. Fire 2023, 6, 111. https://doi.org/10.3390/fire6030111
Zhao J, Wang Z, Hu Z, Cui X, Peng X, Zhang J. Effects of Fire Location and Forced Air Volume on Fire Development for Single-Ended Tunnel Fire with Forced Ventilation. Fire. 2023; 6(3):111. https://doi.org/10.3390/fire6030111
Chicago/Turabian StyleZhao, Jinlong, Zhenhua Wang, Zhenqi Hu, Xinyuan Cui, Xiandu Peng, and Jianping Zhang. 2023. "Effects of Fire Location and Forced Air Volume on Fire Development for Single-Ended Tunnel Fire with Forced Ventilation" Fire 6, no. 3: 111. https://doi.org/10.3390/fire6030111