Article

Promoting Low-Risk Fire Regimes: An Agent-Based Model to Explore Wildfire Mitigation Policy Options

1
Forest Research Centre and Associated Laboratory TERRA, School of Agriculture, Universidade de Lisboa, Tapada da Ajuda, 1349-017 Lisbon, Portugal
2
CIBIO, Centro de Investigação em Biodiversidade e Recursos Genéticos, InBIO Laboratório Associado, Instituto Superior de Agronomia, Universidade de Lisboa, Tapada da Ajuda, 1349-017 Lisbon, Portugal
3
CIBIO, Centro de Investigação em Biodiversidade e Recursos Genéticos, InBIO Laboratório Associado, Campus de Vairão, Universidade do Porto, 4485-661 Vairão, Portugal
4
BIOPOLIS Program in Genomics, Biodiversity and Land Planning, CIBIO, Campus de Vairão, 4485-661 Vairão, Portugal
5
Centre of Geographical Studies and Associated Laboratory TERRA, Institute of Geography and Spatial Planning, Universidade de Lisboa, Edifício IGOT, Rua Branca Edmée Marques, 1600-276 Lisbon, Portugal
*
Author to whom correspondence should be addressed.
Fire 2023, 6(3), 102; https://doi.org/10.3390/fire6030102
Submission received: 29 January 2023 / Revised: 25 February 2023 / Accepted: 28 February 2023 / Published: 6 March 2023

Abstract

:
Landscape patterns and composition were identified as key drivers of fire risk and fire regimes. However, few studies have focused on effective policymaking aimed at encouraging landowners to diversify the landscape and make it more fire-resilient. We propose a new framework to support the design of wildfire mitigation policies aimed at promoting low-risk fire regimes based on land use/land cover choices by landowners. Using the parishes of a fire-prone region in central Portugal as analysis units, a two-step modelling approach is proposed, coupling an agent-based model that simulates land use/land cover choice and a logistic model that predicts fire regimes from a set of biophysical variables reported as important fire regime drivers in the literature. The cost-effectiveness of different policy options aimed at promoting low-risk fire regimes at the parish level is assessed. Our results are in line with those of previous studies defending the importance of promoting landscape heterogeneity by reducing forest concentration and increasing agricultural or shrubland areas as a measure to reduce the risk of wildfire. Results also suggest the usefulness of the framework as a policy simulation tool, allowing policymakers to investigate how annual payments supporting agricultural or shrubland areas, depending on the policy mix, can be very cost-effective in removing a substantial number of parishes from high-risk fire regimes.

1. Introduction

Wildfires are a major concern in different parts of the world, causing serious harm to both public and private interests. In Mediterranean climate regions, although fire is a natural element of the ecosystem [1,2], wildfire hazard levels have been aggravated by demographic and land use/land cover (LUC) changes in recent decades, reaching critical proportions that demand urgent action [3]. The northern and central interior of mainland Portugal are paradigmatic cases, as they are where severe fires became more frequent in recent decades [4]. The depopulation and rural abandonment observed in these regions since the mid-20th century led to a decline in agricultural activities and to an increase in forest plantations of maritime pine (Pinus pinaster) and eucalypt (Eucalyptus globulus), an exotic species in Portugal that altered the natural fire resilience of native species’ forests [5,6,7]. Additionally, fire mitigation policies in Portugal in recent years invested much more into suppression and firefighting equipment, whereas prevention actions were mostly restricted to reducing ignitions by improving surveillance and information campaigns, namely those aimed at farmers burning agricultural residues. Paradoxically, these efforts seem to have led to an accumulation of vegetable fuel loads, which increases the risk that fires not controlled in the early stages may more easily evolve into mega-fires [3,4,8]. Moreover, although wildfires are mostly of human origin in Portugal, either by negligence or intention [9], they are also expected to become more frequent in southern Europe due to climate change [10,11].
Wildfire research has gained increasing attention in recent years, and there is now abundant evidence on the crucial role of land cover in wildfire proneness and its effects on fire regimes [4,6,12,13,14,15,16]. Fire regimes are used to depict combinations of fire frequency and severity [15,17,18]. Fire regimes are often characterized based on metrics such as total burn area, number of fire events, or spatiotemporal concentration indexes (e.g., Gini index), computed over a representative period of time [15,17,19]. Climate, topography, and LUC are acknowledged drivers of fire regimes [18,20]. Among these, LUC stands out as the most relevant for public policies, as climate and topography are naturally less subject to modification by humans on a regional scale [21,22,23,24,25].
The need to intervene in the LUC to reduce wildfire risk by changing the composition and configuration of the landscape encouraged public initiatives to modernize and revise legal frameworks. In Portugal, this led to the publication of the “Integrated Management System for Rural Fires” (Decree-Law 82/2021, 13 October) and, more recently, to the creation of the “Landscape Transformation Program” (Resolution of the Council of Ministers 49/2020, 24 June), establishing a land planning strategy for forest territories vulnerable to wildfire.
Most studies on the LUC drivers of fire regimes typically consider at least three major classes: forest, farmland, and shrubland [7,12,13,14,26]. According to such studies, shrublands are often identified as the most fire-prone land cover class, as shrubland often encompasses fast-growing natural vegetation, which is commonly associated with steeper slopes where fire can easily spread. Forests are also found to be a major fire-prone class given their ability to accumulate large loads of fuel and their propensity to occur in extensive stands, often also occurring in mountain areas; farmland, in contrast, is typically stated as being less fire-prone due to the typical vegetation structure of agricultural and pastoral land uses and to a closer human presence.
The way different LUC classes affect fire regime is not the same. In a recent study focused on central Portugal [13], it was suggested that the proportion of shrubland in the landscape has the highest effect on determining the fire regime, significantly contributing to increases in the total burned area but, at the same time, promoting the temporal dispersion of fires (a fire regime of frequent but small-to-medium-size fires). The same authors observed that forests also contribute to total burned area but with a much smaller contribution to the temporal dispersion of fires (a fire regime of less frequent but larger fires), and they also observed that agriculture has the highest impact on decreasing the total burned area (a low burnt area fire regime). Similar findings were also obtained in previous studies [20,26,27,28].
In addition to the fire propensity of each LUC class, there is also abundant evidence of the importance of maintaining a diverse and heterogeneous landscape mosaic in reducing wildfire risk. Several studies emphasize that a diverse and more heterogeneous landscape mosaic promotes fuel load distribution, hindering the spread of fires and their ability to cause damage [29,30,31]. Conversely, more homogeneous landscapes tend to be associated with higher fire risk and less fire resilience [7]. Some authors even consider that the increased risk of fire in southern Europe is due more to the loss of diverse landscape mosaics than to climate change or negligent behaviour [32]. Other authors have suggested that if fire occurrence is likely to increase landscape heterogeneity, e.g., by creating open areas for natural vegetation, then this has not been enough to offset the trend of mosaic loss due to agricultural abandonment and afforestation in southwestern Europe [33].
As the countryside of southern Europe keeps following a long-term trend of agricultural decline, with farmland being replaced by policy-incentivized forest plantations or abandoned to shrubland, the landscape becomes more homogeneous, more fire-prone, and the fire regimes change to higher risk levels [3,34]. Such evidence supports the calls for public policies better suited to reducing wildfire hazard levels and improving the resilience and sustainability of landscapes, which may include increasing landscape mosaic diversity and promoting LUCs associated with less hazardous fire regimes [5,22,35,36]. This paper addresses these calls by proposing a new framework to assess the cost-effectiveness of public policies aimed at promoting low-risk fire regime landscapes by encouraging landowners to diversify land cover, diverging from the forest stands monoculture. Therefore, the focus of the paper is not to explore the effects of LUC on fire, but rather to use the available knowledge in the field to apply LUC as modelling variables to support wildfire mitigation policymaking.
The framework involves a two-step approach, with an LUC choice model coupled to a fire regime prediction model, which was used to simulate the effect of land planning policies aimed at achieving low-risk fire regimes, bearing in mind that fire cannot be completely eradicated from Mediterranean ecosystems [7,37]. In this modelling setup, fire regime characterization variables (e.g., fire frequency and total area burned) are used to establish a classification scheme of fire regime categories that depict different levels of fire risk, which are assigned to units of territorial analysis in the area of interest (administrative parishes, in the present study) so policies can be planned to ensure a socially desirable minimum of territorial units classified into categories of low-risk fire regimes. To our knowledge, using a fire regime category approach to guide policy design is innovative to wildfire research. In this study, the proposed framework was applied to a fire-prone area in central Portugal to assess its effectiveness as a simulation tool for public policies aimed at promoting low-risk fire regimes.
Our results allow us to discuss the usefulness of using fire regime categories as a reference for designing wildfire mitigation policies while contributing to the pursuit of fire-resilient landscapes and to the “living with fire” objective [37,38].

2. Materials and Methods
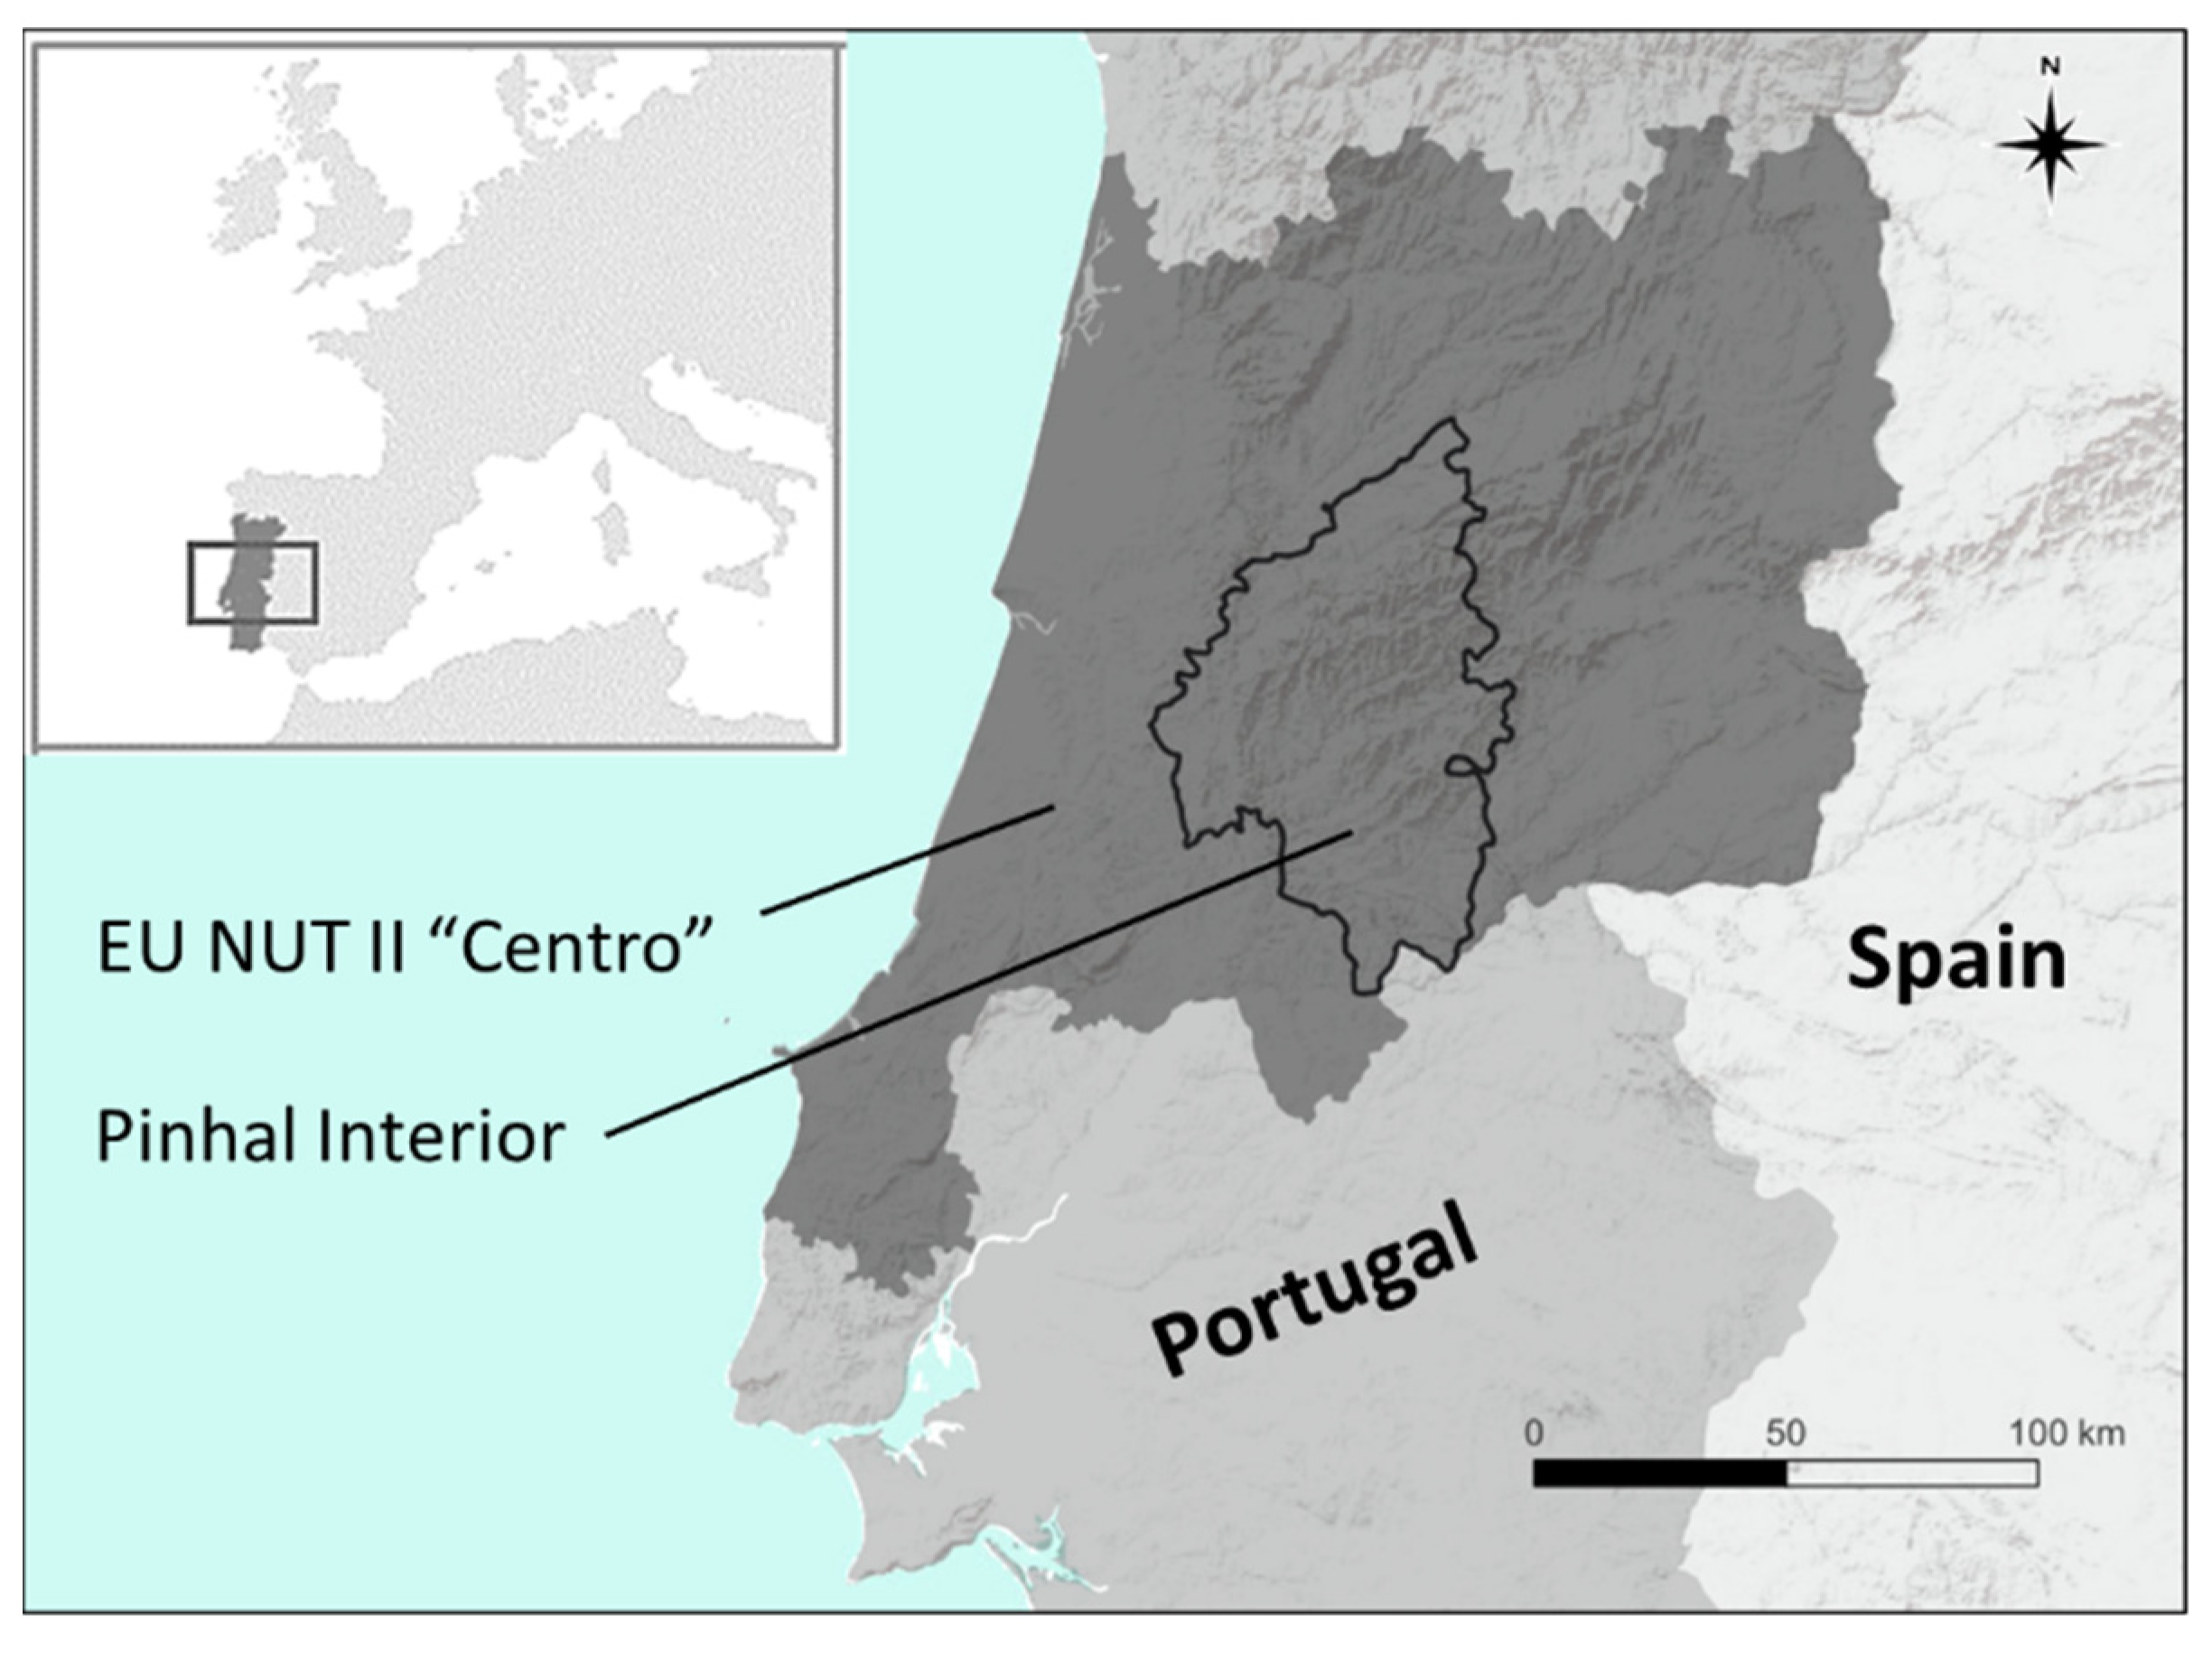
2.1. Study Area

This study is focused on an area known as the Pinhal Interior, a sub-region of the EU-NUT II Centro in mainland Portugal known for being highly prone to wildfires (Figure 1).
Given the relatively low heterogeneity of the Pinhal Interior region in relation to some variables likely to be relevant for the modelling tasks pursued in this study, as described later, the entire Centro region was used to develop the models. In a following step, these models were used in predictions made for the Pinhal Interior study area.
The Centro region extends for 28,199 km2 (about 30% of the territory of mainland Portugal), comprising 100 municipalities and 972 administrative parishes. The topography is relatively smooth next to the coast and becomes more mountainous while progressing eastwards. Altitudes vary from 0 to 1993 m (a.m.s.l.), the highest point in mainland Portugal. The climate is Mediterranean, with warm and dry summers and rainy and moderately cool winters. From southwest to northeast, total rainfall increases from ca. 600 mm up to 1834 mm, and the mean monthly temperature decreases from ca. 16.8 °C to 6.6 °C. The LUC of the Centro region is relatively heterogeneous. Pine and eucalypt forests dominate the central area where the Pinhal Interior is located. Pine is also abundant in the west along a coastal strip that extends for about 100 km. To the northeast, where altitudes are higher, areas of shrubland and sparse vegetation dominate. Agricultural areas appear mostly in the west and in the interior southeast.
The Pinhal Interior extends for 4518 km2 (about 16% of the Centro region), encompassing 19 municipalities and 122 parishes. The landscape is mostly mountainous with elevations ranging ca. 25–1350 m (a.m.s.l.). The average rainfall is about 1130 mm, mostly concentrated from October to March, and the mean temperature is ca. 14.0 °C. This area is dominated by extensive plantations of maritime pine and eucalypt, covering ca. 70% of the territory, followed by shrubland or seminatural areas (14%) and agricultural areas (12%). Artificial areas cover about 3% of the territory, and water bodies cover 1%.
The population density in the Pinhal Interior is low (average 198 inhabitants per km2 in 2021) and has been declining since at least the 1960s due to strong emigration and rural exodus movements, which are still ongoing (resident population dropped 9.1% between 2011 and 2021). Consequently, agriculture is currently almost residual in the territory, largely restricted to village surroundings and small valleys with better suitability. At the same time, the area has been increasingly devastated by wildfires, being one of the most fire-prone regions in the country.

2.2. Baseline Data

The choice of the baseline data to characterise fire regimes and their potential drivers followed the approach developed in a recent work targeting the same study area [13], and it primarily included a digital terrain model and data on LUC, fire occurrence, and climate. All variables were computed for each of the 972 parishes of the Centro region, which were the analytical territorial units used in the estimation of the fire regime models (Table 1).
Fire occurrence data was derived from annual burned area vector maps available for 44 years (1975 to 2018), which were supplied by the Portuguese Nature Conservation Agency (Instituto da Conservação da Natureza e das Florestas). Two fire regime characterization variables were constructed from these maps and computed for each parish: total burned area (TBA), representing the cumulative percentage of parish area burned over the 44-year period, and a Gini concentration index (GCI) revealing the temporal distribution of the total burned area in each parish, ranging from 0 (minimum concentration) to 100 (maximum concentration).
The LUC data was provided for 2018 by the Portuguese General-Directorate of the Territory (Direção-Geral do Território) as a vector map with a minimum patch size of 1 ha. According to the objectives of the study, we considered 3 main rural land cover classes discriminating agriculture, forest, and shrubland in addition to artificial areas and water bodies.
Agriculture (AGRI) consisted of all farmland areas, including temporary and permanent crops and pastures, rainfed or irrigated, and agroforestry areas. Forest (FOREST) encompassed mostly plantations of pines, eucalypt, and other broadleaf (e.g., Quercus spp.) and invasive species (e.g., Acacia spp.). Shrubland (SHRUB) included all shrublands, riparian areas, and sparsely vegetated areas. It should be noted that recently burned areas were not discriminated in the LUC data, which were classified according to their previous use. Thus, shrubland areas are not to be taken as recently burned areas. Artificial areas (ARTIF) comprised all built-up areas and infrastructures. Water bodies (WATER) included all inner surface waters, such as rivers, lakes, reservoirs, and ponds. The proportion of each of these LUC classes was computed for each parish.
The following landscape configuration metrics were extracted at the parish level from the LUC map to be tested within the fire regime models: mean patch size (MPS), Shannon’s diversity index (SHDI), patch density (PD), edge density (ED), and an interspersion index (INTI) describing the intermixing of LUC classes. The boundaries of the parishes were not included in the computation of metrics using patch edges.
The digital terrain model was also provided by the Portuguese General-Directorate of the Territory as a 25 × 25 m raster grid. A slope map was derived from this digital terrain model, and the 80th percentile of the slope was calculated for each parish (SLOP80) to act as an indicator of the degree of roughness of the parish’s terrain.
Raster maps of climate data were extracted from the WorldClim database (https://www.worldclim.org (accessed on 20 July 2022)) and included mean cumulative rainfall between April and June (RAJ) and average monthly temperatures between July and September (TJS).
Finally, a variable expressing the biomass production capacity (in kgC/m2) was computed from raster maps of net primary productivity (NPP) obtained from NASA’s Earth Science Data Systems database (https://lpdaac.usgs.gov/products/mod17a3hgfv006/ (accessed on 24 February 2022)), which were available for the years 2000 to 2014 and were averaged for the 15-year period.
All spatial data was rasterized to a 100 m resolution grid, adjusted to the 1 ha minimum mapped area admitted in the LUC data, and assembled in a spatial database in the R environment [39]. Variable values for parish levels were extracted by intersecting each layer with a polygon vector map of administrative parishes provided by the Portuguese General-Directorate of the Territory using a zonal statistics tool.

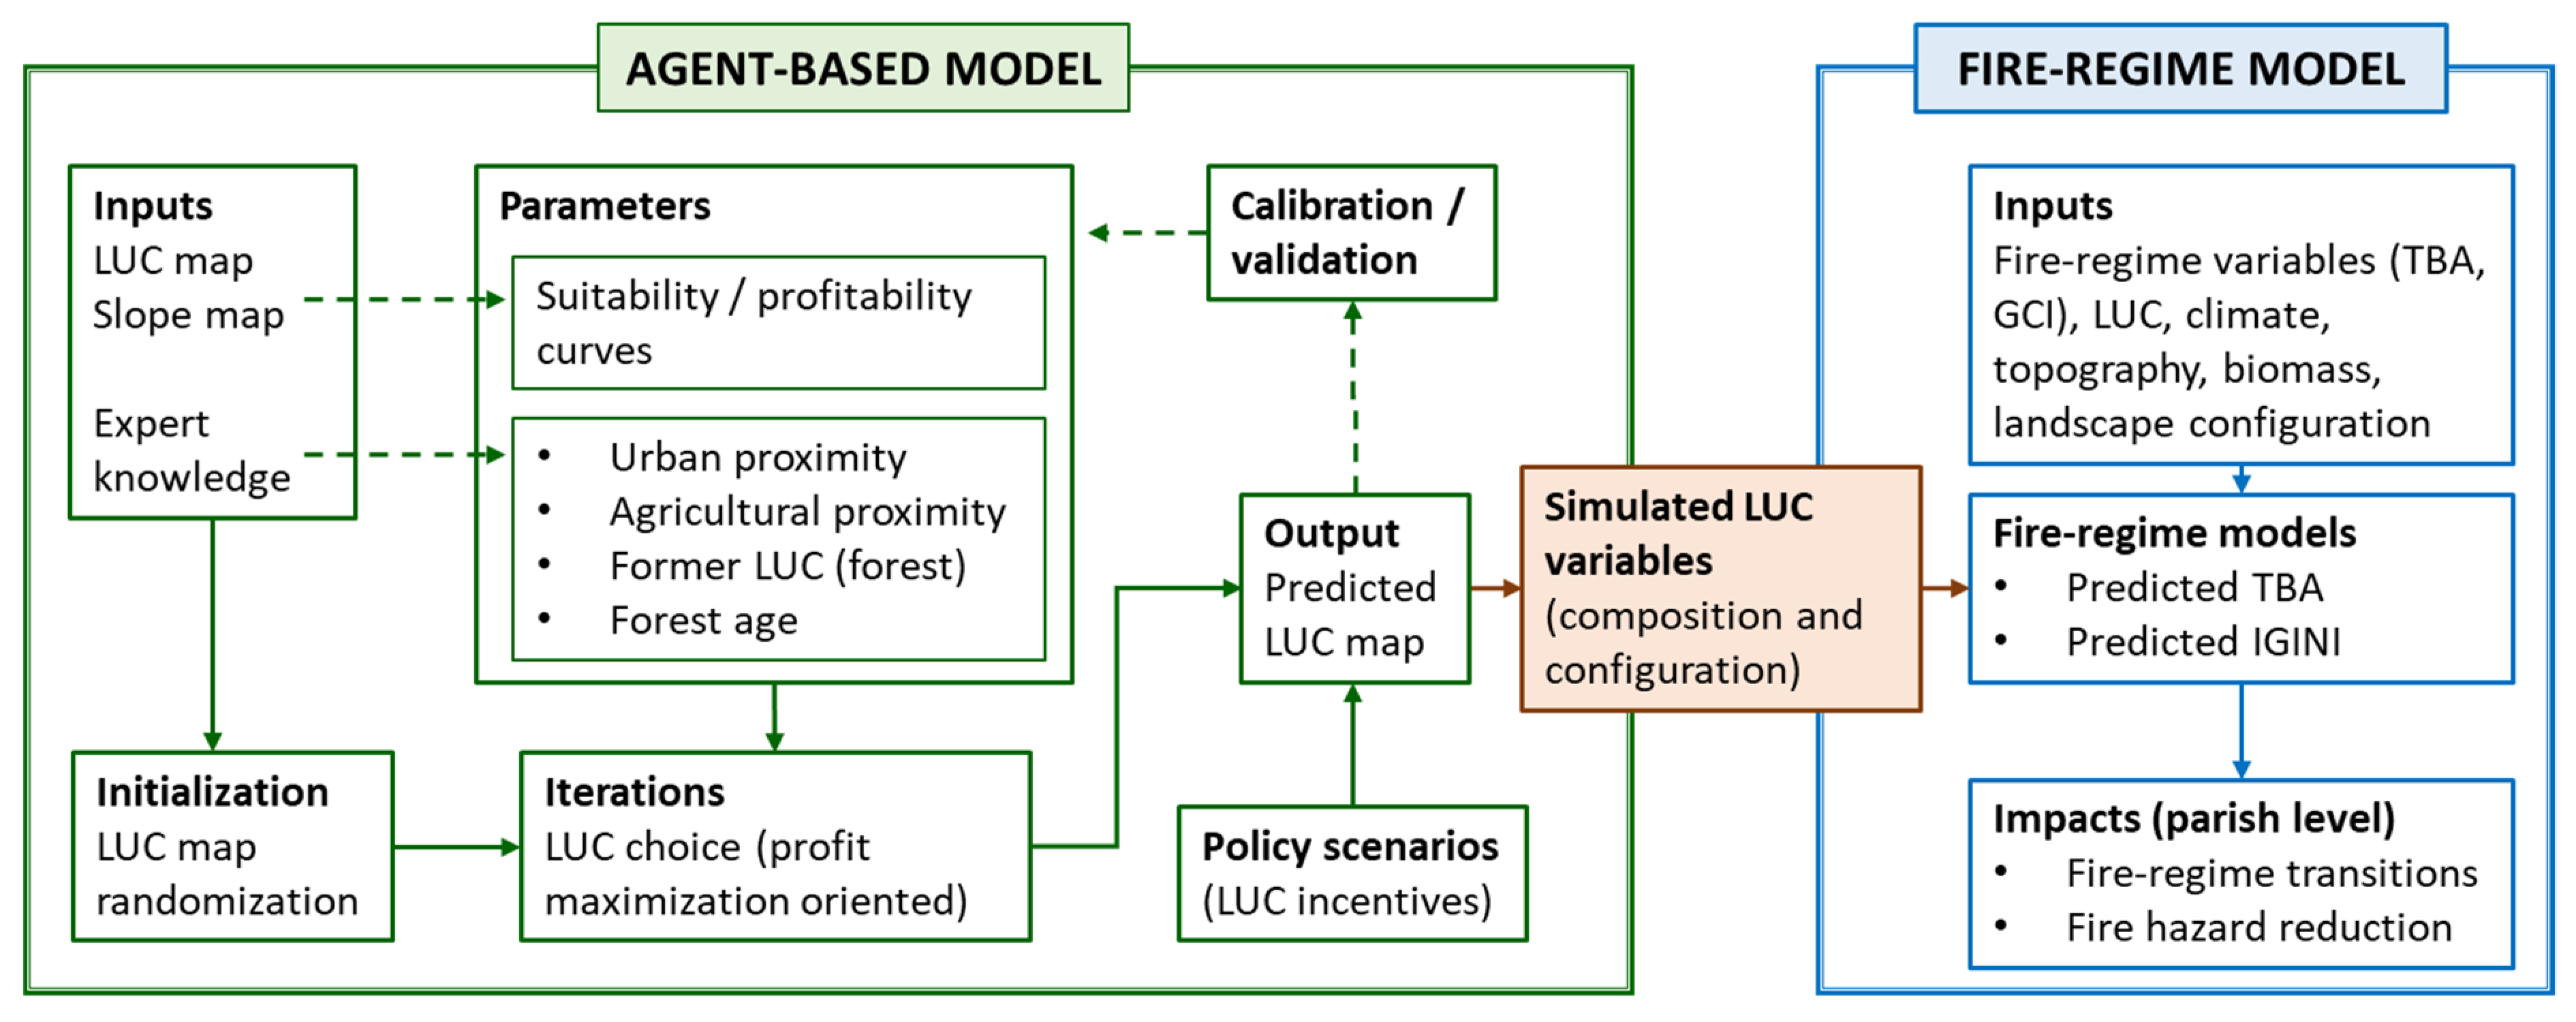
2.3. Fire Regime Modelling

The fire regime modelling approach used logistic regressions to predict two fire regime characterization variables: total burned area (TBA) and the Gini concentration index (GCI). Independent variables comprised all remaining variables in Table 1. Both the TBA and GCI variables were reclassified to 1 or 0 according to whether their values were above or below the corresponding mean for all parishes, and all independent variables were converted to z-scores to facilitate comparison of regression coefficients.
A preliminary multicollinearity analysis was performed to detect and discard variables with high correlations (an arbitrary threshold was set at 0.6). We further computed the Variance Inflation Factor (VIF) to reject all independent variables showing a value above 5 [40].
Fire regime categories were then defined from the TBA and GCI binary values, resulting in 4 fire regimes (Figure 2) that were assigned to all parishes according to their respective values in both variables. Fire regime 1 (TBA = 1 and GCI = 1) is the most hazardous fire regime, as it covers parishes with extensive burned areas over relatively concentrated periods of time where large wildfires are more prone to occur. Fire regime 2 (TBA = 1 and GCI = 0) defines a fire regime of frequent fires that are more dispersed across time, and it is therefore related to lower hazard levels. Fire regime 3 (TBA = 0 and GCI = 1) identifies parishes with low fire occurrences, which are, therefore, concentrated in time (high GCI). Fire regime 4 (TBA = 0 and GCI = 0) identifies parishes with the least hazardous fire regime, as it relates both to low burned area totals and fires more dispersed over time. In this setting, and for the purpose of developing the proposed analytical framework, it was assumed that the policy challenge at stake in this study would be to remove as many parishes as possible from fire regime 1.

2.4. Land Use/Land Cover Agent-Based Choice Model

This task was targeted to develop a LUC choice-model to simulate policy scenarios, whose outputs could be incorporated into the fire regime models previously estimated, to assess the effect of policies on fire regime transitions in the Pinhal Interior study area.
For this purpose, a conceptual agent-based modelling approach was adopted, which is grounded on a cellular automaton grid. In this approach, each cell (map-pixel) acts as an individual decision-making agent capable of assuming a finite number of states (LUC categories), which are updated in each iteration of the simulation (interpreted as a one-year time period) based on the agent’s (rational) behaviour rules in response to external drivers (e.g., policy) and information obtained from neighbouring cells [41,42].
This agent-based/cellular automaton (ABCA) approach encompasses a spatiotemporal feature that allows to exploration of the effects of time in the decision-making process (e.g., the effects of past decisions) and of outcomes at the landscape scale (e.g., the computation of landscape composition and configuration metrics). Agent-based models have been used before in wildfire research [43,44] and in forest policy and economics analysis [45,46].
The ABCA model discriminates five LUC categories from the map of the study area: agriculture, forest, shrubland, artificial areas, and water bodies. Water bodies and artificial areas are assumed to be constant over the time period of the simulations; thus, agents can only choose between three alternative LUCs: agriculture, forest, and shrubland. The assumption that artificial areas will not expand in the near future seems acceptable given that the resident population is not increasing and, rather, shows a long-term downward trend in the study area (see Section 2.1). Water bodies also tend to be a stable land cover over time, typically not part of common land management options.
In this stylized ABCA model, agents were set to select the LUC for each cell based on a profit maximization rule. For the purposes of methodological development and in the absence of empirical data on economic profitability, namely regarding the production costs necessary to calculate gross margins, we resorted to estimates of annual gross income of the most representative activities and outputs within each LUC category based on official agricultural statistics and expert advice. Therefore, the baseline reference values were initially set to 1000 €/ha for agriculture areas, 400 €/ha for forest, and 150 €/ha for shrubland (if shrublands can be grazed, for example) under optimal conditions (e.g., on flat slopes). For a given agent (pixel), the reference profitability values assigned to each LUC (hereafter represented by estimates of gross income) were made dependent on distinct factors that included: slope, previous LUC and its duration, proximity to artificial areas, and proximity to agricultural areas. In each iteration of the model, the progression of which represents the passing of one year, all of these parameters potentially modify the LUC reference profitability values, and the LUC with the resulting highest profitability is chosen by the agent based on these new values.
Given the acknowledged importance of slope in determining LUC at the local/regional scale [24], it was assumed to be the most impacting factor on LUC profitability. The effect of slope on profitability was simulated by inspecting how each LUC was spatially distributed in the study area (Pinhal Interior) according to slope, observing the deciles of the distribution of each LUC under increasing values of slope classes. We then derived suitability curves for each LUC as a function of slope, revealing, for each LUC category, the proportion of its total area found below a given slope value. This suitability was interpreted in terms of its impact on profitability as exemplified in this example: if 60% of all agricultural land was found below 10% slope, we assumed that this threshold indicated that the profitability of agriculture was reduced to 40% of its potential value, i.e., at 10% slope, the 1000 €/ha of potential agricultural annual gross income is reduced to 400 €/ha.
Linear models were adjusted to these suitability curves so they could be used to extract profitability at specific slope values (Figure 3). Hence, the first step in the profit-maximizing agent’s LUC selection process was to inspect its slope pixel value and, based on the profitability linear models, provisionally select the LUC with the highest economic return.
To simulate the “forest inertia” effect related to a likely greater resistance to shifting from forest to agriculture than the other way around, the agent was set to check its current LUC before accepting the LUC pre-selected with the slope/profitability criterion and, if it was found to be forest, then the profitability of agriculture as a potential alternative LUC was reduced in that pixel to inhibit its choice. The extent of this reduction can be defined by the user of the model and is subject to calibration, and it was further made dependent on the forest’s age, decaying as the forest ages and disappearing after 10 years (an arbitrary choice based on the typical duration of a eucalypt’s production cycle).
The distance to artificial areas is then measured, as proximity to artificial areas was considered to favour the choice of agriculture. Thus, the profitability of agriculture was inflated by a distance proximity factor which, in the absence of supporting empirical data, was arbitrarily defined as 1 + exp(−0.008 × D) for model development purposes, where D is the Euclidean distance to the nearest artificial area in meters. Finally, the proximity to agricultural areas was also considered to be a factor favouring the choice of agriculture, promoting the emergence of consolidated agricultural patches. In each iteration of the model, all agents checked for the existence of agricultural neighbours (in a 3 × 3 pixel neighbourhood) and, if true, then the profitability of agriculture was increased by a factor subject to calibration, given the underlying uncertainty.
After loading the original LUC map and reading the parameter values, the ABCA model starts with an initialization step in which all LUCs are randomized (except for water bodies and artificial areas, which are kept constant). In addition, the age of the forest is randomly assigned to all forest pixels with values ranging from 1 to 10 and subject to a probability effect that makes older forest pixels linearly more likely than younger ones. The model can be pre-run a few times to test and adjust parameters for calibration and validation purposes. The model performs 20 iterations in each run to simulate a time period of 20 years, which proved adequate to stabilize LUC choices and for the model to reach a “solution” (Figure 4).
It should be noted that although some of the model parameters had to be arbitrarily defined or extracted from secondary information for the purposes of model development and testing, these may be adjusted in the future as better information becomes available.
The resulting (predicted) LUC map is subject to a smoothing operation to eliminate all isolated pixels, which are then converted to the dominant LUC in the 3 × 3 neighbouring cells. This procedure is in line with the minimum map unit of 1ha in the original map and, at the same time, avoids an estimation of landscape configuration metrics skewed by an excess of very small patches.
Model accuracy was assessed based on the percentage of correctly predicted pixels, complemented with Cohen’s Kappa statistic to correct for agreements occurring by chance [47]. Additionally, because the objective of the ABCA model is to generate simulated values for the LUC variables computed at the parish level to be conveyed into the fire regime models, we also calculated the difference between the observed and predicted LUC shares in each parish and computed the half-sums of their absolute values. The average of these results across all parishes was then interpreted as an estimate of the percentage of accuracy obtained in the model’s predictions [48].

2.5. Scenario Simulation

The ABCA model was then used as a policy simulation tool to assess the cost-effectiveness of policies paying landowners incentives to voluntarily adopt fire-resilient LUC options and their impact on fire regime transitions, which was evaluated by using the fire regime models.
For this purpose, we compared the cost-effectiveness of three hypothetical alternative public policies paying a premium per hectare of (1) agricultural area, (2) shrubland area, or (3) a mix of both LUCs. These distinct policy options included all combinations of increasing levels of payments of 0, 50, 100, and 150 €/ha/year of agriculture and/or shrubland.
The simulation of each scenario was carried out by adding the value of the premium paid by the policy to the fixed component of the fitted linear model of the corresponding LUC (Figure 3), causing it to shift upwards, that is, increasing its relative profitability when compared to the remaining LUCs.
Therefore, in each scenario, the new parameters of the fitted linear model are passed to the ABCA model, from which new values of landscape composition (LUC) and configuration variables are extracted at the parish level. These are then used in the fire models to predict their impact on the TBA and GCI variables, which, at this stage, applied only to the Pinhal Interior study area.
Finally, the parishes are reclassified according to the fire regime category derived from the TBA and GCI models (Figure 2) to assess how many of them are no longer classified as the most fire-hazardous regime, fire regime 1, in each scenario, which is interpreted as an indicator of the effectiveness of the wildfire mitigation policy. Additionally, an estimate of the total cost of the measure in each scenario is also computed.

3. Results

3.1. Fire Regime Models

The correlation analysis among the independent variables led to the elimination of FOREST (percentage of forest in parish area), as it was highly correlated with the other LUC classes, thereby becoming the reference LUC category in the models. PD (patch density) and ED (edge density) were also discarded, as they unveiled correlation coefficients above 0.6 with other variables. After that, all other variables showed VIF values lower than 5; thus, they were kept and tested in the models.
Early attempts to estimate the TBA model led to the elimination of variables SLOP80 (80th slope percentile) and INTI (Interspersion index) due to lack of significance (non-compliance with the p-value < 0.05 criterion). The final TBA model proved to be highly significant, with the chi-square test showing that at least one of the independent variables significantly influenced the TBA (Table 2) and the Nagelkerke’s-R2, indicating that about 57% of the TBA variance is explained by the independent variables. The model revealed a percentage of correct predictions of 82%. Net primary productivity (NPP) was the most important variable, and it had a negative effect on TBA. Shrubland (SHRUB) showed a positive effect on TBA, and agriculture (AGRI) had the opposite effect. Landscape heterogeneity (SHDI) and larger patches (MPS) contributed to reducing TBA, whereas spring rainfall (RAJ) and summer temperatures (TJS) both proved to be TBA promoters.
The estimation of the GCI model led to the elimination of variables SLOP80, AGRI, RAJ, MPS, and INTI due to lack of statistical significance (Table 2). The chi-square test revealed that the model is statistically superior compared to a null model, the Nagelkerke’s-R2 indicates that 36% of the GCI variance is explained by the independent variables, and the model was able to make correct predictions 79% of the time. NPP was, again, the most important variable in the model, positively influencing GCI, i.e., contributing to the temporal concentration of total burned area. Shrubland (SHRUB) was the second most important variable in the model, and it had a significant effect on GCI reduction. Higher summer temperatures (TJS) and larger patch areas (MPS) showed a positive effect on GCI, contributing to temporal concentration of fires. Landscape diversity represented by the Shannon diversity index (SHDI) also contributed to the temporal dispersion of fires.
The classification of the parishes by fire regime from the original TBA and GCI variables reveals the high concentration of parishes classified in the first (most hazardous) fire regime category inside the Pinhal Interior region, where 89 (73%) of its 122 parishes were classified in fire regime 1, corresponding to the highest values of TBA and GCI (Figure 5).

3.2. Land Use/Land Cover Predictions

The ABCA model showed an overall hit rate of 73% of successful predictions. The prediction using LUC classes, however, revealed important differences, with a hit rate of 86% in the forest, 55% in agriculture, and 17% in the shrubland class, which led to a 33% figure in the Cohen’s Kappa statistic. At the landscape scale, the average hit rate of the LUC composition prediction across the 122 parishes in Pinhal Interior was 76% (Figure 6).
The calibration of the model led to setting the “forest inertia” parameter that reduces the propensity to switch from forest to agriculture as a function of the age (youth) of the forest in the form FA/20 (where FA stands for “forest age”, ranging 1 to 10), which was multiplied by the profitability of agriculture to maximally penalize it when the forest is newly planted, then fading out over time. The parameter controlling the effect “distance to agriculture”, aimed at favouring the choice of agriculture when this is the dominant neighbouring LUC, resulted in doubling of the profitability of agriculture for all pixels in this condition.

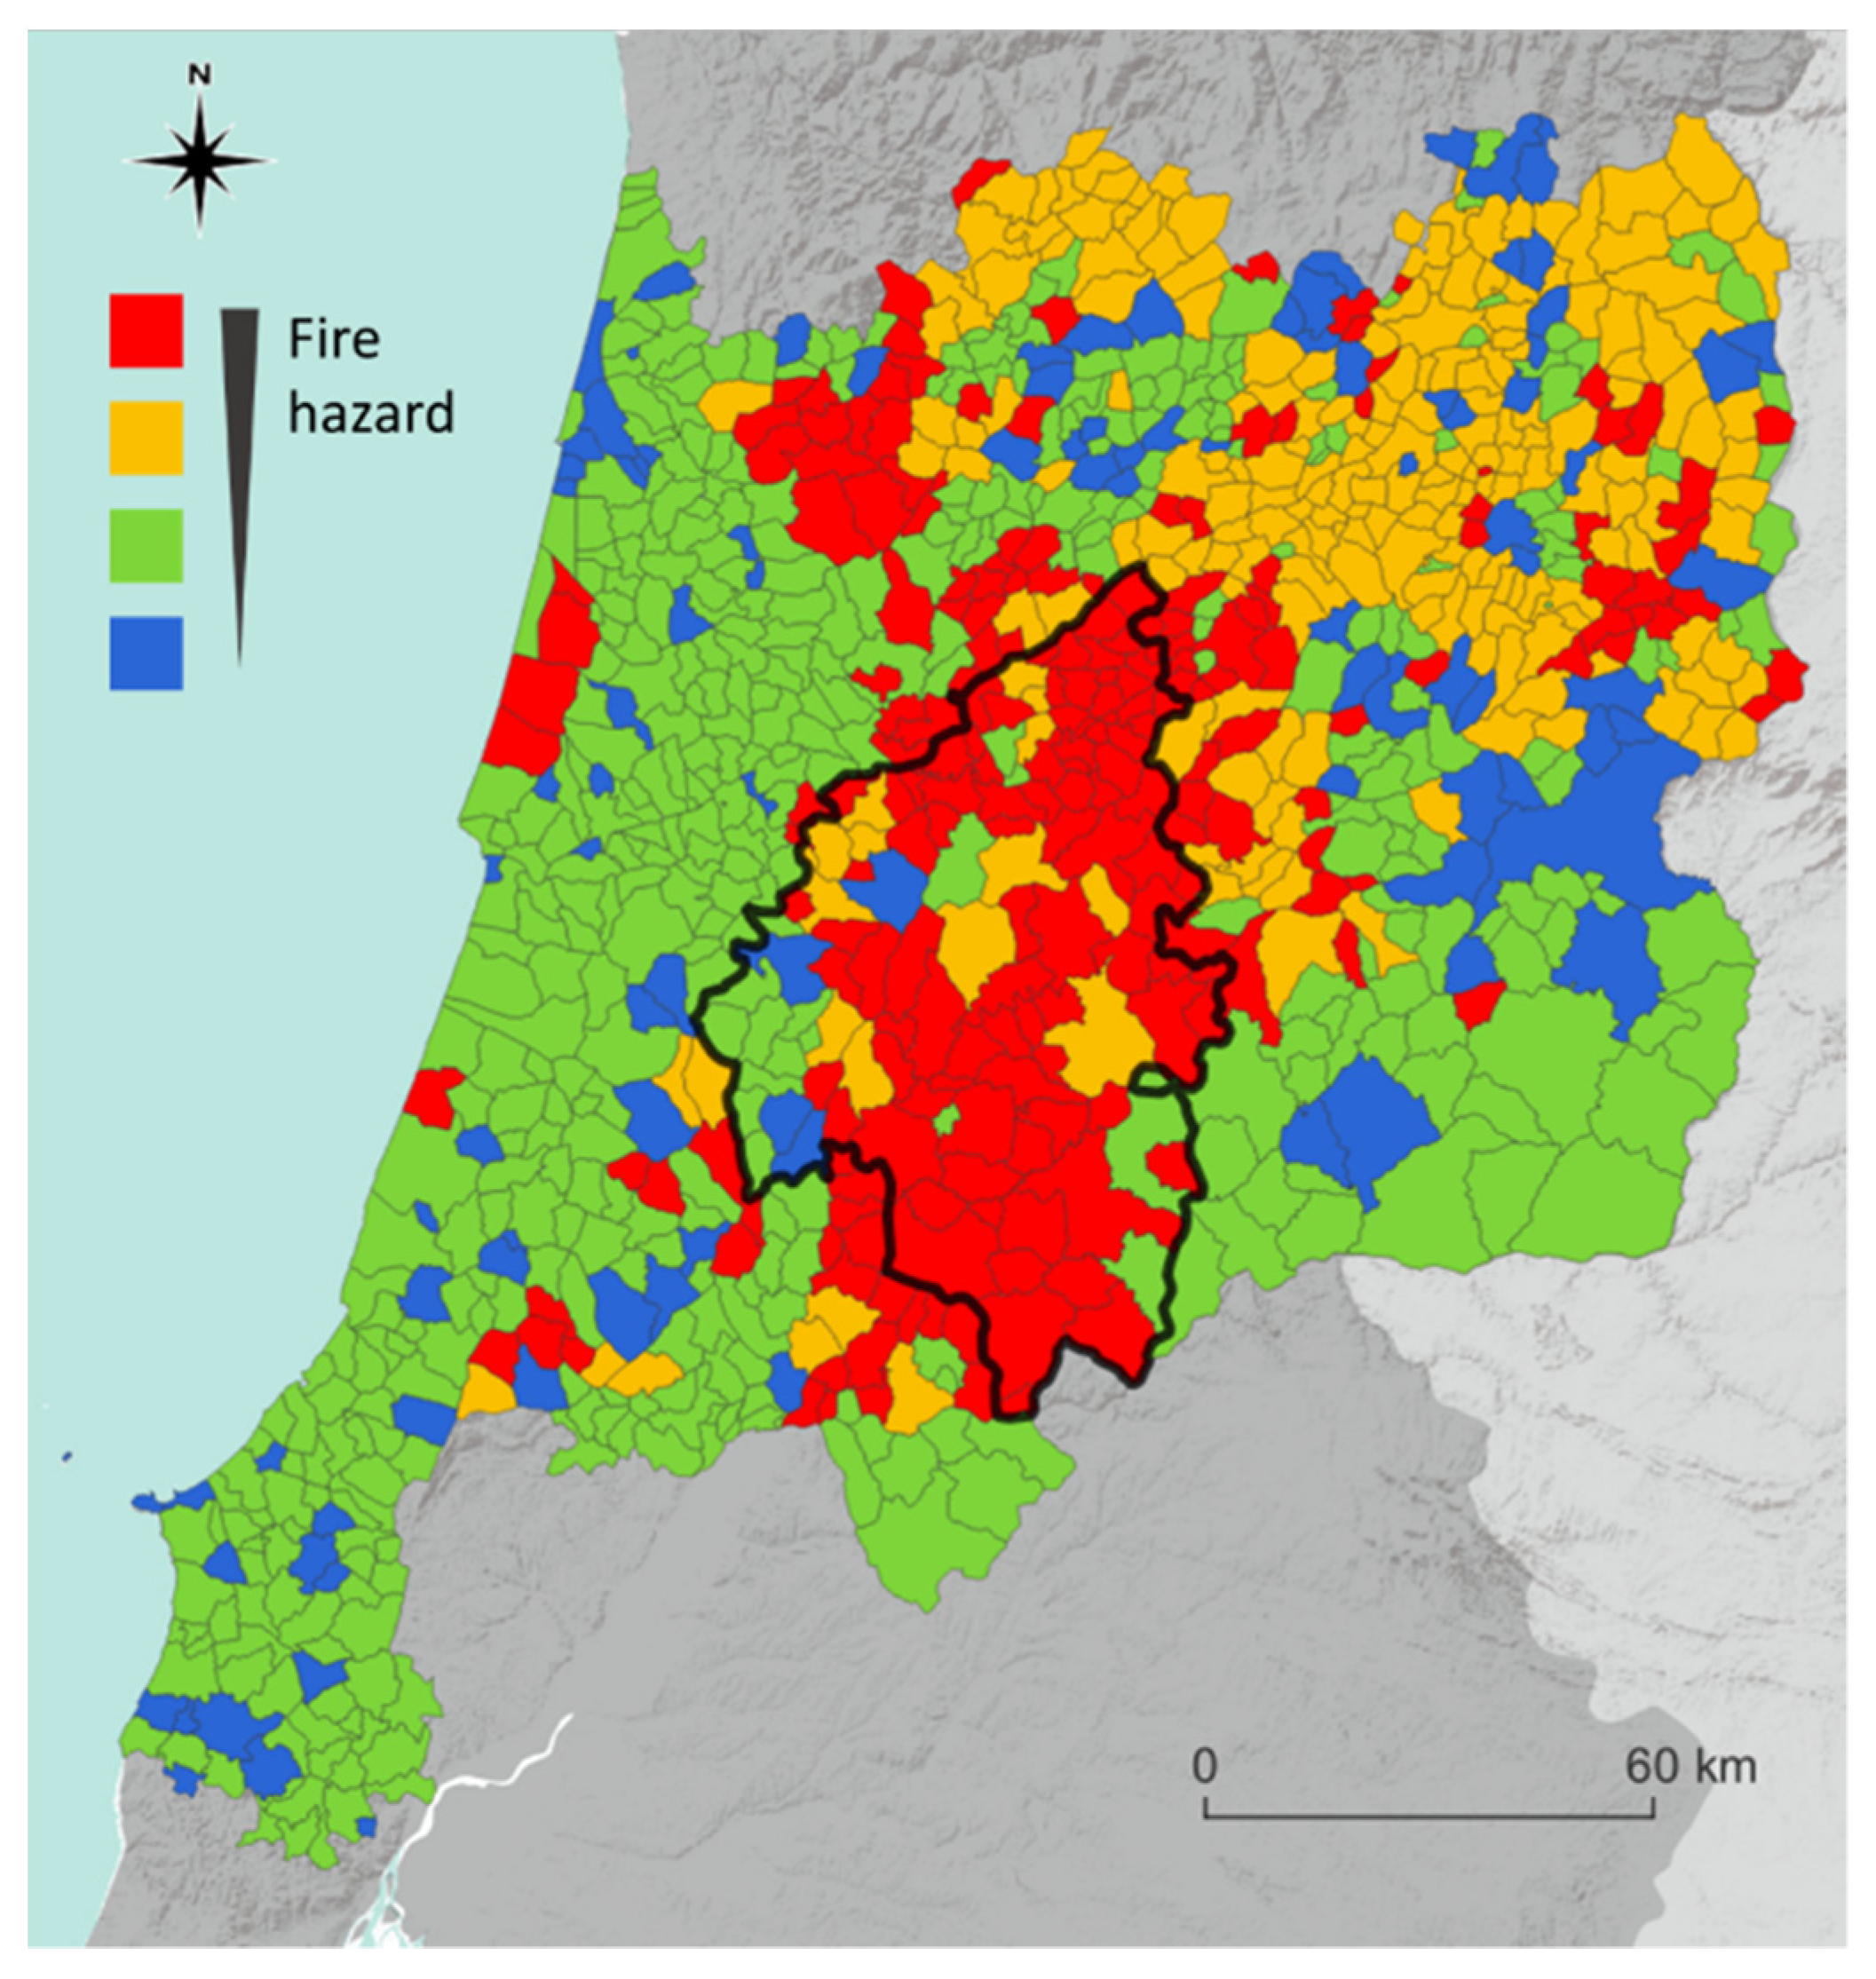
3.3. Fire Regime Transitions

The simulation of the alternative policy options to encourage landowners (agents, in the ABCA model) to adopt less fire-prone LUC showed its effectiveness in reducing the number of parishes classified in the most hazardous fire regime. In reaction to such hypothetical policies, agents replaced the forest with agriculture or shrubland, depending on policy incentives, changing the composition and configuration of the landscape (see simulated LUC maps for each scenario in Figure S1 in Supplementary Information). The simulation of these new LUC variables in the fire models led to a transition towards lower risk fire regime categories, the extent of which depended on the unitary value of subsidies paid by the policies (Table 3).
These results suggest, for example, that if the government’s objective was to halve the number of parishes in the most dangerous fire regime in Pinhal Interior, decreasing from the current (predicted) 78 to 39 or fewer parishes, the most cost-effective way to achieve this would be to pay an incentive of 100 €/ha/year for shrubland areas for a total annual expenditure of 14.5 M€ in payments to landowners (Table 3). Raising this target to 1/3 would require a combined minimum payment of 100 €/ha/year to agriculture and 50 €/ha/year to shrubland, increasing overall annual expenditure to 15.7 M€.

4. Discussion

4.1. Modelling Framework

Our modelling approach proved its overall suitability as a framework to assess the cost-effectiveness of wildfire mitigation policies based on LUC patterns. The decoupling of LUC and fire regime modelling allowed optimization of the methodological approach for each component while enabling their joint integration into a comprehensive policy simulation tool. Nevertheless, the rather exploratory and methodological nature of this study may have overlooked some empirical aspects, which might deserve further in-depth studies, as discussed here.
The fire regime modelling involved estimating two logistic regressions to predict two variables renowned in the literature as characterizing fire regimes: the total burned area (TBA) and the temporal concentration of fires (GCI). The signs and values of the coefficients were globally in line with expectations and with previous works recently developed in the same study area [13]. Regarding the LUC classes, agriculture proved to be crucial for the reduction of the total burned area when compared to forest (the reference LUC class, which was left out in the models). Shrubland was confirmed as the most fire-prone LUC class, but it had a strong promotional effect on its temporal dispersion, which is key to describing fire regimes. Climate proved to be a relevant driver of fire regimes, namely, spring rainfall and summer temperatures, both contributing by increasing the total burned area. The importance of landscape configuration for the fire regime was also shown, suggesting that increasing LUC heterogeneity can promote the fire resilience of landscapes [7,29,30,31].
Unexpectedly, slope did not show statistical significance in both fire models despite being a widely documented driver of wildfire [28,49]. A possible explanation can be related to the strong influence of slope on the spatial distribution of LUC classes embedded in our modelling approach such that the role of this variable was cancelled out by the LUC variables in the models.
The ABCA component of the framework not only revealed its suitability for the development of LUC policy simulations, but also enabled the use of landscape configuration variables in the simulations, which proved to be relevant in determining fire regimes, and it can only be assessed with this type of spatially explicit approach.
The use of suitability curves to relate LUC to slope and their interpretation as profitability curves was an innovative approach in this type of study, and it turned out to be a valuable tool to help simulate the spatial effects of LUC policies.
Despite the good global predictive accuracy of the ABCA model, some weaknesses were found in the predictions at the LUC class level, particularly in the case of shrubland. This may have occurred because this LUC category integrates very distinct land uses and covers, ranging from riparian vegetation at the bottoms of valleys to sparse vegetation at the tops of hills or scrubs on steeper slopes. The same may have happened in the case of agriculture, which typically includes a variety of land uses, albeit to a much lesser extent. These difficulties may have resulted from the use of highly aggregated LUC classes (forest, agriculture, and shrubland), implying a trade-off between allowing the ecological needs of different LUC subclasses to be revealed and the objective of producing useful information for designing cost-effective LUC policies.
Due to the exploratory nature of this study, the parameterization of the ABCA model was largely based on expert knowledge and secondary information (e.g., official statistics), which may give rise to uncertainties not easy to quantify. Future improvements of this approach may benefit from using empirical data and/or optimization methods for parameter estimation.
The use of the averages of the variables TBA and GCI to separate the fire regimes was also a mostly arbitrary option assumed for the purposes of developing and testing the framework. Although the results of this option are in line with those of previous studies on fire regimes in the Centro region and in the study area [13], it must be recognized that there is no data supporting the assertion that these averages actually establish the effective limits of the fire regime categories to consider, or about the degree of generalization of these limits. Therefore, this is an issue that also requires further investigation.
Another issue deserving further attention refers to the temporal mismatch between the fire data, which spans over an extensive period (1975–2018), required to derive the fire regime characterization variables and the LUC data, the latter of which refers to a single year (2018). Such temporal divergence may, however, become acceptable by assuming that the landscape in 2018 was also, to a certain extent, shaped by past fire events [50]. Additionally, the fact that burnt areas were not included in the LUC map and that highly aggregated LUC classes were used in the models, for which greater time-space stability can be expected, also contributes to this assumption.
Although the simulations focused only on the LUC variables (landscape composition and configuration) keeping everything else unchanged, given the objectives of the study, the same modelling framework could have been used to additionally simulate changes in other variables, such as temperature and rainfall, to investigate how climate change may affect the effectiveness of the policy options discussed here. However, this was beyond the scope of the present study.

4.2. Prospects for Wildfire Mitigation Policy

Our findings suggest that policy incentives that encourage landowners to maintain or expand agricultural areas or to convert part of their forest plantations into shrubland can foster the transition towards low-risk fire regimes at the landscape scale. However, in less favoured regions, such as the study area, where biophysical, socioeconomic, and demographic constraints do not make it easy to recover these territories for farming, these incentives may require high payments per hectare.
The lack of empirical economic data prevented the use of net-income based estimates of LUC profitability, forcing us to resort to estimates of gross profit to develop the analyses. This, however, is the income component directly affected by economic incentive policies, which were represented by their effects on the up- or downward shifting of the LUC profitability curves, changing their relative profitability and thereby influencing LUC choice. Despite these caveats, our results suggest that to achieve meaningful reduction in the number of parishes in the study area currently subject to highly hazardous fire regimes, the required public expenditure could total around 14.5 to 15.7 million euros per year. These amounts can be put into perspective if compared to the more than 80 million euros of public aid that was spent in 2018 just on the recovery of agriculture as a result of the wildfires that ravaged this region in 2017 (https://www.ifap.pt/incendios-2017 (accessed on 30 August 2022)). Furthermore, they are also in line with previous claims that, in Portugal, expenditure on fire suppression is typically disproportionately higher than expenditure on fire prevention [51,52].
The policy options that were simulated included payment alternatives to agriculture or shrubland, or a mix of both. Depending on the ambition level of the policy, here assessed as the number of parishes that are to be removed from the most hazardous fire regime categories, the most cost-effective alternative may include only payments to shrubland, or a combination of payments to shrubland and agriculture.
Although the impact of agriculture and shrubland on the fire regime is not the same, as the former contributes to the reduction of burned areas and the latter mainly contributes to the temporal spread of fires, the paramount role of shrubland in reducing wildfire hazard levels (but not wildfire occurrence) should be highlighted. Although our results do not demonstrate this, a possible explanation for this observation could be the fact that, on one hand, shrubs have a quick recovery capacity after fire and, on the other hand, by burning more frequently, which is possibly also due to the absence of management, they prevent the accumulation of high fuel loads so that fires, when they occur, do not reach mega-fire proportions. Thereby, this study identifies shrubland as a LUC class suitable for preventing highly hazardous fire regimes, going beyond most of the literature that simply describes it as a highly fire-prone land cover [7,28,53].
Our findings suggest that a public policy aimed at promoting low-risk fire regimes can be more cost-effective if it is based on payments to shrubland than to agriculture. Although this result is certainly linked to model assumptions, namely LUC profitability levels, it may also be related to the fact that shrublands are mainly composed of natural vegetation, presenting high ubiquity and capacity to thrive in the most diverse conditions. Therefore, shrubland can expand more easily over areas that could hardly be used for agriculture, thereby reducing the costs for its expansion. This, however, raises the question of what kind of shrubland should be promoted by such policies when there are already proposals advocating solutions, such as rewilding less favourable areas [54], slow-growing hardwood plantations [22], or setting aside forested land [55,56], to promote the delivery of non-commercial ecosystem services such as carbon sequestration, habitat provision for wildlife, or the reduction of wildfire risk [54,57,58].

5. Conclusions

The premises underpinning this study unveil its aim to contribute to the debate around the ultimate objective of a successful “wildfire policy”. The policy options considered make it clear that the single or main principle of reducing the burned area is being questioned in favour of avoiding a large temporal concentration of fires and their catastrophic effects [4,23,51].
The revealed effectiveness of the proposed policy options, based on financial incentives and voluntary participation, may be contrasted with that of the typical regulatory approach, which apparently falls short of expectations. Such policy options additionally have the advantage of being simple to implement and monitor with LUC data, and therefore, it is capable of attracting a high number of participants, which also enhances policy effectiveness. Nevertheless, within the current context of the EU’s Common Agricultural Policy (CAP), policy measures such as those proposed here can face the problem of knowing who their final recipients should be and who would be responsible for their implementation and management, as many forestland owners are currently outside the CAP payment system. In addition, the successful implementation of this type of measure also depends on the existence of active recipients in the territory available to adhere to the proposed measures, a condition that, in regions such as the study area that are strongly affected by depopulation, can be called into question.
At a time when calls to stop deforestation and promote forest expansion proliferate to promote carbon sequestration and fight climate change, proposals like the one in the present study, of converting forest into agriculture, seem to go against the mainstream. However, it should be noted that much European forest, especially in the south, is currently man-made, sometimes including exotic species such as eucalypt rather than natural forests [59]. In Mediterranean climate regions such as the study area, the high prevalence of monocultural forest plantations in the landscape and its excessive spatial concentration substantially increase the risk of mega-wildfires [7,19] which, among many other negative impacts, are also responsible for releasing high amounts of organic carbon into the atmosphere.
Overall, this study suggests a fire regime approach that can help in defining landscape-scale fire risk indicators that can be used as a reference to wildfire risk mitigation policy, allowing easy tracking by monitoring the composition of the landscape in relation to three major LUC classes: agriculture, forest, and shrubland.

Supplementary Materials

The following supporting information can be downloaded at: https://www.mdpi.com/article/10.3390/fire6030102/s1, Figure S1: Land use/land cover (LUC) simulations in each policy scenario in the study area of Pinhal Interior. Monetary values refer to payments to landowners provided by a hypothetical LUC policy.

Author Contributions

Conceptualization, P.F.R. and J.L.S.; methodology, P.F.R. and J.L.S.; data curation: P.F.R., R.B. and S.O.; validation, P.F.R., J.L.S., F.M., M.J.C., A.N., M.L., S.O., R.B. and J.L.Z.; formal analysis, P.F.R.; writing—original draft preparation, P.F.R.; writing—review and editing, P.F.R., J.L.S., F.M., M.J.C., A.N., M.L., S.O., R.B. and J.L.Z.; project administration, J.L.S. and F.M. All authors have read and agreed to the published version of the manuscript.

Funding

This research was funded with national funds through the FCT—Portuguese Foundation for Science and Technology, I.P., under the framework of the project People&Fire: Reducing Risk, Living with Risk (PCIF/AGT/0136/2017) and under the Project UIDB/00239/2020 of the Forest Research Centre (CEF) and Associated Laboratory TERRA. This research was also supported by the Centre of Geographical Studies (UIDB/00295/2020 and UIDP/00295/2020). Francisco Moreira was supported by contract IF/01053/2015. Sandra Oliveira was funded through FCT, I.P., under the programme Stimulus of Scientific Employment—Individual Support within the contract 2020.03873.CEECIND.

Institutional Review Board Statement

Not applicable.

Informed Consent Statement

Not applicable.

Data Availability Statement

Publicly available datasets were analysed in this study. This data can be found here: https://www.dgterritorio.gov.pt/ (accessed on 14 February 2022).

Conflicts of Interest

The authors declare no conflict of interest.

References

  1. Keeley, J.E.; Bond, W.J.; Bradstock, R.A.; Pausas, J.G.; Rundel, P.W. Fire in Mediterranean Ecosystems; Cambridge University Press: Cambridge, UK, 2011. [Google Scholar]
  2. Pausas, J.G.; Vallejo, V.R. The role of fire in European Mediterranean ecosystems. In Remote Sensing of Large Wildfires; Springer: Berlin/Heidelberg, Germany, 1999; pp. 3–16. [Google Scholar]
  3. Viedma, O.; Moity, N.; Moreno, J.M. Changes in landscape fire-hazard during the second half of the 20th century: Agriculture abandonment and the changing role of driving factors. Agric. Ecosyst. Environ. 2015, 207, 126–140. [Google Scholar] [CrossRef]
  4. Moreira, F.; Ascoli, D.; Safford, H.; Adams, M.A.; Moreno, J.M.; Pereira, J.M.C.; Catry, F.X.; Armesto, J.; Bond, W.; González, M.E.; et al. Wildfire management in Mediterranean-type regions: Paradigm change needed. Environ. Res. Lett. 2020, 15, 011001. [Google Scholar] [CrossRef]
  5. Aquilué, N.; Fortin, M.J.; Messier, C.; Brotons, L. The Potential of Agricultural Conversion to Shape Forest Fire Regimes in Mediterranean Landscapes. Ecosystems 2020, 23, 34–51. [Google Scholar] [CrossRef]
  6. Fernandes, P.M.; Guiomar, N.; Rossa, C.G. Analysing eucalypt expansion in Portugal as a fire-regime modifier. Sci. Total Environ. 2019, 666, 79–88. [Google Scholar] [CrossRef]
  7. Moreira, F.; Viedma, O.; Arianoutsou, M.; Curt, T.; Koutsias, N.; Rigolot, E.; Barbati, A.; Corona, P.; Vaz, P.; Xanthopoulos, G.; et al. Landscape—Wildfire interactions in southern Europe: Implications for landscape management. J. Environ. Manag. 2011, 92, 2389–2402. [Google Scholar] [CrossRef] [PubMed] [Green Version]
  8. Fernandes, P.M.; Pacheco, A.P.; Almeida, R.; Claro, J. The role of fire-suppression force in limiting the spread of extremely large forest fires in Portugal. Eur. J. For. Res. 2016, 135, 253–262. [Google Scholar] [CrossRef]
  9. Parente, J.; Pereira, M.G.; Amraoui, M.; Tedim, F. Negligent and intentional fires in Portugal: Spatial distribution characterization. Sci. Total Environ. 2018, 624, 424–437. [Google Scholar] [CrossRef] [Green Version]
  10. Dupuy, J.L.; Fargeon, H.; Martin-StPaul, N.; Pimont, F.; Ruffault, J.; Guijarro, M.; Hernando, C.; Madrigal, J.; Fernandes, P. Climate change impact on future wildfire danger and activity in southern Europe: A review. Ann. For. Sci. 2020, 77, 35. [Google Scholar] [CrossRef]
  11. Meira Castro, A.C.; Nunes, A.; Sousa, A.; Lourenço, L. Mapping the causes of forest fires in Portugal by clustering analysis. Geosciences 2020, 10, 53. [Google Scholar] [CrossRef] [Green Version]
  12. Ascoli, D.; Moris, J.V.; Marchetti, M.; Sallustio, L. Land use change towards forests and wooded land correlates with large and frequent wildfires in Italy. Ann. Silvic. Res. 2021, 46, 177–188. [Google Scholar] [CrossRef]
  13. Bergonse, R.; Oliveira, S.; Zêzere, J.L.; Moreira, F.; Ribeiro, P.F.; Leal, M.; Lima e Santos, J.M. Biophysical controls over fire regime properties in Central Portugal. Sci. Total Environ. 2021, 810, 152314. [Google Scholar] [CrossRef]
  14. Carrasco, J.; Acuna, M.; Miranda, A.; Alfaro, G.; Pais, C.; Weintraub, A. Exploring the multidimensional effects of human activity and land cover on fire occurrence for territorial planning. J. Environ. Manag. 2021, 297, 113428. [Google Scholar] [CrossRef] [PubMed]
  15. Montiel Molina, C.; Karlsson Martín, O.; Galiana Martín, L. Regional fire scenarios in Spain: Linking landscape dynamics and fire regime for wildfire risk management. J. Environ. Manag. 2019, 233, 427–439. [Google Scholar] [CrossRef] [PubMed]
  16. Oddi, F.J. Fire Regime. In Encyclopedia of Wildfires and Wildland-Urban Interface (WUI) Fires; Springer International Publishing: Cham, Switzerland, 2018; pp. 1–12. [Google Scholar]
  17. Royé, D.; Tedim, F.; Martin-Vide, J.; Salis, M.; Vendrell, J.; Lovreglio, R.; Bouillon, C.; Leone, V. Wildfire burnt area patterns and trends in Western Mediterranean Europe via the application of a concentration index. Land Degrad. Dev. 2020, 31, 311–324. [Google Scholar] [CrossRef]
  18. Rodrigues, M.; Jiménez-Ruano, A.; de la Riva, J. Fire regime dynamics in mainland Spain. Part 1: Drivers of change. Sci. Total Environ. 2020, 721, 135841. [Google Scholar] [CrossRef]
  19. Moreira, F.; Leal, M.; Bergonse, R.; Canadas, M.J.; Novais, A.; Oliveira, S.; Ribeiro, P.F.; Zêzere, J.L.; Santos, J.L. Recent trends in fire regimes and associated territorial features in a megafire-prone Mediterranean region. Fire 2023, 6, 60. [Google Scholar] [CrossRef]
  20. San-Miguel-Ayanz, J.; Rodrigues, M.; de Oliveira, S.S.; Pacheco, C.K.; Moreira, F.; Duguy, B.; Camia, A. Land Cover Change and Fire Regime in the European Mediterranean Region. In Post-Fire Forest Management in Southern Europe: A COST Action for Gathering and Disseminating Scientific Knowledge; Moreira, F., Arianoutsou, M., Corona, P., De las Heras, J., Eds.; Managing Forest Ecosystems; Springer: Dordrecht, The Netherlands, 2012; pp. 93–119. [Google Scholar]
  21. Barreiro, S.; Benali, A.; Rua, J.C.P.; Tomé, M.; Santos, J.L.; Pereira, J.M.C. Combining landscape fire simulations with stand-level growth simulations to assist landowners in building wildfire-resilient landscapes. Forests 2021, 12, 1498. [Google Scholar] [CrossRef]
  22. Magalh, M.R.; Cunha, S.; Pena, S.B.; Müller, A. FIRELAN—An Ecologically Based Planning Model towards a Fire Resilient and Sustainable Landscape. A Case Study in Center Region of Portugal. Sustainability 2021, 13, 7055. [Google Scholar] [CrossRef]
  23. Wunder, S.; Calkin, D.E.; Charlton, V.; Feder, S.; Martínez de Arano, I.; Moore, P.; Rodríguez y Silva, F.; Tacconi, L.; Vega-García, C. Resilient landscapes to prevent catastrophic forest fires: Socioeconomic insights towards a new paradigm. For. Policy Econ. 2021, 128, 102458. [Google Scholar] [CrossRef]
  24. Benali, A.; Sá, A.C.L.; Pinho, J.; Fernandes, P.M.; Pereira, J.M.C. Understanding the impact of different landscape-level fuel management strategies on wildfire hazard in central Portugal. Forests 2021, 12, 522. [Google Scholar] [CrossRef]
  25. McWethy, D.B.; Schoennagel, T.; Higuera, P.E.; Krawchuk, M.; Harvey, B.J.; Metcalf, E.C.; Schultz, C.; Miller, C.; Metcalf, A.L.; Buma, B.; et al. Rethinking resilience to wildfire. Nat. Sustain. 2019, 2, 797–804. [Google Scholar] [CrossRef]
  26. Moreira, F.; Vaz, P.; Catry, F.; Silva, J.S. Regional variations in wildfire susceptibility of land-cover types in Portugal: Implications for landscape management to minimize fire hazard. Int. J. Wildl. Fire 2009, 18, 563. [Google Scholar] [CrossRef]
  27. Meneses, B.M.; Reis, E.; Reis, R. Assessment of the recurrence interval of wildfires in mainland portugal and the identification of affected luc patterns. J. Maps 2018, 14, 282–292. [Google Scholar] [CrossRef]
  28. Oliveira, S.; Zêzere, J.L. Assessing the biophysical and social drivers of burned area distribution at the local scale. J. Environ. Manag. 2020, 264, 110449. [Google Scholar] [CrossRef]
  29. Mancini, L.D.; Corona, P.; Salvati, L. Ranking the importance of Wildfires’ human drivers through a multi-model regression approach. Environ. Impact Assess. Rev. 2018, 72, 177–186. [Google Scholar] [CrossRef]
  30. Oliveira, S.; Moreira, F.; Boca, R.; San-Miguel-Ayanz, J.; Pereira, J.M.C. Assessment of fire selectivity in relation to land cover and topography: A comparison between Southern European countries. Int. J. Wildl. Fire 2014, 23, 620. [Google Scholar] [CrossRef]
  31. Curt, T.; Borgniet, L.; Bouillon, C. Wildfire frequency varies with the size and shape of fuel types in southeastern France: Implications for environmental management. J. Environ. Manag. 2013, 117, 150–161. [Google Scholar] [CrossRef] [Green Version]
  32. Badia, A.; Saurí, D.; Cerdan, R.; Llurdés, J.C. Causality and management of forest fires in mediterranean environments: An example from catalonia. Environ. Hazards 2002, 4, 23–32. [Google Scholar] [CrossRef]
  33. Lloret, F.; Calvo, E.; Pons, X.; Díaz-Delgado, R. Wildfires and landscape patterns in the Eastern Iberian Peninsula. Landsc. Ecol. 2002, 17, 745–759. [Google Scholar] [CrossRef] [Green Version]
  34. Bacciu, V.; Sirca, C.; Spano, D. Towards a systemic approach to fire risk management. Environ. Sci. Policy 2022, 129, 37–44. [Google Scholar] [CrossRef]
  35. Pe’er, G.; Bonn, A.; Bruelheide, H.; Dieker, P.; Eisenhauer, N.; Feindt, P.H.; Hagedorn, G.; Hansjürgens, B.; Herzon, I.; Lomba, Â.; et al. Action needed for the EU Common Agricultural Policy to address sustainability challenges. People Nat. 2020, 2, 305–316. [Google Scholar] [CrossRef] [PubMed] [Green Version]
  36. Moreira, F.; Pe’er, G. Agricultural policy can reduce wildfires. Science 2018, 359, 1001. [Google Scholar] [CrossRef] [PubMed]
  37. Stoof, C.R.; Kettridge, N. Living With Fire and the Need for Diversity. Earth’s Futur. 2022, 10, e2021EF002528. [Google Scholar] [CrossRef]
  38. Moritz, M.A.; Batllori, E.; Bradstock, R.A.; Gill, A.M.; Handmer, J.; Hessburg, P.F.; Leonard, J.; McCaffrey, S.; Odion, D.C.; Schoennagel, T.; et al. Learning to coexist with wildfire. Nature 2014, 515, 58–66. [Google Scholar] [CrossRef]
  39. R Development Core Team. R: A Language and Environment for Statistical Computing; R Foundation for Statistical Computing: Vienna, Austria, 2021; Available online: http://www.r-project.org (accessed on 23 November 2021).
  40. James, G.; Witten, D.; Hastie, T.; Tibshirani, R. Springer Texts in Statistics An Introduction to Statistical Learning—With Applications in R; Springer: Berlin/Heidelberg, Germany, 2013. [Google Scholar]
  41. Shanthi, M.; Rajan, E.G. Agent Based Cellular Automata: A Novel Approach for Modeling Spatiotemporal Growth Processes. Int. J. Appl. Or Innov. Eng. Manag. 2012, 1, 56–61. [Google Scholar]
  42. Fornacciari, P.; Lombardo, G.; Mordonini, M.; Poggi, A.; Tomaiuolo, M. Agent based cellular automata simulation. CEUR Workshop Proc. 2018, 2215, 16–20. [Google Scholar]
  43. Millington, J.; Romero-Calcerrada, R.; Wainwright, J.; Perry, G. An agent-based model of mediterranean agricultural land-use/cover change for examining wildfire risk. Jasss 2008, 11, 4. [Google Scholar]
  44. Spies, T.A.; White, E.; Ager, A.; Kline, J.D.; Bolte, J.P.; Platt, E.K.; Olsen, K.A.; Pabst, R.J.; Barros, A.M.G.; Bailey, J.D.; et al. Using an agent-based model to examine forest management outcomes in a fire-prone landscape in Oregon, USA. Ecol. Soc. 2017, 22, 25. [Google Scholar] [CrossRef] [Green Version]
  45. Sotirov, M.; Sallnäs, O.; Eriksson, L.O. Forest owner behavioral models, policy changes, and forest management. An agent-based framework for studying the provision of forest ecosystem goods and services at the landscape level. For. Policy Econ. 2019, 103, 79–89. [Google Scholar] [CrossRef]
  46. Holm, S.; Thees, O.; Lemm, R.; Olschewski, R.; Hilty, L.M. An agent-based model of wood markets: Scenario analysis. For. Policy Econ. 2018, 95, 26–36. [Google Scholar] [CrossRef]
  47. Ben-David, A. Comparison of classification accuracy using Cohen’s Weighted Kappa. Expert Syst. Appl. 2008, 34, 825–832. [Google Scholar] [CrossRef]
  48. Ribeiro, P.F.; Santos, J.L.; Canadas, M.J.; Novais, A.M.; Moreira, F.; Lomba, Â. Explaining farming systems spatial patterns: A farm-level choice model based on socioeconomic and biophysical drivers. Agric. Syst. 2021, 191, 103140. [Google Scholar] [CrossRef]
  49. Verde, J.C.; Zêzere, J.L. Assessment and validation of wildfire susceptibility and hazard in Portugal. Nat. Hazards Earth Syst. Sci. 2010, 10, 485–497. [Google Scholar] [CrossRef]
  50. Silva, J.S.; Vaz, P.; Moreira, F.; Catry, F.; Rego, F.C. Wildfires as a major driver of landscape dynamics in three fire-prone areas of Portugal. Landsc. Urban Plan. 2011, 101, 349–358. [Google Scholar] [CrossRef] [Green Version]
  51. Beighley, M.; Hyde, A.C. Portugal Wildfire Management in a New Era: Assessing Fire Risks, Resources and Reforms. Indep. Rep. 2018, 9, 52. [Google Scholar]
  52. Viegas, D.X.; Figueiredo Almeida, M.; Ribeiro, L.M.; Raposo, J.; Viegas, M.T.; Oliveira, R.; Alves, D.; Pinto, C.; Jorge, H.; Rodrigues, A.; et al. O complexo de incêndios de Pedrógão Grande e concelhos limítrofes. Indep. Rep. 2017, 238. [Google Scholar]
  53. Nunes, M.C.S.; Vasconcelos, M.J.; Pereira, J.M.C.; Dasgupta, N.; Alldredge, R.J.; Rego, F.C. Land Cover Type and Fire in Portugal: Do Fires Burn Land Cover Selectively? Landsc. Ecol. 2005, 20, 661–673. [Google Scholar] [CrossRef]
  54. Benayas, J.M.R.; Bullock, J.M. Rewilding European Landscapes; Pereira, H.M., Navarro, L.M., Eds.; Springer International Publishing: Cham, Switzerland, 2015. [Google Scholar]
  55. Grönlund, Ö.; Di Fulvio, F.; Bergström, D.; Djupström, L.; Eliasson, L.; Erlandsson, E.; Forsell, N.; Korosuo, A. Mapping of voluntary set-aside forests intended for nature conservation management in Sweden. Scand. J. For. Res. 2019, 34, 133–144. [Google Scholar] [CrossRef]
  56. Boon, T.E.; Broch, S.W.; Meilby, H. How financial compensation changes forest owners’ willingness to set baside productive forest areas for nature conservation in Denmark. Scand. J. For. Res. 2010, 25, 564–573. [Google Scholar] [CrossRef]
  57. Frei, T.; Edou, K.; Rodríguez Fernández-Blanco, C.; Winkel, G. Governing abandoned land: Storylines on natural forest regrowth in France and Spain. Environ. Sci. Policy 2022, 135, 58–66. [Google Scholar] [CrossRef]
  58. Keenleyside, C.; Tucker, G. Farmland Abandonment in the EU: An Assessment of Trends and Prospects. Report prepared for WWF. Institute for European Environmental Policy, London. 2010. Available online: www.ieep.eu (accessed on 25 August 2022).
  59. Van Holt, T.; Binford, M.W.; Portier, K.M.; Vergara, R. A stand of trees does not a forest make: Tree plantations and forest transitions. Land Use Policy 2016, 56, 147–157. [Google Scholar] [CrossRef]
Figure 1. Location of the study area “Pinhal Interior” in the “Centro” region (EU-NUT II), Portugal.
Fire 06 00102 g001
Figure 2. Conceptual fire regime classification framework (see Section 2.3 for a description; TBA—Total Burned Area; GCI—Gini concentration index).
Fire 06 00102 g002
Figure 3. Profitability curves for agriculture (orange), forest (green), and shrubland (blue) as a function of slope in the study area (solid lines—observed curves; dashed lines—fitted models).
Fire 06 00102 g003
Figure 4. Overall flow of the analytical framework integrating the agent-based model with the fire regime model.
Fire 06 00102 g004
Figure 5. Classification of the parishes (small polygons) of Centro region and Pinhal Interior (thick black line delimited polygon) according to the four fire regimes derived from the TBA and GCI variables (see Figure 2).
Fire 06 00102 g005
Figure 6. Land use/cover map of the study area in 2018, observed (A) and predicted (B).
Fire 06 00102 g006
Table 1. Summary statistics for the variables used in fire regime model estimation.
Type/
Code
DescriptionCentro Region
(n = 972)
Mean–sd. (Max–Min)
Pinhal Interior Region
(n = 122)
Mean–sd. (Max–Min)
Fire occurrence (dependent variables)
TBATotal burned area (cumulative % of parish area)92.5–87.8 (486.8–0.0)148.4–68.2 (307.7–10.7)
GCIGini concentration index (dimensionless)85.2–17.9 (97.7–0.0)90.1–4.6 (97.6–69.4)
Land use/cover
AGRIAgriculture (% of parish area)30.9–18 (85.4–1.7)15.3–9.6 (40.1–1.7)
FORESTForests (% of parish area)46.9–21.7 (93.1–0.1)68.5–14.6 (89.2–18.3)
SHRUBShrubland (% of parish area)13.9–15.7 (90.3–0.0)11.3–13.9 (78.1–0.0)
ARTIFArtificial areas (% of parish area)7.0–7.5 (61.8–0.1)4.0–3.6 (23.2–0.3)
WATERWater bodies (% of parish area)1.3–4.8 (85.8–0.0)1.0–1.8 (11.6–0.0)
Topography
SLOP8080th Percentile of slope (%)18.2–9.4 (53.3–1.9)26.8–10.3 (53.3–11.1)
Climate
RAJMean cumulative rainfall between April and June (mm)198.8–35 (325.4–119)209.1–18.6 (268.9–150.3)
TJSAverage monthly temperatures between July and September (°C)20.6–1.2 (24.3–15.8)21.3–0.7 (23.4–18.8)
Biomass
NPPNet primary productivity (kgC/m2)1.0–0.2 (1.7–0.2)1.0–0.1 (1.3–0.7)
Landscape metrics
MPSMean patch size (ha)26.7–12.5 (125.1–6.2)29.8–11.3 (78.3–12.9)
PDPatch density (no./100 ha)4.3–1.5 (16–0.8)3.8–1.3 (7.8–1.3)
EDEdge density (m/ha)50.6–13.8 (88.3–9.6)43.4–14.1 (88.3–17.1)
SHDIShannon’s diversity index (dimensionless)1.0–0.2 (1.5–0.3)0.8–0.2 (1.3–0.4)
INTIInterspersion index (%)63.7–11.8 (96.7–25.2)58.7–10.9 (86.2–34.8)
Table 2. Coefficients and statistics for the final TBA and GCI models.
CoefficientStd. Errorz Valuep Value
TBA
  (Intercept)1.2620.4992.5310.011
  AGRI−1.1580.147−7.8590.000
  SHRUB1.5650.1719.1620.000
  TJS0.7130.1335.3680.000
  RAJ0.8560.1565.4920.000
  MPS−0.5290.133−3.9720.000
  SHDI−0.5100.135−3.7690.000
  NPP−1.8470.535−3.4520.001
Chi-square sig.0.000
Nagelkerke’s R20.574
Prediction accuracy0.823
GCI
  (Intercept)−1.7340.386−4.4980.000
  SHRUB−0.6750.098−6.8740.000
  TJS0.2940.0873.4010.001
  MPS0.2390.1012.3610.018
  SHDI−0.2210.105−2.0970.036
  NPP2.7960.4076.8640.000
Chi-square sig.0.000
Nagelkerke’s R20.355
Prediction accuracy0.790
Table 3. Fire regime outcomes in each scenario and estimation of the total annual cost of the measure in 106 euros (M€). Polygons identify parishes. The numbers below the coloured symbols identify the number of parishes in each fire regime (see Figure 2 for colour legend).
Agriculture
0 €/ha/Year50 €/ha/Year100 €/ha/Year150 €/ha/Year
Shrubland0 €/ha/yearFire 06 00102 i001Fire 06 00102 i002Fire 06 00102 i003Fire 06 00102 i004
Fire 06 00102 i017
-- M€
Fire 06 00102 i018
4.5 M€
Fire 06 00102 i019
11.8 M€
Fire 06 00102 i020
22.7 M€
50 €/ha/yearFire 06 00102 i005Fire 06 00102 i006Fire 06 00102 i007Fire 06 00102 i008
Fire 06 00102 i021
1.8 M€
Fire 06 00102 i022
8.1 M€
Fire 06 00102 i023
15.7 M€
Fire 06 00102 i024
27.0 M€
100 €/ha/yearFire 06 00102 i009Fire 06 00102 i010Fire 06 00102 i011Fire 06 00102 i012
Fire 06 00102 i025
14.5 M€
Fire 06 00102 i026
19.5 M€
Fire 06 00102 i027
27.6 M€
Fire 06 00102 i028
39.6 M€
150 €/ha/yearFire 06 00102 i013Fire 06 00102 i014Fire 06 00102 i015Fire 06 00102 i016
Fire 06 00102 i029
36.0 M€
Fire 06 00102 i030
39.7 M€
Fire 06 00102 i031
47.9 M€
Fire 06 00102 i032
60.8 M€
Disclaimer/Publisher’s Note: The statements, opinions and data contained in all publications are solely those of the individual author(s) and contributor(s) and not of MDPI and/or the editor(s). MDPI and/or the editor(s) disclaim responsibility for any injury to people or property resulting from any ideas, methods, instructions or products referred to in the content.

