
The Post-Shock Nonequilibrium Relaxation in a Hypersonic Plasma Flow Involving Reflection off a Thermal Discontinuity
Physics Department, Old Dominion University, Norfolk, VA 23529, USA
Plasma 2023, 6(1), 181-197; https://doi.org/10.3390/plasma6010014
Submission received: 4 January 2023
/
Revised: 16 February 2023
/
Accepted: 21 February 2023
/
Published: 6 March 2023
(This article belongs to the Special Issue Feature Papers in Plasma Sciences)
Abstract
:The evolution in the post-shock nonequilibrium relaxation in a hypersonic plasma flow was investigated during a shock’s reflection off a thermal discontinuity. It was found that within a transitional period, the relaxation zone parameters past both the reflected and transmitted waves evolve differently compared to that in the incident wave. In a numerical example for the non-dissociating N2 gas heated to 5000 K/10,000 K across the interface and M = 3.5, the relaxation time determined for the transmitted wave is up to 50% shorter and the relaxation depth for both waves is significantly reduced, thus resulting in a weakened wave structure. The results of the extension into larger values of heating strength and the shock Mach numbers are discussed. The findings can be useful in the areas of research involving strong shocks interacting with optical discharges or other heated media on the scale where the shock structure becomes important.
1. Introduction
The research topics involving the interaction of shock waves with interfaces with plasma or gaseous media characterized by significantly elevated temperatures or rarefaction have been of intense interest since the middle of the last century. The vast pool of applications using plasma media includes aerospace, air flight, and environmental domains that can benefit from the research aimed at achieving significantly reduced wave drag and thus increased aircraft speed, lower fuel consumption, and ultimately a longer flight range [1]; the possibility of controlling the direction of a vehicle in flight via energy deposition in the flow around it [2,3,4]; and managing the sonic boom detrimental to the environment. On a laboratory scale, the topics of academic and applied interests include the shock–flame interaction and combustion [5], and the shock-assisted compression utilizing implosion toward the target [6] in fusion research. In astrophysics, the studies are of interest to explain fascinating phenomena occurring, for example, during supernova explosions [7]. Considering nonequilibrium processes due to the relaxation of slower degrees of freedom in the medium compressed by a shock, the data on the thermodynamic properties of the specific gases can be extracted from recordings of the shock structure in experiments [7].
The electric, RF, or laser-induced discharges are typically used to heat a gas to temperatures up to several thousand degrees, producing plasma areas in a wide range of temperatures that are dependent on the discharge type. Optical discharges will be of special interest in this work due to the relatively small, mm scaled sizes of the heated area of a simple shape featuring relatively sharp boundaries. Another key characteristic of this discharge is its ability of intensive heating up to 10,000 K that, in addition to the instant compression in a shock wave, creates the conditions when the energy of the active degrees of freedom of molecules (translational and rotational) is high enough to excite slower inert degrees of freedom (vibration, dissociation, and electronic excitation) in the gas molecules to significant population levels. The cooling of the translational and rotational temperature is caused by the excitation of the molecular energy levels resulting in the onset of vibrations, dissociation, electronic excitation, and chemical reactions. Due to significant difference in the excitation rates for active and inert degrees of freedom, a departure from the equilibrium state in the flow behind the shock results. The relaxation processes lagging with respect to the shock motion create an extended structure of the shock wave of an appreciable size. The parameters of the post-shock nonequilibrium relaxation zone, such as width, depth (defined through the asymptotic values), and parameter distribution in the zone, depend on the shock strength and the temperature of the medium of propagation. The sort of gas is another strong factor in the zone formation that can be also very sensitive to impurities. Because of the great variation in the energy content of inert degrees of freedom for different gases, the relaxation zone length can vary, for ex., between a portion of a mm in N2 to tens of cm in O2, and a minuscule amount of water vapor present in the gas may result in the shock structure of a completely different scale [8].
The transition of this type of shock through the gas or plasma discontinuities will be the main topic of discussion in this work. The process of refraction of a plane discontinuous shock front normally incident on a discontinuous plane interface in an ideal gas has been considered, for ex., in [9]. At a fixed value of the shock Mach number, the reflected and transmitted wave intensities and the character of the reflected wave are determined by the heating strength across the interface and the plasma media thermodynamic properties. In case of intensive heating and the gases of certain nature, the refraction equations can be corrected for real gas properties, as was done in [10], and applied to diatomic non-dissociating nitrogen at 5000 K. An extension of the problem considering non-sharp interfaces, i.e., having a continuous distribution of parameters across it over some distance, was studied in [11].
The interaction of curved shocks with interfaces of variable shapes, both discontinuous and continuous, and with various gas parameter distributions behind the interface, has been analyzed by many authors. The findings that are closely tied to the shock and plasma conditions used in this work are described in [12]. The non-equilibrium state effects in the hypersonic flows, including the slower excitation modes such as molecular vibrations and dissociation, have been studied by many authors, for ex. in numerical investigation [13], and that at highly thermal and rarefied media conditions in [14].
A combination of two phenomena in the shock refraction, the nonequilibrium relaxation and the curvature, was a topic of another investigation that studied the evolution of an extended shock structure during its passage through a discontinuous curved interface with a thermal gas [15]. The dependence of the relaxation length in the post-shock flow on the Mach number was considered the main factor in the shock’s structure transformation. It was assumed there that the process of shock reflection, always present at an interface to some degree, does not affect the properties of the relaxation region in the transmitted shock and thus all the changes in its structure were attributed to the curvature effects only.
In connection with the latter assumption, the next step would be looking into the process of reflection of a shock wave featuring an extended structure of a finite width, and checking whether the parameters of the relaxation zone past both, the reflected and transmitted waves, may be affected. Apart from academic interests, clarification on this matter can be vital in the applications considering the shock–plasma interactions on the scales where the shock structure comes to play. Since in those problems the reflected portion of the wave is typically considered as a loss to be minimized (or maximized), the structure of the transmitted wave will be of primary interest.
2. Reflection of a Shock Wave Having an Extended Structure
Derivation of the expressions describing the process of reflection of a structured shock can be started from the same interaction conditions on the interface used for a sharp shock front [9], where the front was treated as a mathematical discontinuity across which the flow quantities experience a discrete jump. Then, with the continuous distribution of gas parameters on the high-pressure side of the front, the process of the interaction with the interface will be stretched over the time period that is limited by the relaxation time in the zone.
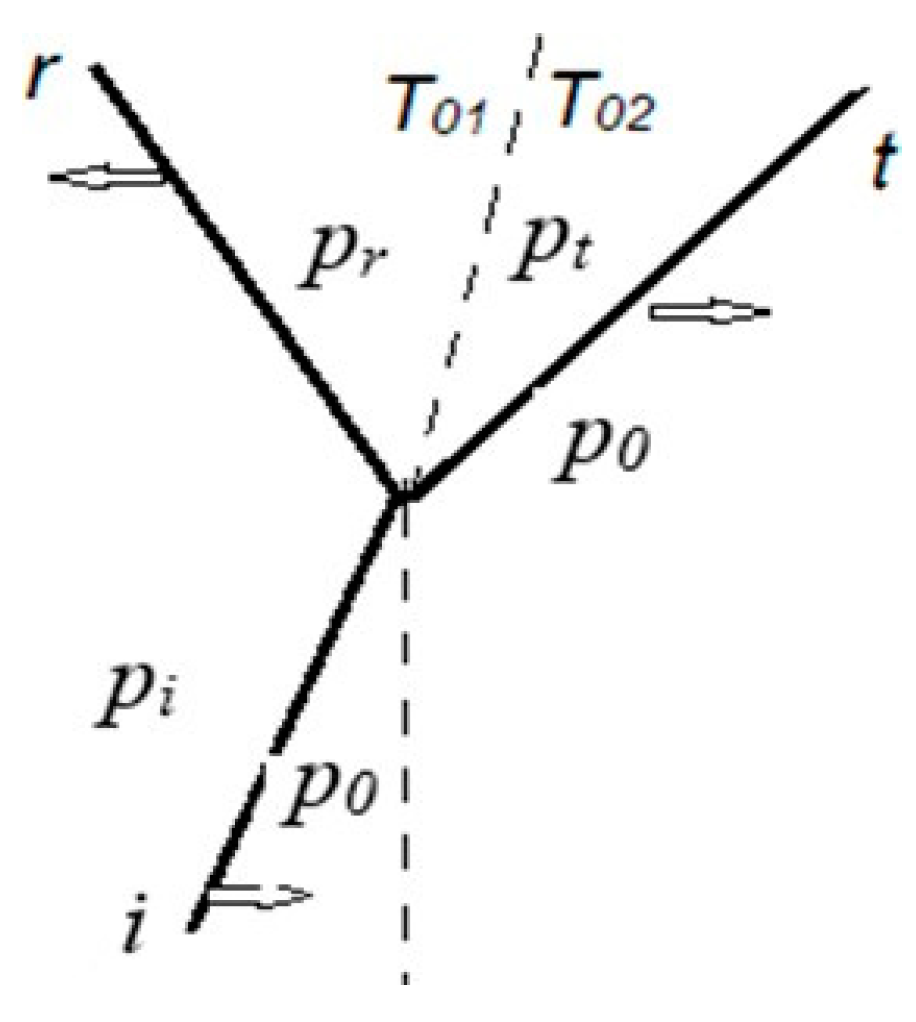
As depicted in Figure 1, a plane shock wave “i” of Mach number Mi is incident normally, from left to right, on a discontinuous plane interface (dashed line) separating two gases of different properties. A portion of the incident shock energy is reflected back (“r”) into the medium 1 (left of the interface) and the remainder of it is transmitted (“t”) into the medium.
Initially, the gas pressure p0 in both media is constant and uniformly distributed, and p0 = patm. The gas is heated to T01 = 5000 K from the incident shock side of the interface, and to T02 = 10,000 K on the other side. Considering diatomic nitrogen as the medium on both sides, there will be no significant dissociation at this temperature. For the benefit of clarity in the following calculations, the discontinuous interface is chosen as reflecting more efficiently. However, a smooth interface can be readily included in considerations using, for ex., the model [9].
For adiabatic but non-isothermal gas conditions, T01 ≠ T02, the shock refraction equation can be set using the Rankine–Hugoniot relation together with the gas pressure and flow speed continuity conditions across the interface, p1 = p2, u1 = u2, as was done in [10], where u1 and u2 denote the speed of flow in the media 1 and 2, accordingly. The continuous distribution of gas parameters in the post-shock nonequilibrium zone will be described with a set of functions f (x, t), each being specific to the temperature, pressure, density, etc. distributions.
In general, the character of a reflected wave is determined by the temperature step across the interface, the sort of gas, and the degree of molecular dissociation that are included in the parameter:
where γ is the specific heat ratio and μ is the molecular weight on each side of the interface [10]. In most cases, when the parameter θ is substantially larger than the unity, the reflected wave will be a rarefaction wave, and the shock refraction equation relating incident and reflected wave intensities takes the form:
Here, the ratio is the temperature jump across the incident shock, indices i, r, and t denote the incident, reflected, and transmitted waves accordingly, , , are the pressure jumps across the corresponding waves, and the parameter .
In Equation (2), the pressure jump across the incident shock πi (x, t) corresponds to the temperature distribution established on the high-pressure side of the shock during the relaxation period (to be determined). The distribution function fT (x, t) is defined as the current value of the temperature in the zone normalized to its value immediately behind the shock front. Similarly, the pressure distribution is described with a function fP (x, t), and consequently:
where x is the distance from the shock front, πi(0) is the pressure jump in the flow immediately behind the front (at x = 0), and the time t is counted starting from the moment the incident shock strikes the interface. The pressure continuity across the interface:
is the condition that is used to eliminate one of the three variables (pressure ratios) in Equation (1).
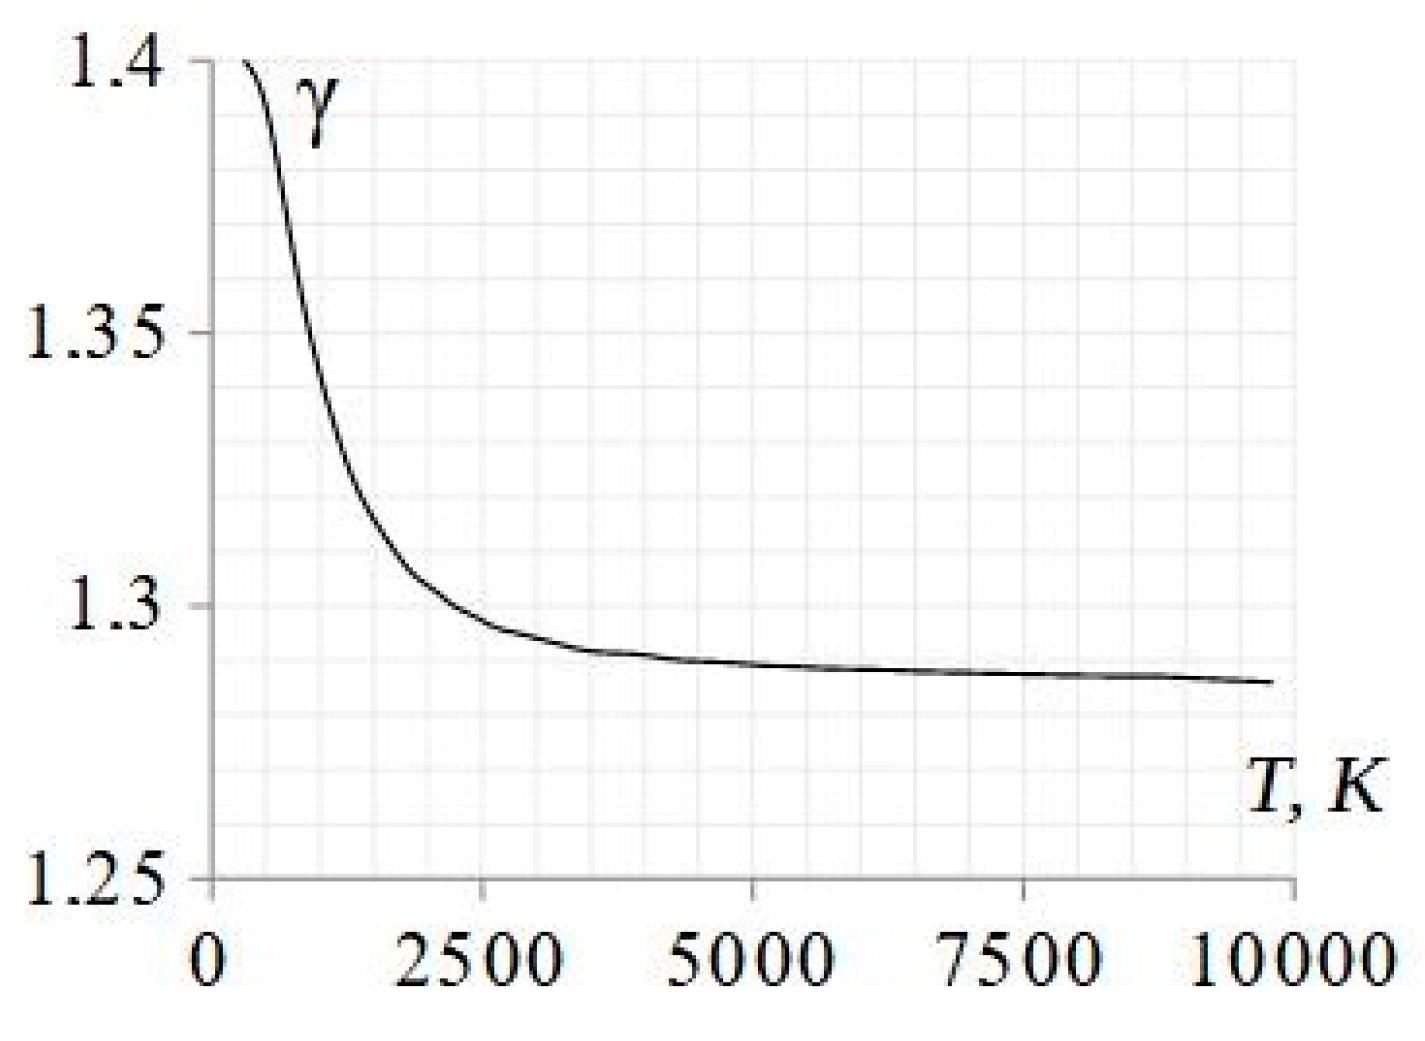
The parameters λ in both media across the interface taken as equal, and λ1 = λ2, can be used to simplify Equation (2). The reason for this is the fact that the specific heat ratio γ in the gas is affected strongly up to approximately 2500 K and then, as the temperature increases to 10,000 K, it has a tendency to saturate at a constant value of approximately γ =1.2860 [16]. Thus, when the gas heating is intense on both sides of the interface, the difference in the parameters becomes insignificant. The graph of Figure 2 illustrating this property is plotted assuming excitation of vibrations only and no dissociation in the gas.
Thus, with equal specific heat ratios, γ1 = γ2, and considering non-dissociating gas, μ1 = μ2, the parameter θ is then reduced to the temperature ratio (the heating strength across the interface).
In the range of temperatures considered here, the real gas effects are significant and can be included using, for ex., the model [10] developed for similar plasma conditions (assuming equilibrium). The approach is based on the use of experimental data in the enthalpy expressions in the form of relaxation length and energy content factors. An alternative and more straightforward way is borrowing the numerical data obtained for the shock jump parameters that were real gas corrected (assuming equilibrium) for non-dissociating diatomic nitrogen at the temperature of 5000 K [10]. Non-ideal gas effects are also included in the speed of sound expressions in the form of a correction factor σ, via , , and . Here, is the temperature distribution function in the relaxation zone past the incident shock front, is the gas temperature in the flow at x = 0, and R is the universal gas constant. In accordance to [16], the real gas processes also affect the reflectivity of a discontinuous plane shock front (x = 0) and the conditions determining the character of the reflected wave.
In a gas with a state displaced from equilibrium by almost instant compression in the shock, it takes typically a few collisions to establish a new equilibrium for translational and rotational degrees of freedom, and up to thousands for slower degrees, such as vibration and dissociation. Thus, the gas state in the flow immediately behind the shock front, where the translational equilibrium has been established almost instantly while the population levels of the slower modes are still negligible, is in equilibrium. Therefore, in Equations (2) and (3), the real gas corrected data in [10] can be borrowed to determine parameter jumps , , and for the incident shock at the location x = 0.
3. Flow Parameter Profiles in the Relaxation Zone of the Incident Shock
The solution for the pressure jump πr (x, t) in Equation (2) requires known parameter distribution functions in the relaxation zone of the incident shock, fT (x, t) and fP (x, t). To determine fT (x, t), the approach [13] developed for a plain shock of moderate to strong intensities propagating free in a uniformly heated medium can be utilized. The model is based on experimental data used in the enthalpy expressions via the active and inert components of the energy content factors and taken on both sides of the front. Assuming that the gas in front of the incident shock is in equilibrium, the enthalpy , and a similar expression holds for the inert component, in the gas experiencing nonequilibrium relaxation. Then, the temperature distribution Tx1 in the nonequilibrium zone in the flow behind the shock is obtained by integrating the following expression:
where the temperature jumps across the shock, is the temperature in the nonequilibrium zone at a current location x normalized to the value of T1, and, in front of the shock, 0 < x < λT, λT is the relaxation zone length for the temperature profile. The coefficients δ1 through δ3 and ε1 through ε10 are the functions of the Mach number, incident medium temperature, molecular weight μ, the specific heat ratio γ, the energy content factors and , the correction σ, and the coefficients in the fit function for the relaxation length data. The factor , where h is Plank’s constant, kB is the Boltzmann constant, and ν is the vibrational frequency (cm−1) in the harmonic oscillator mode approximation. The expressions for the coefficients δ and through are given in Appendix A.
The constant of integration c in Equation (5) is determined from the boundary condition at the location immediately behind the shock front, at x = 0, , from which . Thus, the temperature distribution in the nonequilibrium zone is the inverse function to the solution .
With the known distribution function , the relaxation length λT can be read from the temperature profile directly, or determined analytically as the distance , where the system reaches its new equilibrium temperature T31 asymptotically (Figure 3).
The integration of the expression (5) yields the following solution:
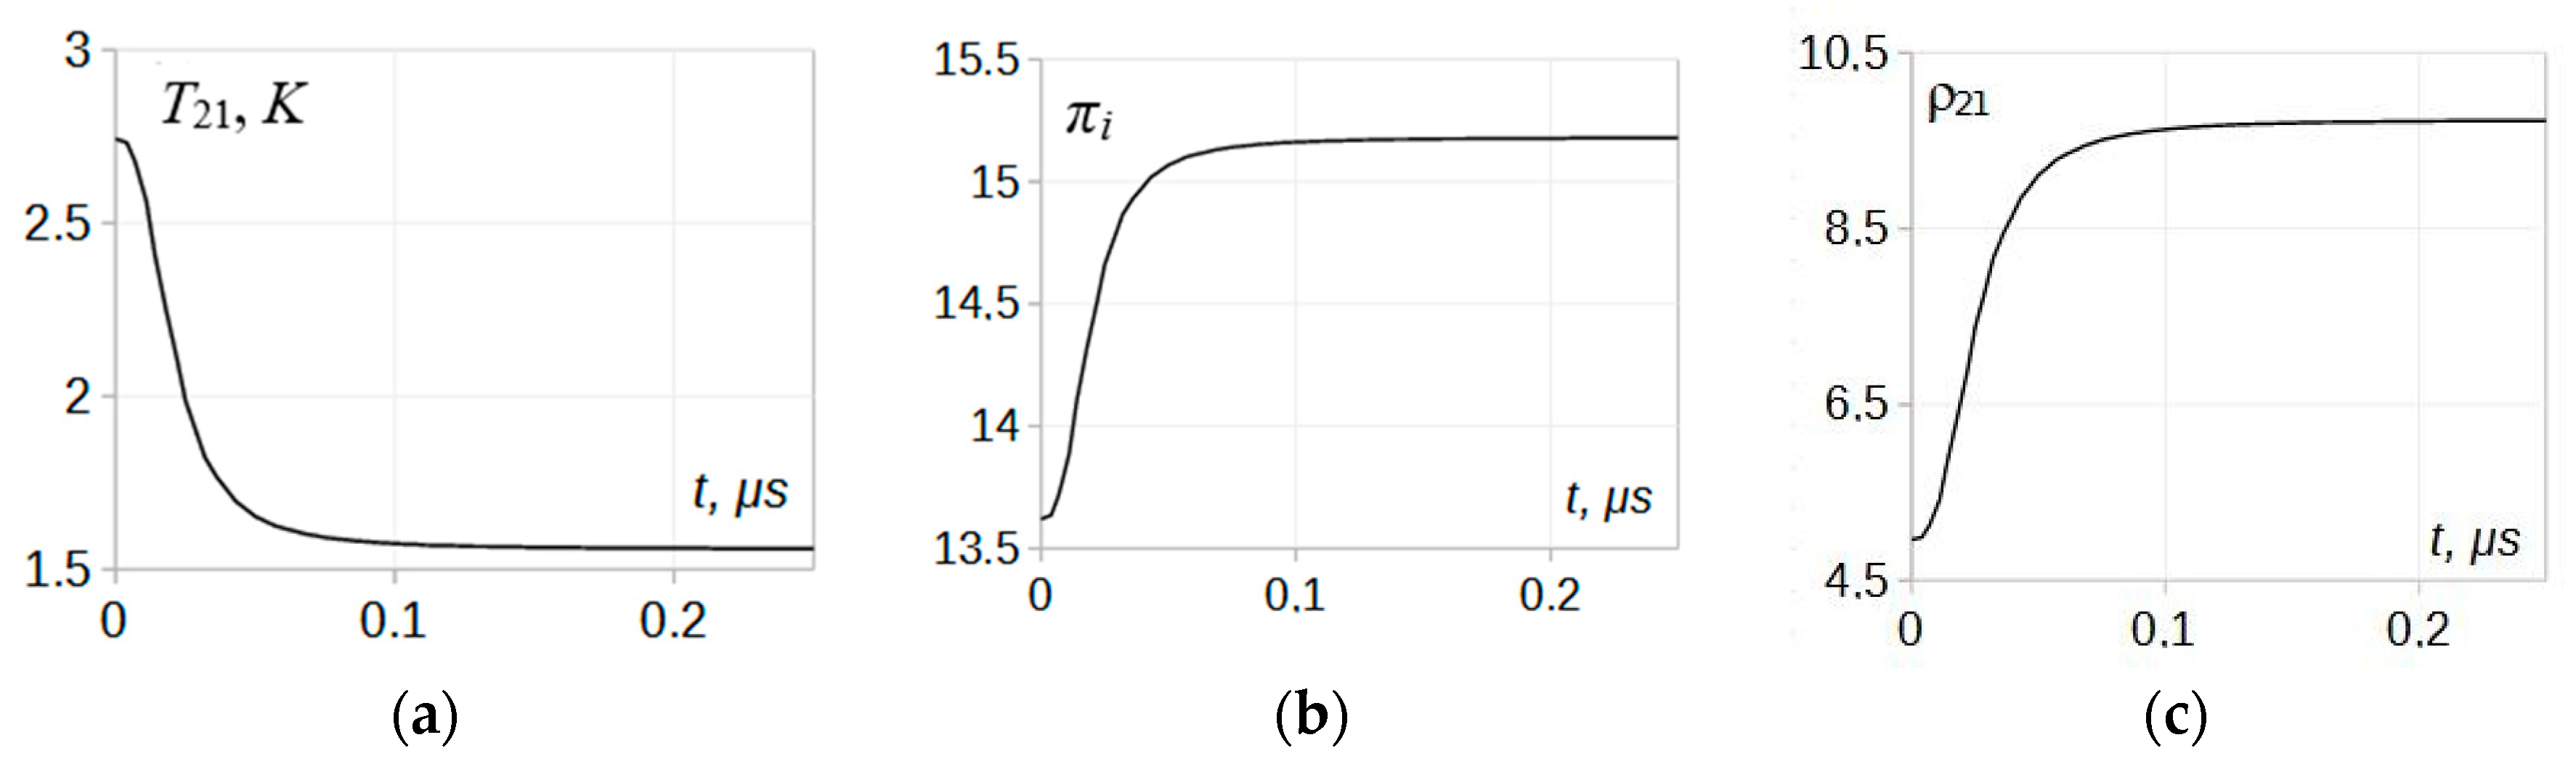
with the coefficients given in Appendix A. Applied to non-dissociating diatomic nitrogen at T1 = 5000 K, Mi = 3.5, and with estimated σ = 0.9204, the solution in Equation (7) takes the form illustrated in Figure 3. The horizontal coordinates of the most left (at x = 0) and right (x = λT) points of the curve give the asymptotic normalized temperatures T21 and T31, accordingly, T21 > T31, and the difference between the point’s vertical coordinates is the length of the relaxation zone λT of 0.0890 cm. In further calculations, for simplicity, the numerical data obtained for the solution in Figure 3 can be closely fitted with a bell-type function, :
where x is in cm.
Using the conservation laws of mass and momentum across the shock, the pressure distribution function can be determined from the temperature distribution (8) via the following relation:
and similarly for the density:
The parameter profiles, first obtained as functions of the coordinate x, can be re-scaled for the time via the shock speed as , and the results are plotted in Figure 3.
As seen in the graphs, the relaxation time in the nonequilibrium zone past the incident shock of Mi = 3.5 in N2 at 5000 K is approximately 0.20 μs, which corresponds to the relaxation length of 0.89 mm.
In the calculations, the integration of Equation (5) was performed analytically using Wolfram Mathematica software, which can also be done numerically, and numerical calculations for the system of Equations (9) and (10) were performed using the Matlab software. The influence of approximations used in the model on its validity and precision will be discussed at the end of paragraph 4, and a number of factors influencing the precision in the derivation of the Equation (5) can be found in reference [13].
4. The Relaxation Dynamics in the Zone during Shock Reflection
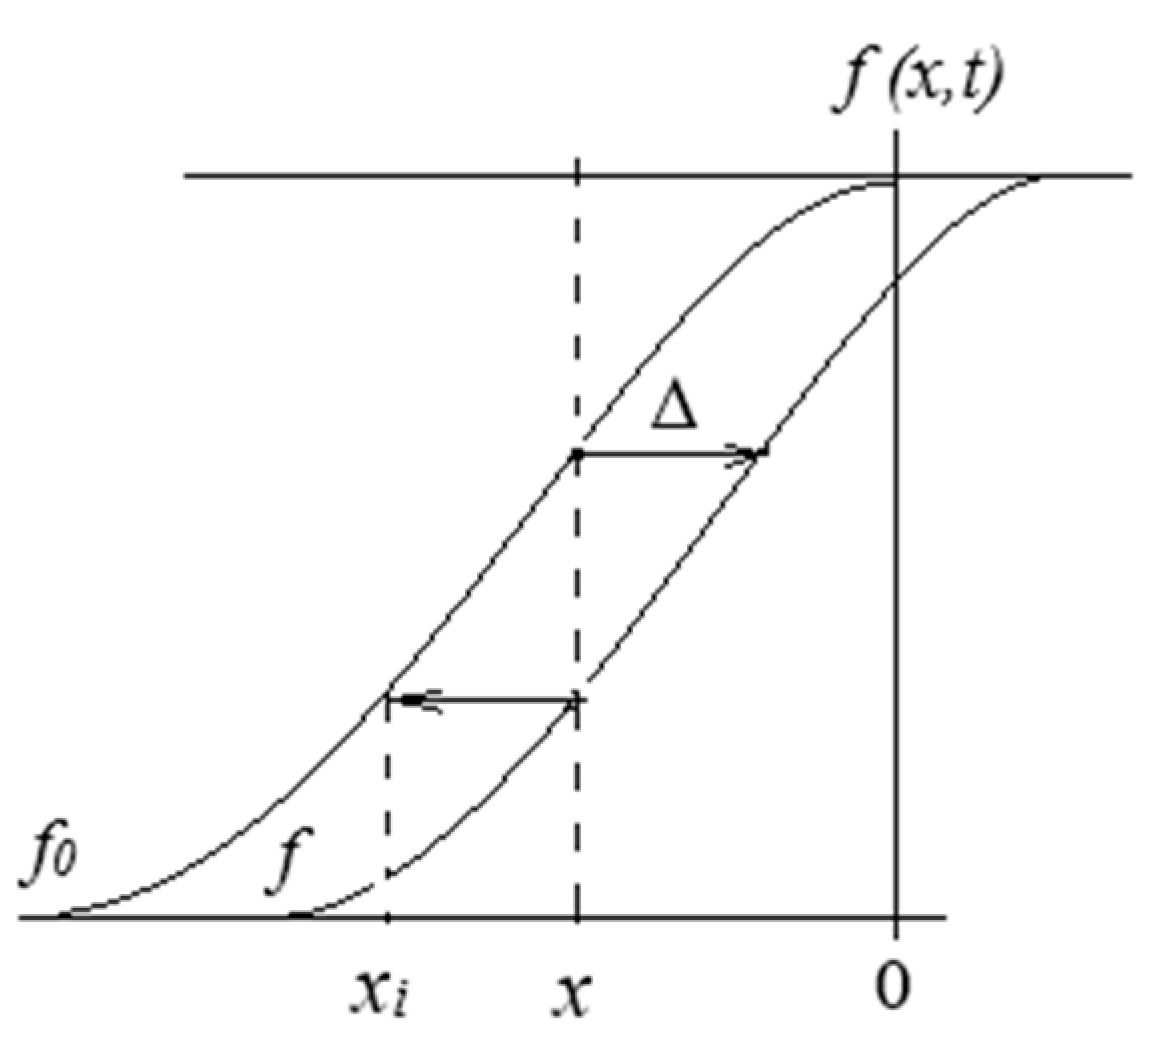
The initial temperature distribution function obtained in the relaxation zone behind a shock propagating free in the incident medium (denoted as f0) is given in terms of a distance x from the front, and is defined up to the moment when the shock front hits the interface. As the front advances into the hotter medium, the continued relaxation in the gas in front of the interface results in the parameter distribution being dependent on the interaction time t. The temporal change of the initial distribution function f0 at the point of reflection is equivalent to its shift to the right with the shock wave speed Vsw at the distance ∆ = Vsw t (Figure 4). As seen in the diagram, at a current time t and a location x within the relaxation layer, the shift results in a transition from the initial function f0(x, t) to that at the distance xi = x + ∆, i.e., f0(x, t) → f(xi, t) = f0(x + ∆, t), thus yielding a new distribution:
Counting the distance x to the left from the origin, as shown in the graph in Figure 4, the value of x at the point of reflection becomes fixed, x = 0, and thus the parameter distribution in the zone is a function of time only, . Then, using this function in the refraction Equation (2), a non-stationary solution for the normalized pressure πr in the reflected wave can be found. The temporal change in the distribution πr occurs during the transitional period , where tλ is the relaxation time. After that, a stationary state corresponding to a new equilibrium established at the end of the relaxation zone in the gas takes place again.
In most of the applications involving the shock–plasma interaction, the state of a transmitted shock is of primary interest, while the reflected portion of the wave is associated with the loss of the shock’s energy. For this case, Equation (2) can be transformed for the transmitted shock distribution πt using the pressure continuity condition (4), or the solution can be obtained from already determined πr utilizing the same continuity condition.
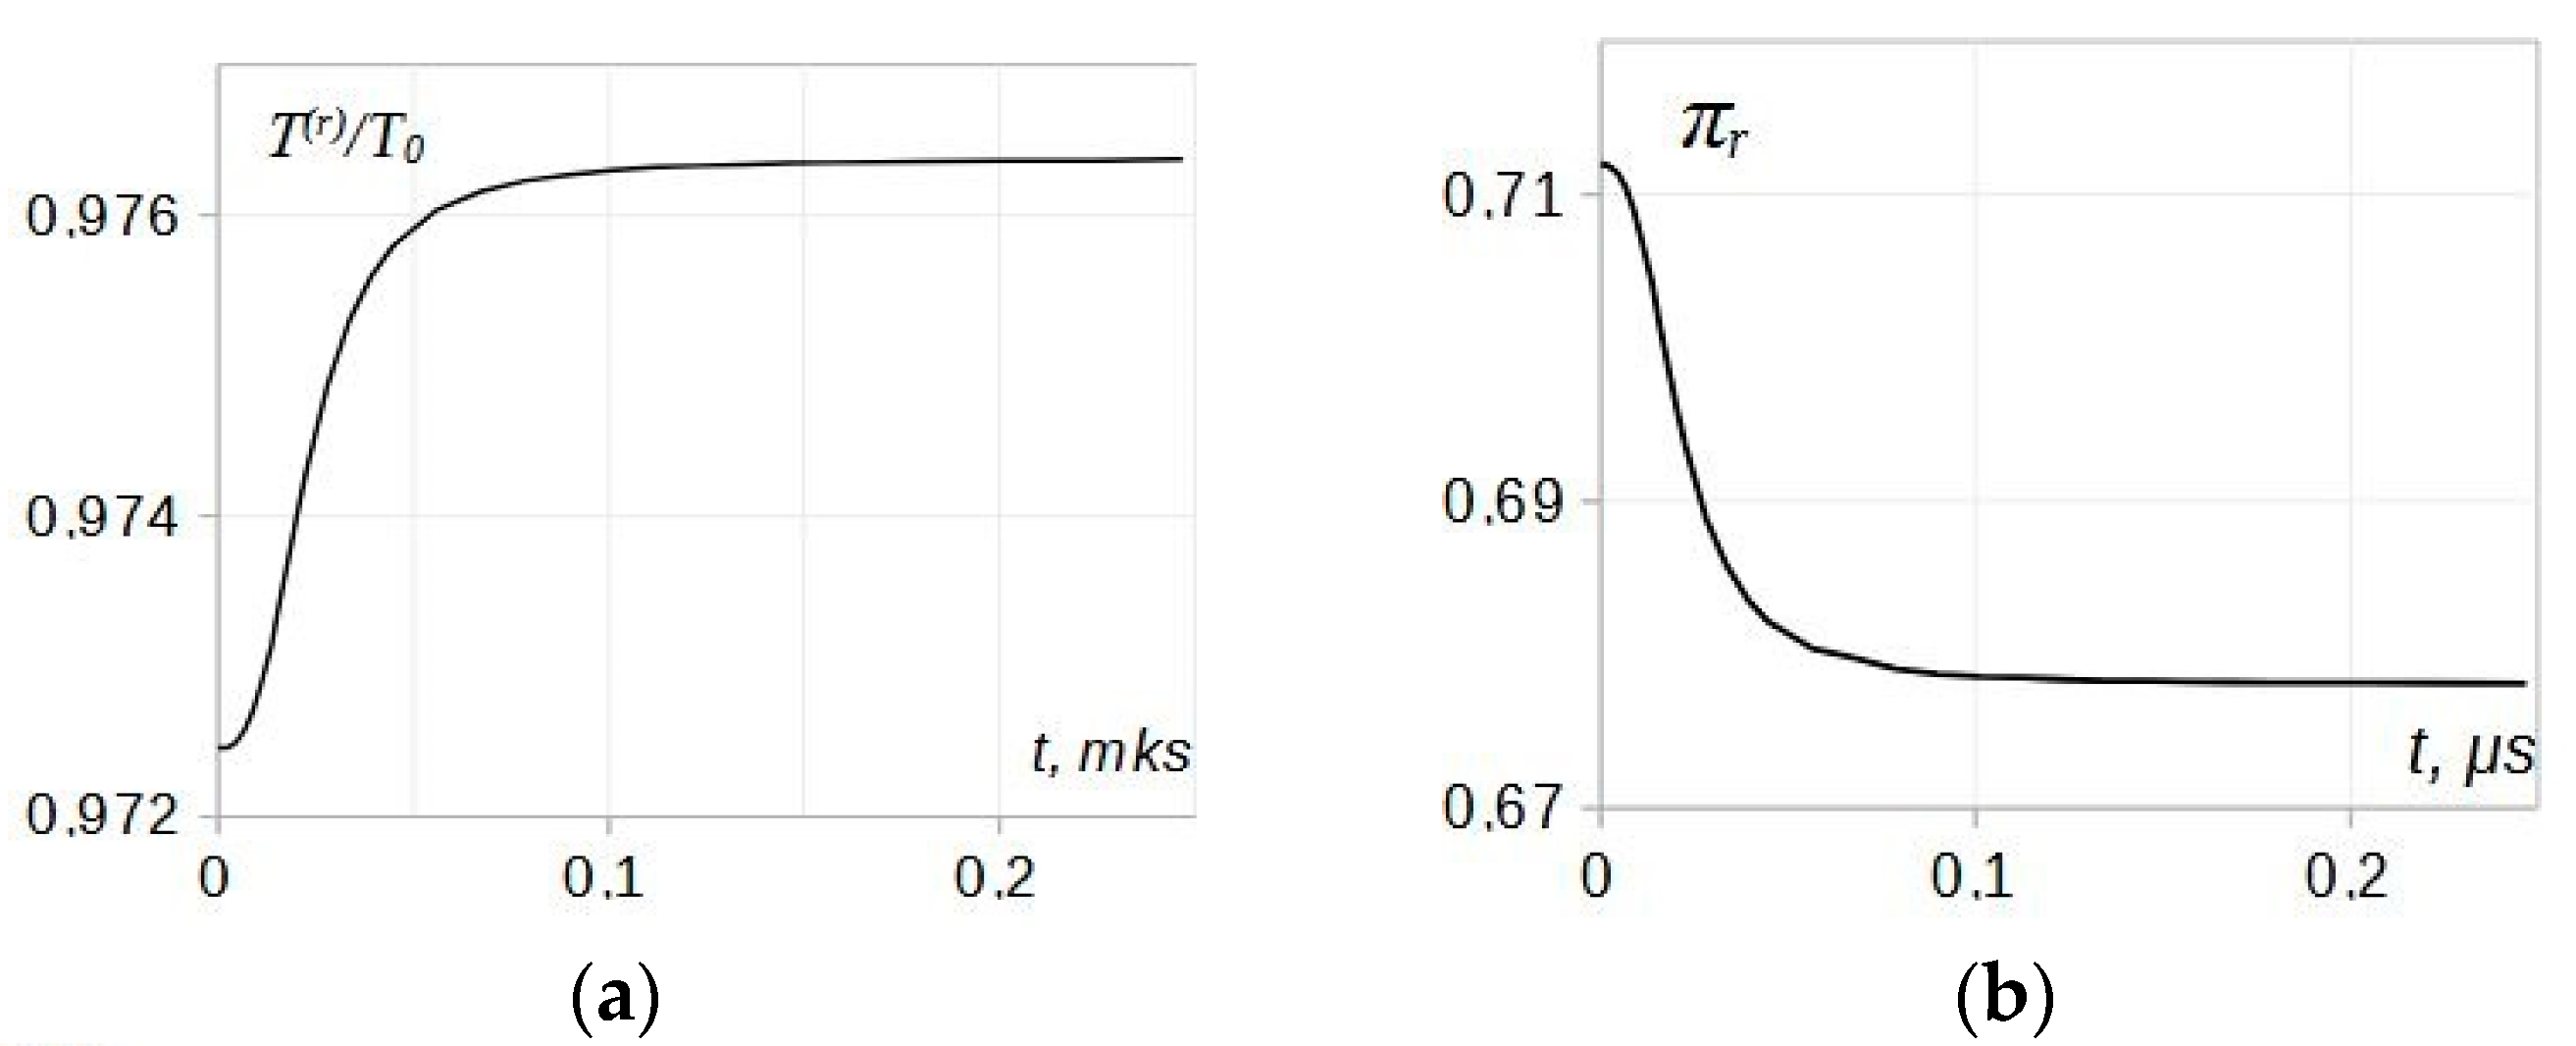
An illustration of the solution to Equation (2) was performed for particular conditions, the shock Mach number Mi = 3.5 in N2 at 5000 K, for which the incident shock temperature profile (5) can be utilized. Numerical results for the flow parameter distribution in the relaxation zones across the head of the rarefaction wave fan (in the reflected wave) and across the front of the transmitted shock are presented in Figure 5. The pressure distribution across the transmitted wave πt is obtained using condition (4) and the temperature distribution T21(t) using relationship (9).
As seen in the graphs, visible modifications in the relaxation zone parameters in both the reflected and transmitted waves take place. Most changes occur for the relaxation time and the relaxation depth values while, in general, the parameter profiles keep the shapes similar to that of the incident wave.
Comparing the data in Figure 5 to the incident shock profiles in Figure 3, significant shortening, around 50%, of the relaxation time in the transmitted wave is seen, along with noticeably smaller differences between the asymptotic temperatures, T21–T31, and pressures, π2–π3, attributable to the relaxation depth.
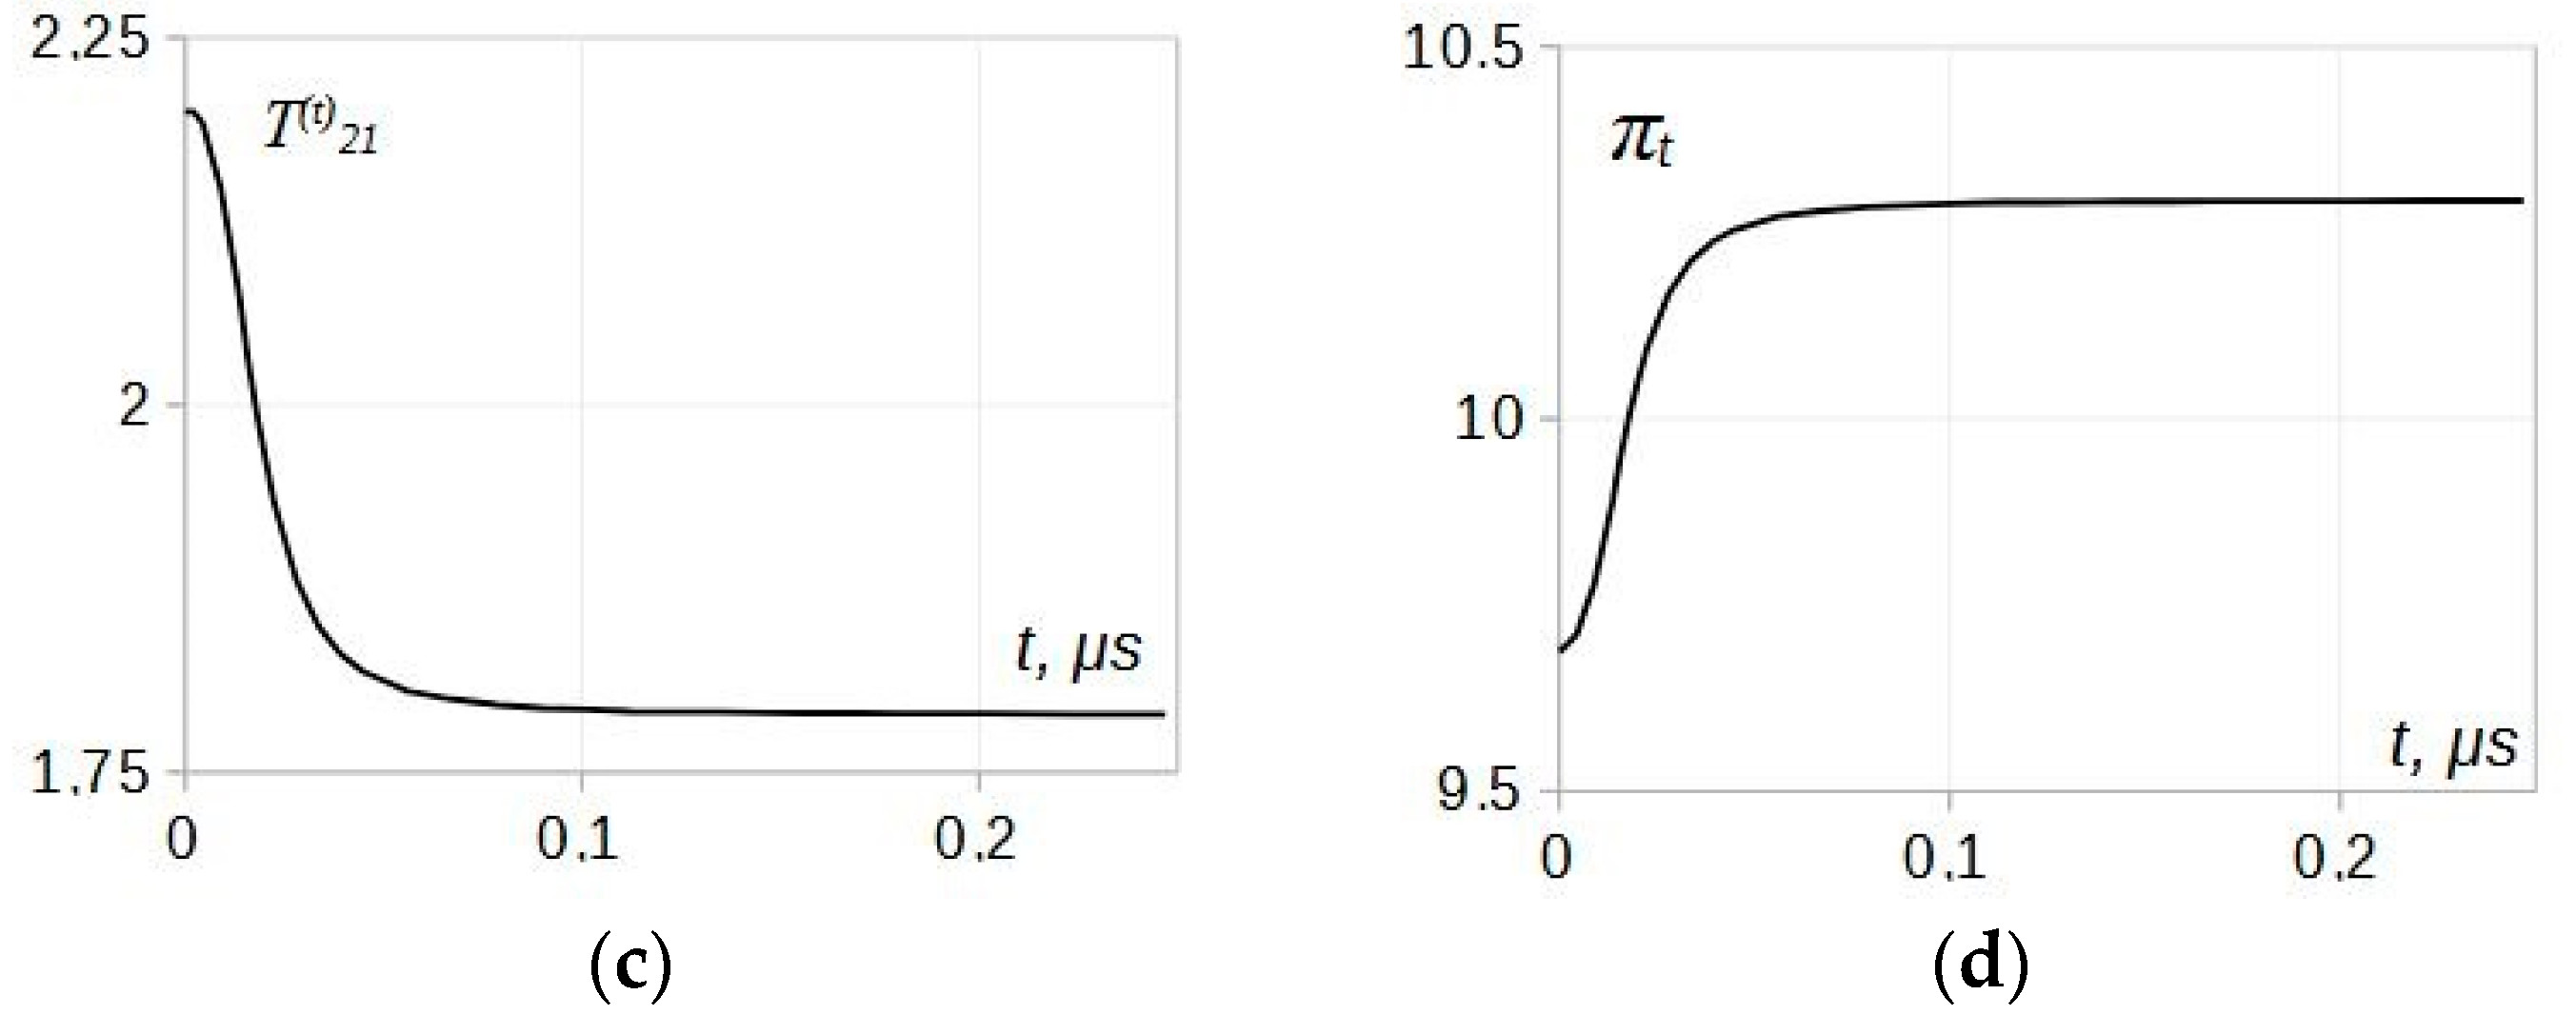
The flow speed distribution u in the relaxation zones of the incident and transmitted shocks can be analyzed considering the mass and momentum conservation laws across the shock and the two continuity conditions across the interface. The expressions for the flow speed can be readily obtained as the functions of the key variable πr. Then for the two waves of interest
In determining the flow parameters inside the relaxation zone of the reflected rarefaction wave, the following simplifications and approximations can be utilized. First, because at the instant of reflection, the incident shock is moving with a constant speed and the transmitted shock’s acceleration caused by the density drop at the interface is virtually instant, the theory of a centered rarefaction wave can be a good approximation. Second, the media extension on both sides of the interface can be assumed here as unlimited. However, the character of the solution will remain valid even though the gas in the incident medium does not extend to the left from the interface to infinity but rather has a boundary at some coordinate x = xb [13]. The presence of such a boundary will not affect the flow until the time when the head of the rarefaction wave reaches the left-hand boundary at the time tb = xb/c0, where c0 is the speed of sound in the media in front of the reflected wave. Then, the model relations are applicable if the relaxation time for the incident shock is shorter than the time tb. In this case, the expression for the flow speed at the head of the expansion fan in the relaxation zone of the reflected rarefaction wave takes the following form:
from which it follows that the flow distribution during the transitional period is determined by the pressure and temperature distributions in the relaxation zones of the reflected and incident waves.
Applying relations (12) and (13) for the same incident flow conditions as in Figure 5, the flow speed distribution for the three waves participating in the interaction can be obtained. A trend similar to that in Figure 5 can be seen by comparing the flow speed profiles of Figure 6 for the incident and transmitted shocks, ui and ut, and that for the rarefaction wave ur at the head of the expansion fan. Similar to the structure typical for the temperature and pressure profiles in Figure 5, the flow speed for both waves emerging on the interface shows reduced relaxation depths compared to that in the incident wave, and most notably, significant shortening of around 20% of the relaxation time in the transmitted wave.
The temperature change in the relaxation zone during the transitional period can be determined using the first Riemann invariant r attributed to a wave of rarefaction, where P is the pressure function, from which:
In relations (14) and (15), the subscript “0” refers to the medium of the rarefaction wave propagation, and the speed of sound is determined using the distribution functions for the flow speed ur and normalized temperature profile in the nonequilibrium zone behind the incident shock fT (x),
where . The classical centered-wave theory is developed for a perfect gas characterized by a constant specific heat and, at the present problem conditions, needs to be corrected for real gas effects. In the derivations, the expressions taken along the J+ characteristics [13] are applied to a gas in any thermodynamic state, but later the correction to the speed of sound value can be done in the expression for the flow speed u. The factor σ in the adjustment includes the specific heat correction due to the temperature, the virial correction takes into account inter-molecular interactions that are the function of temperature and pressure, and the correction accounting for relaxation processes leading to acoustical dispersion is a function of temperature, pressure, and frequency [10].
Using the relations (15) and (16), numerical calculations for the temperature in the relaxation zone at the head of the reflected wave were performed for particular problem conditions, and the results are presented in Figure 5a. According to the data, the relaxation time in the zone of the reflected wave is left unchanged; however, the relaxation depth is significantly decreased, making the wave structure weaker.
For easier comparison of the profile parameters in the relaxation zones for the three waves, all the key characteristics of data in Figure 3a, Figure 5 and Figure 6 are collected in Table 1. Because of the incident shock energy splitting between that in the reflected and transmitted waves, the changes in the zone parameters are considered relative to their corresponding values in the incident wave. Based on the above results, the analysis of the nonequilibrium zone evolution during the interaction will be performed in terms of the relaxation time tλ, and the relaxation depth DT. The latter is defined through the gas parameters at the two ends of the relaxation zone, immediately behind the shock front (index “2”) and at the location where a new state of equilibrium is established (index ”3”). Then, for the extended temperature jump determined by Equation (6)
similarly for the pressure, , and for the flow speed, , each of them being applicable to the incident, reflected, or transmitted waves.
When analyzing the data, the following processes explaining the specifics of relaxation in the gas must be considered. The excitation of vibrations in the gas compressed by the shock wave and an increase in time of the vibrational energy component results in a continuous decrease in the gas temperature across the relaxation zone of the incident wave (DT = 0.432, Table 1 and Figure 3a) and a moderate gas compression (Dp = 0.103, Figure 3b,c), the feature commonly observed in real gases [17]. The effect mostly shows up in the gas density, for which the relaxation depth is almost five times stronger than for the pressure (0.103 vs. 0.490 accordingly), and similar to that for the temperature. The additional compression built up across the zone drives an increase in the flow speed ui with time (0.061), in a degree comparable to that for the pressure. The relaxation time of around 0.150 μs is common for all three gas parameters.
In the reflected rarefaction wave, the “compression” in the zone across the head of the expansion fan, which is the inverse to πr, also increases with time (Dπ(i) = 0.048), thus fortifying the wave, along with a very slight decrease in the temperature (DT(r) = 0.004). A stronger effect on the flow speed ur (Du(r) = 0.141) is the result of an increase in time compression in the zone acting in the same direction as the motion of the gas flow within the rarefaction wave structure.
For the transmitted wave, overall, the parameter distributions in its relaxation zone follows that in the incident wave, however the relaxation proceeds in somewhat weaker degree. A slower temperature decrease with time (Dt = 0.186 vs. 0.432) resulting in additional weaker compression in the zone (Dp = 0.059 vs. 0.103) drives the flow speed acceleration (Du = 0.038 vs. 0.061). Another remarkable effect on relaxation in the transmitted wave is significantly reduced, by 20 to 50%, relaxation times in the profiles (120–100 μs vs 150 μs). However, accounting for acceleration of the transmitted shock in the hotter gas, the relaxation length in this medium makes up its original value in the zone of the incident wave.
In a discussion of the applicability of the assumptions used in the derivation of the model relationships, the following factors must be taken into consideration. First, at moderately elevated temperatures and atmospheric pressure, it is supposed that the rotational equilibrium in a gas is established almost instantly and simultaneously with the translational degrees of freedom, which is typically followed by vibrations, then dissociation, and finally by ionization as the temperature increases. However, there is evidence that under the condition of significantly lowered pressure, for ex., during a hyperbolic reentry into Earth’s atmosphere (ambient pressure of 0.1 Torr, room temperature, and the shock speed around 10 km/s), the rotational and vibrational relaxation rates can become comparable and thus the rotations can come into equilibrium with vibrations simultaneously [13]. Consequently, in determining the temperature distribution in the relaxation layer, the assumption of equilibrium between rotational and translational energy modes may not always be made.
Second, in case the molecular vibrations are excited in a gas to a significant degree, the relaxation zone length is an increasing function of the shock strength (Mach number). Note that such behavior is qualitatively different from that common for a monatonic gas, where only viscosity and thermal conductivity contribute. In the absence of slow excitation processes, such as vibrations or dissociation, only irreversible conversion of the directed motion of gas into heat is present. This results in the shock width being a decreasing function of the Mach number via , where l is the molecular free path, tending to zero at large M [7]. Conversely, within the extended structure of a shock in a diatomic gas, dissipative processes such as viscosity or heat conduction can be neglected because the mass and heat fluxes are dependent on the gradients of the flow speed, , and that of gas temperature, , accordingly, and thus cannot contribute substantially.
A number of additional limitations must be imposed on the model at the conditions common for plasma and for very strong shocks when the heat exchange mechanisms, such as radiative heat transfer and electron heat conduction [7], must be included. In this case, the radiation and radiation heat transfer will contribute in addition to the kinetic mechanisms, such as viscosity and vibrations, ∆xkinetic = ∆xvisc + ∆xvib, ∆xvisc << ∆xvib. The shock width ∆x is then determined by dominating process depending on the temperature and thermodynamic properties of a specific gas or mixture, ∆x = ∆xvisc + ∆xvib, + ∆xrad, usually with ∆xkin << ∆xrad. The resonant radiation transfer that is typically present in partially ionized gases at elevated pressure, especially in the presence of strong density gradients, can contribute via an increase in the density of electronically excited atoms [18].
In strong explosions generating intensive shocks, when significant radiation from heated regions adds up to the sources of losses, the rate of radiative cooling becomes comparable to the rates of adiabatic cooling due to gas expansion. Because of significant optical transparency to radiation common for colder plasmas, the temperature profiles across the shock acquire a characteristic bump due “preheating” of the medium in front of the shock. On the high-pressure side of the shock, if the temperature reaches its “cooling” value at some point in the relaxation zone, the temperature profiles will undergo additional distortions caused by the propagation of the cooling waves [7]. Then, the applicability of the model in this work can be decided by analyzing whether the mentioned rates are compatible with the continuity conditions used in the derivation of the refraction in Equation (5).
5. Extension of the Model into a Wider Range of Parameters
The dynamics in the relaxation zone parameter distribution during the transitional period have been demonstrated here for specific plasma and shock conditions, assuming fixed values of the incident shock intensity and the heating strength across the interface. To explore for possible tendencies or limitations in the relaxation parameter behavior, the model relationships can be analyzed by their variation with the two parameters. First, by varying the heating strength θ within a small interval of temperatures T02, the temporal profiles of pressure ratio πr can be calculated. In the absence of significant dissociation and the heat capacity ratios being close to equal, γ1 ≈ γ2, θ is reduced to the initial gas temperature ratio, θ = T02/T01. If keeping the incident shock Mach number fixed, the extended structure of the incident wave (5) will not change. Then, the pressure jump in the reflected portion of the wave will be described with the same relation (2), but now in the interval of θ values. The key variable in the calculations, πr, then can be used to determine all the remaining variables for the reflected and transmitted waves using relations (9), (12), (13) and (15).
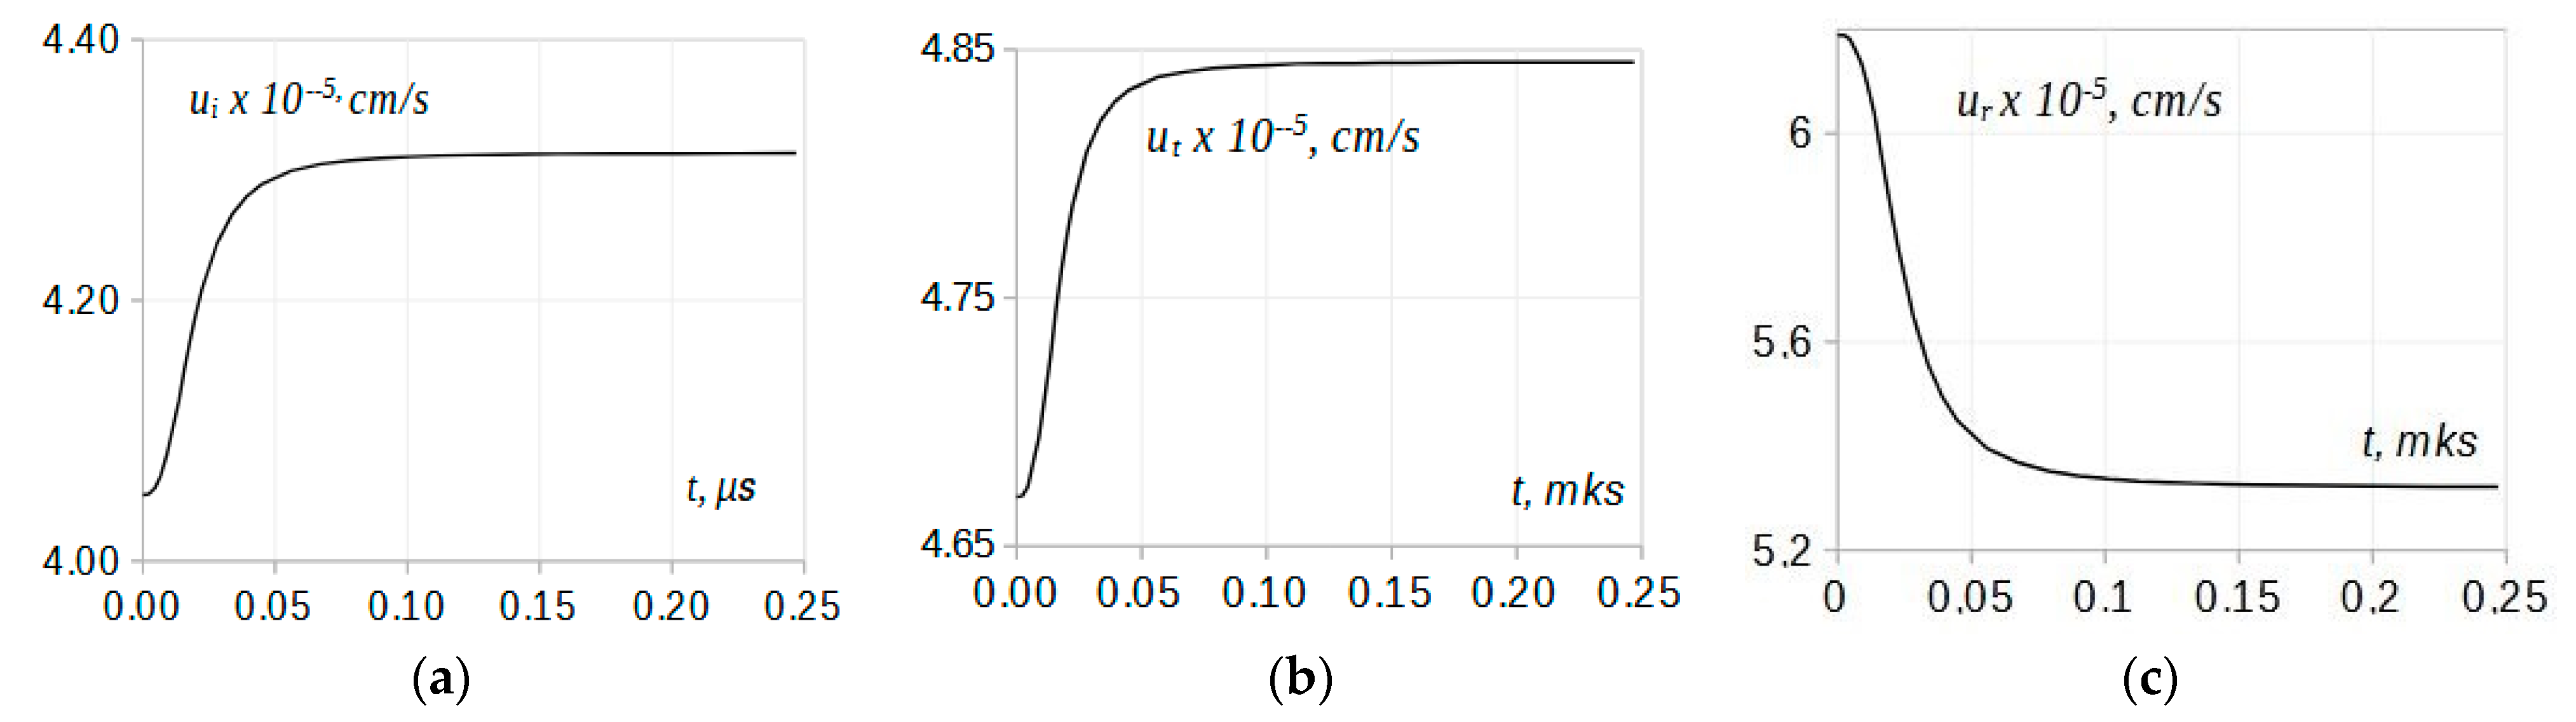
In Figure 7a, numerical results for the pressure jump πr are plotted vs. the parameter θ. Each curve corresponds to a different coordinate x within the relaxation zone, from x = 0 to x = 0.025 cm, through equal intervals of 0.005 cm. The coordinate x increases from the upper to the lower curve. In another plot, Figure 7b, the temporal profiles for πr are plotted for a number of θ values, between 1.0 and 2.6 through the equal interval of 0.2. The parameter θ increases from the upper curve to the lower curve.
It is evident that increasing the heating strength between 1 and 2.6 results in a stronger reflected wave, as seen in Figure 7a, and deeper relaxation in the nonequilibrium zone, while keeping the profile shapes quite similar (Figure 7b). The increase in the reflected wave intensity with the parameter θ is nonlinear, quickly approaching saturation at larger values of θ (Figure 7b). Note that the curves πr (θ) converge at the same point at θ = 1 thus confirming that, in the absence of sizable difference in the heat capacity ratios and insignificant dissociation in the gas during the transitional period, no any shift in the transition point determining the character of the reflected wave is produced. The shifts are not large naturally and become noticeable in real gases when there is a significant difference in the gas temperatures across the interface resulting in a diversion in the gas properties [9,16].
For stronger shock waves, the model can be analyzed by varying its relations with Mach number Mi, while keeping the parameter θ fixed. The procedure can be split into two parts.
First, the relaxation zone structure of the incident shock is dependent on the Mach number, in accordance with Equations (5), (6) and (9). Thus, the analysis of the reflection dynamics should account for not only stronger shocks but also that of different structures.
Another consequence of the shock strength (Mach number) is the dependence of shock reflectivity (or transmission) on this factor [9]. This property was explored for a discontinuous shock front, and thus the results of this study can be borrowed for estimation of the reflected and transmitted wave intensities immediately behind the shock front (at x = 0, t = 0). Once the state of the gas at this location is determined, the structure of the whole relaxation zone can be re-constructed using relationships (2), (4), (9), (12), (13), (15) and (16). Besides, in the context of this research, the incident shock structure is just an initial condition, the subject to the initial gas temperature in the incident medium, T01, and Mi, and thus all the changes during the transitional period are considered relative to that in the incident wave. Thus the processes of formation of the shock structure and reflection, being independent of each other, can be considered separately.
Therefore, the main effort can be focused on exploring the shock reflectivity vs. Mi to determine the reflected and transmitted wave intensities at x = 0, and then the extension zone profile can be reconstructed using the method described above. For this, first, the transcendental Equation (2) can be analyzed to find a solution for πr (Mi, θ, x = 0) as a function of the incident Mach number (with θ as a fixed parameter), and then for the transmitted shock strength πt (Mi, θ, x = 0), with the quantities defined as the reflection and transmission coefficients, accordingly:
{r = π (Mi, θ)/πi(Mi, θ), t = πt (Mi, θ)/πi(Mi, θ), x = 0}
In an analytical form, the relation can be obtained by first differentiating Equation (2) with respect to the incident Mach number (assuming x = 0), from which we obtain the differential equation that can be solved for πr as a function of the Mach number.
Here the coefficients υ0, υ1, υ3, υ4, υ5, and υ6 are the functions of Mi, θ, and λ, and their expressions are given in Appendix A. A similar equation can be obtained for πt (Mi, θ, x = 0) using the differential Equation (19), the transformation relation between the variables, and condition (4), where πi (x = 0) is a known function of Mi. Alternatively, if a solution for πr (Mi, θ, x = 0) is obtained first, then the function πt (Mi, θ, x = 0) is determined directly from the condition (4):
For the purpose of illustrating how efficiently a thermal discontinuity reflects a shock of increasing intensity, the differential Equation (19) was solved numerically and the results are shown in Figure 8.
It is seen in the graph that the reflected wave intensity [πr (x = 0)]−1 first quickly increases with the Mach number and then saturates at the value of 1/πr ≈ 1.54 after the Mach number reaches Mi = 10. Accounting for a simultaneous and quick increase in the pressure jump across the incident shock πi (Mi, x = 0) with Mi, the shock reflectivity r = πr(Mi, θ)/πi(Mi, θ) diminishes to negligible values. Thus, at the interface with a fixed value of θ, the increase in the shock Mach number results in diminishing relative losses due to reflection. The results are not surprising since in this case, the internal energy in the gas due to heating across the interface becomes less and less comparable to the work done by compression in the incident shock of increasing strength. Similarly, for the transmission coefficient , the conclusions reciprocal to the above can be made by applying relationship (4), from which it follows that stronger shocks transmit interfaces more effectively.
6. Summary and Conclusions
Looking into the refraction of a structured shock wave on a plasma interface revealed remarkable dynamics in the nonequilibrium relaxation in the flow past the two waves, the reflected and transmitted ones, resulting from the interaction. The investigation was limited to a plane shock front of a finite width normally incident at a plane discontinuous thermal (or rarefaction) discontinuity. The plane-to-plane geometry allows separating the effects of curvature [15], and thus all the changes in the relaxation zone of the waves can be attributable to the basic processes of shock reflection and transmission only. The sort of gas (N2) and elevated temperatures on both sides of the interface (5000 K and 10,000 K) were the conditions enabling noticeable excitation of molecular vibrations, while the dissociation term levels were still insignificant. A much slower relaxation rate for vibrations relative to that for the active degrees of freedom results in the delay in establishing the equilibrium in the gas past the shock front, leading to a relaxation zone of significant width with a continuous distribution of the parameters inside of it.
The purpose of this work was to determine the character of changes in the relaxation zone parameters across the transmitted shock and at the head of the expansion fan in the reflected rarefaction wave relative to the initial distribution in the relaxation zone of the incident wave. The dynamics in the parameter distribution in the flow past the two waves were studied during a transitional period limited by the time of nonequilibrium relaxation in the flow behind the incident shock front. After that, the post-shock flow achieves a new state of equilibrium, and the temporal changes cease to exit. The shock refraction equation derived for a plane and discontinuous geometry of interaction was modified to apply to a shock of an extended structure. An example with a shock of fixed intensity and a fixed level of significant heating across the interface was used to probe the effect. An analysis for an extended range of values of the shock strengths and gas heating across the interface was presented.
Numerical calculations showed that modifications of the wave’s structure are mainly seen in the relaxation time and relaxation depth, both of them being determined by the parameters of the new state of equilibrium established at the end of the relaxation zone. The effects can be understood considering the dynamics in the zone parameter distribution behind the incident shock and the reflected rarefaction wave simultaneously, as the reflected wave propagates through the gas of continuously changing parameters in the relaxation zone of the incident wave. In the reflected rarefaction wave, the compression in the zone across the head of the expansion fan increases with time, similarly to that in the incident shock front, thus fortifying the reflected wave with time. A similar but stronger effect on the flow speed is the result of an increasing with time compression in the relaxation zone of the reflected wave acting in the same direction with the motion of the gas in the rarefaction wave. The relaxation depth in the zone is found to be approximately twice as weak compared to that in the incident wave, thus making the structure of the reflected wave less pronounced.
For the transmitted shock wave, the structure of the relaxation zone is similar to that of the incident wave, but with the strength weaker to some degree. A slower temperature decrease with time, compared to that in the incident wave, accompanied by an additional weaker compression in the zone, drives the flow speed acceleration. Overall, the reduction in the relaxation depth and relaxation times result in weakened structures for both the reflected and transmitted waves.
The most remarkable effect on the relaxation in the transmitted shock wave is seen in significantly reduced, by 20 to 50%, relaxation times. However, due to the higher speed of the transmitted shock in the medium of temperature T02, the relaxation length makes up its original value for the incident shock. Thus, if the transmitted shock structure is registered in experiments in terms of time, the shortening of the relaxation zone, along with a lower contrast level (reduced relaxation depths) the structure will be displayed as being significantly less pronounced. However measuring the structure in terms of distance may not show a visible difference, except for the intensity. After the transitional period limited with the incident shock relaxation time, the gas state past the transmitted wave will be adjusted accordingly to the new temperature of the medium and can be determined with the relations (5)–(9), the experimental data for the energy content factors , , and the corresponding factor σ.
An extension of the model into a wider range of parameters was done by varying the analytical expressions with the incident shock Mach number and the parameter θ determining the jump in the initial gas state on both sides of the interface. Due to specific gas conditions considered here, the parameter θ is reduced to the initial gas temperature ratio, . However, all the conclusions of this work were made for the parameter θ in general, and thus they can be extended to include the effects of dissociation and specific gas properties that are characterized by differences in molecular weights and specific heat ratios across the interface, in accordance with definition (1). In this part of the investigation, the main attention was focused on the reflectivity of stronger shocks interacting with thermal discontinuities of variable heating intensities. Variation in the structure of a free propagating shock with Mach number and gas temperature, the factor accompanying the problem of the interaction, has been investigated in the previous research, and thus can be considered separately. The effect of increasing heating intensity θ is a stronger reflected wave and a deeper relaxation, with no visible effect on the shapes of the parameter profiles in the relaxation zone. The increase in the reflected wave intensity is nonlinear and quickly approaches saturation at larger values of θ. For stronger shocks at fixed values of θ, their reflectivity quickly tends to negligible levels as the Mach number Mi increases. Thus, attenuation of stronger shocks by means of reflection becomes less efficient.
The results of this work are in good agreement with the findings of numerical investigation [14], which studied the effect of molecular vibrations and gas rarefaction on the hypersonic flow of diatomic nitrogen gas of Mach 8 over a 2D cylinder. In the equations, the effects of rarefaction were introduced via the Knudsen number and the modified Rayleigh–Onsager dissipation function that includes both the rarefaction factor and vibrational energies. The results confirmed that the vibrational degrees of freedom and rarefaction conditions affect both the shock structure and the hypersonic flow, contributing to the reduction in static temperature and velocity behind the bow shock and a significant increase in the shock width. The inclusion of vibrational energy term significantly suppresses the dissipation due to lower temperature, and the heat flux increases in rarefied conditions. In the aerothermodynamic flight test, the effects became noticeable from altitudes above 50 km.
The findings of this work may be useful in the areas of research involving strong shocks interacting with optical discharges or other intensively heated media where the shock structure must be included into consideration.
Funding
This research received no external funding.
Conflicts of Interest
The authors declare no conflict of interest.
Appendix A
Appendix A.1
The expressions for the coefficients and appearing in Equations (5) and (6).
Appendix A.2
The coefficients used in Equation (7).
Appendix A.3
The coefficients υ0, υ1, υ3, υ4, υ5, and υ6 appearing in Equation (19).
References
- Bushnell, D.M. Shock Wave Drag Reduction. Annu. Rev. Fluid Mech. 2004, 36, 81–96. [Google Scholar] [CrossRef]
- Kremeyer, K.P. Energy Deposition I: Applications to Revolutionize High Speed Flight and Flow Control. In Proceedings of the 20th AIAA International Space Planes and Hypersonic Systems and Technologies Conference, Glasgow, Scotland, 6–9 July 2015. [Google Scholar] [CrossRef]
- Kianvashrad, N.; Knight, D. Interaction of energy discharge and hypersonic vehicle. In Proceedings of the 8th European Conference for Aeronautics and Aerospace Sciences, Madrid, Spain, 1–4 July 2019. [Google Scholar]
- Sohbatzadeh, F.; Mehdipoor, M.; Mirzanedjhad, S. Theoretical investigation of supersonic flow control by non-thermal Dc discharg. Shock Waves 2018, 29, 415–426. [Google Scholar] [CrossRef]
- Thomas, G.; Bambrey, R.; Brown, C. Experimental observations of flame acceleration and transition to detonation following shock-flame interaction. Combust. Theory Model. 2001, 5, 573–594. [Google Scholar] [CrossRef]
- Mandal, L.; Roy, S.; Khan, M.; Roychoudhury, R. Shock Induced Symmetric Compression in a Spherical Target. J. Mod. Phys. 2015, 6, 1769–1775. [Google Scholar] [CrossRef] [Green Version]
- Zel, Y.B.; Raizer, Y.P. Physics of Shock Waves and High-Temperature Hydrodynamic Phenomena, V.2; Academic Press: New York, NY, USA; London, UK, 1967. [Google Scholar]
- Bethe, H.A.; Teller, E. Deviations from Thermal Equilibrium in Shock Waves; Engineering Research Institute, Univ. of Michigan: Ann Arbor, MI, USA, 1961. [Google Scholar]
- Patterson, S. The reflection of a shock wave on a gaseous interface. Proc. Phys. Soc. 1948, 61, 119–121. [Google Scholar] [CrossRef]
- Markhotok, A. Cumulative energy effect in the shock-discontinuity interaction under real-gas conditions. Appl. Energy Combust. Sci. 2021, 7, 100036. [Google Scholar] [CrossRef]
- Markhotok, A.; Popovic, S. Shock wave refraction enhancing conditions on an extended interface. Phys. Plasmas 2013, 20, 043506. [Google Scholar] [CrossRef]
- Markhotok, A. Wave Drag Modification in the Presence of Discharges. In Aerodynamics; Chapter in “Compressible flows and shock waves”; IntechOpen: London, UK, 2019. [Google Scholar] [CrossRef] [Green Version]
- Panesi, M.; Munafò, A.; Magin, T.E.; Jaffe, R.L. Nonequilibrium shock-heated nitrogen flows using a rovibrational state-to-state method. Phys. Rev. E 2014, 90, 013009. [Google Scholar] [CrossRef] [PubMed]
- Sreekala, V.A.; Chourushi, T.; Sengupta, B.; Myong, R.S. Effects of bulk viscosity, vibrational energy, and rarefaction on flow and vorticity fields around simple bodies at hypersonic speeds. In Proceedings of the AIAA SCITECH 2022 Forum, San Diego, CA, USA, 3–7 January 2022. [Google Scholar] [CrossRef]
- Markhotok, A. Nonequilibrium Factor in the Structure of a Curved Shock Wave Refracted Into an Intensively Heated Medi-um. IEEE Trans. Plasma Sci. 2022, 50, 596–608. [Google Scholar] [CrossRef]
- Markhotok, A. The Effect of Gas Nonideality on the Interface Reflectivity When Interacting With a Shock Wave. IEEE Trans. Plasma Sci. 2020, 48, 3759–3767. [Google Scholar] [CrossRef]
- Zuckerwar, A.J. Handbook of the Speed of Sound in Real Gases, V.1 Theory; Academic Press: New York, NY, USA, 2002. [Google Scholar]
- Popović, S.; Markhotok, A.; Brooke, G.; Vušković, L. Resonant Radiation Transfer in Partially Ionized Neon. In American Physical Society 2002 Division of Atomic, Molecular and Optical Physics Meeting Abstracts; The SAO/NASA Astrophysics Data System: Cambridge, MA, USA, 2002; p. J6-024. [Google Scholar]
Figure 1.
On the space–time diagram, a plane shock of an extended structure (“i”) incident normally on a plane interface (dashed line), from left to right, is partially reflected (“r”) and partially transmitted (“t”) into the media of higher temperature T02.
Figure 1.
On the space–time diagram, a plane shock of an extended structure (“i”) incident normally on a plane interface (dashed line), from left to right, is partially reflected (“r”) and partially transmitted (“t”) into the media of higher temperature T02.

Figure 2.
The specific heat ratio γ vs. gas temperature in non-dissociating nitrogen gas.

Figure 3.
The temperature (a), pressure (b), and density (c) temporal profiles in the relaxation zone of the incident shock. Diatomic nitrogen at 5000 K, Mi = 3.5.
Figure 3.
The temperature (a), pressure (b), and density (c) temporal profiles in the relaxation zone of the incident shock. Diatomic nitrogen at 5000 K, Mi = 3.5.

Figure 4.
Temporal change of the distribution function at the point of reflection (x = 0). The shock is moving from left to right.
Figure 4.
Temporal change of the distribution function at the point of reflection (x = 0). The shock is moving from left to right.

Figure 5.
Flow parameter distribution in the relaxation zone across reflected (a,b) and transmitted (c,d) waves. Mi = 3.5. Incident medium is non-dissociating N2 at 5000 K.
Figure 5.
Flow parameter distribution in the relaxation zone across reflected (a,b) and transmitted (c,d) waves. Mi = 3.5. Incident medium is non-dissociating N2 at 5000 K.


Figure 6.
The flow speed distribution in the transitional layer across the incident shock, (a) ui, the transmitted shock, (b) ut, and at the head of the expansion fan of the rarefaction waves (c) ur. Mi = 3.5, incident medium is non-dissociating N2 at 5000 K.
Figure 6.
The flow speed distribution in the transitional layer across the incident shock, (a) ui, the transmitted shock, (b) ut, and at the head of the expansion fan of the rarefaction waves (c) ur. Mi = 3.5, incident medium is non-dissociating N2 at 5000 K.

Figure 7.
(a) The pressure jump πr vs. parameter θ. Each curve corresponds to a different coordinate x within the relaxation zone, from x = 0 to x = 0.025 cm, through equal intervals of 0.005 cm. The coordinate x increases from the upper to the lower curve. (b) πr vs. time t. Each line corresponds to various θ between 1.0 and 2.6 through the equal interval of 0.2. The parameter θ increases from the upper curve to the lower curve.

Figure 8.
The pressure jump in the reflected wave πr (x = 0) vs. incident shock Mach number Mi in non-dissociating nitrogen at 5000 K. The heating strength is fixed at the value .
Figure 8.
The pressure jump in the reflected wave πr (x = 0) vs. incident shock Mach number Mi in non-dissociating nitrogen at 5000 K. The heating strength is fixed at the value .


Table 1.
The relaxation times and relaxation depths in the relaxation zone for the temperature, pressure, density, and flow speed distributions in the incident, reflected, and transmitted waves.
Table 1.
The relaxation times and relaxation depths in the relaxation zone for the temperature, pressure, density, and flow speed distributions in the incident, reflected, and transmitted waves.
| Relaxation Time (μs) and Depth | T21 | π | u | |
|---|---|---|---|---|
| Incident: | , μs | 0.150 | 0.150 | 0.150 |
| −0.432 | +0.103 | + 0.061 | ||
| Reflected: | , μs | 0.150 | 0.150 | 0.150 |
| +0.004 | −0.048 | −0.141 | ||
| Transmitted: | , μs | 0.100 | 0.100 | 0.120 |
| −0.186 | +0.059 | + 0.036 | ||
Disclaimer/Publisher’s Note: The statements, opinions and data contained in all publications are solely those of the individual author(s) and contributor(s) and not of MDPI and/or the editor(s). MDPI and/or the editor(s) disclaim responsibility for any injury to people or property resulting from any ideas, methods, instructions or products referred to in the content. |
© 2023 by the author. Licensee MDPI, Basel, Switzerland. This article is an open access article distributed under the terms and conditions of the Creative Commons Attribution (CC BY) license (https://creativecommons.org/licenses/by/4.0/).
Share and Cite
MDPI and ACS Style
Markhotok, A. The Post-Shock Nonequilibrium Relaxation in a Hypersonic Plasma Flow Involving Reflection off a Thermal Discontinuity. Plasma 2023, 6, 181-197. https://doi.org/10.3390/plasma6010014
AMA Style
Markhotok A. The Post-Shock Nonequilibrium Relaxation in a Hypersonic Plasma Flow Involving Reflection off a Thermal Discontinuity. Plasma. 2023; 6(1):181-197. https://doi.org/10.3390/plasma6010014
Chicago/Turabian StyleMarkhotok, Anna. 2023. "The Post-Shock Nonequilibrium Relaxation in a Hypersonic Plasma Flow Involving Reflection off a Thermal Discontinuity" Plasma 6, no. 1: 181-197. https://doi.org/10.3390/plasma6010014