Application of Plasma Bridge for Grounding of Conductive Substrates Treated by Transferred Pulsed Atmospheric Arc


Abstract
:1. Introduction
2. Materials and Methods
2.1. Materials
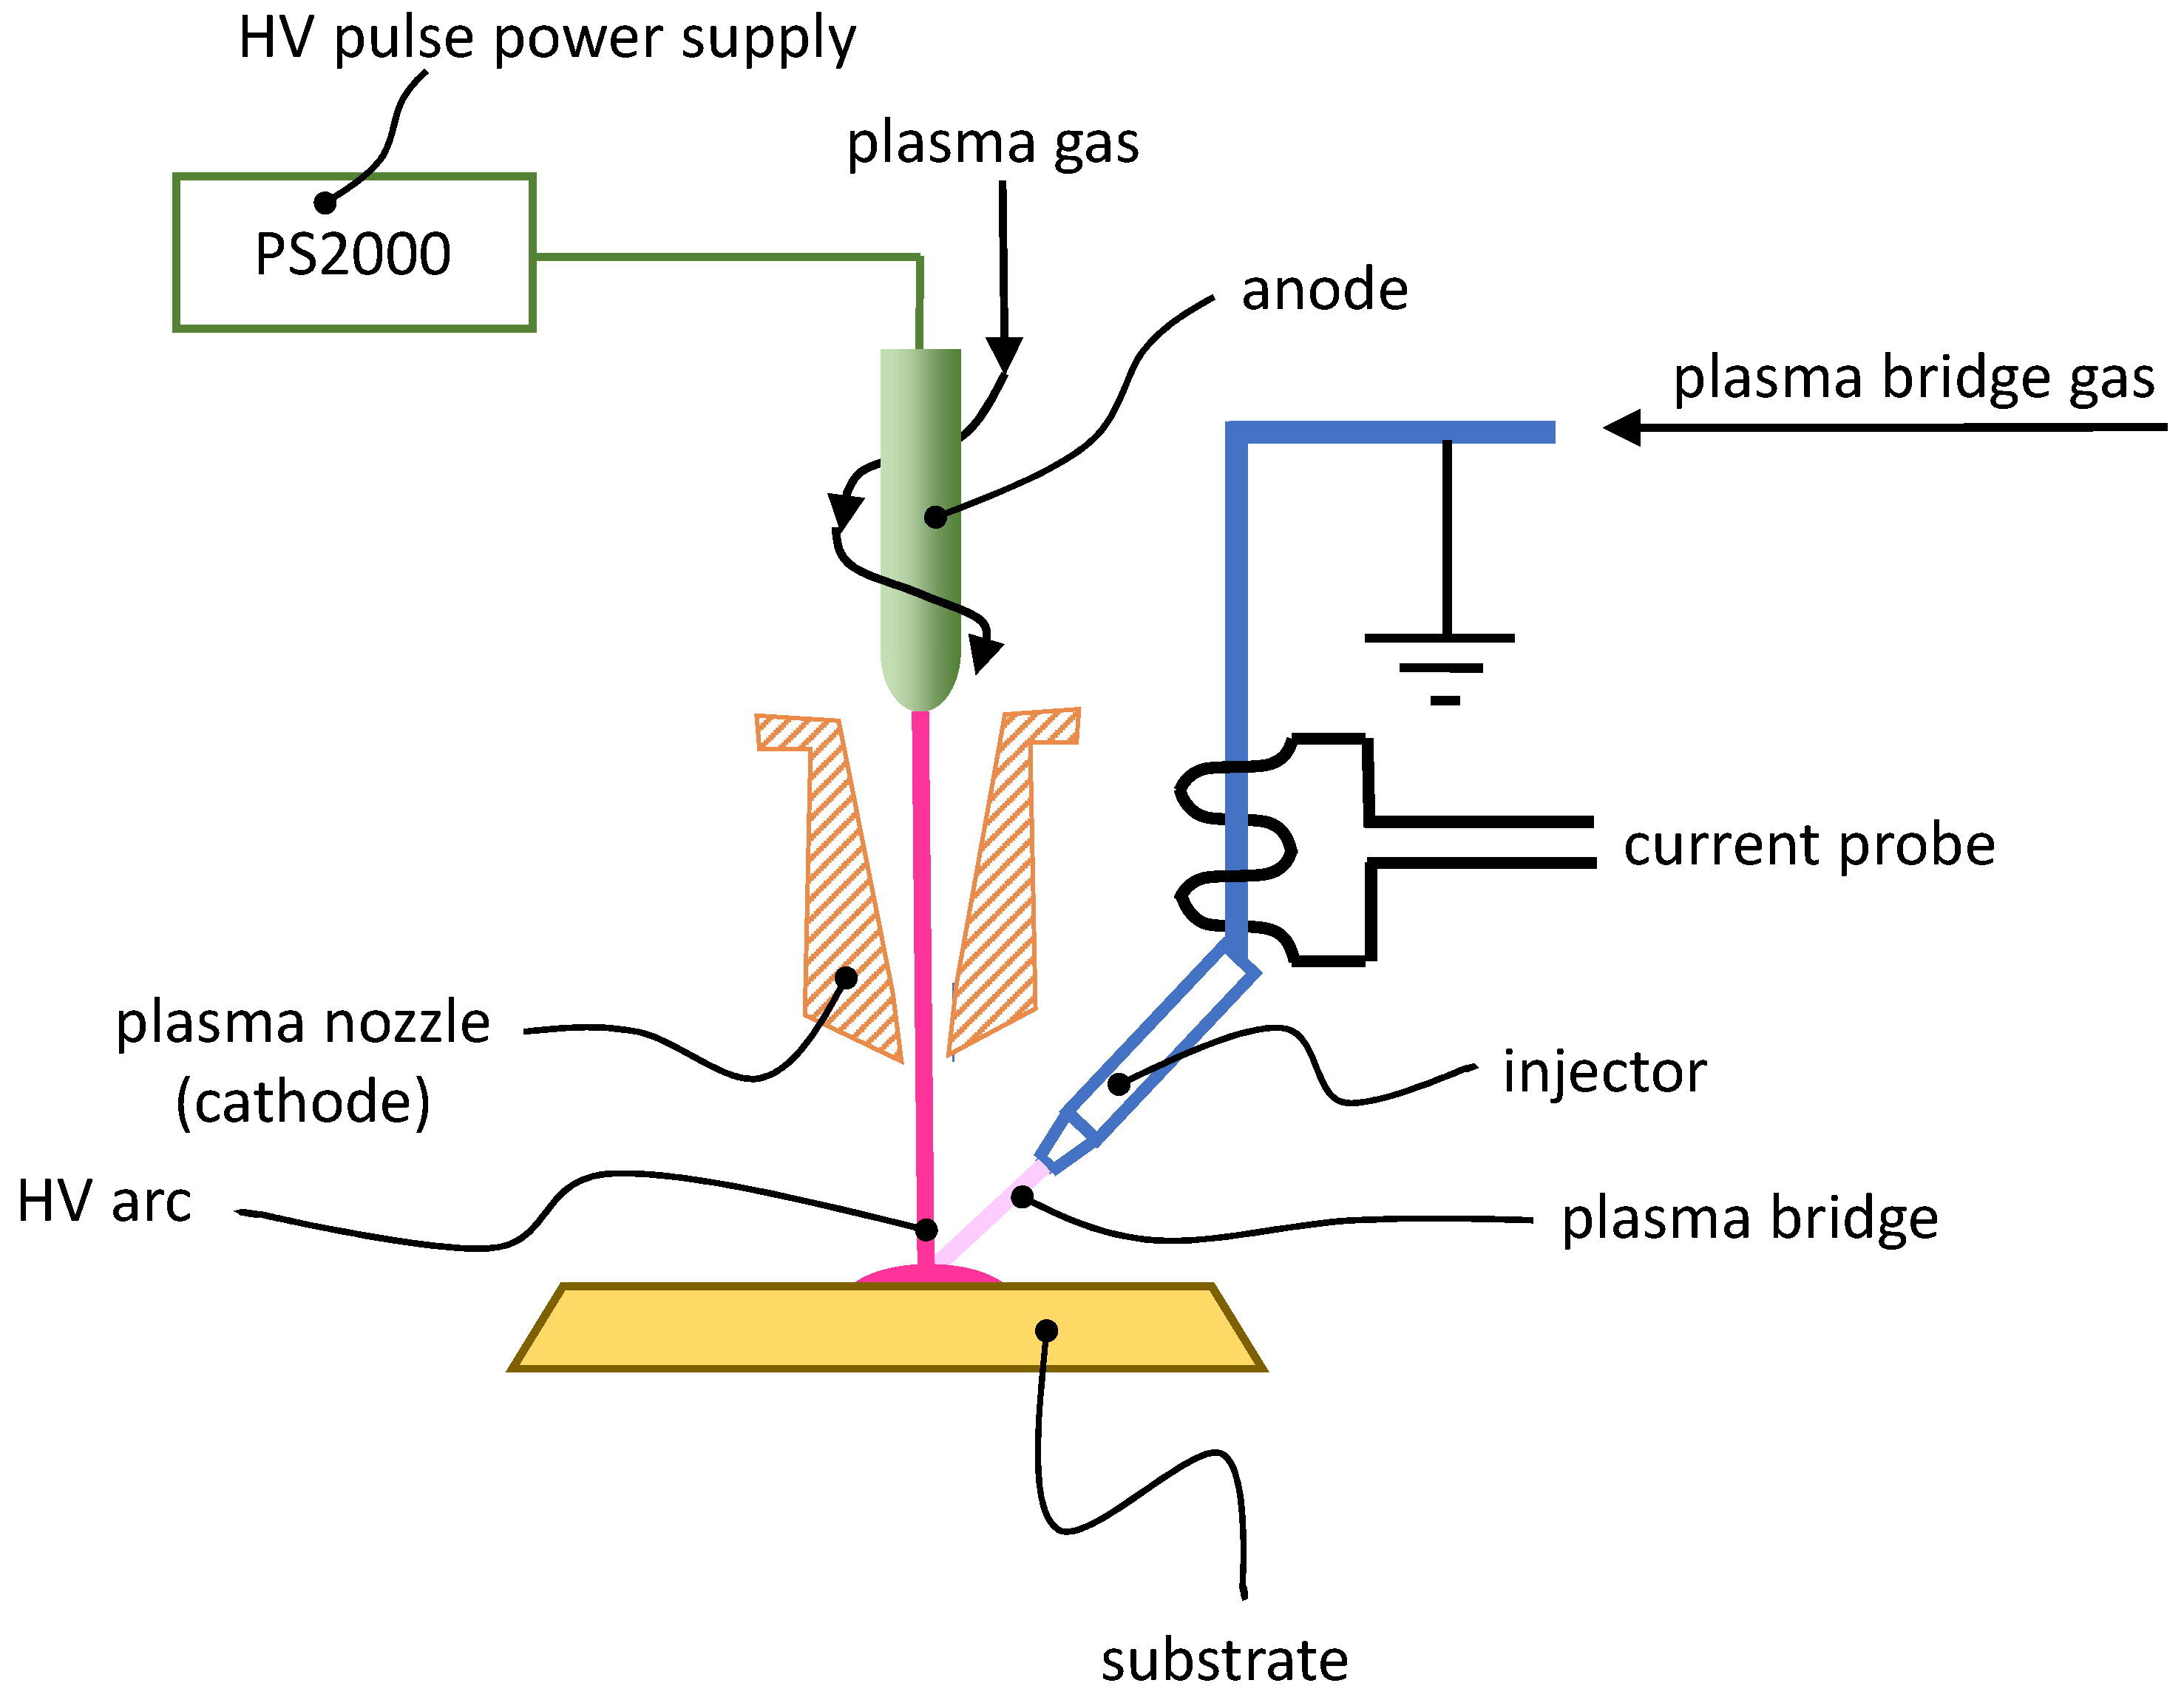
2.2. Setup for Plasma Bridge Investigation
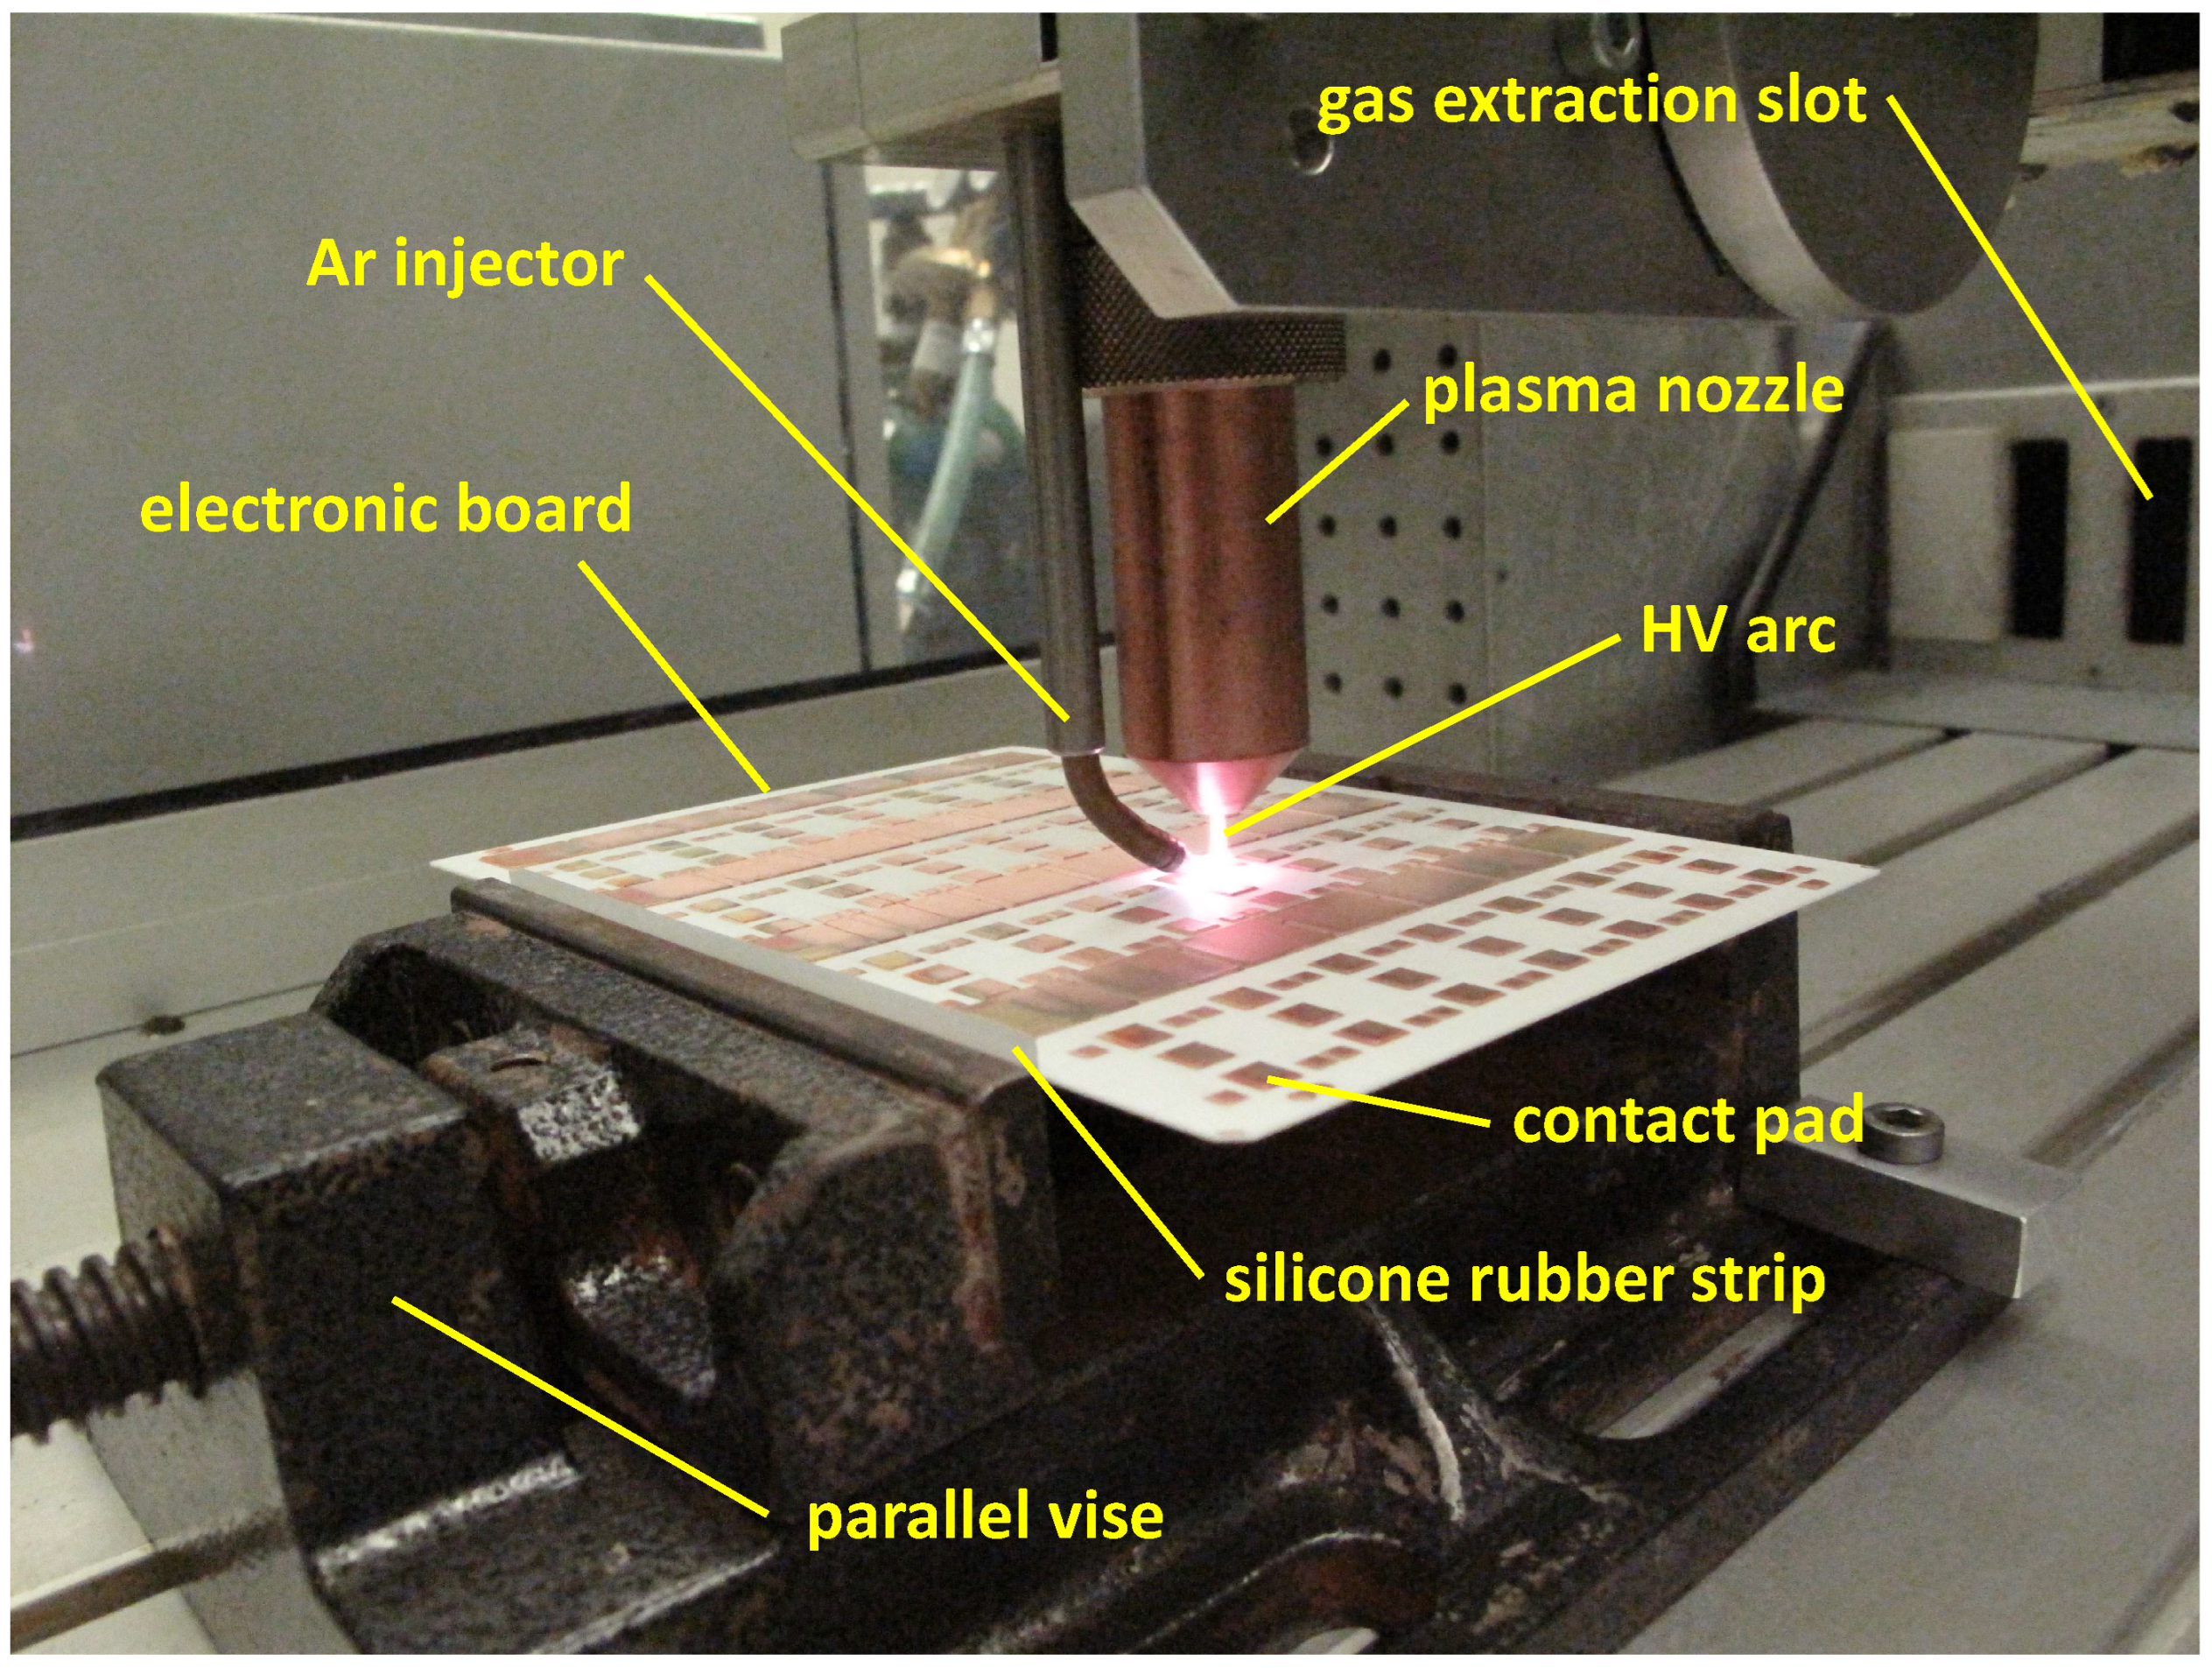
2.3. Plasma Processing System
3. Results and Discussion
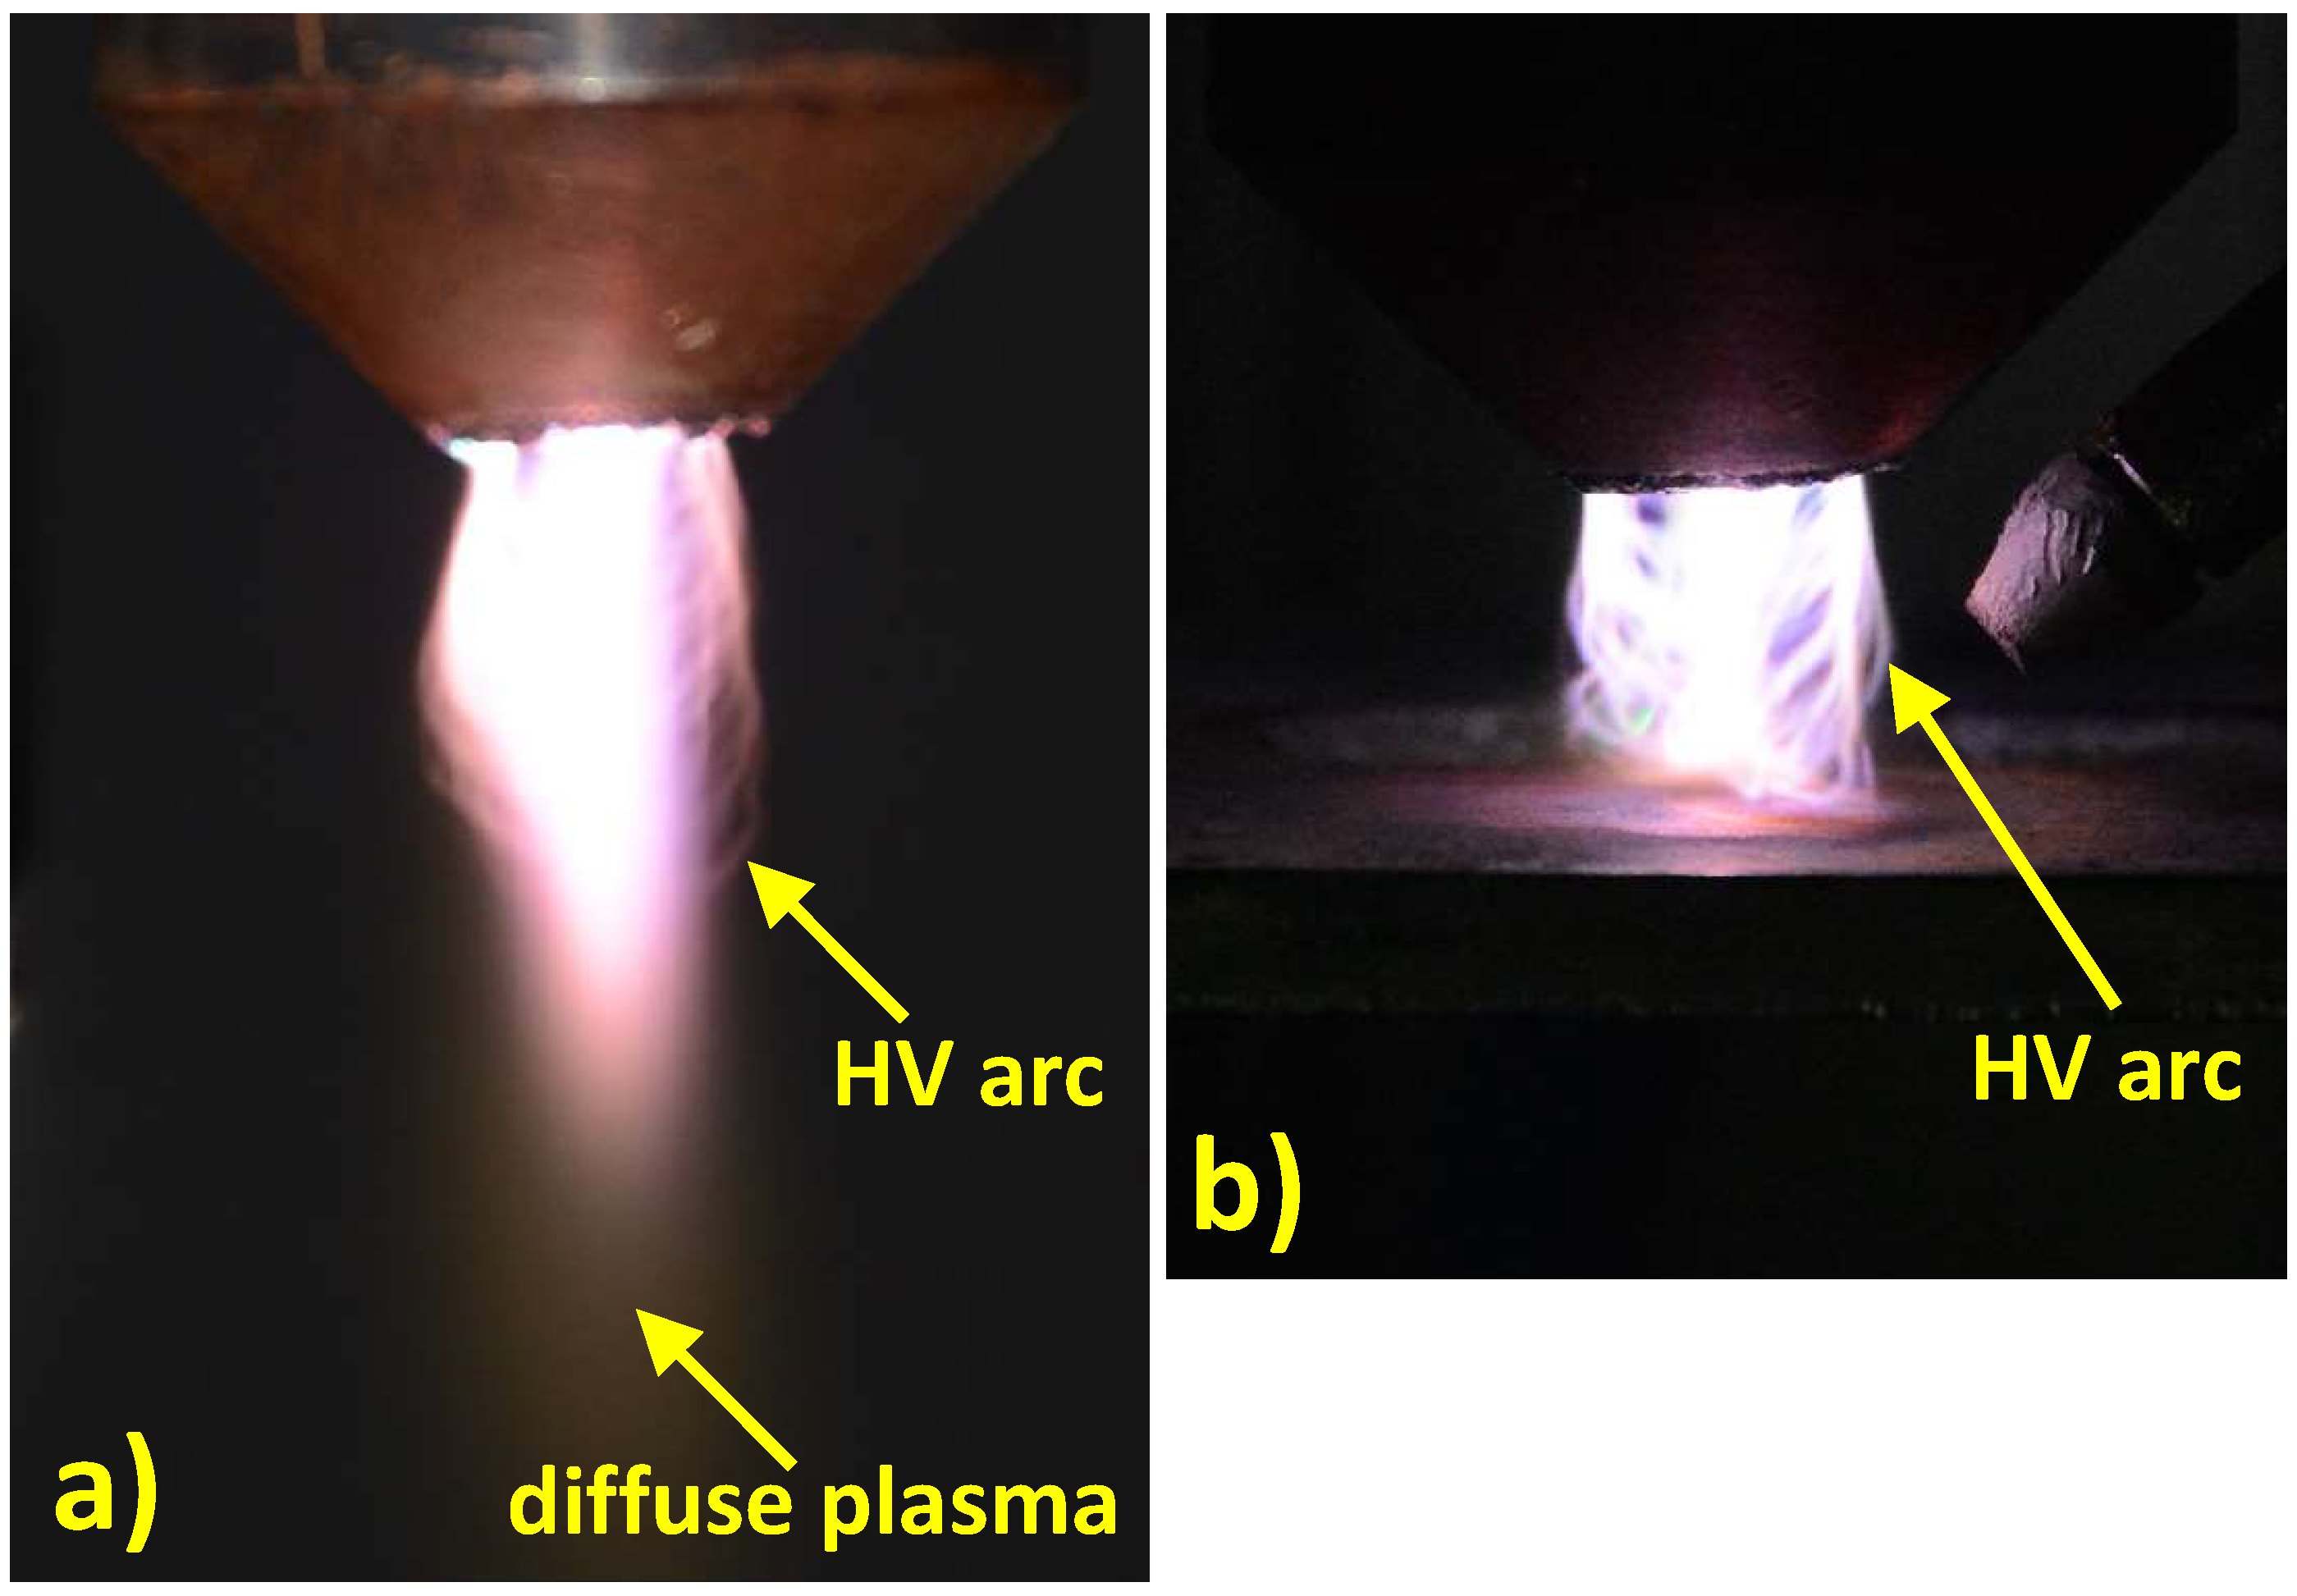
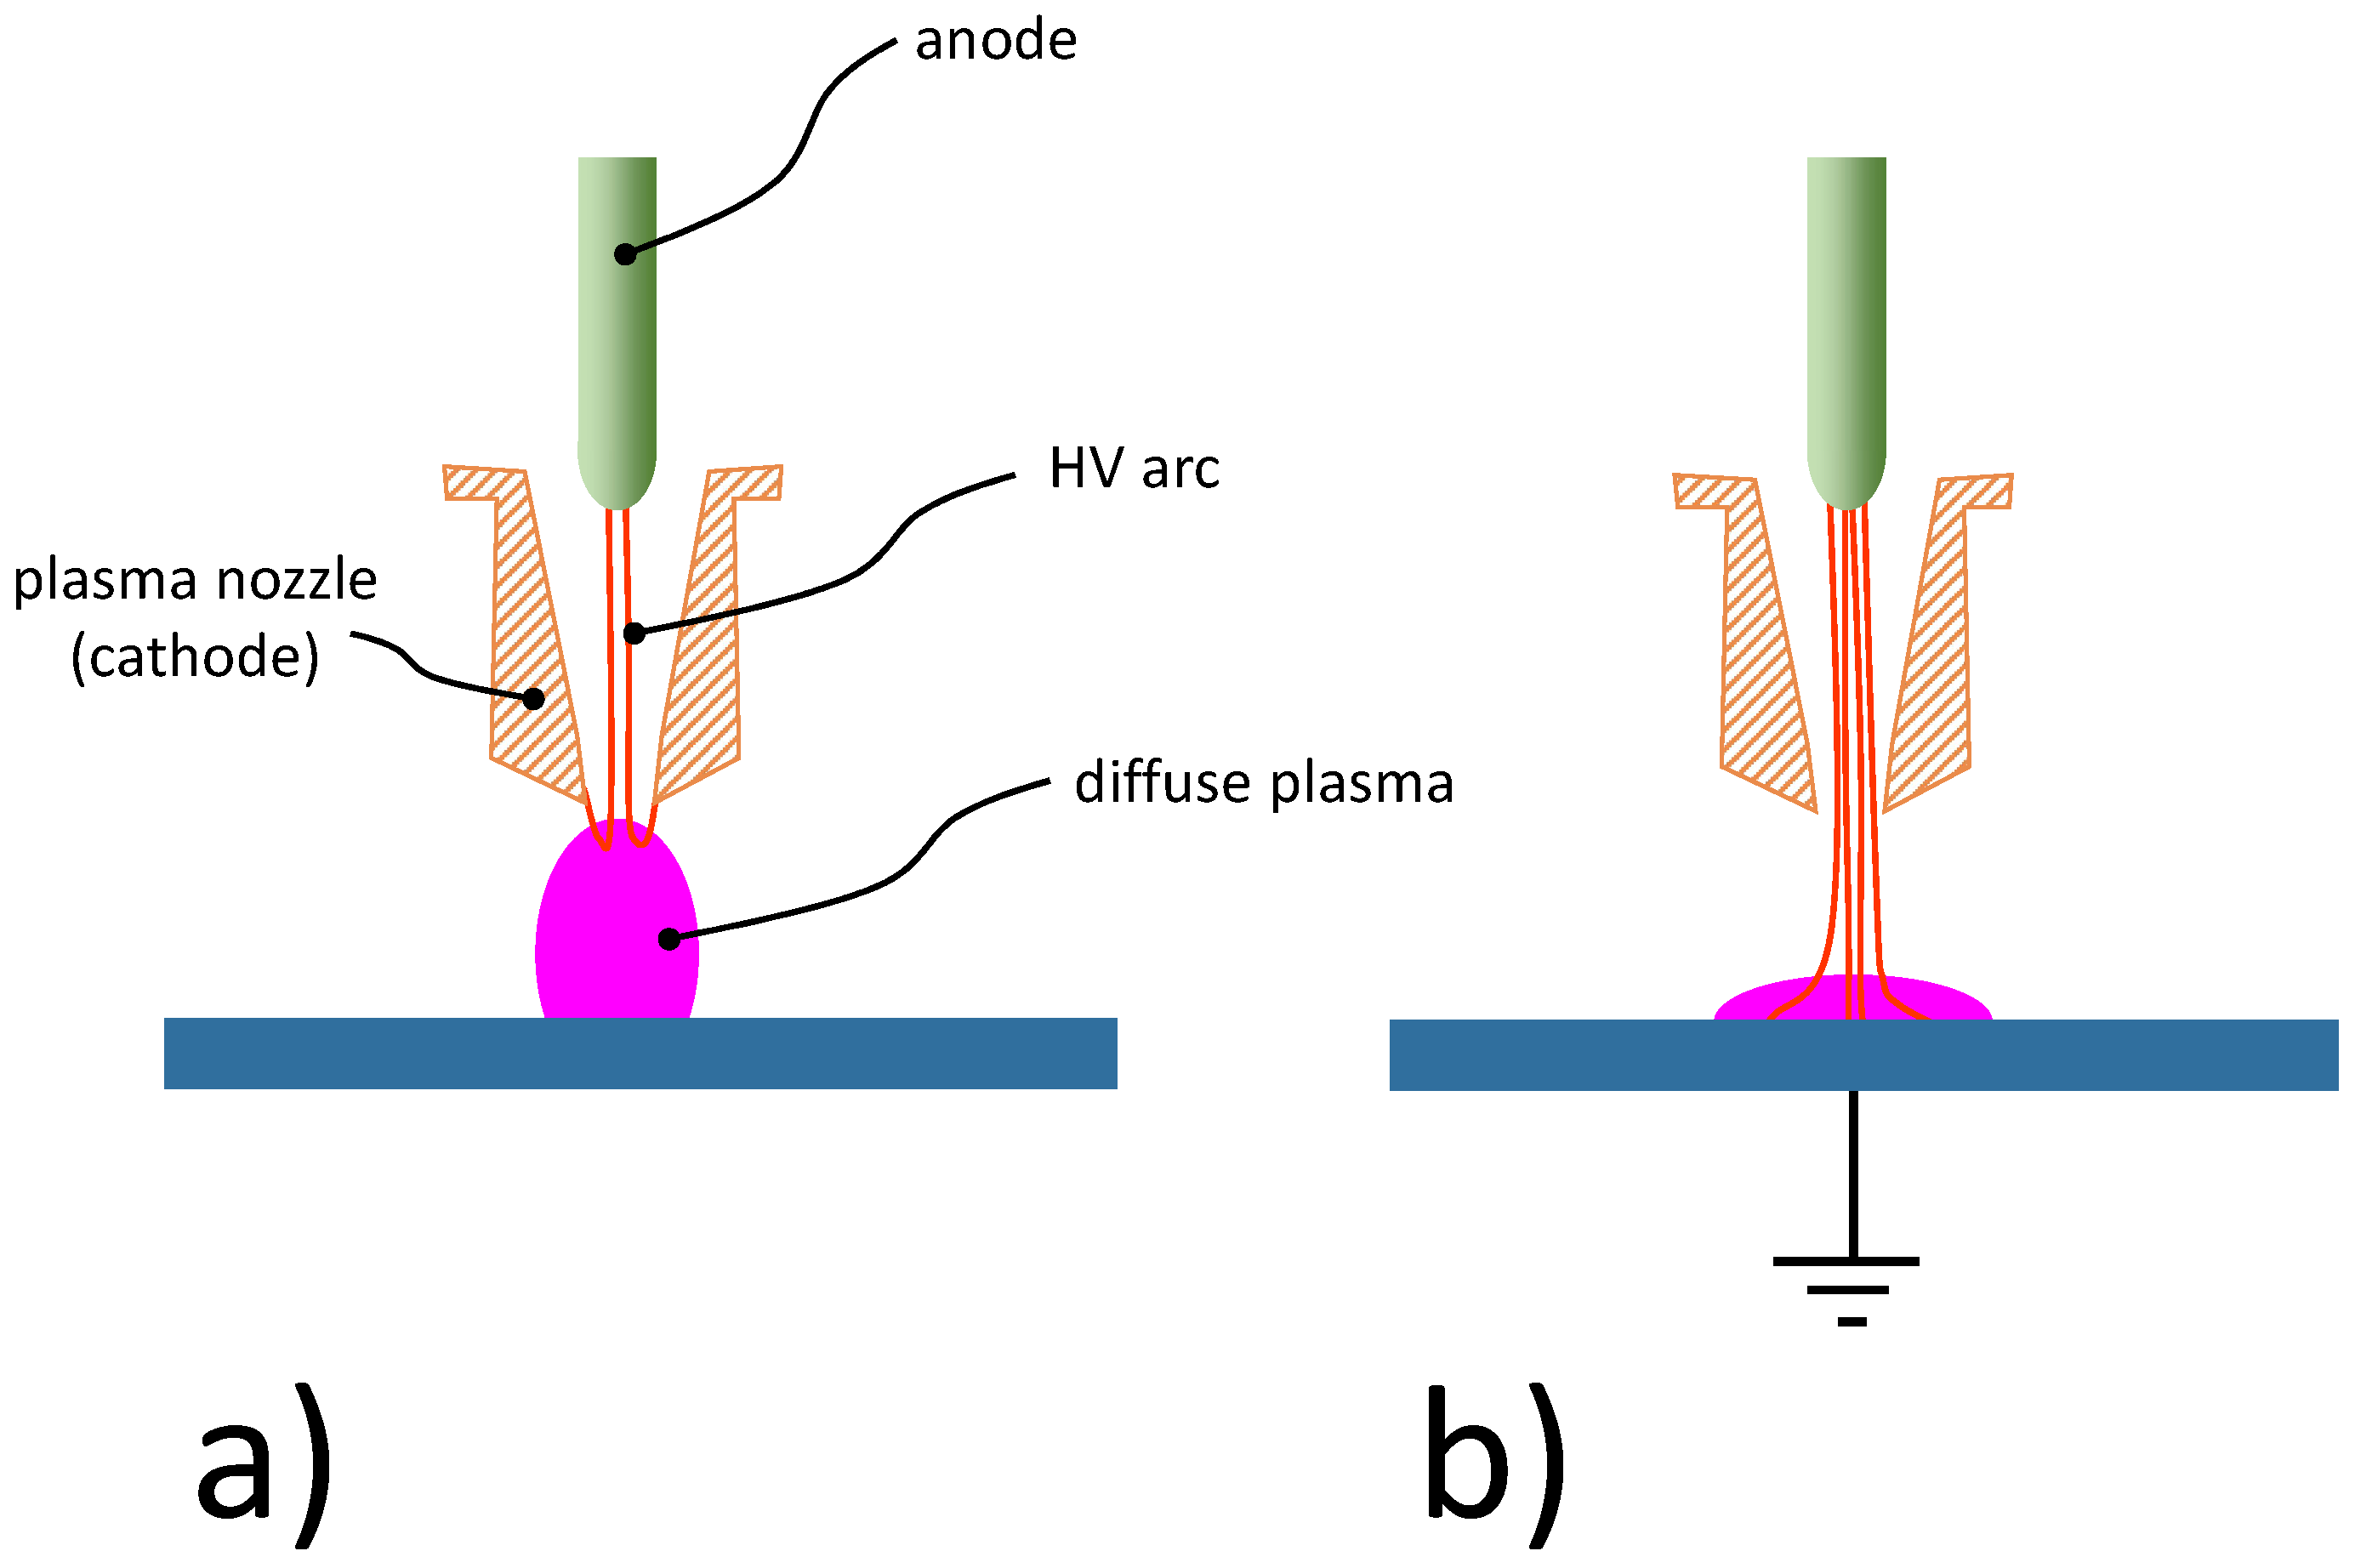
3.1. Diffuse Plasma Mode
3.1.1. Structure of the PAA-PJ
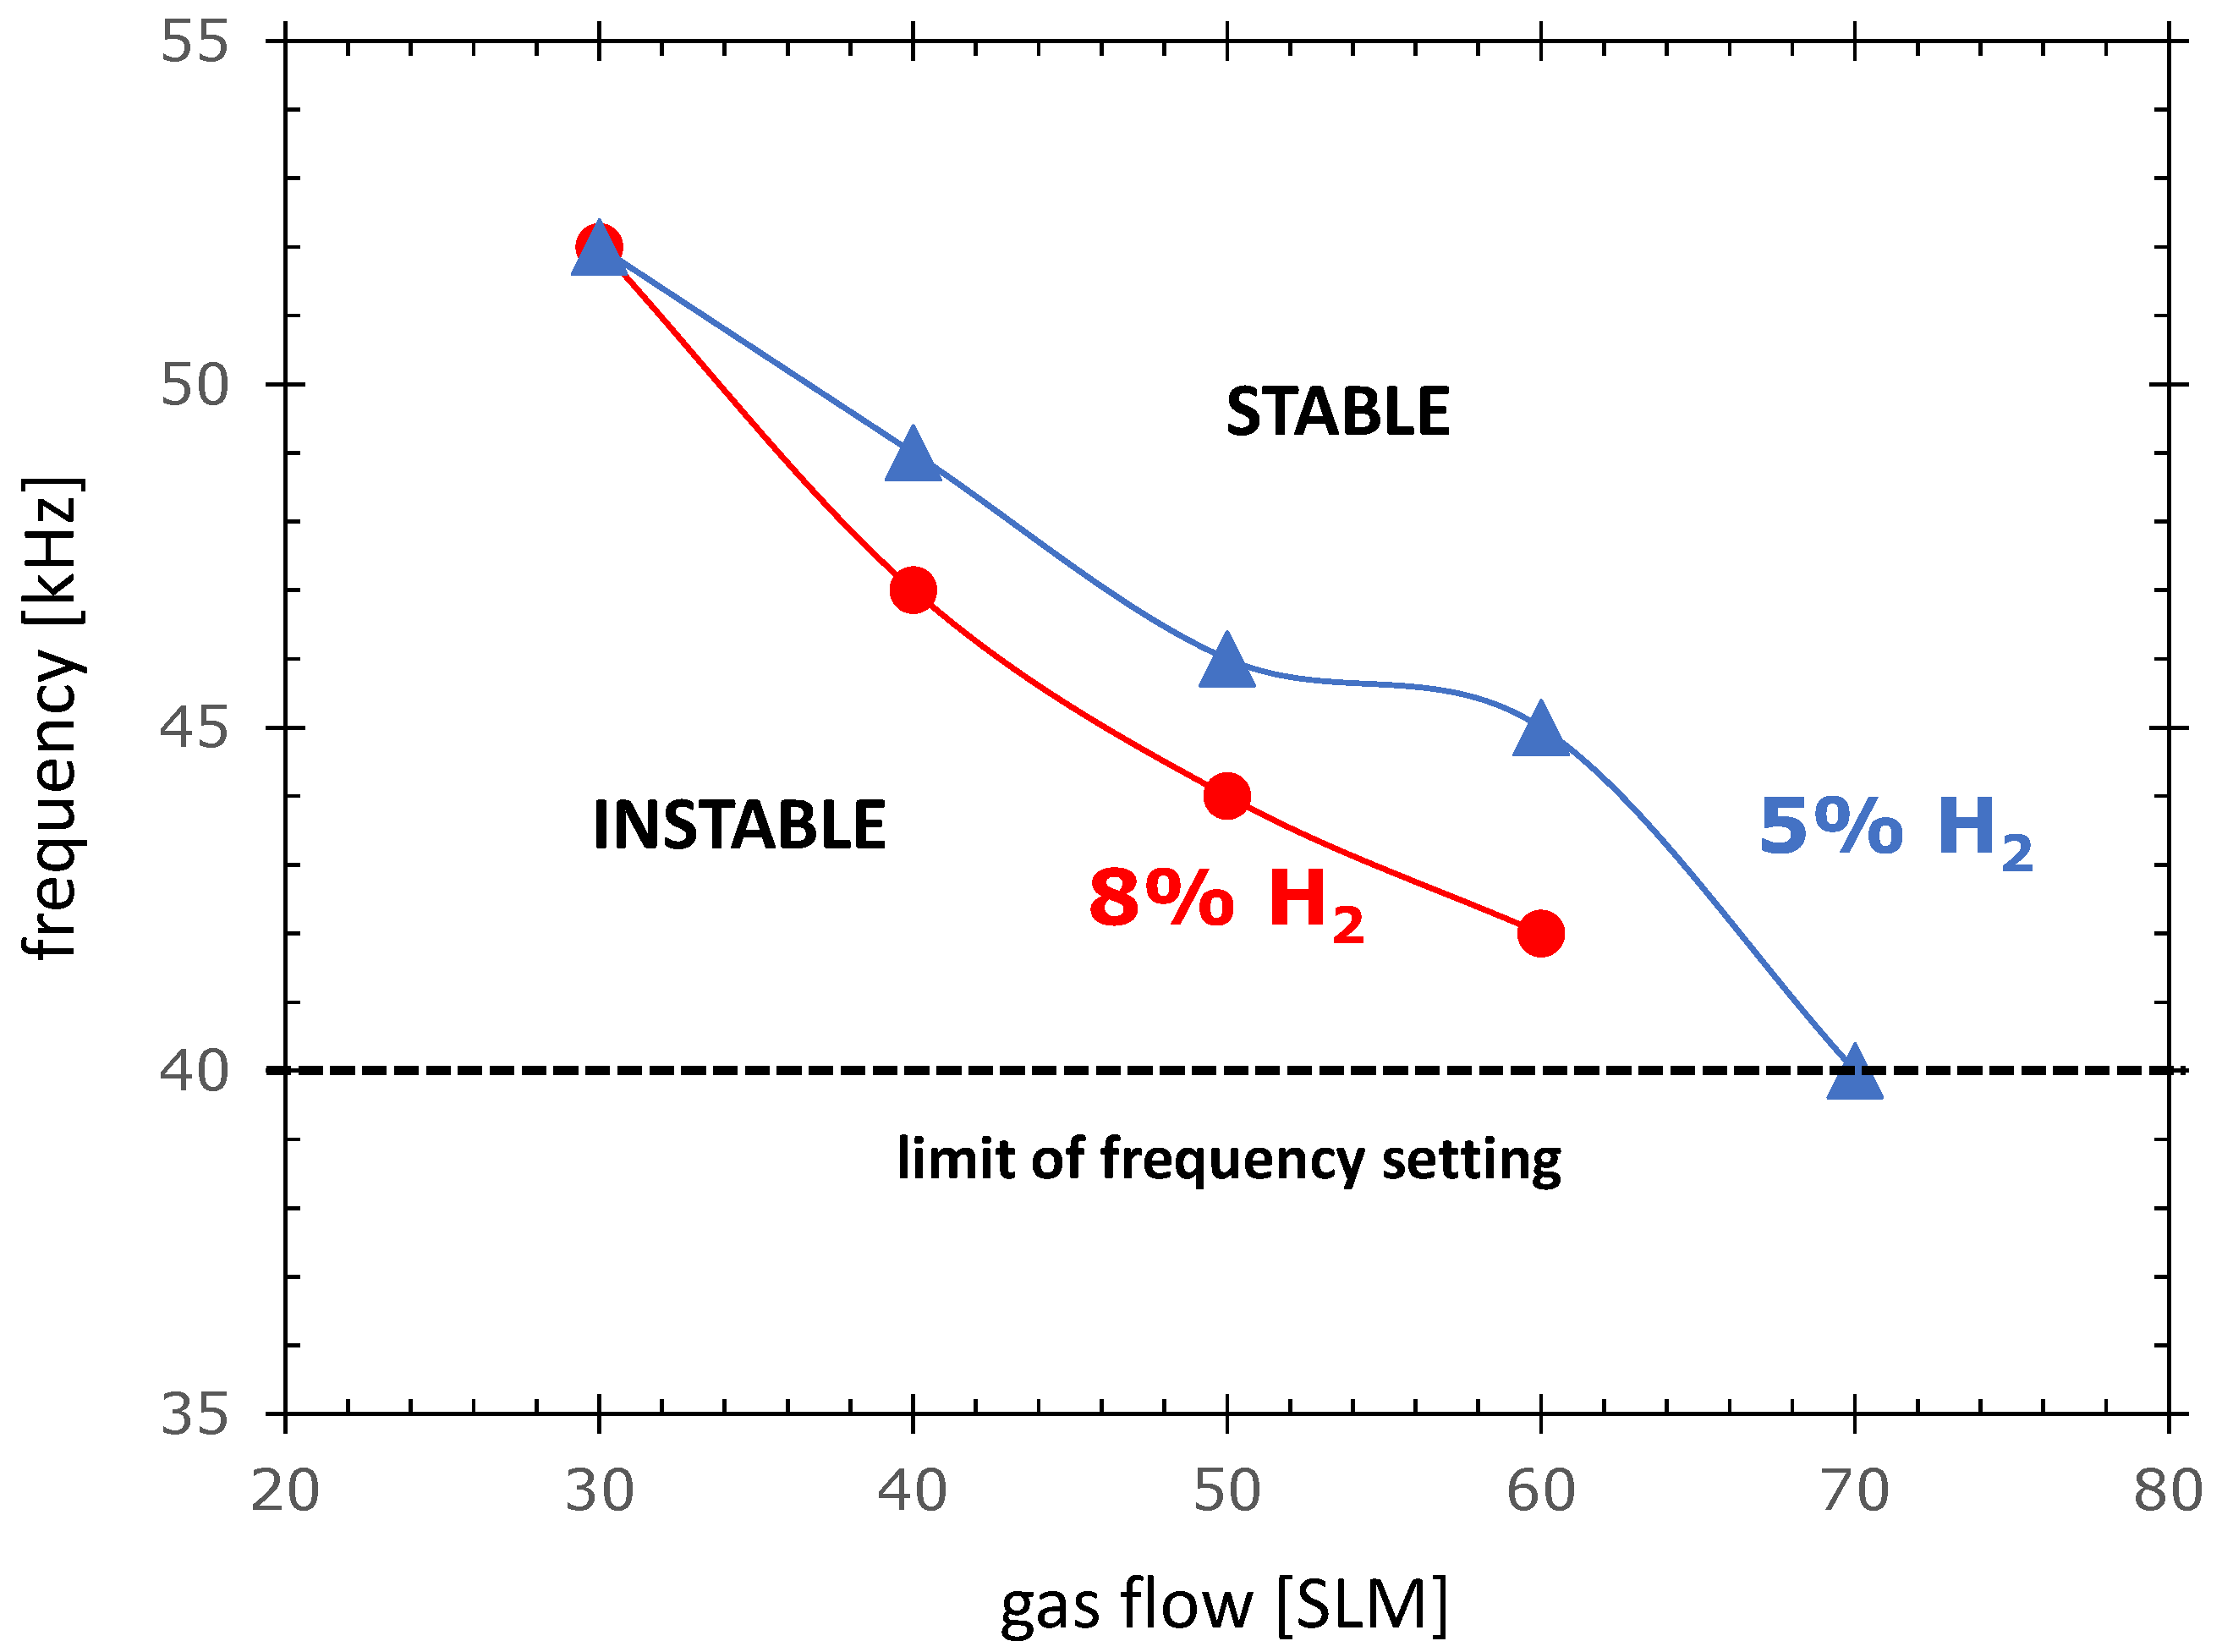
3.1.2. Discharge Stability
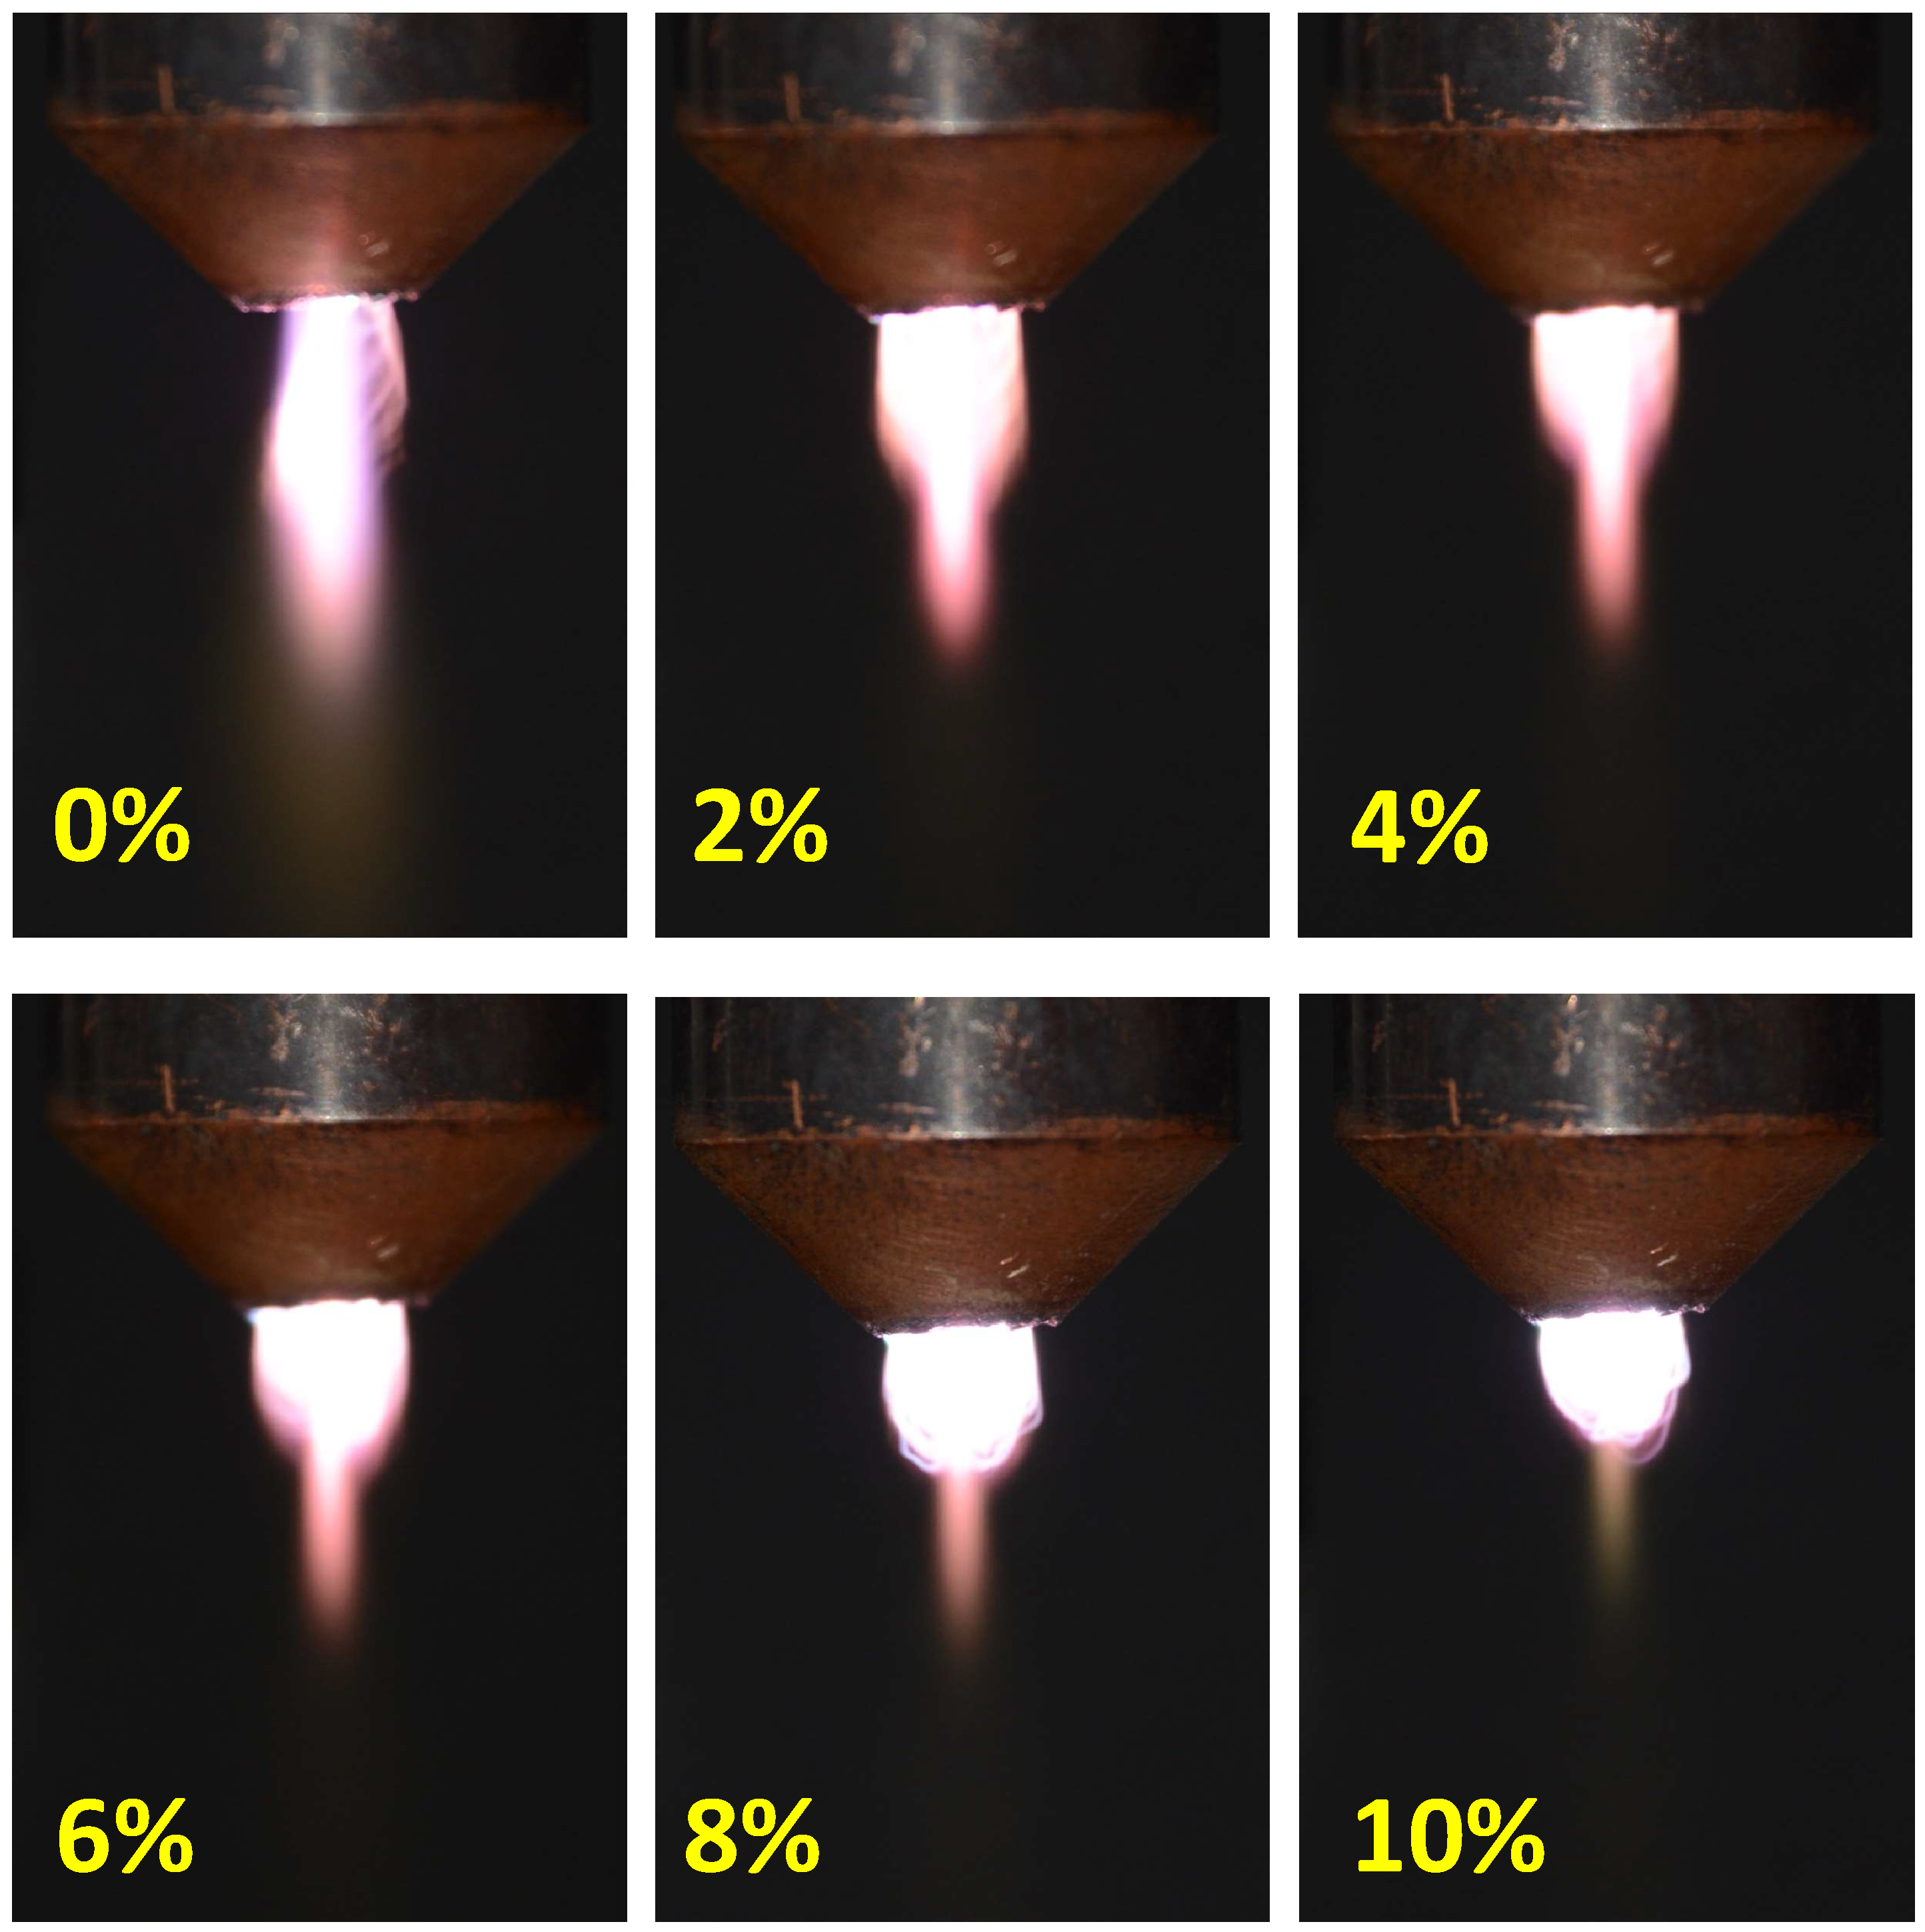
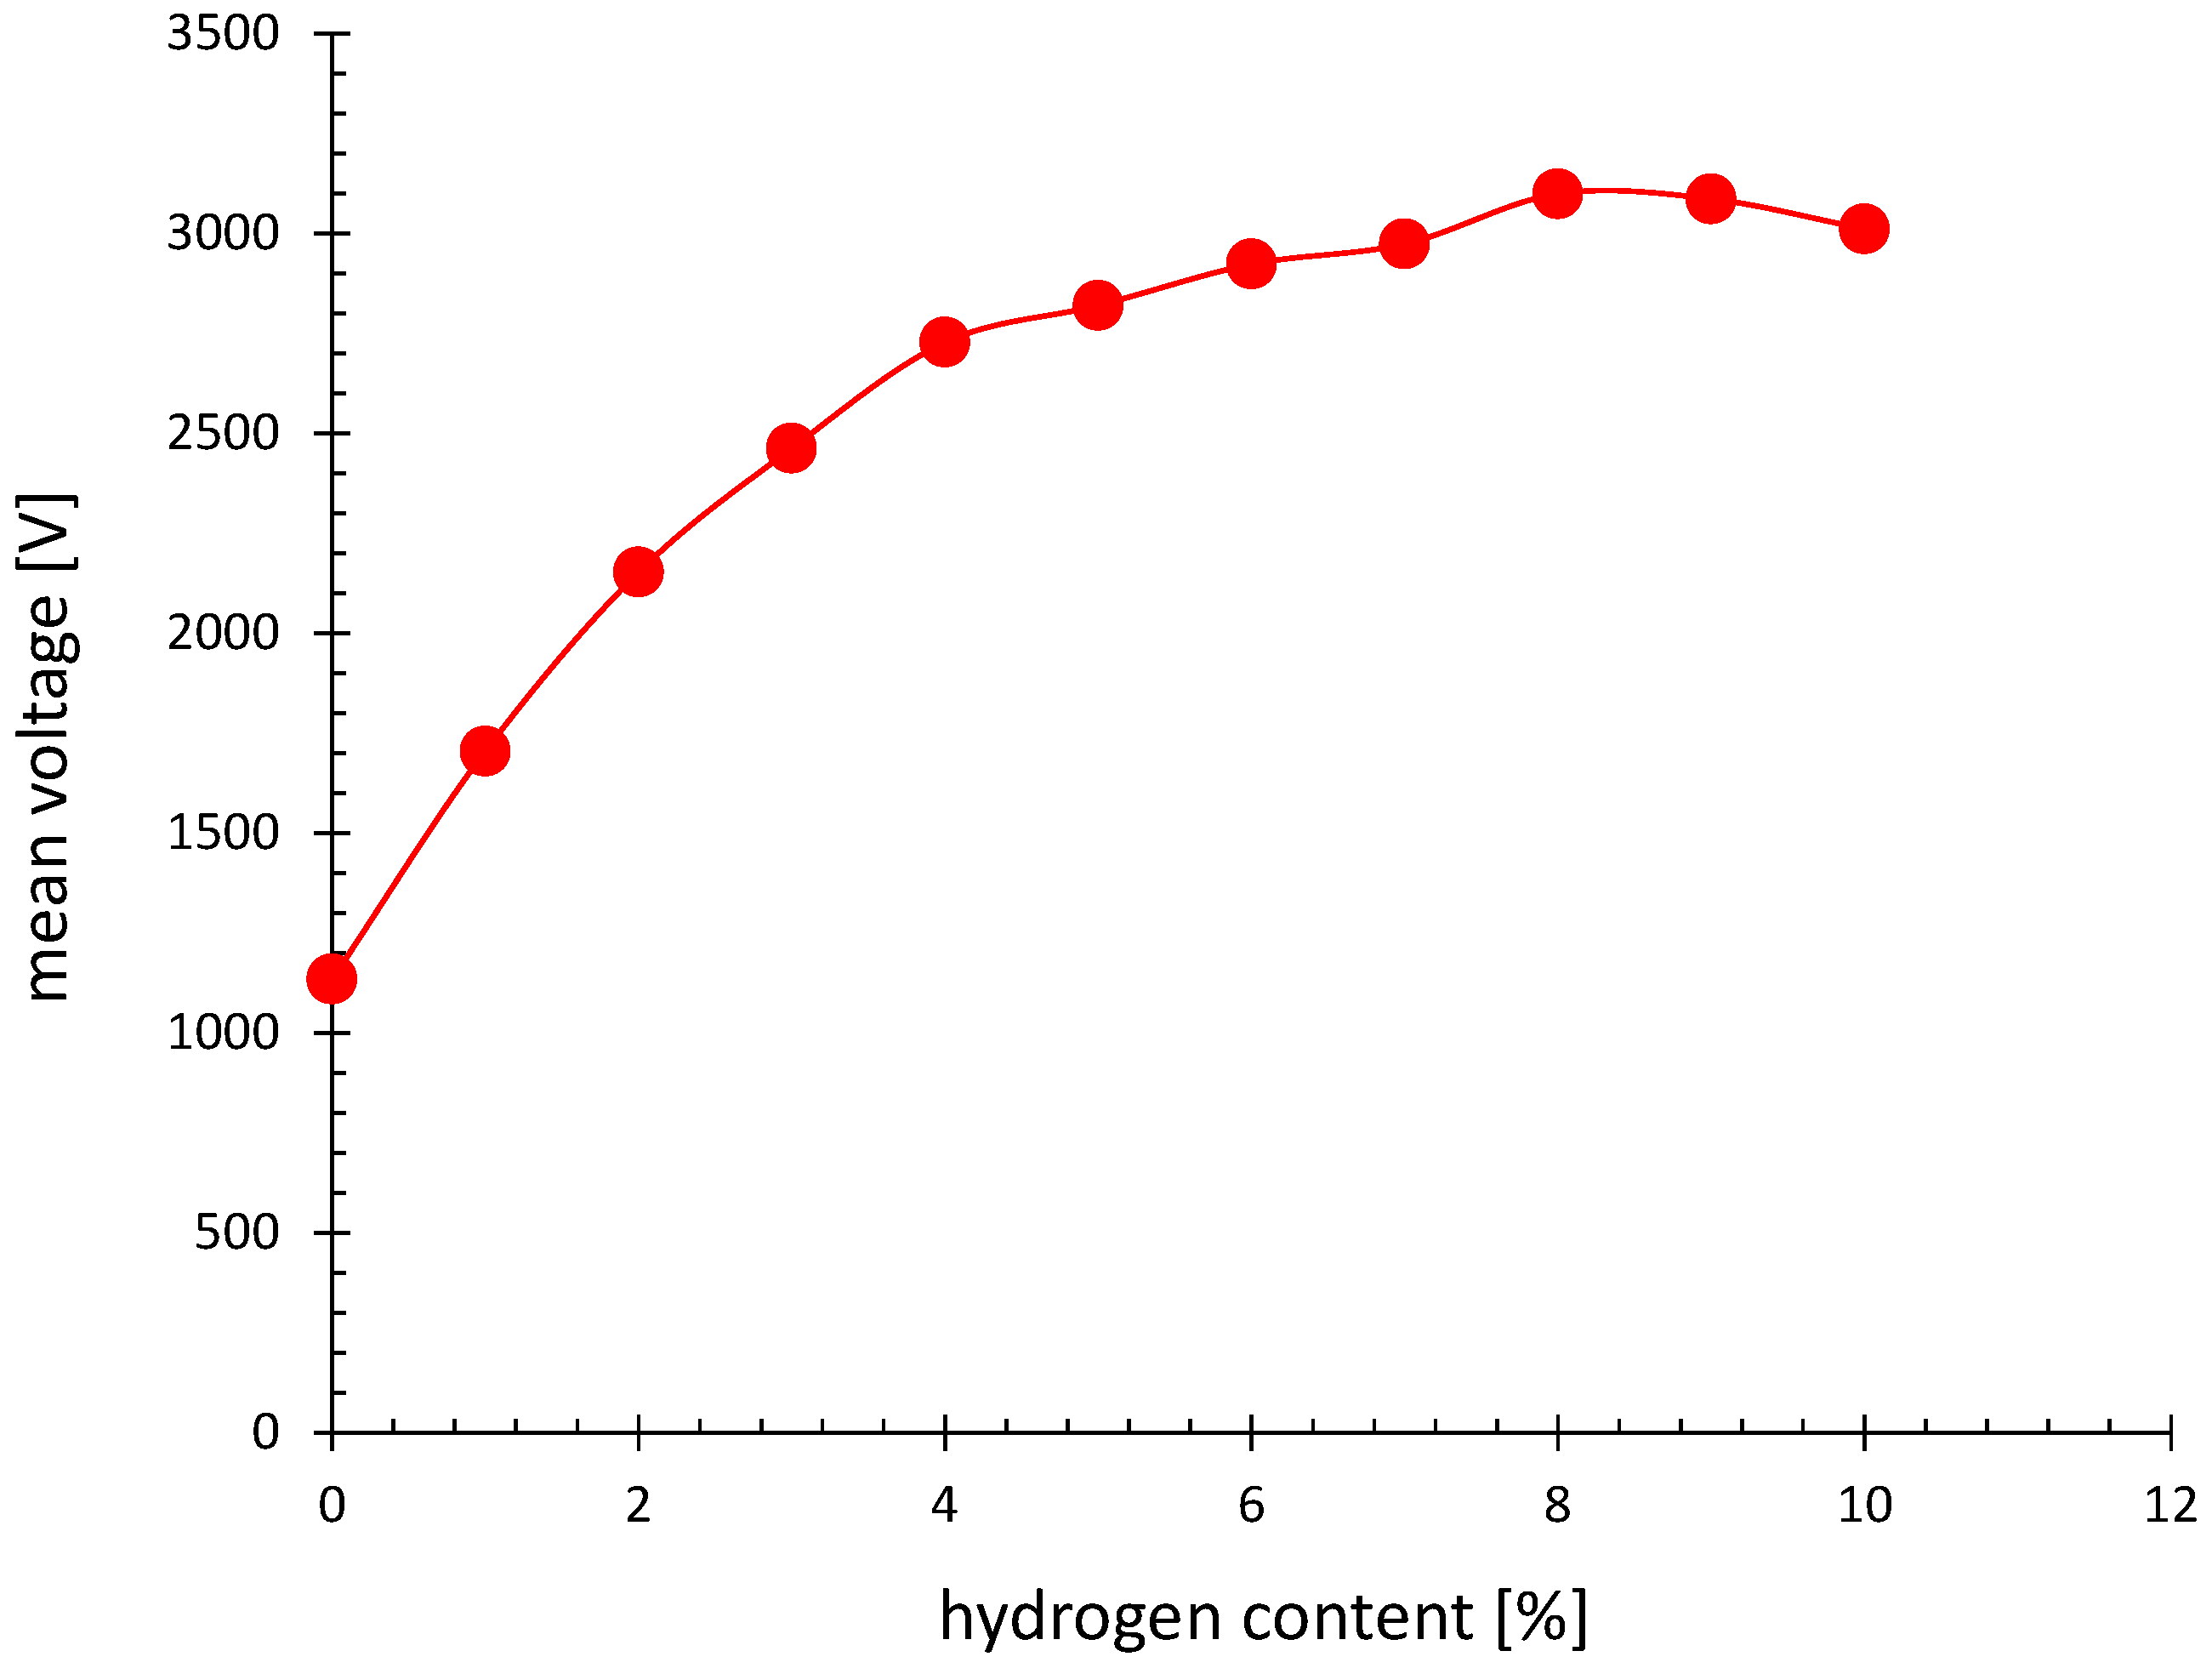
3.1.3. Influence of Hydrogen Percentage on Jet Morphology
3.2. Transferred Arc Mode
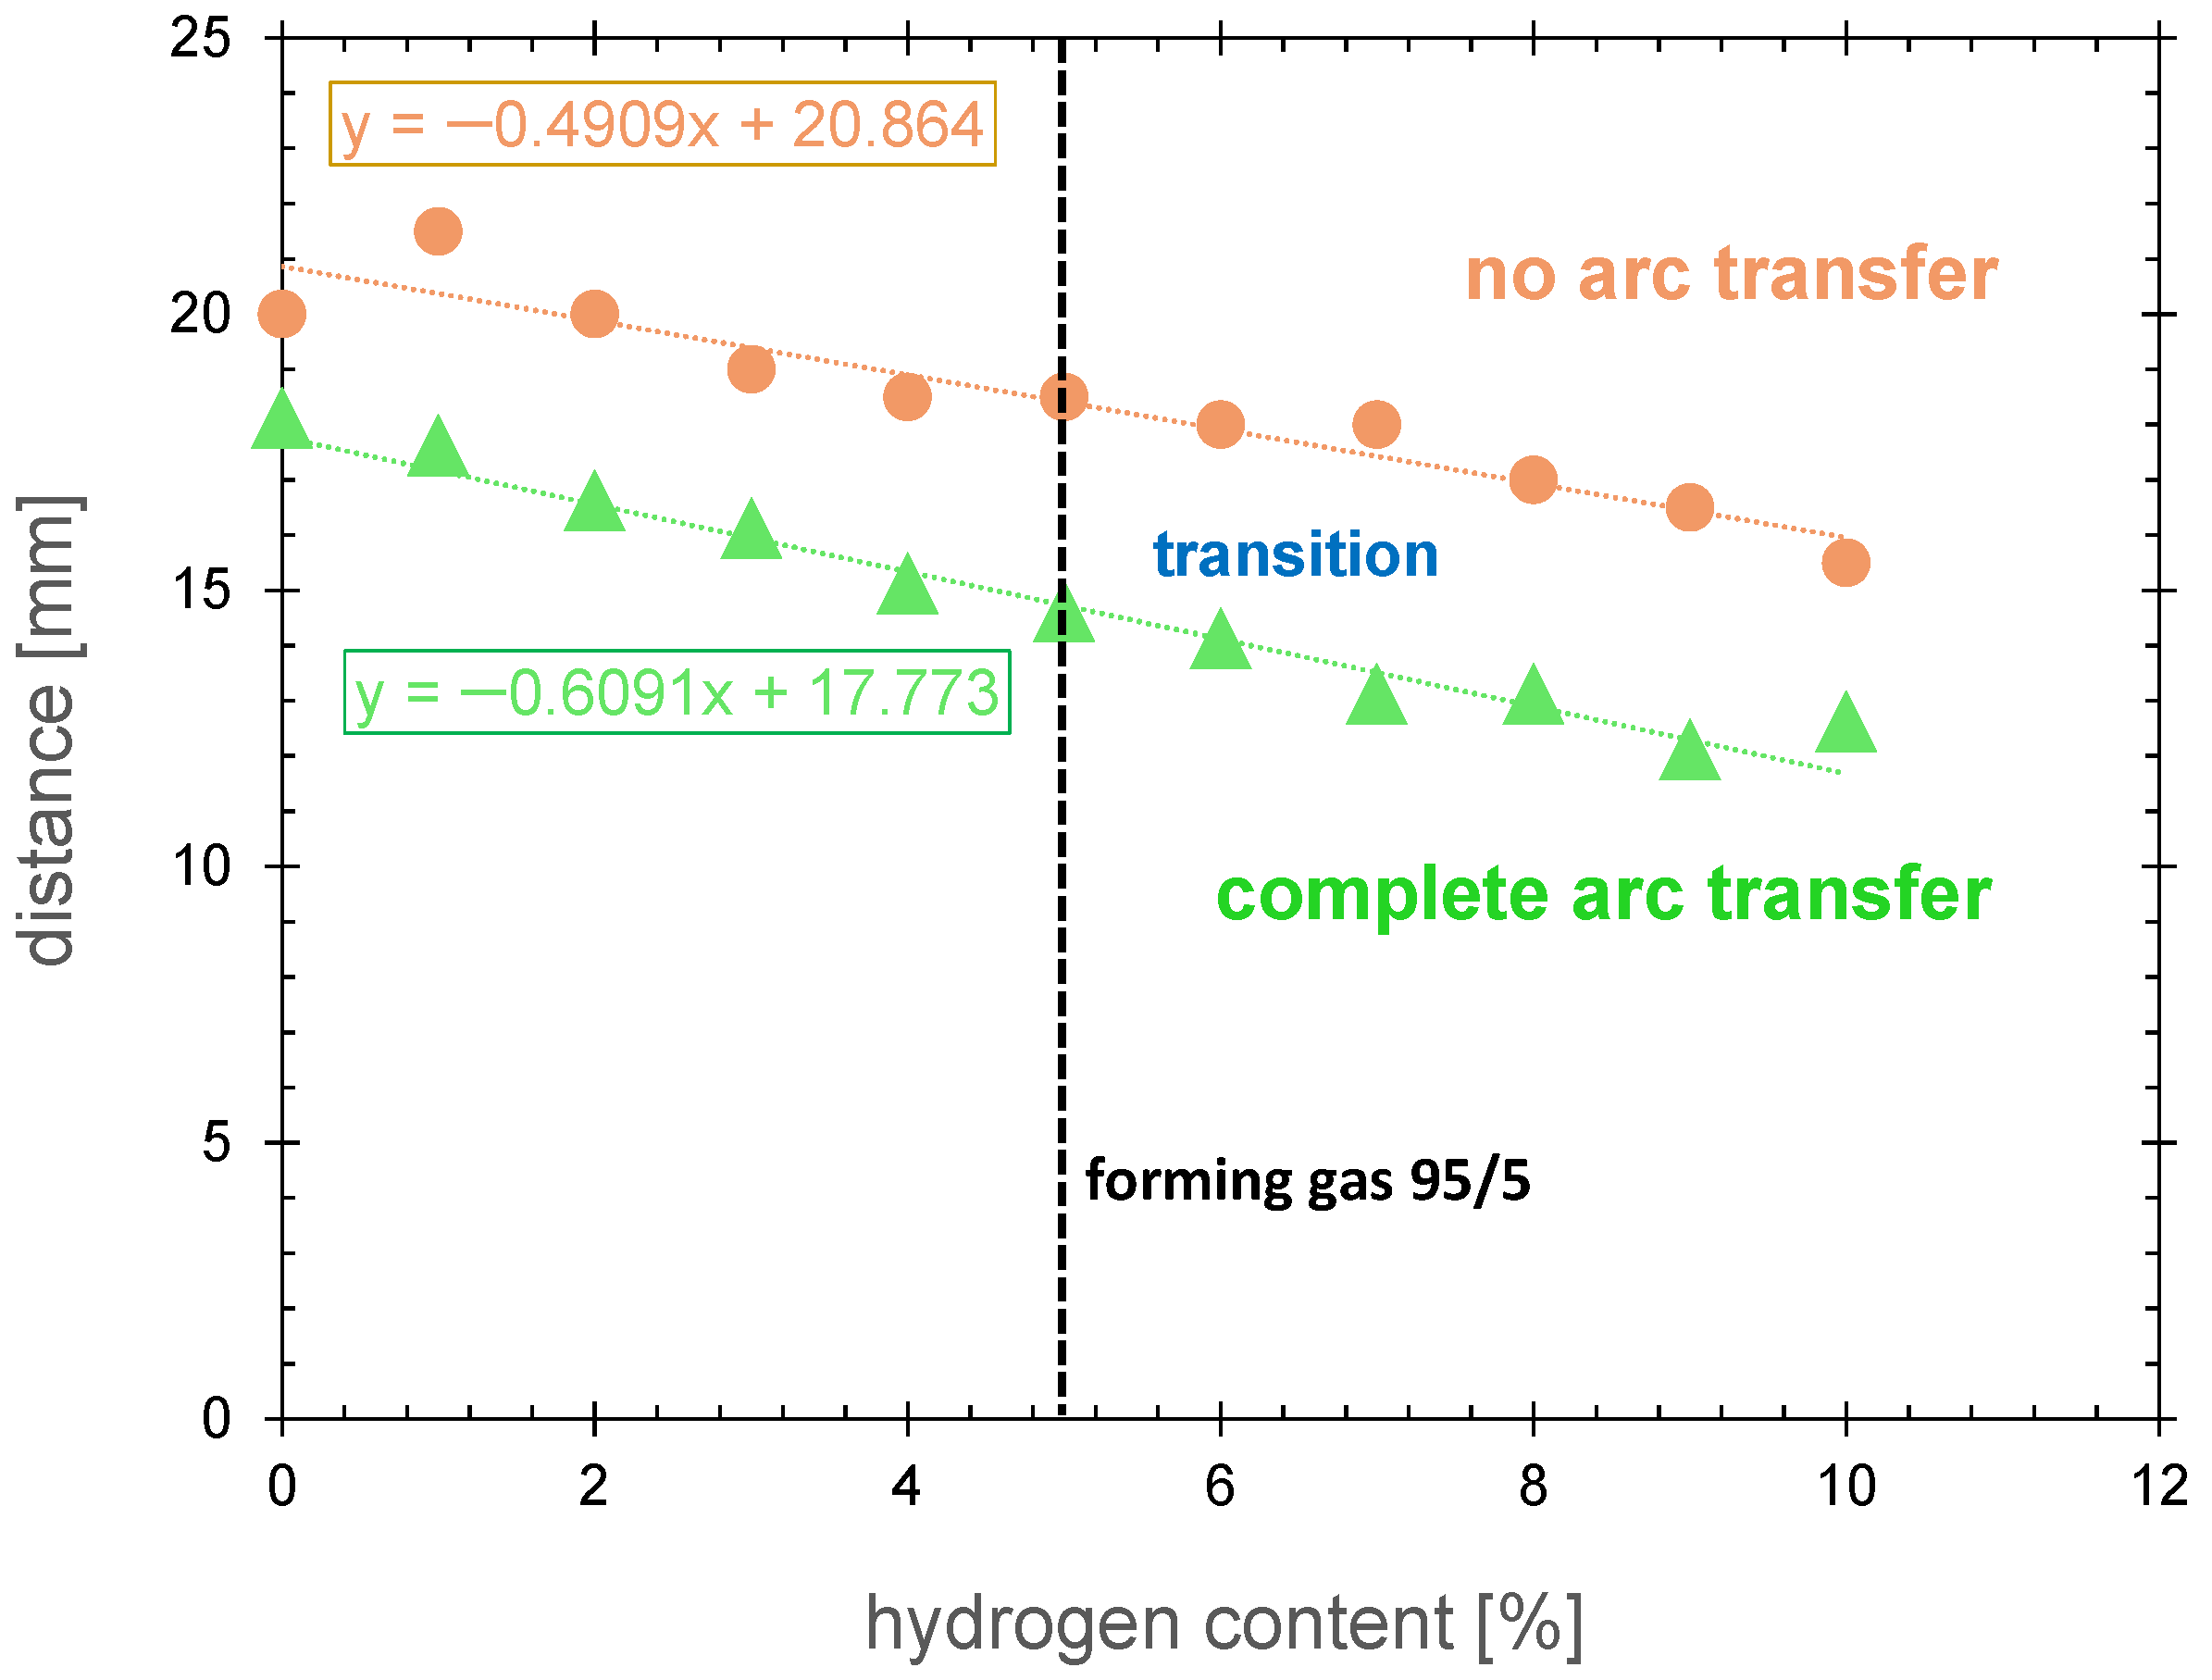
3.2.1. Influence of Hydrogen Percentage on Arc Transition
3.2.2. Plasma Focused on Capacitively Grounded Surfaces
3.3. Plasma Bridge
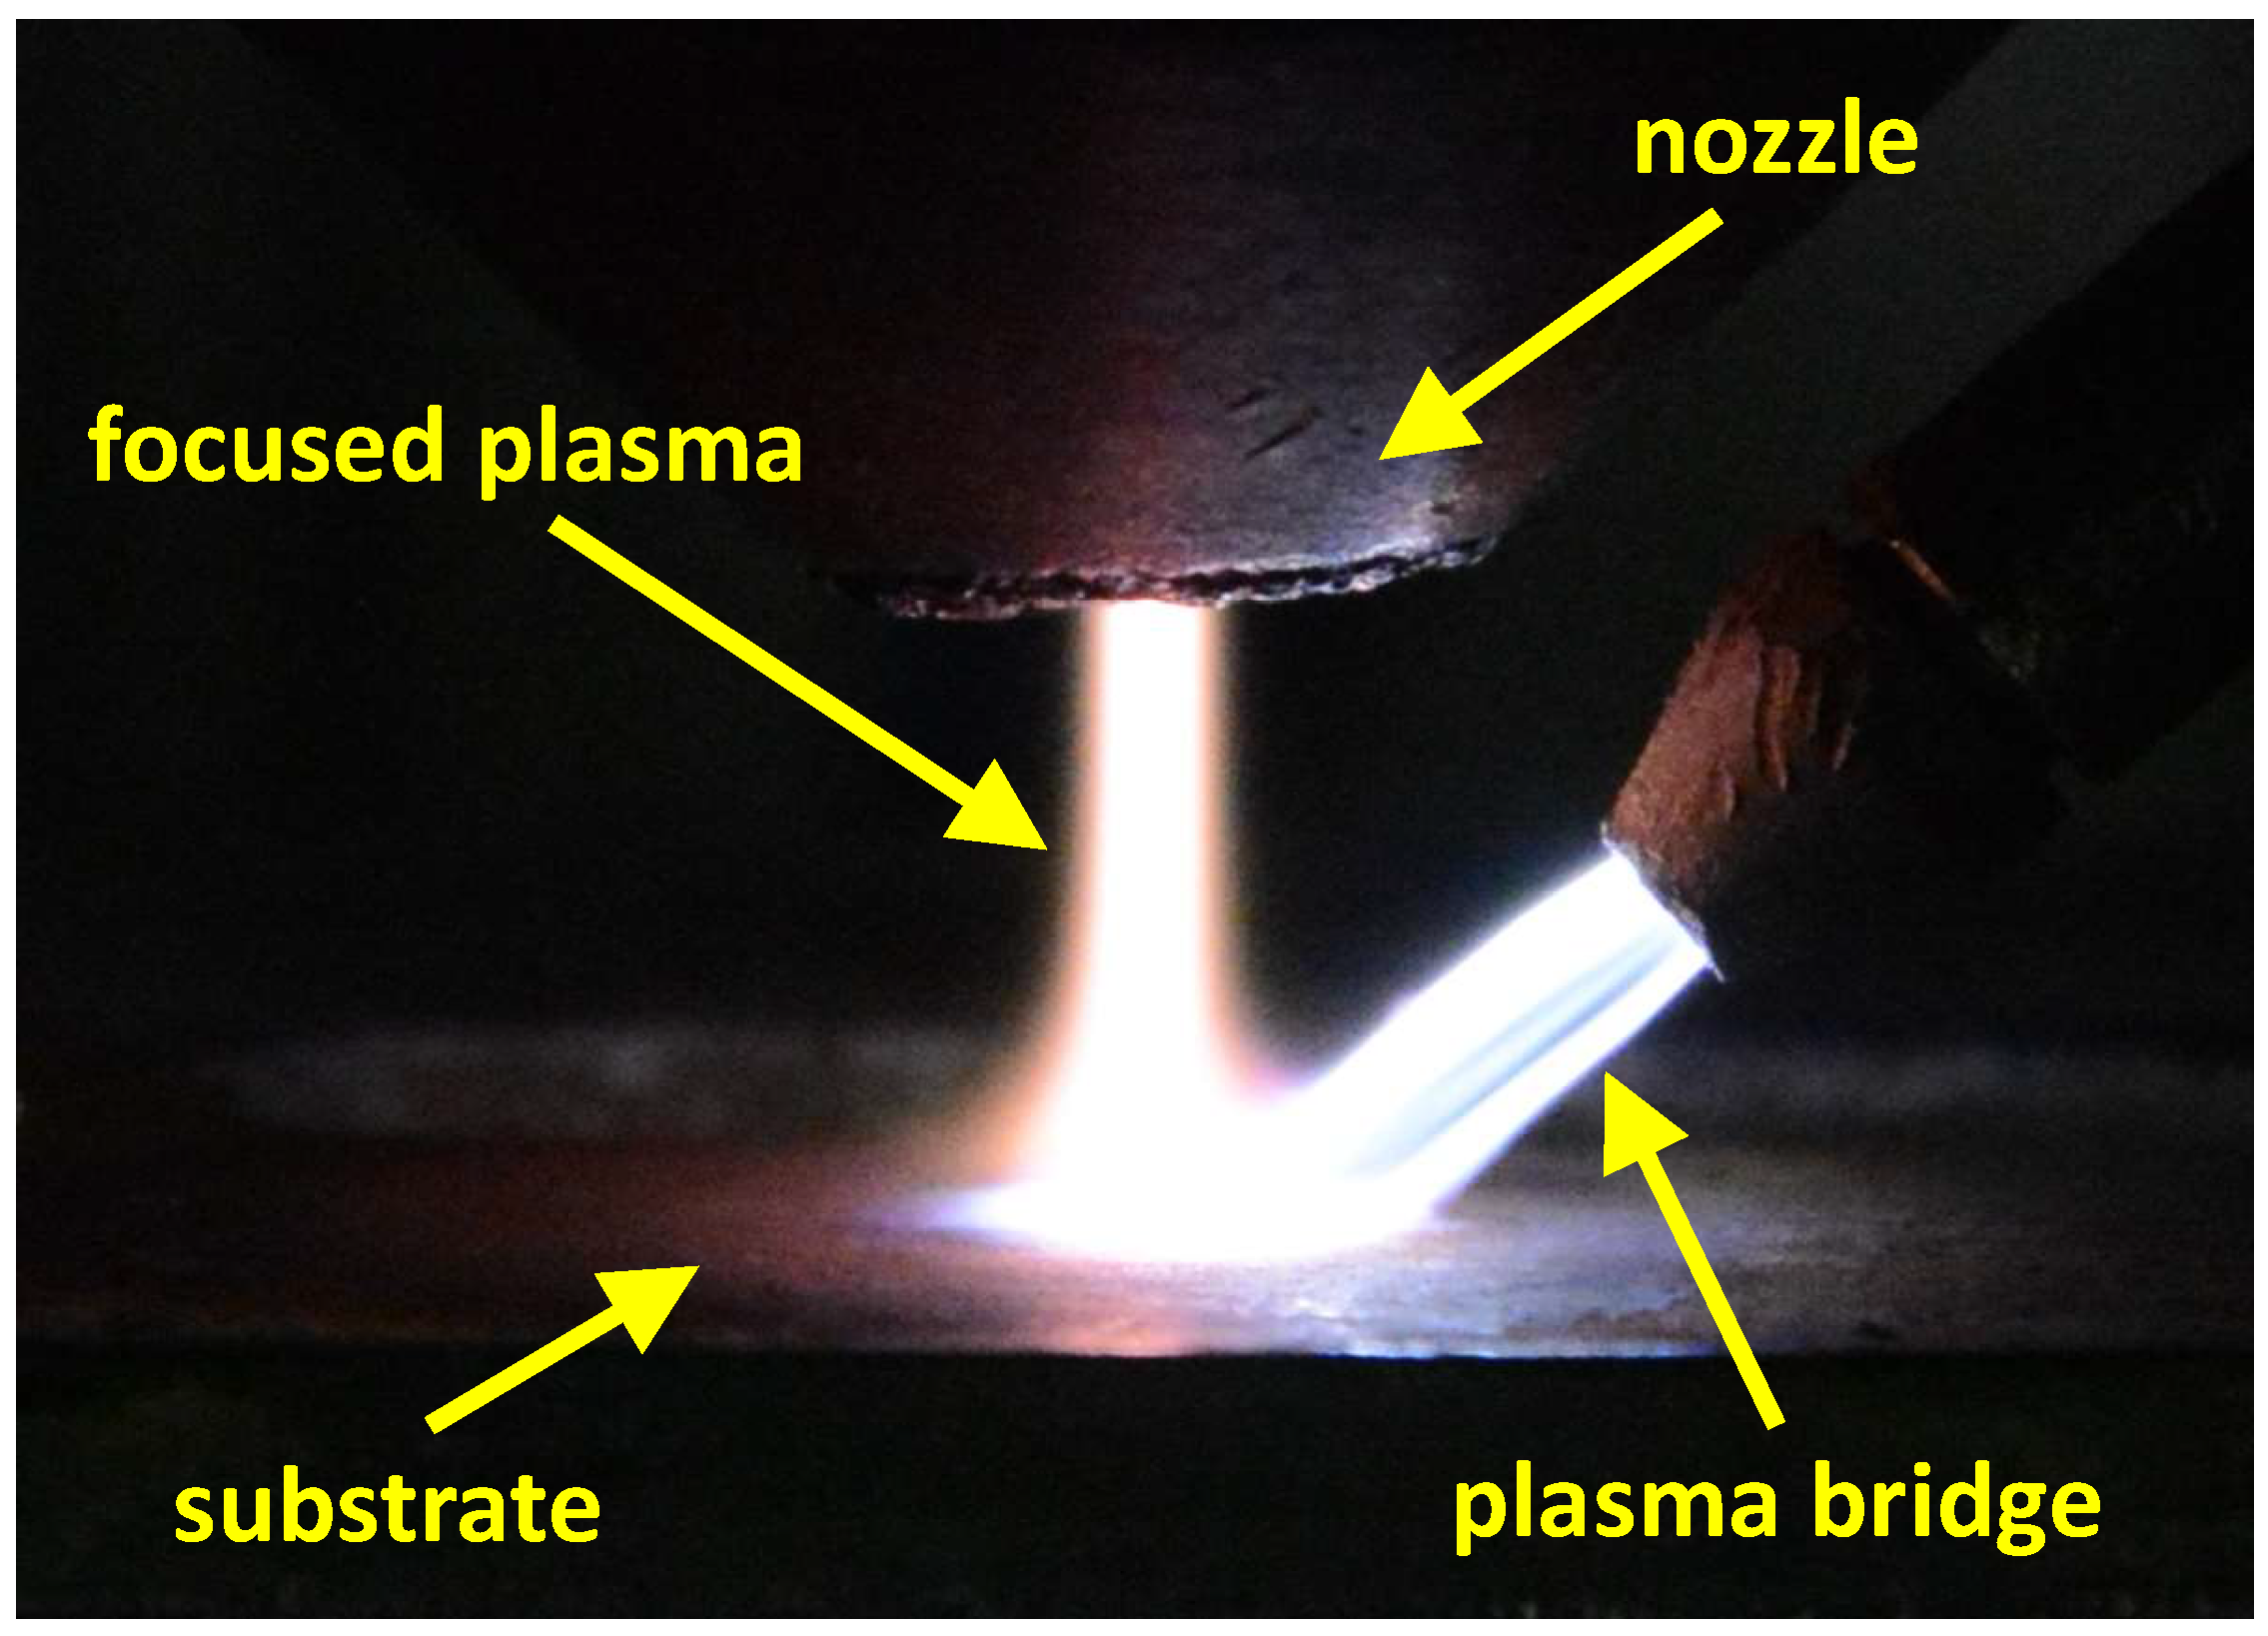
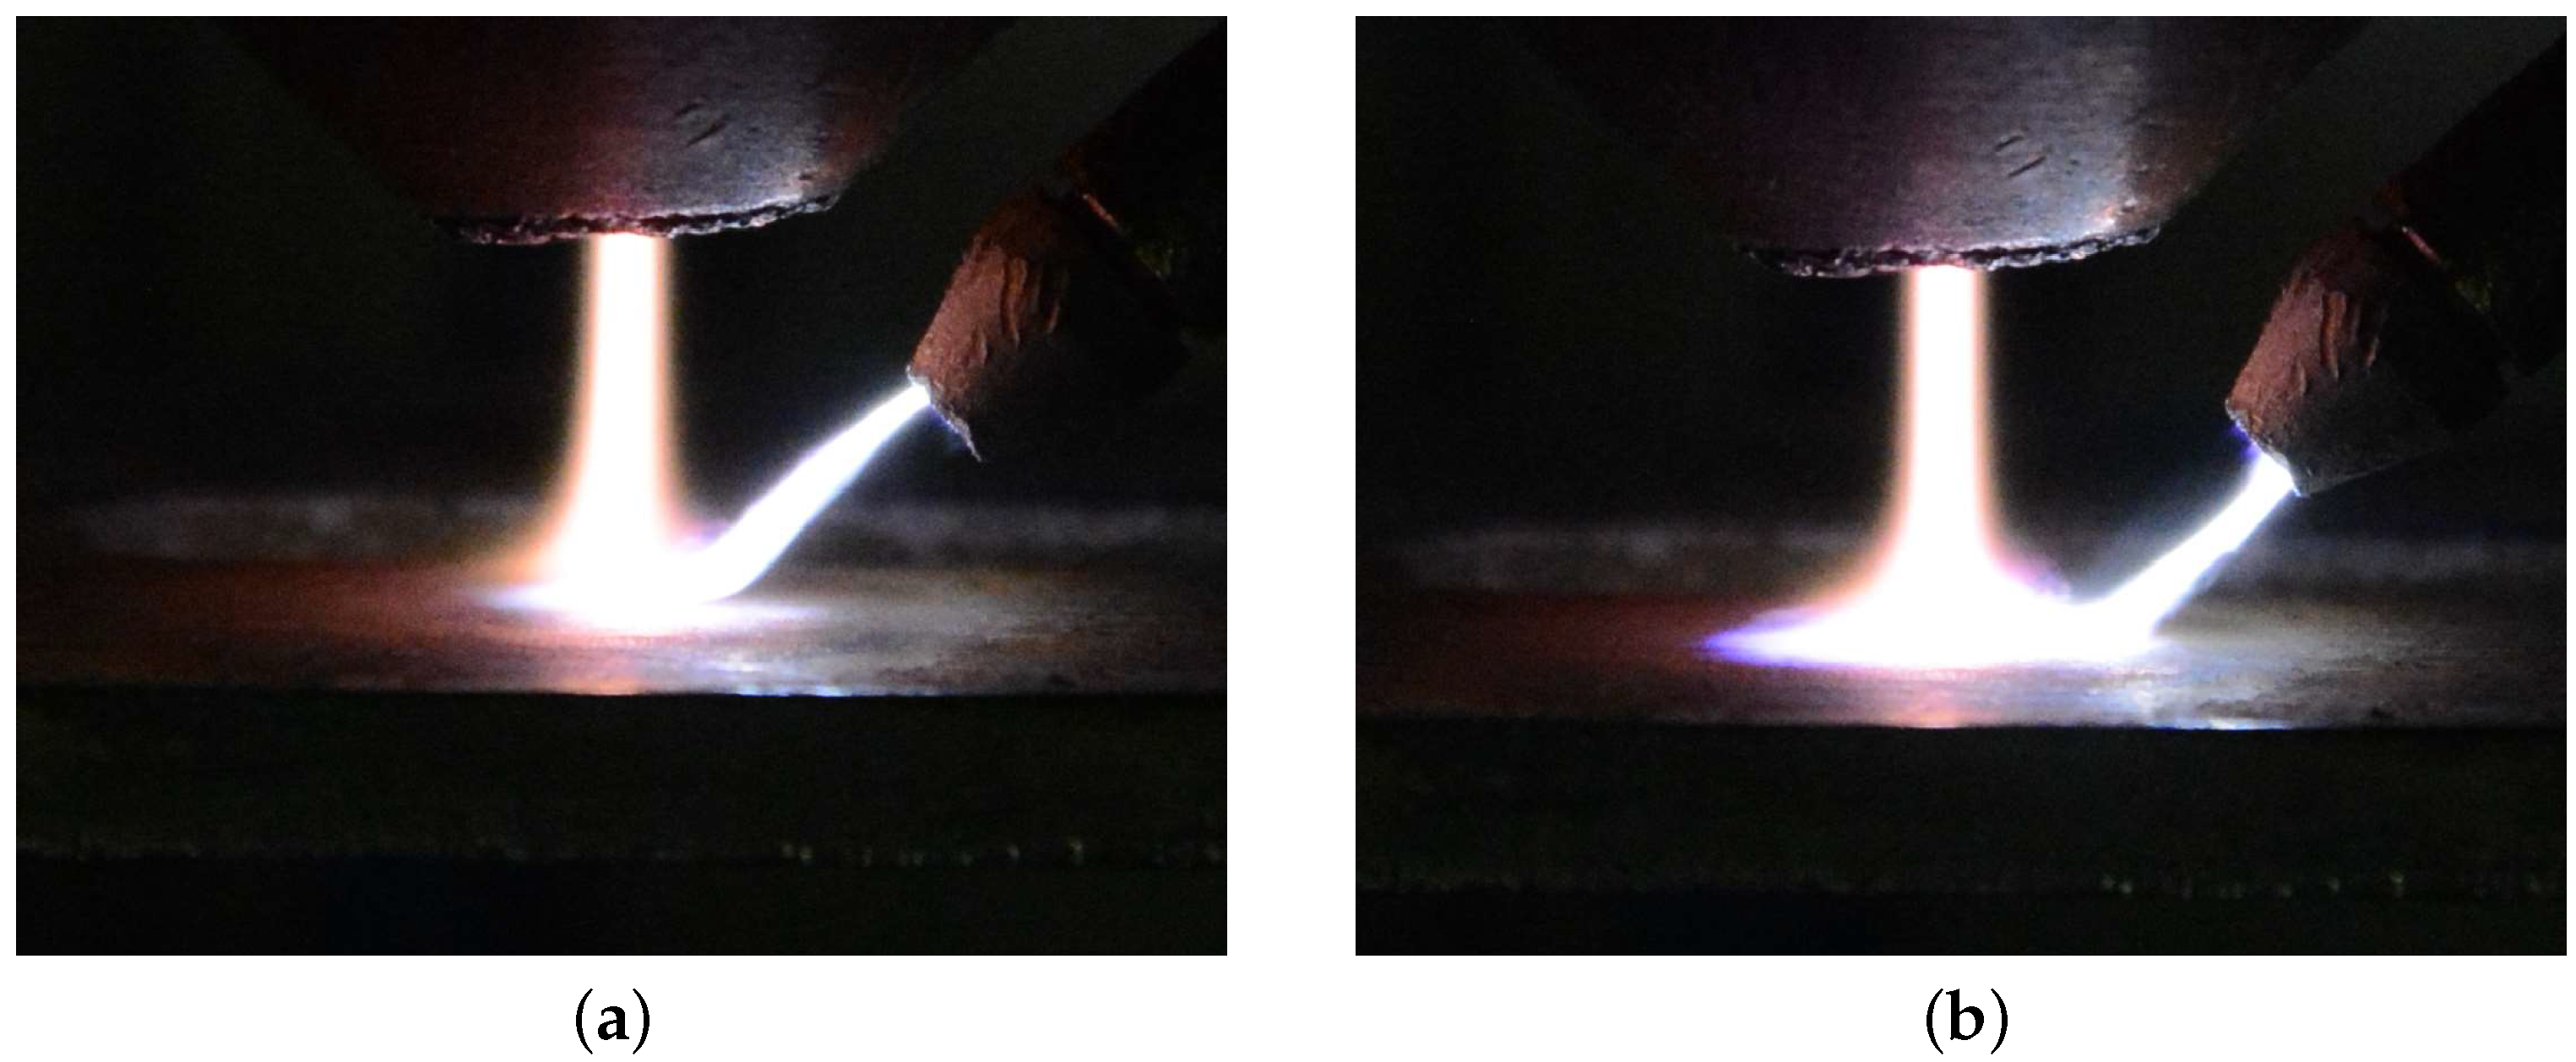
3.3.1. Plasma Bridge Structure
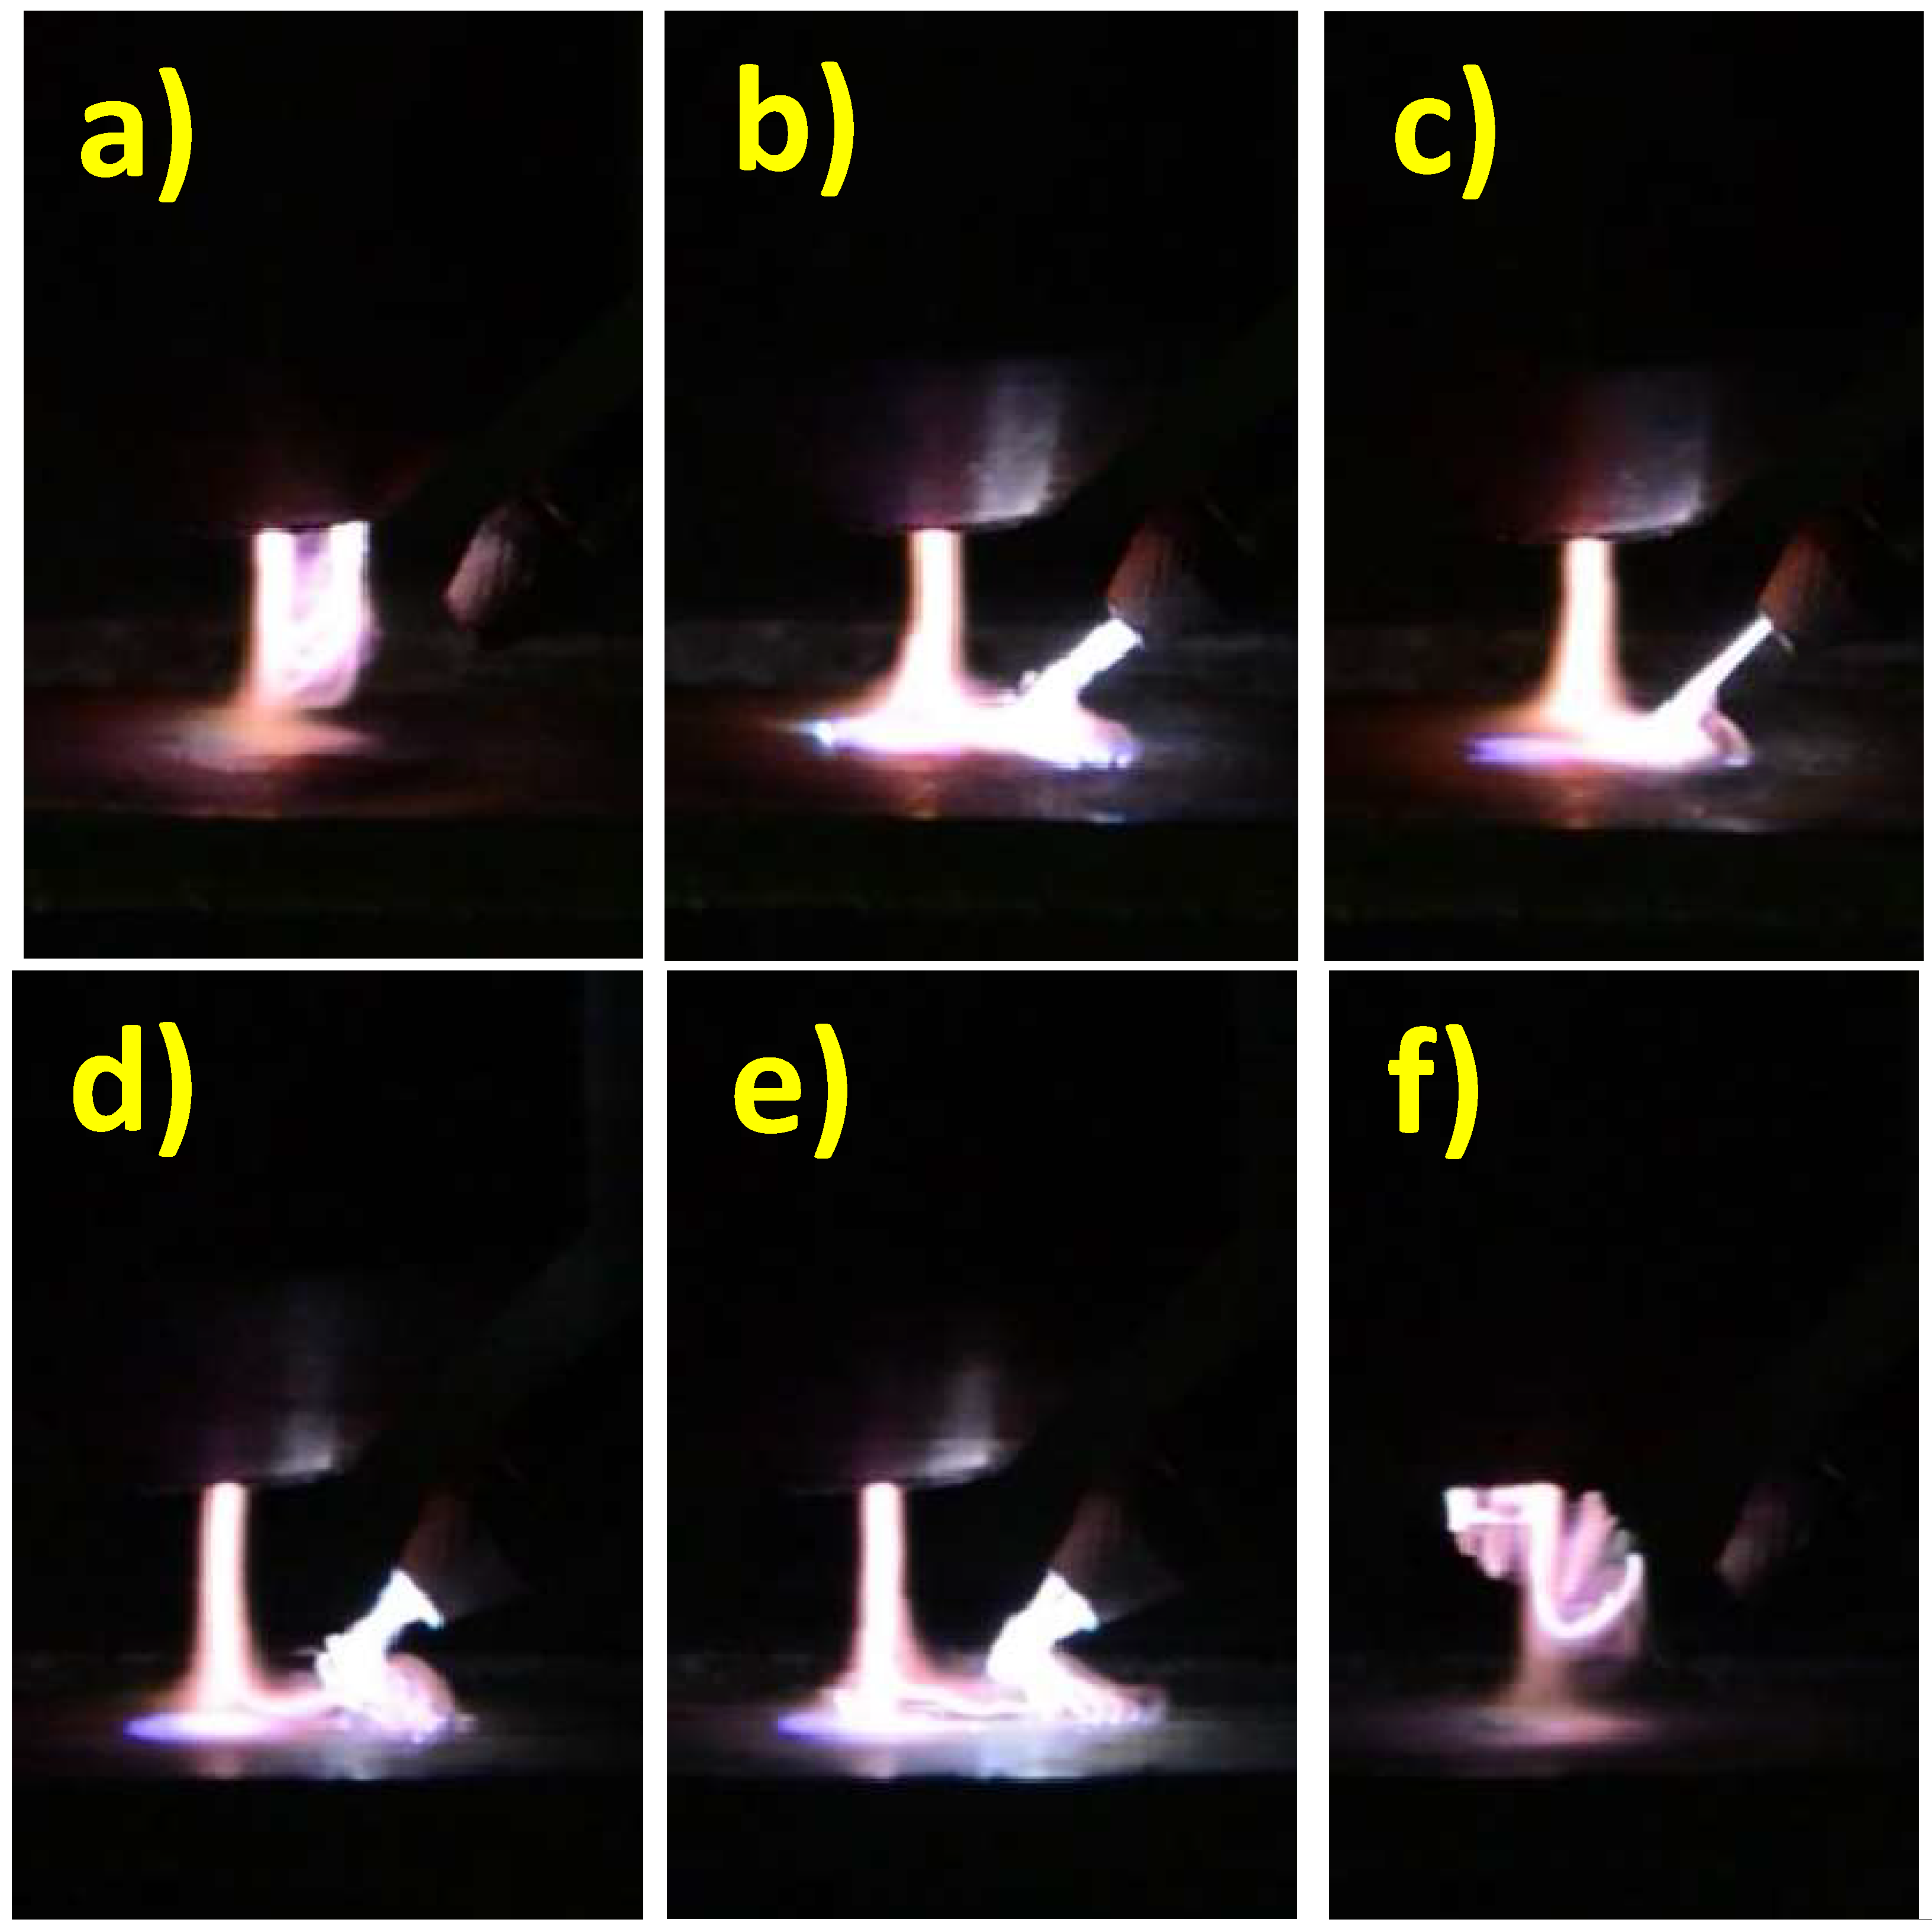
3.3.2. Ignition and Extinction by Argon Flow
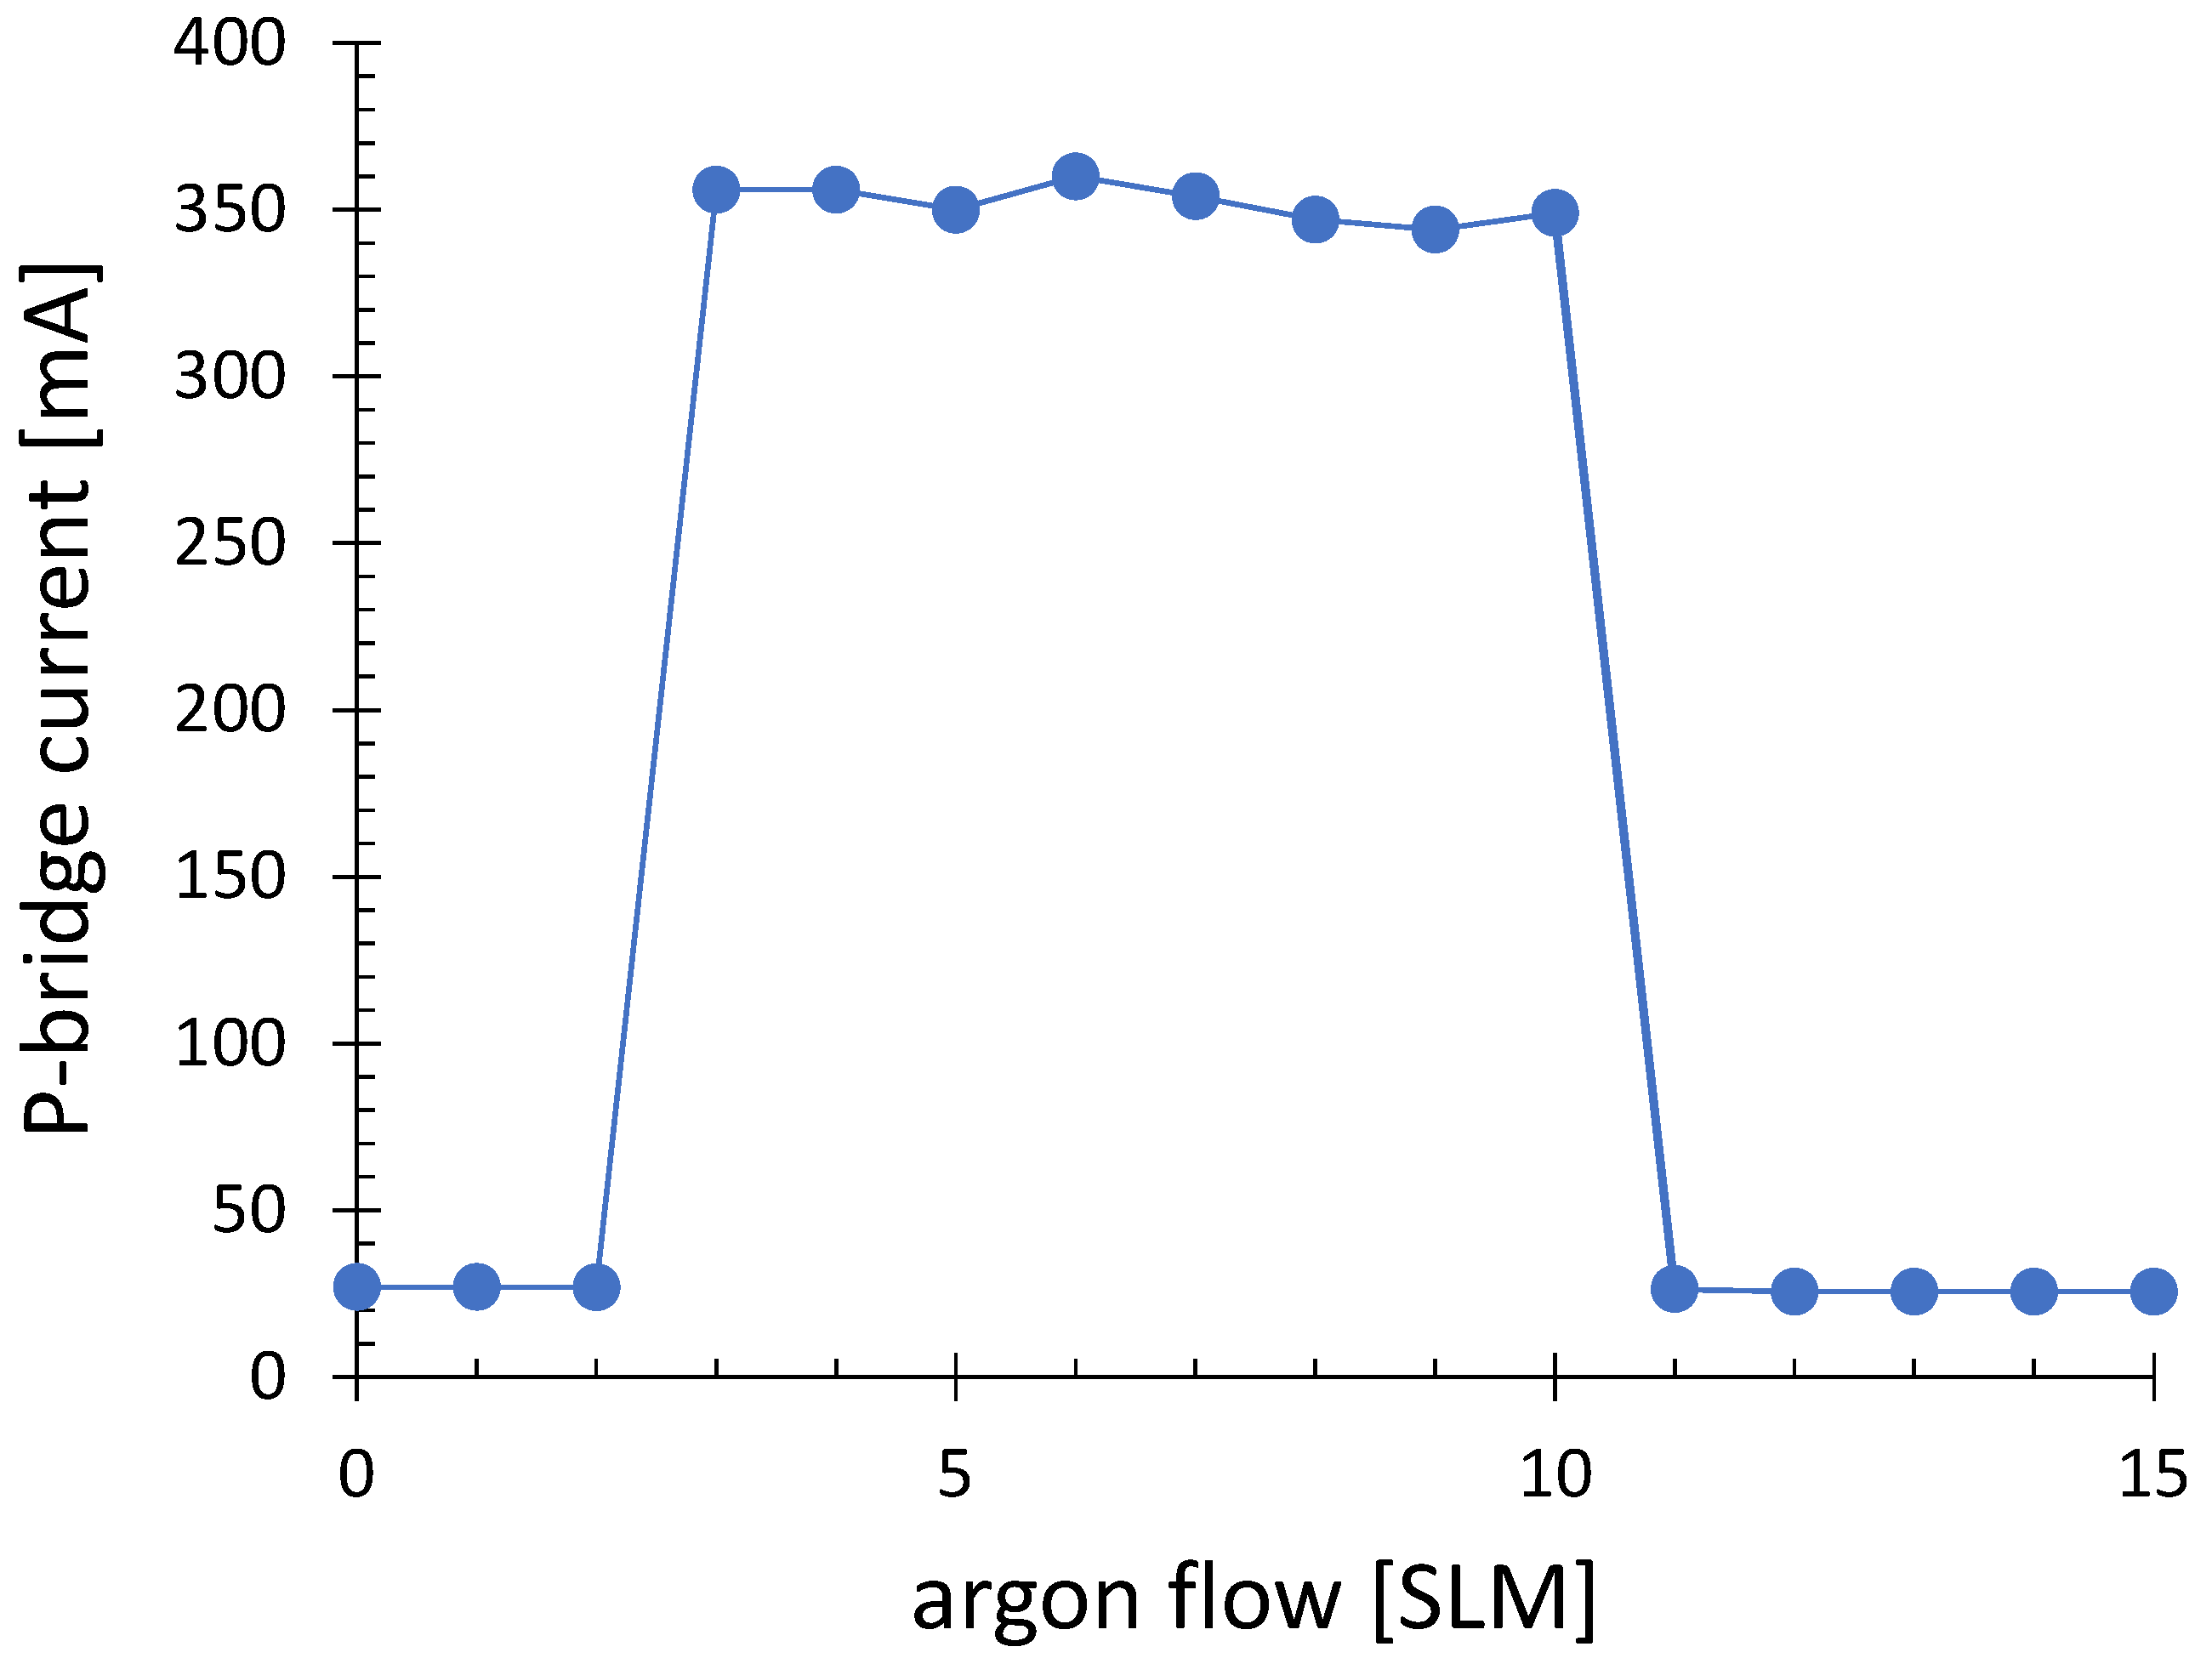
3.3.3. Plasma Bridge Current
- The consumption of argon is an economic factor. Its flow should be minimized.
- Argon dilutes the PAA-PJ gas, causing a decrease of the hydrogen concentration at the substrate and, consequently, the diminished efficiency of the oxide reduction process. From this point of view, the argon flow should be as low as possible.
- The presence of the argon at the foot of the transferred arc causes an increase of the contact area between the arc and the substrate and, consequently, a lower power density of the arc. The local temperature of the surface decreases, and the process efficiency drops. To minimize this effect, the smallest possible argon flow should be applied.
3.4. Application Example
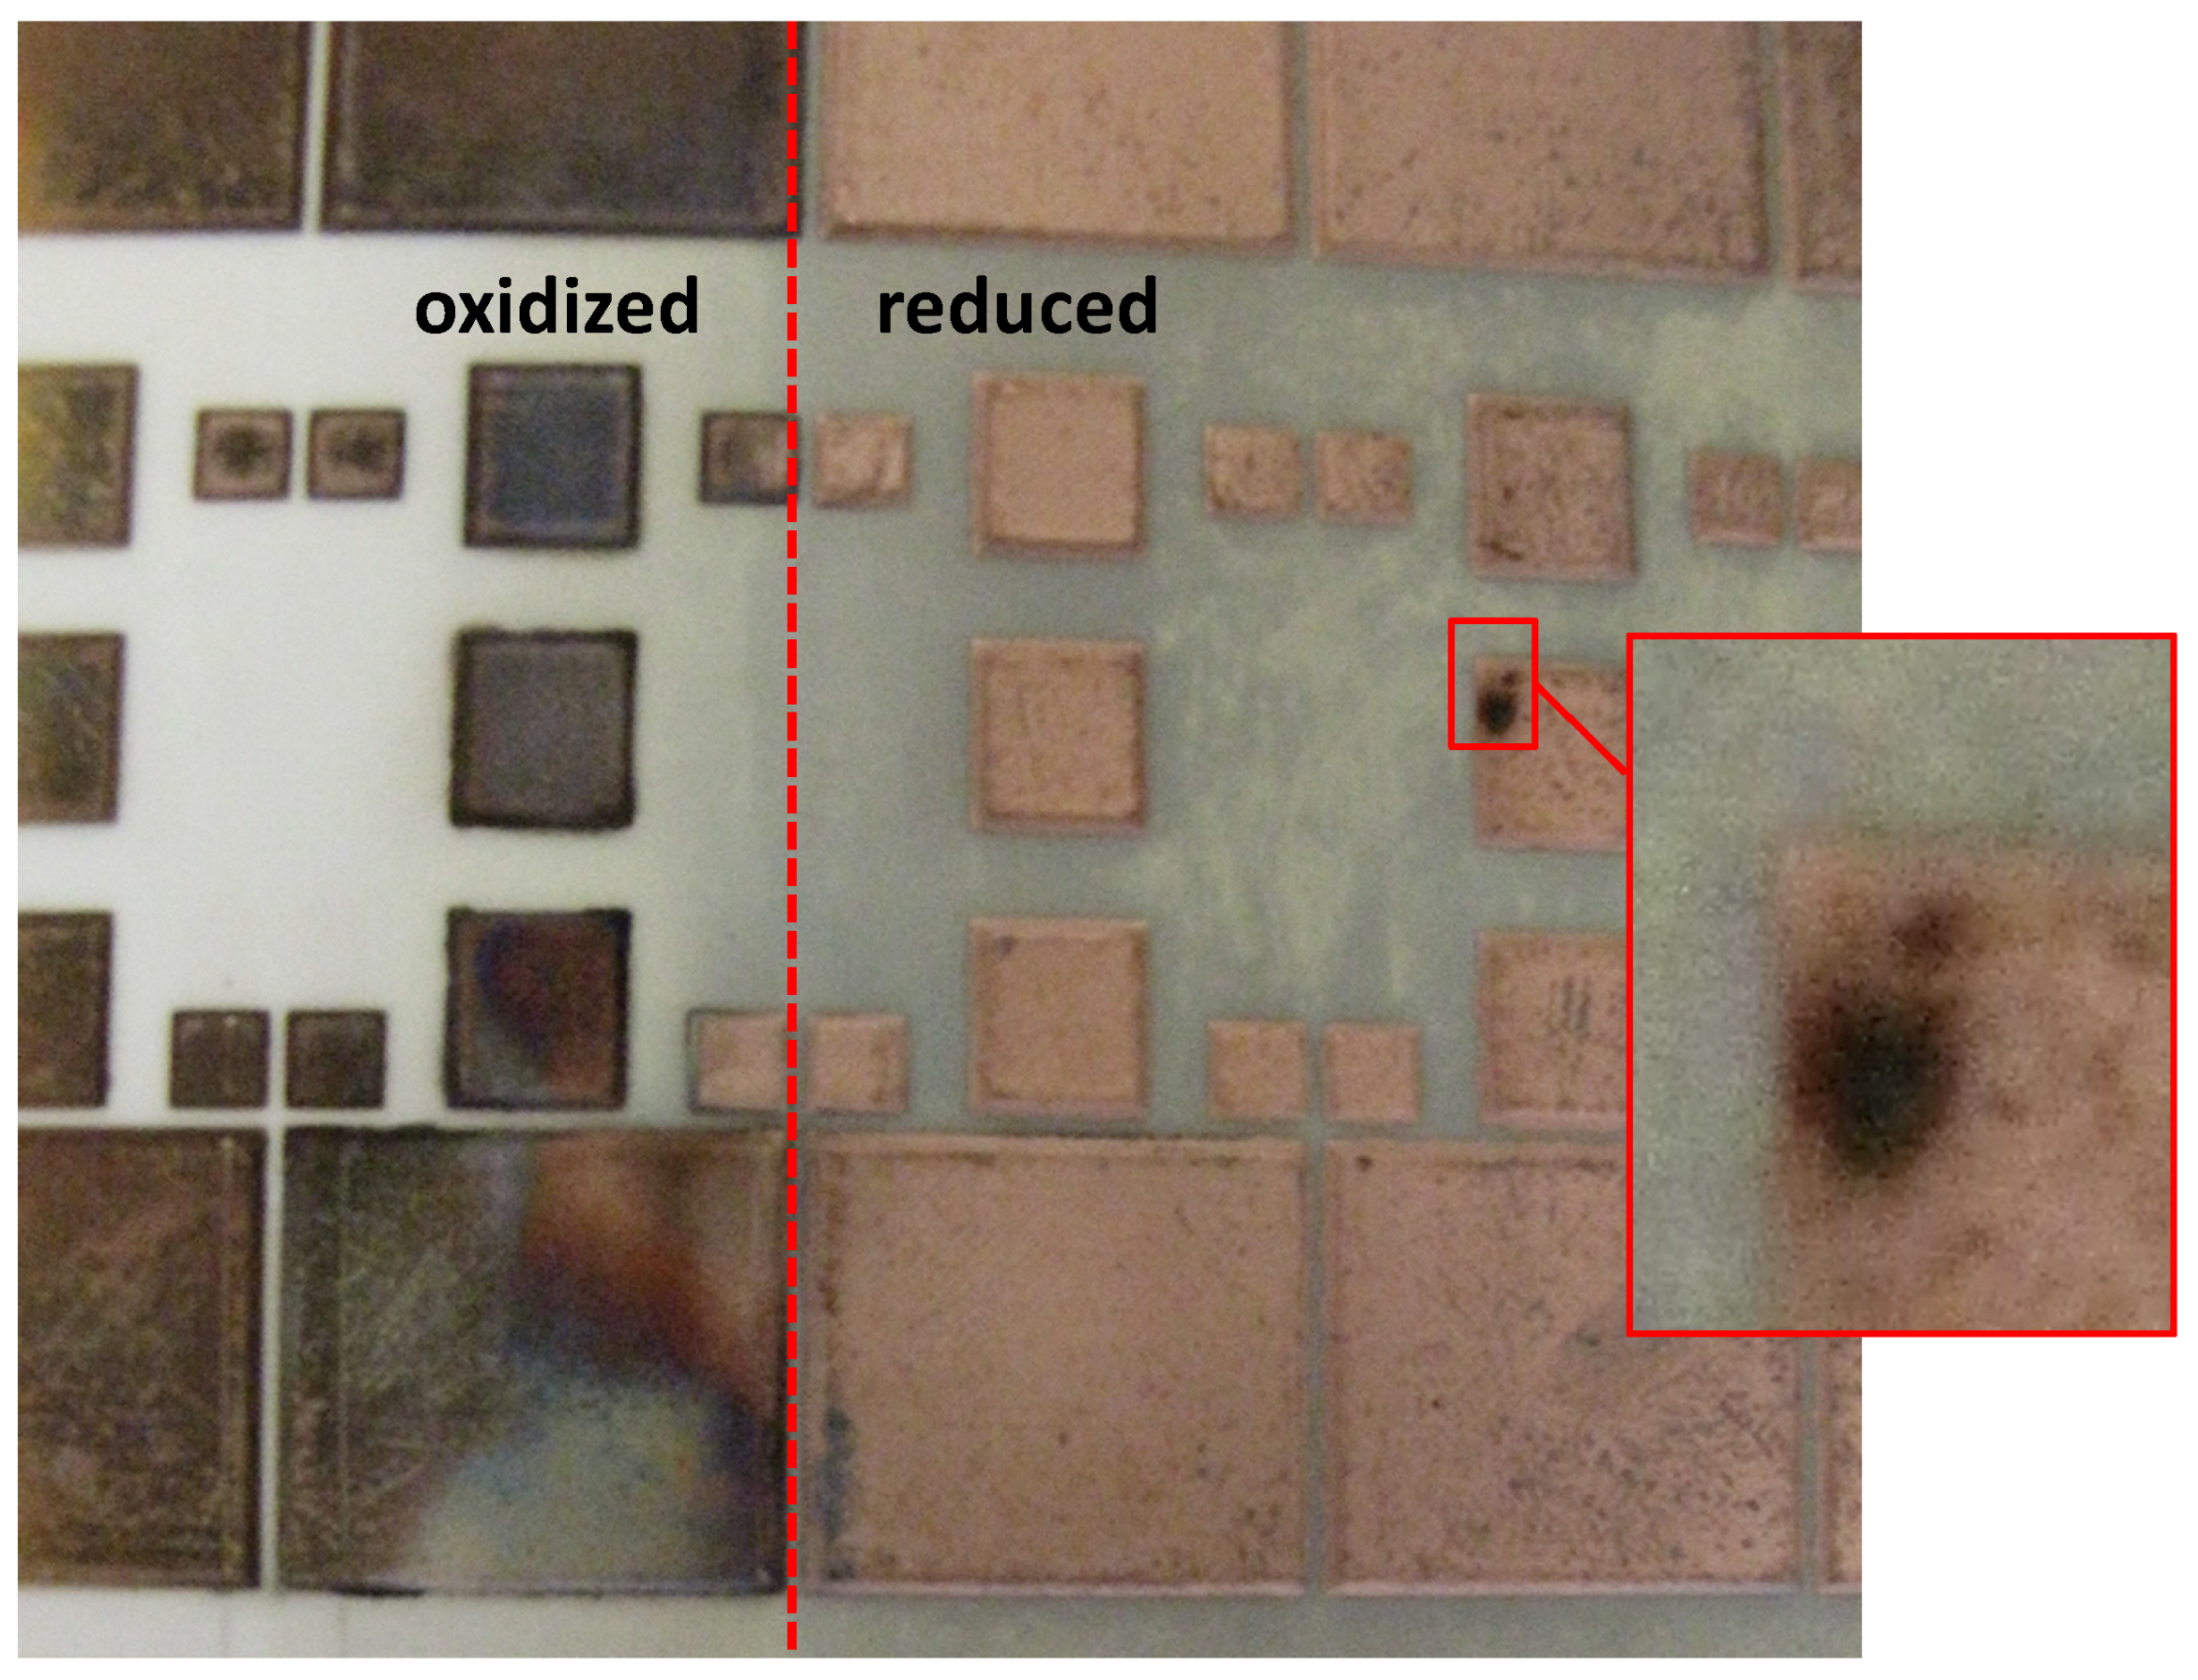
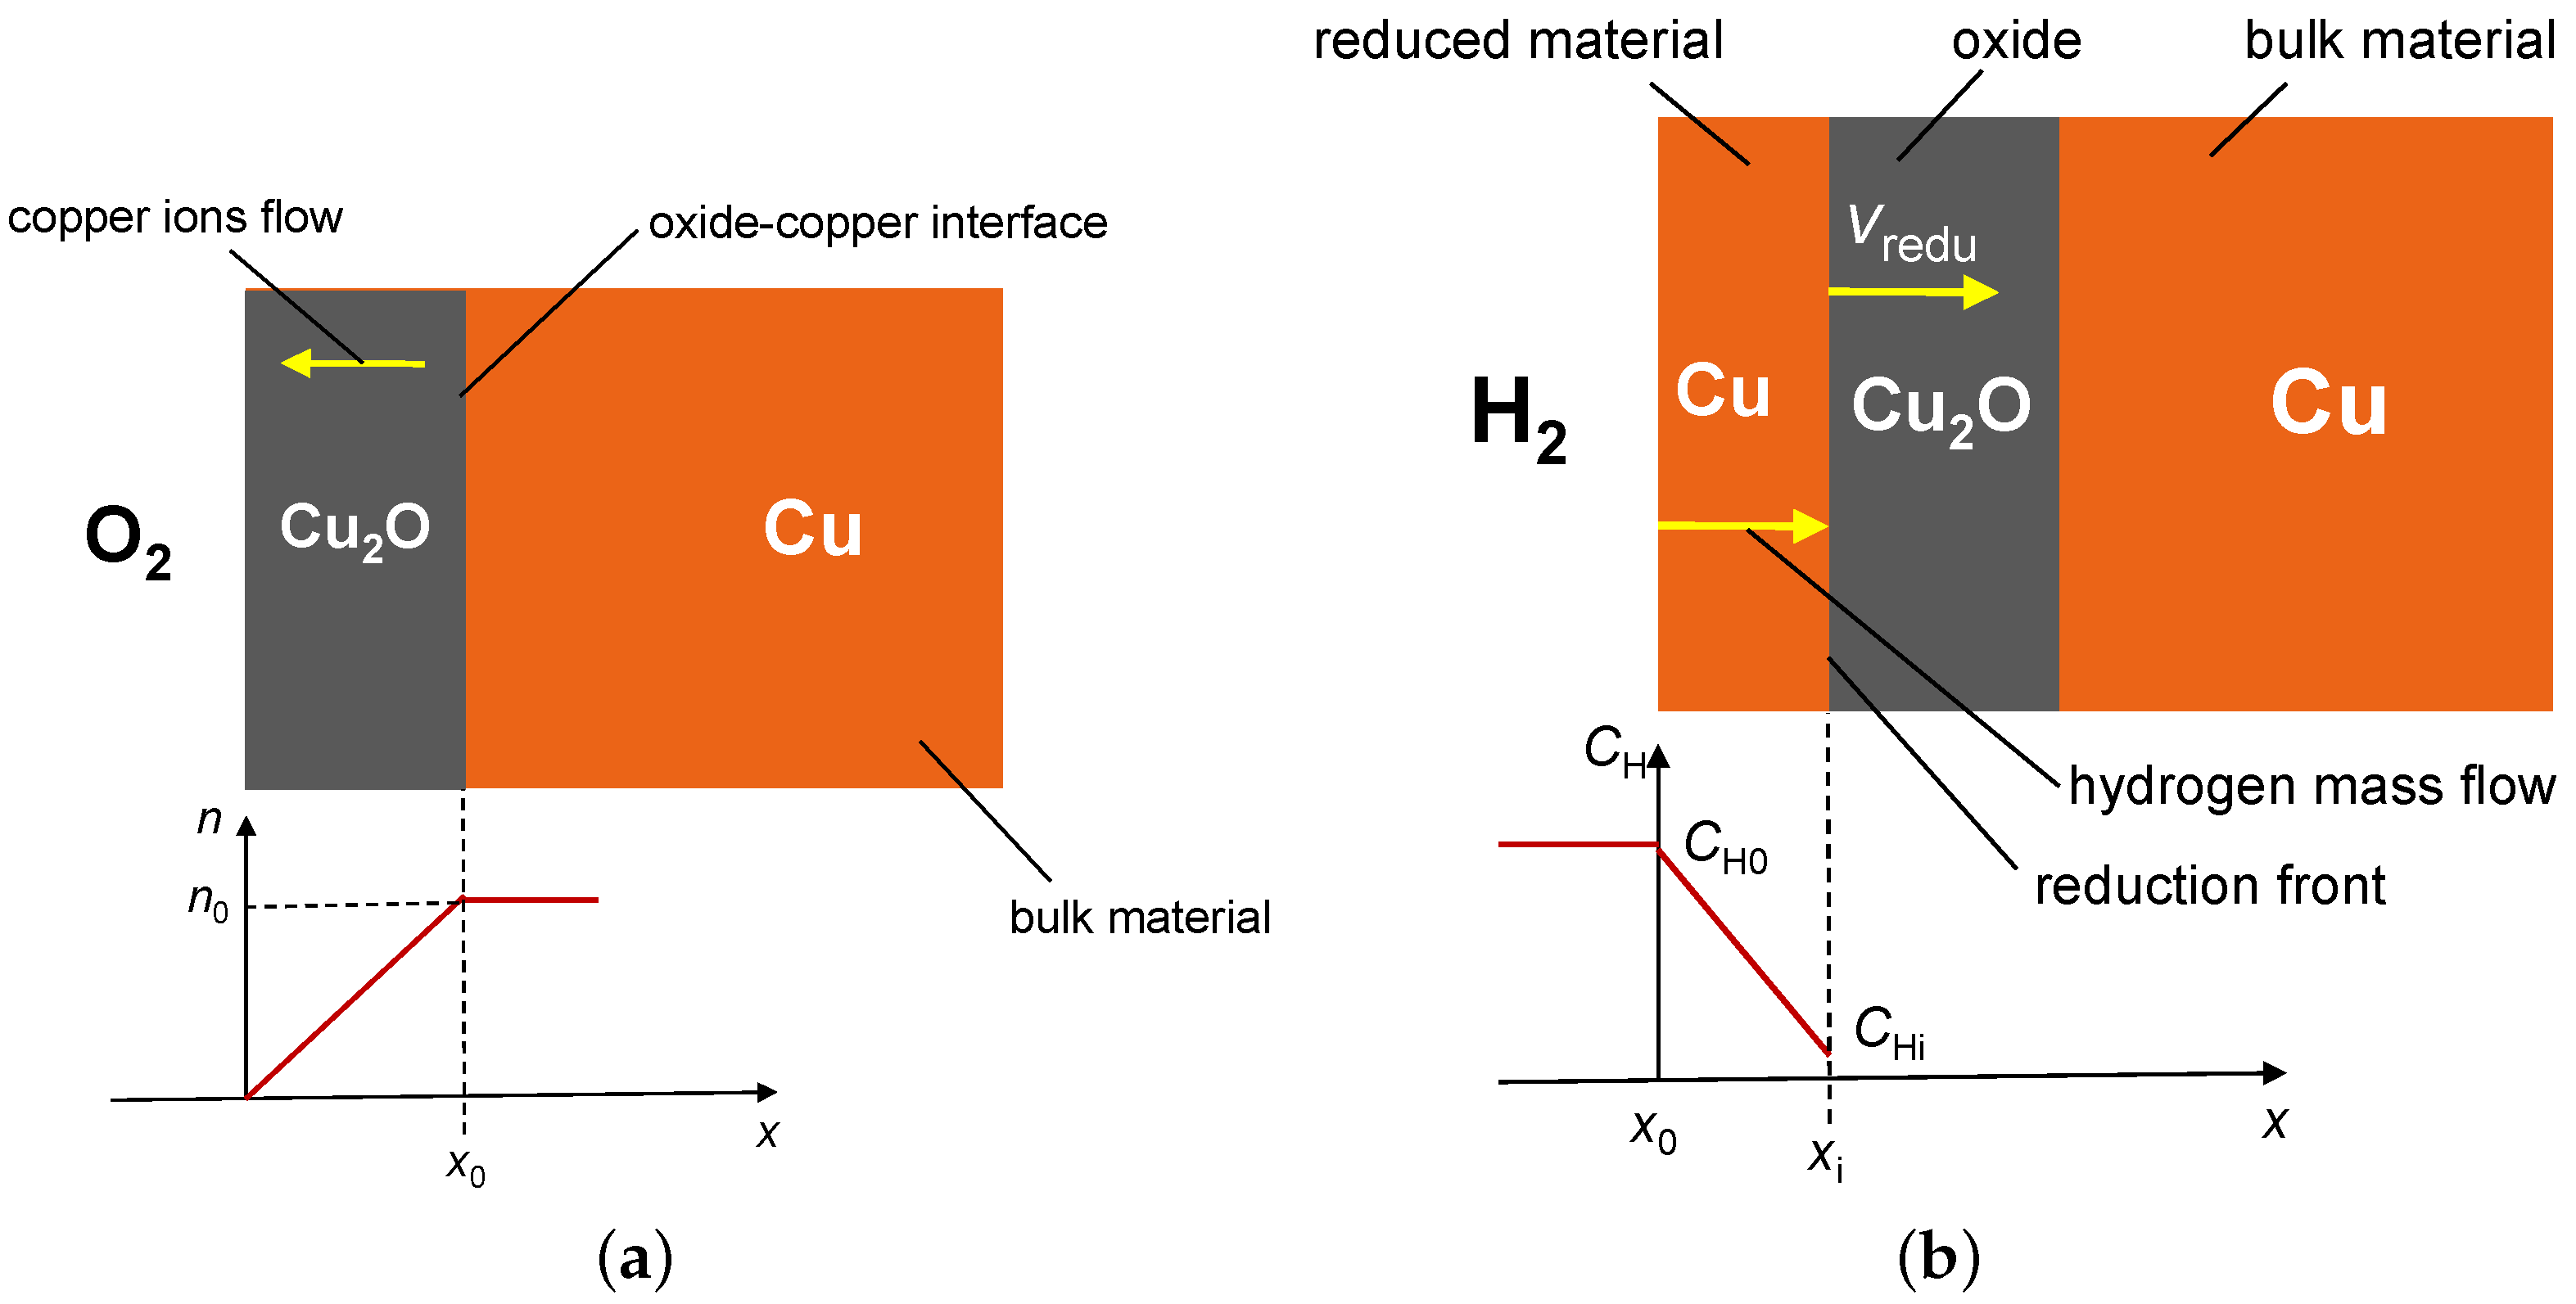
3.4.1. Oxidation Process
3.4.2. Reduction Process
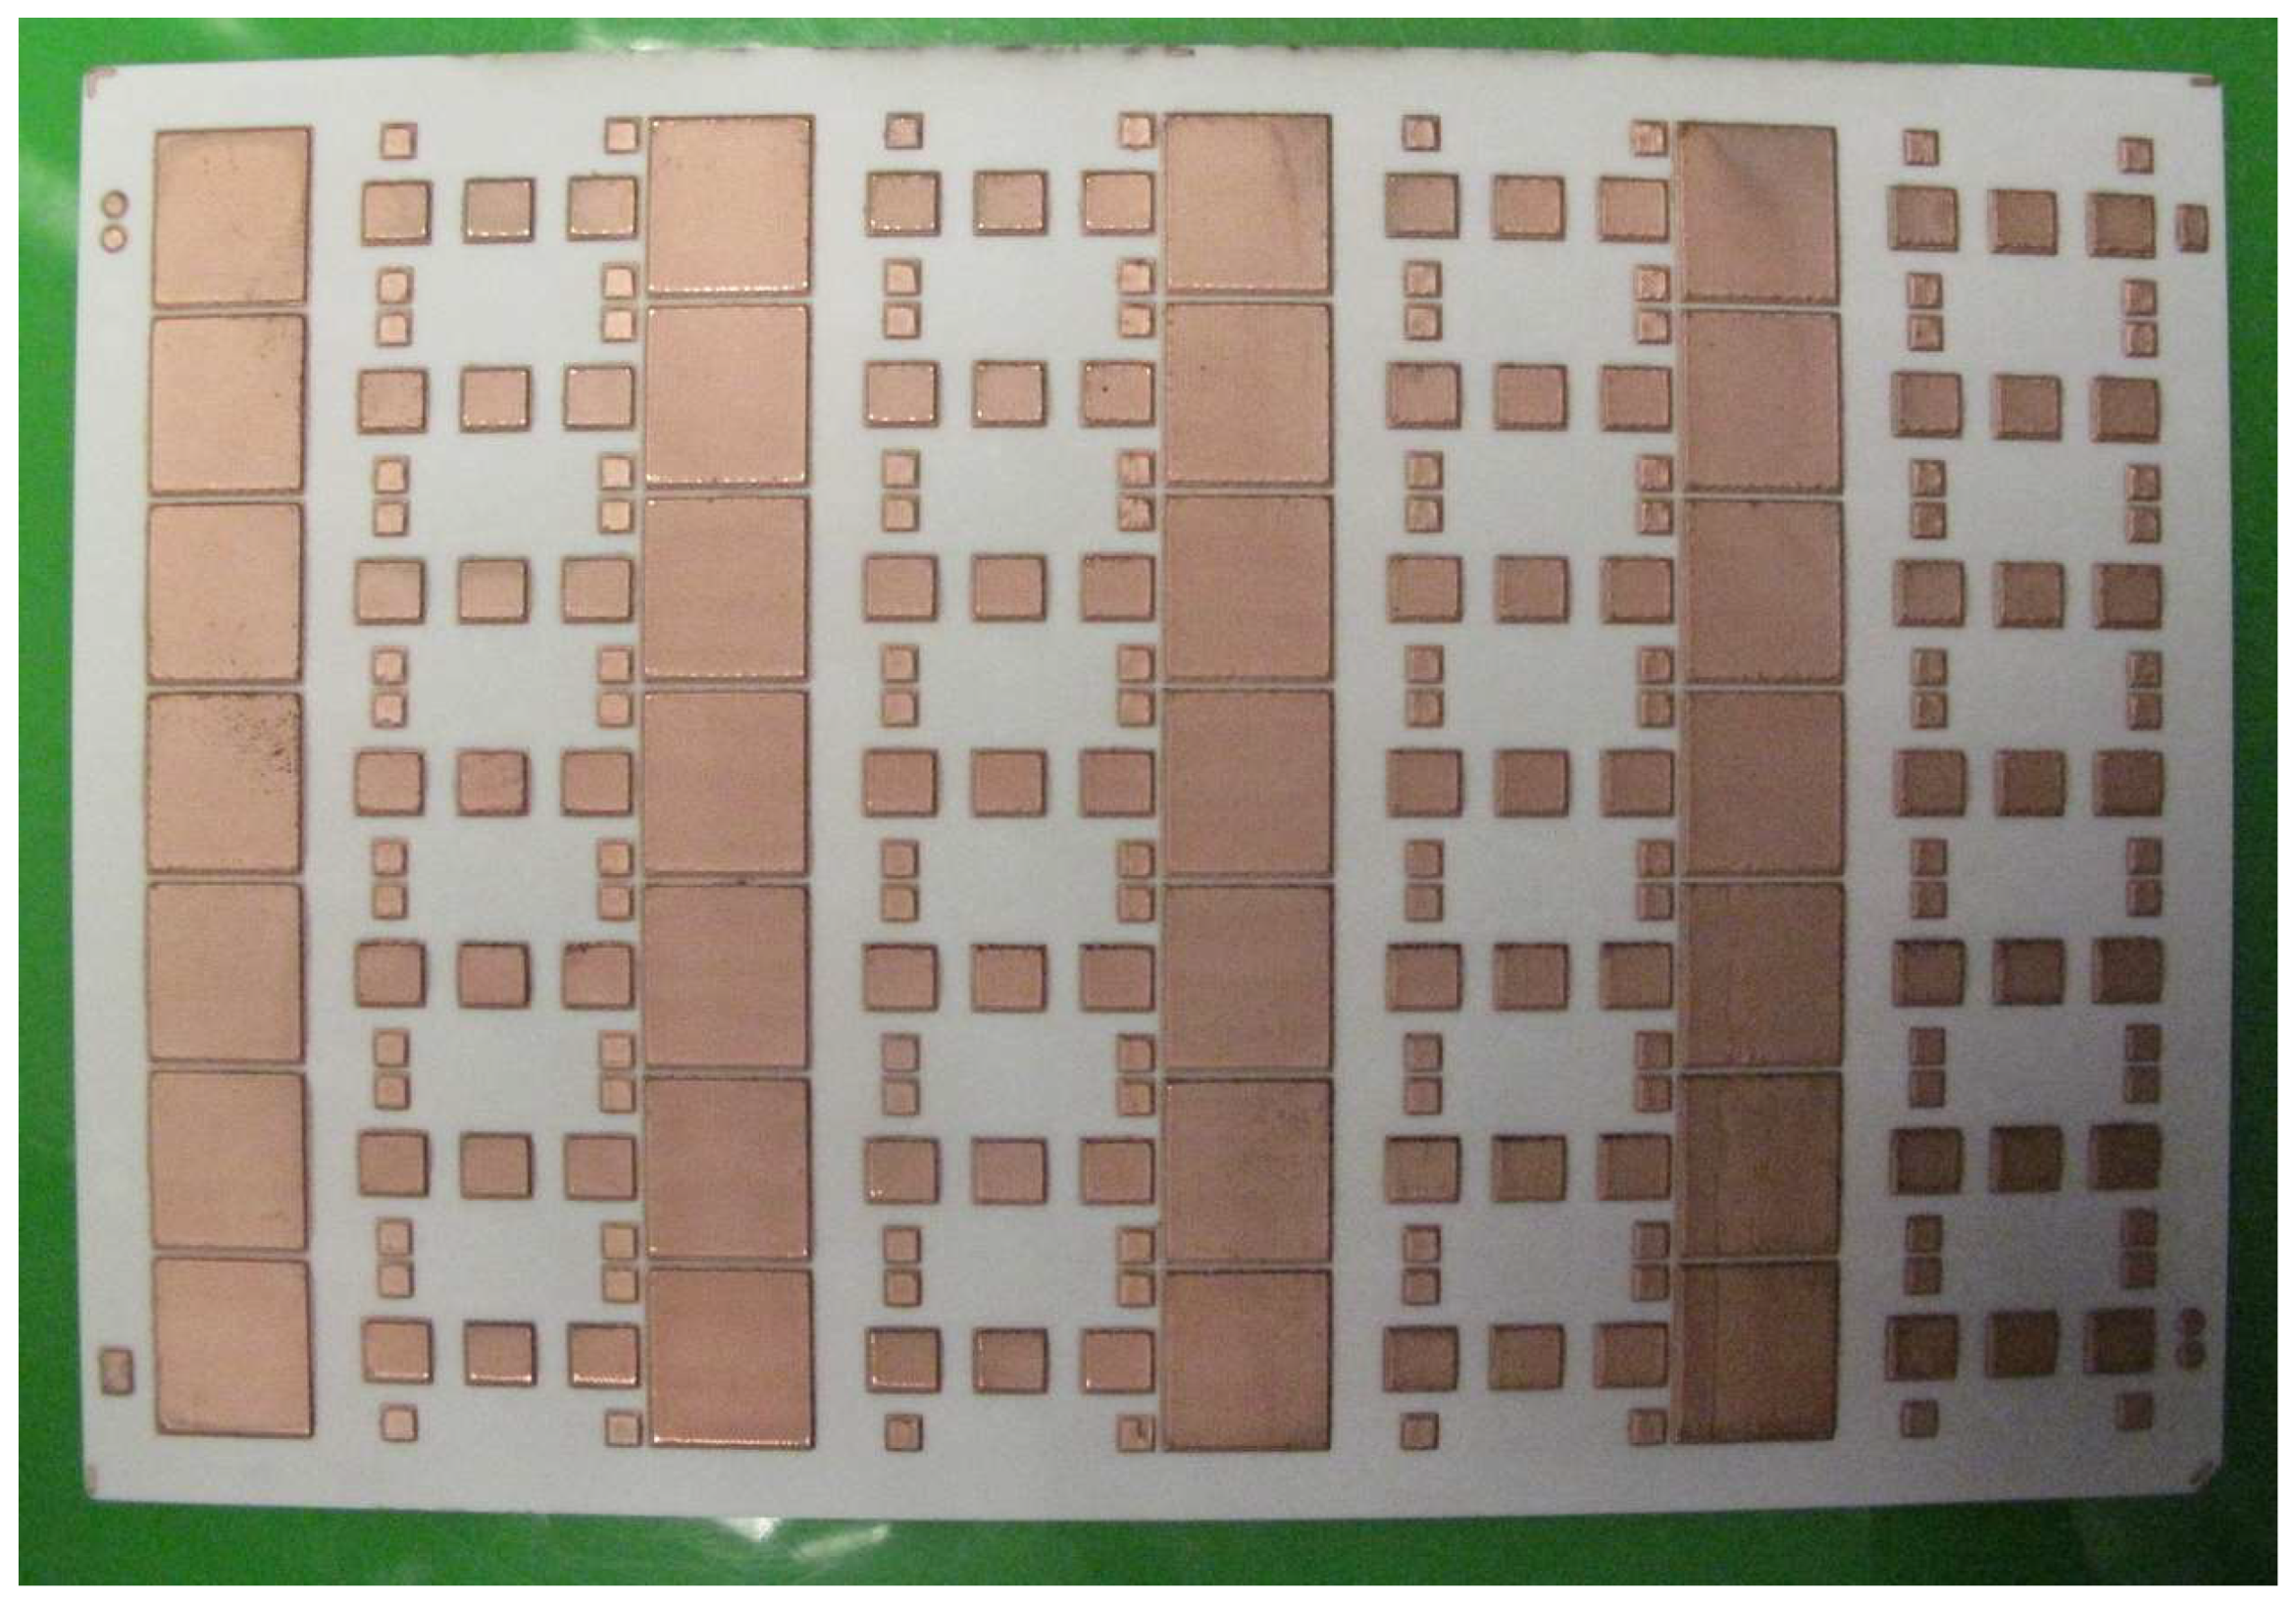
3.4.3. Treatment Results
4. Conclusions
Author Contributions
Funding
Data Availability Statement
Acknowledgments
Conflicts of Interest
Abbreviations
| APP | Atmospheric pressure plasma |
| APPJ | Atmospheric pressure plasma jet |
| PAA | Pulsed atmospheric arc |
| PAA-PJ | Pulsed atmospheric arc plasma jet |
| PET | Polyethylene terephthalate |
| PI | Polyimide |
| PDMS | Polydimethylsiloxane |
| HV | High voltage |
| ICP | Inductively coupled plasma |
| DBD | Dielectric barrier discharge |
| CDA | Compressed dried air |
| FG | Forming gas |
| MFC | Mass flow controller |
| SLM | Standard liters per minute |
Appendix A. Estimation of the Oxide Layer Thickness

Appendix B. Estimation of the Reduced Oxide Thickness
References
- Lu, X.; Laroussi, M.; Puech, V. On atmospheric-pressure non-equilibrium plasma jets and plasma bullets. Plasma Sources Sci. Technol. 2012, 21, 034005. [Google Scholar] [CrossRef]
- Winter, J.; Brandenburg, R.; Weltmann, K.D. Atmospheric pressure plasma jets: An overview of devices and new directions. Plasma Sources Sci. Technol. 2015, 24, 064001. [Google Scholar] [CrossRef]
- Laroussi, M. Nonthermal decontamination of biological media by atmospheric-pressure plasmas: Review, analysis, and prospects. IEEE Trans. Plasma Sci. 2002, 30, 1409–1415. [Google Scholar] [CrossRef]
- Tendero, C.; Tixier, C.; Tristant, P.; Desmaison, J.; Leprince, P. Atmospheric pressure plasmas: A review. Spectrochim. Acta Part B At. Spectrosc. 2006, 61, 2–30. [Google Scholar] [CrossRef]
- Pappas, D. Status and potential of atmospheric plasma processing of materials. J. Vac. Sci. Technol. A 2011, 29, 020801. [Google Scholar] [CrossRef] [Green Version]
- Kunhardt, E.E. Generation of large-volume, atmospheric-pressure, nonequilibrium plasmas. IEEE Trans. Plasma Sci. 2000, 28, 189–200. [Google Scholar] [CrossRef]
- Laroussi, M.; Akan, T. Arc-free atmospheric pressure cold plasma jets: A review. Plasma Proces. Polym. 2007, 4, 777–778. [Google Scholar] [CrossRef]
- Fanelli, F.; Fracassi, F. Atmospheric pressure non-equilibrium plasma jet technology: General features, specificities and applications in surface processing of materials. Surf. Coatings Technol. 2017, 322, 174–201. [Google Scholar] [CrossRef]
- Pearson, J.B. Aspects of Energy Transport in a Vortex Stabilized Arc. Ph.D. Thesis, The University of British Columbia, Department of Physics, Vancouver, BC, Canada, 1985. [Google Scholar]
- Hsu, C.C.; Yang, Y.J. The increase of the jet size of an atmospheric-pressure plasma jet by ambient air control. IEEE Trans. Plasma Sci. 2009, 38, 496–499. [Google Scholar]
- Hsu, C.C.; Wu, C.Y. Electrical characterization of the glow-to-arc transition of an atmospheric pressure pulsed arc jet. J. Phys. D Appl. Phys. 2009, 42, 215202. [Google Scholar] [CrossRef]
- Léoment, S.; Salem, D.B.; Carton, O.; Pulpytel, J.; Arefi-Khonsari, F. Influence of the nozzle material on an atmospheric pressure nitrogen plasma jet. IEEE Trans. Plasma Sci. 2014, 42, 2480–2481. [Google Scholar] [CrossRef]
- Noeske, M.; Degenhardt, J.; Strudthoff, S.; Lommatzsch, U. Plasma jet treatment of five polymers at atmospheric pressure: Surface modifications and the relevance for adhesion. Int. J. Adhes. Adhes. 2004, 24, 171–177. [Google Scholar] [CrossRef]
- Lommatzsch, U.; Pasedag, D.; Baalmann, A.; Ellinghorst, G.; Wagner, H.E. Atmospheric pressure plasma jet treatment of polyethylene surfaces for adhesion improvement. Plasma Process. Polym. 2007, 4, S1041–S1045. [Google Scholar] [CrossRef]
- Palleiro, C.; Stepanov, S.; Rodríguez-Senín, E.; Wilken, R.; Ihde, J. Atmospheric pressure plasma surface treatment of thermoplastic composites for bonded joints. In Proceedings of the 20th International Conference on Composite Materials-ICCM20, Copenhagen, Denemark, 19–24 July 2015; pp. 101–112. [Google Scholar]
- Ohkubo, Y.; Endo, K.; Yamamura, K. Adhesive-free adhesion between heat-assisted plasma-treated fluoropolymers (PTFE, PFA) and plasma-jet-treated polydimethylsiloxane (PDMS) and its application. Sci. Rep. 2018, 8, 18058. [Google Scholar] [CrossRef] [PubMed] [Green Version]
- Kim, M.C.; Yang, S.H.; Boo, J.H.; Han, J.G. Surface treatment of metals using an atmospheric pressure plasma jet and their surface characteristics. Surf. Coatings Technol. 2003, 174–175, 839–844. [Google Scholar] [CrossRef]
- Kim, M.C.; Song, D.K.; Shin, H.S.; Baeg, S.H.; Kim, G.S.; Boo, J.H.; Han, J.G.; Yang, S.H. Surface modification for hydrophilic property of stainless steel treated by atmospheric-pressure plasma jet. Surf. Coatings Technol. 2003, 171, 312–316. [Google Scholar] [CrossRef]
- Toshifuji, J.; Katsumata, T.; Takikawa, H.; Sakakibara, T.; Shimizu, I. Cold arc-plasma jet under atmospheric pressure for surface modification. Surf. Coatings Technol. 2003, 171, 302–306. [Google Scholar] [CrossRef]
- Lin, G.W.; Jiang, Y.H.; Kao, P.K.; Chiu, I.C.; Wu, Y.H.; Hsu, C.C.; Cheng, I.C.; Chen, J.Z. Nitrogen atmospheric-pressure-plasma-jet induced oxidation of SnOx thin films. Plasma Chem. Plasma Process. 2015, 35, 979–991. [Google Scholar] [CrossRef]
- Szulc, M.; Forster, G.; Marques-Lopez, J.L.; Schein, J. A simple and compact laser scattering setup for characterization of a pulsed low-current discharge. Appl. Sci. 2022, 12, 6915. [Google Scholar] [CrossRef]
- Szulc, M.; Forster, G.; Marques-Lopez, J.L.; Schein, J. Spectroscopic characterization of a pulsed low-current high-voltage discharge operated at atmospheric pressure. Appl. Sci. 2022, 12, 6366. [Google Scholar] [CrossRef]
- Szulc, M.; Forster, G.; Marques-Lopez, J.L.; Schein, J. Influence of pulse amplitude and frequency on plasma properties of a pulsed low-current high-voltage discharge operated at atmospheric pressure. Appl. Sci. 2022, 12, 6580. [Google Scholar] [CrossRef]
- Little, C.; Korzec, D.; Burger, D.; Nettesheim, S. Enhancing bonding properties of pressure-sensitive adhesives on white goods by means of atmospheric-pressure plasma treatment. In Proceedings of the Fourteenth International Triennial Conference on the Science and Technology of Adhesion and Adhesives, Adhesion’2019, Bristol, UK, 3–5 September 2019; pp. 1–4. [Google Scholar]
- Käppler, I.; Hund, R.D.; Cherif, C. Surface modification of carbon fibers using plasma technique. Autex Res. J. 2014, 14, 34–38. [Google Scholar] [CrossRef] [Green Version]
- Neermann, S.; Scheetz, M.; Franke, J.; Roudenko, J.; Schirmer, J.; Reichenberger, M. Substrate pretreatments: An investigation of the effects on areosol jet printed structures. In Advances in Production Research: Proceedings of the 8th Congress of the German Academic Association for Production Technology (WGP); Schmitt, R., Schuh, G., Eds.; Springer: Aachen, Germany, 2018; pp. 352–360. [Google Scholar] [CrossRef]
- Hirman, M.; Navratil, J.; Soukup, R.; Hamacek, A.; Steiner, F. Influence of flexible substrate roughness with aerosol jet printed pads on the mechanical shear strength of glued joints. In Proceedings of the 40th International Spring Seminar on Electronics Technology (ISSE), Sofia, Bulgaria, 10–14 May 2017; pp. 1–6. [Google Scholar]
- Szulc, M.; Schein, S.; Schaup, J.; Zimmermann, S.; Schein, J. Suitability of thermal plasmas for large-area bacteria inactivation on temperature-sensitive surfaces – first results with Geobacillus stearothermophilus spores. IOP Conf. Ser. J. Phys. 2017, 825, 012017. [Google Scholar] [CrossRef] [Green Version]
- Wen Hsu, Y.; Li, H.C.; Yang, Y.J.; Che Hsu, C. Deposition of zinc oxide thin films by an atmospheric pressure plasma jet. Thin Solid Film. 2011, 519, 3095–3099. [Google Scholar] [CrossRef]
- Korzec, D.; Nettesheim, S. Application of a pulsed atmospheric arc plasma jet for low-density polyethylene coating. Plasma Process. Polym. 2020, 17, 1900098. [Google Scholar] [CrossRef]
- Korzec, D.; Nettesheim, S.; Ammon, A. Plasmawerkzeug für den Flussmittelauftrag auf Leiterplatten. In Atmosphärische Plasmen: Anwendungen-Entwicklungen-Anlagen; Horn, K., Ed.; Anwenderkreis Atmosphärendruckplasma-ak-adp: Jena, Germany, 2019; pp. 158–167. [Google Scholar]
- Köhler, R.; Sauerbier, P.; Militz, H.; Viöl, W. Atmosphereic pressure plasma coating of wood and MDF with polyester Powder. Coatings 2017, 7, 171. [Google Scholar] [CrossRef] [Green Version]
- Jnido, G.; Ohms, G.; Viöl, W. Deposition of TiO2 thin films on wood substrate by an air atmospheric pressure plasma jet. Coatings 2019, 9, 441. [Google Scholar] [CrossRef] [Green Version]
- Köhler, R.; Ohms, G.; Militz, H.; Viöl, W. Atmosphereic pressure plasma coating of bismuth oxide circular droplets. Coatings 2018, 8, 312. [Google Scholar] [CrossRef] [Green Version]
- Korzec, D.; Burger, D.; Nettesheim, S. Plasmaaktivierung von Rolle zu Rolle. Adhäsion Kleb. Dicht. 2015, 59, 26–31. [Google Scholar] [CrossRef]
- Ward, J.W.; King, H.J. Mercury hollow cathode plasma bridge neutralizers. J. Spacecr. 1968, 5, 1161–1164. [Google Scholar] [CrossRef]
- Kaufman, H.R. Fundamentals of Ion-Source Operation; Commonwealth Scientific Corporation: Alexandria, VA, USA, 1984; Chapter V.D; p. 60. [Google Scholar]
- Scholze, F.; Eichhorn, C.; Bundesmann, C.; Spemann, D.; Neumann, H.; Bulit, A.; Feili, D.; Gonzalez del Amo, J. Modelling of a radio frequency plasma bridge neutralizer (RFPBN). Procedia Eng. 2017, 185, 9–16. [Google Scholar] [CrossRef]
- Scholze, F.; Pietag, F.; Adirim, H.; Kreil, M.; Kron, M.; Woyciechowski, R.; Bundesmann, C.; Spemann, D. Development and test of a cost-efficient gridded ion thruster propulsion system for small satellites-IonJet. J. Electr. Propuls. 2022, 1, 28. [Google Scholar] [CrossRef]
- Relyon Plasma GmbH. Operating Instructions Plasma Generator PG31. Available online: http://www.relyon-plasma.com/wp-content/uploads/2016/05/plasma-generator-pg31-manual-EN_F0298601.pdf (accessed on 12 April 2019).
- Relyon Plasma GmbH. Operating Instructions PS2000 Power Supply. 2017. Available online: http://www.relyon-plasma.com/wp-content/uploads/2017/07/ps2000-power-supply-manual-EN_F0307802.pdf (accessed on 12 April 2019).
- Sarrafi, R.; Kovacevic, R. Cathodic cleaning of oxides from aluminum surface by variable-polarity arc. Weld. J. 2010, 89, 1. [Google Scholar]
- Hoffmann, M. Entwicklung einer Steuerung für Homogene und Reproduzierbare Atmosphärendruck–Plasmabehandlung am Beispiel Eines Reduktionsprozesses vor dem Plattieren. Master’s Thesis, Fernuniversität Hagen, Hagen, Germany, 2016. [Google Scholar]
- Strauss, R. SMT Soldering Handbook; Newnes, An imprint of Butterworth-Heinemann: Oxford, UK, 1998; Chapter 4.2; pp. 85–96. [Google Scholar]
- Tanaka, K.; Hirano, H.; Kumano, M.; Froemel, J.; Tanaka, S. Bonding-based wafer-level vacuum packaging using atomic hydrogen pre-treated Cu bonding frames. Micromachines 2018, 9, 181. [Google Scholar] [CrossRef] [PubMed] [Green Version]
- Sawada, Y.; Taguchi, N.; Tachibana, K. Reduction of copper oxide thin films with hydrogen plasma generated by a dielectirc-barrier glow discharge. Jpn. J. Appl. Phys. 1999, 38, 6506–6511. [Google Scholar] [CrossRef]
- Hsieh, J.H.; Fong, L.H.; Yi, S.; Metha, G. Plasma cleaning of copper leadframe with Ar and Ar/H2 gases. Surf. Coatings Technol. 1999, 112, 245–249. [Google Scholar] [CrossRef]
- Sabat, K.C.; Paramguru, R.K.; Mishra, B.K. Reduction of copper oxide by low-temperature hydrogen plasma. Plasma Chem. Plasma Process. 2016, 36, 1111–1124. [Google Scholar] [CrossRef]
- Sawada, Y.; Tamaru, H.; Kogoma, M.; Kawase, M.; Hashimoto, K. The reduction of copper oxide thin films with hydrogen plasma generated by an atmospheric-pressure glow discharge. J. Phys. D Appl. Phys. 1996, 29, 2539. [Google Scholar] [CrossRef]
- Sener, M.E.; Sathasivam, S.; Palgrave, R.; Quesada Cabrera, R.; Caruana, D.J. Patterning of metal oxide thin films using a H2/He atmospheric pressure plasma jet. Green Chem. 2020, 22, 1406–1413. [Google Scholar] [CrossRef] [Green Version]
- Inui, H.; Takeda, K.; Kondo, H.; Ishikawa, K.; Sekine, M.; Kano, H.; Yoshida, N.; Hori, M. Measurement of hydrogen radical density and its impact on reduction of copper oxide in atmospheric-pressure remote plasma using H2 and Ar mixture gases. Appl. Phys. Express 2010, 3, 126101. [Google Scholar] [CrossRef]
- Tajima, S.; Tsuchiya, S.; Matsumori, M.; Nakatsuka, S.; Ichiki, T. Reduction of copper oxide films by an atmospheric-pressure inductively coupled plasma microjet. Trans. Mater. Res. Soc. Jpn. 2010, 35, 621–625. [Google Scholar] [CrossRef] [Green Version]
- Tajima, S.; Tsuchiya, S.; Matsumori, M.; Nakatsuka, S.; Ichiki, T. High-rate reduction of copper oxide using atmospheric-pressure inductively coupled plasma microjets. Thin Solid Film. 2011, 519, 6773–6777. [Google Scholar] [CrossRef]
- Lee, J.; Williams, T.S.; Hicks, R.F. Atmospheric pressure plasma reduction of copper oxide to copper metal. J. Vac. Sci. Technol. A 2021, 39, 023001. [Google Scholar] [CrossRef]
- Relyon Plasma GmbH. Reduction of Metal Surfaces Using Atmospheric Plasma. 2014. Available online: https://www.relyon-plasma.com/wp-content/uploads/2017/03/160520__TN_Reduction_EN.pdf (accessed on 14 January 2023).
- Aromaa, J.; Kekkonen, M.; Mousapour, M.; Jokilaakso, A.; Lundström, M. The oxidation of copper in air at temperatures up to 100 °C. Corros. Mater. Degrad. 2021, 2, 625–640. [Google Scholar] [CrossRef]
- Choudhary, S.; Sarma, J.V.N.; Pande, S.; Ababou-Girard, S.; Turban, P.; Lepine, B.; Gangopadhyay, S. Oxidation mechanism of thin Cu films: A gateway towards the formation of single oxide phase. AIP Adv. 2018, 8, 055114. [Google Scholar] [CrossRef] [Green Version]
- Grzesik, Z.; Migdalska, M. Oxidation mechanism of Cu2O and defect structure of CuO at high temperatures. High Temp. Mater. Process. 2011, 30, 277–287. [Google Scholar] [CrossRef]
- Mimura, K.; Lim, J.W.; Isshiki, M.; Jiang, Q.; Zhou, Y. Brief review of oxidation kinetics of copper at 350 °C to 1050 °C. Met. Mater. Trans. A 2006, 37, 1231–1237. [Google Scholar] [CrossRef]
- Unutulmazsoy, Y.; Cancellieri, C.; Chiodi, M.; Siol, S.; Lin, L.; Jeurgens, L.P.H. In situ oxidation studies of Cu thin films: Growth kinetics and oxide phase evolution. J. Appl. Phys. 2020, 127, 065101. [Google Scholar] [CrossRef]
- Park, J.Y.; Kwon, T.H.; Koh, S.W.; Kang, Y.C. Annealing temperature dependence on the physicochemical properties of copper oxide thin films. Bull. Korean Chem. Soc. 2011, 32, 1331–1335. [Google Scholar] [CrossRef] [Green Version]
- Katz, L.; Guinan, M.; Borg, R.J. Diffusion of H2, D2, and T2 in single-crystal Ni and Cu. Phys. Rev. B 1971, 4, 330–341. [Google Scholar] [CrossRef]
- Sakamoto, Y. The electrochemical determination of diffusivity and solubility of hydrogen in coper. J. Jpn. Inst. Met. 1982, 4, 285–290. [Google Scholar] [CrossRef] [PubMed] [Green Version]


| Contact Pad Area (mm) | Time of Charging (ns) |
|---|---|
| 8 | 3.8 |
| 32 | 15.2 |
| 175 | 83.0 |
| Parameter | Reduction | Oxidation |
|---|---|---|
| power level | 100% | 100% |
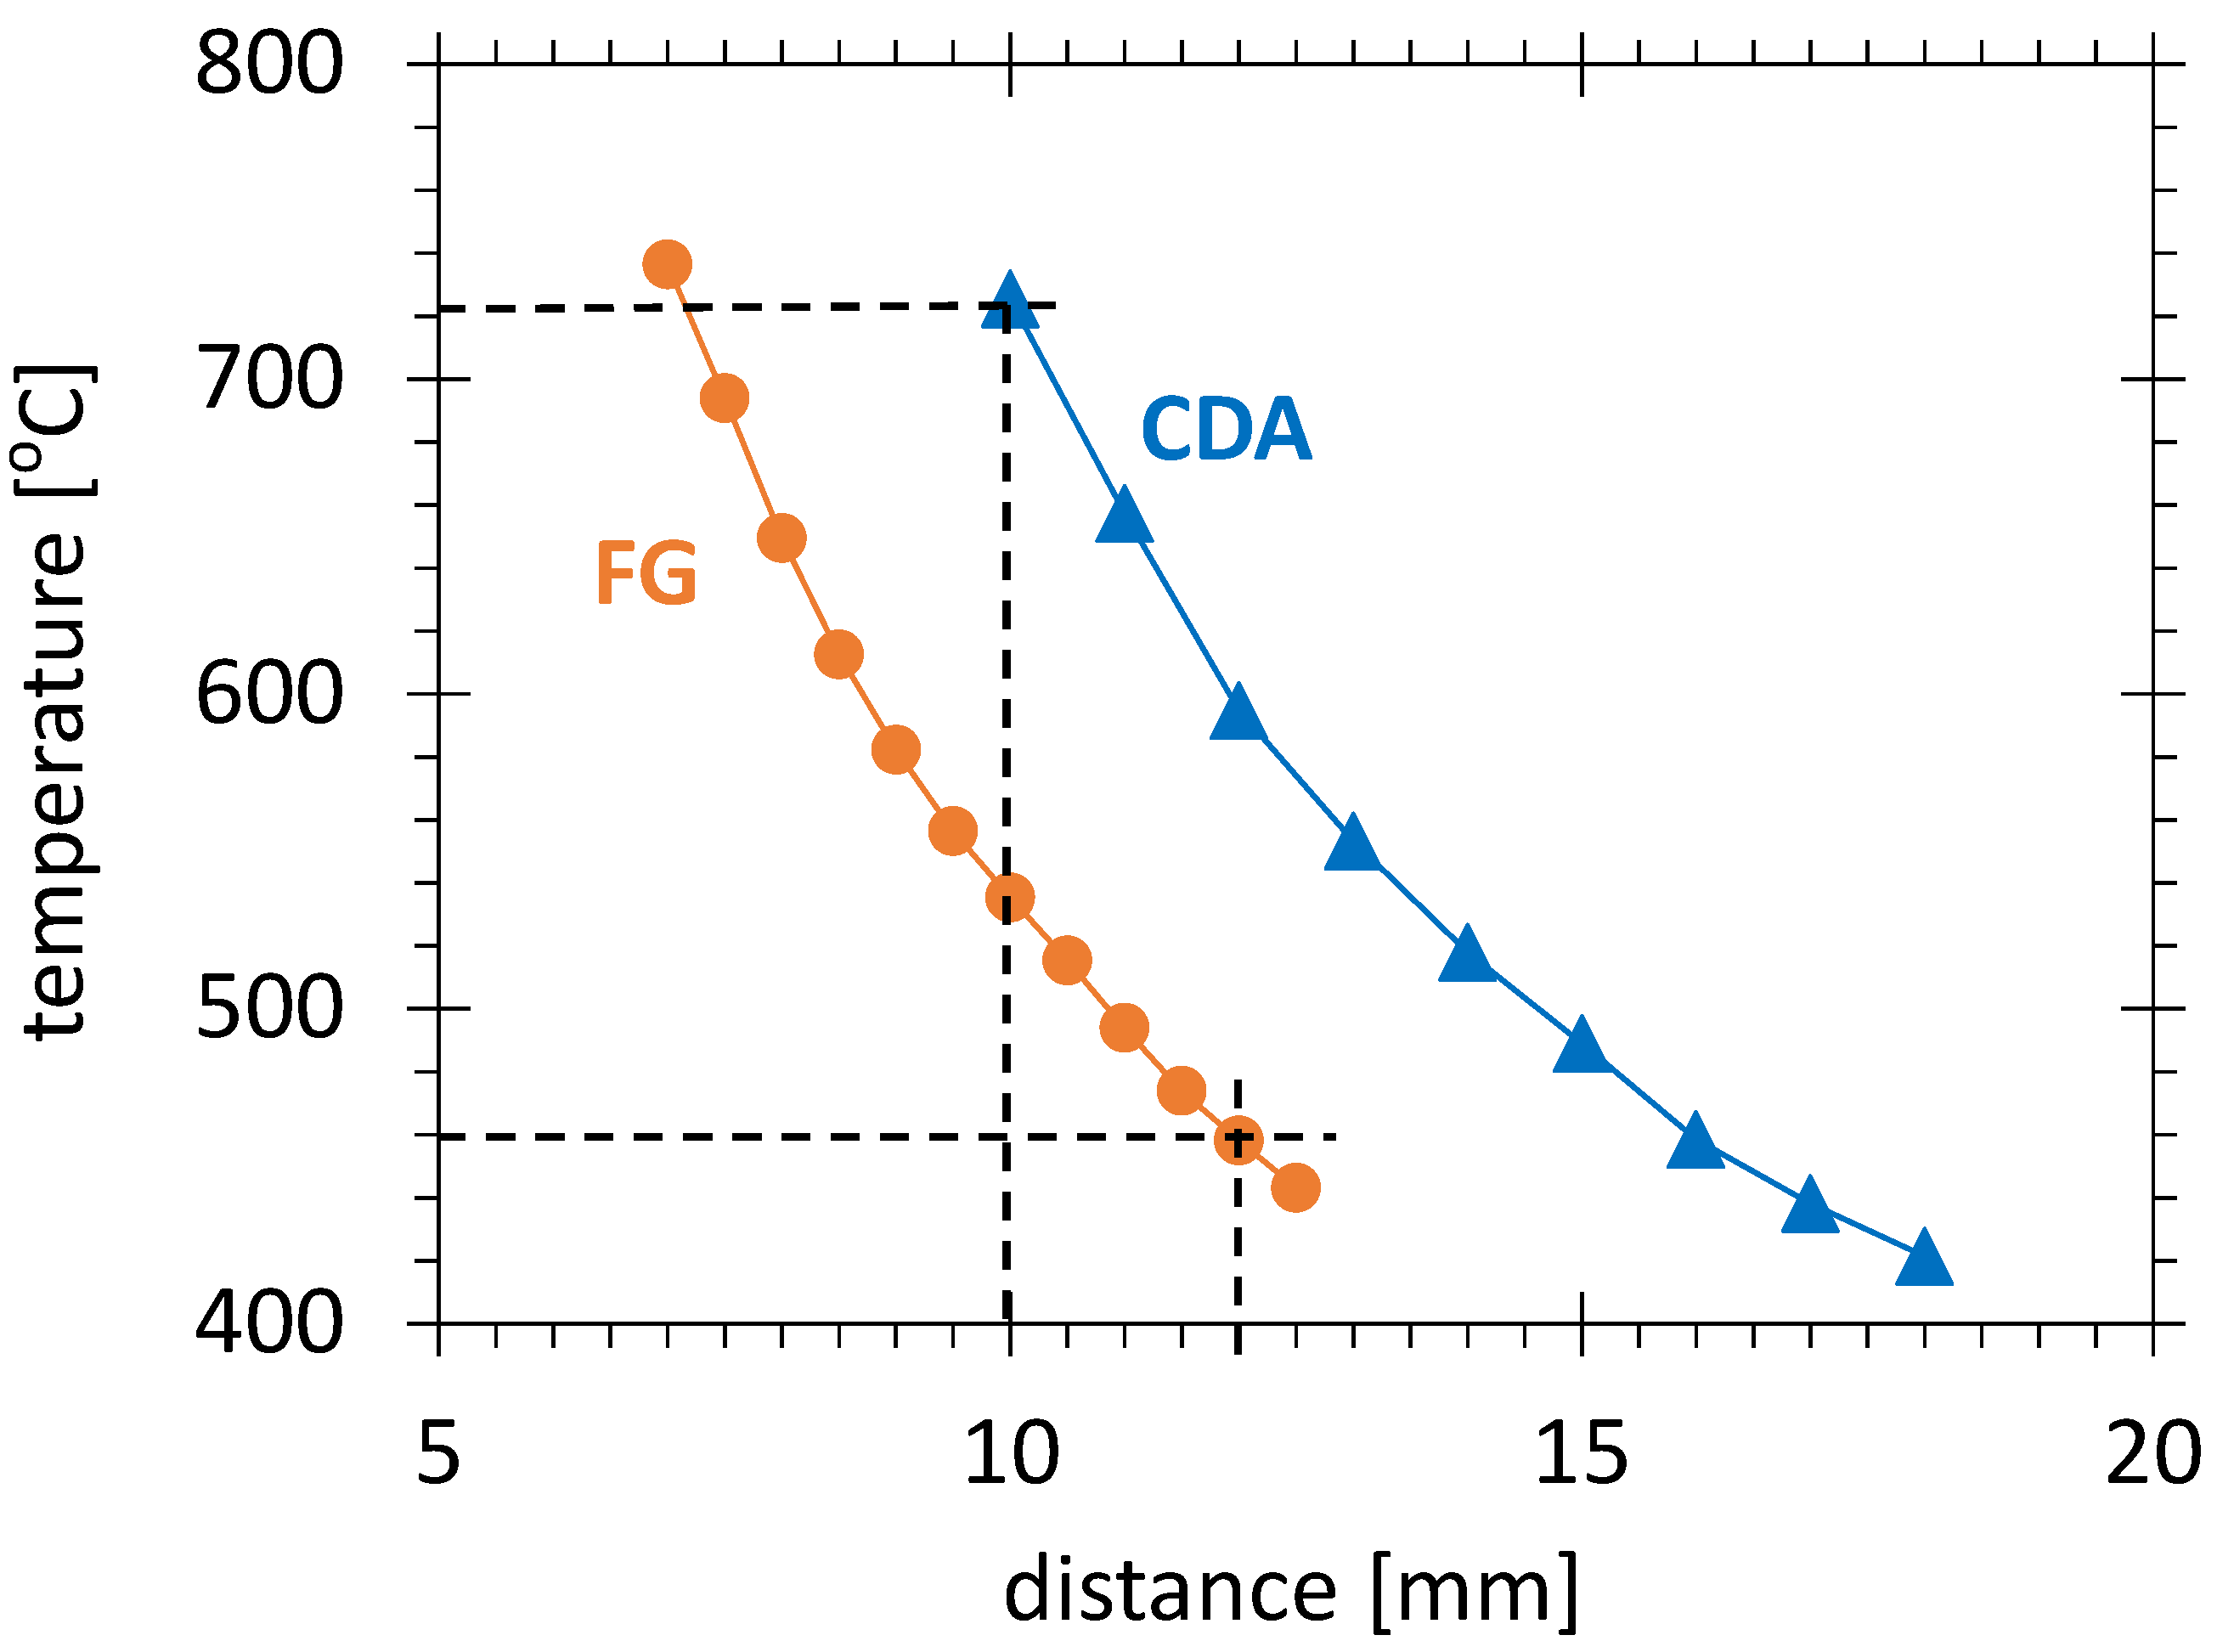
| nozzle-substrate distance | 12 mm | 10 mm |
| pulse frequency | 60 kHz | 60 kHz |
| speed | 100 mm/s | 100 mm/s |
| plasma gas | FG95/5 | CDA |
| plasma gas flow | 57 SLM | 57 SLM |
| plasma bridge gas | Ar | Ar |
| plasma bridge gas flow | 7 SLM | 7 SLM |
| length of treatment path | 180 mm | 180 mm |
| step between paths | 4 mm | 8 mm |
| number of paths | 24 | 12 |
| number of runs | 3 | 4 |
Disclaimer/Publisher’s Note: The statements, opinions and data contained in all publications are solely those of the individual author(s) and contributor(s) and not of MDPI and/or the editor(s). MDPI and/or the editor(s) disclaim responsibility for any injury to people or property resulting from any ideas, methods, instructions or products referred to in the content. |
© 2023 by the authors. Licensee MDPI, Basel, Switzerland. This article is an open access article distributed under the terms and conditions of the Creative Commons Attribution (CC BY) license (https://creativecommons.org/licenses/by/4.0/).
Share and Cite
Korzec, D.; Hoffmann, M.; Nettesheim, S. Application of Plasma Bridge for Grounding of Conductive Substrates Treated by Transferred Pulsed Atmospheric Arc. Plasma 2023, 6, 139-161. https://doi.org/10.3390/plasma6010012
Korzec D, Hoffmann M, Nettesheim S. Application of Plasma Bridge for Grounding of Conductive Substrates Treated by Transferred Pulsed Atmospheric Arc. Plasma. 2023; 6(1):139-161. https://doi.org/10.3390/plasma6010012
Chicago/Turabian StyleKorzec, Dariusz, Markus Hoffmann, and Stefan Nettesheim. 2023. "Application of Plasma Bridge for Grounding of Conductive Substrates Treated by Transferred Pulsed Atmospheric Arc" Plasma 6, no. 1: 139-161. https://doi.org/10.3390/plasma6010012