
CO2 Decomposition in Microwave Discharge Created in Liquid Hydrocarbon
 , and
, and 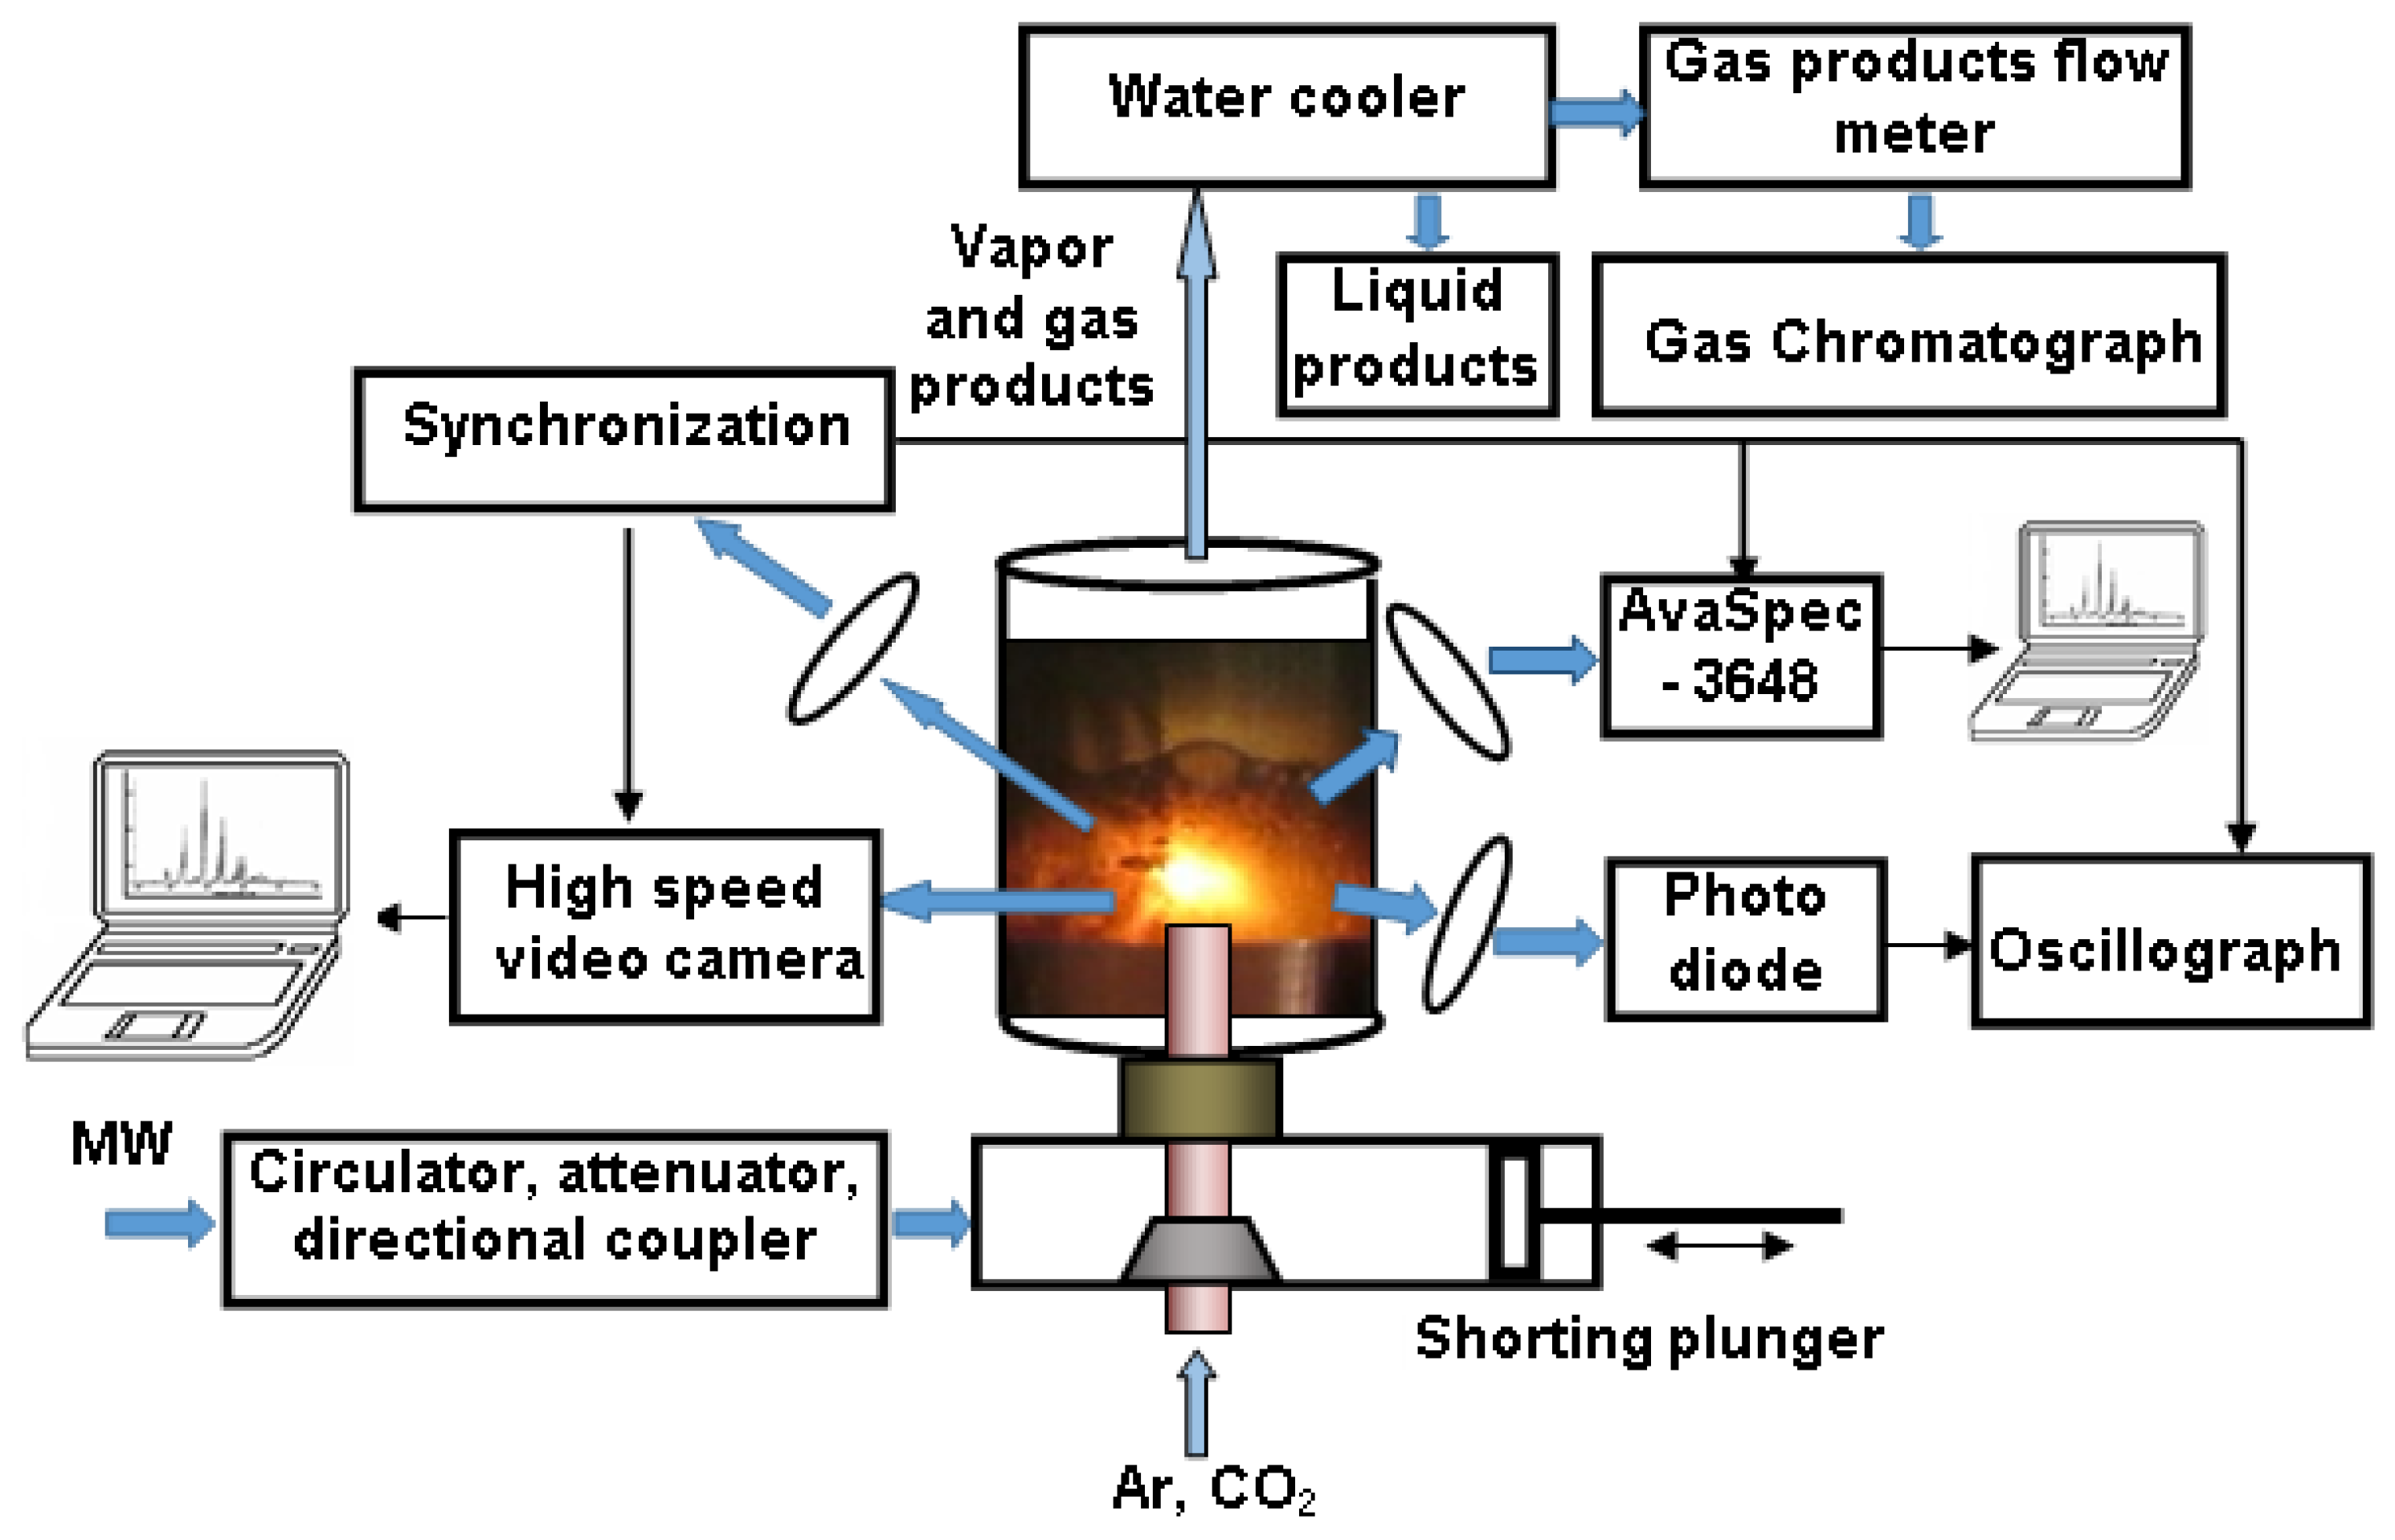
Abstract
:1. Introduction
2. Experimental Setup
3. Results and Discussion
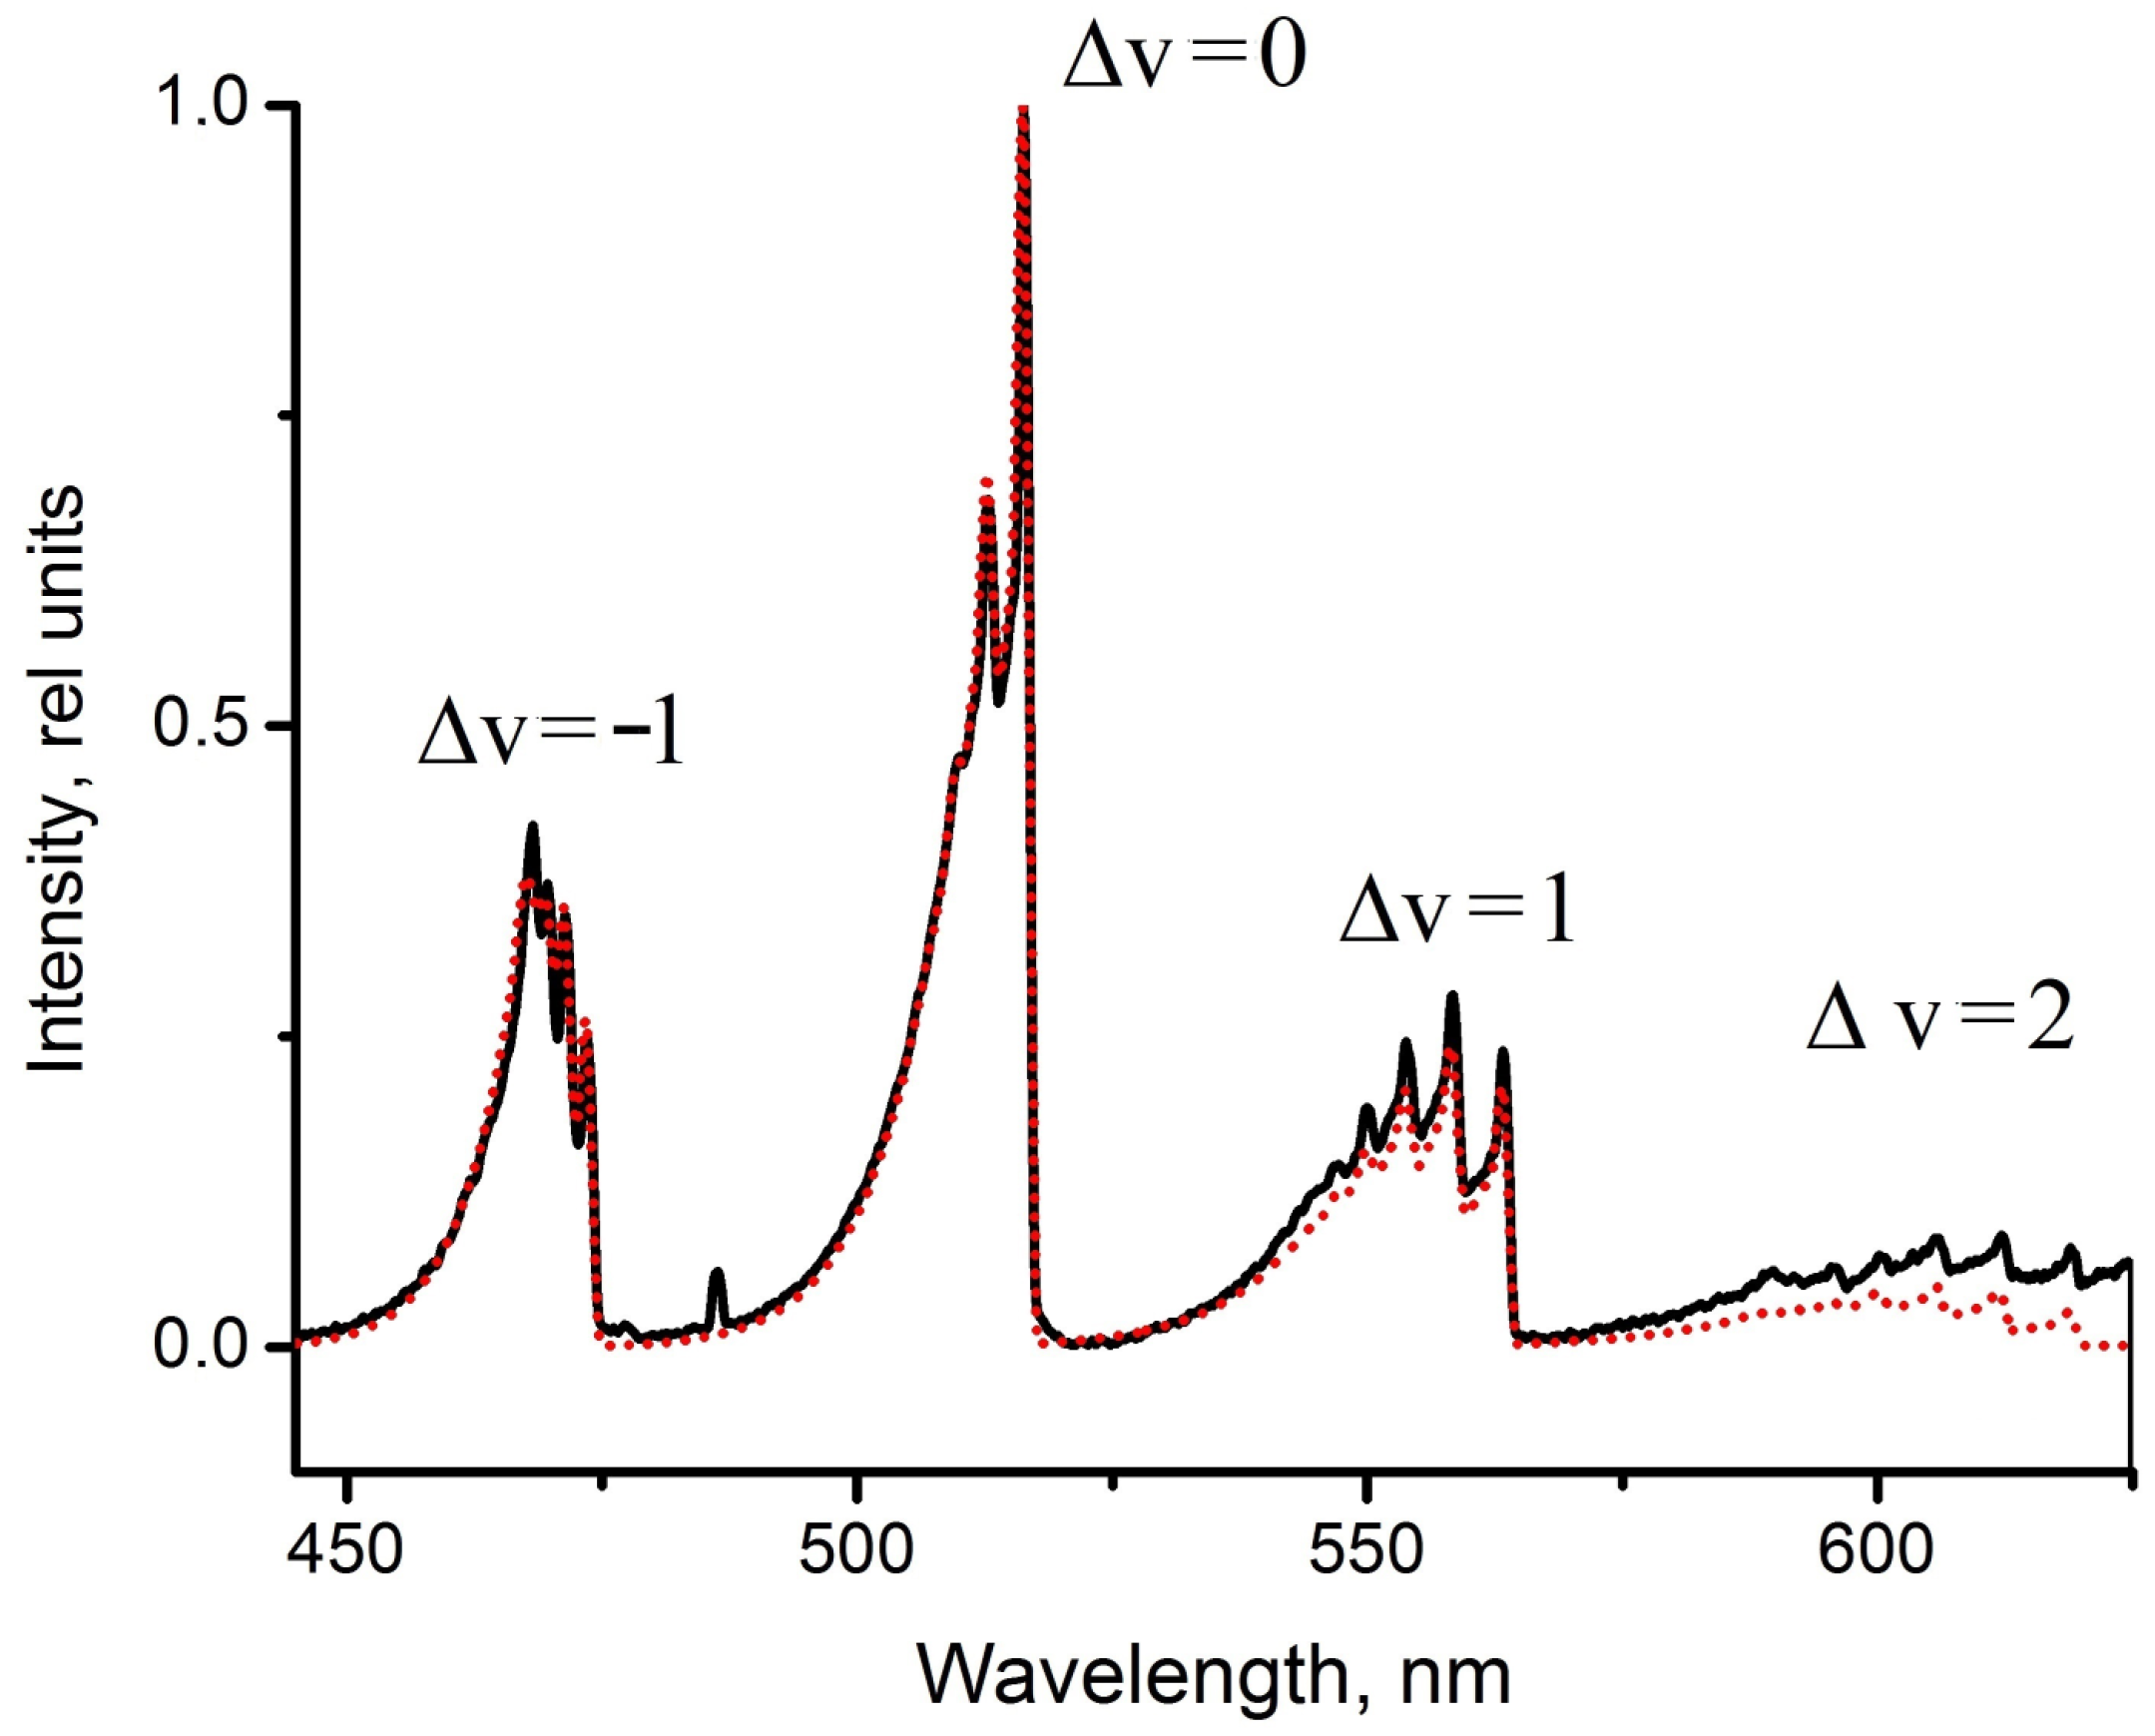
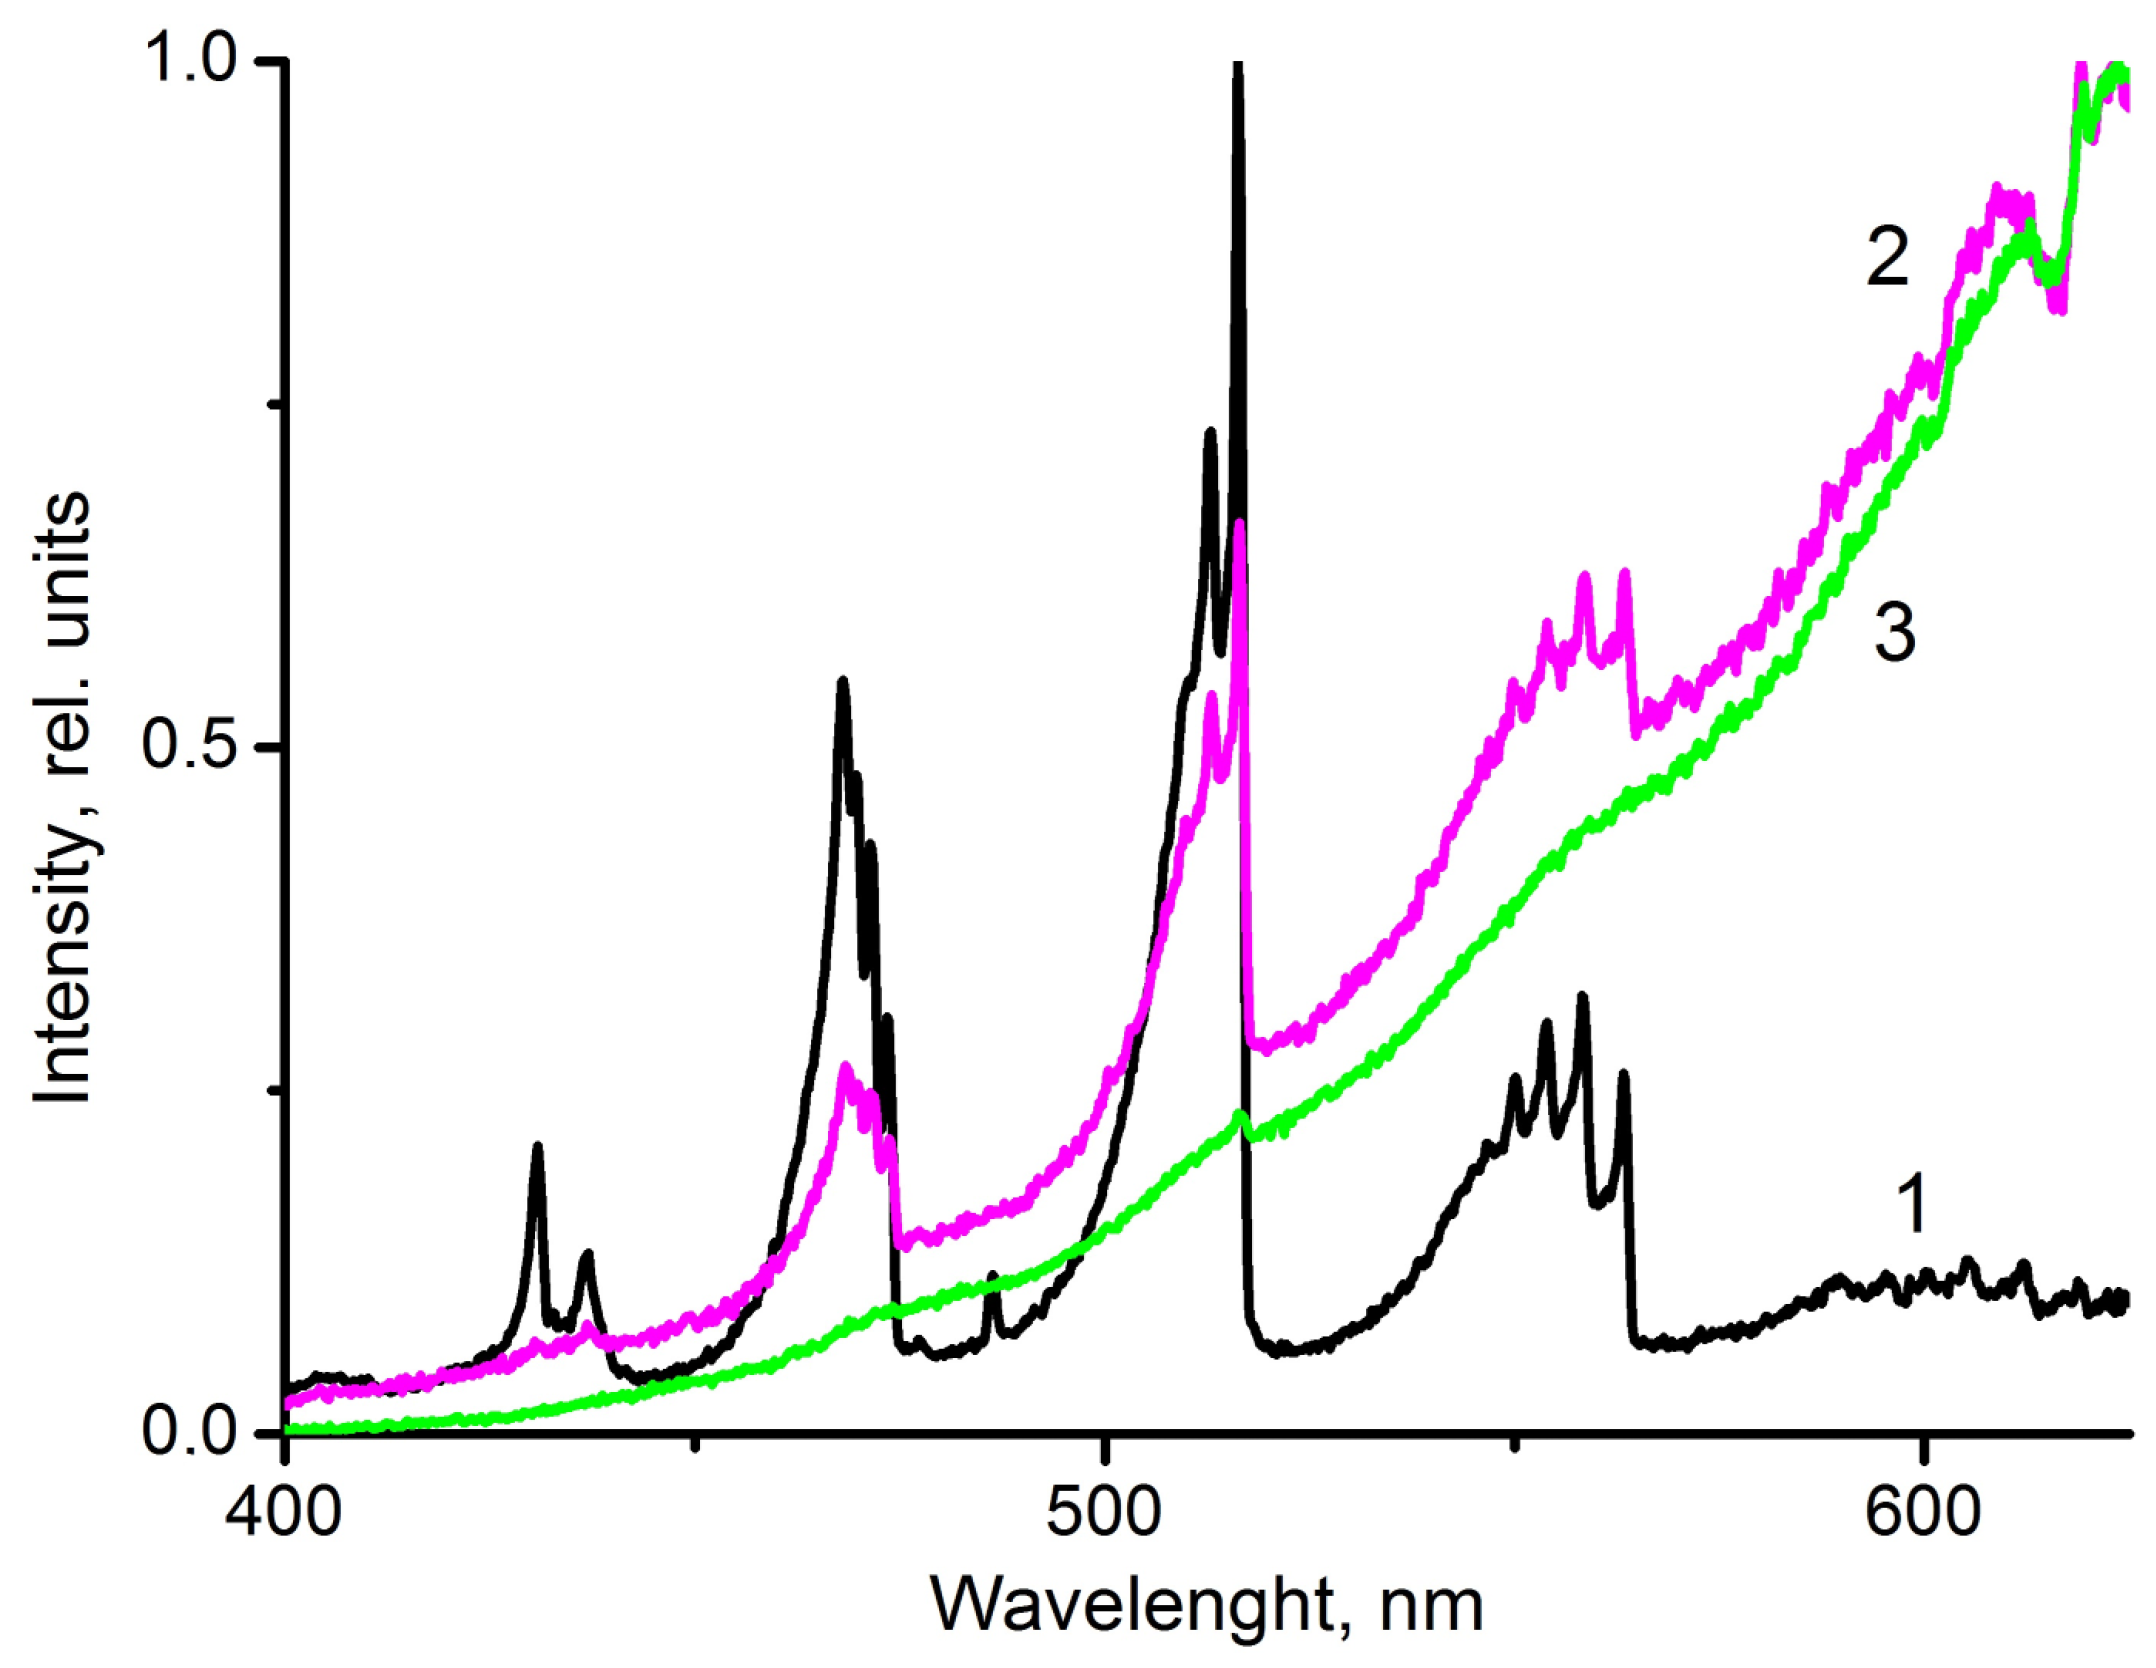
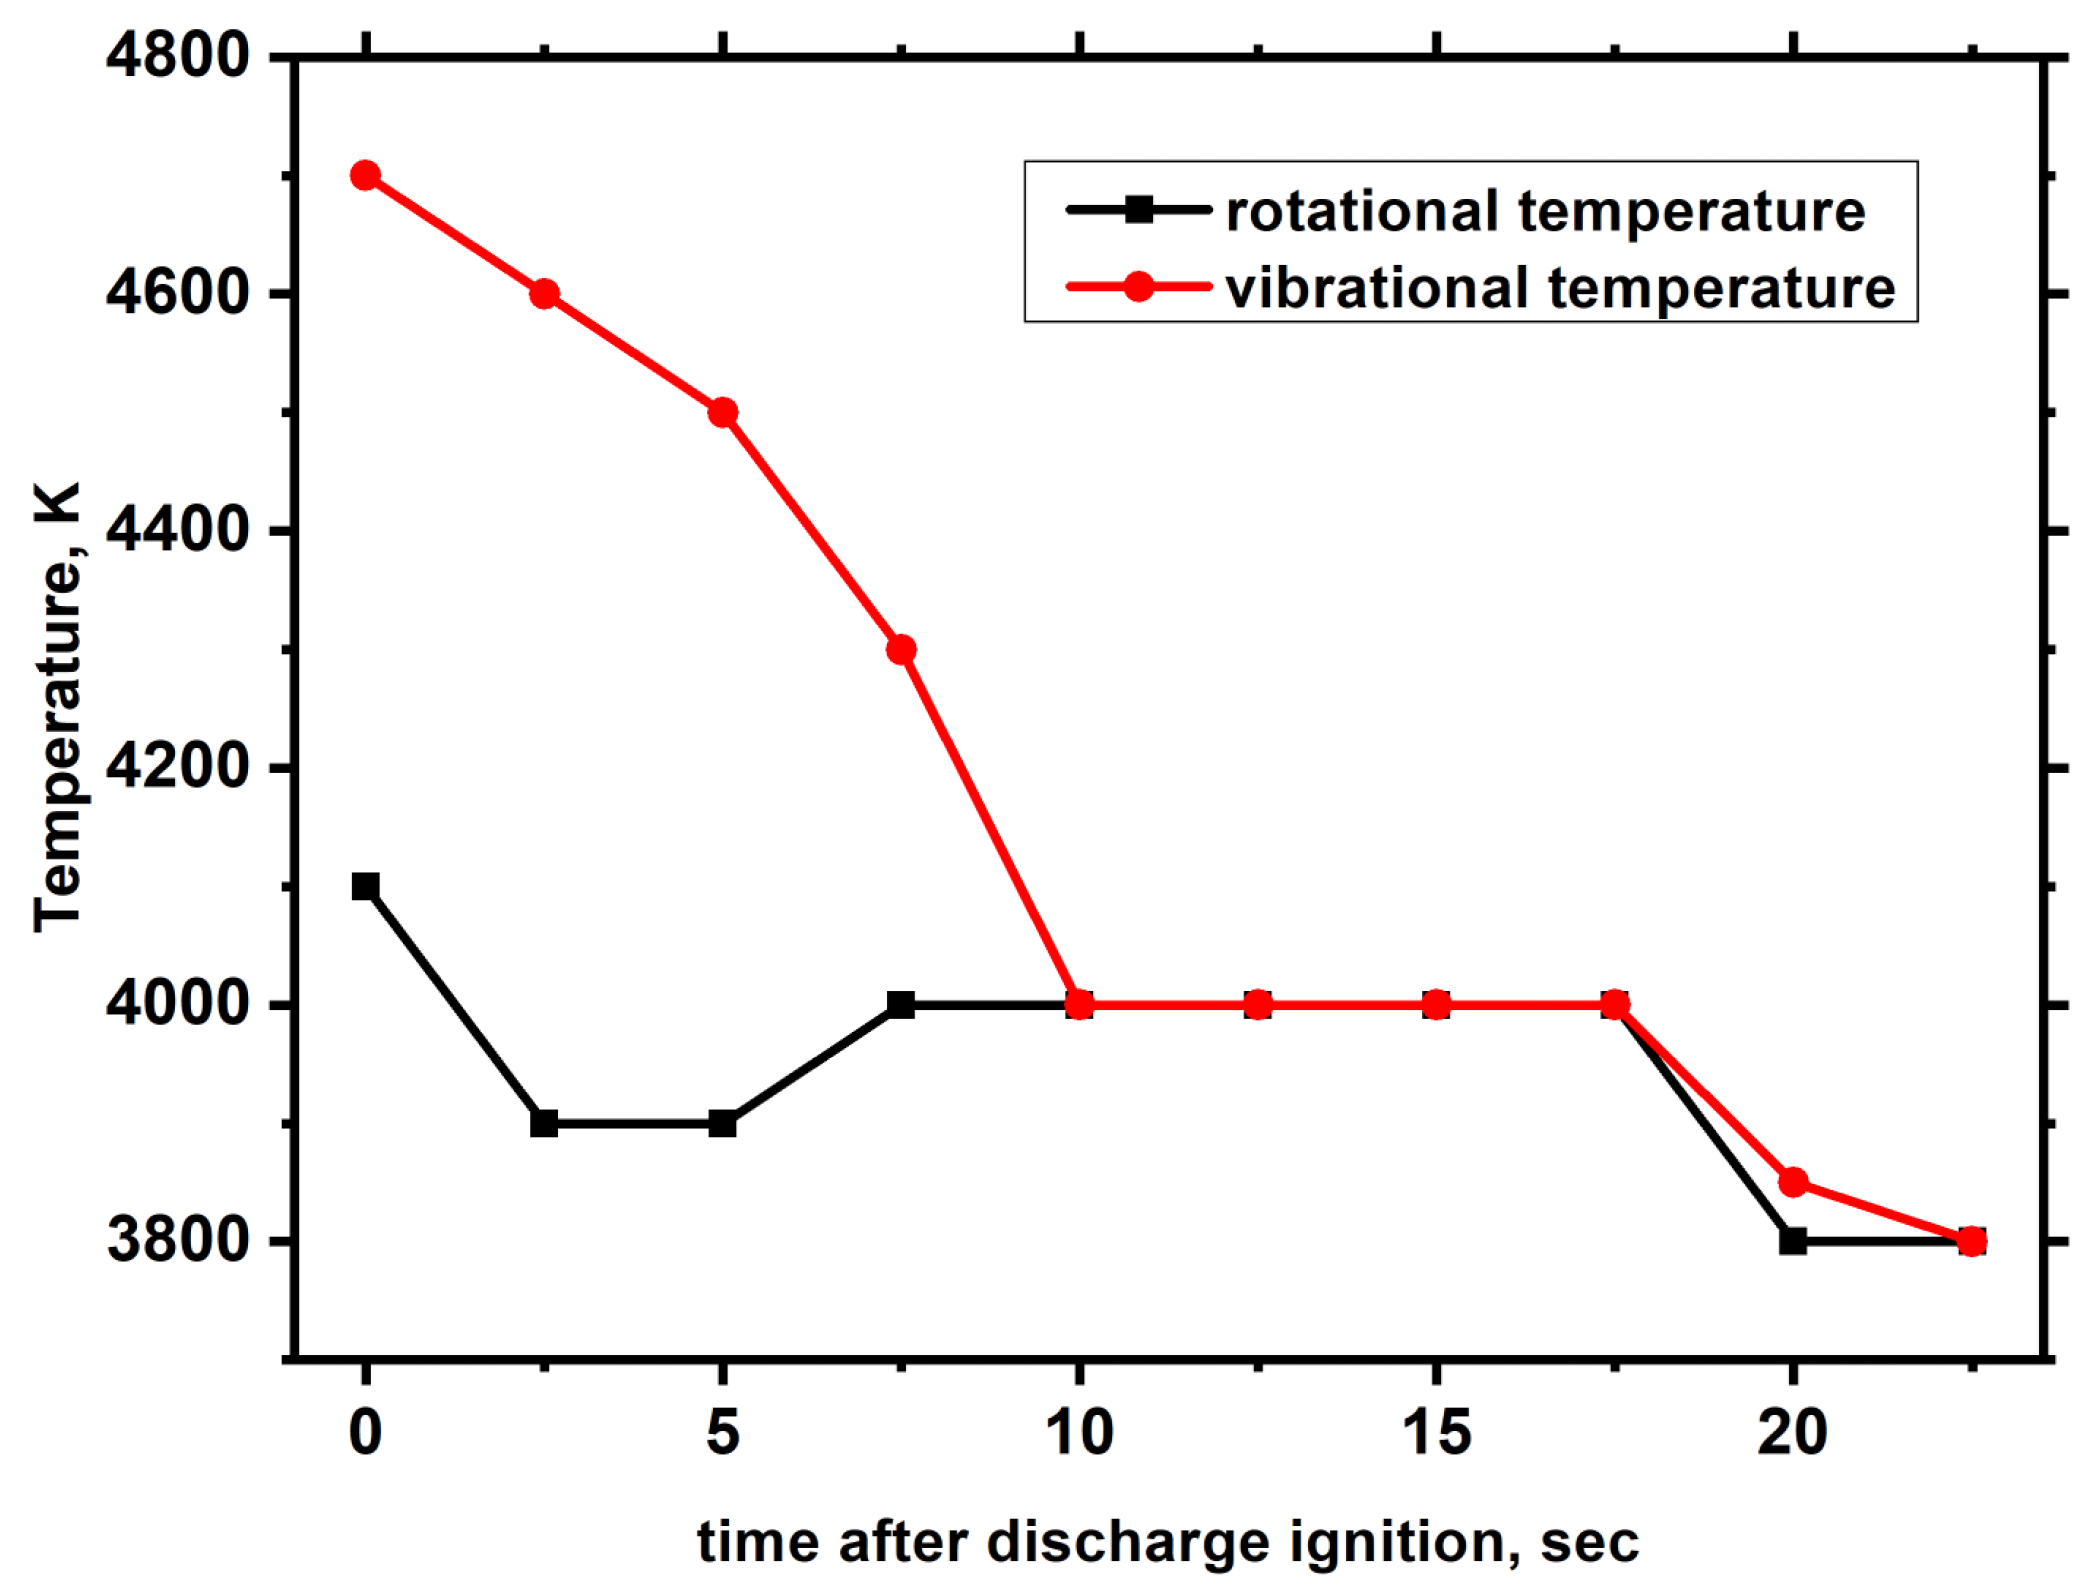
3.1. Results of Optical Diagnostics
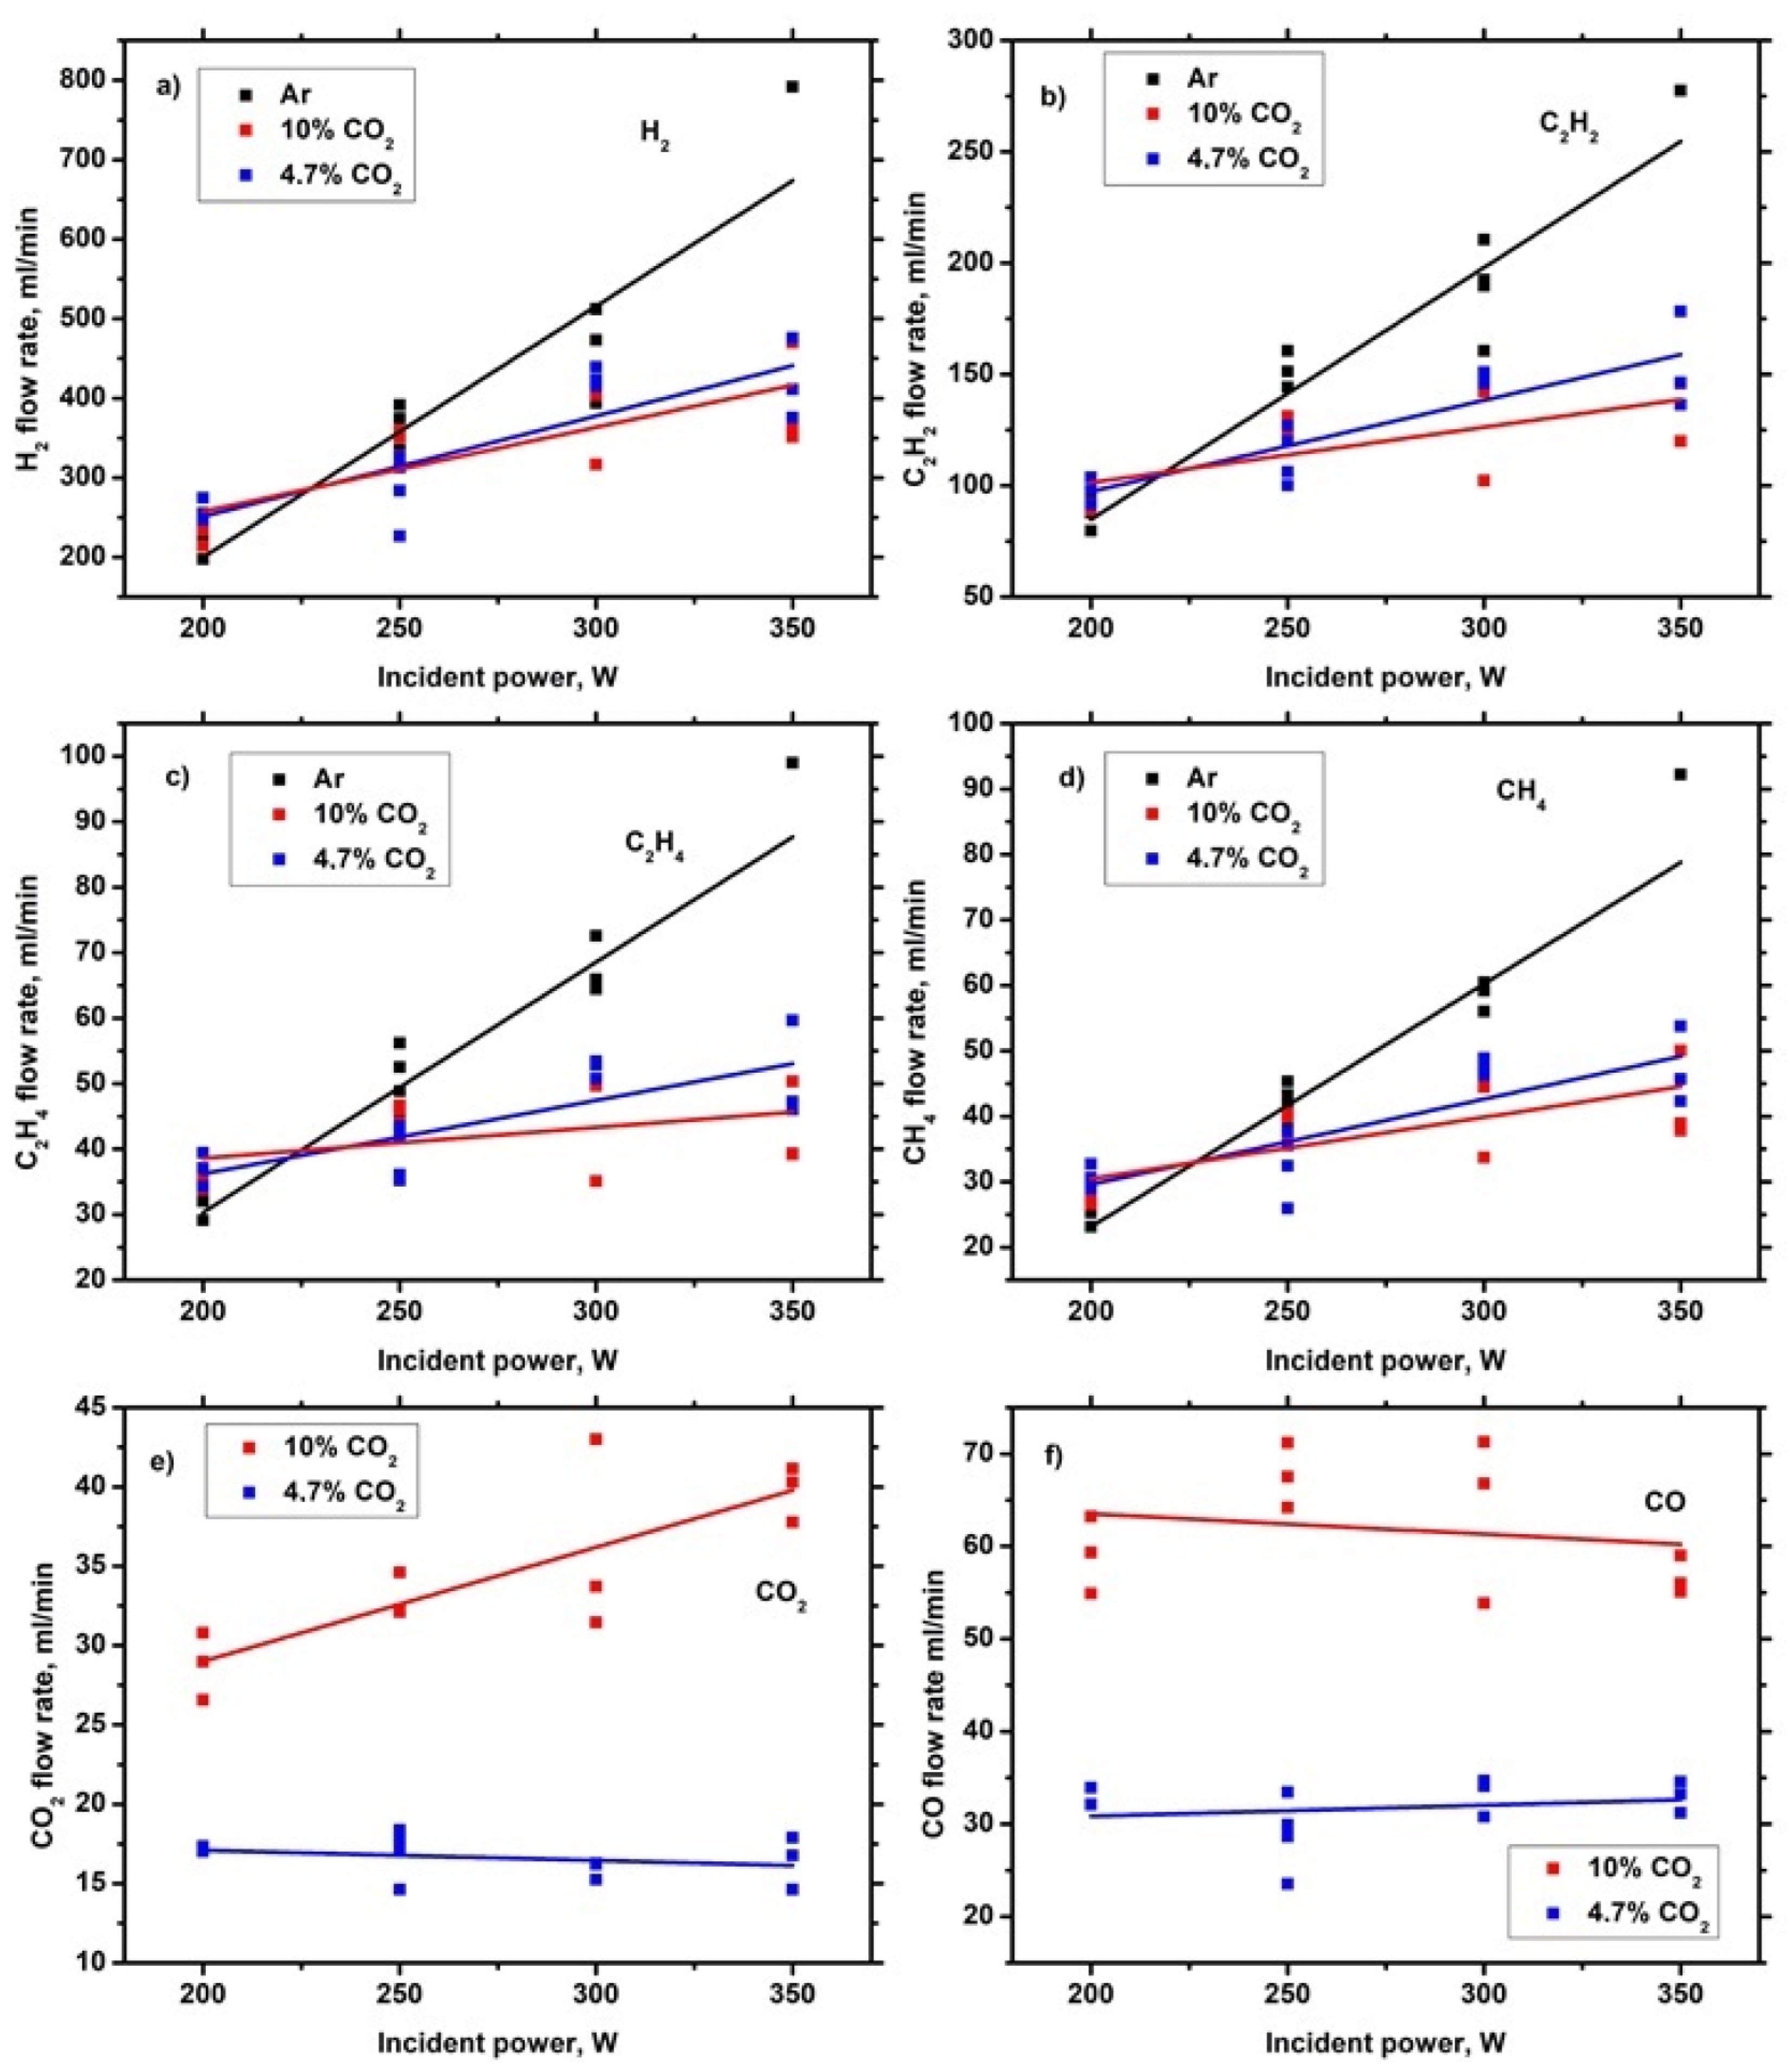
3.2. Gas Products on the Outlet of Reactor
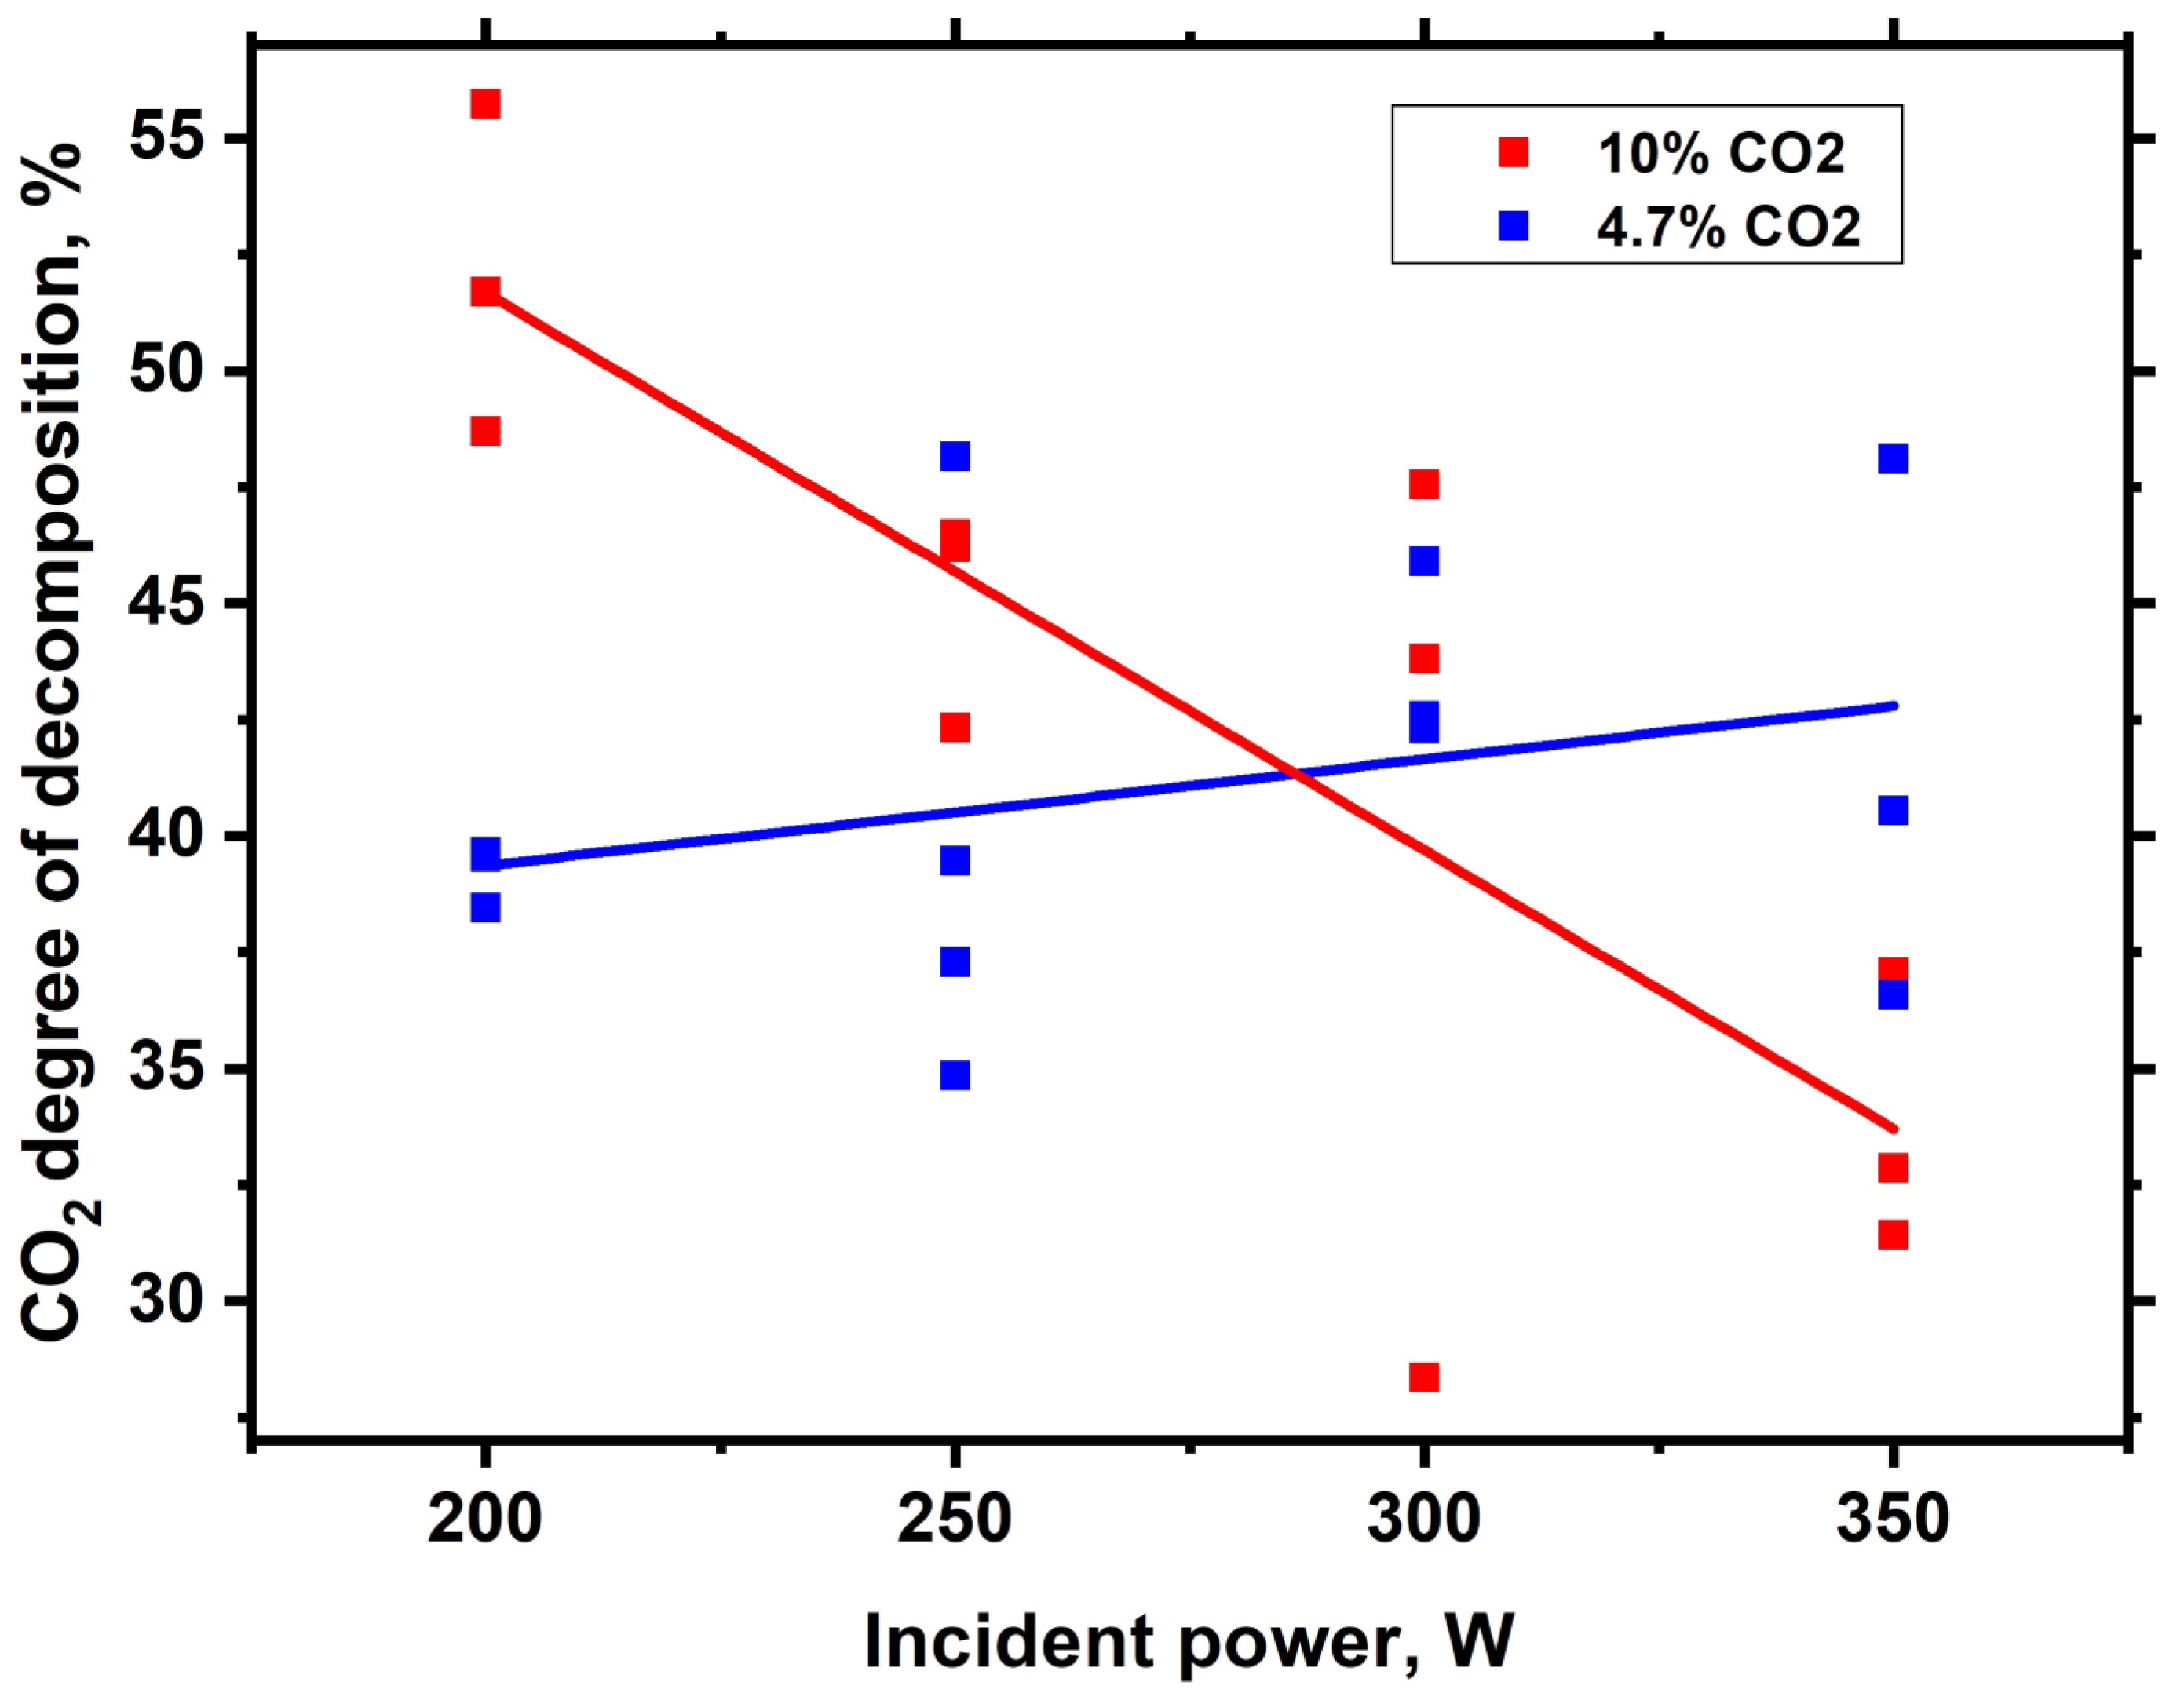
3.3. CO2 Decomposition and Production of Hydrogen
4. Conclusions
Author Contributions
Funding
Informed Consent Statement
Data Availability Statement
Conflicts of Interest
References
- Song, C. Global challenges and strategies for control, conversion and utilization of CO2 for sustainable development involving energy, catalysis, adsorption and chemical processing. Catal. Today 2006, 115, 2–32. [Google Scholar] [CrossRef]
- Centi, G.; Perathoner, S. Opportunities and prospects in the chemical recycling of carbon dioxide to fuels. Catal. Today 2009, 148, 191–205. [Google Scholar] [CrossRef]
- Omae, I. Recent developments in carbon dioxide utilization for the production of organic chemicals. Coord. Chem. Rev. 2012, 256, 1384–1405. [Google Scholar] [CrossRef]
- Dimitriou, I.; García-Gutiérrez, P.; Elder, R.H.; Cuéllar-Franca, R.M.; Azapagic, A.; Allen, R.W.K. Carbon dioxide utilisation for production of transport fuels: Process and economic analysis. Energy Environ. Sci. 2015, 8, 1775–1789. [Google Scholar] [CrossRef] [Green Version]
- Parida, B.; Iniyan, S.; Goic, R. A review of solar photovoltaic technologies. Renew. Sustain. Energy Rev. 2011, 15, 1625–1636. [Google Scholar] [CrossRef]
- Thirugnanasambandam, M.; Iniyan, S.; Goic, R. A review of solar thermal technologies. Renew. Sustain. Energy Rev. 2010, 14, 312–322. [Google Scholar] [CrossRef]
- Centi, G.; Quadrelli, E.A.; Perathoner, S. Catalysis for CO2 conversion: A key technology for rapid introduction of renewable energy in the value chain of chemical industries. Energy Environ. Sci. 2013, 6, 1711–1731. [Google Scholar] [CrossRef]
- Aresta, M.; Dibenedetto, A.; Angelini, A. Catalysis for the valorization of exhaust carbon: From CO2 to chemicals, materials, and fuels. Technological use of CO2. Chem. Rev. 2014, 114, 1709–1742. [Google Scholar] [CrossRef]
- Bogaerts, A.; Kozák, T.; Van Laer, K.; Snoeckx, R. Plasma-based conversion of CO2: Current status and future challenges. Faraday Discuss. 2015, 183, 217–232. [Google Scholar] [CrossRef]
- Snoeckx, R.; Bogaerts, A. Plasma technology–a novel solution for CO2 conversion? Chem. Soc. Rev. 2017, 46, 5805–5863. [Google Scholar] [CrossRef] [Green Version]
- Trenchev, G.; Nikiforov, A.; Wang, W.; Bogaerts, A. Atmospheric pressure glow discharge for CO2 conversion: Model-based exploration of the optimum reactor configuration. Chem. Eng. J. 2019, 362, 830–841. [Google Scholar] [CrossRef]
- George, A.; Shen, B.; Craven, M.; Wang, Y.; Kang, D.; Wu, C.; Tu, X. A Review of Non-Thermal Plasma Technology: A novel solution for CO2 conversion and utilization. Renew. Sustain. Energy Rev. 2021, 135, 109702. [Google Scholar] [CrossRef]
- Lebedev, Y.A.; Shakhatov, V.A. Decomposition of Carbon Dioxide in Microwave Discharges (an Analytical Review). Russ. J. Appl. Chem. 2022, 95, 1–20. [Google Scholar] [CrossRef]
- Lebedev, Y.A.; Shakhatov, V.A. Decomposition of CO2 in Atmospheric Pressure Barrier Discharge (Analytical Review). Plasma Phys. Rep. 2022, 48, 693–710. [Google Scholar] [CrossRef]
- Lebedev, Y.A. Microwave Discharges in Liquid Hydrocarbons: Physical and Chemical Characterization. Polymers 2021, 13, 1678. [Google Scholar] [CrossRef]
- Zhang, Y.P.; Li, Y.; Wang, Y.; Liu, C.J.; Eliasson, B. Plasma methane conversion in the presence of carbon dioxide using dielectric-barrier discharges. Fuel Process. Technol. 2003, 83, 101–109. [Google Scholar] [CrossRef]
- Wang, Q.; Yan, B.H.; Jin, Y.; Cheng, Y. Investigation of dry reforming of methane in a dielectric barrier discharge reactor. Plasma Chem. Plasma Process. 2009, 29, 217–228. [Google Scholar] [CrossRef]
- Aerts, R.; Snoeckx, R.; Bogaerts, A. In-Situ Chemical Trapping of Oxygen in the Splitting of Carbon Dioxide by Plasma. Plasma Process. Polym. 2014, 11, 985–992. [Google Scholar] [CrossRef]
- Indarto, A.; Choi, J.W.; Lee, H.; Song, H.K. Effect of additive gases on methane conversion using gliding arc discharge. Energy 2006, 31, 2650–2659. [Google Scholar] [CrossRef]
- Kim, S.C.; Lim, M.S.; Chun, Y.N. Reduction characteristics of carbon dioxide using a plasmatron. Plasma Chem. Plasma Process. 2014, 34, 125–143. [Google Scholar] [CrossRef]
- Kim, S.C.; Chun, Y.N. Development of a gliding arc plasma reactor for CO2 destruction. Environ. Technol. 2014, 35, 2940–2946. [Google Scholar] [CrossRef]
- Tu, X.; Whitehead, J.C. Plasma dry reforming of methane in an atmospheric pressure AC gliding arc discharge: Co-generation of syngas and carbon nanomaterials. Int. J. Hydrog. Energy 2014, 39, 9658–9669. [Google Scholar] [CrossRef]
- Liu, J.L.; Park, H.W.; Chung, W.J.; Park, D.W. High-efficient conversion of CO2 in AC-pulsed tornado gliding arc plasma. Plasma Chem. Plasma Process. 2016, 36, 437–449. [Google Scholar] [CrossRef]
- Cleiren, E.; Heijkers, S.; Ramakers, M.; Bogaerts, A. Dry reforming of methane in a gliding arc plasmatron: Towards a better understanding of the plasma chemistry. ChemSusChem 2017, 10, 4025–4036. [Google Scholar] [CrossRef] [PubMed]
- Shapoval, V.; Marotta, E. Investigation on plasma-driven methane dry reforming in a self-triggered spark reactor. Plasma Process. Polym. 2015, 12, 808–816. [Google Scholar] [CrossRef]
- Li, D.; Li, X.; Bai, M.; Tao, X.; Shang, S.; Dai, X.; Yin, Y. CO2 reforming of CH4 by atmospheric pressure glow discharge plasma: A high conversion ability. Int. J. Hydrog. Energy 2009, 34, 308. [Google Scholar] [CrossRef]
- Dinh, D.K.; Choi, S.; Lee, D.H.; Jo, S.; Kim, K.T.; Song, Y.H. Energy efficient dry reforming process using low temperature arcs. Plasma Process. Polym. 2018, 15, 1700203. [Google Scholar] [CrossRef]
- Tao, X.; Qi, F.; Yin, Y.; Dai, X. CO2 reforming of CH4 by combination of thermal plasma and catalyst. Int. J. Hydrog. Energy 2008, 33, 1262–1265. [Google Scholar] [CrossRef]
- Nakagawa, Y.; Nishitani, A.K. Deoxidization of carbon dioxide by pulse power discharge. Jpn. J. Appl. Phys. 1993, 32, L1568. [Google Scholar] [CrossRef]
- Nunnally, T.; Gutsol, K.; Rabinovich, A.; Fridman, A.; Gutsol, A.; Kemoun, A. Dissociation of CO2 in a low current gliding arc plasmatron. J. Phys. D Appl. Phys. 2011, 44, 274009. [Google Scholar] [CrossRef]
- Lebedev, Y.A.; Krashevskaya, G.V.; Batukaev, T.S.; Epstein, I.L. Light emission from microwave discharges in liquid hydrocarbons at the initial stages of their development. Plasma Process. Polym. 2021, 18, 2100051. [Google Scholar] [CrossRef]
- Lebedev, Y.A.; Krashevskaya, G.V.; Batukaev, T.S.; Mikhaylyuk, A.V. Time resolved study of ignition of microwave discharge in liquid hydrocarbons. Plasma Process. Polym. 2022, 19, e2100215. [Google Scholar] [CrossRef]
- Available online: http://www.specair-radiation.net/ (accessed on 5 April 2020).
- Averin, K.A.; Lebedev, Y.A.; Tatarinov, A.V. Main gaseous products of microwave discharge in various liquid hydrocarbons. High Energy Chem. 2019, 53, 331–335. [Google Scholar] [CrossRef]
- Lebedev, Y.A.; Shakhatov, V.A. Optical emission spectra of microwave discharge in different liquid hydrocarbons. Plasma Process. Polym. 2020, 17, 2000003. [Google Scholar] [CrossRef]
- Lebedev, Y.A. Some properties of the tunable cavity microwave plasma source. Plasma Sources Sci. Technol. 1995, 4, 474. [Google Scholar] [CrossRef]
- Averin, K.A.; Bilera, I.V.; Lebedev, Y.A.; Shakhatov, V.A.; Epstein, I.L. Microwave discharge in liquid n-heptane with and without bubble flow of argon. Plasma Process. Polym. 2019, 16, 1800198. [Google Scholar] [CrossRef]
- Liu, C.; Xu, G.; Wang, T. Non-thermal plasma approaches in CO2 utilization. Fuel Process. Technol. 1999, 58, 119–134. [Google Scholar] [CrossRef]
- Rostrup-Nielsen, J.R. Aspects of CO2-reforming of methane. Stud. Surf. Sci. Catal. 1994, 81, 25–41. [Google Scholar]
- Nomura, S.; Toyota, H.; Mukasa, S.; Yamashita, H.; Maehara, T.; Kawashima, A. Production of hydrogen in a conventional microwave oven. J. Appl. Phys. 2009, 106, 073306. [Google Scholar] [CrossRef]
- Taghvaei, H.; Jahanmiri, A.; Rahimpour, M.R.; Shirazi, M.M.; Hooshmand, N. Hydrogen production through plasma cracking of hydrocarbons: Effect of carrier gas and hydrocarbon type. Chem. Eng. J. 2013, 226, 384–392. [Google Scholar] [CrossRef]


Disclaimer/Publisher’s Note: The statements, opinions and data contained in all publications are solely those of the individual author(s) and contributor(s) and not of MDPI and/or the editor(s). MDPI and/or the editor(s) disclaim responsibility for any injury to people or property resulting from any ideas, methods, instructions or products referred to in the content. |
© 2023 by the authors. Licensee MDPI, Basel, Switzerland. This article is an open access article distributed under the terms and conditions of the Creative Commons Attribution (CC BY) license (https://creativecommons.org/licenses/by/4.0/).
Share and Cite
Batukaev, T.S.; Bilera, I.V.; Krashevskaya, G.V.; Lebedev, Y.A.; Nazarov, N.A. CO2 Decomposition in Microwave Discharge Created in Liquid Hydrocarbon. Plasma 2023, 6, 115-126. https://doi.org/10.3390/plasma6010010
Batukaev TS, Bilera IV, Krashevskaya GV, Lebedev YA, Nazarov NA. CO2 Decomposition in Microwave Discharge Created in Liquid Hydrocarbon. Plasma. 2023; 6(1):115-126. https://doi.org/10.3390/plasma6010010
Chicago/Turabian StyleBatukaev, Timur S., Igor V. Bilera, Galina V. Krashevskaya, Yuri A. Lebedev, and Nurlan A. Nazarov. 2023. "CO2 Decomposition in Microwave Discharge Created in Liquid Hydrocarbon" Plasma 6, no. 1: 115-126. https://doi.org/10.3390/plasma6010010