Article

On the Statistics of Mechanical Failure in Flame-Sprayed Self-Supporting Components

1
TU Bergakademie Freiberg, Institute of Ceramics, Refractories and Composite Materials, Agricolastraße 17, 09599 Freiberg, Germany
2
Refratechnik Steel GmbH, Research and Development, Am Seestern 5, 40547 Düsseldorf, Germany
*
Author to whom correspondence should be addressed.
Ceramics 2023, 6(2), 1050-1066; https://doi.org/10.3390/ceramics6020062
Submission received: 21 March 2023 / Revised: 18 April 2023 / Accepted: 23 April 2023 / Published: 25 April 2023
(This article belongs to the Special Issue Ceramic Coatings for High-Temperature Applications)

Abstract

:
The objective of this study was to investigate the variability of flexural strength for flame-sprayed ceramic components and to determine which two-parametric distribution function was best suited to represent the experimental data. Moreover, the influence of the number of tested specimens was addressed. The stochastic nature of the flame-spraying process causes a pronounced variation in the properties of potential components, making it crucial to characterise the fracture statistics. To achieve this, this study used two large data sets consisting of 1000 flame-sprayed specimens each. In addition to the standard Weibull approach, the study examined the quality of representing the experimental data using other two-parametric distribution functions (Normal, Log-Normal, and Gamma). To evaluate the accuracy of the distribution functions and their characteristic parameters, random subsamples were generated by resampling of the experimental data, and the results were assessed based on the sampling size. It was found that the experimental data were best represented by either the Weibull or Gamma distribution, and the quality of the fit was correlated with the number of positive and negative outliers. The Weibull fit was more sensitive to positive outliers, whereas the Gamma fit was more sensitive to negative outliers.

1. Introduction

The flame-spraying of ceramic materials is a highly versatile technique [1,2]. The unique microstructure of the flame-sprayed coatings, including cracks and pores, results in exceptional thermal shock resistance [3,4]. That offers numerous possibilities for the preparation and modification of various substrate materials for refractories in high-temperature applications. One motivation was the functionalisation of refractory hollowware based on uniaxially pressed rice husk ash [5] via flame-sprayed alumina potentially used in steel ingot casting (prototype, see Figure 1). These components must provide excellent resistance against thermal shock and erosion caused by the flow of the molten steel, as well as high chemical inertness against the steel melt itself [6,7]. However, materials traditionally used for this purpose, such as refractory clay, are limited in terms of these properties [8]. With the flame-spraying technique, a wide range of materials can be utilised [1,2,9]. Accordingly, their mechanical characteristics are of particular interest when considering the service life time of such materials in both room and high-temperature applications.
Figure 2 shows the cross-section obtained via scanning electron microscopy of a material composite based on rice husk ash and a flame-sprayed alumina coating. The nature of the rice husk ash and the shaping process results in a rough surface of the bulk material. This causes an interlocking with the flame-sprayed alumina coating on the coating/substrate material interface. This interlocking must be taken into account with regard to the mechanical properties of the composite material, which is non-trivial. Consequently, the contributing materials has to be characterised separately in a first step. In this regard, the flame-sprayed ceramic coating is of particular interest.
Recent studies provided an overview regarding the mechanical characteristics of flame-sprayed components based on different ceramic materials (Al2O3 and Al2O3 with TiO2 and ZrO2 additions) [3,4]. The stochastic nature of the flame-spraying process can result in a pronounced variability in the mechanical properties of the flame-sprayed components, particularly in terms of their fracture statistics [4,10]. Thus, a comprehensive characterisation of these properties is essential in order to predict their mechanical behaviour and ensure their successful use in high-temperature applications [11]. Hence, the sampling size required to obtain statistically reliable data has to be questioned.
Following the suggestion of Danzer et al. [12], a minimum of 30 specimens is required for determining strength data for ceramic components. According to the law of large numbers, the probability to obtain the true value for a variable from an experiment approaches one for the number of performed experiments approaching infinity [13]. However, in practice, the number of tested specimens needs to be limited and minimised as much as possible. Therefore, selecting an appropriate sampling size for determining strength data involves balancing the cost of sample preparation with the desired level of experimental accuracy. Danzer et al. [12,14] assessed the scatter of strength data for ceramic parts in dependency of the sampling size. To achieve this, strength data were randomly generated from an idealised theoretical Weibull distribution. Obviously, the scatter of the Weibull modulus determined for the generated sample around the true value of the distribution increases as the sampling size decreases. However, the analysis revealed an asymmetric deviation with a larger positive difference, leading to an overestimation of the true value. Thus, the standard suggests a correction factor for the Weibull modulus dependent on the sampling size. Conventionally, flexural strength data of ceramic components are represented using the Weibull distribution [15]. However, recent studies showed that the Weibull modulus of flame-sprayed ceramic components is low ( m = 3 to 5.5 [3,4]) compared to densely sintered ceramic components fabricated by injection moulding ( m = 11.8 [16]). Because of the unique microstructure of flame-sprayed ceramic components (see Figure 2), it is uncertain whether the assumption of a Weibull distribution, i.e., failure because of the weakest link, is met in the first place [15,17,18,19]. Thus, it is also uncertain, whether a similar behaviour as a function of the sampling size can be expected.
Therefore, this work statistically investigated the scatter of flexural strength for flame-sprayed ceramic components on two large data sets including 1000 specimens each. Recently, Gorjan and Ambrožič [20] investigated a large experimental data set of flexural strength data for low-pressure injection-moulded ceramic parts with regard to its representation by different two-parametric distribution functions. It was found that the Weibull distribution describes the experimental data best, while the Normal, Log-Normal, and Gamma distributions yielded lower fitting accuracy. However, Fedorov and Gulyaeva [21] pointed out that the obtained strength data of porous alumina pellets were significantly better represented by the Gamma distribution compared to the Weibull distribution.
Thus, the current study aims to investigate the suitability of the two-parametric distribution functions Normal, Log-Normal, and Gamma distribution, in addition to the standard Weibull approach, for representing flexural strength data of flame-sprayed components. Furthermore, this study presents a simulation based on resampling of experimentally determined strength data to investigate the influence of the sampling size on the robustness of different distribution functions and their characteristic parameters. This complements the theoretical simulation presented by Danzer et al. [12,14]. The study examines to what extent the flexural strength data of flame-sprayed components follows the theoretically expected fracture statistics of ceramic components.

2. Materials and Methods

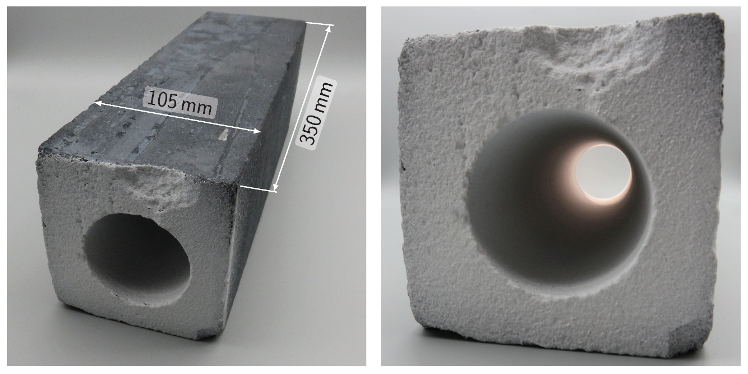
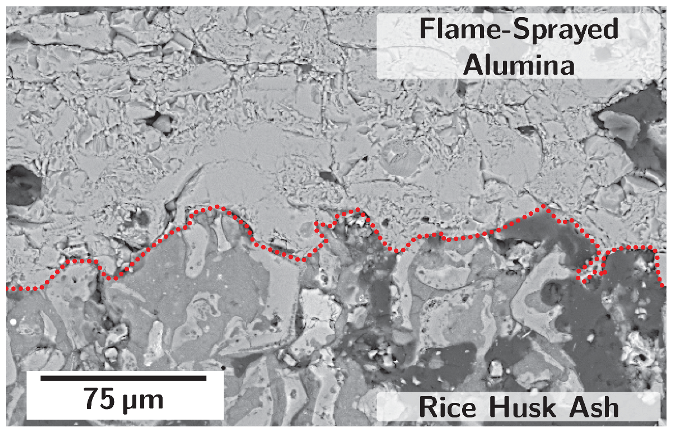
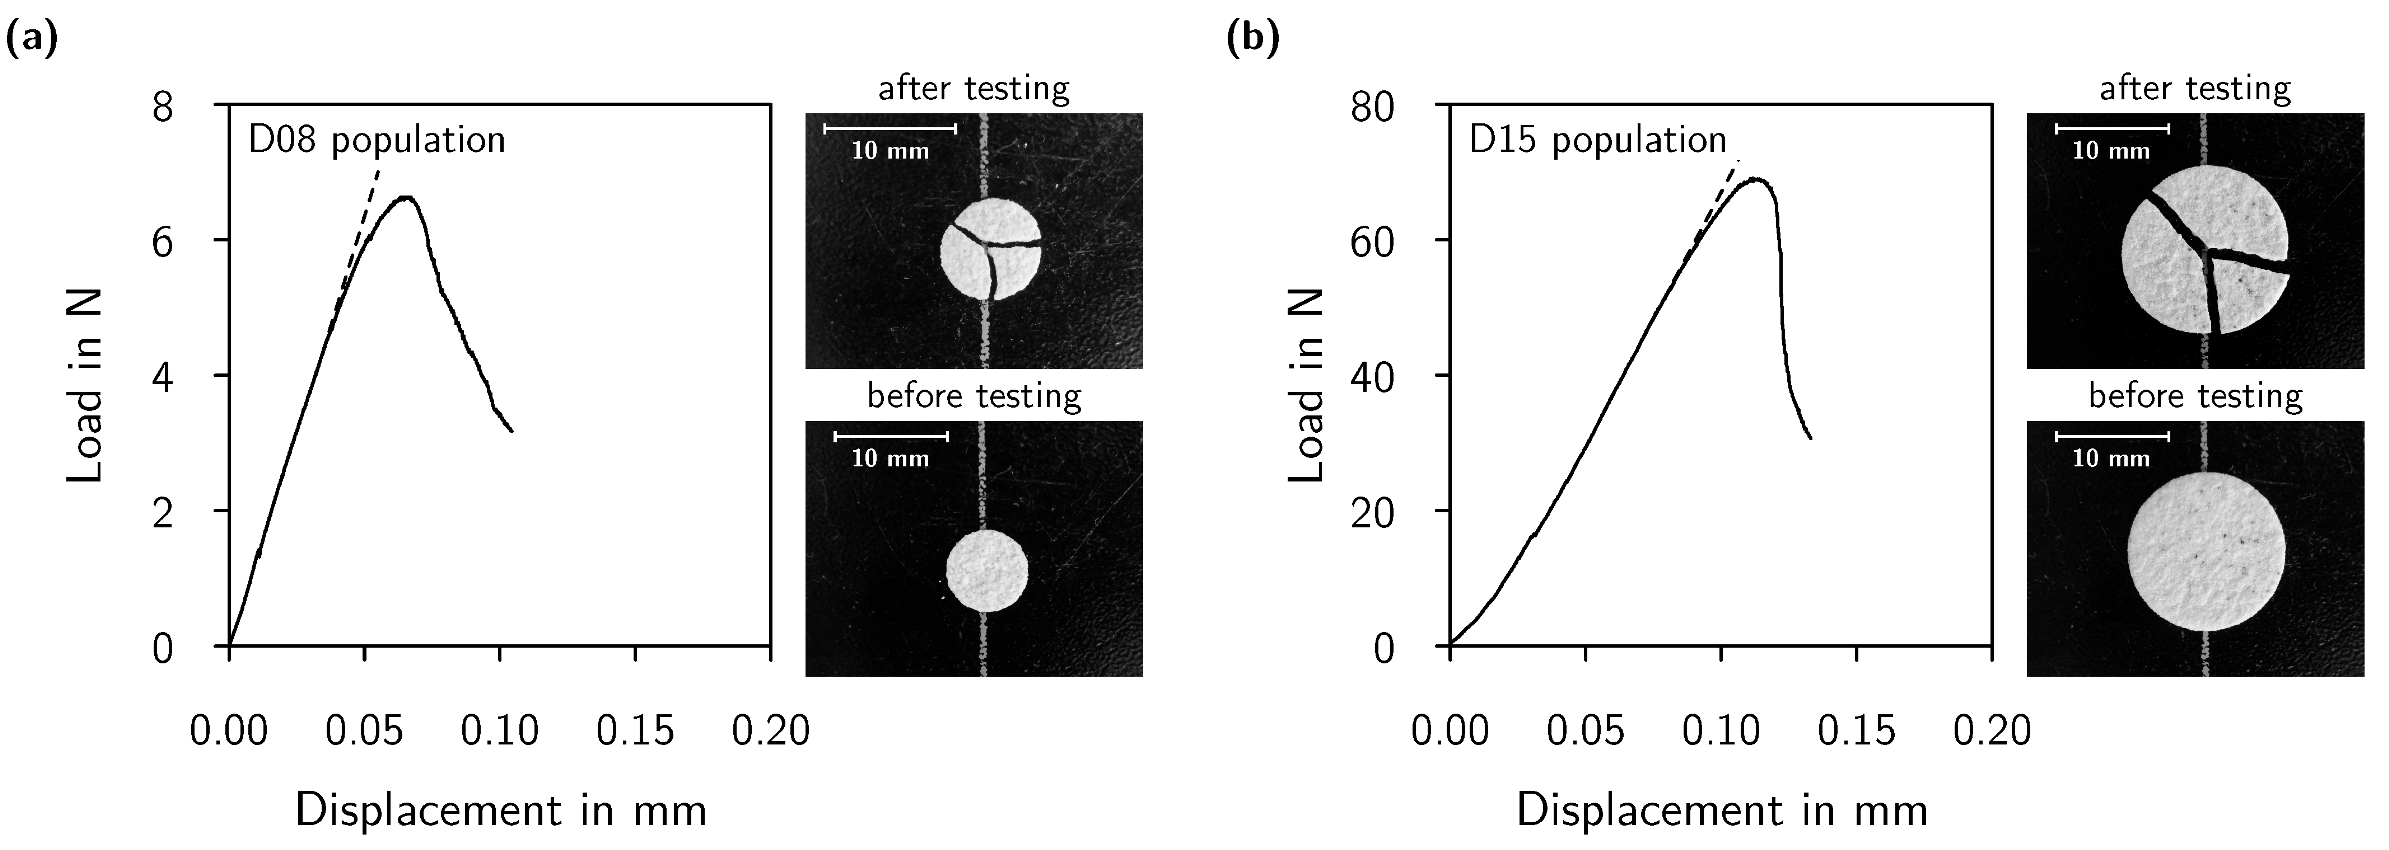
2.1. Fabrication and Testing of Specimens

For flexural strength testing, disc-shaped Al2O3 specimens were fabricated using the flame-spraying technique (Flexicord feedstock, Saint-Gobain Coating Soluations S.A.S., Avignon, France) on a graphite substrate (Graphite Materials GmbH, Zirndorf, Germany) with pins of diameter D = 8 m m and D = 15 m m , respectively. The spray distance between the flame-spraying gun and the graphite substrate was 150 m m . Table 1 summarises the parameters of the flame-spraying process. Details of the experimental setup were described by Neumann et al. [4]. After cooling, the specimens were removed from the graphite pins, resulting in self-supporting components. To avoid pre-selection of specimens for B3B testing, the proportion of rejects r, i.e., specimens, which were not removed from the substrate without rupture, was determined by r = 1 q q a 1 , where q is the number of usable specimens and q a the number of spraying attempts [4]. This ratio depends on the specimens’ geometry and thickness and the substrate properties. For each disc geometry, a total of 1000 specimens were fabricated with r < 0.01 . Following the suggestion by Neumann et al. [4], such geometries were suitable for estimating Weibull parameters. The two populations, designated as D08 and D15 according to the specimen diameter, each consisting of 1000 specimens, were tested for their flexural strength.
The flexural strength was determined using the ball on three ball test (B3B) [22,23]. For both populations, a similar experimental setup was used. The diameter of the used alumina balls was 5 m m and 10 m m for D08 and D15, respectively. All specimens were tested with a loading rate of 0.5 mm min−1. The flexural strength was calculated according to Equation (1) using the maximum load at rupture F c , the specimens’ thickness t, and the dimensionless factor f * . The latter is dependent on Poisson’s ratio ν and the ratio of both the specimens’ thickness t and the support balls’ diameter D s to the specimens’ diameter D and was calculated by an empirical formula presented by Börger et al. [23]. The Poisson’s ratio ν of the flame-sprayed material was approximated by ν = 0.2 . A thickness measurement of the flame-sprayed components was carried out using a digital caliper (resolution 0.01   m m ).
σ c , B 3 B = f * 2 t D , D s D , ν F c t 2
Figure 3 shows exemplary load-displacement curves of one tested specimen each of the D08 and D15 populations. For both curves, deviation from linearity at peak load was observed.

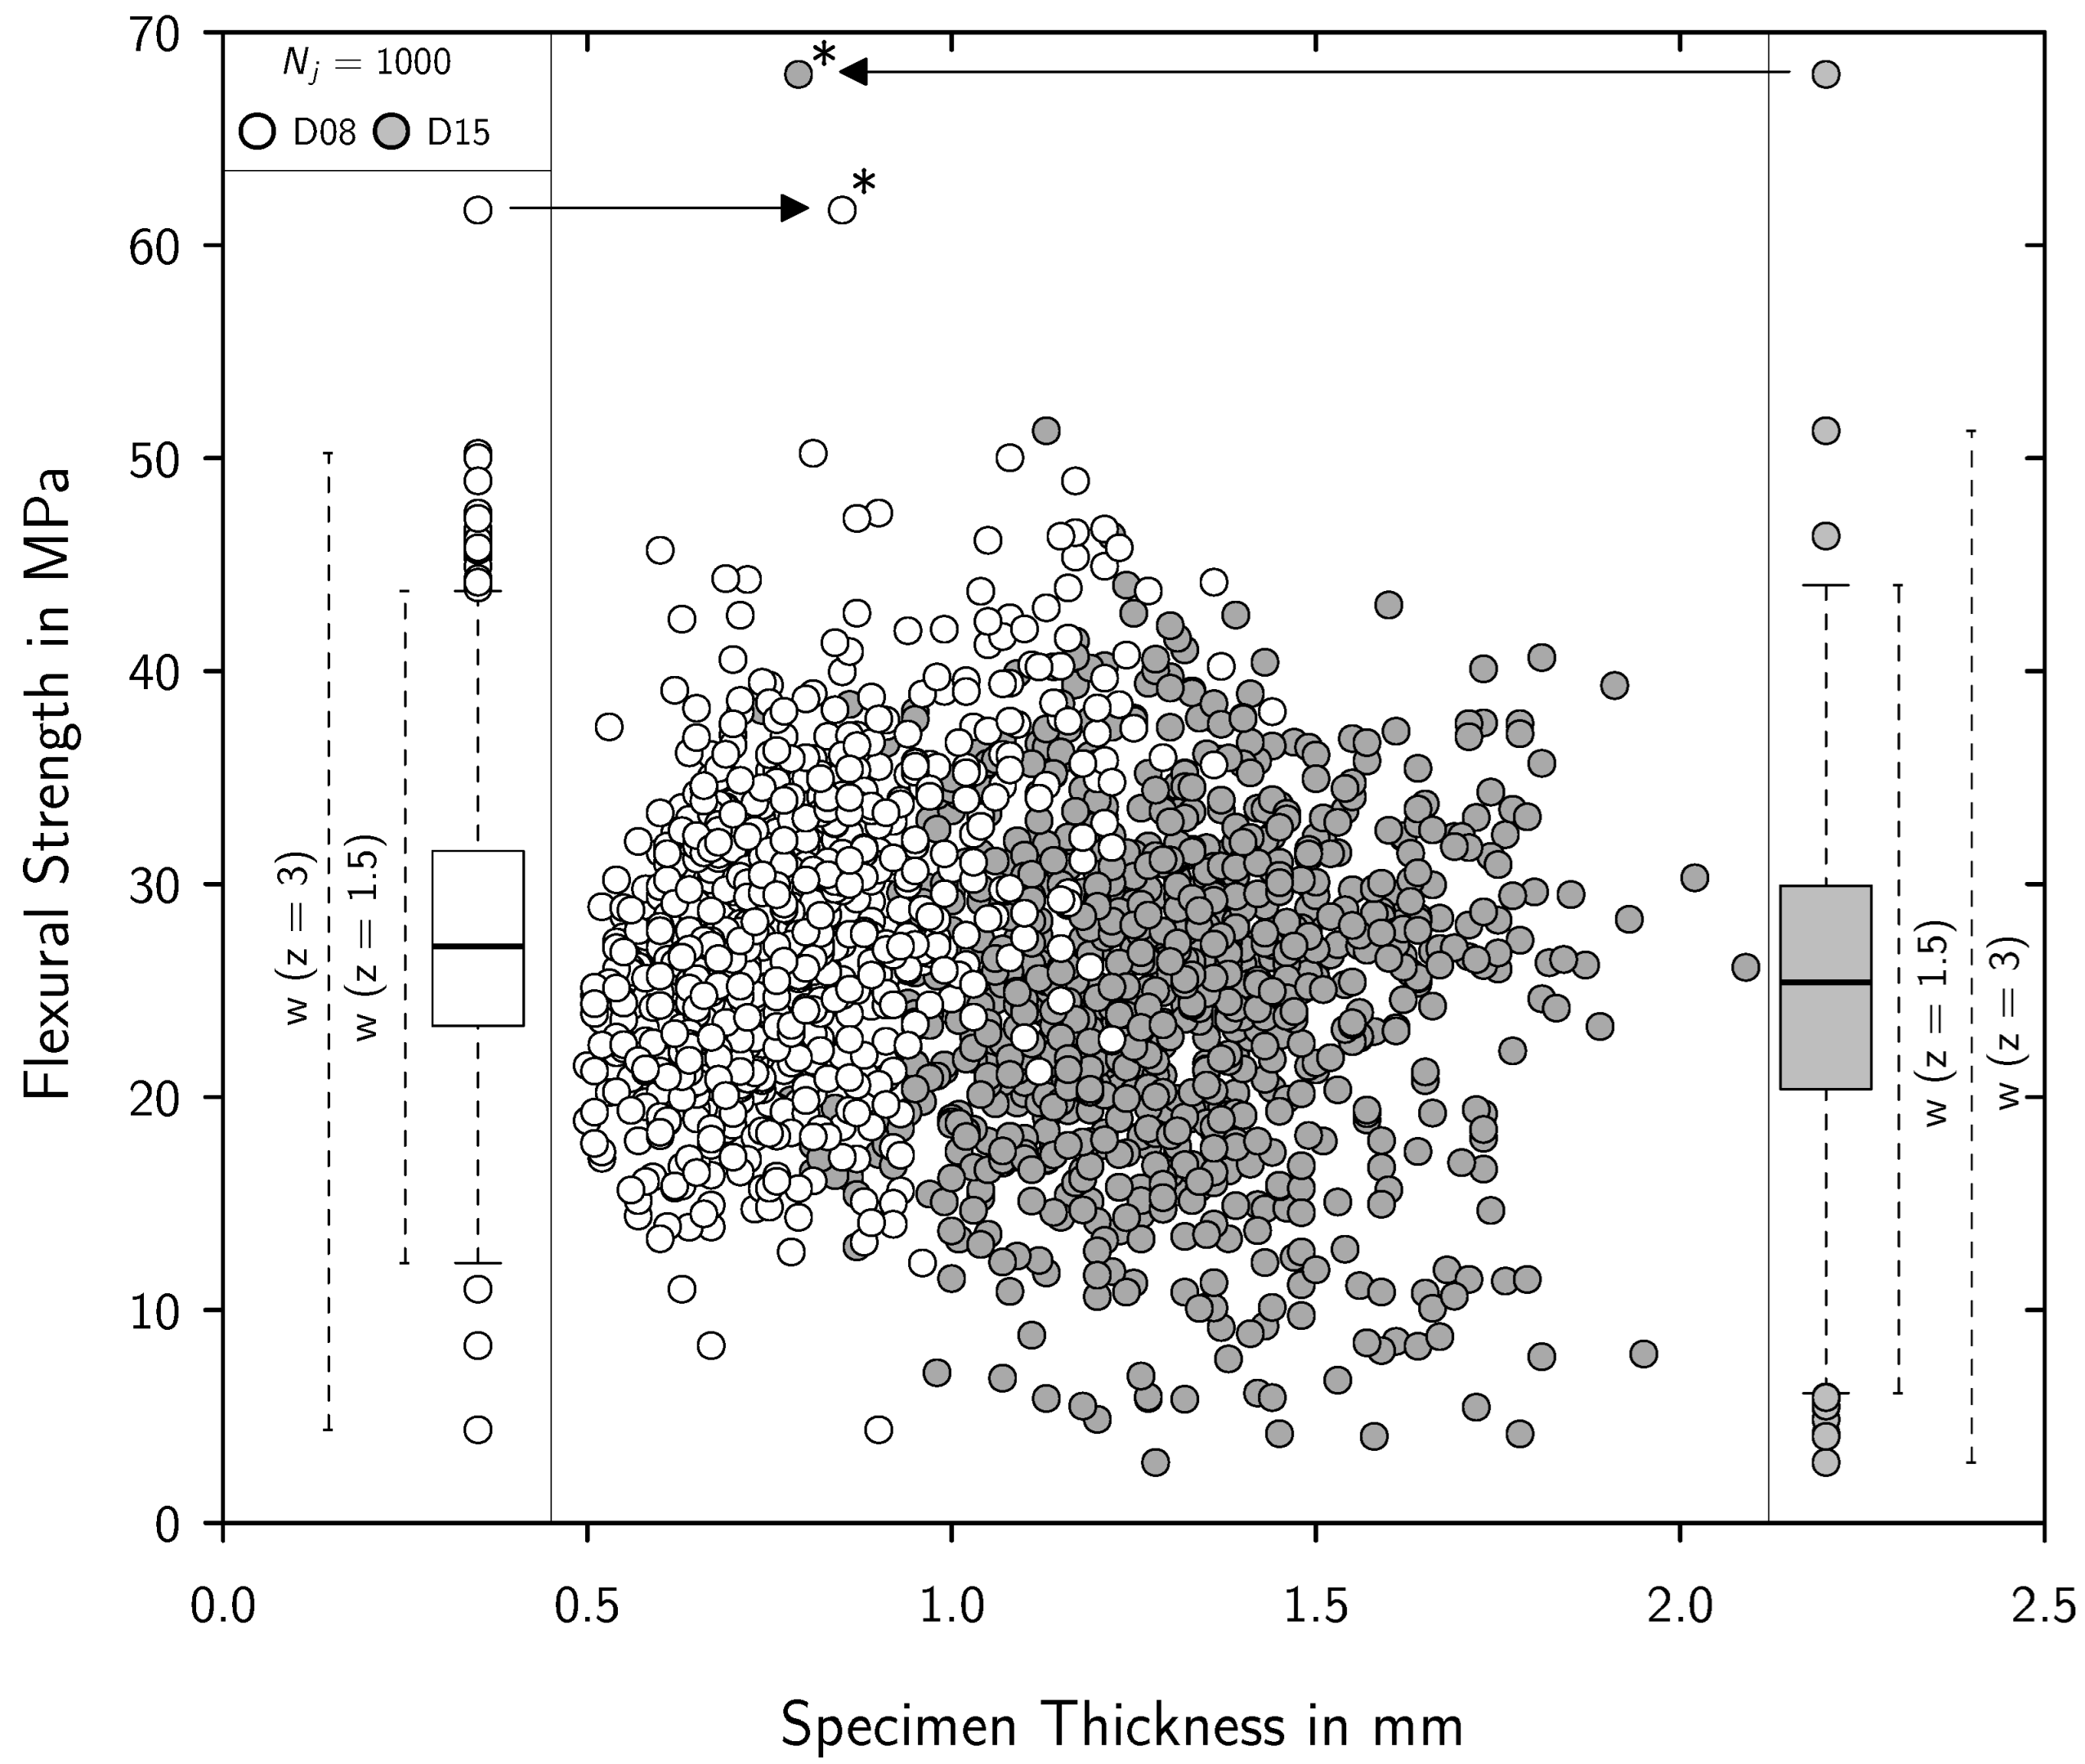
2.2. Statistical Analyses

All calculations described in this work were performed using the statistical software package R [24]. Whenever required, a local weighted regression (LWR) was applied using the loess function from base R [25] to smooth certain curves for clarity and readability. The figure captions indicate the use of LWR. A span width of 0.05 was used, corresponding to 5% of the total data points used as nearest surrounding neighbours for the local regression at each point.
The compatibility of different two-parametric distribution functions, namely Weibull (W), Normal (N), Log-normal (LN), and Gamma (G) (Equations (2)–(5)) with the experimental data was investigated in the following analysis. The statistical variable was the flexural strength obtained by B3B designated as σ .
p W ( σ ) = m σ 0 W σ σ 0 W m 1 exp σ σ 0 W m
p N ( σ ) = 1 δ 2 π exp 1 2 σ σ 0 N δ 2
p LN ( σ ) = 1 σ 1 ω 2 π exp 1 2 l n ( σ ) l n ( σ 0 LN ) ω 2
p G ( σ ) = 1 σ 0 G k Γ ( k ) σ k 1 exp σ σ 0 G
The compatibility was evaluated using quantile-quantile probability plots (Q-Q plots) constituting the experimental data against the values calculated with a theoretical distribution. Moreover, the visual examination of the fit quality was complemented by calculating the coefficient of determination R 2 for each distribution according to Equation (6). Therefore, the fitting parameters were determined using the maximum likelihood method (for details, see [20]), while the probability of failure ( P i ) was determined for the ascending ranked experimental data according to Equation (7). Note that quantities determined for the experimental data receive the index ‘ex’.
R 2 = 1 i = 0 N j ( σ i σ i , t h ) 2 i = 0 N j ( σ i σ i ) 2
P i = ( i 0.5 ) N j 1
The experimentally determined strength data were assumed to be a representative distribution of the true strength data of the flame-sprayed components. This assumption allowed for the application of the random resampling technique to investigate the influence of the sampling size on the robustness of different fitted distributions and their corresponding shape and scale parameters.
Random resampling was used to generate sub-populations from each experimentally determined population. The sub-populations were of size N j , with N j = { 30 ; 31 ; ; 1000 } . For each value of N j , 1000 sub-populations were generated by drawing N j strength values with replacement from the data sets. This resulted in a total of 971,000 distinct sub-populations being generated from each of the populations D08 and D15. For each sub-population, the coefficient of determination, shape, and scale parameters for the Gamma and Weibull distributions were determined.
Whenever required, percentiles were calculated using the quantile function from R stats package [24]. The uth percentile of variable X is denoted as X | u . The median of X would thus follow the denotation X | 50 . The u v th interpercentile range X | v u for the variable X is calculated by subtracting the vth percentile X | v from the uth percentile X | u .

3. Results and Discussion

In Figure 4, the complete experimental data are presented, i.e., the flexural strength over the specimen thickness. As presented and irrespective of the test series D08 or D15, for both the specimen thickness and the determined flexural strength, a certain scattering was observed. As outlined, the basic flame spray settings were kept consistent for both test series (number of oversprays, etc.). Consequently, from the processing point of view, the test series themselves can be considered consistent, meaning a sufficient resemblance of all individual specimens per series.
Following Equation (1), the influence of the specimen thickness should already be accounted for and thus the flexural strength should be independent of the specimen thickness. Referring to the scatter plots from Figure 4; however, a correlation between the specimen thickness and the flexural strength cannot be rejected from visual inspection alone. For that reason, the data were tested for correlation by the non-parametric Spearman rank sum correlation test. Basically, such test results in a correlation factor ρ [ 1 , 1 ] . For ρ [ 0.1 , 0.1 ] , no correlation would be given, for ρ ± [ 0.1 , 0.5 ] , a mild correlation can be assumed, and for ρ ± [ 0.5 , 1.0 ] , a strong or very strong correlation is present [26]. In the present study, mild correlation is considered the maximum tolerated correlation in order to hold the basic premise of one consistent data set. Mild correlation may trace back to the influence of the human operator and could be arbitrary. Known from the literature, several flame-spray process parameters can affect the final coating properties, such as the spray angle, distance between the spray unit and the substrate, or the horizontal travel- or rotation-speed of the spray unit, to name a few [1,2,27]. As an operator, a human would be unable to reproduce those settings exactly for each specimen, for example, due to human fatigue. Eventually, that may result in an inherent scatter of the specimen thickness and the derived flexural strength, as it was observed (cf. Figure 4). That is why mild correlation between the specimen thickness and the flexural strength is accepted (per test series). In contrast, a strong or very strong correlation would mean that the specimens are not similar due to strong variation in the spray process parameters. If so, the specimens could differ too much in terms of their microstructure, modulus of elasticity, local phase composition, etc. In the present study, the resulting ρ of D08 and D15 amounted to 0.39 and 0.10, respectively. Henceforth, for both series, only a mild correlation is present from the data and both series can be considered as one entire population each.
The boxplot representation reveals a rather symmetric distribution of the strength data around its median for both test series. Equal for both, a certain amount of outliers can be derived from the standard boxplots, i.e., for w ( z = 1.5 ) . Also equal for both, an extreme positive outlier was found, i.e., for w ( z = 3 ) (cf. Figure 4). For the present study, extreme positive outliers are excluded from the experimental data (in Figure 4 indicated by asterisks). Extreme positive outliers oppose the conservative point of view insofar as they would lead to an overestimation of the flexural strength limits even for robust statistical measures (median, upper and lower quartile, etc.). Overestimation is considered the more harmful way of misestimation. Excluding such positive outliers can be understood as a ‘concept of maximum doubt’. Extreme negative outliers on the contrary (whenever present), should not be excluded at any rate. Hence, for the following resampling procedures, the experimental data pool comprises N ex = 999 strength values per series.

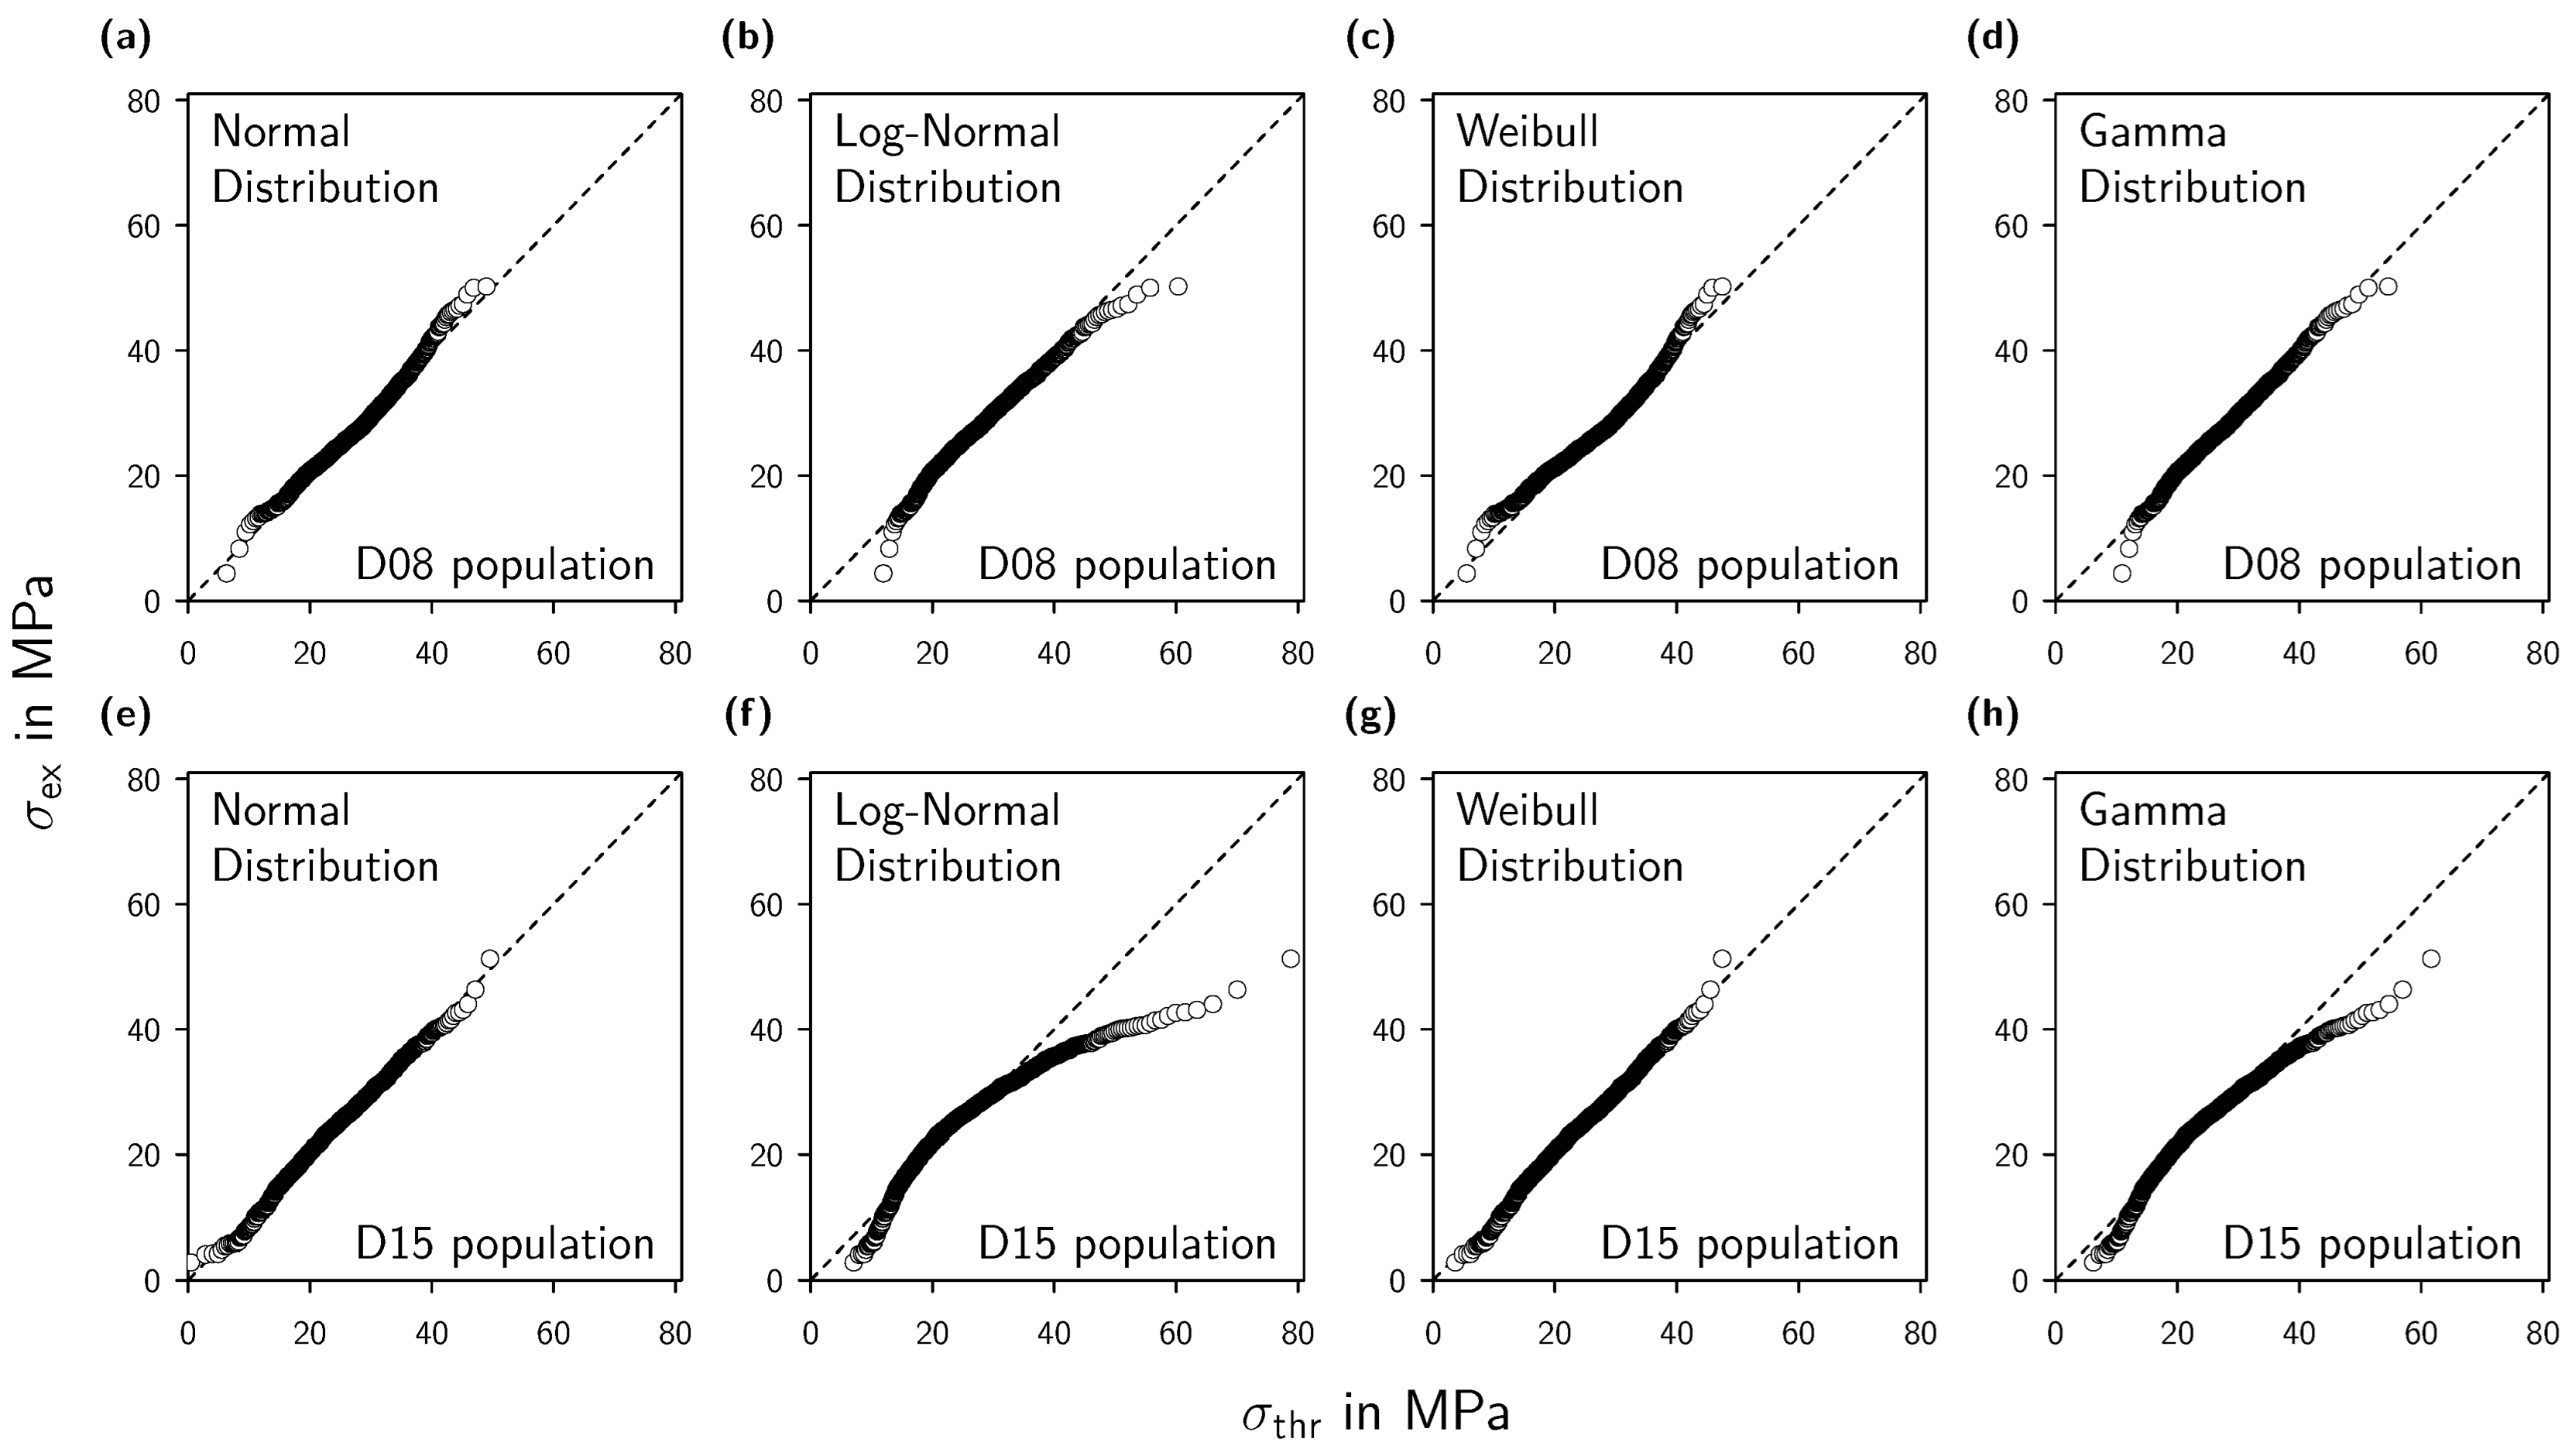
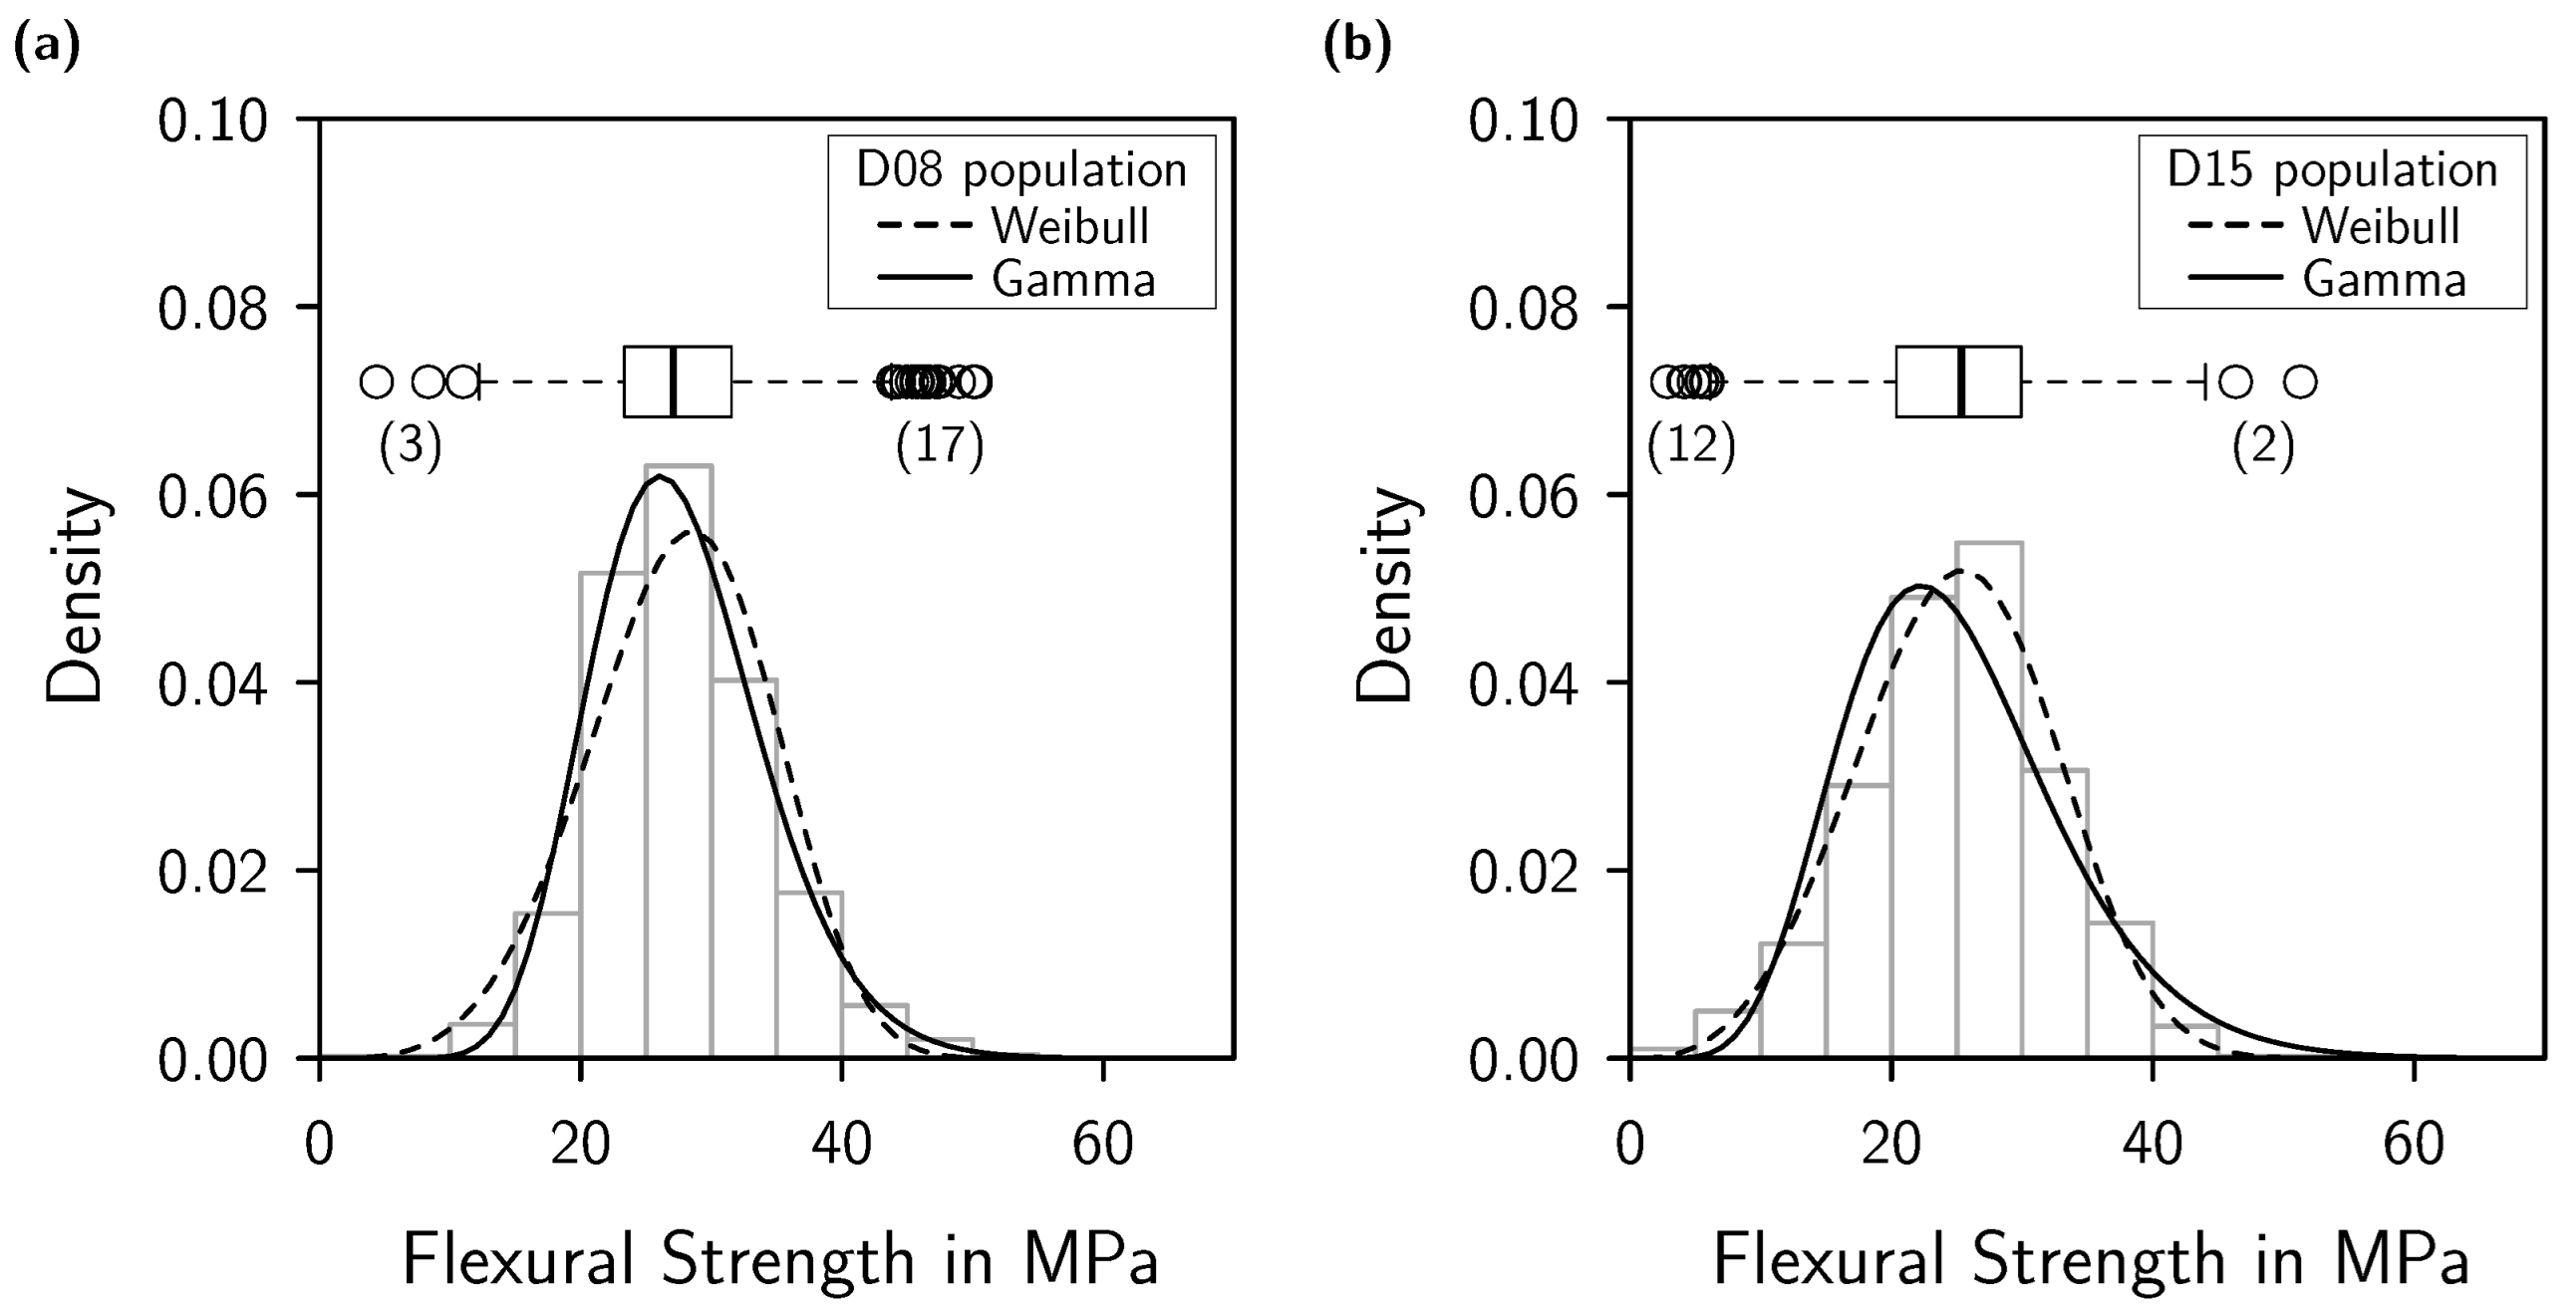
3.1. Fitting of Two-Parametric Distributions for Experimental Data

Figure 5 presents Q-Q plots for D08 and D15 assuming either the Weibull, Normal, Log-Normal, or Gamma distribution for the experimental data. The corresponding coefficients of determination R ex 2 as well as shape and scale parameter for each fit are summarised in Table 2.
Visually, both populations fit well to a straight line for the Weibull or the Normal distribution. However, the fit for the Weibull distribution was slightly worse for D08 compared to D15. Accordingly, the Normal or the Weibull fit gave the highest R ex 2 values for the D15 population and slightly lower values for the D08 population (Table 2). In contrast, the data points deviate from a straight line when assuming Log-Normal distribution, resulting in lower R ex 2 values, particularly for the D15 population. This indicates a poor representation of the data points, leading to the rejection of the Log-Normal distribution for flexural strength data of flame-sprayed materials.
The Gamma distribution gave an excellent fit to the D08 population with an R G , ex 2 = 0.9954 . However, the accuracy of the fit was worse for the D15 population. Nevertheless, a high R G , ex 2 > 0.94 was observed for both populations. Therefore, the Gamma distribution was considered for further investigation.
Figure 6 shows the histogram of the experimental data for both populations with the fitted lines for the Weibull and the Gamma distributions. It can be seen that the right tail of the Gamma distribution is larger compared to the Weibull distribution. This means that positive outliers are less detrimental to the Gamma distribution fit. On the other hand, when fitting the Weibull distribution, the left tail was found to be larger. This suggests a greater tolerance for negative outliers. The box plots show that the outliers of the D08 population were mainly positive outliers (Figure 6a), while those of the D15 population were mainly negative outliers (Figure 6b). Because of that, the fit quality of the D08 population was better with the Gamma distribution than with the Weibull distribution ( R G , ex 2 > R W , ex 2 ). Conversely, the fit quality of the D15 population was better with the Weibull distribution than with the Gamma distribution ( R W , ex 2 > R G , ex 2 ), see Table 2.
The Q-Q analysis showed that both D08 and D15 were equally well represented by the Normal distribution. However, Neumann et al. [4] reported that the Normal distribution underestimates the loss of strength in flame-sprayed components due to thermal shock. This is critical for components subjected to substantial thermal shock such as refractory hollowware [6,7]. Therefore, the Normal distribution was rejected.

3.2. Random Sub-Population Analysis–Random Resampling

Based on the Q-Q analyses, the Weibull and the Gamma distribution functions were found to be suitable for representing the experimental strength data. Consequently, these distributions were used to fit the sub-populations generated by random resampling of the experimental strength data.

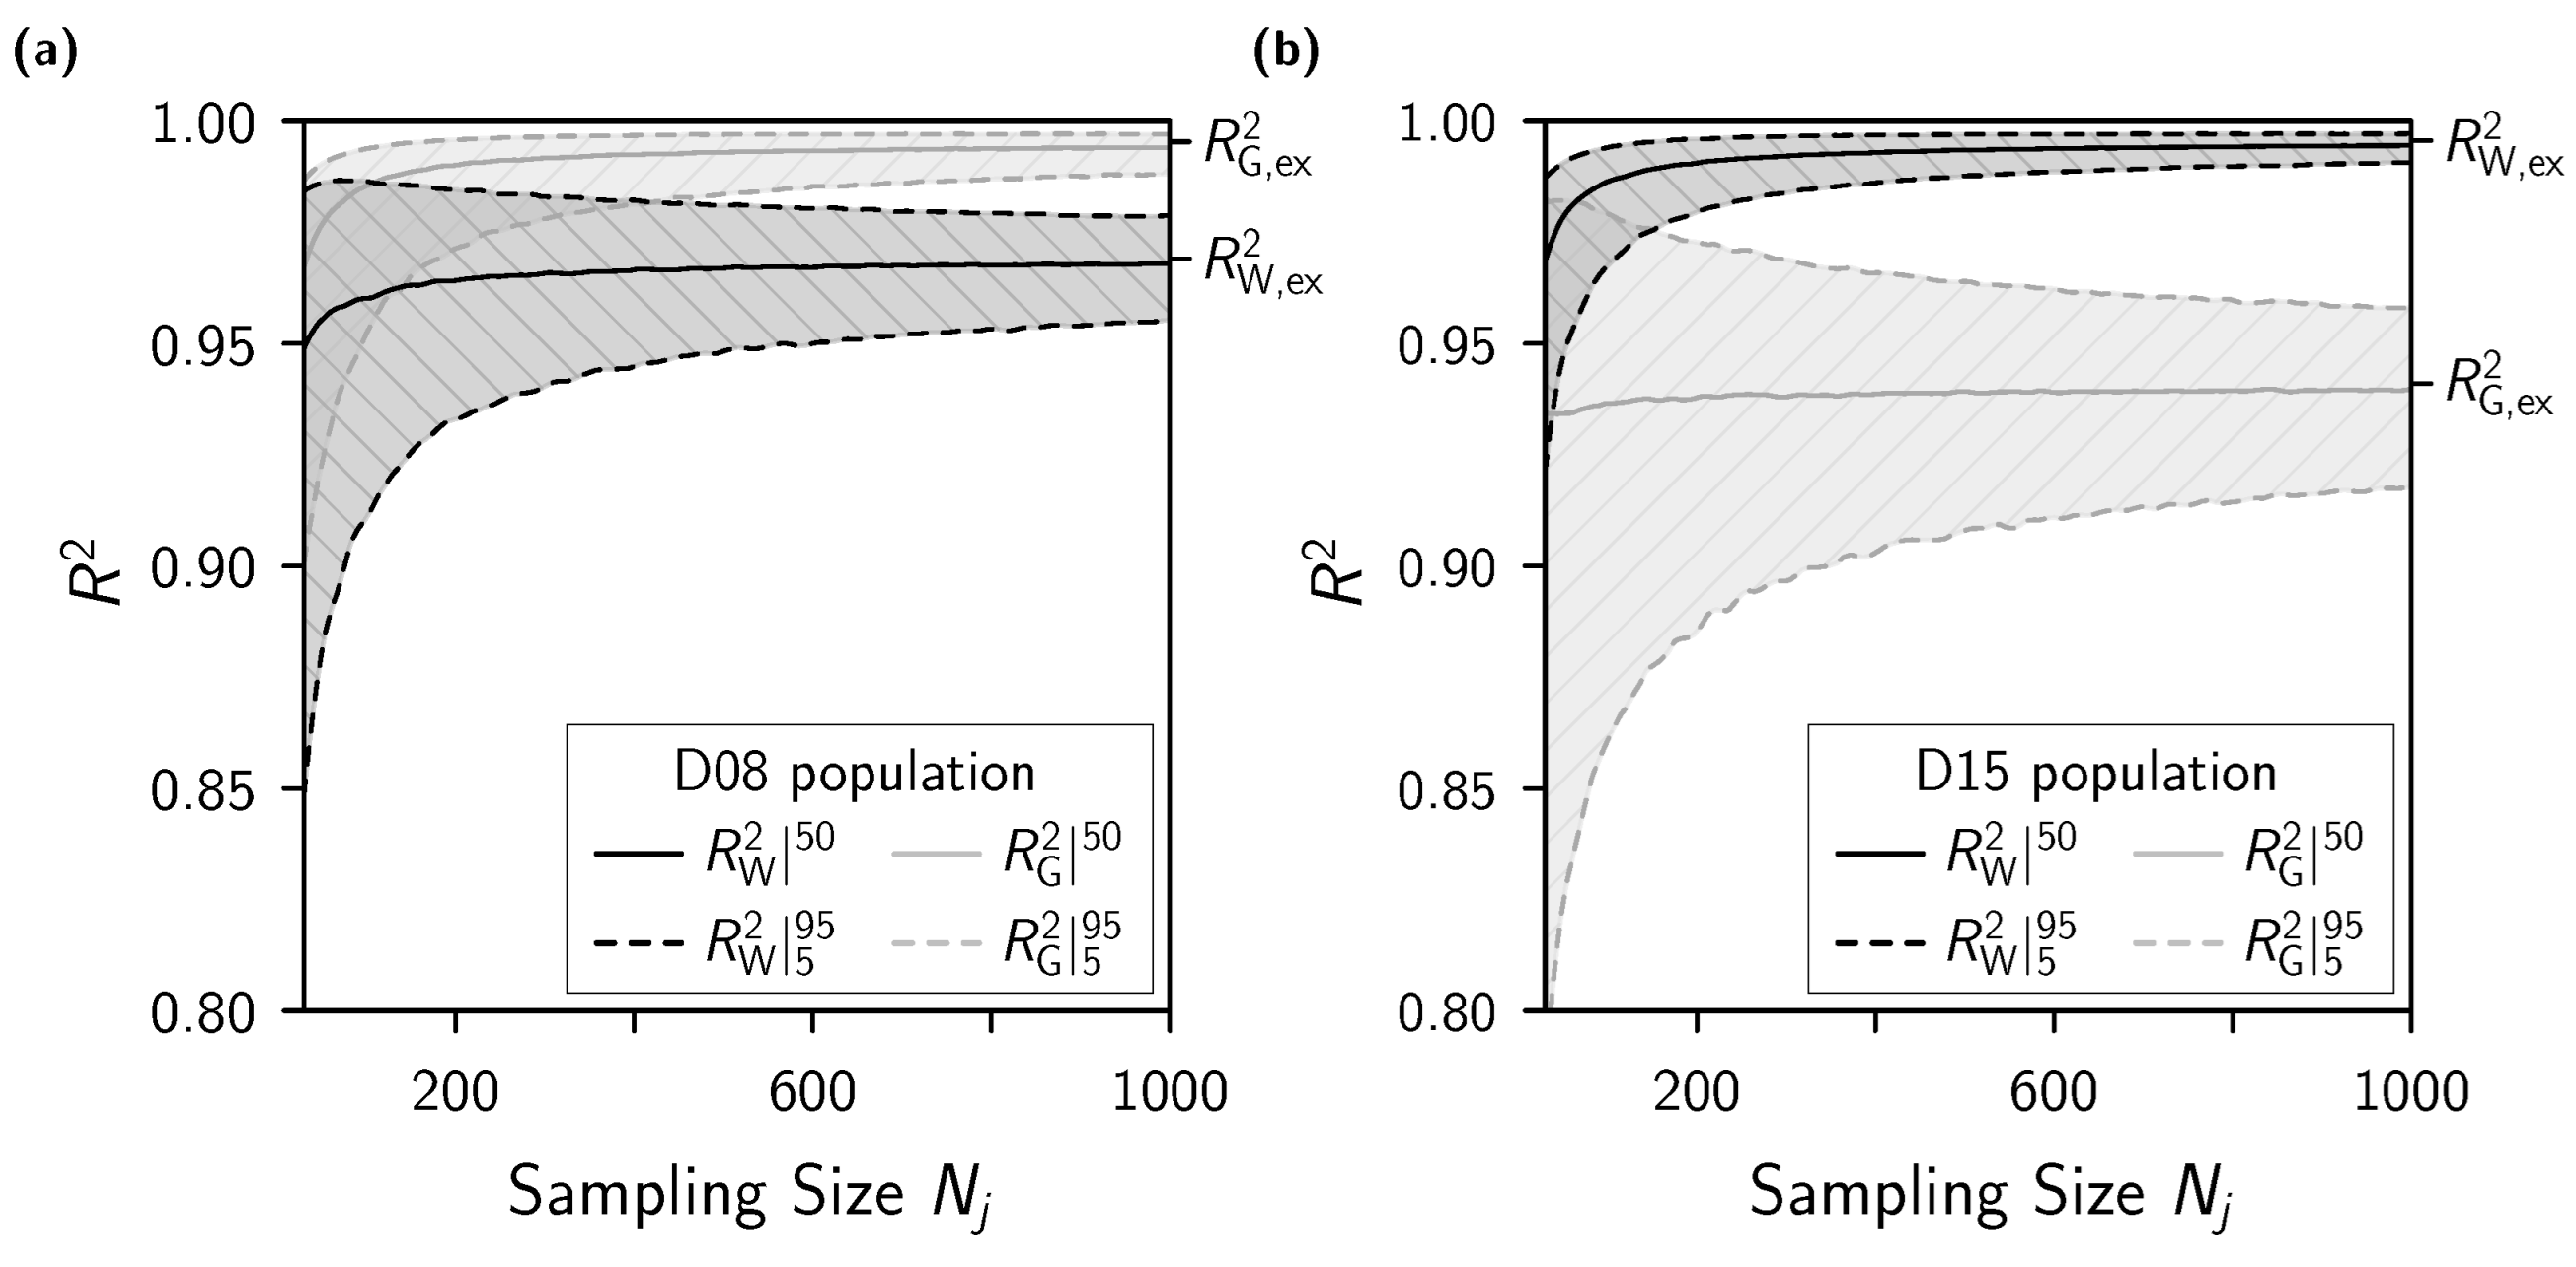
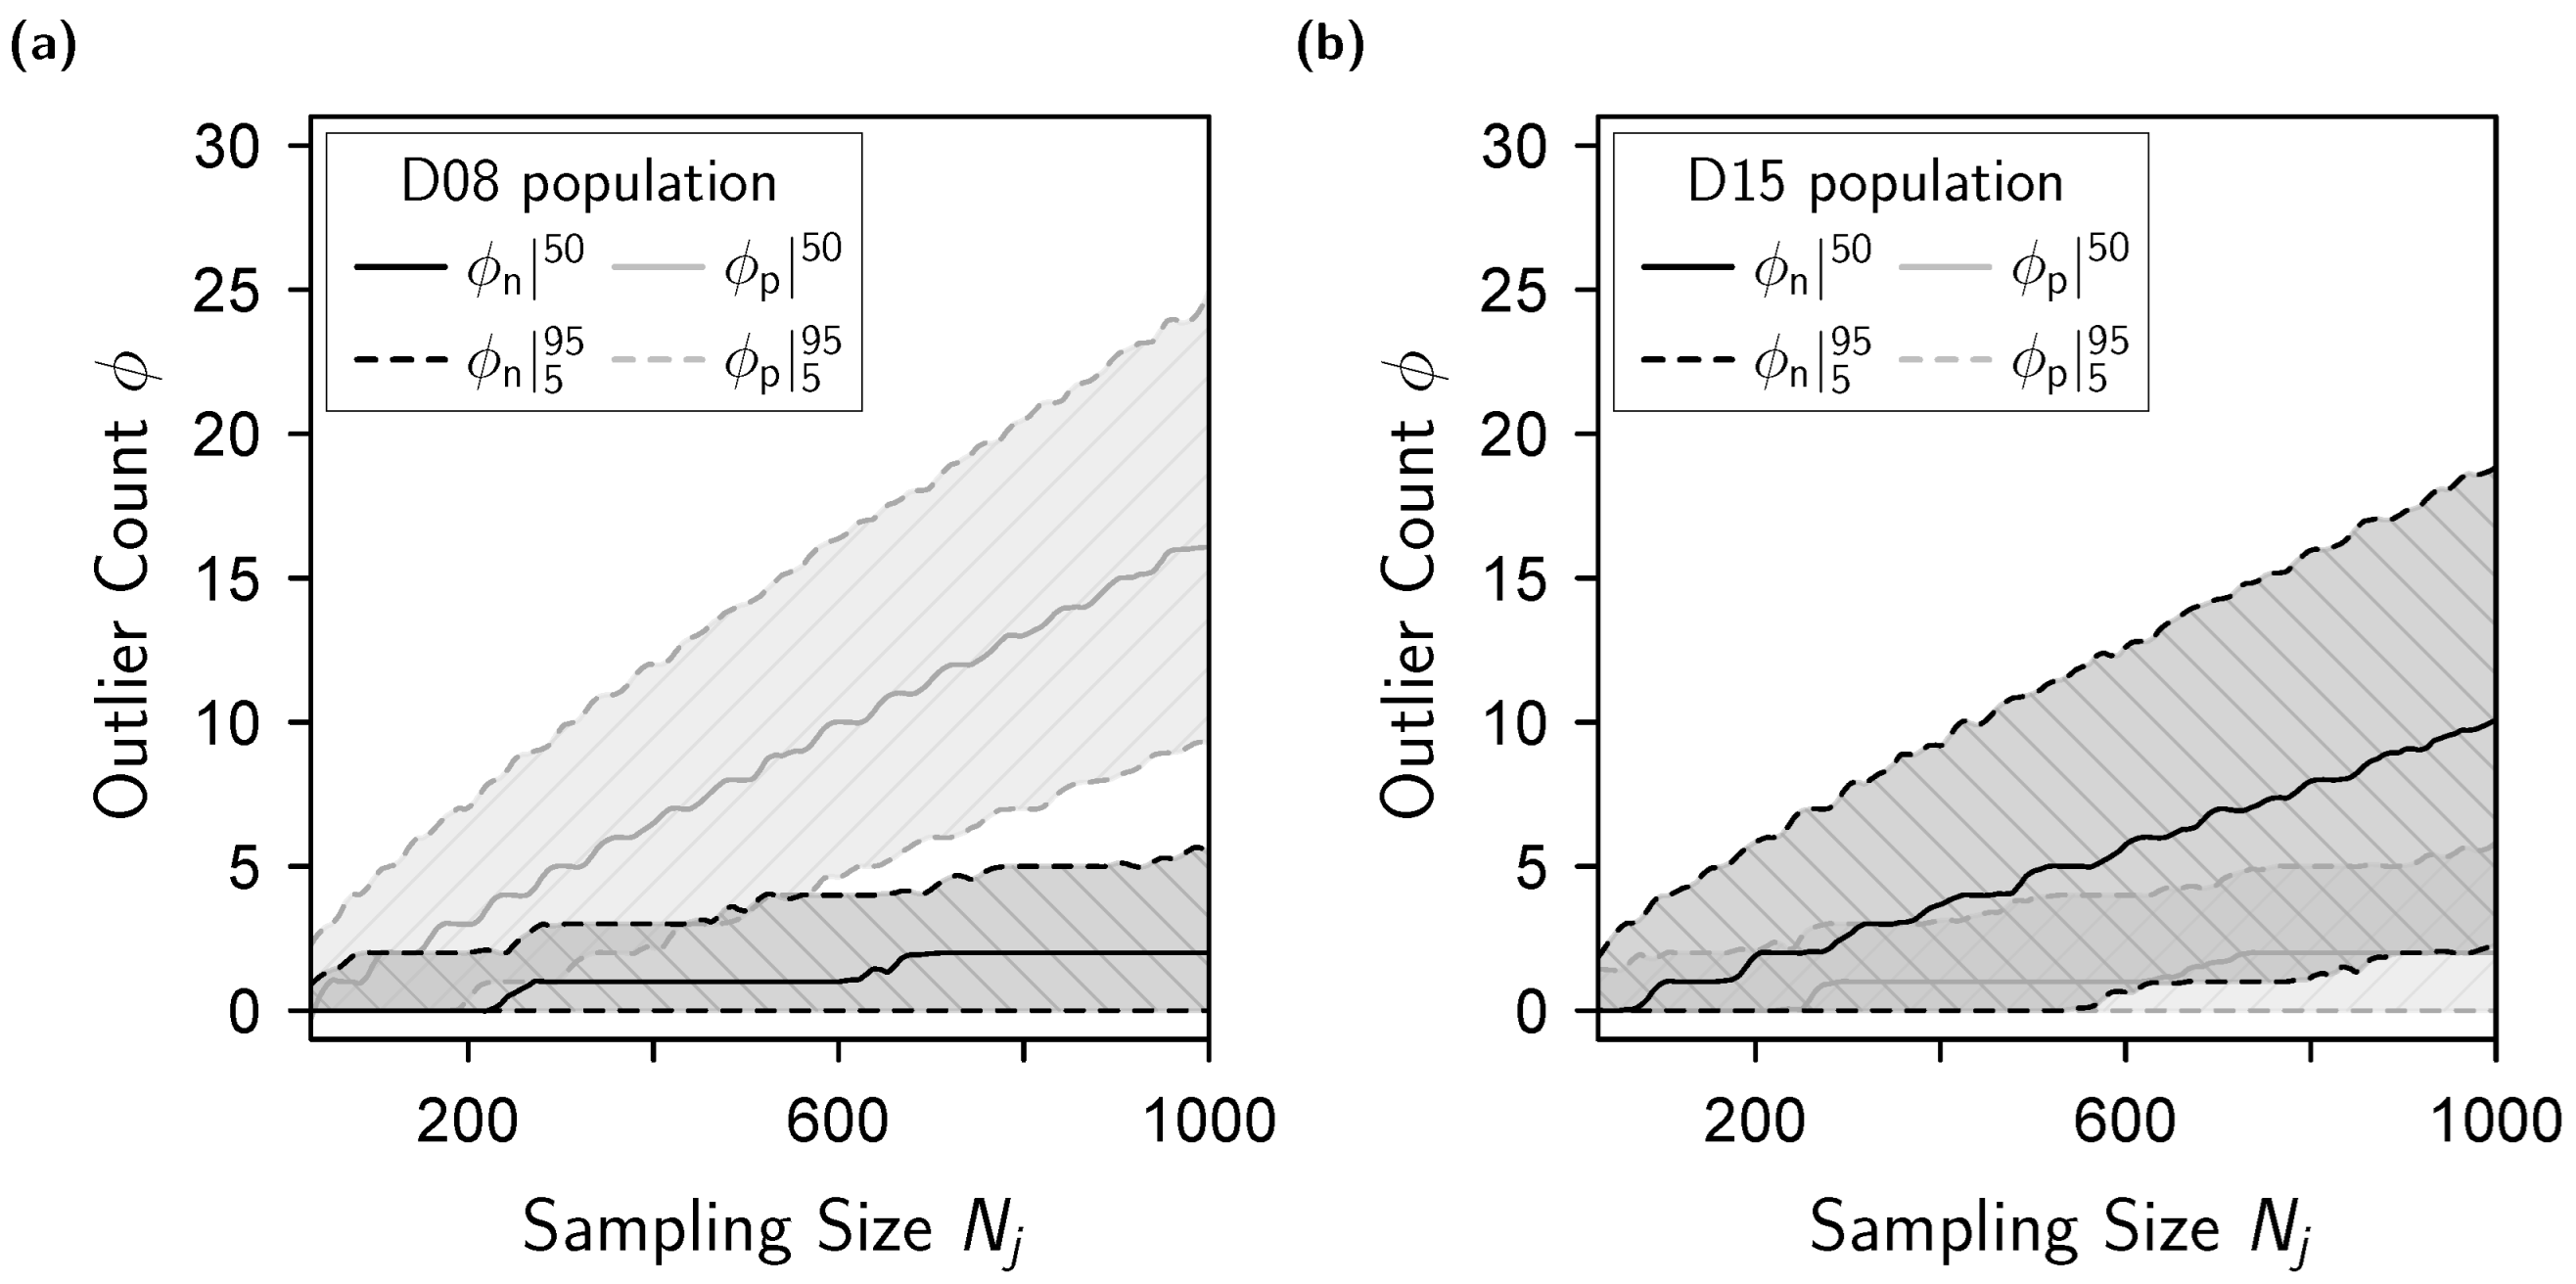
3.2.1. Coefficient of Determination

Figure 7 shows the relationship between R 2 and the sampling size ( N j ) based on random resampling of the strength data. With the increasing sampling size, the median fit quality (represented by R 2 | 50 ) improved and approached the fit quality of the underlying experimental data set ( R ex 2 , Table 2). Accordingly, the interpercentile range between the 5th and the 95th percentiles ( R 2 | 5 95 ) decreased with the increasing N j . This trend is in line with the law of large numbers [13].
However, the span width of R 2 | 5 95 for the D08 and D15 populations varied depending on the assumed distribution. Specifically, when the Weibull distribution was used, R W 2 | 5 95 was larger for the D08 population compared to D15, and the lower boundary reached smaller values for the decreasing N j . On the other hand, when the Gamma distribution was used, R G 2 | 5 95 of the D15 population was larger than that of the D08 population, and the lower boundary reached smaller values for decreasing N j .
The following has to be discussed:
  • Among others, the fit quality of a data set depends on the number of its outliers, which also affects the fit quality of sub-populations derived from the data.
  • A sub-population from a data set containing a high number of outliers may have a high or low fit quality, depending on chance.
  • Generating a sub-population with a high fit quality is more likely if the number of outliers in the underlying experimental data is low. This also reduces the scatter in the fit quality of the generated sub-populations.
Figure 8 indicates that sub-populations from D08 had a larger median number of positive outliers than negative outliers, regardless of N j . Moreover, the variability of the positive outliers was higher than that of the negative outliers (wider span of the IPR). Because the Weibull distribution is more sensitive to positive outliers than the Gamma distribution, this caused R W 2 | 50 to be lower than R G 2 | 50 for all N j and a higher variability in R W 2 compared to R G 2 for the D08 sub-populations. The share of positive and negative outliers showed an opposite behaviour for sub-populations from D15, resulting in a reversal of the R 2 values and their scatter for the Weibull and Gamma distributions. This was because the Gamma distribution is more sensitive to negative outliers than the Weibull distribution.
Nevertheless, the median fit quality R 2 | 50 of the generated sub-populations was similar to the fit quality of the corresponding experimental data independently of N j . Table 3 illustrates the required N j to achieve R ex 2 within specified boundaries. This shows that R 2 | 50 was robust even for small sampling sizes.

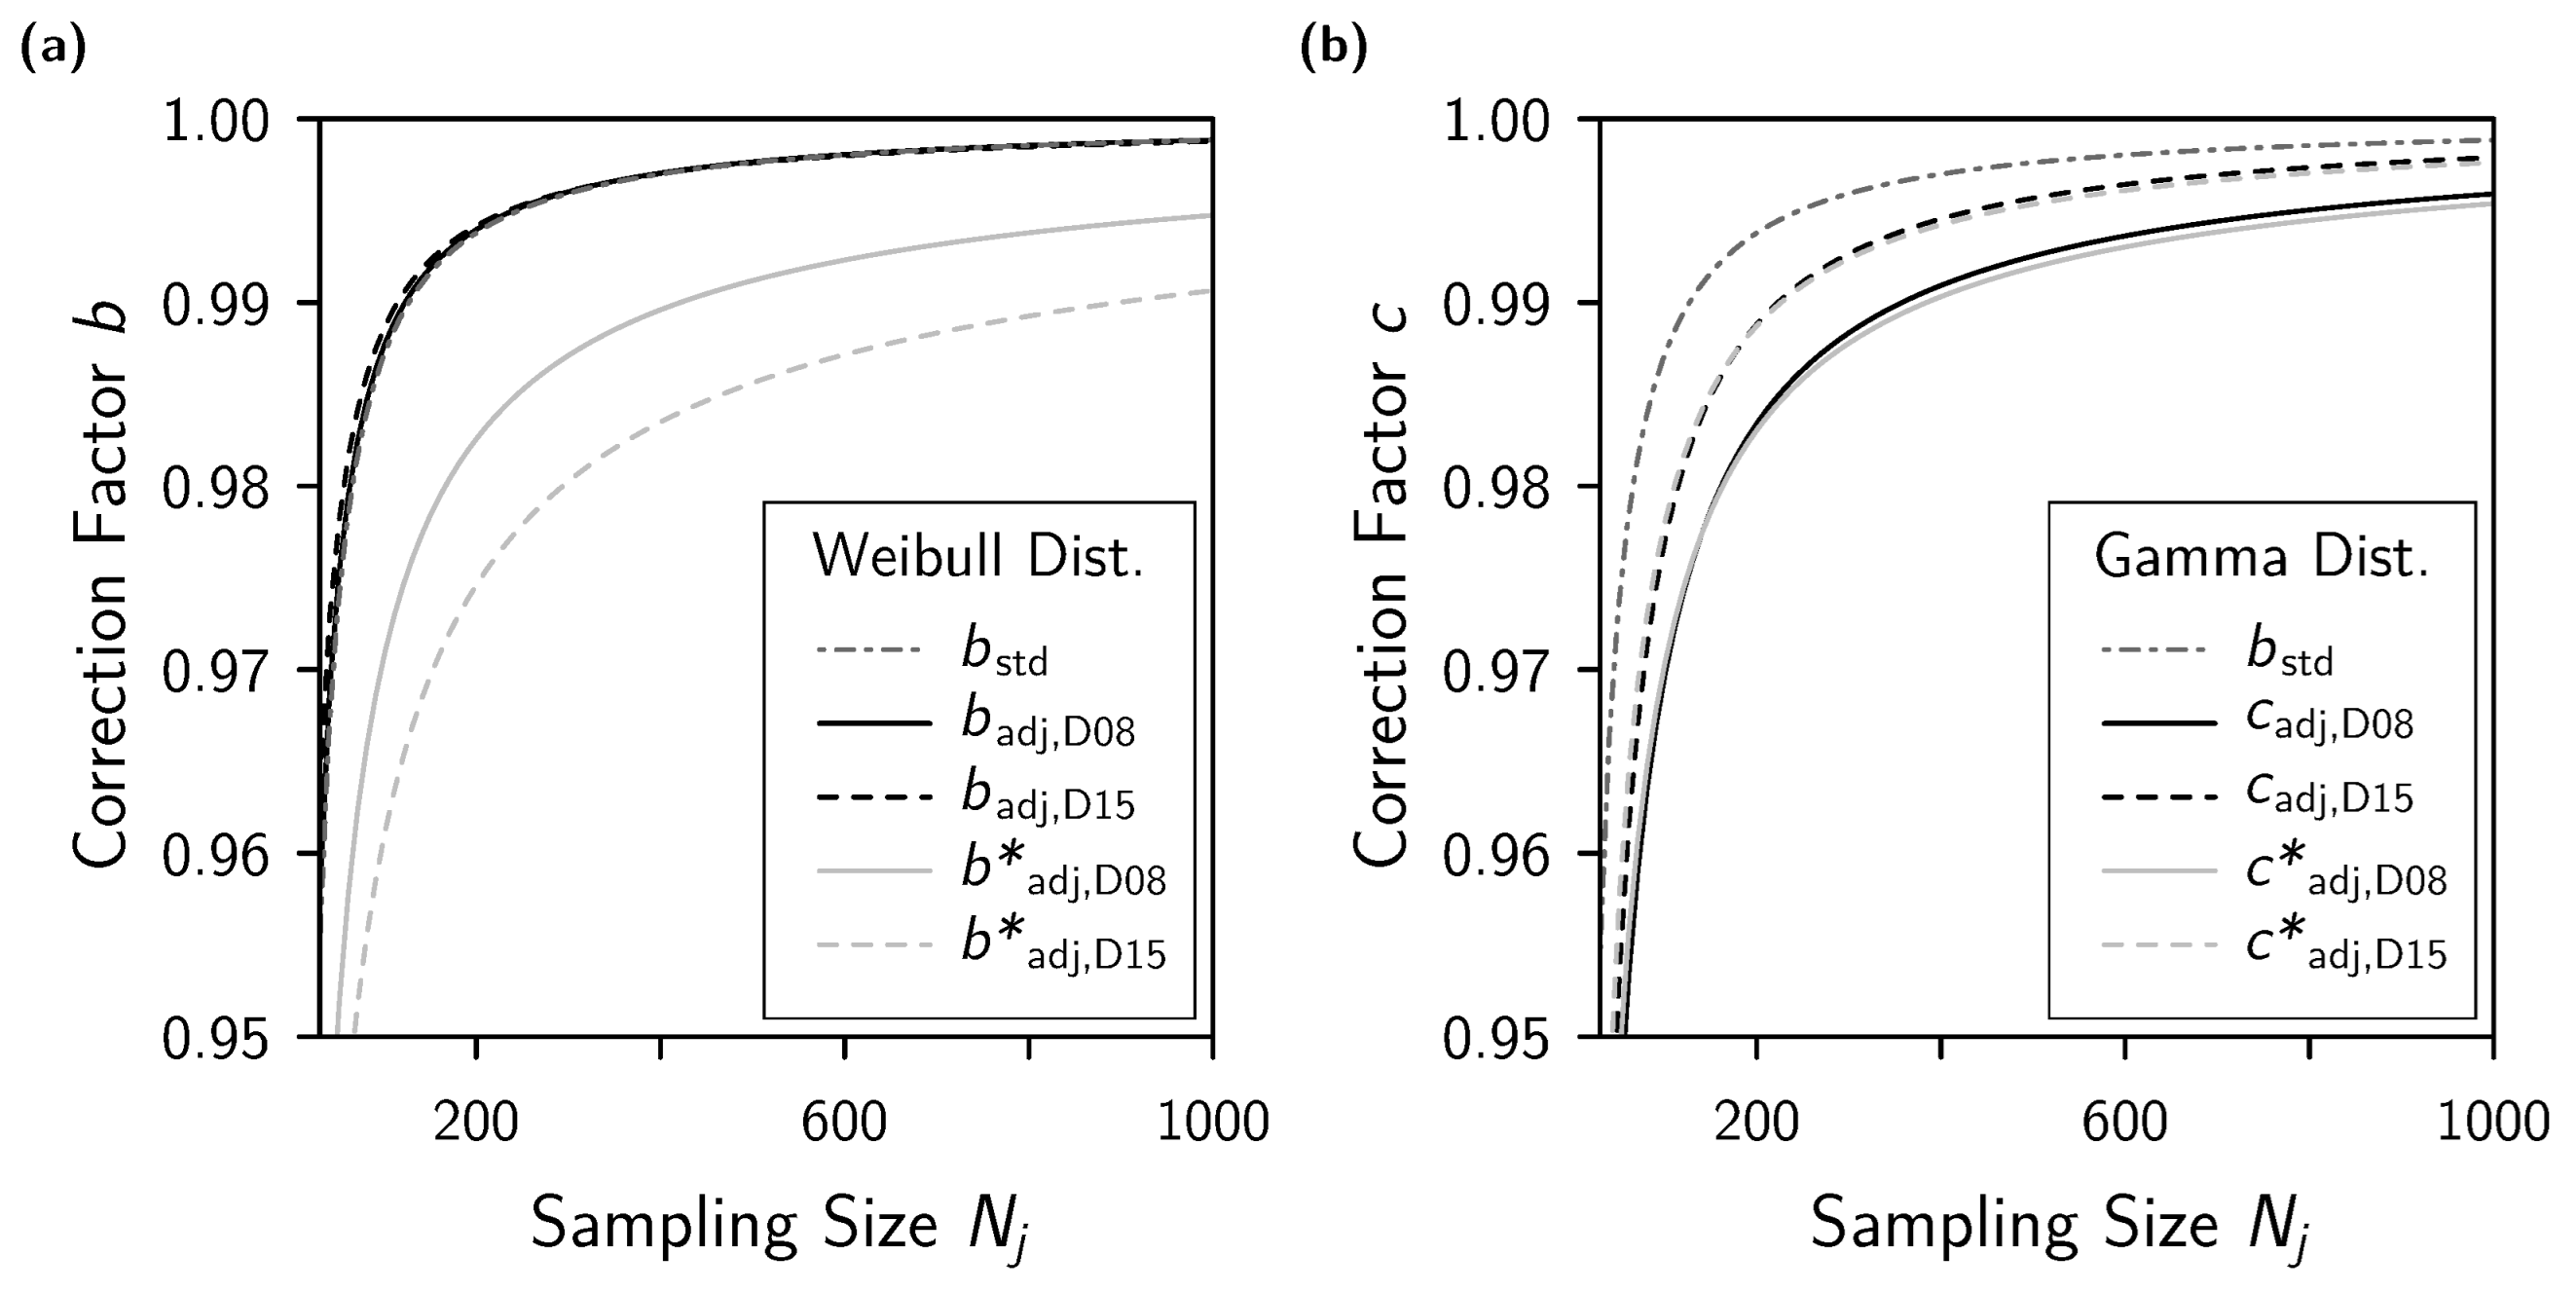
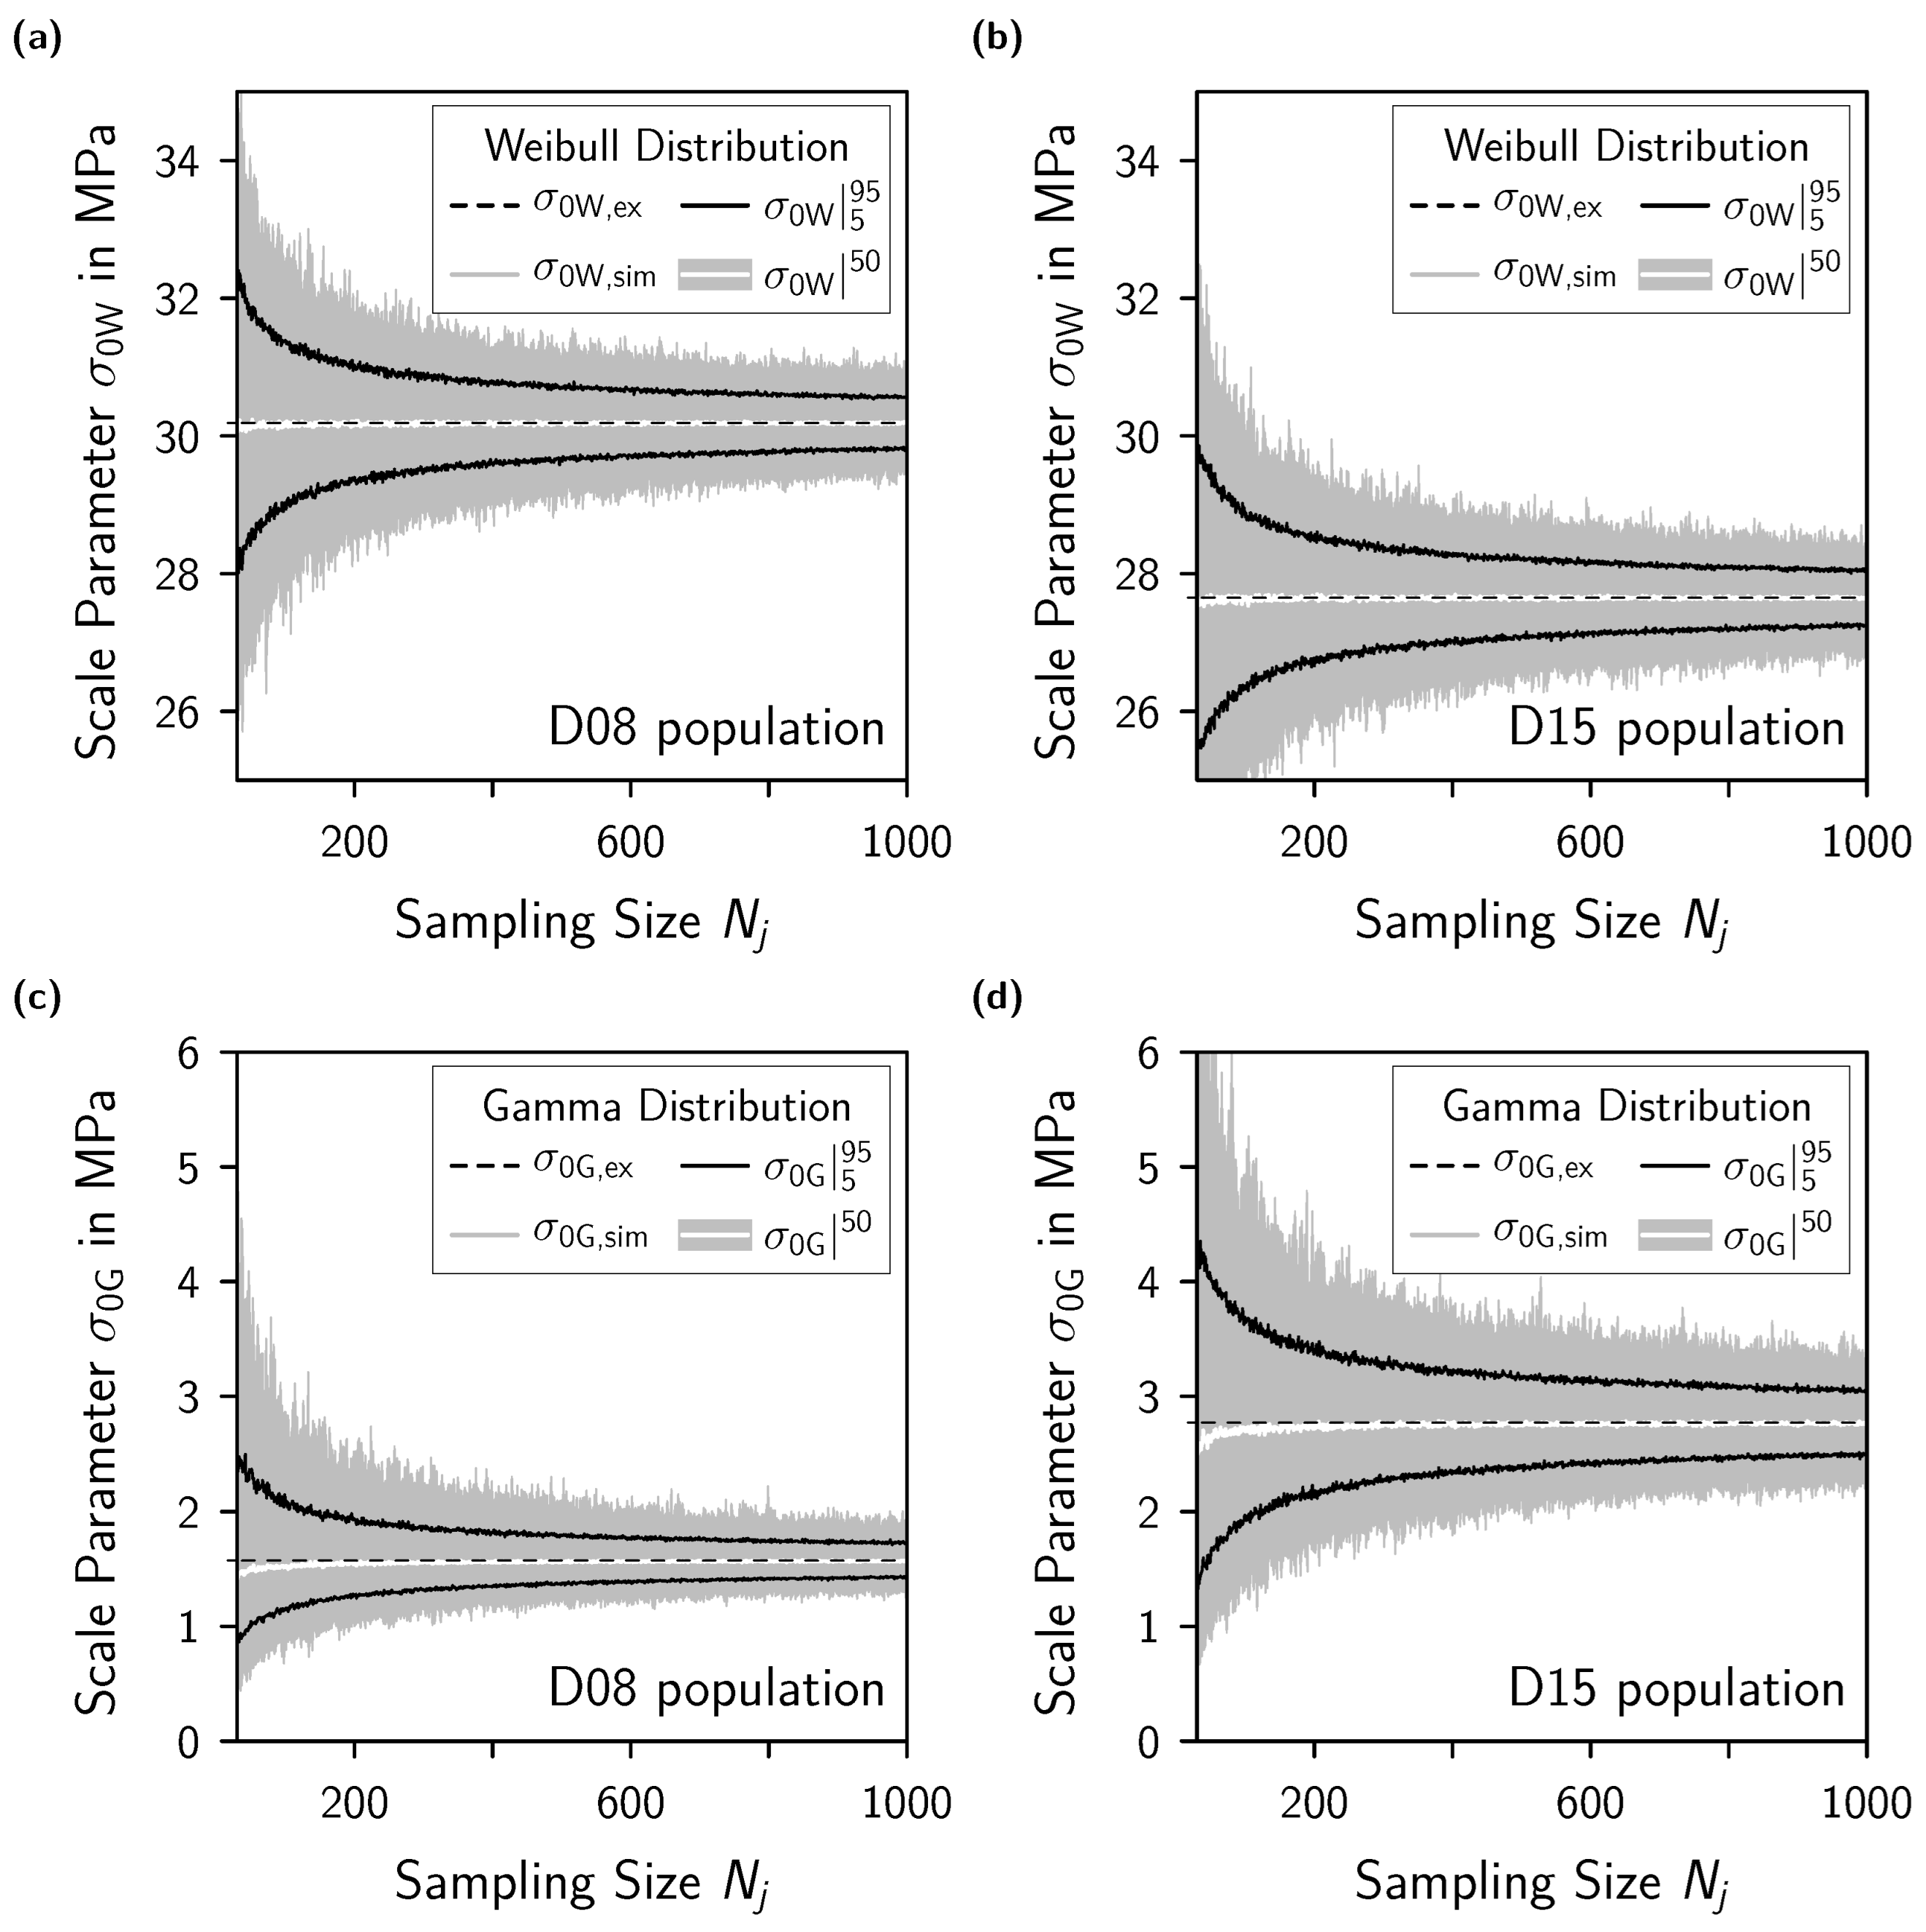
3.2.2. Distribution Parameters

In the following, the shape and scale parameters of the Weibull distribution (m and σ 0 W ) and the Gamma distribution (k and σ 0 G ) were investigated as a function of the sampling size N j for the resampled sub-populations.
Figure 9 presents the shape parameters m and k for assuming the Weibull and Gamma distributions, respectively, for the D08 and D15 sub-populations as a function of the sampling size ( N j ). As N j increases, the IPRs ( m | 5 95 and k | 5 95 ) and the median shape parameters ( m | 50 and k | 50 ) of the resampled populations approach the experimentally determined values ( m ex and k ex ) due to the law of large numbers [13]. However, the IPRs were found to span asymmetrically around m ex , with a larger upper range. As presented, m | 50 > m ex was valid independent of the investigated range of N j . However, the difference m | 50 m ex decreased as N j increased, which is consistent with previous studies [12,14]. This suggests that m ex , which in this regard was considered as the true m of the resampled distribution, would be likely overestimated, particularly for small sampling sizes. Similarly, the median shape parameter for the Gamma distribution k | 50 was found to positively deviate from k ex for small sampling sizes (Figure 9b,c).
Therefore, the standard EN 843 5 recommends a correction of the Weibull modulus m to m cor using Equation (8), while b can be approximated with Equation (9) where s = 1.593 and h = 1.047 (determined based on a Monte-Carlo-Simulation).
m cor = b · m
b = 1 s · N j h
k cor = c · k
c = 1 s · N j h
Similarly, an empirical correction factor was estimated based on the data obtained from the random resampling. The b adj was fitted with m cor = m ex and m = m | 50 ( N j ) using Equation (8) and a non-linear least-squares method. Using the same approach and Equations (10) and (11) with k cor = k ex and k = k | 50 ( N j ) , a correction factor c adj , D 08 and c adj , D 15 was determined for the Gamma distribution based on the data of D08 and D15, respectively. As mentioned above, extreme positive outliers were removed from both populations, which was a single data point in each case. At this point, the influence of a single extreme outlier shall be investigated. Therefore, the correction factors b adj * and c adj * were estimated for an identical random resampling of the distribution of strength data including the extreme outliers. Table 4 summarises the obtained coefficients s and h.
Figure 10 shows the adjusted correction factors as a function of N j for the D08 and D15 populations. It can be seen that the adjusted correction factors b adj , D 08 and b adj , D 15 were in excellent agreement with b std . Thus, using b std as a correction factor for a Weibull analysis of flexural strength data for flame-sprayed components is suitable. However, for the Gamma distribution, a stronger correction factor than b std was required for both populations. A stronger correction b adj * for the determined Weibull Modulus was required for both populations, if extreme outliers were included in the generation of sub-populations. Conversely, the correction factor c adj * differed only negligibly from c adj of the corresponding distribution. This again emphasises the robustness of the Gamma distribution against positive outliers, while the Weibull distribution was susceptible in this regard.
Figure 11 shows that the 5th to 95th interpercentile range of the characteristic strength σ 0 W | 0 95 was symmetrical around σ 0 W , ex independently of N j and became smaller as N j increases. This was in excellent agreement with the simulation based on a theoretical Weibull distribution presented by Danzer et al. [12,14]. Moreover, the obtained median σ 0 W | 50 of the simulated data deviated negatively from σ 0 W , ex for small values of N j . Similarly, σ 0 G | 5 95 spans symmetrically around σ 0 G , ex . The median scale parameter σ 0 G | 50 determined for the Gamma distribution deviated negatively from σ 0 G , ex as well. This means an underestimation of the experimentally determined scale parameter of the underlying distribution. While an overestimation would have more adverse effects and presents a higher degree of risk, an underestimation is a more conservative approach and therefore acceptable. Therefore, no correction factor was required, which is in accordance with the EN 843-5 standard. In the case of the Gamma distribution, the characteristic strength is obtained by multiplication of shape and scale parameter. Thus, the underestimation of the scale parameter compensates for the overestimation of the shape parameter k to a certain extent.
Figure 11 shows that the median characteristic strength σ 0 W | 50 of the Weibull distribution was higher for the D08 population compared to the D15 population. This was in excellent agreement with the size effect theory, which predicts a decreasing characteristic strength with increasing volume under load [11]. Taking into account the multiplication of shape and scale parameter from the Gamma distribution, the characteristic strength of 27.6   M Pa and 25.0   M Pa was determined based on the experimental data from the D08 and D15 population, respectively. Thus, an identical trend of the size effect was observed.

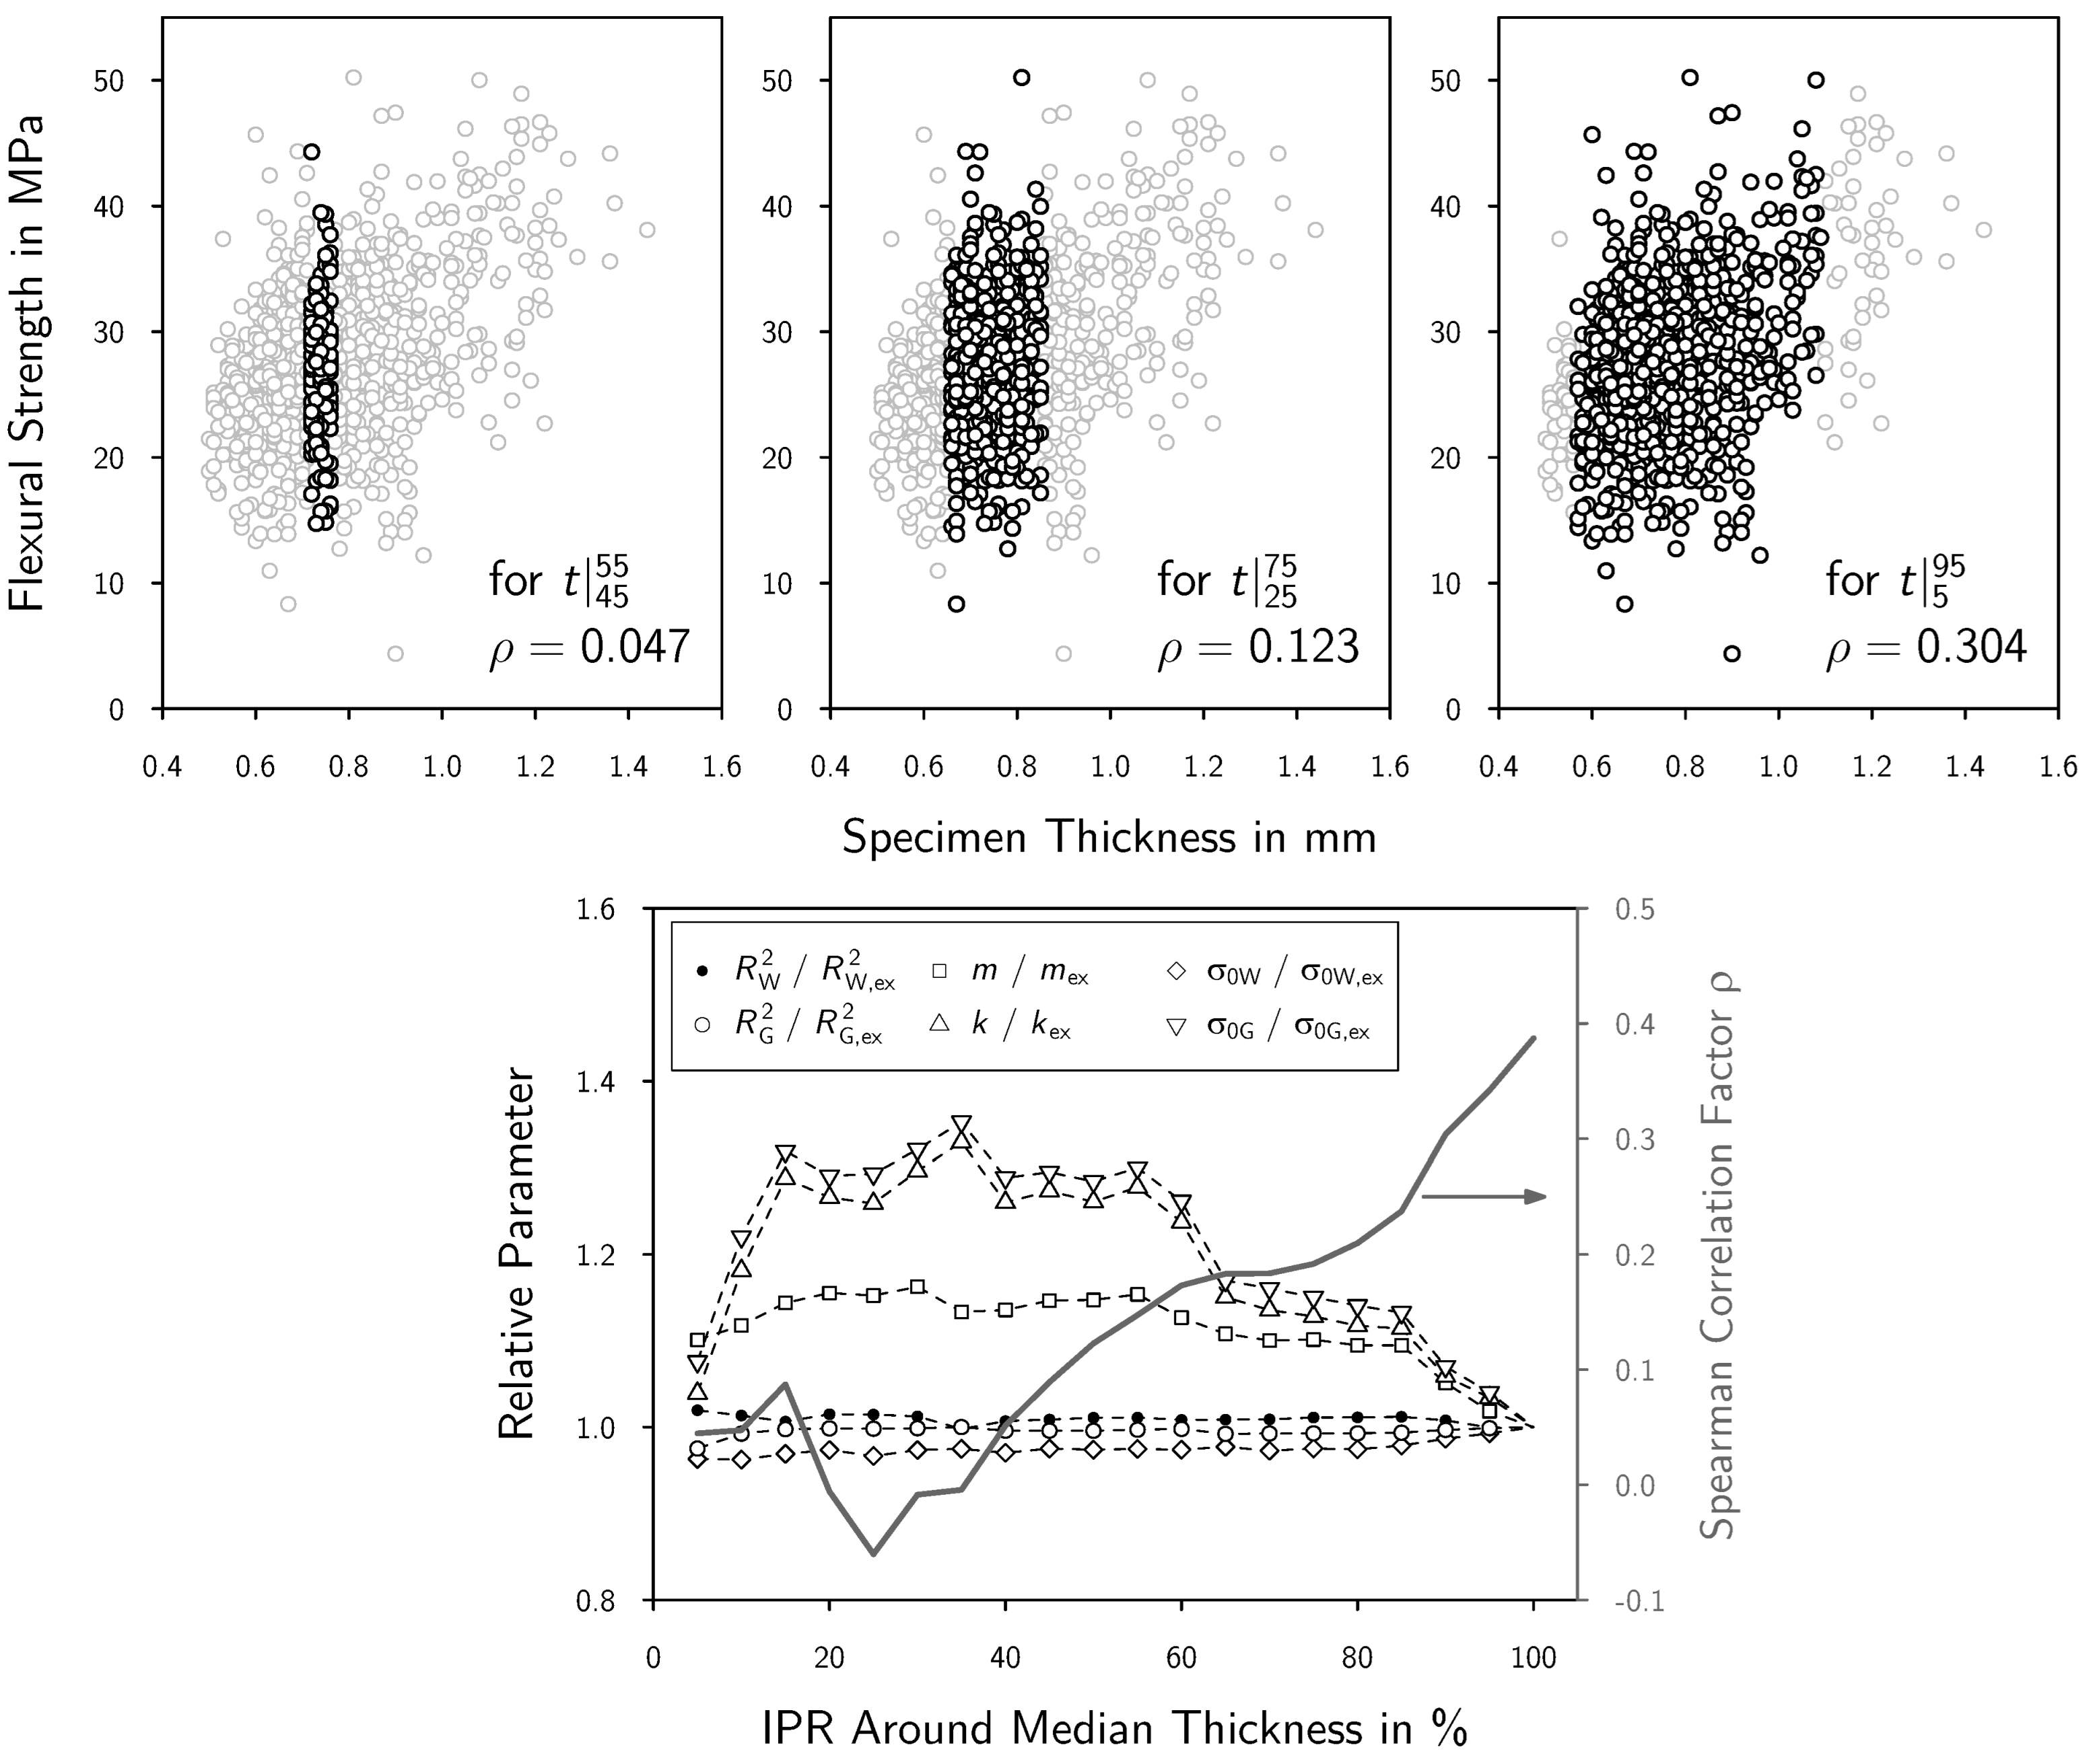
3.3. Conditional Sub-Population Analysis–Conditional Data Cropping

A final note shall be made on the correlation between the specimen thickness and the flexural strength, exemplary for D08. Among the two test series, despite being of an overall mild nature, a positive correlation was present for D08. However, to isolate an origin of this relation remains a difficult question to be answered. A likely reason was already discussed, i.e., the fact of relying on a human operator. Despite this uncertainty, a resampling on the basis of the variation in the specimen thickness as a condition allows for some insight, taking the scattering of specimen thickness as an inherent characteristic of the manual flame-spray process. First, the quantiles of the specimen thicknesses were determined. Then, starting at the median of the specimen thickness t | 50 , interpercentile ranges t | 50 x 50 + x around this median can be defined (abbreviated by IPR; including the borders). Referring to the Figure 9 and Figure 11, this principle of interpercentile ranges was applied before in this study. In consequence, the higher the interpercentile range of the specimen thickness around the median is set, the more variability in the specimen thickness is accounted for. By cropping the experimental D08 data set on the basis of this premise, conditioned sub-populations were built, which were analysed for their statistics as performed before, including the correction of the determined Weibull modulus.
From that conditioned data cropping, two boundaries can be derived: allowing for no variation in the specimen thickness (lower boundary) or allowing for the maximum scatter of the specimen thickness (upper boundary). For the lower boundary, only the specimens with a thickness equal to the median of all thicknesses were taken into account and for the upper boundary, all specimens were taken into consideration (minus the extreme positive outlier, excluded before). Consequentially, the conditioned data cropping results in sub-populations of different sampling sizes N and thus, for comparability, it is necessary to account for that in regard of the Weibull modulus. At this point, the measurement precision of the specimen thickness became relevant. In the present study, the thickness was measured on two decimal digits. Due to the mere number of experimentally tested specimens and this measuring precision, the original experimental data sets contain multiple specimens of similar thickness. As a consequence, it was possible to form a data subset at the lower boundary (only specimens of median thickness), which comprises a statistically reasonable number of 30 individual specimens. Note that the following statements exclusively apply to the D08 series. Their transfer to other test series, materials, or testing methods has to be considered separately.
Starting at the lower boundary, no correlation between the specimen thickness and the flexural strength can be postulated, i.e., an ideal Spearman correlation factor of ρ = 0 . The respective statistical parameters of the Weibull and Gamma fitting are listed in Table 5, relative to the corresponding experimental parameters from Table 2. For the upper boundary, i.e., the full data set, the Spearman correlation factor amounts to ρ = 0.39 (as presented before). Regarding the Weibull fitting (actually the less suited distribution for D08) it occurred that after reducing the specimen thickness variation to zero, the Weibull fitting was improved ( R W 2 / R W , ex 2 > 1 ). Simultaneously, the Weibull modulus was increased ( m / m ex > 1 ), while the characteristic strength was lower ( σ 0 W / σ 0 W , ex < 1 ). In comparison, the difference in the characteristic strength by 1% (only median thickness vs. the full data set) is lower than the difference in the Weibull modulus by about 30%. As further presented in Figure 12, a difference in either the Weibull modulus (positive difference up to 18%) or the characteristic strength (negative difference of about 2%) was observed nearly for the complete range of IPR. For the Gamma distribution fitting, it was observed that the fitting improved at a higher variation in the specimen thickness ( R G 2 / R G , ex 2 < 1 ). Moreover, both distribution parameters k and σ 0 G lay above the experimental data for 0 < IPR < 100 (cf. Figure 12). The strictest conclusion that can be drawn from this is that the experimental scatter in the flexural strength of the D08 series was to some extent affected by the variation in specimen thickness, i.e., it was increased. Here, a trade off has to be found: stating a more pronounced scattering in the flexural strength would again be the more cautious/conservative point of view and prevent an overestimation of the material. In the present case of flame-sprayed alumina, it was thus indeed permitted to neglect the mild correlation between the flexural strength and the specimen thickness.

4. Conclusions

According to textbook standards, the variability of failure, i.e., the scattering of the mechanical strength, poses a fundamental and design-relevant material-specific feature to be introduced into the lifetime prediction of ceramic components, next to the fracture resistance and the sub-critical cracking behaviour. In this work, the flexural strength of two populations of flame-sprayed self-supporting ceramic components based on alumina including 1000 disc-shaped specimens each, were tested using the ball on three ball test. The suitability of the two-parametric distribution functions, i.e., the Normal, Log-Normal, Weibull, and Gamma distribution to describe the data were investigated using Q-Q analysis. Based on random resampling of the flexural strength data, the suitability of different distribution functions in dependency of the sampling size in the range from 30 to 1000 was investigated. Moreover, the distribution parameters, i.e., the shape and the scale parameters were determined and their dependence on the sampling size was evaluated.
The Q-Q analysis revealed the Weibull and Gamma distribution to be most suitable to represent flexural strength data of flame-sprayed self-supporting components. Moreover, it was shown that because of their skew, the Gamma distribution is more robust against positive outliers in a data set, while the Weibull distribution is more robust against negative outliers. The random resampling of the strength data showed that the fitting accuracy of the distribution was robust independently of the sampling size. Even for the smallest sample size investigated (30), the median fit quality was in a range of ± 5 % of the fit quality from the underlying experimental data set. An analysis of the distribution parameters revealed that for both the Weibull and the Gamma distribution, the shape parameter of the underlying distribution would be overestimated for small sampling sizes. Nevertheless, the study also showed that the suggested correction factor for the Weibull modulus was in excellent agreement with the simulated data (as long as extreme outliers were excluded from the analysis). Based on these results, a correction factor for the shape parameter of the Gamma distribution was suggested. Conversely, the characteristic strength (scale parameter) was slightly underestimated by both distribution functions for small sampling sizes and requires no correction.

Author Contributions

Conceptualization, F.K., M.N., T.W. and C.G.A.; methodology, F.K. and M.N.; software, M.N. and F.K.; validation, M.H., T.W. and C.G.A.; formal analysis, F.K., M.N. and M.H.; investigation, M.H., F.K. and M.N.; resources, T.S. and C.G.A.; data curation, F.K. and M.N.; writing—original draft preparation, F.K.; writing—review and editing, F.K., M.N. and T.W.; visualization, F.K. and M.N.; supervision, T.S., H.J. and C.G.A.; project administration, H.J. and C.G.A.; funding acquisition, T.S., H.J. and C.G.A. All authors have read and agreed to the published version of the manuscript.

Funding

This research was funded by the German Research Foundation (DFG) as part of the transfer project AN 322 39-1.

Institutional Review Board Statement

Not applicable.

Informed Consent Statement

Not applicable.

Data Availability Statement

Data available upon request.

Acknowledgments

The authors would like to thank N. Brachhold for reviewing the manuscript.

Conflicts of Interest

The authors declare no conflict of interest. The funders had no role in the design of the study; in the collection, analyses, or interpretation of data; in the writing of the manuscript; or in the decision to publish the results.

References

  1. Fauchais, P.L.; Heberlein, J.V.; Boulos, M.I. Thermal Spray Fundamentals: From Powder to Part; Springer Science & Business Media: New York, NY, USA, 2014. [Google Scholar]
  2. Vardelle, A.; Moreau, C.; Akedo, J.; Ashrafizadeh, H.; Berndt, C.C.; Berghaus, J.O.; Boulos, M.; Brogan, J.; Bourtsalas, A.C.; Dolatabadi, A.; et al. The 2016 thermal spray roadmap. J. Therm. Spray Technol. 2016, 25, 1376–1440. [Google Scholar] [CrossRef]
  3. Aneziris, C.G.; Gehre, P.; Kratschmer, T.; Berek, H. Thermal shock behavior of flame-sprayed free-standing coatings based on Al2O3 with TiO2-and ZrO2-additions. Int. J. Appl. Ceram. Technol. 2011, 8, 953–964. [Google Scholar] [CrossRef]
  4. Neumann, M.; Gehre, P.; Hubálková, J.; Zielke, H.; Abendroth, M.; Aneziris, C.G. Statistical Analysis of the Flexural Strength of Free-Standing Flame-Sprayed Alumina Coatings Prior and After Thermal Shock. J. Therm. Spray Technol. 2020, 29, 2026–2032. [Google Scholar] [CrossRef]
  5. Stein, V.; Schemmel, T. Sustainable rice husk ash-based high-temperature insulating materials. Interceram-Int. Ceram. Rev. 2020, 69, 30–37. [Google Scholar] [CrossRef]
  6. Wetzig, T.; Neumann, M.; Schwarz, M.; Schöttler, L.; Abendroth, M.; Aneziris, C.G. Rapid Prototyping of Carbon-Bonded Alumina Filters with Flame-Sprayed Alumina Coating for Bottom-Teeming Steel Ingot Casting. Adv. Eng. Mater. 2022, 24, 2100777. [Google Scholar] [CrossRef]
  7. Zhang, L.; Thomas, B.G. State of the art in the control of inclusions during steel ingot casting. Metall. Mater. Trans. B 2006, 37, 733–761. [Google Scholar] [CrossRef]
  8. Schönwelski, W.; Ruwier, K.; Föllbach, S.; Sperber, J. High-quality refractories for high quality steel. In Proceedings of the ICRF 2014, 2nd International Conference on Ingot Casting, Rolling and Forging, Milan, Italy, 7–9 May 2014. [Google Scholar]
  9. Chagnon, P.; Fauchais, P. Thermal spraying of ceramics. Ceram. Int. 1984, 10, 119–131. [Google Scholar] [CrossRef]
  10. Ostojic, P.; Berndt, C. The variability in strength of thermally sprayed coatings. Surf. Coat. Technol. 1988, 34, 43–50. [Google Scholar] [CrossRef]
  11. Munz, D.; Fett, T. Ceramics, Mechanical Properties, Failure Behaviour, Materials Selection; Springer: Berlin, Germany, 2001; Volume 36, pp. 25–26. [Google Scholar]
  12. Danzer, R.; Lube, T.; Supancic, P.; Damani, R. Fracture of ceramics. Adv. Eng. Mater. 2008, 10, 275–298. [Google Scholar] [CrossRef]
  13. Schervish, M.J.; DeGroot, M.H. Probability and Statistics; Pearson Education: London, UK, 2012. [Google Scholar]
  14. Danzer, R.; Lube, T.; Supancic, P. Monte Carlo simulations of strength distributions of brittle materials—Type of distribution, specimen and sample size. Int. J. Mater. Res. 2001, 92, 773–783. [Google Scholar] [CrossRef]
  15. Weibull, W. A statistical distribution function of wide applicability. J. Appl. Mech. 1951. [Google Scholar] [CrossRef]
  16. Michálek, M.; Michálková, M.; Blugan, G.; Kuebler, J. Strength of pure alumina ceramics above 1 GPa. Ceram. Int. 2018, 44, 3255–3260. [Google Scholar] [CrossRef]
  17. Danzer, R. A general strength distribution function for brittle materials. J. Eur. Ceram. Soc. 1992, 10, 461–472. [Google Scholar] [CrossRef]
  18. Danzer, R. Some notes on the correlation between fracture and defect statistics: Are Weibull statistics valid for very small specimens? J. Eur. Ceram. Soc. 2006, 26, 3043–3049. [Google Scholar] [CrossRef]
  19. Keleş, Ö.; García, R.E.; Bowman, K.J. Deviations from Weibull statistics in brittle porous materials. Acta Mater. 2013, 61, 7207–7215. [Google Scholar] [CrossRef]
  20. Gorjan, L.; Ambrožič, M. Bend strength of alumina ceramics: A comparison of Weibull statistics with other statistics based on very large experimental data set. J. Eur. Ceram. Soc. 2012, 32, 1221–1227. [Google Scholar] [CrossRef]
  21. Fedorov, A.; Gulyaeva, Y. Strength statistics for porous alumina. Powder Technol. 2019, 343, 783–791. [Google Scholar] [CrossRef]
  22. Danzer, R.; Harrer, W.; Supancic, P.; Lube, T.; Wang, Z.; Börger, A. The ball on three balls test—Strength and failure analysis of different materials. J. Eur. Ceram. Soc. 2007, 27, 1481–1485. [Google Scholar] [CrossRef]
  23. Börger, A.; Supancic, P.; Danzer, R. The ball on three balls test for strength testing of brittle discs: Stress distribution in the disc. J. Eur. Ceram. Soc. 2002, 22, 1425–1436. [Google Scholar] [CrossRef]
  24. R Core Team. R: A Language and Environment for Statistical Computing; R Foundation for Statistical Computing: Vienna, Austria, 2022. [Google Scholar]
  25. Cleveland, W.S. Robust locally weighted regression and smoothing scatterplots. J. Am. Stat. Assoc. 1979, 74, 829–836. [Google Scholar] [CrossRef]
  26. Schober, P.; Boer, C.; Schwarte, L.A. Correlation coefficients: Appropriate use and interpretation. Anesth. Analg. 2018, 126, 1763–1768. [Google Scholar] [CrossRef] [PubMed]
  27. Gadelmoula, A.; Al-Athel, K.; Akhtar, S.; Arif, A. A Stochastically Generated Geometrical Finite Element Model for Predicting the Residual Stresses of Thermally Sprayed Coatings Under Different Process Parameters. J. Therm. Spray Technol. 2020, 29, 1256–1267. [Google Scholar] [CrossRef]
Figure 1. Prototype of refractory hollowware based on biogenic silica with flame-sprayed alumina coating.
Ceramics 06 00062 g001
Figure 2. Microstructure of a composite material based on rice husk ash (lower part) and a flame-sprayed alumina coating (upper part) obtained by scanning electron microscopy; interface (dotted red line).
Ceramics 06 00062 g002
Figure 3. Exemplary Load-Displacement graphs for a tested specimen and specimen photographs before and after testing from the D08 population (a) and the D15 population (b).
Ceramics 06 00062 g003
Figure 4. Complete experimental data: flexural strength over the specimen thickness and basic boxplots of the strength data ( w ( z ) = { σ c ( Q 1 z IQR , Q 3 + z IQR ) } , IQR = inter quartile range, Q 1 = 25% quantile, Q 3 = 75% quantile). Asterisks * indicate extreme positive outliers in the scatter plot, derived from the boxplot representation, i.e., outliers above w ( z = 3 ) .
Ceramics 06 00062 g004
Figure 5. Q-Q plots assuming Weibull, Normal, Log-normal, and Gamma distribution for D08 population (ad) and D15 population (eh).
Ceramics 06 00062 g005
Figure 6. Histogram and fitted Weibull and Gamma distribution for experimental data of the D08 population (a) and the D15 population (b).
Ceramics 06 00062 g006
Figure 7. Fit quality R 2 dependent on sampling size N j for assuming either the Weibull (W) or the Gamma (G) distribution for the sub-populations from D08 (a) and D15 (b); curves smoothed using LWR.
Ceramics 06 00062 g007
Figure 8. Number of positive outliers ϕ p and negative outliers ϕ n for the D08 sub-populations (a) and the D15 sub-populations (b) dependent on the sampling size N j for 1000 resamplings with the median number of positive and negative outliers ( ϕ p | 50 and ϕ n | 50 , respectively) and the interpercentile range between the 5th and the 95th percentile of positive and negative outliers ( ϕ p | 5 95 and ϕ n | 5 95 , respectively); curves smoothed using LWR.
Ceramics 06 00062 g008
Figure 9. Shape parameter of the Weibull distribution (a,b) and the Gamma distribution (c,d) in dependence on the sampling size N j for D08 and D15 sub-populations.
Ceramics 06 00062 g009
Figure 10. Empirical determined correction factors for the shape parameter of the Weibull distribution (a) and the Gamma distribution (b).
Ceramics 06 00062 g010
Figure 11. Scale parameter of the Weibull distribution (a,b) and the Gamma distribution (c,d) in dependency on the sampling size N j for D08 and D15 sub-populations.
Ceramics 06 00062 g011
Figure 12. Exemplary sub-populations of D08 for different interpercentile ranges around the median specimen thickness (IPR, for t | 55 45 , t | 75 25 , and t | 5 95 ), generated by thickness-conditioned data cropping and the resulting relative Weibull and Gamma fit parameters and the Spearman correlation factor as function of the IPR ( R 2 —coefficient of determination of the QQ analysis, m—Weibull modulus, σ 0 W —characteristic strength, k—Gamma distribution shape parameter, σ 0 G —Gamma distribution scale parameter; extension ‘ex’ indicates experimental supported data of the D08 test series).
Ceramics 06 00062 g012
Table 1. Parameters of the flame-spraying process ( m 3 represents a standard cubic metre).
ParameterDimensionValue
flow rate of O2 m 3 · h 1 3.2
flow rate of C2H2 m 3 · h 1 1.3
flow rate of pressurised air m 3 · h 1 38
feed rate m · min 1 0.28–0.30
Table 2. Parameters of fitted distributions for experimental data of D08 and D15 populations (shape parameter of Normal distribution in MPa).
DistributionCoeff. of Det.Shape Par.Scale Par. in MPa
D08D15D08D15D08D15
Normal0.98920.99596.4817.46027.64025.003
Log-Normal0.98470.80570.2460.36626.85723.631
Weibull0.96910.99574.4783.75330.18927.650
Gamma0.99540.941017.5569.0251.5742.770
Table 3. Minimum sampling size N j , min for which R 2 | 50 R ex 2 · ( 1 ± i ) with i = { 0.05 ; 0.025 ; 0.01 } .
i0.050.0250.01
R W 2 | 50 -D08303074
R W 2 | 50 -D15303493
R G 2 | 50 -D08303598
R G 2 | 50 -D15303030
Table 4. Empirical determined parameters s and h for different correction factors.
Correction Factorsh
Weibull Distribution:
b std 1.59311.0470
b adj , D 08 1.43611.0328
b adj , D 15 0.99050.9694
b adj , D 08 * 0.90700.7458
b adj , D 15 * 0.68210.9694
Gamma Distribution:
c adj , D 08 1.67650.8711
c adj , D 15 2.76541.0399
c adj , D 08 * 1.22960.8085
c adj , D 15 * 1.88630.9664
Table 5. Relative Weibull and Gamma fit parameters for specimens of only the median thickness t | 50 resulting in N = 30 considered specimens ( R 2 —coefficient of determination of the QQ analysis, m—Weibull modulus, σ 0 W —characteristic strength, k—Gamma distribution shape parameter, σ 0 G —Gamma distribution scale parameter; extension ‘ex’ indicates experimental supported data of the D08 test series).
R W 2 / R W , ex 2 1.012 R W 2 / R G , ex 2 0.955
m / m ex 1.329 k / k ex 1.539
σ 0 W / σ 0 W , ex 0.990 σ 0 G / σ 0 G , ex 1.531
Disclaimer/Publisher’s Note: The statements, opinions and data contained in all publications are solely those of the individual author(s) and contributor(s) and not of MDPI and/or the editor(s). MDPI and/or the editor(s) disclaim responsibility for any injury to people or property resulting from any ideas, methods, instructions or products referred to in the content.

