Article

Microstructure, Process Optimization, and Strength Response Modelling of Green-Aluminium-6061 Composite as Automobile Material

by
Abayomi Adewale Akinwande
1,*,
Olanrewaju Seun Adesina
2,
Adeolu Adesoji Adediran
3,4,*,
Oluwatosin Abiodun Balogun
1,
David Mukuro
2,
Oluwayomi Peter Balogun
5,
Kong Fah Tee
6,* and
M. Saravana Kumar
7
1
Department of Metallurgical and Materials Engineering, Federal University of Technology, Akure 340110, Nigeria
2
Department of Mechanical Engineering, Redeemers University, Ede 232101, Nigeria
3
Department of Mechanical Engineering, Landmark University, Omu-Aran 251103, Nigeria
4
Department of Mechanical Engineering Science, University of Johannesburg, Johannesburg 2092, South Africa
5
Prototype Engineering Development Institute, P.M.B 5025, Ilesa 233262, Nigeria
6
Faculty of Engineering and Quantity Surveying, INTI International University, Nilai 71800, Malaysia
7
Graduate Institute of Manufacturing Technology, National Taipei University of Technology, Taipei 10608, Taiwan
*
Authors to whom correspondence should be addressed.
Ceramics 2023, 6(1), 386-415; https://doi.org/10.3390/ceramics6010023
Submission received: 8 September 2022 / Revised: 10 January 2023 / Accepted: 29 January 2023 / Published: 1 February 2023
(This article belongs to the Special Issue Ceramics for Decarbonization of the Global Industry)

Abstract

:
The use of ashes derived from various waste sources as supplements to synthesized ceramic reinforcement in metal matrices has been established. However, studies involving a combination of particulates from three different sources are rare. In a bid to further knowledge in this aspect of research and develop a green aluminium composite for automobile applications, the present investigation studied the implication of adding palm kernel shell ash (PKA), rice husk ash (RHA), and waste steel particles (STP) to the morphology and strength behaviour of Al-6061-T6 alloy. The experimental design was undertaken via the Box–Behnken design (BBD) of the response surface method. A 4% STP at a constant dose was mixed with PKA and RHA at varying proportions and stirring temperatures according to the BBD. The experimental outcome revealed that the responses were greatly influenced by microstructural evolution. From the surface plots, 2–4% RHA and PKA enhanced tensile and flexural strengths, while 4–6% led to a decline in strength. Meanwhile, 2–6% of the particles are favourable to the enhancement of tensile and compressive strengths and moduli. Temperatures between 700 and 800 °C favored response improvement, whereas temperatures between 800 and 900 °C were detrimental to responses. Developed regression models for the responses were validated to be good representations of the experimental outcomes. The optimum mix was obtained at 4.81% PKA, 5.41% RHA, and a stirring temperature of 803 °C. The validation experiment conducted portrayed reliable responses with <5% deviation from the predicted values, thereby certifying the models to be statistically fit for future predictions.

1. Introduction

Aluminium and its alloys have found very good use in the design of engineering components for some decades now. Nowadays, aluminium alloys are sought-after materials for automobile design and production based on their high strength-to-density ratio. Aluminium alloys are in various grades owing to varying properties; hence, their use for a specific application is hinged on their properties. Examples of grades employed in automobile design include aluminium 6061, 7075, 7068, and AlSi10Mg. In some cases, the properties are improved by various post-manufacture processes such as heat treatment, hot or cold rolling, plastic deformation, forging, and many others. On account of this, varying microstructural evolution has been achieved in the matrix, with a consequent effect on the mechanical properties. Additionally, additives and particulate fillers are introduced, amounting to microstructural restructuring with a consequential effect on property parameters [1,2,3,4]. The majority of these particulate fillers are synthetic or environmental waste sources. Examples of synthetic fillers are SiC, SiO2, TiO2, Al2O3, TiN, B4C, and many more. These ceramic particles have been employed extensively in many studies and have brought about tremendous outcomes [5,6]. Environmental wastes may include agro-waste and industrial wastes [7,8,9,10].
Agro-waste particulate fillers are often synthesized from agro-based materials. Ashes from rice husk, palm kernel shell, coconut shell, bamboo leaf ash, eggshell, and other materials are among them. In a way, synthesizing these particles from the original waste source has been applauded as a strategy for recycling, thereby preventing them from degrading the environment [11,12,13]. The derived fillers are low-cost, sustainable, and environmentally friendly. Hence, their employment as additives in aluminium alloy results in a lightweight and cost-effective composite with improved mechanical properties. As such, green aluminium composites are produced for engineering applications. This trend of study has drawn the attention of several scholars globally, and interesting findings have been reported.
Previous studies involved in the development of green aluminium products include the investigation carried out by Gladston et al. [14]. Their study realized improvement in ultimate tensile strength and microhardness by the addition of RHA in AA 6061 matrix. The powder content was included at 2, 4, 6, and 8%. The highest improvement of the properties was realized at 8%. Saravanan et al. [15] revealed the influence of RHA in the range of 3 to 12% on the hardness value of AlSi10Mg alloy. The result showed that hardness exhibited a linear interaction with RHA dose. The highest hardness value was realized at 12 wt.% RHA. In their study, Mishra et al. [16] introduced rice husk ash at varying dosages into aluminium-LM6 matrix. The consequence of the addition revealed a significant improvement in hardness. Udoye et al. [17] have improved the ultimate tensile strength and hardness of aluminium-6061 by the inclusion of RHA from 2 to 8 wt.% (in steps of 2 wt.%). The findings revealed that RHA could achieve a 16.5% enhancement in the ultimate tensile strength of aluminium-6061 and a 33.3% increase in hardness.
On the other hand, Edoziuno et al. [18] introduced PKA at 2.5, 5.0, 7.5, 10.0, 12.5, and 15 wt.% in AA 6063 matrix. The findings depicted that 2.5–7.5 wt.% was favourable for strength improvement with respect to ultimate tensile strength and yield strength. Beyond 7.5 wt.%, there was strength depreciation. The elastic modulus was boosted to 12.5%, while 15% led to a reduction in the modulus. Hardness and impact strength peaked at 2.5 and 10%, respectively. The conclusion indicated that PKA played an important role in improving the strength parameters of the alloy. Coconut shell ash has been investigated by its introduction into aluminium-1200 matrix. The study was successful as 4% of the ash yielded a 19.9% improvement in hardness [19].
The development of hybrid composites using these additives as a supplement to synthesized ceramic particulates or by a combination of two agro-based additives in aluminium alloy has also been studied. Kolappan et al. [20] investigated the effect of SiC and coconut shell ash on the properties of AA 7068. In addition, Kulkarni and Siddeswarappa [21] combined rice husk ash and areca sativa ash to fabricate an Al composite. The findings displayed the possibility of enhancing hardness, tensile strength, and compressive strength by increasing the dosage of the ashes.
Kulkami et al. [22] reviewed the use of agro-waste materials in Al alloy and concluded on the potential of employing agro wastes as reinforcement in metal matrix composites, citing their benefits. Hybrid composites of the duo of agro-waste were recommended as an alternative to synthetic ceramic reinforcement based on the cheaper cost.
Examples of industrial waste are fly ash, glass powder, and red mud (obtained during the industrial production of aluminium). Research studies have also studied this aspect. Tiwari et al. [23] infused fly ash into an aluminium composite at 1, 2, and 4 wt.%. From the findings, 1 and 2 wt.% increased hardness by 15.4 and 30.8%, respectively, while 4 wt.% decreased hardness. The study further revealed the role of fly ash in minimizing the wear rate of the composite. Kumar et al. [24] investigated the role of fly ash in aluminium AA 6061. The outcome of the research illustrated the improvement in hardness from 1 to 7% weight fraction of the fly ash. Impact strength improved between 1 and 3 wt.% before a further decline. Other studies involving fly ash are in Refs. [25,26]. Waste glass powder is another industrial-based reinforcement that has been utilized in aluminium matrix. Adediran et al. [27] investigated waste glass powder as filler at 0, 2, 4, 6, 8, and 10 wt.% in AA-6061 alloy. The presence of the powder in the matrix resulted in an improvement of yield and ultimate tensile strengths, yield, and ultimate compressive strengths, and hardness when compared with the control. Optimum performance was obtained at 6 wt.% for yield and ultimate tensile strengths, 8 wt.% for yield and ultimate compressive strengths, and 10 wt.% for hardness. Sinshaw et al. [28] infused waste glass particles into aluminium alloy at 0 to 12 wt.% (in steps of 2 wt.%). The outcome revealed that waste glass played an important role in enhancing the mechanical performance of the aluminium alloy. An infusion of 8% yielded the highest tensile properties, while 12% yielded the highest hardness. Other literature involving the use of waste glass in an aluminium alloy matrix has shown results in tandem with these investigations [29,30,31]. Investigations carried out on red mud are revealed in the literatures [32,33,34]. In each of the studies, red mud was reported to boost the performance of the matrix.
An industrial waste that has gained little attention as a matrix filler in an aluminium alloy matrix is steel shavings. Operations involving machining, milling, and filling of steel are in most cases accompanied by metal chips or shavings. Steel wastes are non-biodegradable, so disposal in landfills has exacerbated environmental degradation. A better way of reducing them is by milling them into powder and employing them as fillers in the aluminium composite as implemented by Adeosun et al. [35]. According to Liu et al. [36], synthetic ceramics, industrial, and agro-wastes are inherently brittle. Therefore, at a certain weight proportion of the particles in aluminium alloy, the brittle nature dominates, which is partly held responsible for depreciation in strength at a certain weight fraction of the additives [27,30]. Moreso, the inherent brittle nature of the fillers has been claimed to have a negative effect during cold or hot-rolling of aluminium alloy composites [37,38]. Steel is regarded to be ductile and tough as compared with waste-based particle fillers such as rice husk ash and palm kernel shell ash or synthetic ceramics [39]. Hence, their inclusion as supplements with agro-based additives in the aluminium matrix has a way of impacting the ductile performance of the composite.
On account of this, the present investigation was conceived to incorporate locally sourced agro-waste (rice husk and palm kernel shell) and industrial waste (steel powder) as fillers in the design and development of the hybrid Al6061 via the stir casting process. The choice of rice husk, palm kernel, and steel powder is based on their abundance and availability within the purview of this research. The response surface method was employed for the design of the experiment to minimize experimental runs and for the optimization of process parameters. Experimental variables are palm kernel shell ash (PKA), rice husk ash (RHA), and stirring temperature (ST), while steel powder was introduced at a constant proportion of 4 wt.%. The choice of such wt.% of Fe was based on observations showcased by Yamasaki et al. [40] in which 3 to 5 wt.% Fe introduced into the aluminium matrix ensured improvement in the tensile performance of the developed composite.

2. Experimental Procedure

2.1. Design of Experiment

Response Surface Method (RSM)

A response surface method (RSM) is an approach involved in the design of an experiment to appraise the interactions between independent variables and their effects on the responses. The method engages statistical and mathematical approaches in the modelling of the responses with respect to the obtained experimental outcomes. Box–Behnken approach of the RSM was engaged in this analysis. As shown in Table 1, the variable components have three levels: low, medium, and high (−1, 0, and +1). Fifteen experimental runs were obtained with three replicates entailing 3 centre points and 12 middle points. The factors for the designs are palm kernel shell ash (A), rice husk ash (B), and stirring temperature (C). Via the RSM, a relationship existing between the independent variables and responses was analyzed, and a regression model of the second order was arrived at as expressed in Equation (1).
Y = a 0 + a 1 X 1 + a 2 X 2   + a 3 X 3 + a 12 X 1 X 2 + a 13 X 1 X 3 + a 23 X 2 X 3   + a 11 X 1   2 + a 22 X 2   2 + a 33 X 3 2
where X1, X2, and X3 are the independent experimental variables in place of PKA dosage, RHA proportion, and stirring temperature. Equally, a 0 ,   a 1 , a 2 , a 3 ,   a 12 ,   a 13 , a 23 , a 11 , a 22     and a 33 are coefficient of terms. The model expresses the responses as a function of the independent variables. In this study, the responses are tensile, compressive, and flexural strengths; and tensile and compressive moduli.
RSM employs a surface plot in the explanation of the pattern of the interactions between the terms, while a contour plot depicts predictive responses for varying combinations of the independent variables. The surface plot is such that two variables are plotted on the X and Y axes while the response is plotted on the Z axis. A contour/process map, on the other hand, is a 2D view connecting different design points via contour lines [41]. The two plots were utilized in this study to further explain the interactive patterns between the previously mentioned experimental variables. Table 2 presents the mix design for the experiment.

2.2. Material

The materials employed in the present investigation are ingot aluminium Al6061 (procured from Shanghai Worldyang Chemical Co. Ltd., Shanghai, China). The inherent properties of the ingot are showcased in Table 3, while the EDS result is presented in Figure 1 The waste steel particles used were from chips gotten from the machining of steel components. Waste rice husk ash and palm kernel shells were collected and pre-washed separately to remove attached impurities, after which they were open-dried for 24 h. The shell was crushed manually into smaller pieces and ground via a grinding machine into powder. To increase the surface area, the powder was further pulverized and collected. This process was continued by introducing the powder into the muffle furnace and heating it to a temperature of 700 °C for 6 h to obtain the ash. The palm kernel ash (PKA) was allowed to cool to room temperature, after which it was collected and further ball milled for 4 h. The ash was then sieved to −23 µm passing and collected for specimen preparation. After washing and 24 h of open drying of the rice husk, the rice husk was made to pass through the same process as that of PKA and eventually arrived at rice husk ash (RHA) sieved to −23 µm. Steel chips were collected from a machining shop and were initially sieved (−300 µm) via a sieve shaker and then milled for 12 h. The milled steel particles were sieved to −23 µm and collected for specimen preparation.

2.3. Composite Development

Specimens were produced based on the mix design indicated in Table 2. The process entailed initial preheating of the graphite crucible used to a temperature of 500 °C, followed by the charging of the Al6061 ingot into the crucible. The temperature was then increased to the respective temperatures stipulated in Table 2. The steel particles as well as PKA and RHA particles were initially preheated to 500 °C before their introduction into the melt. Via a mechanical mixer, a 4 wt.% constant dosage of steel particles was blended with PKA and RHA particles following the design mix in Table 2. The mixtures were then preheated to 500 °C before being introduced into the melt at 2.5 g/min. Subsequently, the melt was stirred at 300 rpm for 10 min, after which the obtained liquid composite was transferred into moulds at a poring rate of 2.4 cm3/s and allowed to cool to room temperature.

2.4. Mechanical and Morphological Characterization

In achieving reliable results, three specimens were tested for each mix proportion and the average result was recorded.

2.4.1. Tensile Properties

Tensile specimens (specimen length 120 mm) of a gauge length of 60 mm and a diameter of 10 mm were subjected to tensile load employing a universal testing machine (model H 001C) in accordance with the ASTM E8/E8M [42] protocol. A load of 10 kN was applied at 10−3/s and a cross speed of 3 mm/min.

2.4.2. Compressive Properties

In line with ASTM E 9-09 [43], cube specimens of 10 mm in length were subjected to compressive load (20 kN) at a 10−2/s rate until fracture using the universal testing machine. Compressive strength was obtained as the ratio of fracture load to cross-sectional area.

2.4.3. Flexural Properties

Specimens of dimensions of 65 mm in length, 10 mm in width, and 5 mm in height were subjected to a three-point bending test as per Das et al. [44] with the aid of the universal testing machine. Span lengths were maintained at 50 mm for all specimens.

2.4.4. Morphological, Elemental, and Phase Characterization

Specimens were initially sectioned, after which the surfaces were subjected to grinding and polishing until the specimen surface was mirror-like. Next, 0.50% hydrogen fluoride was swabbed over the surface of each specimen for 20 min. The surfaces were then subjected to rinsing using distilled water, followed by surface drying under a laboratory drier. The microstructural examination was done with a scanning electron microscope (JSM 7900F), while elemental composition and distribution were examined with energy dispersive spectroscopy (EDS). The phase identification was done in accordance with ASTM D 3906-19 [45] engaging Bruker at a 2° spectral range of 0 to 90° with a scanning rate of 2.5 degrees/min.

3. Results

3.1. Properties of Input Materials

The properties of the alloy are listed in 
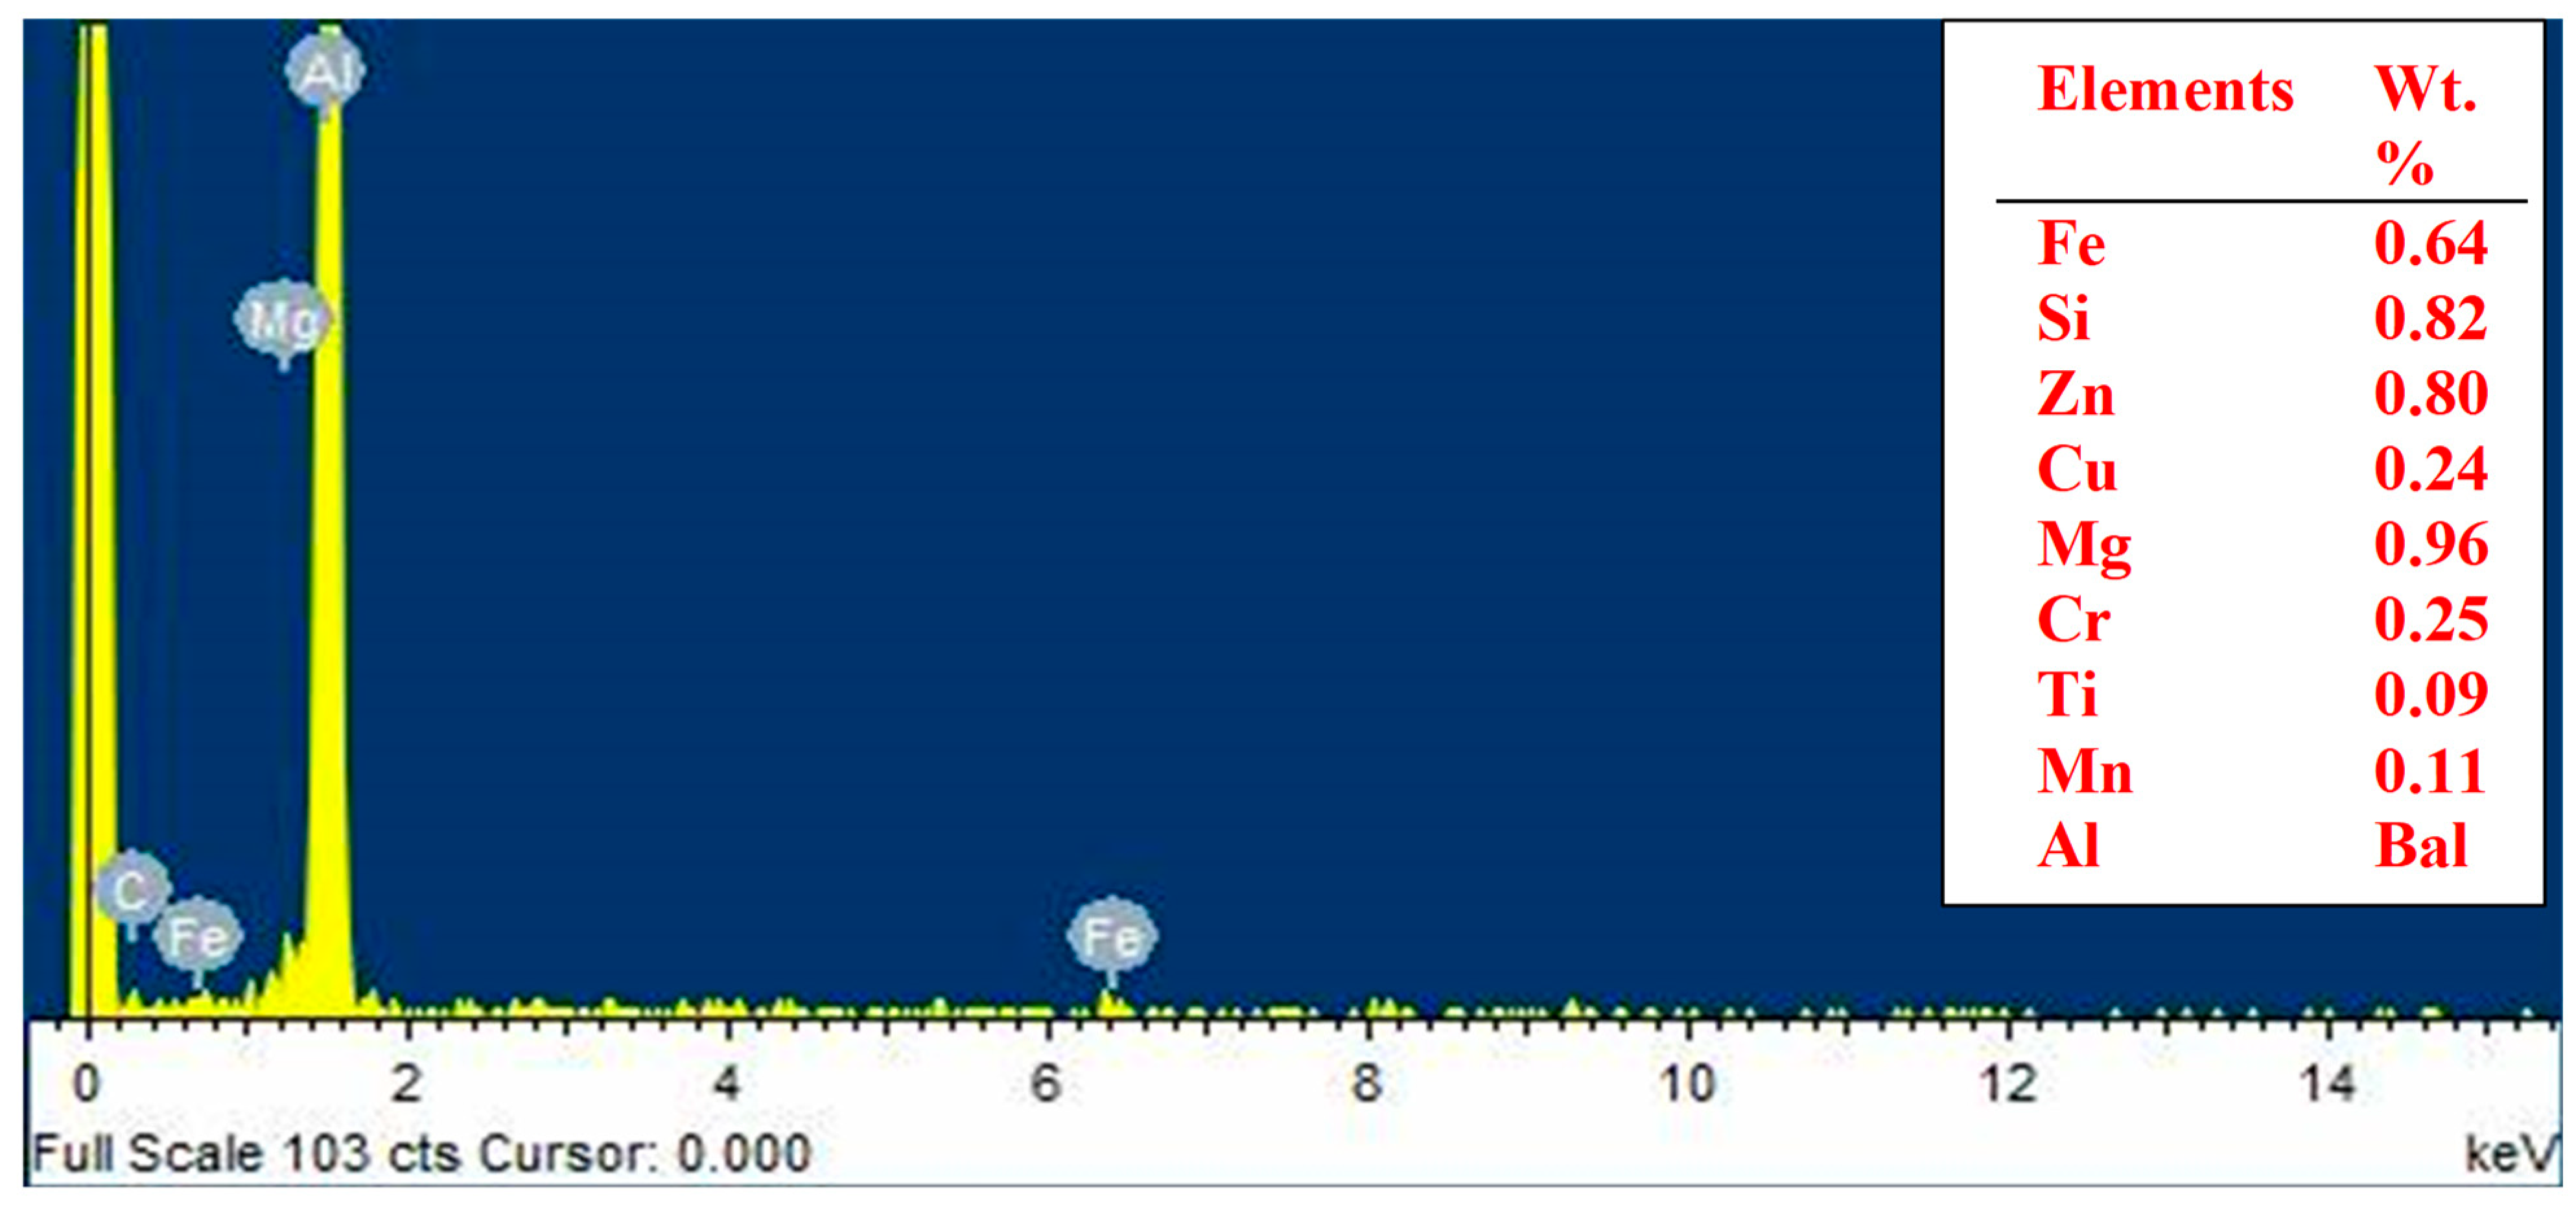
Table 3. They are 2.76 ± 0.20 g/cc, 83.0 ± 1.3 HRB, 241.6 ± 4.5 MPa, 60.3 ± 2.6 GPa, 255.5 ± 3.9 MPa, and 209.8 ± 2.7 MPa for density, Brinell hardness, tensile strength, tensile modulus, flexural strength, and compressive strength, respectively. From the result, EDS (elemental composition) is displayed in Figure 1, where Al, being the matrix, is the major element present. Other elements present in the matrix are Fe, Si, Zn, Cu, Mg, Cr, and Mn. The obtained elemental composition affirmed the elements present in Al6061 [46].
Furthermore, the chemical and elemental compositions of palm kernel shell ash (PKA) and rice husk ash (RHA) are showcased in Table 4. Going by the presented values, silica is the highest compound present in the two ashes, though its percentage in RHA is almost 90.6%, a value higher than that of PKA. MgO, Al2O3, Fe2O3, MnO2, and CaO are other compounds present.
As indicated in Table 5, iron remains the major element in the waste steel powder, indicating the particles are iron-based. Other minor elements are also indicated in the Table.
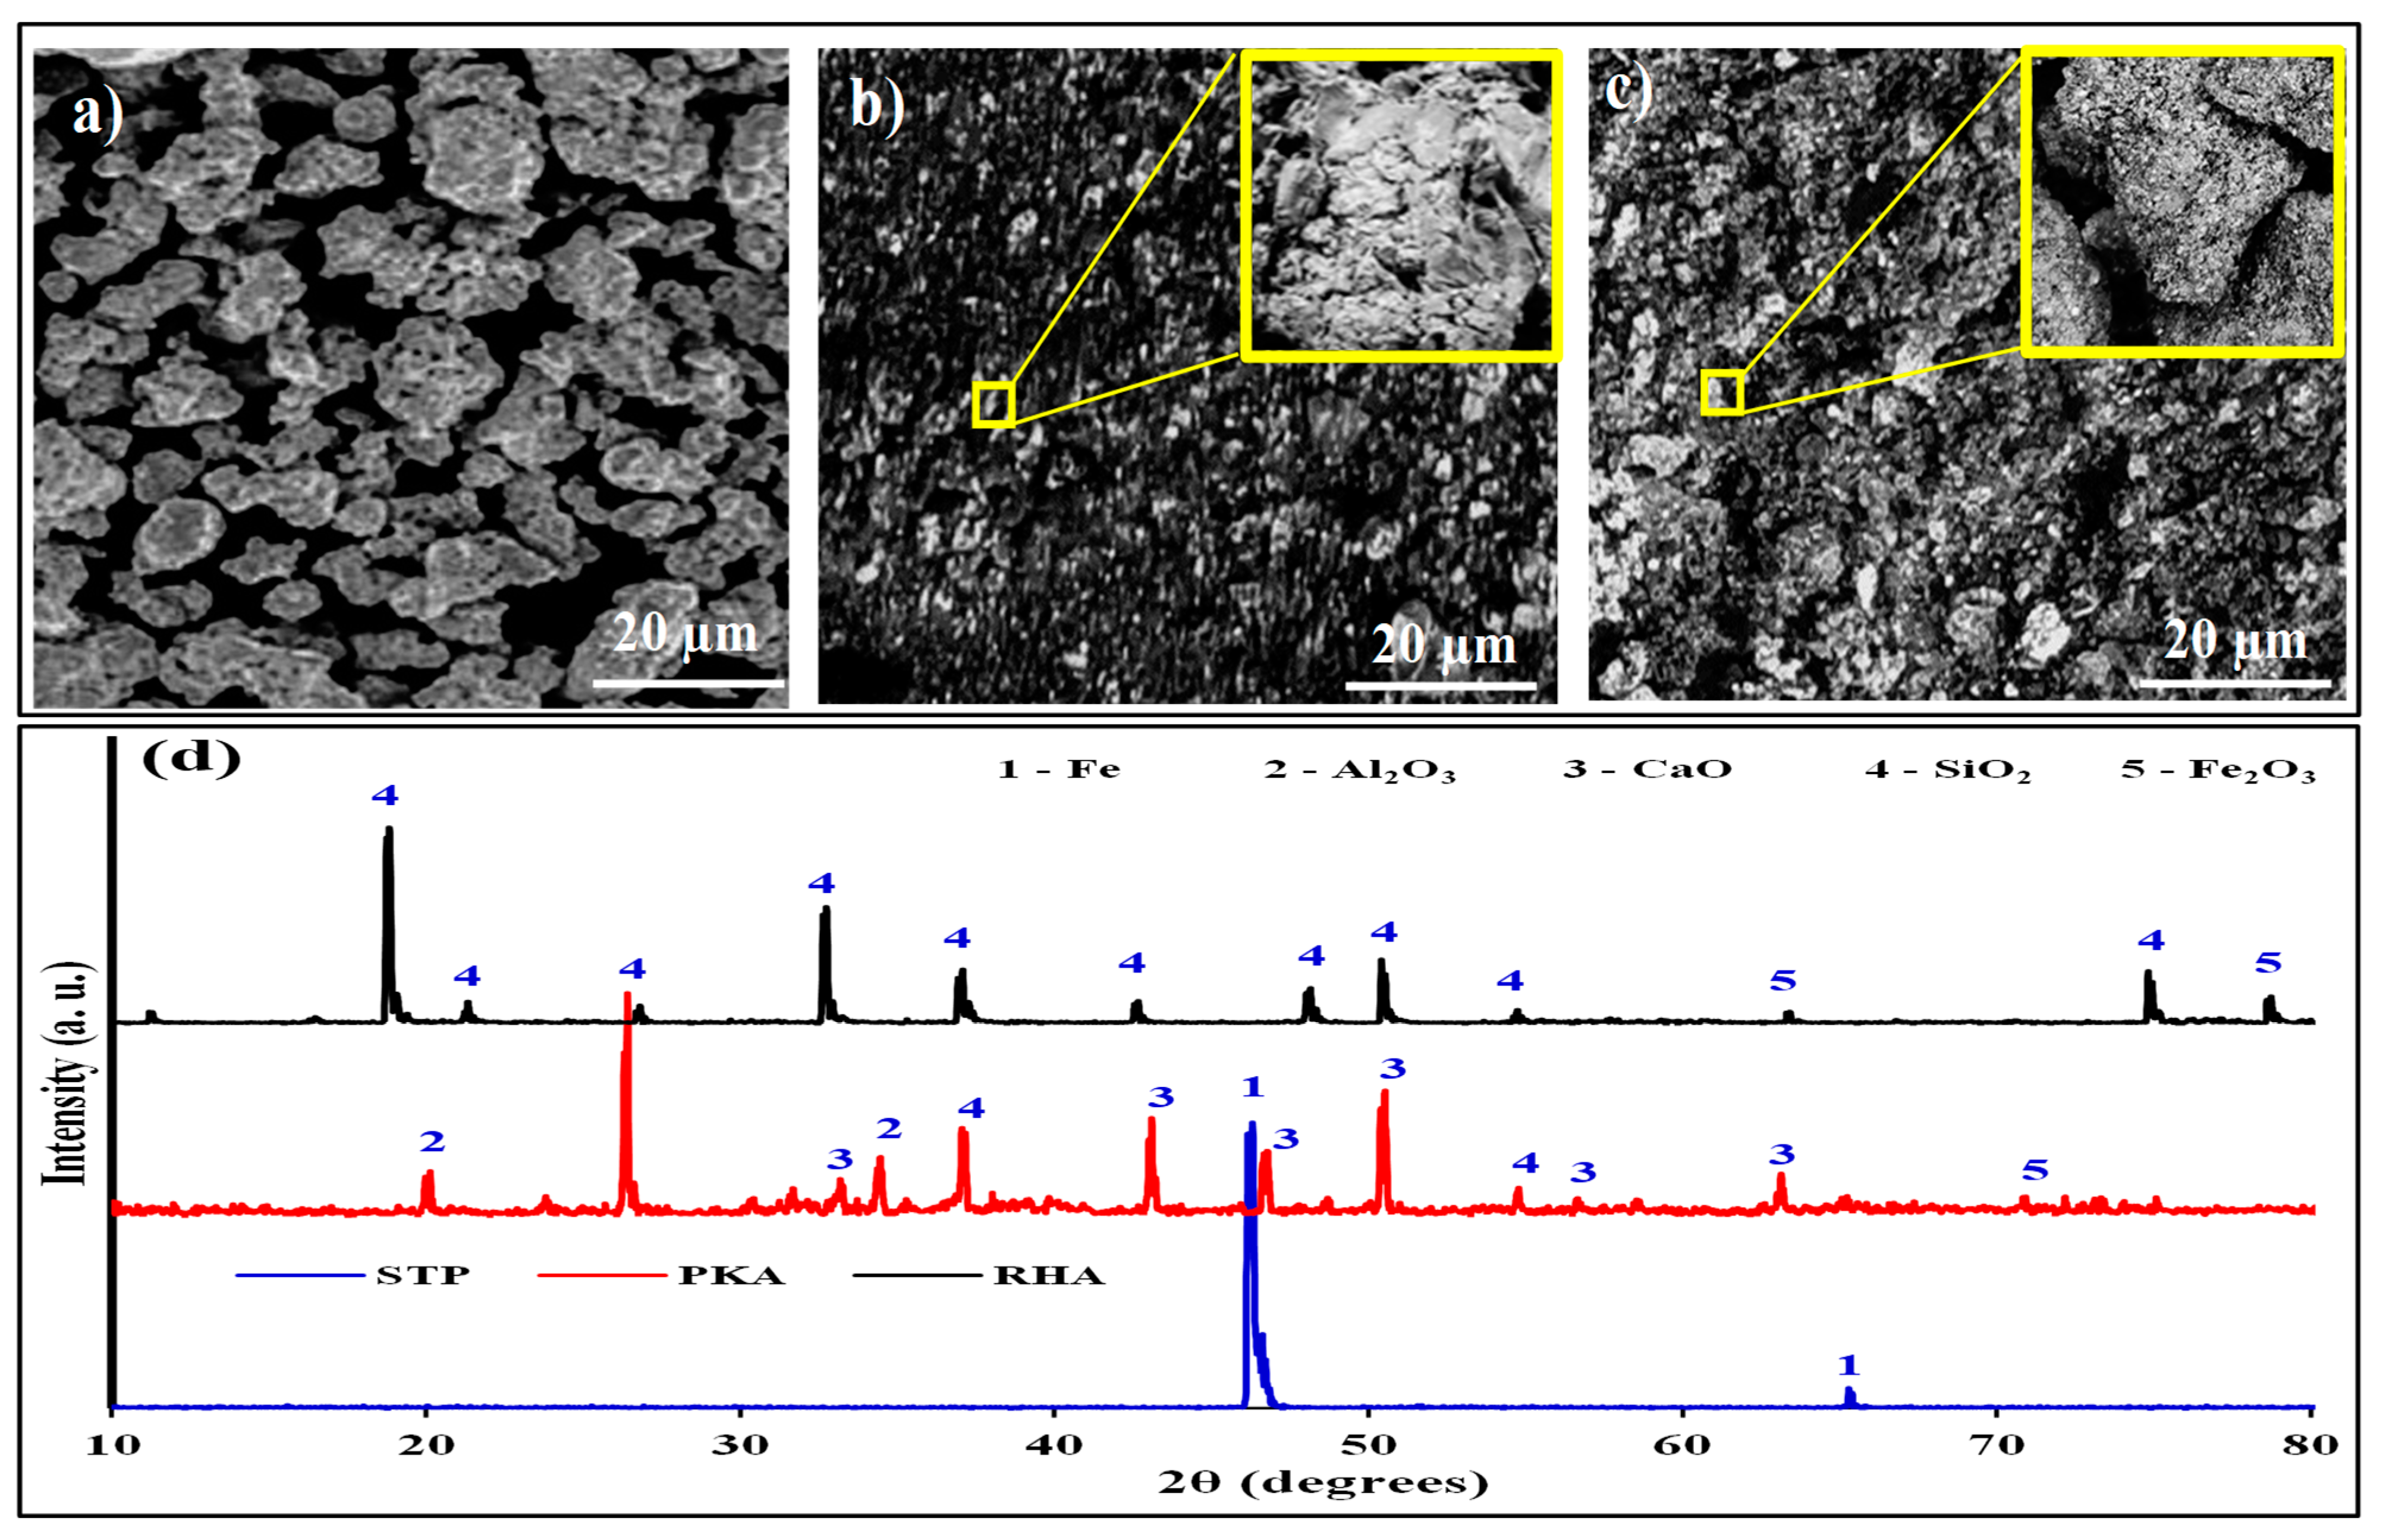
Figure 2 presents the morphological images of STP, PKA, and RHA (Figure 2a–c) and the X-ray dispersive pattern (Figure 2d). Figure 2a presents the SEM image of the steel powder with irregular spherical-like shapes. Figure 2a,b shows they have clustered particles with porous structures. Based on the energy dispersive result in Figure 2d, the steel reflects Fe peaks depicting the powder as an alloy of iron (in blue line). Other phases were not identified because of their low contents. This is confirmed in Table 5 as other elements are less than 0.5%. Figure 2d depicts high peaks of silica observed at 26.2, 38.0, 46.3, and 54.8 degrees. CaO was revealed at positions of 33.2, 51.8, 56.2, and 63.8 degrees corroborating the results displayed in Table 4 and also confirming the findings of Imoisili et al. [47] and Imoisili et al. [48]. The silica and CaO content observed in their findings for PKA is at almost the same positions noted in our findings.
As observed in Figure 2c, SiO2 is the most occurring phase, attaining positions of 19.5, 24.7, 32.8, 37.6, 42.5, 47.1, and 50.1 degrees, hence, agreeing with the observation of Farooque et al. [49]. The results are consistent with Table 4, which shows a SiO2 proportion of 90.21% in RHA. Significantly, the strengthening of an aluminium base matrix with RHA has been on account of the rich silica content, which serves as a substitute for synthetic silica. By the chemical composition of variables, they are fit for the reinforcement of Al-6061.
The corresponding values for the evaluated properties for each experimental run are highlighted in Table 6 with their respective designations. Experimental run 1 is designated 2-4-900 indicating a sample prepared with 2% PKA and 4% RHA at 900 °C. Other samples are also designated following the same pattern.
Table 6 presents the property value for specimens prepared at varying conditions according to the experimental runs in Table 2.

3.2. Microstructural and Phase Characterization

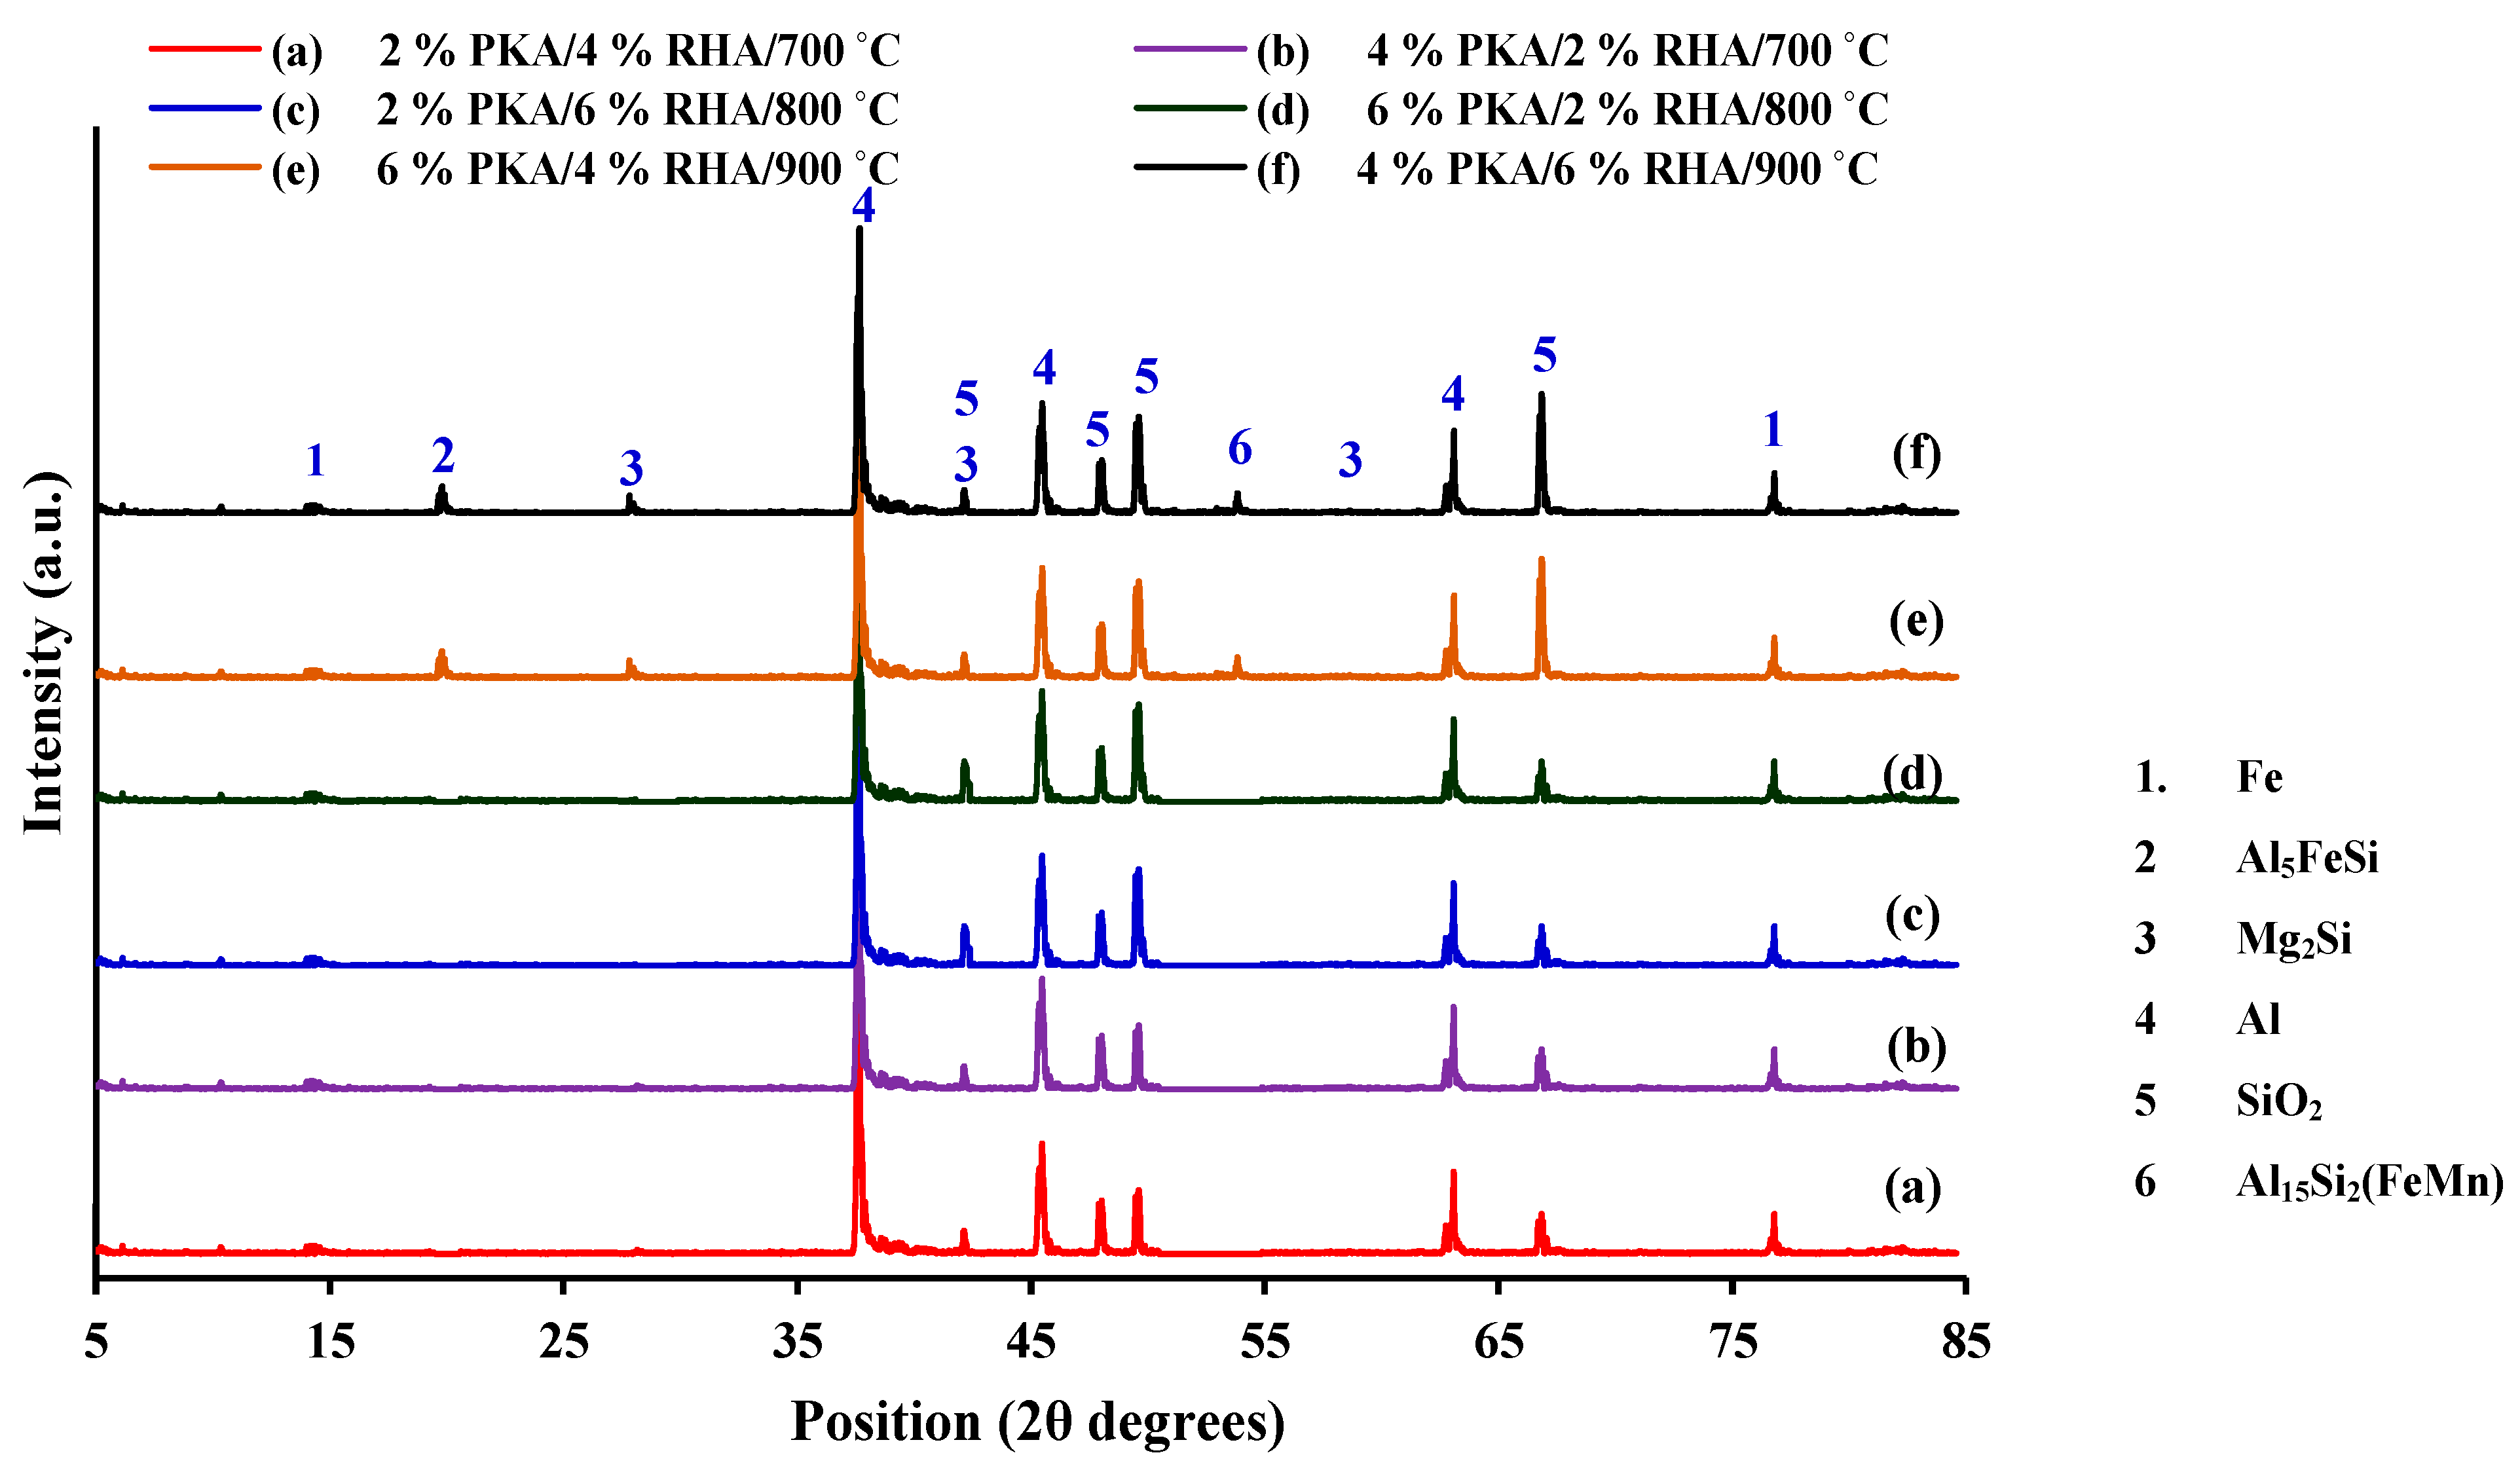
The phases contained in the selected specimens are depicted in Figure 3. Figure 3a,b shows XRD results for specimens cast at 700 °C and prepared with 2% PKA, 4% RHA, and 4% PKA, 4% RHA in that order. SiO2, Fe, and the Al phase were recognized in the specimens. The highest peak in aluminium is typical of aluminium-based alloys. The presence of SiO2 is due to the reinforcement of PKA and RHA. Fe is also present owing to intrinsic Fe in Al6061 as well as assimilated steel particles included in the melt. Figure 3c,d shows XRD data for specimens cast at 800 °C and prepared with 2% PKA/6% RHA and 6% PKA/2% RHA, respectively. From the XRD plot, there is a higher presence of silica, as depicted by the higher peak of the silica phase. The phases present in specimens prepared at 900 °C with 6% PKA/4% RHA and 4% PKA/6% RHA, respectively, are depicted in Figure 3e,f. As featured in the results, intermetallic phases of Mg2Si, Al5FeSi, and Al15Si2(FeMn) are revealed. The implication of this is that 900 °C features the existence of intermetallic phases attributed to high-temperature reactions.
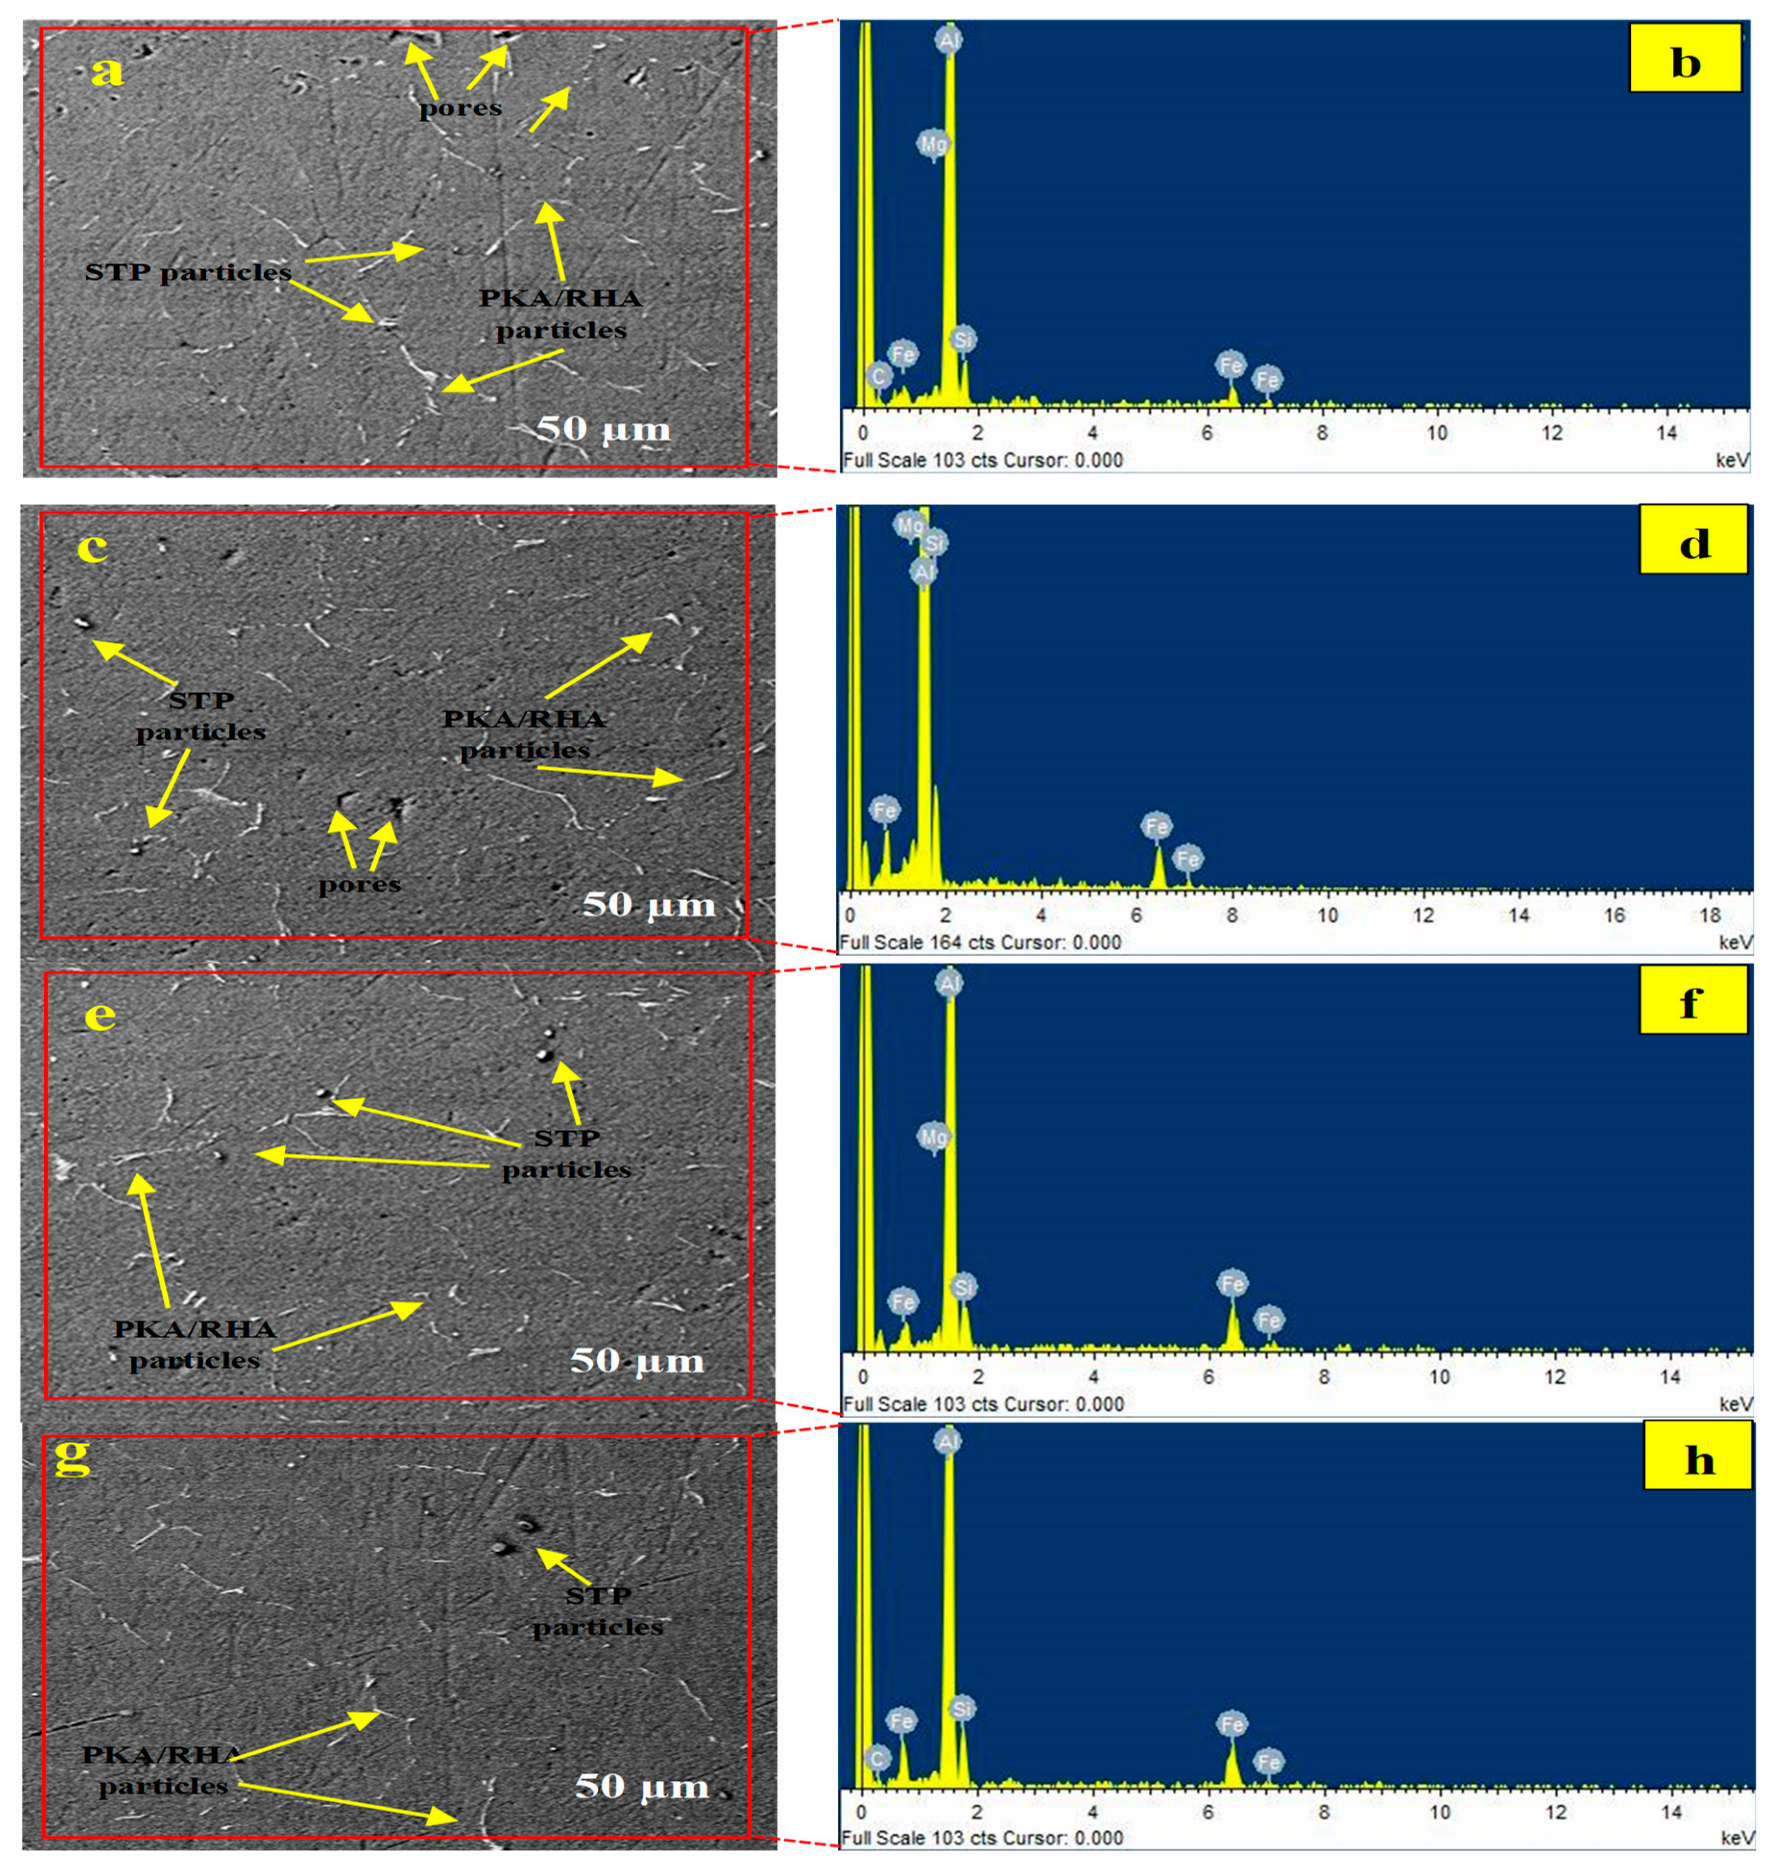
Figure 4a–h highlights the microstructural and elemental characteristics of specimens processed at 700 and 800 °C. While Figure 4a,c,e,g contains the morphological images, Figure 4b,d,f,h is the respective EDX result of the specimen. Figure 4a,c shows the morphology of specimens processed at 700 °C with 2% PKA/4% RHA and 4% PKA/2% RHA. The reinforcing particles were revealed to be dispersed within the matrix. The relevance of the stir casting process in particle dispersion in aluminium melt has been demonstrated by authors [50,51,52]. Microvoids have also been discovered in the microstructure represented by Figure 4a,c. Infilling of intrinsic pores in matrixes is one of the effects of particle reinforcement of composites. The presence of pores in Figure 4a,c may be as a result of lower viscosity in the melt, which did not permit even dispersion of the particles within the matrix. The lower viscosity of the melt is associated with a relatively low stirring temperature [53,54]. Figure 4b,d identifies the elements present in the phases as Al (matrix), Mg, Si, and Fe (as a result of steel particle addition). According to the XRD pattern (Figure 3), there are no intermetallic phases identified in specimens (b) 2% PKA/4% RHA and (d) 4% PKA/2% RHA. The microstructure of the specimen also exhibits the absence of an intermetallic phase. The major defect, therefore, identified in the microstructure is the set of micropores.
The property values (Table 6) of the specimens prepared at 700 °C represent the effect of the dispersion. In comparison to properties of pure aluminium 6061 (Table 3), specimens fabricated with 2% PKA/4% RHA at 700 °C yielded 12.4, 11.1, 4.9, and 9.2% increases in tensile strength, tensile modulus, compressive strength, and flexural strength, respectively. Similarly, at the same 700 °C, specimens doped with 4% PKA/2.0% RHA showed a 3.7, 7.8, 1.0, and 6.20% increase in the respective properties over pure Al6061 values. This demonstrates that particle distribution played a significant influence in improving the properties of the developed composites as compared with the base material. Furthermore, a 2% PKA/4% RHA specimen displayed improved tensile strength, tensile modulus, compressive strength, and compressive modulus by 8.4, 3.1, 5.8, and 8.1% over a 4% PKA/2% RHA specimen in that order. Despite the two having the same particle count (6%), the specimen with the higher RHA content performed better. This is based on the higher silica content of RHA as compared with PKA (Table 4).
Figure 4e,g demonstrates the morphology of specimens containing 2% PKA/6% RHA and 6% PKA/2% RHA, respectively, synthesized at an 800 °C stirring temperature. The presence of reinforcing agents PKA and RHA as well as steel particles can be featured in the microstructure. The particles are dispersed within the matrix, as observed in the figures. Micropores are significantly minimized when compared to specimens processed at 700 °C. This contributed significantly to the performance of the specimen at 800 °C.
The specimen generated with 2% PKA/6% RHA at 800 °C displayed a 24.2, 70.8, 39.2, and 26.0% boost in tensile strength, tensile modulus, compressive strength, and flexural strength when compared with the pure Al6061 used in the study. Specimens prepared with 6% PKA/2% RHA at 800 °C ensued 17.5, 50.9, 29.6, and 10% improvement over pure Al6061 as regards the same properties, respectively. The improvement is attributed to the dispersion observed within the microstructure. As a result of this even dispersion, there is even stress distribution within the matrix, thereby improving strength [27,55,56]. The findings of this study as regards the improvement of properties on account of particle dispersion are exemplified in the works of authors Chaubey et al. [57]. A similar investigation involving the use of palm kernel ash as reinforcing particles in Al6063 with improvement in the mechanical performance of the developed composite was earlier reported [18]. The infilling of pores by the reinforcing palm kernel ash consequently improves densification and by extension the mechanical properties of the composite.
The even dispersion of the particles revealed in the microstructure at 800 °C (Figure 4e,g) is based on the moderate viscosity of the melt, engendering even dispersion of the particles and strong interfacial adhesion with the matrix [30,55]. Further observation has shown that specimen 2% PKA/6% RHA performed better than specimen 6% PKA/2% RHA (despite the same particle count of 8%) by 5.6, 13.2, 8.6, and 14.6% as par tensile strength, tensile modulus, compressive strength, and flexural strength. The findings are associated with higher silica content in RHA as compared with PKA (Table 4).
In Figure 4e,g, the microstructure of specimens 6% PKA/2% RHA and 2% PKA/6% RHA revealed the presence of no cluster, dispersed particles, and reduced pores. This is responsible for superior performance noted at 800 °C than at 700 °C. The presence of elements Si, Fe, and Mg in the matrix’s EDX results confirmed the existence of the reinforcing phase (Figure 4f,h). The major phases identified in the XRD for specimens 6% PKA/2% RHA and 2% PKA/6% RHA (Figure 4c,d) were SiO2 and Al, with no intermetallic phase present.
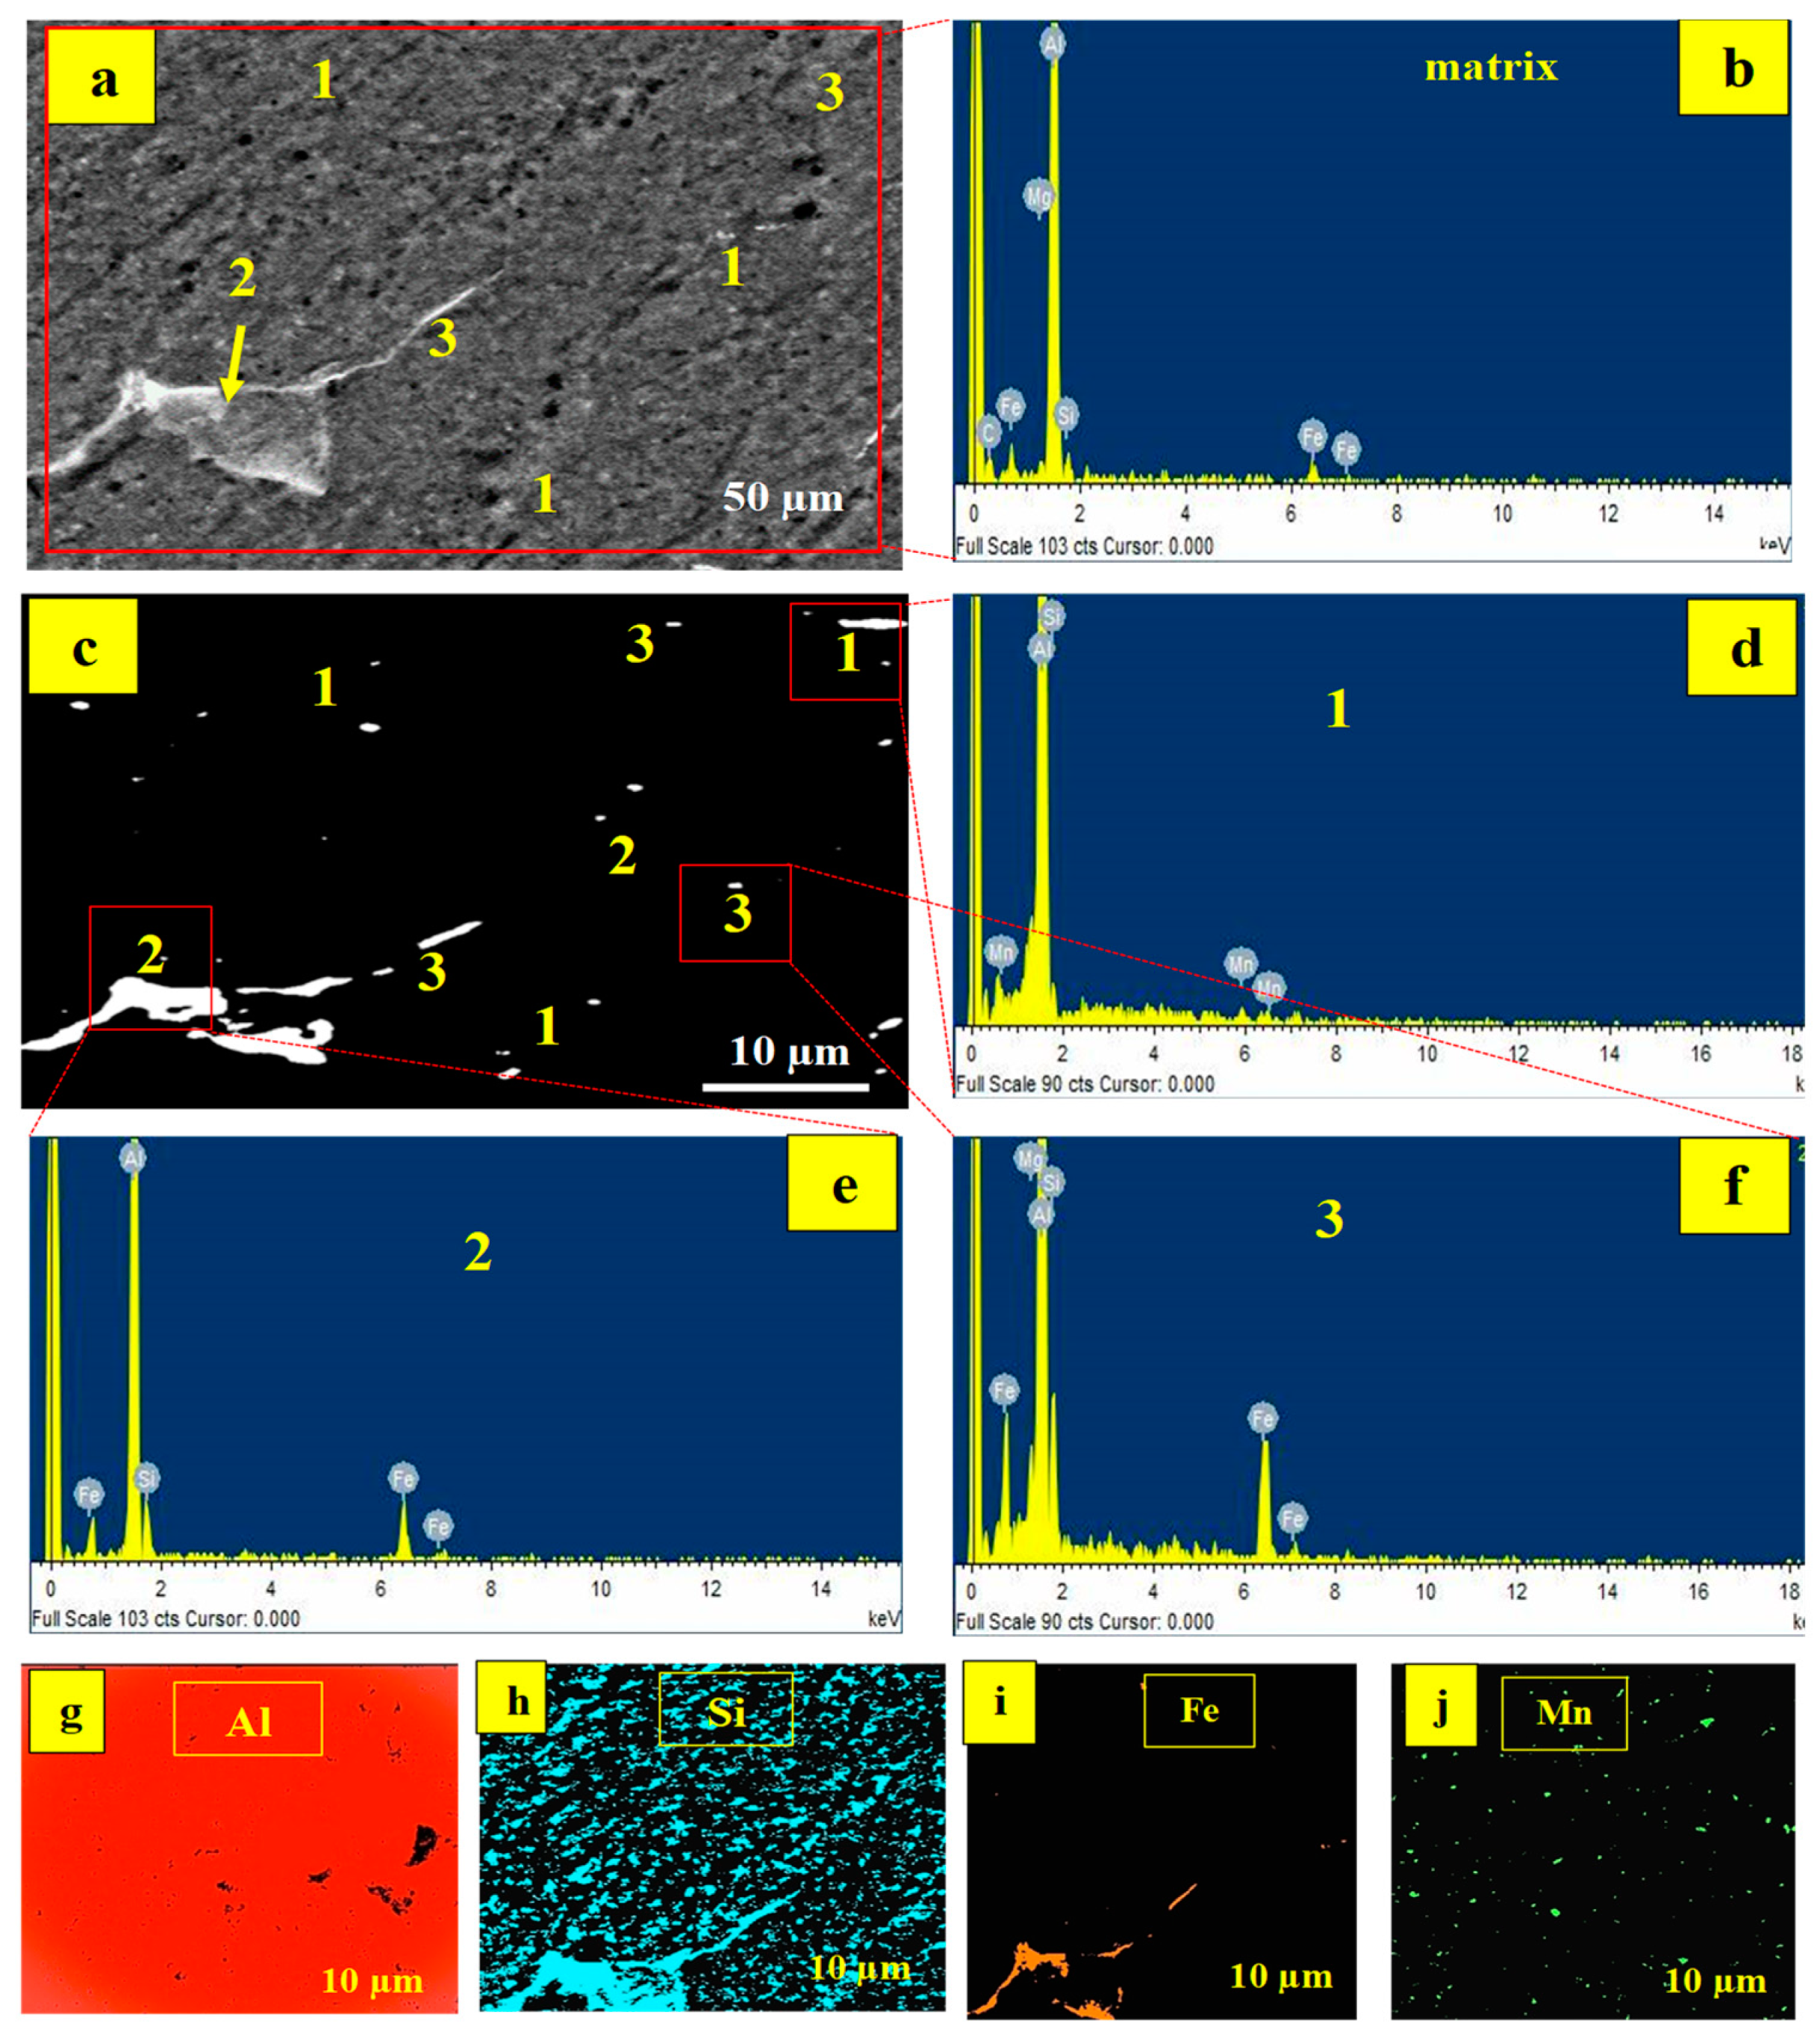
The microstructural characteristics and EDX results of specimens processed at 900 °C are demonstrated in Figure 5. The appearance of micropores may be seen in the micrograph. Akinwande et al. [29] and Adediran et al. [55] also confirmed that microvoids and blow holes are common features at high-temperature casting. There is a tendency for greater air entrapment at such temperatures, and during solidification, the entrapped air is expelled, resulting in pores in the matrix [58].
The EDS result of the matrix is illustrated in Figure 5b, which detects the presence of elements such as Al, Si, Fe, Mn, and Mg, similar to the EDX result for Al6061 shown in Figure 1. In Figure 5a, different points are labelled spots 1, 2, and 3. Under polarized illumination, Figure 5c highlights the detected spots even more clearly. Figure 5d–f shows the spot EDS results for points 1, 2, and 3. For spot 1, the elements detected are Mg and Si, as indicated in Figure 4d. While Al, Fe, Mn, and Si are found in spot 2 (Figure 5e), spot 3 contains Al, Fe, Mn, and Si (Figure 5f). The phases Mg2Si, Al5FeSi, and Al15Si2(FeMn) are the phases identified, which correlate to the literature references [59,60,61]. The phases are also visible in the XRD (Figure 3) for a specimen of formulation 4% PKA and 6% RHA cast at 900 °C.
The intermetallic phases are formed at a high temperature of 900 °C. Fe is present in spots 2 and 3, as evidenced by EDX and XRD results. Steel particles were added to increase the composite’s ductility. At higher temperatures, however, interactions between the active elements occur, resulting in the production of intermetallic phases. The elemental map of the specimen generated at 900 °C (4% PKA/6% RHA) is pictured in Figure 5g–j. Aluminium’s map is featured in Figure 5g. Based on it being the matrix, the aluminium element is established in practically every section of the matrix. The majority of the microstructure is noted to be dispersed with Si (Figure 5h) on account of the inclusion of silica-based reinforcing particles. The silicon element is also found in the intermetallic phases, confirming the existence of silica in the phases displayed in Figure 5d–f.
The distribution of Fe in the microstructure is shown in Figure 5i. The majority of the Fe element is found in intermetallic phases, with minor amounts found elsewhere in the matrix. Its predominant presence in the intermetallic is due to the reaction that took place at that temperature (900 °C), resulting in the absorption of Fe into the phases. According to Lin et al. [61] and according to the alloy phase diagram of Al-Fe, Fe has low solubility in the aluminium matrix, hence at high proportions, Fe tends to precipitate, forming Fe-rich intermetallic phases. The elemental distribution of manganese is depicted in Figure 5j. It is sparsely dispersed within the matrix on account of its reduced amount in the mix.
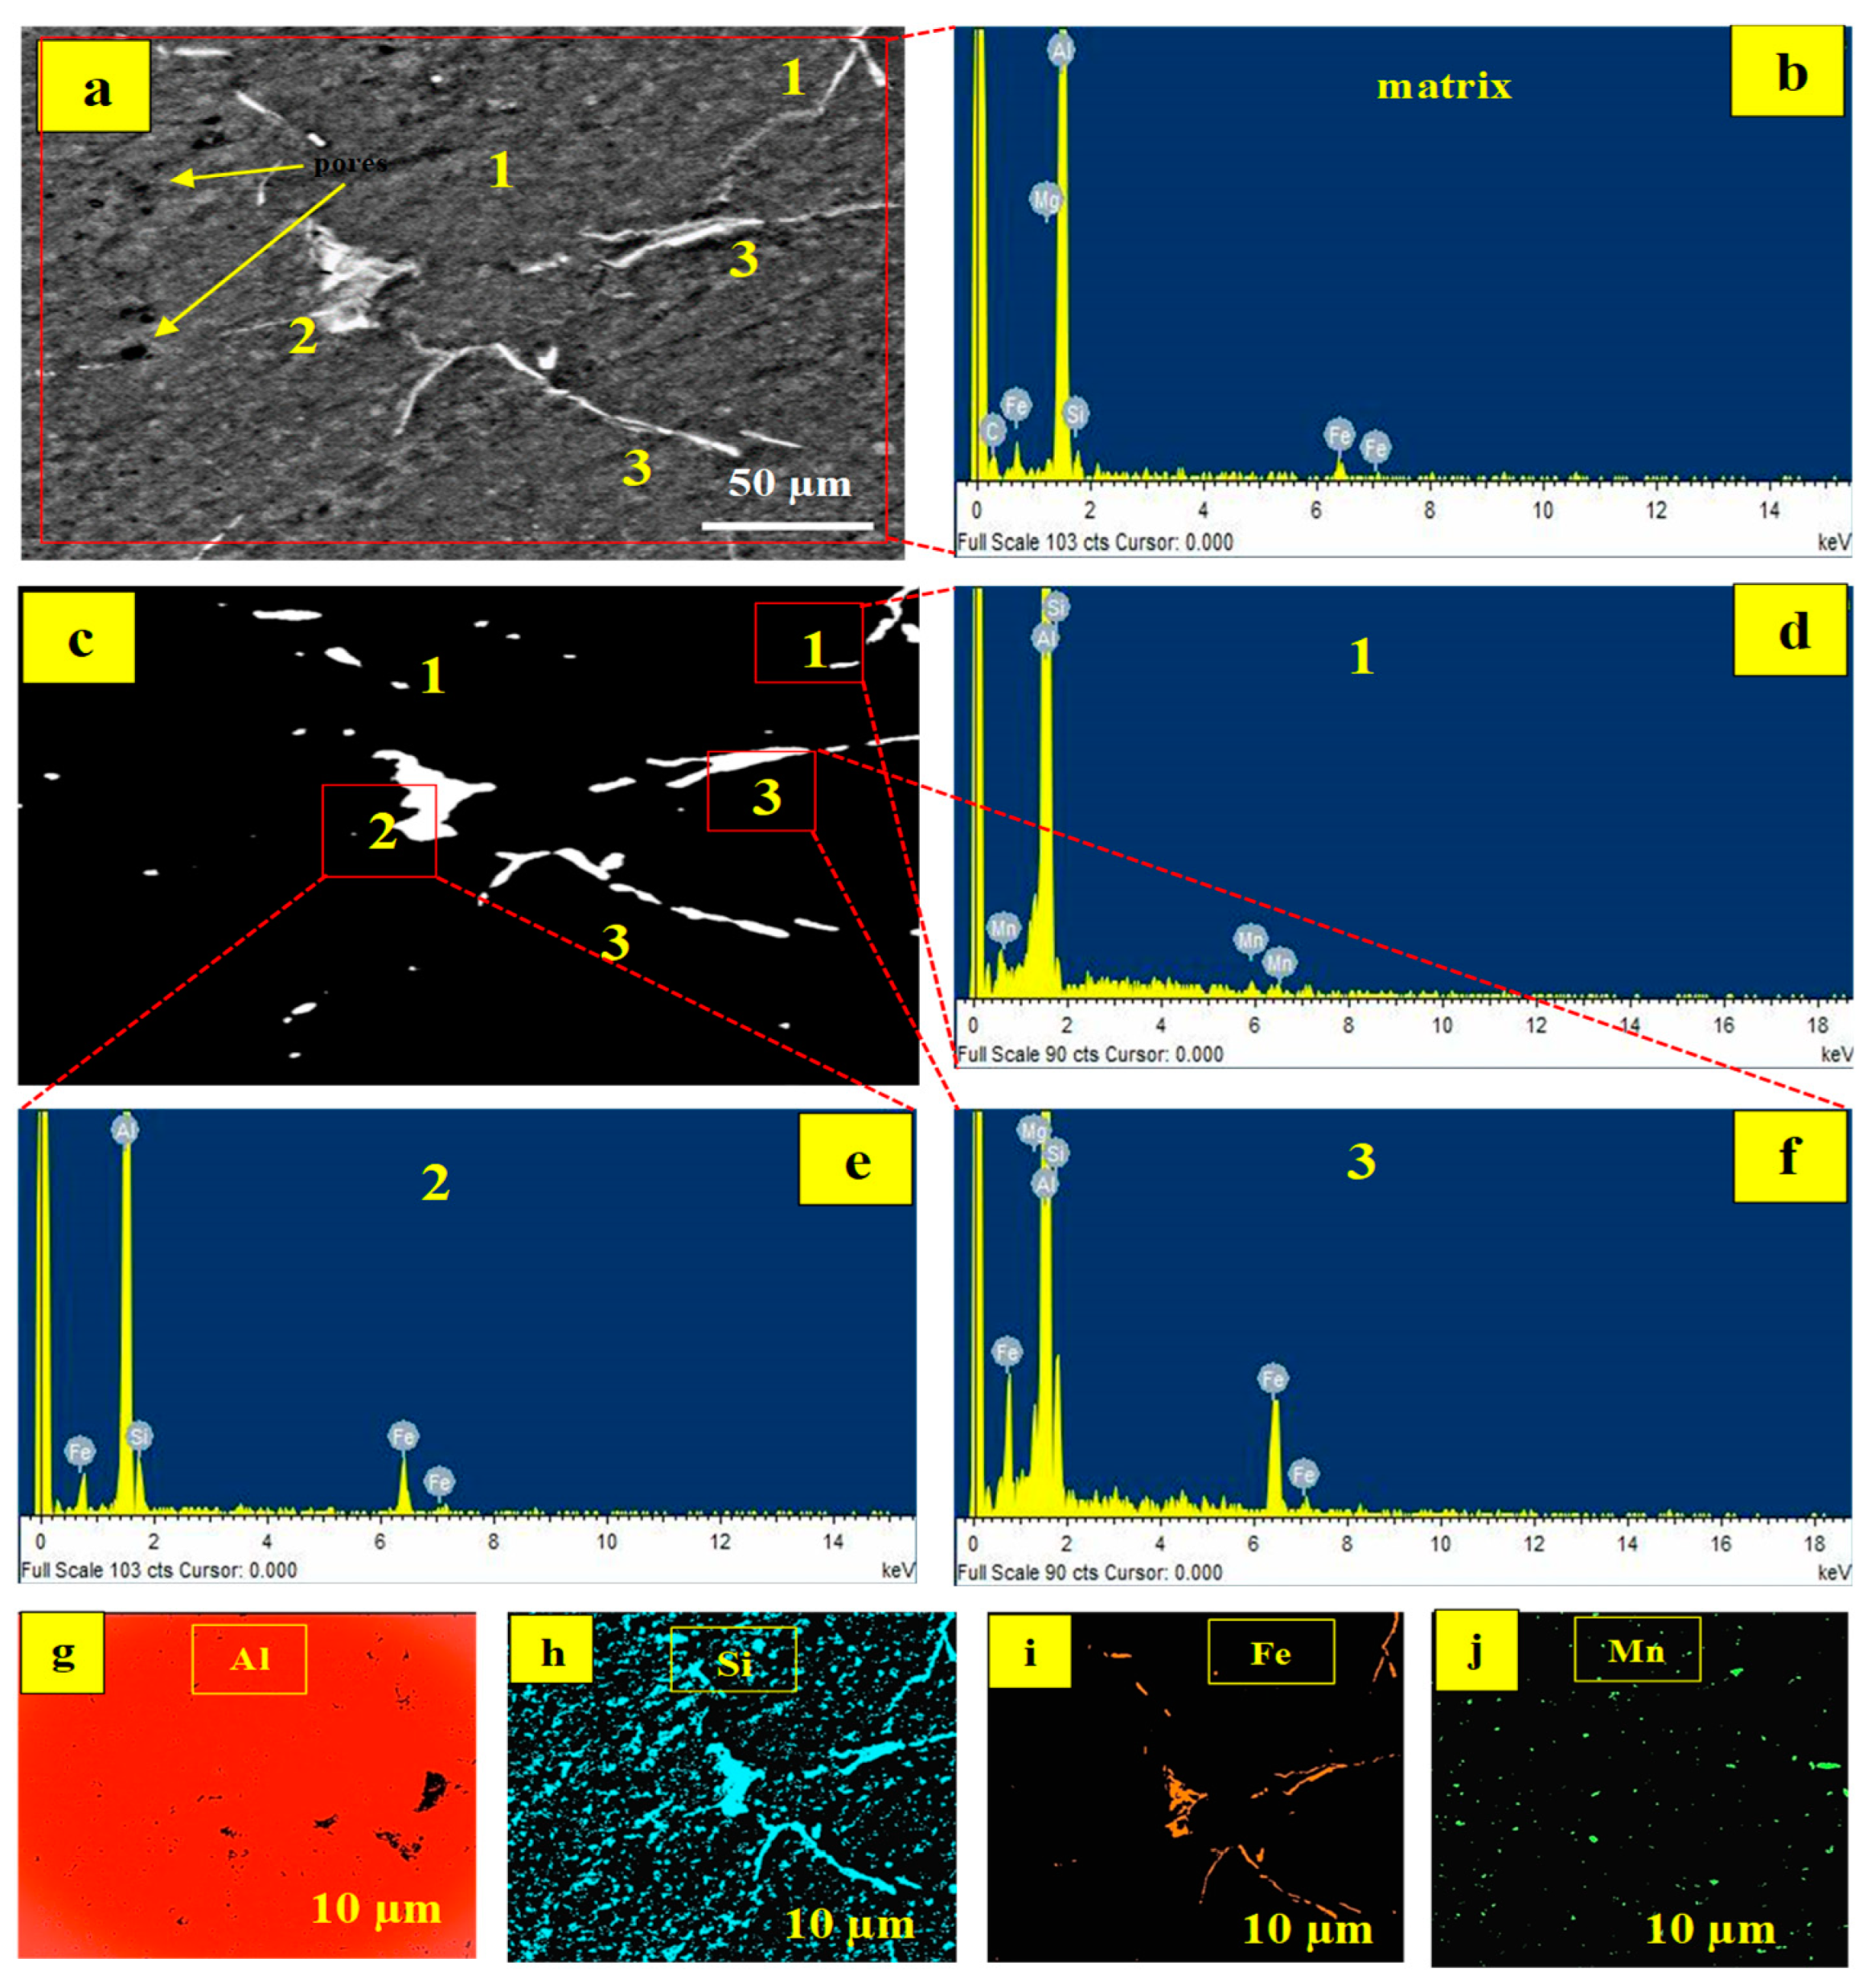
The microstructural characteristics and EDS results of a specimen generated at 900 °C and containing 6% PKA/4% RHA are shown in Figure 6. The presence of voids can be seen in Figure 6a owing to the evolution of entrapped air and gases during solidification. This is a common occurrence in high-temperature casting [29,55]. Figure 6b depicts the elemental composition of the matrix, indicating the presence of Al, Si, Fe, Mn, and Mg; identical to the EDS result of the specimen, 6% PKA/4% RHA generated at the same temperature. Various spots numbered 1, 2, and 3 are also recognized and shown under polarized light (Figure 6c).
Figure 6d–f highlight the EDS-determined composition of the spots. The elements discovered in spot 1 are Mg and Si, as in specimen 6% PKA and 4% RHA; spot 2 is Al, Fe, and Si; and spot 3 is Al, Fe, Mn, and Si. The spots are recognized as Mg2Si, Al5FeSi, and Al5S12(FeMn) intermetallic phases, respectively. The elemental maps in the specimen are featured in Figure 6g–j. Due to the fact that it is the basic element, Al dominated the element distribution within the matrix (Figure 6g). It is also among the intermetallic elements, according to the EDS elemental composition of the discovered spots. Figure 6h depicts the Si distribution, while Figure 6i and Figure 7j depict the Fe and Mn elemental distributions, respectively.
In terms of property values, the specimen performed better than pure Al6061. Furthermore, for tensile strength, tensile modulus, compressive strength, and flexural strength, specimen 4% PKA/6% RHA outperformed its 6% PKA/6% RHA counterpart by 0.7, 5.6, 24.2, and 0.7%, respectively. The disparity is still associated with the difference in PKA and RHA content, as revealed in Table 4. This is also linked to the microstructure of the specimen at 4% PKA/6% RHA having more area of coverage for intermetallic phases than its counterpart obtained with 6% PKA/4% RHA. The results for tensile strength and flexural strength are fairly close, with no appreciable differences. In comparison with specimens prepared at 800 °C with the ones at 900 °C, there is a clear disparity. In terms of tensile strength, tensile modulus, compressive strength, and flexural strength, specimens 2% PKA/6% RHA cast at 800 °C outperformed specimens 4% PKA/6% RHA cast at 900 °C by 3.09, 35.5, 2.3, and 11.4%, respectively. Similarly, and regarding the same set of responses, specimens of 6% PKA/2% RHA cast at 800 °C beat specimens of 6% PKA/4% RHA cast at 900 °C by 1.7, 26.4, 13.5, and 2.4% serially. This is a clear indication that the specimens cast at 800 °C performed better than the ones cast at 900 °C. The findings are linked to the moderate viscosity of the melt, which engendered even dispersion of the particles as noted in the microstructure. As a result of the dispersion, even the distribution of stress is kindled, thereby improving performance under loading. More so, the intermetallics present in the specimen cast at 900 °C are detrimental to the matrix, resulting in lower strength performance under loading owing to their brittle nature.

3.3. Response Surface Analysis

3.3.1. Analysis of Variance (ANOVA) and Mathematical Models

The significance of each of the independent inputs on each response was determined by ANOVA and the results are presented in Table 7, Table 8 and Table 9. In the tables, terms A, B, and C stand for palm kernel ash (PKA), rice husk ash (RHA), and Temperature (Temp.), respectively.
The outcome of the analysis of variance on tensile strength (TS) and tensile modulus (TM) is revealed in Table 7. For both tensile strength and tensile modulus, the probability value for terms PKA, RHA, and temperature is <0.05. Based on that, the inputs of PKA, RHA, and stirring temperature on tensile strength and tensile modulus are consequential. Interactions (PKA vs. PKA), A2, (RHA vs. RHA) B2, and (Temperature vs. Temperature) C2 are determined to have a consequential contribution to tensile strength, while other interactions have an insignificant effect on the response (since the p-value is less than 0.05). Only changes in interaction C2 have a significant effect on tensile modulus, whereas other interactions have no discernible effect. The p-value for the model for each of tensile strength (Table 7a) and elastic modulus (Table 7b) is less than 0.05, indicating that the models (Equations (1) and (2)) are significant. This is further corroborated by the lack of fit, where the p-value is greater than 0.05 in each case. Hence, the models have a high degree of fitness. The coefficient of correlation R2 for the model is 0.9788 and 0.9751 for TS and TM, respectively, corroborating their high degree of fitness. In that case, 97.88% of the data is explained by the model for tensile strength, whereas 99.51% for that of elastic modulus. Accordingly, the models have a good correlation with the fitted data. Since the disparity between R2 (adj) and R2 (pred) for TS and TM is not above 0.2, there exists an agreement between the two parameters and the models are fit for response prediction.
TS = 68.3740 A + 74.9375 B + 6.3238 C − 0.0625 AB − 0.0463 AC + 0.0000 BC − 4.0625 A2 − 8.7500 B2 − 0.0038 C2 − 2535.2500
TM = 7.4375 A + 5.5625 B + 3.9125 C − 0.3125 AB − 0.00500 AC + 0.0000 BC + 0.1563 A2 + 0.1563 B2 − 0.0025 C2 − 1495.5000
The mathematical models of tensile strength and elastic modulus are depicted in Equations (2) and (3) accordingly where A, B, and C stand for PKA proportion, RHA proportion, and stirring temperature, respectively. TS and TM stand for tensile strength and tensile modulus accordingly. The model expressions for TS and TM in Equations (2) and (3) can be streamlined at the expense of the insignificant terms as highlighted in Equations (4) and (5).
TS = 68.3740 A + 74.9375 B + 6.3238 C − 4.0625 A2 − 8.7500 B2 − 0.0038 C2 − 2535.2500
TM = 7.4375 A + 5.5625 B + 3.9125 C + 0.1563 A2 + 0.1563 B2 − 1495.5000
Table 8 presents the analysis of variance on compressive strength (CS) and compressive modulus (CM). The impact of the factors on the responses is significant because the p-value for terms PKA and RHA is <0.05 for both responses (Table 8a,b). The p-value for temperature is less than 0.05 for compressive strength and greater than 0.05 for compressive modulus. It, therefore, means a temperature change has an appreciable impact on compressive strength but a negligible consequence on compressive modulus. Interactions represented by C2 are observed to show a consequential effect on the two response parameters; whereas, the other interactions are portrayed to have a marginal impact on the responses (since the p-value is less than 0.05).
The p-value for the model (expressed in Equations (4) and (5)) for compressive strength (Table 8a) and compressive modulus (Table 8b) is less than 0.05. For that reason, the models are termed significant. On account of the p-value (greater than 0.05), the lack of fit for the model is insignificant. Hence, the models are further confirmed to be statistically fit in representing the data of the responses. The coefficient of correlation R2 for the model is 0.9826 and 0.9865 for CS and CM, respectively, corroborating their high degree of fitness. Inference: 98.26% of the data is explained by the model for compressive strength, while 98.65% for that of compressive modulus. Accordingly, the relationship has a good correlation with the fitted data. Since the disparity between R2 (adj) and R2 (pred) for CS and CM is not above 0.2, there exists a synergy between the two parameters and the models are fit for response prediction.
CS = 7.1250 A + 8.0000 B + 4.0475 C + 0.3750 AB + 0.0000 AC + 0.0100 BC + 0.0625 A2 − 0.3125 B2 − 0.0025 C2 − 1433.5000
CM = 11.0000 A + 6.7500 B + 2.8850 C + 0.1250 AB − 0.0100 AC + 0.0025 BC + 0.0625 A2 − 0.1875 B2 − 0.0018 C2 − 1138.5000
The mathematical models of compressive strength and compressive modulus are delineated in Equations (6) and (7), respectively where A, B, and C stand for PKA proportion, RHA proportion, and stirring temperature, respectively. CS and CM stand for tensile strength and tensile modulus accordingly. The model expressions for CS and CM in Equations (6) and (7) can be streamlined at the expense of the insignificant terms as highlighted in Equations (8) and (9).
CS = 7.1250 A + 8.0000 B + 4.0475 C − 0.0025 C2 − 1433.5000
CM = 11.0000 A + 6.7500 B + 2.8850 C − 0.0018 C2 − 1138.5000
Table 9 presents the analysis of variance for flexural strength. From the table, the probability values as regards independent variables PKA, RHA, and temperature are <0.05. On account of that, the parameters are said to have appreciable contributions to flexural strength. Interactions A2, B2, and C2 also contributed significantly to the response. Meanwhile, other cross-interactions between the factors had inconsequential contributions to the response (since p-v is less than 0.05). The p-value for the model of flexural strength is denoted to be less than 0.05, signifying a significant model (Equations (1) and (6)). Furthermore, the significance of the model is evinced by the lack of a p-value greater than 0.05. By implication, the model has a high degree of fitness. The coefficient of correlation R2 for the model is 0.9866, showing there exists a good correlation between the response data and the model. By deduction, 98.66% is explained by the model for flexural strength response. Since the disparity between R2 (adj) and R2 (pred) is less than 0.2, there is therefore a good agreement between the terms, affirming a statistically fit model.
FS = 50.4375 A + 62.1875 B + 6.5150 C − 0.8125 AB − 0.0200 AC − 0.0050 BC − 4.2813 A2 − 6.1563 B2 − 0.0040 C2 − 2511.5000
The mathematical models of flexural strength are stipulated in Equation (6) where A, B, and C stand for PKA proportion, RHA proportion, and stirring temperature individually. The model expressions for FS in Equation (10) can be streamlined at the expense of the insignificant terms as highlighted in Equation (11).
FS = 50.4375 A + 62.1875 B + 6.5150 C − 4.2813 A2 − 6.1563 B2 − 0.0040 C2 − 2511.5000

3.3.2. Diagnostic Plot

Figure 7 shows the normal probability plot for the residuals as regards the parameters. It is revealed that the residuals are distributed along the mean line, picturing a good relationship between the model and the data. This is further confirmed by the R2 values, which are greater than 0.95.
For a good model fit to predict responses, the plotted points should be distributed close to the fitted line, which is at 45 to the horizontal. In all the plots (Figure 8), the points are distributed close to the fitted line, hence, the models are fit for prediction. Equally, the R2(prediction) for the plots is valued above 0.9, a case in which the prediction of the model may have less than a 10% deviation. Tensile modulus, compressive strength, and compressive modulus have an R2(pred.) greater than 0.95, depicting a very good model statistically fit for response with less than 5% error.

3.4. Surface and Contour Plots

3.4.1. Tensile Strength

Figure 9a displays the surface plot for the interaction between PKA and RHA as a par tensile strength while holding the temperature constant at 800 °C. The interaction between 2–4% PKA and 2–4% RHA resulted in an increase in tensile strength, whereas 4–6% PKA and 4–6% RHA resulted in a decrease in strength value. By implication, the two showcased an inverted parabolic profile. The intersection of the points of inflexion exists at 4 wt.% PKA and 4 wt.% RHA for both factors, yielding a maximum value of 388.885 MPa.
Figure 9b reveals the contour plot for the interplay existing between PKA and temperature at a constant dose of 4% RHA. The proportion of PKA between 2–4 wt.% blended with 4% RHA at 700–800 °C was beneficial to tensile strength improvement. Conversely, 4–6.0% PKA and 800–900 °C kindled strength minimization. By deduction, the two inputs demonstrated an inverted parabolic interaction profile. The intersection mark for the points of inflexion of two independent variables is 4% PKA/800 °C temperature, corresponding to 243.01 MPa.
Figure 9c shows the surface plot for the relationship between RHA vs. temperature, holding PKA at 4%. Infusion of 2–4% RHA at temperatures ranging from 700–800 °C has been shown to improve strength. In contrast, 4–6% RHA introduced into the melt at 800–900 °C triggered a progressive decrement in strength value. The interaction profile for the variables as observed is an inverted paraboloid. The point in which the inflexions for the two variables intersect exists at 4% RHA/800 °C temperature.

3.4.2. Tensile Modulus

In Figure 10a, the surface plot for the relation “PKA vs. RHA” as regards tensile modulus is unveiled. The addition of 2–6 wt.% PKA and RHA resulted in a linear improvement in tensile modulus. The interaction profile for the two independent variables is positively linear.
In the case of the relation “RHA and temperature”, while maintaining PKA at 4% (Figure 10b), the pattern of interaction is highlighted in the surface plot. A linear increase in PKA at temperatures of 700–800 °C engendered a progressive boost in tensile modulus, for which the same dosage of PKA at temperatures of 800–900 °C enkindled strength depreciation. It shows, therefore, that PKA manifested a positive linear interaction profile even as temperature depicted an inverted parabolic interaction pattern with a point of inflexion at 800 °C.
The surface plot for the relationship “RHA vs. Temperature” at a constant 4% dose of PKA is demonstrated in Figure 10c. The same dose of the RHA blended in the melt between 2 and 6 wt.% at 700–800 °C purported a rise in tensile modulus, while the same dose of the RHA utilized as reinforcement at a temperature range of 800–900 °C resulted in a decline in modulus value. By inference, RHA exhibited a positive linear interaction pattern even as temperature depicted an inverted parabolic pattern with the point of inflexion existing at 800 °C.

3.4.3. Compressive Strength

The surface plot for the relationship “PKA vs. RHA” with regard to compressive strength when maintaining the temperature at 800 °C is portrayed in Figure 11a. As observed, the continuous addition of PKA and RHA at 2–6 wt.% amounted to a progressive enhancement in compressive strength, displaying a positive linear interaction pattern.
For the relationship “RHA and temperature” at a constant PKA of 4 wt.%, the mode of the relationship is presented by the surface plot in Figure 11b. The input of the RHA particles between 2 and 6% at a temperature range of 700–800 °C ensued in a consecutive improvement in strength, of which 2–6 wt.% of the same particles at a temperature range of 800–900 °C manifested a decrease in compressive strength. While RHA showcased a linear pattern of interaction, the stirring temperature displayed an inverted parabolic pattern even as the point of inflexion is depicted at 800 °C.
The surface interaction plot between RHA and temperature when maintaining PKA at 4 wt.% is illustrated in Figure 11c. It is observed that compressive strength appreciated progressively between 700 and 800 °C when 2–6 wt.% RHA was introduced into the melt. However, at the temperature range of 800–900 °C, there was a recline in the compressive strength. In that case, RHA depicted a linear relationship pattern, even as temperature showcased an inverted paraboloid pattern with a turning point at 800 °C.

3.4.4. Compressive Modulus

Figure 12a portrays the surface plot for the relationship between PKA and RHA as par compressive modulus when keeping the temperature constant at 800 °C. The interaction between 2–4% PKA and 2–4% PKA resulted in a progressive improvement in compressive modulus. By implication, the two showcased positive linear patterns for the relationship.
Figure 12b reveals the surface plot for the interplay existing between PKA and temperature at a constant dose of 4% RHA. At 700–800 °C stirring temperature, the RHA content of 2–6 wt.% blended with 4–6% RHA was beneficial to the improvement of compressive modulus response. On the other hand, 2–6% PKA and 800–900 °C amounted to a reduction in modulus. By deduction, while PKA demonstrated a linear profile, temperature portrayed an inverted parabolic pattern. The point of inflexion for temperature is about 800 °C.
Figure 12c shows the surface plot for the relationship between RHA vs. temperature, holding PKA at 4%. Infusion of 2–6% RHA at temperatures ranging from 700 to 800 °C has been shown to improve modulus response. Meanwhile, 2–6% RHA introduced into the melt at 800–900 °C enkindled a progressive decrement in strength value. The interaction profile for the RHA is linear with a positive gradient. The interaction plot for temperature is an inverted paraboloid. The turning point for the temperature profile is 800 °C.

3.4.5. Flexural Strength

The surface plot for the influence of the relation “PKA vs. RHA” on flexural strength when holding temperature at 800 °C is showcased in Figure 13a. The interaction between 2–4% PKA and 2–4% RHA resulted in an increase in flexural strength, whereas 4–6% PKA and 4–6% RHA resulted in a decrease in strength value. Deductively, the two showcased inverted parabolic patterns of interaction. The intersection of the points of inflexion exists at 4 wt.% PKA and 4 wt.% RHA for both factors, yielding a maximum value of 336.53 MPa.
Figure 13b reveals the contour plot for the interplay existing between PKA and temperature at a constant dose of 4% RHA. The proportion of PKA between 2–4 wt.% blended with 4–6% RHA at 700–800 °C was favourable to the improvement of the response. Conversely, 4–6% PKA and 800–900 °C kindled strength minimization. By deduction, the two inputs demonstrated an inverted parabolic interaction profile. The intersection mark for the points of inflexion of two independent variables is 4% PKA/800 °C temperature, corresponding to 334.84 MPa.
Figure 13c demonstrates the surface plot for the relationship between RHA vs. temperature, holding PKA at 4%. Infusion of 2–4% RHA at temperatures ranging from 700 to 800° C has been shown to improve strength. In contrast, 4–6% RHA introduced into the melt at 800–900 °C ensued a progressive decrement in strength value. The interaction profile for the variables as observed is an inverted paraboloid. The point in which the inflexions for the two variables intersect exists at 4% RHA/800 °C temperature, corresponding to the value of 335.62 MPa.

3.5. Process Mapping

As explained by Akinwande et al. [62,63] process maps for a given response are 2D views in which design points are connected by contour lines. The process of mapping the responses investigated in this study is presented in Figure 14, Figure 15, Figure 16 and Figure 17. The contour plots show different sections where different ranges of responses are obtained at different combinations of the independent variables. Important sections are the sections tagged “optimum region” where optimum response ranges are realizable at a diverse combination of the parameters.
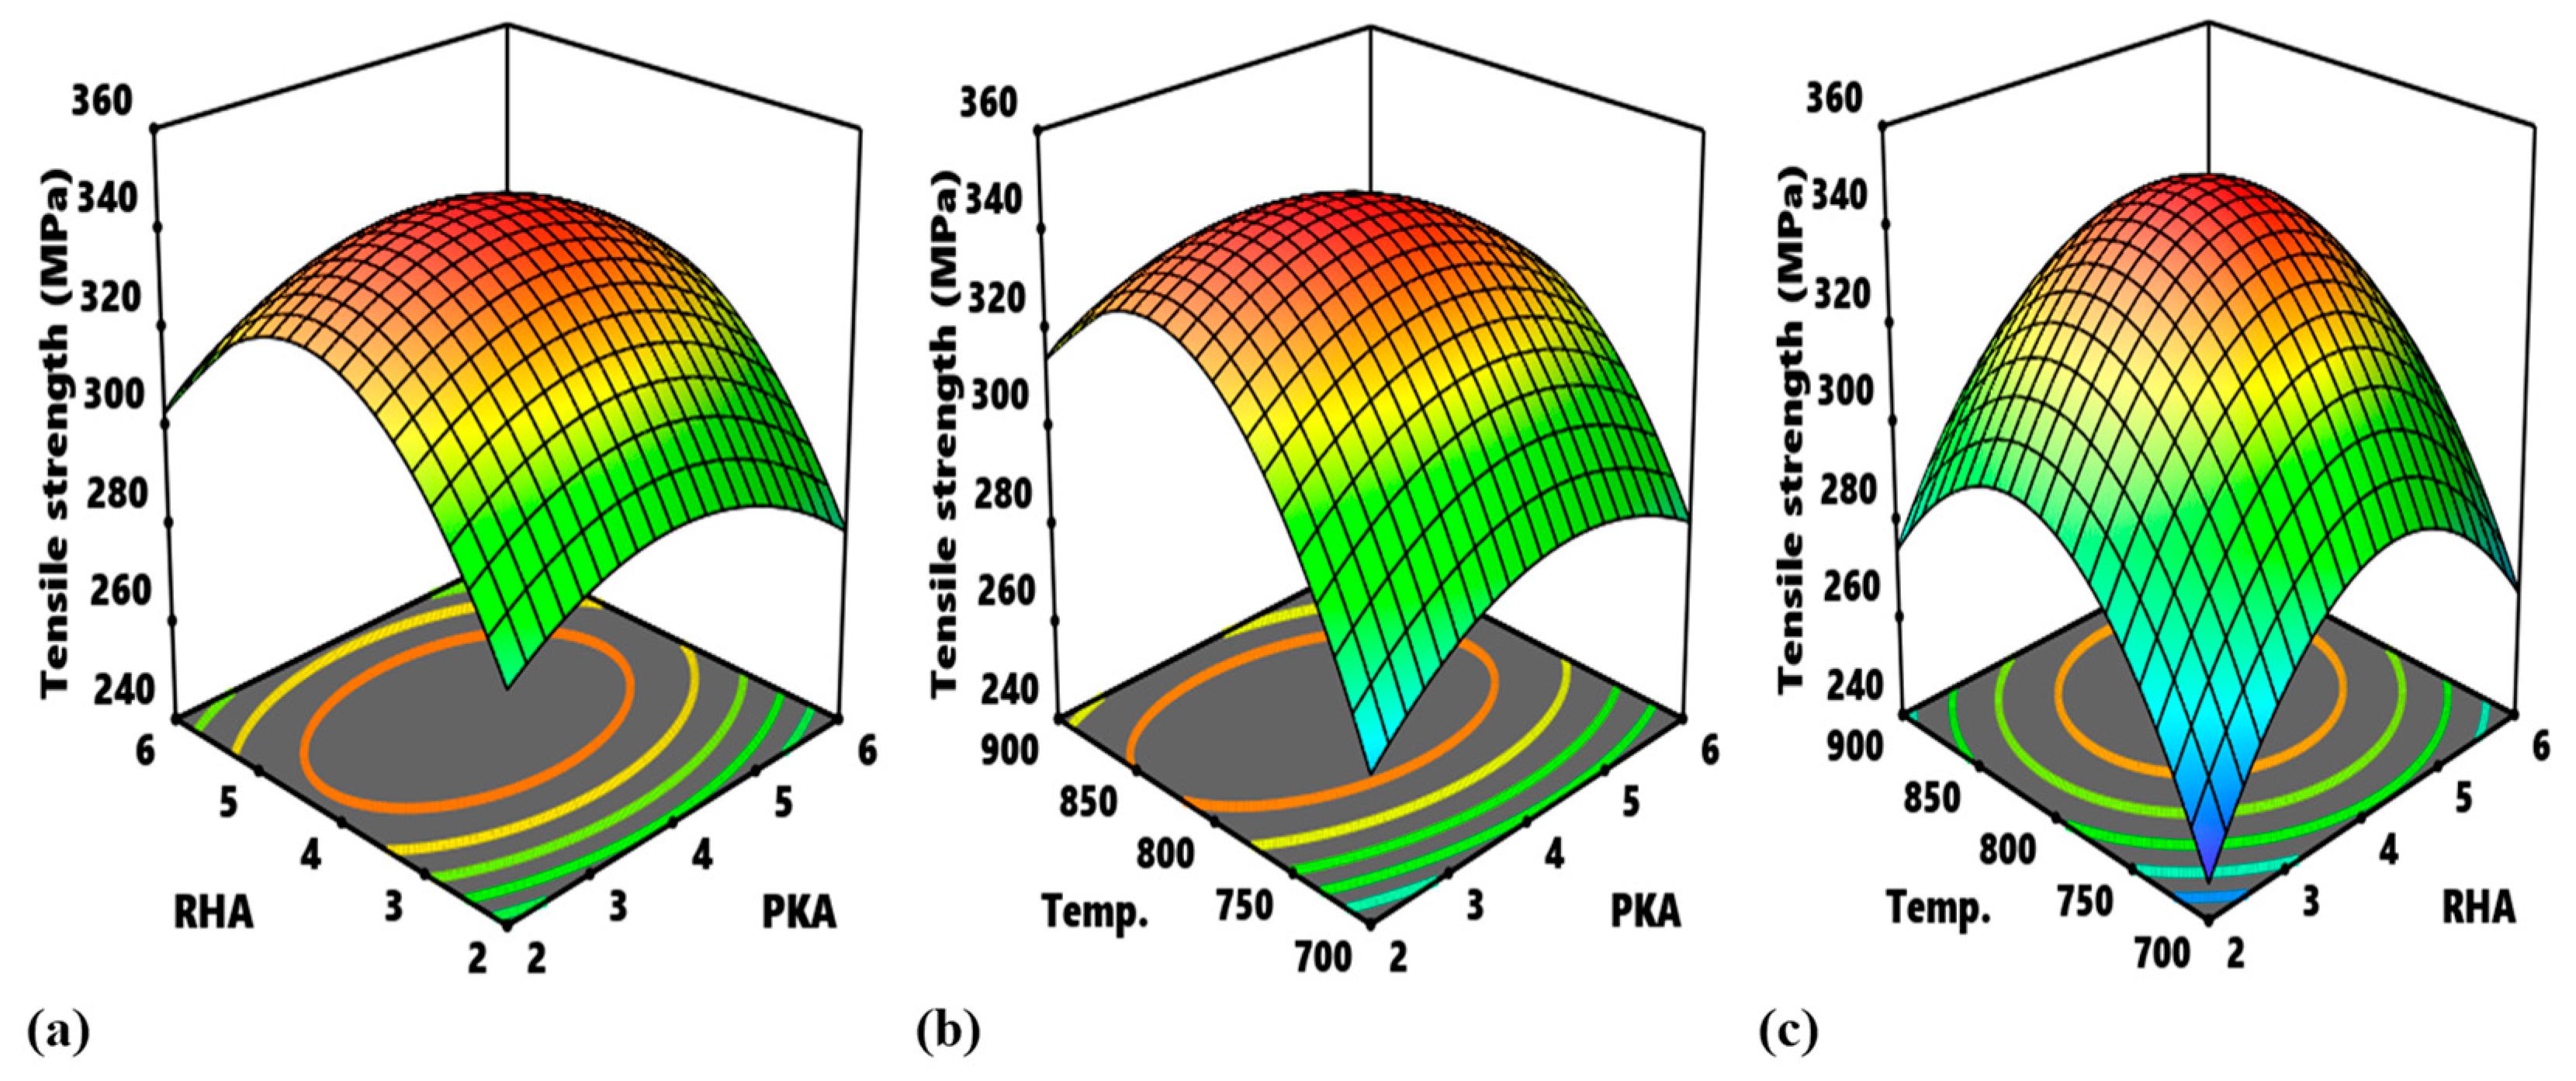
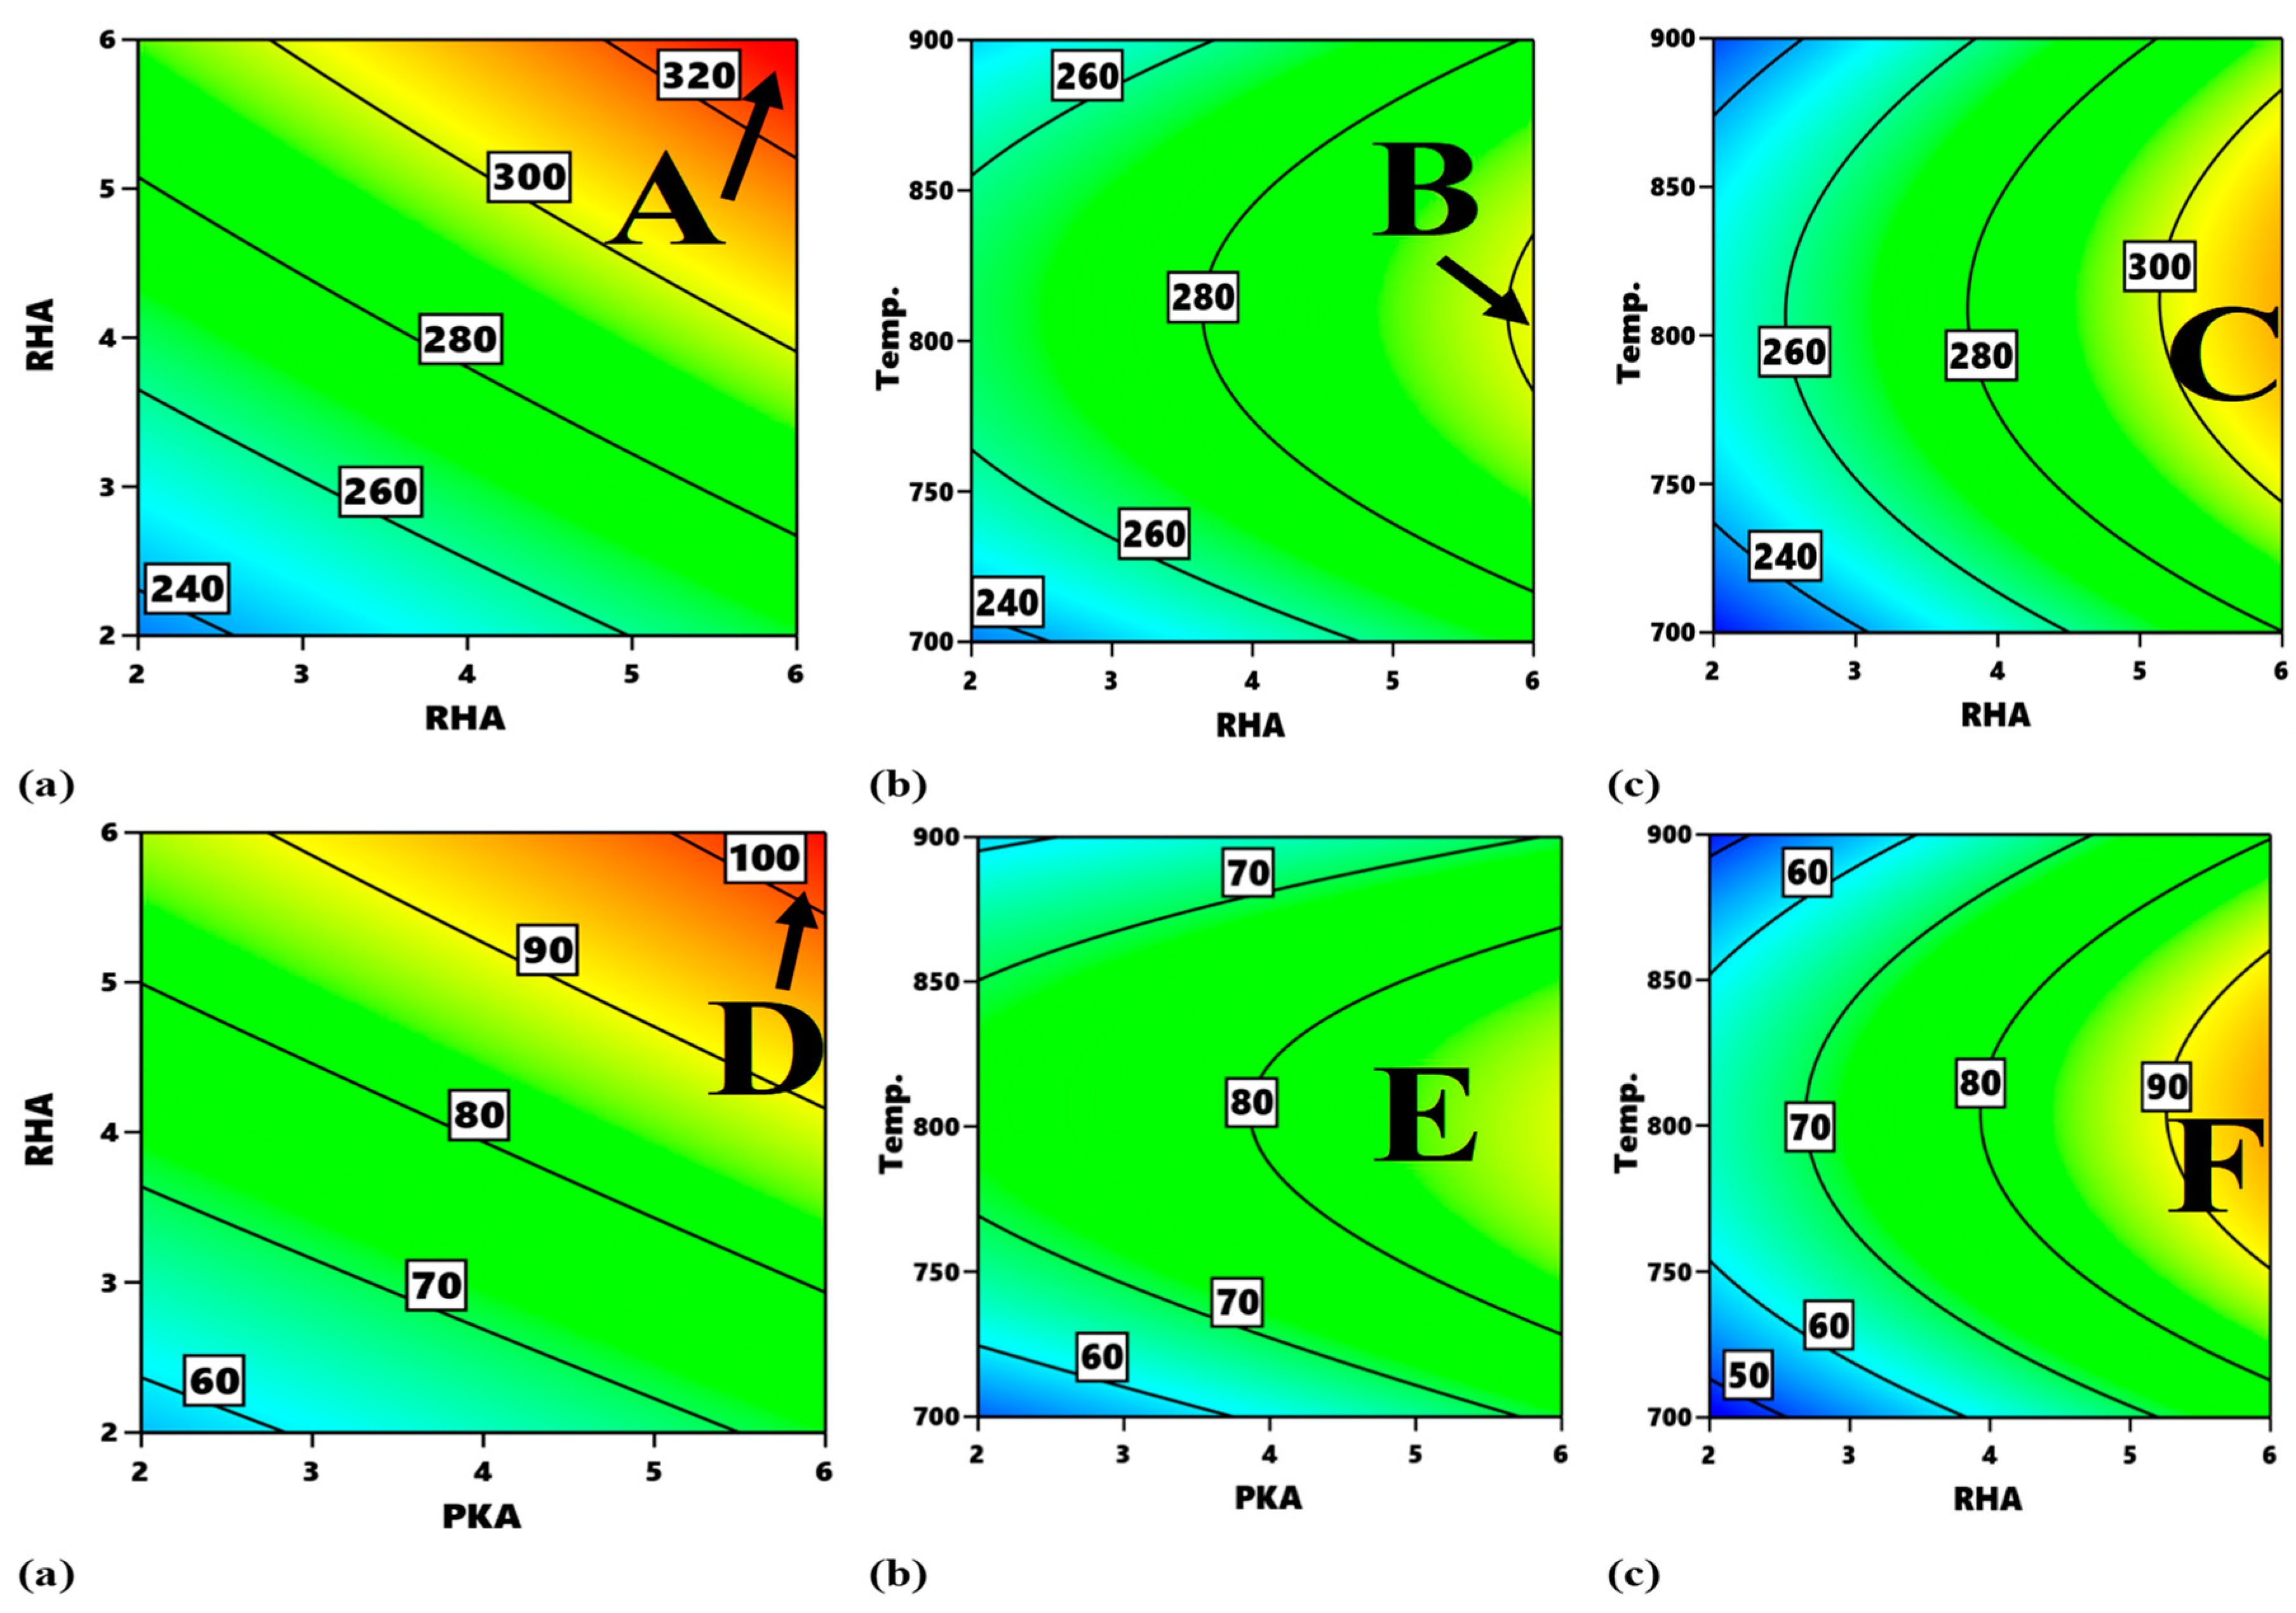
Figure 14 highlights the process map for the tensile strength and tensile modulus. In Figure 14a, the portions, labelled A, are the optimum zones for the interaction of PKA and RHA when maintaining a stirring temperature of 800 °C. The contour intervals in ascending order are indicated as 280–300 MPa, 300–320 MPa, 320–340 MPa, and 340–360 MPa. The interval of 340–360 MPa is the optimum zone for the optimization of flexural strength at a constant 800 °C. The corresponding input variables for the optimization are 2.75–4.7% PKA and 3.6–4.8% RHA. In the same way, in Figure 14b, as regards the interplay between PKA and temperature, the region labelled B is the optimum zone for the optimization of tensile strength when holding RHA constant at 4 wt.%. Hence, in optimizing tensile strength, the blend of 2.55–3.85 PKA with 4% (constant) RHA at the temperature of 780–865 °C is recommended. The contour plot for tensile strength at a constant value of 4 wt.% for the relationship “RHA vs. temperature” is identified in Figure 14c. Point C is the portion of the attainment of optimum tensile strength in the range of values of 340–360 MPa. That means that, for the optimization of tensile strength for that interaction, 3.6–4.9% RHA combined with 4% PKA can be employed at a temperature range of 785–860 °C.
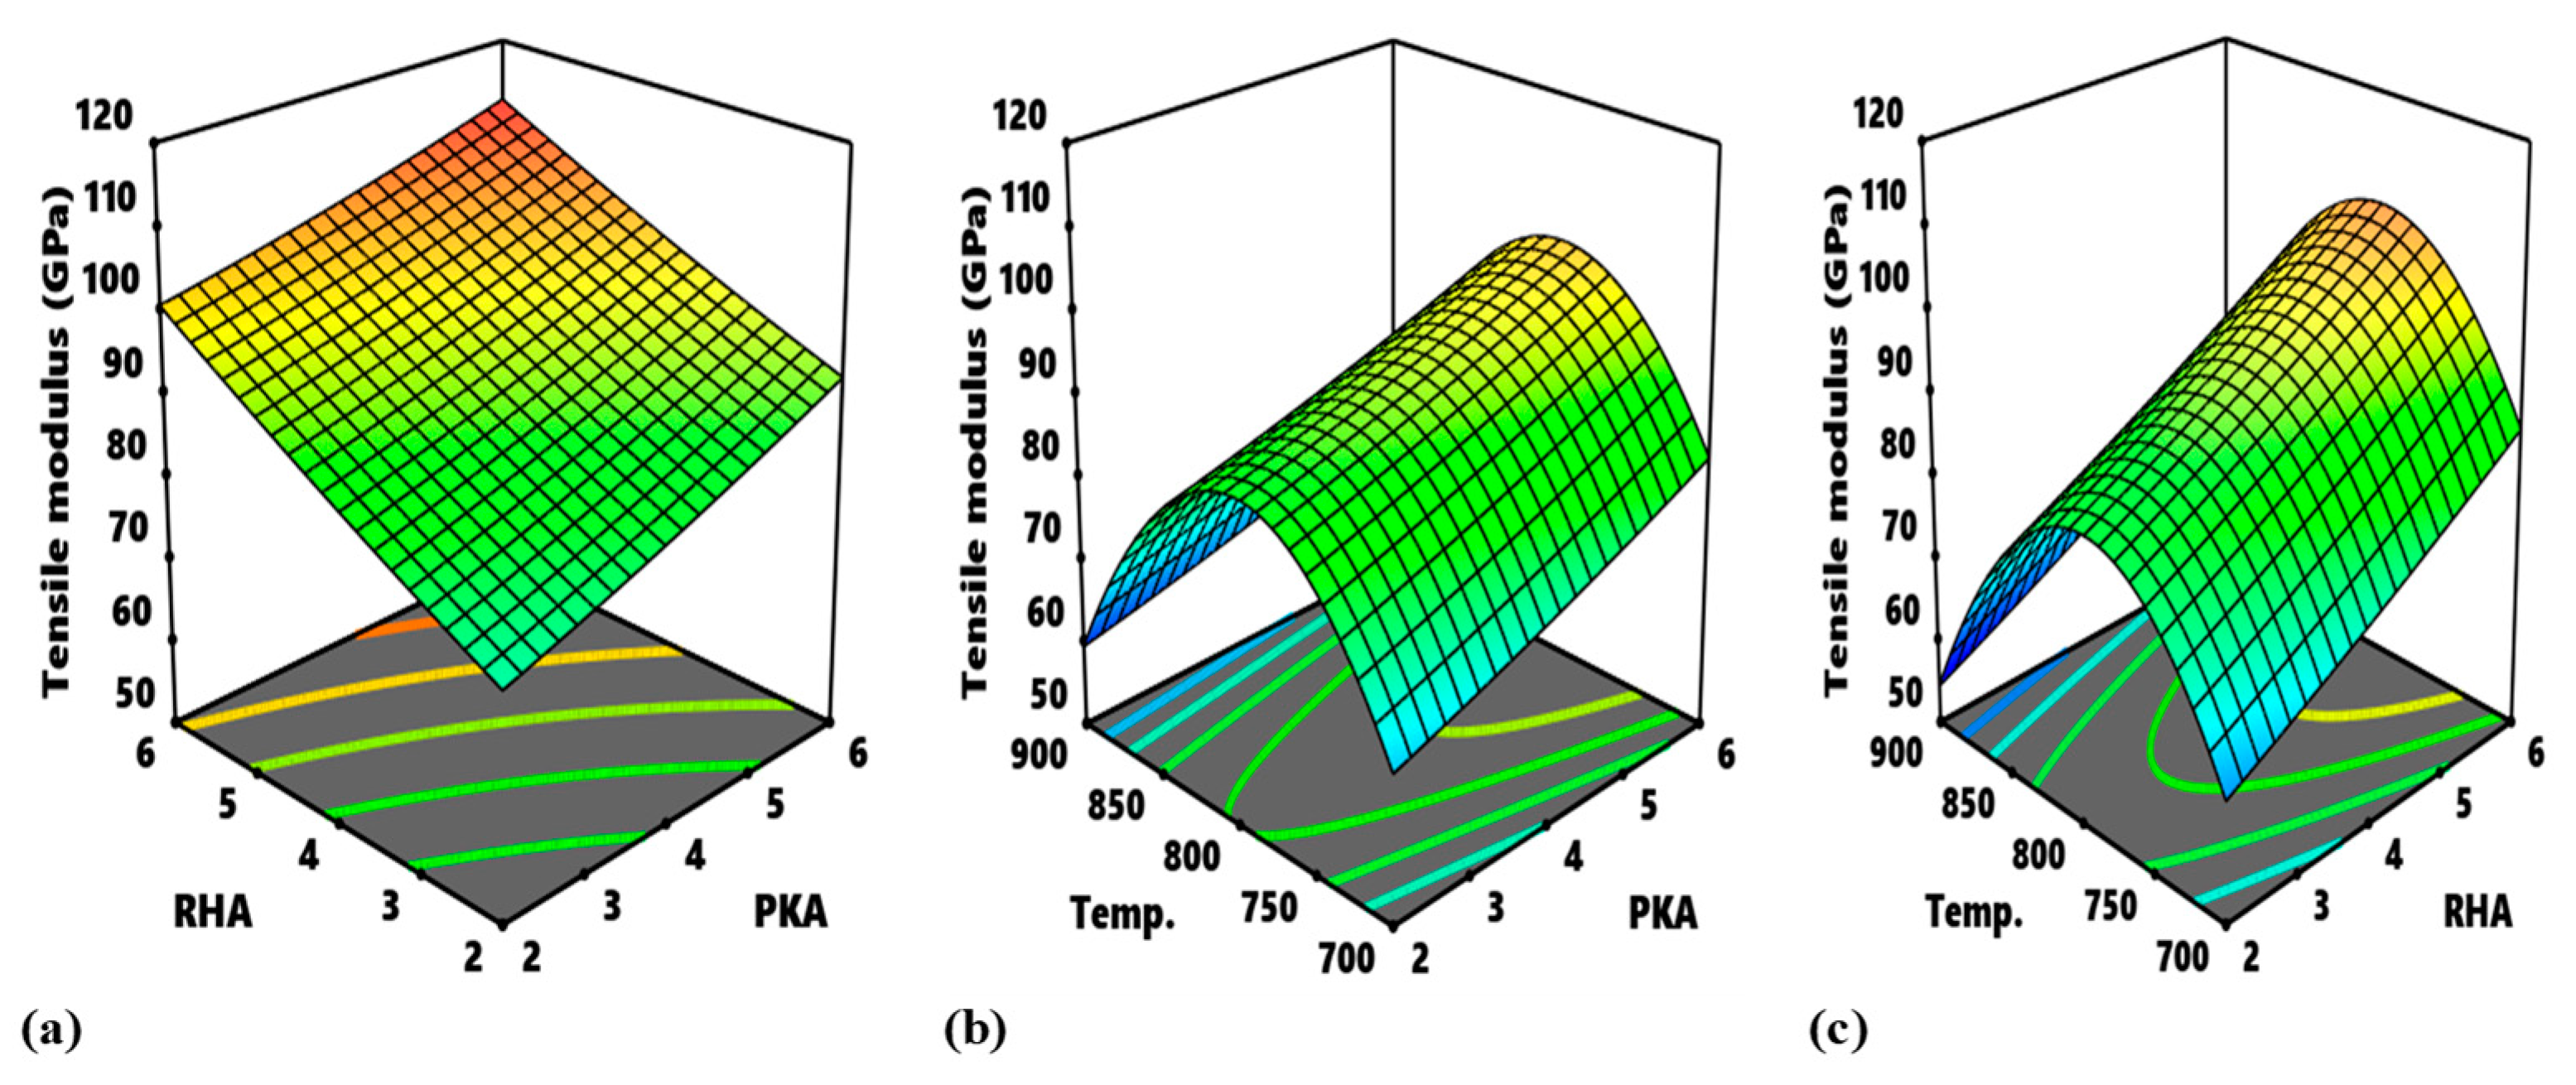
The contour plot for the interaction between PKA and RHA at an unchanging temperature of 800 °C with regard to tensile modulus is exhibited in Figure 14d and outlines the regions in which varying response values can be obtained. The optimal domain is marked D, and it’s the region for optimization of tensile modulus in-range value of 110–120 GPa. The input variable for the region is 5.5–6.0% PKA and 5.6–6.0% RHA. Figure 14e highlights the contour map for the interaction of PKA vs. temperature when sustaining RHA at 4%. The region marked E is the optimal area and values of 5.5–6.0% for PKA and 760–815 °C for temperature will suffice in the optimization of tensile modulus. In Figure 14f, the region labelled “F” is regarded as the optimal zone for the interaction between RHA and temperature. In optimizing flexural modulus within the identified region, input variables are stated to be in the range of 5.65–6% for RHA and 770–820 °C for temperature.
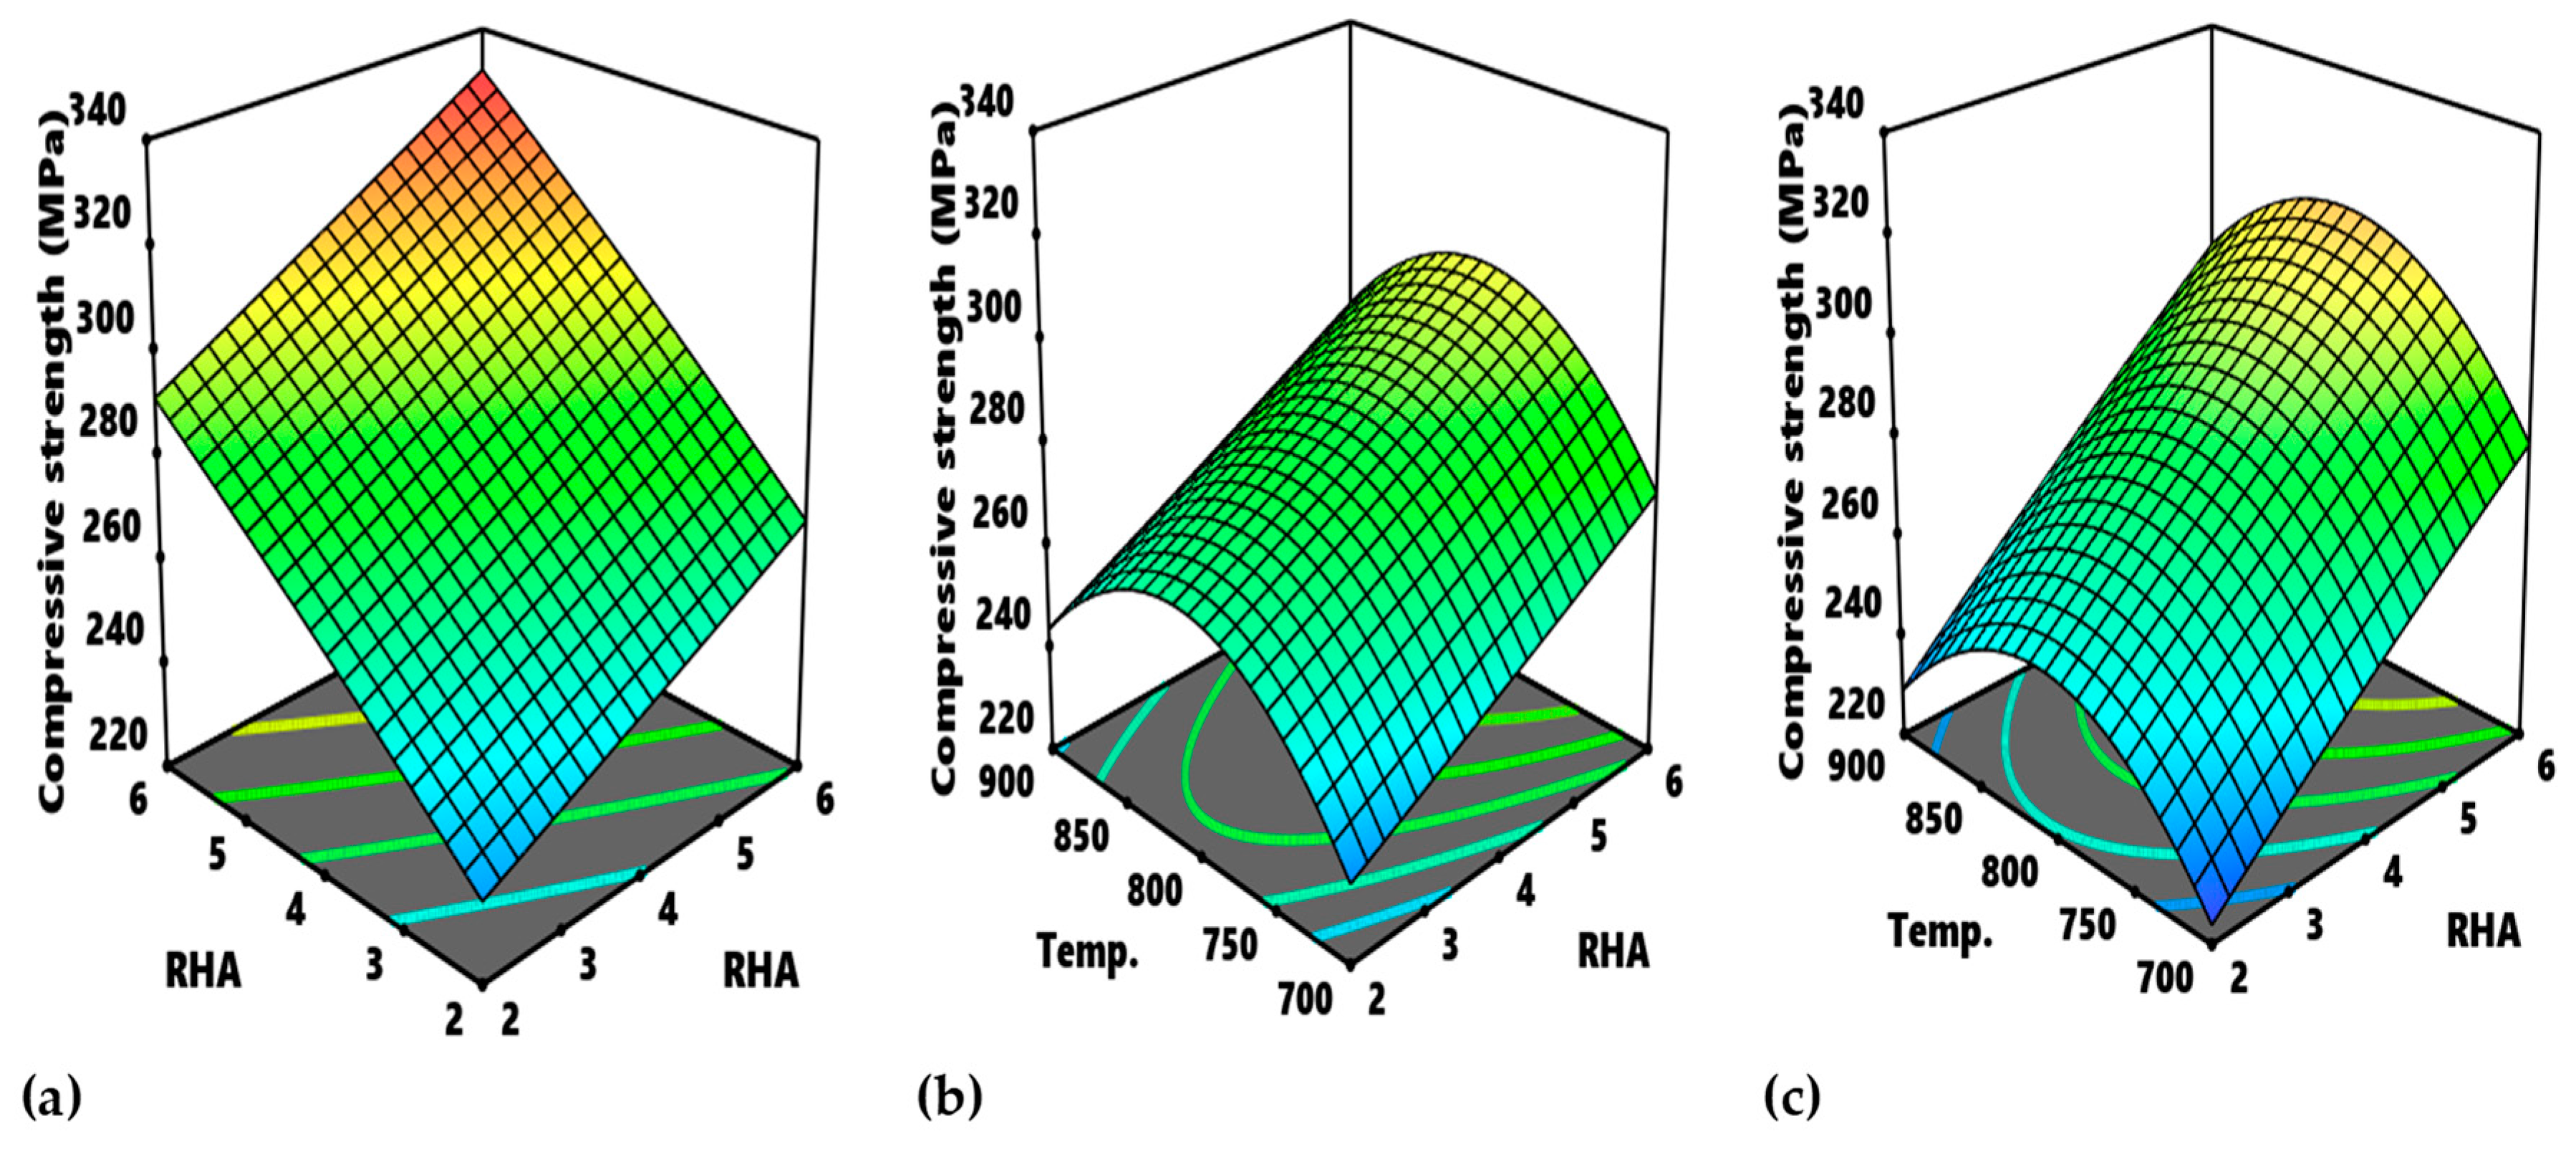
Figure 15 presents the contour plot for different interactions with respect to compressive strength and modulus. Figure 15a refers to the contour plot of the interaction between PKA vs. RHA pertaining to compressive strength. The optimum zone for the optimization of compressive strength for such interaction is indicated as “A”, corresponding to 4.6–6.0% PKA and 5.3–6.0% RHA. It, therefore, means that optimal compressive strength between 320 and 340 MPa is visible within that range of values. Likewise, in Figure 15b, as regards the interplay between PKA and temperature, the region labelled B is the optimum zone for the optimization of compressive strength when holding RHA constant at 4 wt.%. Therefore, in maximizing compressive strength response, the blend of 5.8–6.0% PKA with 4% (constant) RHA at a temperature of 725–825 °C is recommended. The contour plot for compressive strength at a constant value of 4 wt.% for the relationship “RHA vs. temperature” is showcased in Figure 15c. Point C is the portion of the attainment of optimum compressive strength in the range of values of 300–320 MPa. That means that, for optimization of the strength response for that interaction, 5.4–6.4% RHA combined with 4% PKA can be employed at a temperature range of 740–870 °C.
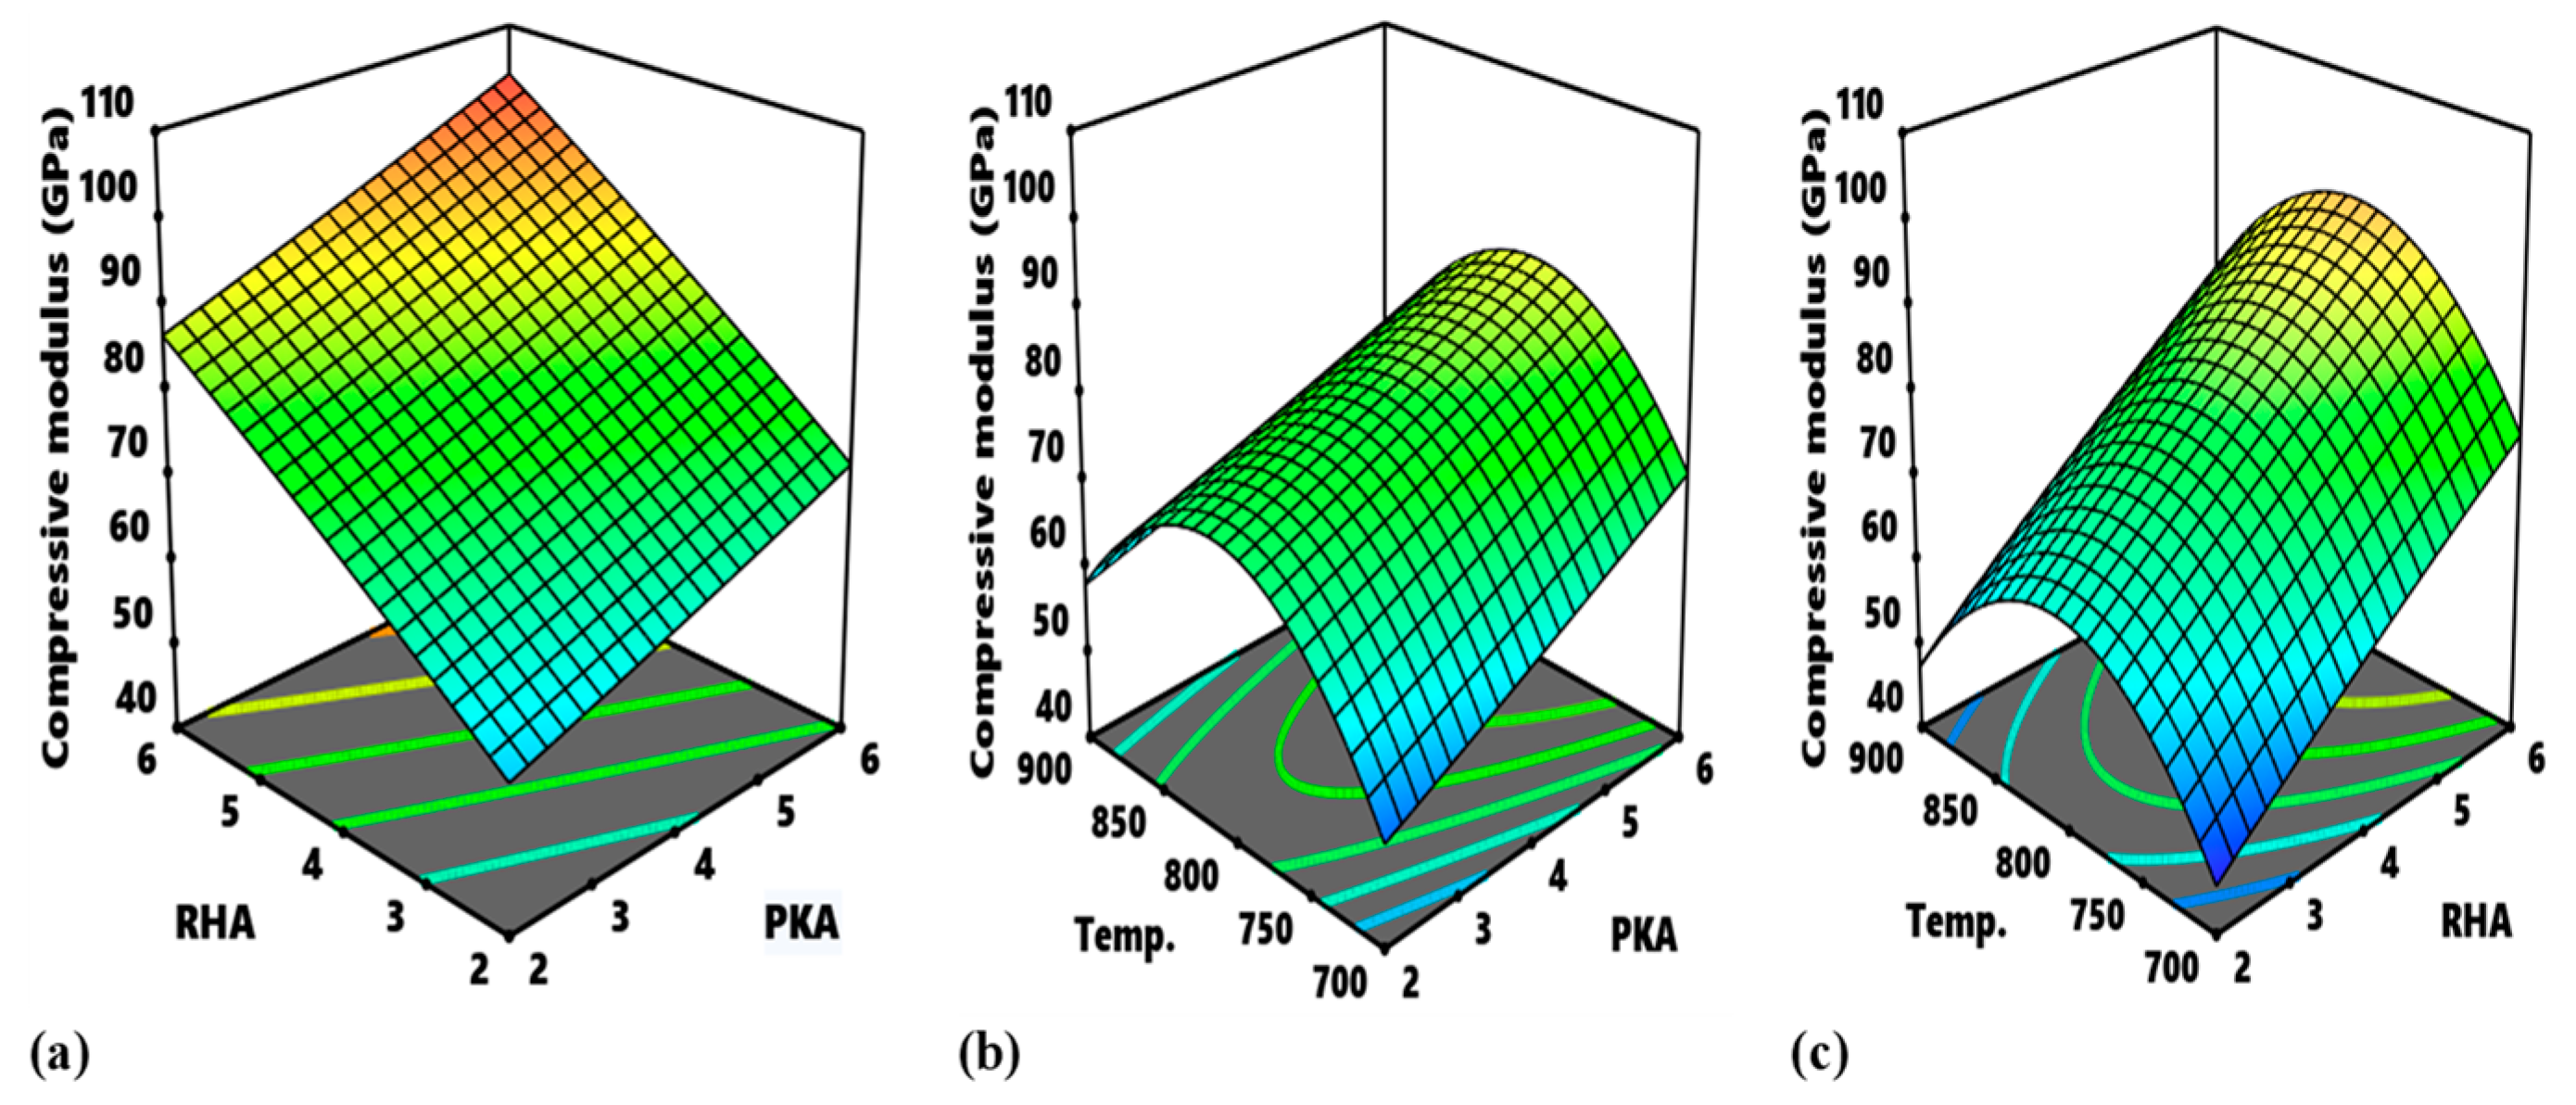
With respect to compressive modulus, the contour map for the relationship between PKA and RHA at an uninterrupted temperature of 800 °C is exhibited in Figure 15d, outlining the regions in which varying response values can be obtained. The optimal domain is marked D, and it’s the region for optimization of the modulus in-range value of 100–110 GPa. The input variable for the region is 5.3–6.9% PKA and 5.3–6.9% RHA. Figure 15e highlights the contour map for the interaction of PKA vs. temperature when sustaining RHA at 4%. The region marked E is the optimal area and values of 4.1–6.1% for PKA and 730–860 °C for temperature will suffice in the optimization of compressive modulus. In Figure 15f, the region labelled “F” is regarded as the optimal zone for the interaction between RHA and temperature. In optimizing compressive modulus within the identified region, input variables are stated to be in the range of 5.55–6.0% for RHA and 775–855 °C for temperature.
In 
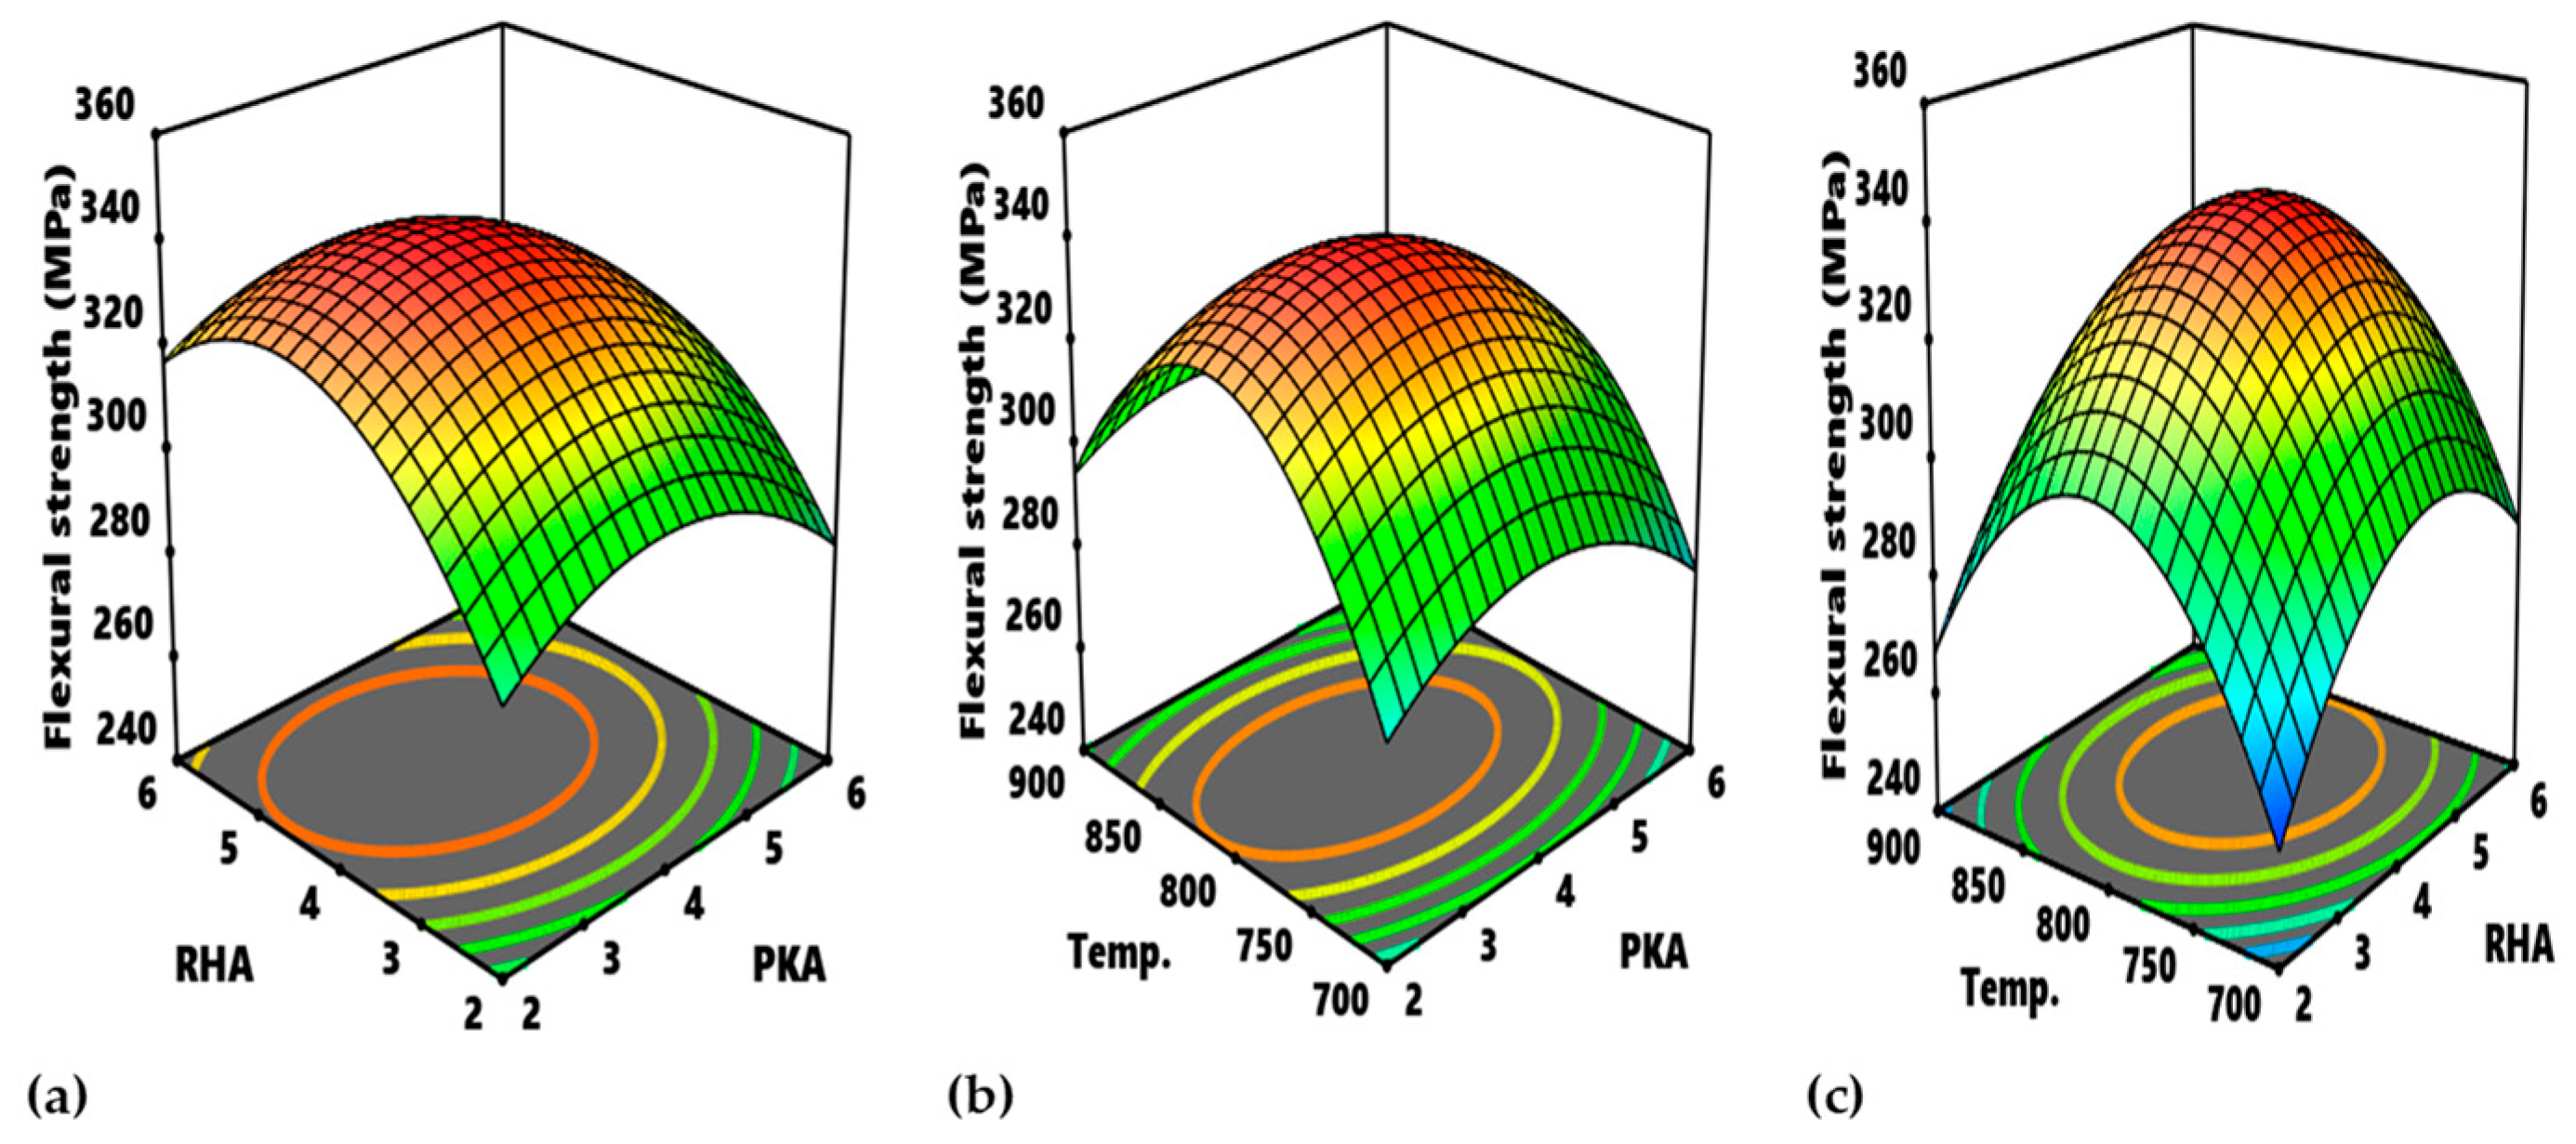
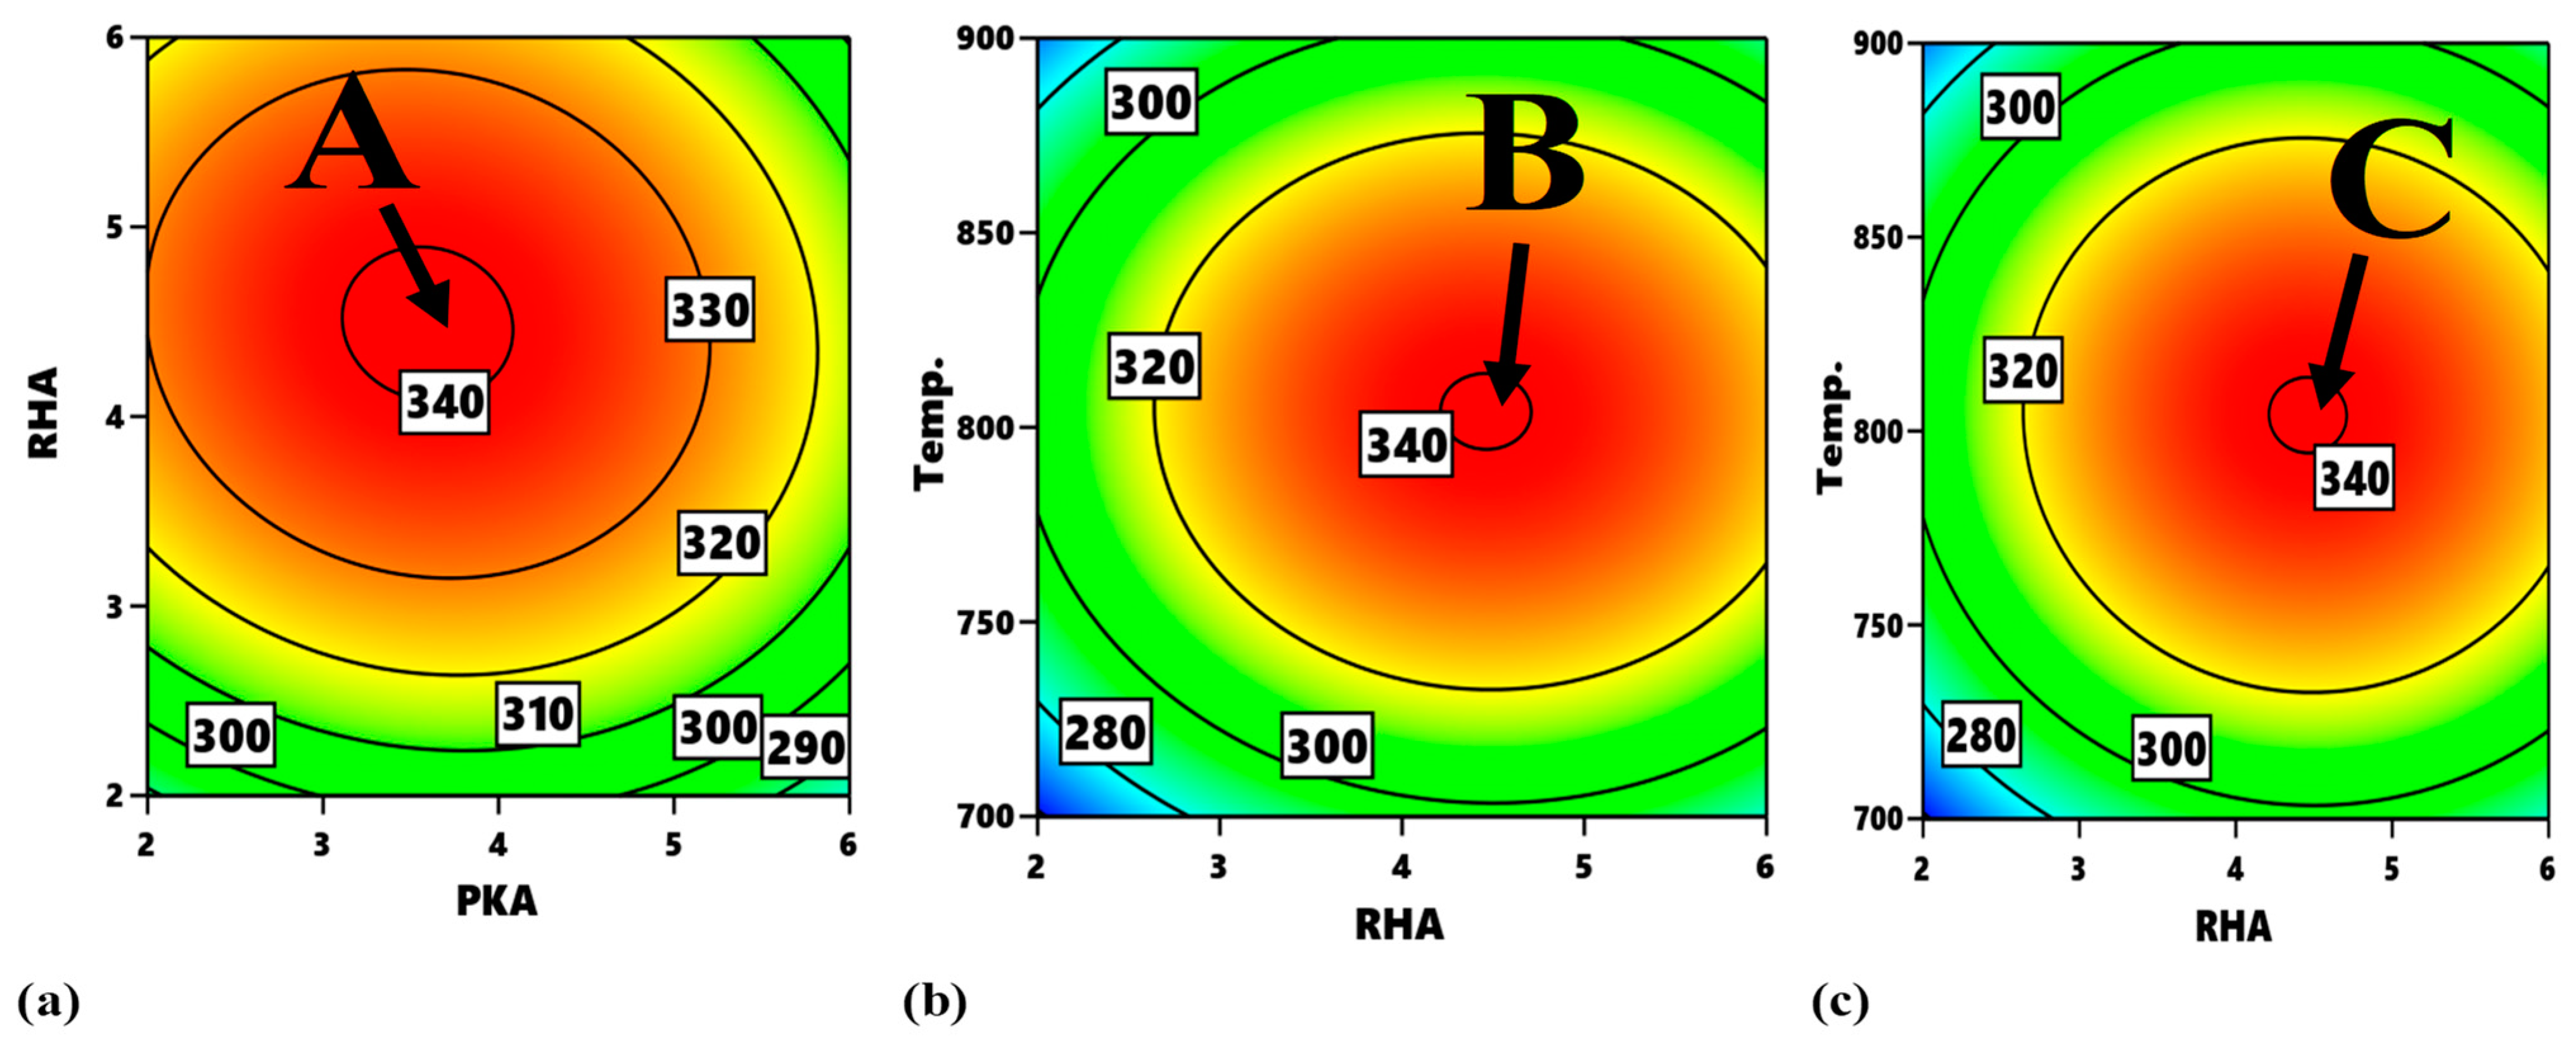
Figure 16, the contour plot of interactions between experimental variables with regard to flexural strength is identified. With reference to Figure 16a, the portions, labelled A, are the optimum zones for the interaction of PKA and RHA when maintaining the temperature at 800 °C. The corresponding input variables for the optimization are 4.2–4.83% PKA and 3.4–4.3% RHA. Similarly, Figure 16b displays the contour plot for the interplay between PKA and temperature. When RHA is held constant at 4 wt.%, the region labelled B is the optimum zone for optimizing flexural strength. When RHA is held constant at 4 wt.%, the region labelled B is the optimum zone for optimizing flexural strength. It is therefore estimated that the blend of 4.4–4.8 PKA with 4% (constant) RHA at a temperature of 792–817 °C will beget optimum flexural performance. The contour plot for the relationship “RHA vs. temperature” is identified in Figure 16c (at a constant value of 4 wt.%). Point C is the division of the plot maximizing flexural strength response within the range of values of 340–360 MPa. That means that, for optimization of flexural strength as regards the interaction, 4.4–4.6% RHA combined with 4% PKA can be employed at a temperature range of 790–823 °C.

3.6. Optimization and Result Validation

Optimization was effected with the response surface method via the engagement of design expert 13 software similar to [63,64,65,66,67]. Table 10 highlights the goal, lower and upper limits for optimizing the responses. Figure 17 depicts the outcome of the optimization procedure. In Figure 17, the red dots for the inputs are the points corresponding to the optimal value for each of the input variables between the range of input values, while the blue points correspond to the optimal values for each of the responses between the ranges of the response values obtained in this study. As obtained from the software, a combination of 4.80784~4.81% RHA and 5.41163~5.41% RHA at a temperature of 802.979~803 °C is predicted to yield optimum performance in the composite.
The software predicted 311.553 MPa, 94.4965 GPa, 328.616 MPa, 105.11 GPa, and 328.566 MPa for compressive strength, compressive modulus, tensile strength, tensile modulus, and flexural strength, respectively, with the desirability of 0.841 (Figure 17). To validate the predicted outcome, samples were prepared at optimum conditions and tested for their responses. Three specimens were prepared for each of the respective tests, and the mean results were recorded for each response. The validation procedure yielded the following results: 317.8 MPa (2.0% error), 98.9 GPa (4.7% error), 324.1 MPa (1.37% error), 102.3 GPa (2.6% error), and 334.1 MPa (1.7% error). Since the errors for each of the responses are less than 5%, there is therefore no significant discrepancy between the predicted outcome and the experimental outcome. Hence, the models are certified as statistically competent in the prediction of the property responses.

3.7. Morphology of the Optimized Specimen

The microstructural features of a sample prepared at optimum conditions are presented in Figure 18a. The elemental composition and XRD diffraction pattern are identified in Figure 18b,c. Figure 18a demonstrates how the particles are dispersed in the matrix. The PKA and RHA particles coexist with the steel particles. This, therefore, shows that a temperature of 803 °C is competent to uniformly disperse the particles at the stipulated dosages of the particles. The matrix reveals no significant presence of intermetallic phases as well as micro-pores. There is no presence of the intermetallic phase indicated in Figure 18a. The elemental compositions of the optimum specimen are indicated in Figure 18b. The EDS shows the presence of Fe, Si, Mn, Mg, and Al and their amounts. As compared with the pure Al6061 (Figure 1), the quantity is higher in the optimum specimen due to the presence of the additives. As a consequence of that, Al wt.% will be reduced a bit. The elemental distribution (Al, Si, Fe, Mn) is portrayed in Figure 18c–f, which shows the even distribution of the elements within the matrix. Al has the highest distribution on account of it being the matrix. The XRD pattern dispersion is identified in Figure 18g. Being the matrix, it displayed high peaks. There is the presence of silica phases owing to the reinforcement particle addition rich in silica. Peaks of Fe are identified based on the introduction of waste steel particles. From the pattern, there is no significant presence of the intermetallic phase.

4. Conclusions

In the present investigation, palm kernel shell ash (PKA) and rice husk ash (RHA) were blended in various compositions with 4 wt.% waste steel particulates in the Al6061 matrix. The microstructural features and strength performance of the composites were examined and the following conclusions were arrived at.
i.
The microstructural images displayed features that reflected the relationship between the properties of the composite and the microstructure. Reinforcing particles were dispersed at 700 °C and 800 °C even as 900 °C showed some intermetallics due to high-temperature reaction.
ii.
The ANOVA results demonstrated that the independent variables of the study (PKA, RHA, and stirring temperature) have appreciable effects on the responses.
iii.
PKA and RHA at 2–4% contributed to increased tensile and flexural strengths when compared with the pure Al6061, while 4–6% of the additives decreased strength values.
iv.
Tensile and compressive modulus and compressive strength were greatly improved between 2 and 6% of both particles.
v.
The surface and contour plots showed the responses were dependent on the mode of the interplay between the variables.
vi.
The optimum mix was obtained as 4.81% PKA, 5.41% RHA, and 803 °C and the predicted values of responses at that condition were 328.616 MPa, 105.011 GPa, 311.553 MPa, 94.4965 GPa, and 328.566 MPa for tensile strength, tensile modulus, compressive strength, compressive modulus, and flexural strength, respectively.
vii.
Confirmation results for the responses are 318 MPa, 99 GPa, 324 MPa, 102 GPa, and 334 MPa for respective responses. The deviation for each response is less than 5%, thereby validating the models.
viii.
The morphology of the optimized specimen revealed dispersion of the particles within the matrix, proving that the optimum mix is fit for the design of green-Al6061 as an automobile material.

Author Contributions

Conceptualization, A.A.A. (Abayomi Adewale Akinwande) and A.A.A. (Adeolu Adesoji Adediran); methodology, A.A.A. (Abayomi Adewale Akinwande) and O.A.B.; software, A.A.A. (Abayomi Adewale Akinwande) and A.A.A. (Adeolu Adesoji Adediran); validation, A.A.A. (Abayomi Adewale Akinwande), D.M., O.P.B., K.F.T. and M.S.K.; formal analysis, A.A.A. (Abayomi Adewale Akinwande) and A.A.A. (Adeolu Adesoji Adediran); investigation, A.A.A. (Abayomi Adewale Akinwande) and D.M.; resources, A.A.A. (Abayomi Adewale Akinwande), O.S.A. and A.A.A. (Adeolu Adesoji Adediran); data curation, A.A.A. (Abayomi Adewale Akinwande) and O.S.A.; writing—original draft preparation, A.A.A. (Abayomi Adewale Akinwande) and O.S.A.; writing—review and editing, A.A.A. (Abayomi Adewale Akinwande), O.S.A., A.A.A. (Adeolu Adesoji Adediran), O.A.B., D.M., O.P.B., K.F.T. and M.S.K.; supervision, A.A.A. (Abayomi Adewale Akinwande) and A.A.A. (Adeolu Adesoji Adediran); project administration, A.A.A. (Abayomi Adewale Akinwande) and A.A.A. (Adeolu Adesoji Adediran); funding acquisition, K.F.T. and A.A.A. (Adeolu Adesoji Adediran). All authors have read and agreed to the published version of the manuscript.

Funding

This research received no external funding.

Institutional Review Board Statement

Not applicable.

Informed Consent Statement

Not applicable.

Data Availability Statement

All data used in this report are presented herein.

Acknowledgments

The authors appreciate the Department of Mechanical Engineering Science, University of Johannesburg, South Africa for their support.

Conflicts of Interest

The authors declare no conflict of interest.

References

  1. Selvakumar, S.; Dinaharan, I.; Palanivel, R.; Babu, B.G. Development of stainless-steel particulate reinforced AA 6081 aluminium matrix composites with enhanced ductility using friction stir processing. Mater. Sci. Eng. A 2017, 685, 317–326. [Google Scholar] [CrossRef]
  2. Thirumoorthy, A.; Arjunan, T.V.; Kumar, K.L.S. Latest research development in aluminium matrix with particulate reinforcement composites—A review. Mater. Today Proc. 2018, 5, 1657–1665. [Google Scholar] [CrossRef]
  3. Wang, P.; Eckert, J.; Prashanth, K.G.; Wu, M.W.; Kaban, I.; Xi, L.X.; Scudino, S. A review of particulate-reinforced aluminium matrix composites fabricated by selective laser melting. Trans. Nonferrous Met. Soc. China 2020, 30, 2001–2034. [Google Scholar] [CrossRef]
  4. Olorunyolemi, O.C.; Ogunsanya, O.A.; Akinwande, A.A.; Balogun, O.A.; Kumar, M.S. Enhanced mechanical behaviour and grain characteristics of aluminium matrix composites by cold rolling and reinforcement addition (rice husk ash and coal fly ash). J. Process Mech. Eng. Part E 2022, 1–13, in press. [Google Scholar] [CrossRef]
  5. Bhoi, N.K.; Singh, H.; Pratap, S. Development in the aluminium metal matrix composites reinforced by micro/nano particles—A review. J. Compos. Mater. 2019, 54, 813–833. [Google Scholar] [CrossRef]
  6. Saikrupa, C.; Reddy, C.G.M.; Venkatesh, S. Aluminium metal matrix composites and effect of reinforcement—A review. IOP Conf. Ser. Mater. Sci. Eng. 2021, 1057, 012098. [Google Scholar] [CrossRef]
  7. Akinwande, A.A.; Balogun, O.A.; Romanovski, V.; Danso, H.; Ademati, O.A.; Adetula, Y.V. Recycling of synthetic waste wig fiber in the production of cement-adobe for building envelope: Physio-hydric properties. Environ. Sci. Pollut. Res. 2022, 29, 34075–34091. [Google Scholar] [CrossRef]
  8. Akinwande, A.A.; Balogun, O.A.; Romanovski, V.; Danso, H.; Kamarou, M.; Ademati, A.O. Mechanical performance and Taguchi optimization of kenaf fiber/cement-paperboard composite for interior application. Environ. Sci. Pollut. Res. 2022, 29, 52675–52688. [Google Scholar] [CrossRef]
  9. Akinwande, A.A.; Folorunso, D.O.; Balogun, O.A.; Romanovski, V. Mathematical modelling, multi-objective optimization, and compliance reliability of paper-derived eco-composites. Environ. Sci. Pollut. Res. 2022, 29, 70135–70157. [Google Scholar] [CrossRef]
  10. Barnabas, A.A.; Balogun, O.A.; Akinwande, A.A.; Ogbodo, J.F.; Ademati, A.O.; Dongo, I.E.; Romanovksi, V. Reuse of walnut shell waste in the development of fired ceramics bricks. Environ. Sci. Pollut. Res. 2022. [Google Scholar] [CrossRef]
  11. Bahrami, A.; Soltani, N.; Pech-Canul, M.I.; Gutierrez, C.A. Development of metal-matrix composites from industrial/agricultural waste material and their derivatives. Crit. Rev. Environ. Sci. Technol. 2015, 46, 143–208. [Google Scholar] [CrossRef]
  12. Ikubanni, P.P.; Oki, M.; Adeleke, A.A.; Omoniyi, P.O. Synthesis, physio-mechanical and microstructural characterization of Al6063/SiC/PKSA hybrid reinforced composites. Sci. Rep. 2021, 11, 14845. [Google Scholar] [CrossRef]
  13. Talabi, H.K.; Ojomo, A.M.; Folorunso, O.E.; Akinfolarin, J.F.; Kumar, P.J.; Akinwande, A.A.; Kumar, M.S. Development of hybrid aluminium alloy composites modified with locally sourced environmental wastes. Adv. Mater. Process. Technol. 2022. [Google Scholar] [CrossRef]
  14. Gladston, J.A.K.; Sheriff, N.M.; Dinaharan, I.; Selvan, J.D.R. Production and characterization of rice husk ash particulate reinforced AA 6061 aluminium alloy composites by compocasting. Trans. Non-Ferr. Metall. Soc. China 2015, 25, 683–691. [Google Scholar] [CrossRef]
  15. Saravanan, S.D.; Senthilkumar, M.; Shankar, S. Effect of particle size of tribological behaviour of rice husk ash-reinforced aluminium alloy (AlSi10Mg) matrix composites. Tribol. Trans. 2013, 56, 1156–1167. [Google Scholar] [CrossRef]
  16. Mishra, P.; Mishra, P.; Rana, R.S. Effect of rice husk ash reinforcement on mechanical properties of aluminium alloy (LM 6) matrix composites. Mater. Today Proc. 2017, 5, 6018–6022. [Google Scholar] [CrossRef]
  17. Udoye, N.E.; Nnamba, O.J.; Fayomi, O.S.I.; Inegbenebor, A.O.; Jolayemi, K.J. Analysis on mechanical properties of AA 6061/rice husk ash composites produced through stir casting technique. Mater. Today Proc. 2020, 43, 1415–1420. [Google Scholar] [CrossRef]
  18. Edoziuno, F.O.; Nwaeju, C.C.; Adediran, A.A.; Odoni, B.U.; Prakash, V.R.A. Mechanical and microstructural characteristics of aluminium 6063 alloy/palm kernel shell composites for light weight application. Sci. Afr. 2021, 12, e00781. [Google Scholar] [CrossRef]
  19. Panda, B.; Niranjan, C.A.; Vishwanatha, A.D.; Harisha, P.; Chandan, K.R.; Kumar, R. Development of novel stir cast aluminium composite with modified coconut shell ash filler. Mater. Today Proc. 2020, 22, 2715–2724. [Google Scholar] [CrossRef]
  20. Kolappan, S.; Arunkumar, T.; Mohanavel, V.; Subramani, K.; Kailasanathan, C.; Kumaran, P.; Subbiah, R.; Kumar, S.S. Experimental investigation on stir casted hybrid composite AA 7068 with SiC and coconut shell fly ash. Mater. Today Proc. 2022, 62, 5540–5545. [Google Scholar] [CrossRef]
  21. Kulkarni, P.P.; Siddeswarappa, B. A study on microstructure and mechanical behaviour of AA 6063 metal matrix composites reinforced with areca shealth ash and rice husk ash. Mater. Today Proc. 2022, 52, 445–451. [Google Scholar] [CrossRef]
  22. Kulkami, P.P.; Siddeswarappa, B.; Kumar, K.S.H. A survey of effect of agro waste ash as reinforcement on aluminium base metal matrix composites. J. Compos. Mater. 2019, 9, 312–326. [Google Scholar] [CrossRef]
  23. Tiwari, S.K.; Rao, A.U.; Dasgotra, A.; Kona, S. Characterization of aluminium-fly ash composite fabricated by stir casting technique. Mater. Today Proc. 2021, 46, 2179–2182. [Google Scholar] [CrossRef]
  24. Kumar, P.; Sharma, S.; Kandpal, B.C. Synthesis and mechanical characterization of biomass fly ash strengthened aluminium matrix composites. Mater. Today Proc. 2019, 26, 266–272. [Google Scholar] [CrossRef]
  25. Patil, A.; Banapurmath, N.R.; Hunashyal, A.M.; Hallad, S. Enhancement of mechanical properties by the reinforcement of fly ash in aluminium metal matrix composites. Mater. Today Proc. 2020, 12, 1654–1659. [Google Scholar] [CrossRef]
  26. Prakash, J.U.; Sadhana, A.D.; Ananth, S.; Pillai, K.V.A. Optimization of wear parameters of aluminium matrix composites (LM6/Fly, Ash) using Taguchi, Technique. Mater. Today Proc. 2020, 39, 1543–1548. [Google Scholar] [CrossRef]
  27. Adediran, A.A.; Akinwande, A.A.; Balogun, O.A.; Adesina, O.S.; Olayanju, A.; Mojisola, T. Evaluation of the properties of Al-6061 alloy reinforced with particulate waste glass. Sci. Afr. 2021, 12, e00812. [Google Scholar] [CrossRef]
  28. Sinshaw, Y.; Sirahbizu, B.; Palami, S.; Prakash, U. Mechanical property analysis of glass reinforced aluminium matrix composites. Mechanical property analysis of glass particulates reinforced aluminium matrix composites. Mater. Today Proc. 2022, 62, 488–494. [Google Scholar] [CrossRef]
  29. Akinwande, A.A.; Adediran, A.A.; Balogun, O.A.; Yibowei, M.E.; Barnabas, A.A.; Talabi, H.K.; Olorunfemi, B.J. Optimization of selected casting parameters on the mechanical behavior of Al 6061/glass powder composites. Heliyon 2022, 8, e09350. [Google Scholar] [CrossRef]
  30. Akinwande, A.A.; Balogun, O.A.; Romanovski, V. Modelling, multi-response optimization, and performance reliability of green metal composites produced from municipal wastes. Environ. Sci. Pollut. Res. 2022. [Google Scholar] [CrossRef]
  31. Balogun, O.A.; Akinwande, A.A.; Adediran, A.A.; Ogunsaya, O.A.; Ademati, A.O.; Kumar, M.S.; Erinle, T.J.; Akinlabi, E.T. Microstructure and particle size effects on selected mechanical properties of waste glass-reinforced aluminium matrix composites. Mater. Today Proc. 2022, 62, 4589–4598. [Google Scholar] [CrossRef]
  32. Chinta, N.D.; Selvaraj, N.; Mahesh, V. Mechanical characterization of aluminium-red mud metal matrix composites. Mater. Today Proc. 2018, 5, 26911–26917. [Google Scholar] [CrossRef]
  33. Harshavardhan, R.; Anil, K.C.; Rao, K.V.S. Evaluation of fracture toughness of red mud reinforced aluminium matrix composite. Mater. Today Proc. 2018, 5, 24854–24861. [Google Scholar] [CrossRef]
  34. Panwar, N.; Chauhan, A.; Pali, H.S.; Sharma, M.D. Fabrication of aluminium 6061 red-mud composites using stir casting and micro structure observation. Mater. Today Proc. 2020, 21, 2014–2023. [Google Scholar] [CrossRef]
  35. Adeosun, S.O.; Oyetunji, A.; Akpan, E.I. Strength and ductility of forged 1200 aluminium alloy reinforced with steel particles. Niger. J. Technol. 2015, 34, 710–715. [Google Scholar] [CrossRef]
  36. Liu, C.Y.; Wang, Q.; Jia, Y.Z.; Zhang, B.; Jing, R.; Ma, M.Z.; Jing, Q.; Liu, R.P. Effect of W particles on the properties of accumulatively roll-bonded Al/W composites. Mater. Sci. Eng. A 2012, 547, 120–124. [Google Scholar] [CrossRef]
  37. El-Sabbagah, A.; Soliman, M.; Taha, M.; Palkowski, H. Hot rolling behaviour of stir-cast Al6061 and Al 6082 alloys—SiC fine particulates reinforced composites. J. Mater. Process. Technol. 2011, 212, 497–508. [Google Scholar] [CrossRef]
  38. ByraReddy, B.; Bharathesh, T.P.; Shiva, D.P. Effect of hot rolling on microstructure and mechanical behaviour of B4C nano particles reinforced Al 6063 alloy composites. J. Mech. Civ. Eng. 2021, 18, 53–62. [Google Scholar] [CrossRef]
  39. Springer, H.; Baron, C.; Szczepaniak, A.; Uhlenwinkel, V.; Raabe, D. Stiff, light, strong and ductile: Nano-structured high modulus steel. Sci. Rep. 2017, 7, 2757. [Google Scholar] [CrossRef]
  40. Yamasaki, S.; Okuhira, T.; Mitsuhara, M.; Nakashima, H.; Kusui, J.; Adachi, M. Effect of Fe addition on heat-resistance aluminium alloys produced by selective laser melting. Metals 2019, 9, 468. [Google Scholar] [CrossRef] [Green Version]
  41. Akinwande, A.A.; Adediran, A.A.; Balogun, O.A.; Olorunfemi, B.J.; Kumar, M.S. Optimization of flexural strength of recycled polyethylene-terephthalate (PET) eco-composite using response surface methodology. E3S Web Conf. 2021, 309, 01094. [Google Scholar] [CrossRef]
  42. ASTM E8/E8M; Standard Test Methods for Tension Testing of Metallic Materials. ASTM International: Conshohocken, PA, USA, 2009. [CrossRef]
  43. ASTM E09-9; Standard Test Methods for Compression Testing of Metallic Materials at Room Temperature. ASTM International: Conshohocken, PA, USA, 2009. [CrossRef]
  44. Das, D.K.; Roy, M.P.; Satpathy, B.K.; Nanda, R.K. Nayak, Compressive, impact and flexural behavior of Al based metal matrix composites. Mater. Today Proc. 2019, 18, 3080–3086. [Google Scholar] [CrossRef]
  45. ASTM D3906-03; Standard Test Methods for Determination of Relative X-Ray Diffraction Intensities of Faujasite-Type, Zeolite-Containing Materials. ASTM International: Conshohocken, PA, USA, 2013. [CrossRef]
  46. Dwiwedi, S.K.; Srivastava, A.K.; Sugimoto, K.I.; Chopkar, M. Microstructural and mechanical characterization of chicken eggshell-reinfoced Al6061 matrix composites. Open J. Metal. 2018, 8, 1–13. [Google Scholar] [CrossRef]
  47. Imoisili, P.E.; Ukoba, K.O.; Jen, T.C. Synthesis and characterization of amrorphous mesoporous silica from palm kernel shell ash. Bol. La Soc. Esp. Ceram. Vidrio. 2019, 59, 159–164. [Google Scholar] [CrossRef]
  48. Imoisili, P.E.; Ukoba, K.O.; Jen, T.C. Green technology extraction and characterization of silica nanoparticles from palm kernel shell ash via sol-gel. J. Mater. Res. Technol. 2020, 9, 307–313. [Google Scholar] [CrossRef]
  49. Farooque, K.N.; Zaman, M.; Halim, E.; Islam, S.; Hossain, M.; Mollah, Y.A.; Mahmood, A.J. Characterization and utilization of rice husk ash (RHA) from rice mill of Bangladesh. Bangladesh J. Sci. Ind. Res. 2009, 44, 157–162. [Google Scholar] [CrossRef]
  50. Boostani, A.F.; Tahamtan, S.; Jian, Z.Y.; Wei, D.; Yazdani, S.; Chosroshaki, R.A.; Mousavian, R.T.; Xu, J.; Zhang, X.; Gong, D. Enhanced tensile properties of aluminium matrix composites reinforced with graphene encapsulated SiC nanoparticles. Compos. Part A. 2015, 68, 155–163. [Google Scholar] [CrossRef] [Green Version]
  51. Negi, A.S.; Shanmugasundaram, T. Hybrid particles dispersion strengthened aluminium metal matrix composite processed by stir casting. Mater. Today Proc. 2020, 39, 1210–1214. [Google Scholar] [CrossRef]
  52. Shin, S.; Park, H.; Park, B.; Lee, S.B.; Lee, S.K.; Kim, Y.; Chao, S.; Jo, I. Dispersion mechanism and mechanical properties of SiC reinforcement in aluminium matrix composites through stir-and die-casting processes. Appl. Sci. 2021, 11, 952. [Google Scholar] [CrossRef]
  53. Moses, J.J.; Dinaharan, I.; Sekhar, S.J. Prediction of influence of process parameters on tensile strength of AA 6061/TiC aluminium matrix composites produced using stir casting. Trans. Nonferrous Met. Soc. China 2016, 26, 1498–1511. [Google Scholar] [CrossRef]
  54. Ali, M. Review of stir casting technique and technical challenges for ceramic reinforcement particulate and aluminium matrix composites. J. Silic. Based Compos. Mater. 2020, 6, 198–204. [Google Scholar] [CrossRef]
  55. Adediran, A.A.; Akinwande, A.A.; Balogun, O.A.; Olorunfemi, B.J.; Kumar, M.S. Optimization studies of stir casting parameters and mechanical properties of TiO2 reinforced Al 7075 composite using response surface methodology. Sci. Rep. 2021, 11, 19860. [Google Scholar] [CrossRef] [PubMed]
  56. Ogunsanya, O.A.; Akinwande, A.A.; Balogun, O.A.; Romanovski, V.; Kumar, M.S. Mechanical and damping behavior of artificially aged Al 6061/TiO2 reinforced composites for aerospace applications. Part. Sci. Technol. 2022, 41, 196–208. [Google Scholar] [CrossRef]
  57. Chaubey, A.K.; Scudino, S.; Mukhopadhyay, N.K.; Khoshkhoo, M.S.; Mishra, B.K.; Eckert, J. Effect of particle dispersion on the mechanical behaviour of Al-based metal matrix composites reinforced with nanocrystalline Al-Ca intermetallics. J. Alloy. Compd. 2012, 5365, 5134–5137. [Google Scholar] [CrossRef]
  58. Mozammil, S.; Verma, P.; Karloopia, J.; Jha, P.K. Investigation and measurement of porosity in Al + 4.5Cu/6 wt.% TiB2 insitu composites: Optimization and statistical Modelling. J. Mater. Res. Technol. 2020, 9, 8041–8057. [Google Scholar] [CrossRef]
  59. Taylor, J.A. Iron-containing intermetallic phases in Al-Si based casting alloys. Procedia Mater. Sci. 2012, 1, 19–33. [Google Scholar] [CrossRef]
  60. Matthew, J.; Remy, G.; Williams, M.A.; Tang, F.; Srirangam, P. Effect of Fe intermetallics on microstructure and properties of Al-Si alloys. J. Mater. 2019, 71, 4362–4369. [Google Scholar] [CrossRef] [Green Version]
  61. Ling, B.; Li, H.; Xu, R.; Shi, Y.; Xiao, H.; Zhang, W.; Lu, K. Precipitation of iron-rich intermetallic and mechanical properties of Al-Si-Mg-Fe alloys with Al-5Ti-B. Mater. Sci. Technol. 2018, 34, 2145–2152. [Google Scholar] [CrossRef]
  62. Akinwande, A.A.; Folorunso, D.O.; Balogun, O.A.; Danso, H.; Romanovski, V. Paperbricks produced from wastes: Modeling and optimization of compressive strength by response surface approach. Environ. Sci. Pollut. Res. 2022. [Google Scholar] [CrossRef]
  63. Olaniran, O.; Akinwande, A.A.; Adediran, A.A.; Jen, T.C. Process maps and regression models for the physio-thermo-mechanical properties of sintered Al7075-molybdenum composite. Mater. Lett. 2022, 332, 133527. [Google Scholar] [CrossRef]
  64. Ademati, A.O.; Akinwande, A.A.; Balogun, O.A.; Romanovski, V. Optimization of bamboo fiber-reinforced composite-clay bricks for development of low-cost farm settlement toward boosting rural agribusiness in Africa. J. Mater. Civ. Eng. 2022, 34. [Google Scholar] [CrossRef]
  65. Adesina, O.S.; Adediran, A.A.; Akinwande, A.A.; Daramola, O.O.; Sanyaolu, O. Modelling and optimizing tensile behavior of developed aluminium hybrid composite. Surf. Rev. Lett. 2022. [Google Scholar] [CrossRef]
  66. Balogun, O.A.; Akinwande, A.A.; Ogunsanya, O.A.; Ademati, A.O.; Adediran, A.A.; Erinle, T.J.; Akinlabi, E.T. Central composite design and optimization of selected stir casting parameters on flexural strength and fracture toughness mTiO2p/Al 7075 composites. Mater. Today Proc. 2022, 62, 4574–4583. [Google Scholar] [CrossRef]
  67. Akinwande, A.A.; Balogun, O.A.; Adediran, A.A.; Adesina, O.S.; Romanovski, V.; Jen, T.C. Experimental analysis, statistical modeling, and parametric optimization of quinary-(CoCrFeMnNi)100−x/TiCx high-entropy-alloy (HEA) manufactured by laser additive manufacturing. Results Eng. 2022, 17, 100802. [Google Scholar] [CrossRef]
Figure 1. Elemental composition of Al6061 according to EDS measurement.
Ceramics 06 00023 g001
Figure 2. Morphological image of input materials (a) steel particles (b) palm kernel ash (c) rice husk ash and their (d) XRD.
Ceramics 06 00023 g002
Figure 3. X-ray diffraction of selected composites.
Ceramics 06 00023 g003
Figure 4. Morphology and EDS analysis of specimens prepared at 700 °C containing (a,b) 2% PKA and 4% RHA (c,d) 4% PKA and 2% RHA; specimens prepared at 800 °C containing (e,f) 2% PKA and 6% RHA (g,h) 6% PKA and 2% RHA.
Ceramics 06 00023 g004
Figure 5. Morphology of specimens cast at 900 °C with a formulation of 4% PKA/6% RHA expressed in (a) SEM image (b) EDS result for the matrix (c) polarized illumination (Amscope 40×−1000× fluorescence microscope) and EDS results on (d) spot 1 (e) spot 2 (f) spot 3 (gj) elemental maps.
Ceramics 06 00023 g005
Figure 6. Morphology of specimen cast at 900 °C with a formulation of 6% PKA/4% RHA expressed in (a) SEM image (b) EDS result for the matrix (c) fluorescence morphology and EDS results on (d) spot 1 (e) spot 2 (f) spot 3 (gj) elemental maps.
Ceramics 06 00023 g006
Figure 7. Normal probability plot for responses (a) tensile strength, (b) tensile modulus, (c) compressive strength, (d) compressive modulus, and (e) flexural strength.
Ceramics 06 00023 g007
Figure 8. Predicted vs. actual plot for responses (a) tensile strength, (b) tensile modulus, (c) compressive strength, (d) compressive modulus, and (e) flexural strength.
Ceramics 06 00023 g008
Figure 9. Surface plots representing the relationship of the variables that affect tensile strength as revealed by interactions (a) PKA vs. RHA (b) PKA vs. stirring temperature (c) RHA vs. stirring temperature.
Ceramics 06 00023 g009
Figure 10. Surface plots representing the relationship of the variables affect tensile modulus as revealed by interactions (a) PKA vs. RHA (b) PKA vs. stirring temperature (c) RHA vs. stirring temperature.
Ceramics 06 00023 g010
Figure 11. Surface plots representing the relationship of the variables that affect compressive strength as revealed by interactions (a) PKA vs. RHA (b) PKA vs. stirring temperature (c) RHA vs. stirring temperature.
Ceramics 06 00023 g011
Figure 12. Surface plots representing the relationship of the variables affect compressive modulus as revealed by interactions (a) PKA vs. RHA, (b) PKA vs. stirring temperature, and (c) RHA vs. stirring temperature.
Ceramics 06 00023 g012
Figure 13. Surface plots representing the relationship of the variables that affect flexural strength as revealed by interactions (a) PKA vs. RHA, (b) PKA vs. stirring temperature, and (c) RHA vs. stirring temperature.
Ceramics 06 00023 g013
Figure 14. Contour plot for (ac) tensile strength and (df) tensile modulus.
Ceramics 06 00023 g014
Figure 15. Contour plot for (top ac) compressive strength (bottom ac) compressive modulus.
Ceramics 06 00023 g015
Figure 16. Contour plot for (ac) flexural strength.
Ceramics 06 00023 g016
Figure 17. Optimization ramp.
Ceramics 06 00023 g017
Figure 18. Characteristics of a sample prepared at optimum condition (a) microstructural features, (b) EDS elemental composition, (c) XRD phase identification.
Ceramics 06 00023 g018
Table 1. Levels of the design.
VariablesLow (−1)Middle (0)High (+1)
PKA dosage (wt.%)246
RHA dosage (wt.%)246
Stirring temperature (°C)700800900
Table 2. Mix design according to the experimental run.
Coded LevelsFactors
Experimental RunsABCPKA (%)RHA (%)Temperature (°C)
1−10124900
201146900
311066800
4−1−1022800
510164900
601−146700
701026800
810062800
910064700
100−1−142700
11−10−124700
120−1142900
1300044800
1400044800
1500044800
A, B, and C are PKA proportion (wt.%), RHA proportion (wt.%), and stirring temperature (°C).
Table 3. Properties of matrix materials.
PropertiesDensity (g/cm3)Hardness (HRB)Tensile Strength (MPa)Young Modulus (GPa)Flexural Strength (MPa)Compressive Strength (MPa)
Value2.76 ± 0.2083.0 ± 1.3241.6 ± 4.560.3 ± 2.6255.5 ± 3.9209.8 ± 2.7
Table 4. Chemical composition of reinforcements (PKA and RHA).
MaterialsSiO2MgOAl2O3Fe2O3CaOK2OP2O5MnO2Other
PKA47.34.26.93.020.26.84.13.54.0
RHA90.20.70.30.60.32.10.10.05.7
Table 5. Elemental composition of the reinforcing steel used.
ElementsCuCPCrSiMnNiMoSFe
Amount (%)0.10.30.000.10.20.60.10.10.1balance
Table 6. Corresponding responses for the experimental runs.
Experimental RunsDesignationsTensile Strength (MPa)Tensile Modulus (GPa)Compressive Strength (MPa)Compressive Modulus (GPa)Flexural Strength (MPa)
12-4-900322 ± 5.959 ± 1.4243 ± 4.161 ± 1.1291 ± 3.7
24-6-900291 ± 5.176 ± 1.7295 ± 5.077 ± 1.4289 ± 3.3
36-6-800303 ± 5.3113 ± 2.6330 ± 5.6105 ± 2.3297 ± 3.8
42-2-800280 ± 5.076 ± 1.7237 ± 3.956 ± 0.9291 ± 3.7
56-4-900289 ± 5.172 ± 1.7281 ± 4.272 ± 1.1277 ± 3.3
64-6-700268 ± 3.885 ± 2.0280 ± 4.177 ± 1.6281 ± 4.1
72-6-800300 ± 3.4103 ± 2.4302 ± 4.887 ± 1.6322 ± 3.9
86-2-800294 ± 5.291 ± 2.1269 ± 4.372 ± 1.1298 ± 3.2
96-4-700275 ± 5.284 ± 1.9273 ± 4.369 ± 1.4281 ± 1.8
104-2-700250 ± 4.165 ± 1.5222 ± 3.148 ± 0.7258 ± 1.6
112-4-700271 ± 4.667 ± 1.5235 ± 3.050 ± 0.8279 ± 3.3
124-2-900273 ± 4.856 ± 1.3229 ± 3.646 ± 0.5270 ± 3.2
134-4-800342 ± 5.396 ± 2.2278 ± 4.283 ± 1.4338 ± 4.2
144-4-800344 ± 6.093 ± 2.1288 ± 4.578 ± 1.2340 ± 4.5
154-4-800345 ± 5.391 ± 2.1279 ± 3.981 ± 1.5335 ± 3.0
Table 7. Analysis of variance for (a) Tensile strength (b) Tensile modulus.
(a) Tensile Strength (TS)(b) Tensile Modulus (TM)
SourceSSdfMSF-vp-vSourceSSdfMSF-vp-v
Model9726.6191080.7320.560.0053Model3675.469408.3889.510.0003
A-PKA4560.501660.5011.150.0438A-PKA378.121378.1282.880.0008
B-RHA703.131703.1313.380.0216B-RHA990.131990.13217.010.0001
C-Temp.1540.1311540.1329.300.0056C-Temp.180.501180.5039.560.0033
AB0.250010.25000.00480.9483AB6.2516.251.370.3068
AC342.251342.256.510.0632AC4.0014.000.87670.4021
BC0.000010.00000.00001.0000BC0.000010.00000.00001.0000
845.001845.0016.080.01601.2511.250.27400.6283
3920.0013920.0074.580.00101.2511.250.27400.6283
4500.0014500.0085.610.00081940.4511940.45425.300.0001
Residual210.25452.56 Residual18.2544.56
Lack of Fit208.25369.4234.710.1240Lack of Fit13.7534.581.020.6052
Pure Error2.0012.00 Pure Error4.5014.50
Cor Total9936.8613 Cor Total3693.7113
R2 = 0.9788R2 (adj) = 0.9512R2 (pred) = 0.9339R2 = 0.9751R2 (adj) = 0.9639R2 (pred) = 0.9622
Table 8. Analysis of variance for (a) compressive strength (b) compressive modulus.
(a) Compressive Strength(b) Compressive Modulus
SourceSSdfMSF-vp-vSourceSSdfMSF-vp-v
Model12,233.0091359.2281.150.0004Model3542.439393.6032.460.0022
A-PKA2664.5012664.50159.070.0002A-PKA512.001512.0042.230.0029
B-RHA7200.0017200.00429.850.0000B-RHA1922.0011922.00158.520.0002
C-Temperature180.501180.5010.780.0304C-Temperature18.00118.001.480.2900
AB9.0019.000.53730.5042AB1.000011.00000.08250.7882
AC0.000010.00000.00001.0000AC16.00116.001.320.3147
BC16.00116.000.95520.3837BC1.000011.00000.08250.7882
0.200010.20000.01190.91820.200010.20000.01650.9040
5.0015.000.29850.61391.8011.800.14850.7196
2040.2012040.20121.800.00041008.2011008.2083.150.0008
Residual67.00416.75 Residual48.50412.13
Lack of Fit17.0035.670.11330.9410Lack of Fit36.00312.000.96000.6174
Pure Error50.00150.00 Pure Error12.50112.50
Cor Total12,300.0013 Cor Total3590.9313
R2 = 0.9826R2 (adj) = 0.9723R2 (pred) = 0.9596R2 = 0.9865R2 (adj) = 0.9561R2 (pred) = 0.9527
Table 9. Analysis of variance for flexural strength.
(a) Flexural Strength
SourceSSdfMSF-vp-v
Model7694.969855.0032.810.0021
A-PKA300.131300.1311.520.0274
B-RHA1035.1311035.1339.720.0032
C-Temperature98.00198.003.760.1245
AB42.25142.251.620.2719
AC64.00164.002.460.1922
BC4.0014.000.15350.7152
938.451938.4536.010.0039
1940.4511940.4574.450.0010
5088.0515088.05195.220.0002
Residual104.25426.06
Lack of Fit102.25334.0817.040.1758
Pure Error2.0012.00
Cor Total7799.2113
R2 = 0.9866R2 (adj) = 0.9666R2 (pred) = 0.9592
Table 10. Optimization constraints.
NameGoalLower LimitUpper LimitImportance
A: PKAis in range263
B: RHAis in range263
C: Temp.is in range7009003
CSmaximize2223303
CMmaximize461053
TSmaximize2503443
TMmaximize561133
FSmaximize2583403
Where A is PKA, B is RHA, and C is stirring temperature.
Disclaimer/Publisher’s Note: The statements, opinions and data contained in all publications are solely those of the individual author(s) and contributor(s) and not of MDPI and/or the editor(s). MDPI and/or the editor(s) disclaim responsibility for any injury to people or property resulting from any ideas, methods, instructions or products referred to in the content.

