
Multifunctional Materials Based on the Solid Solutions of the (Na, K, Cd0.5)NbO3 (KNN-Cd) System Modified with Rare Earth Elements: Crystal Structure, Microstructure, and Macroresponses
 , ,
, ,
Abstract
:1. Introduction
2. Materials and Methods
2.1. Materials
2.2. Research
3. Results and Discussion
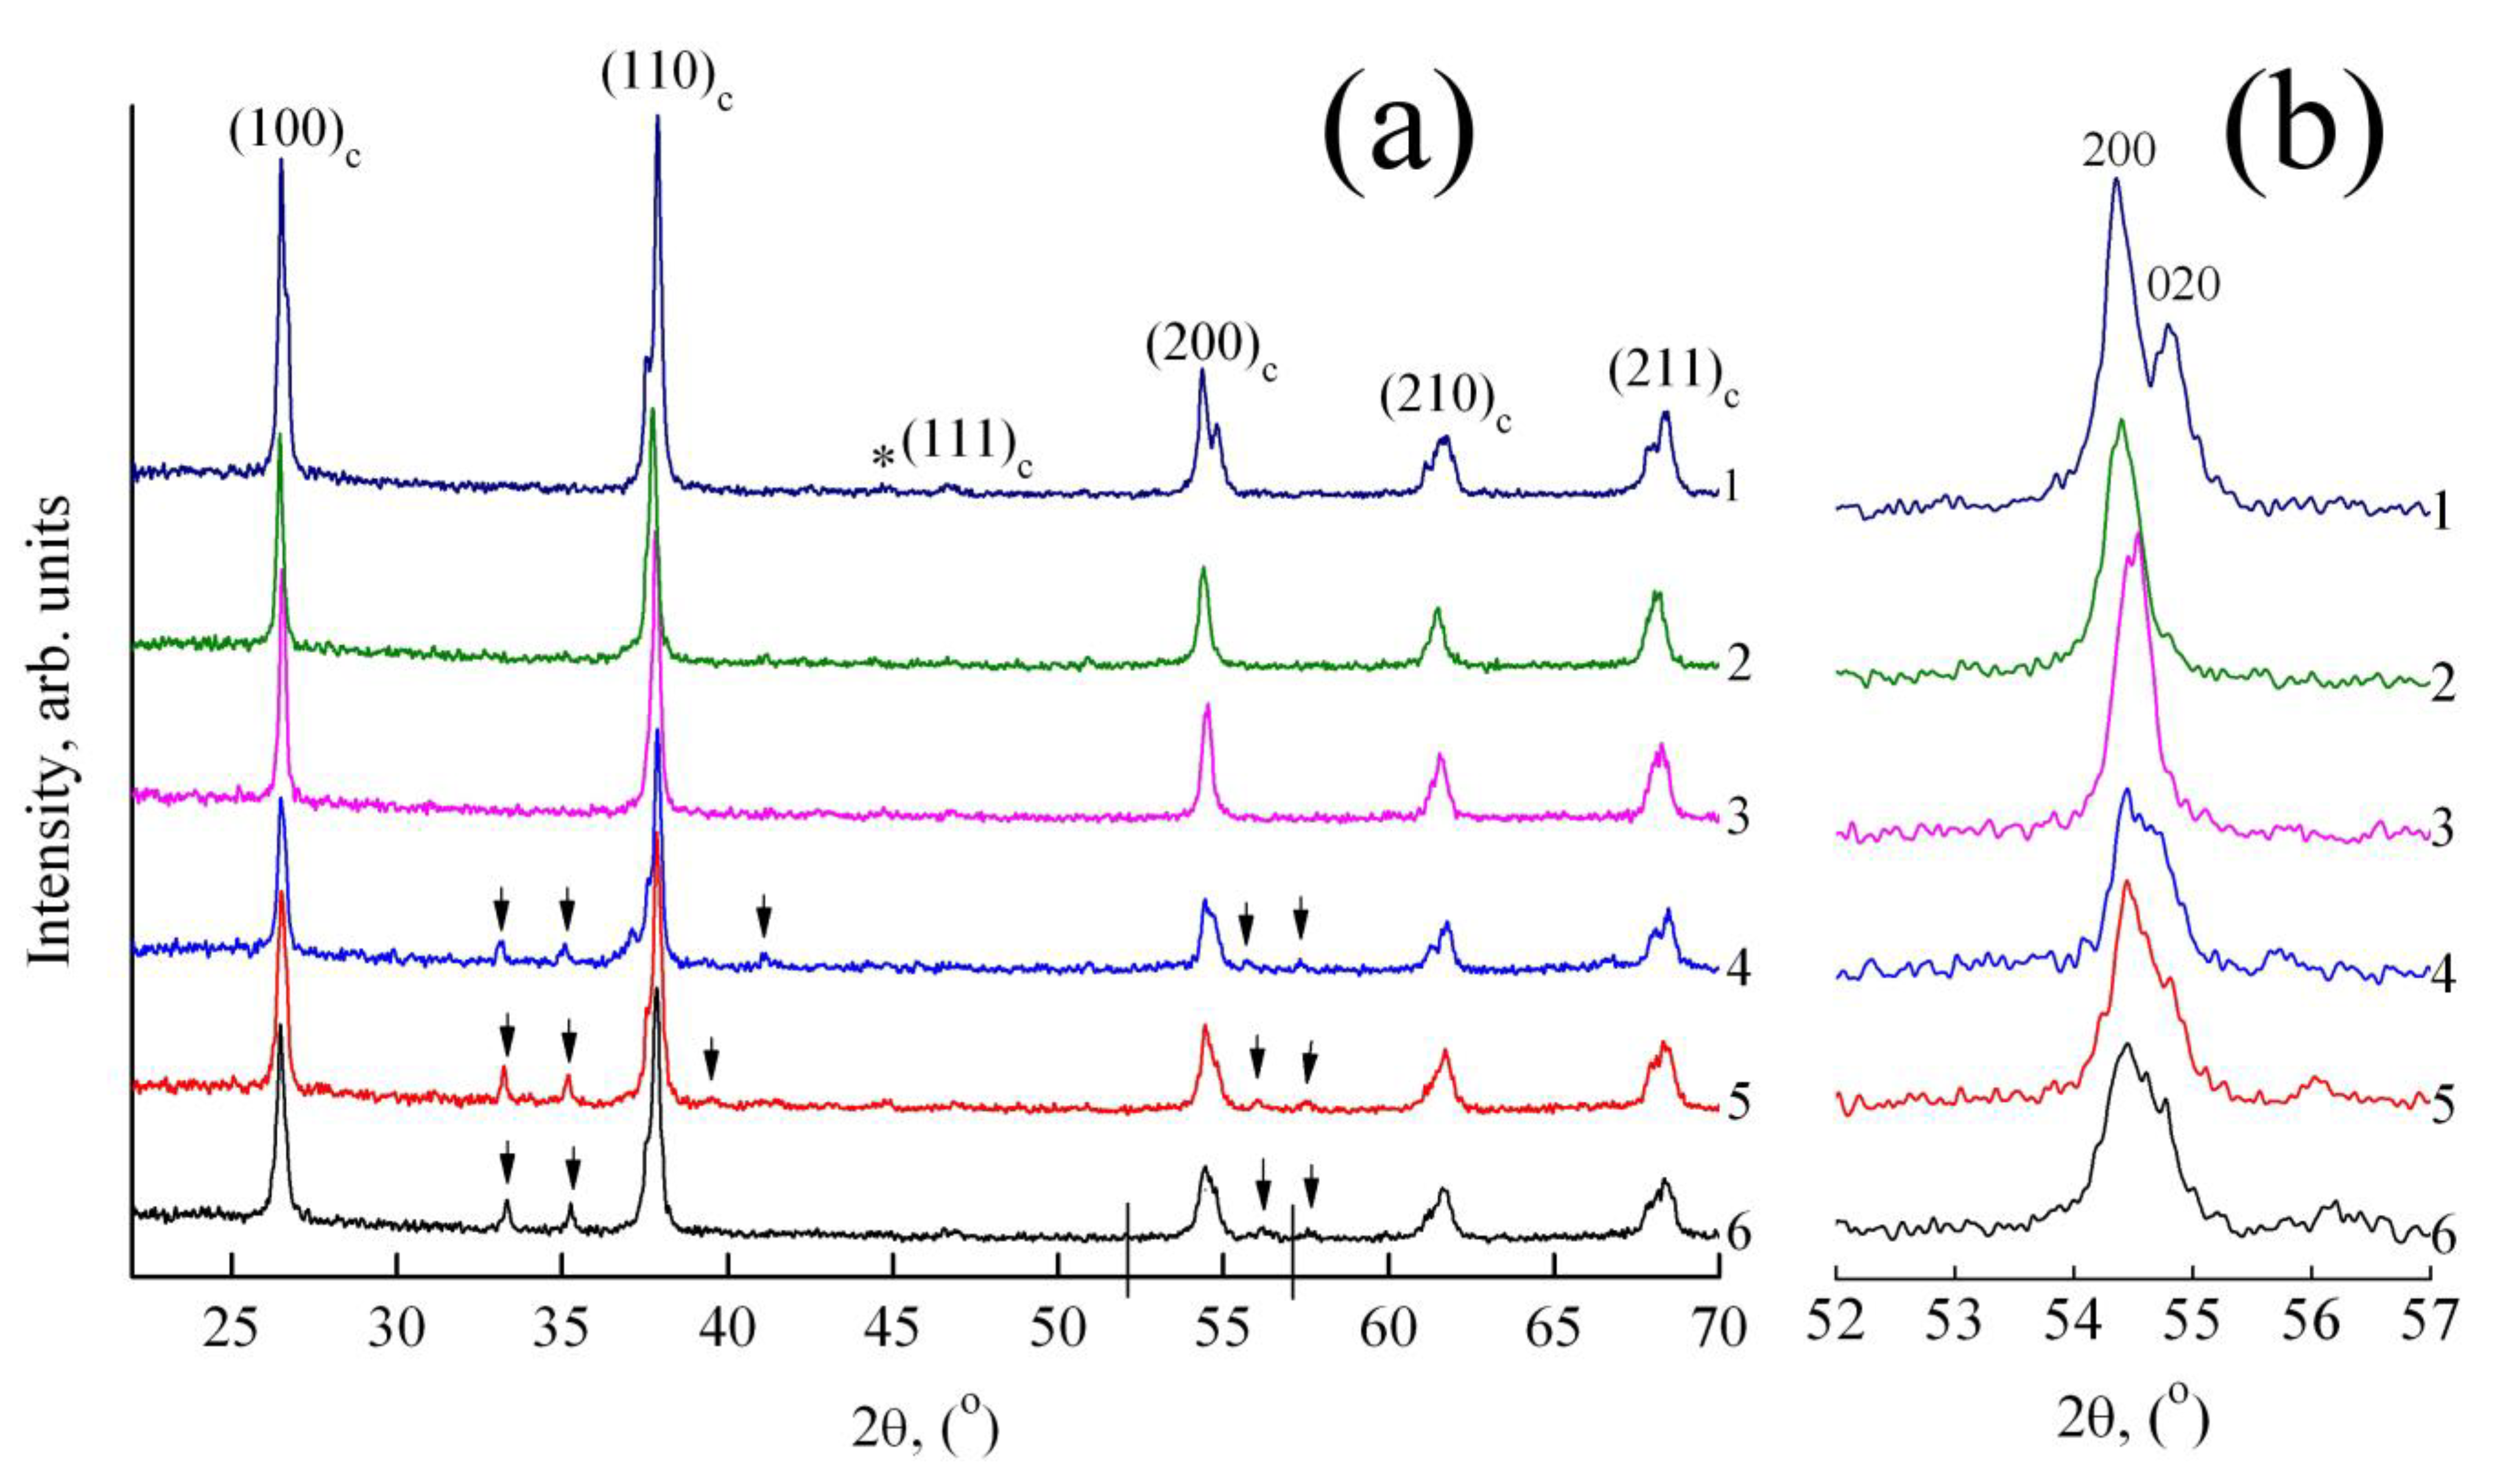
3.1. X-Ray Study
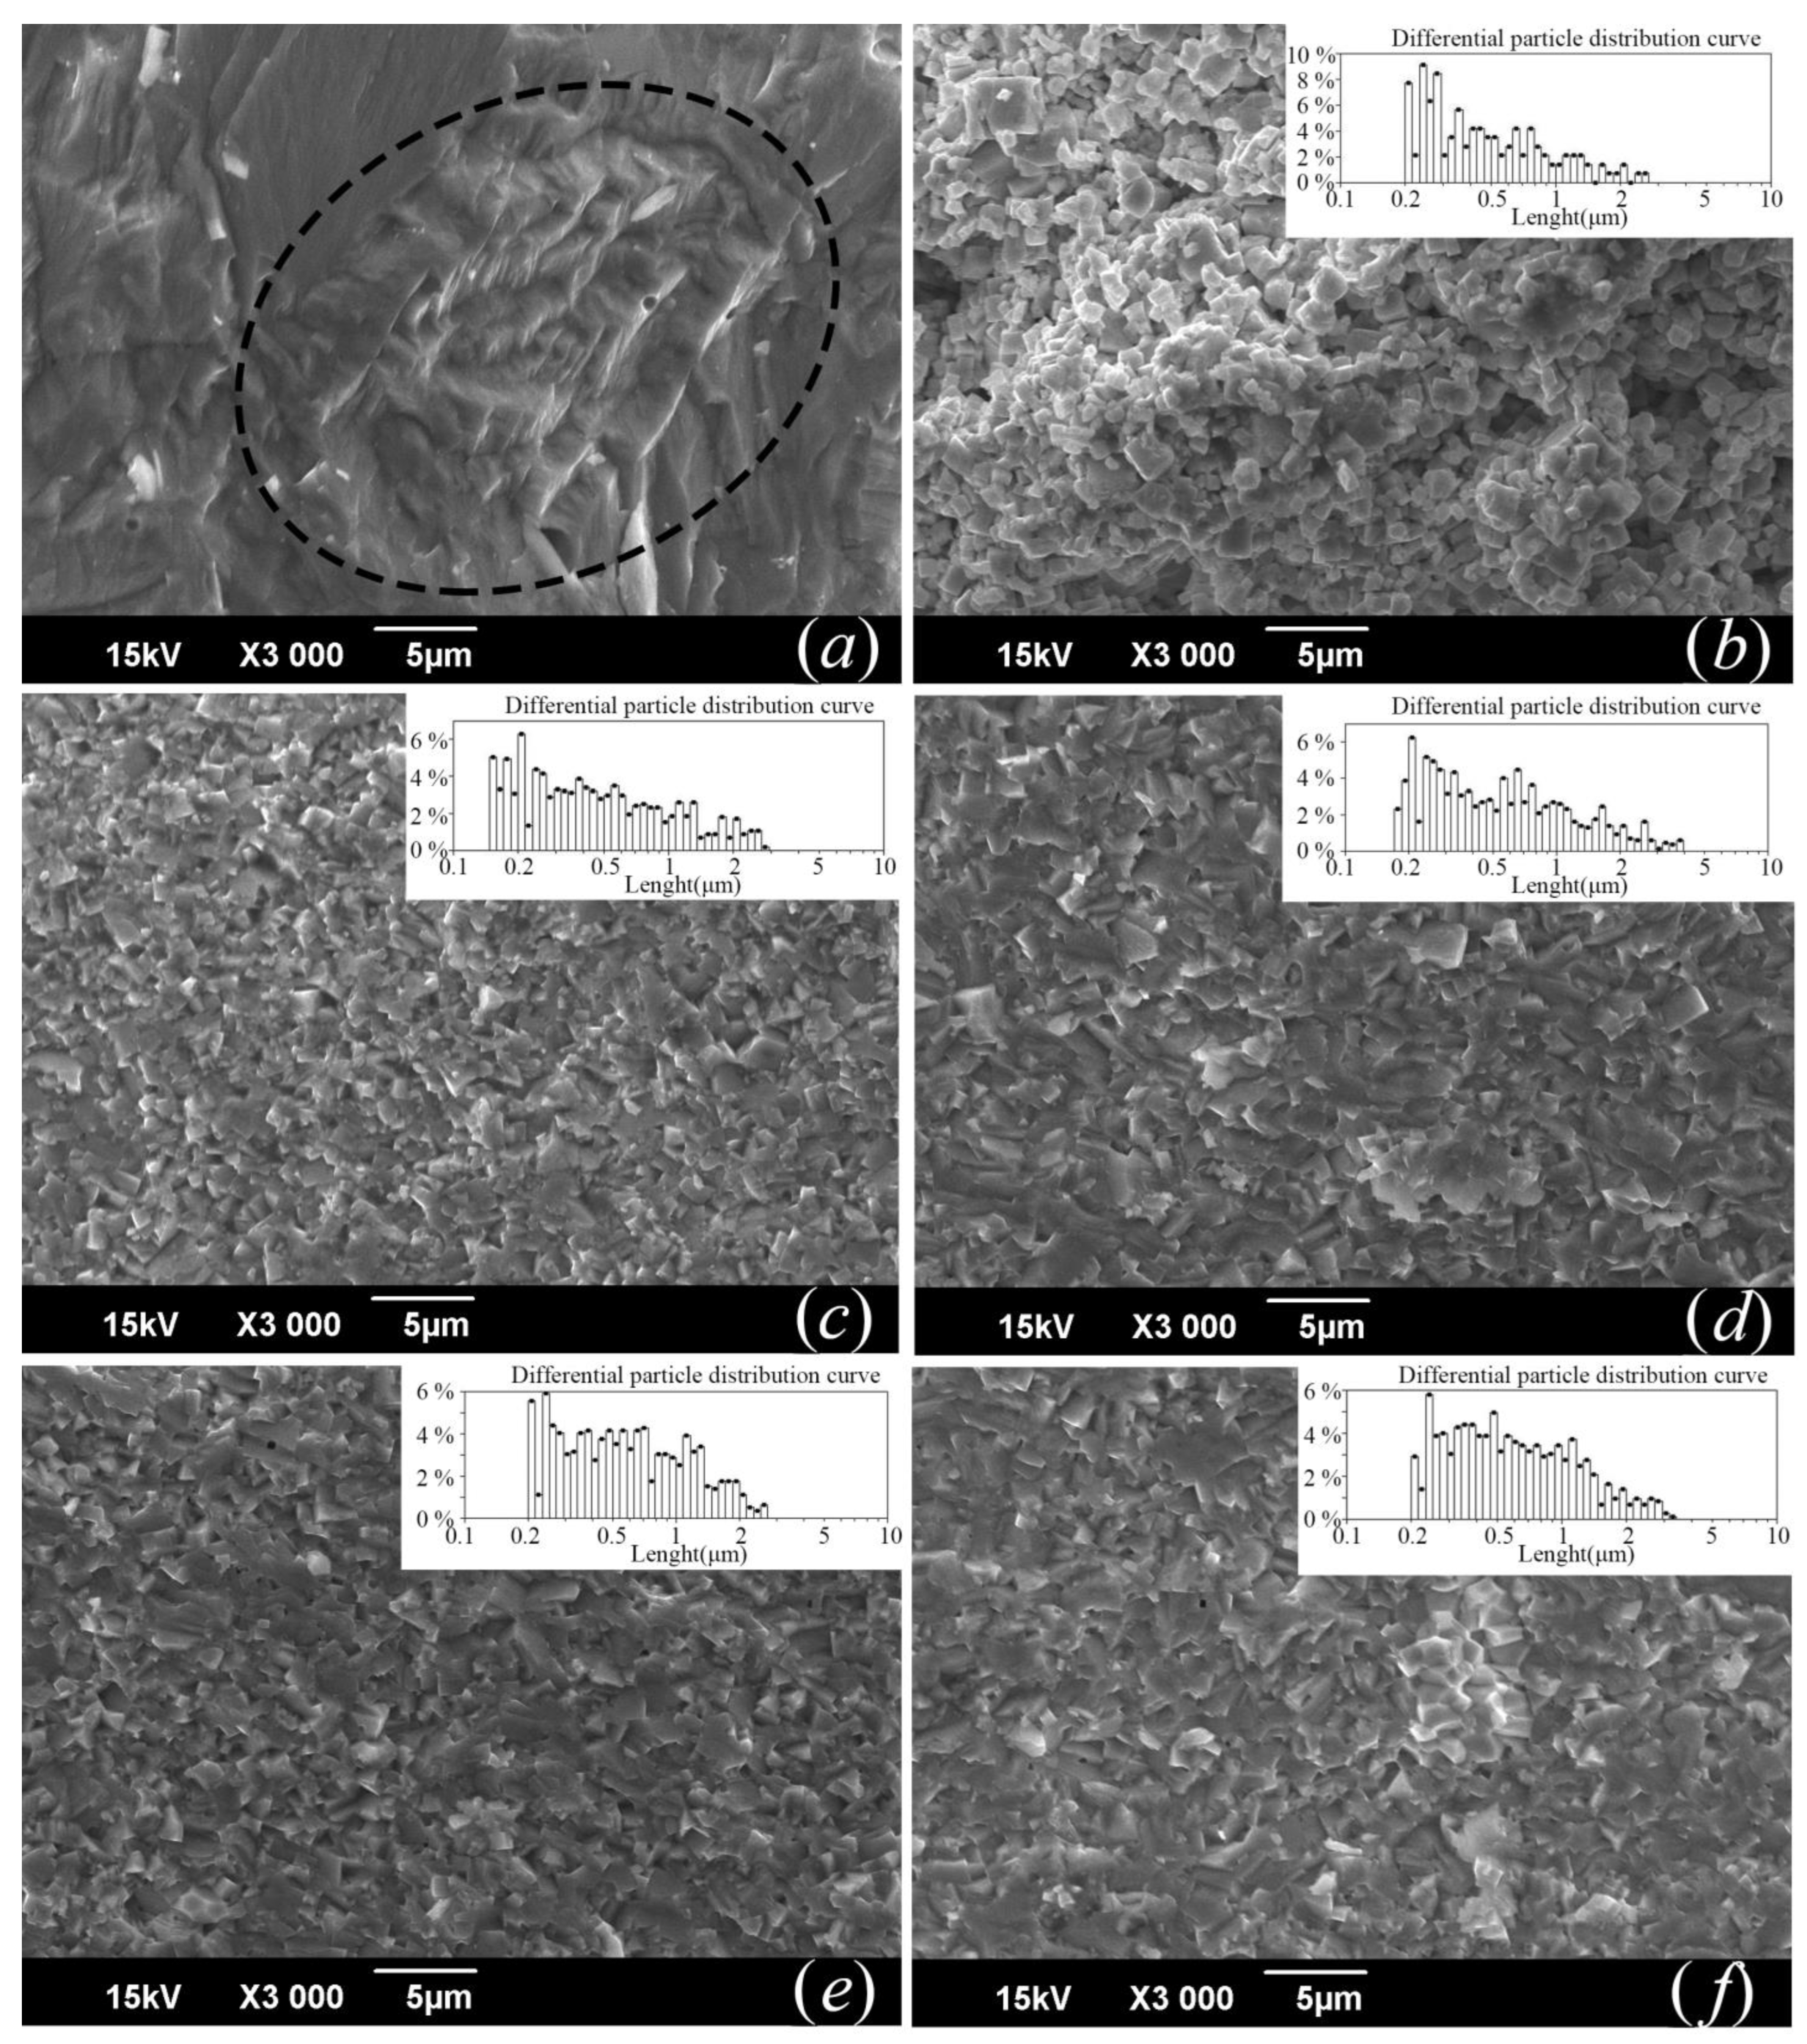
3.2. Microstructure
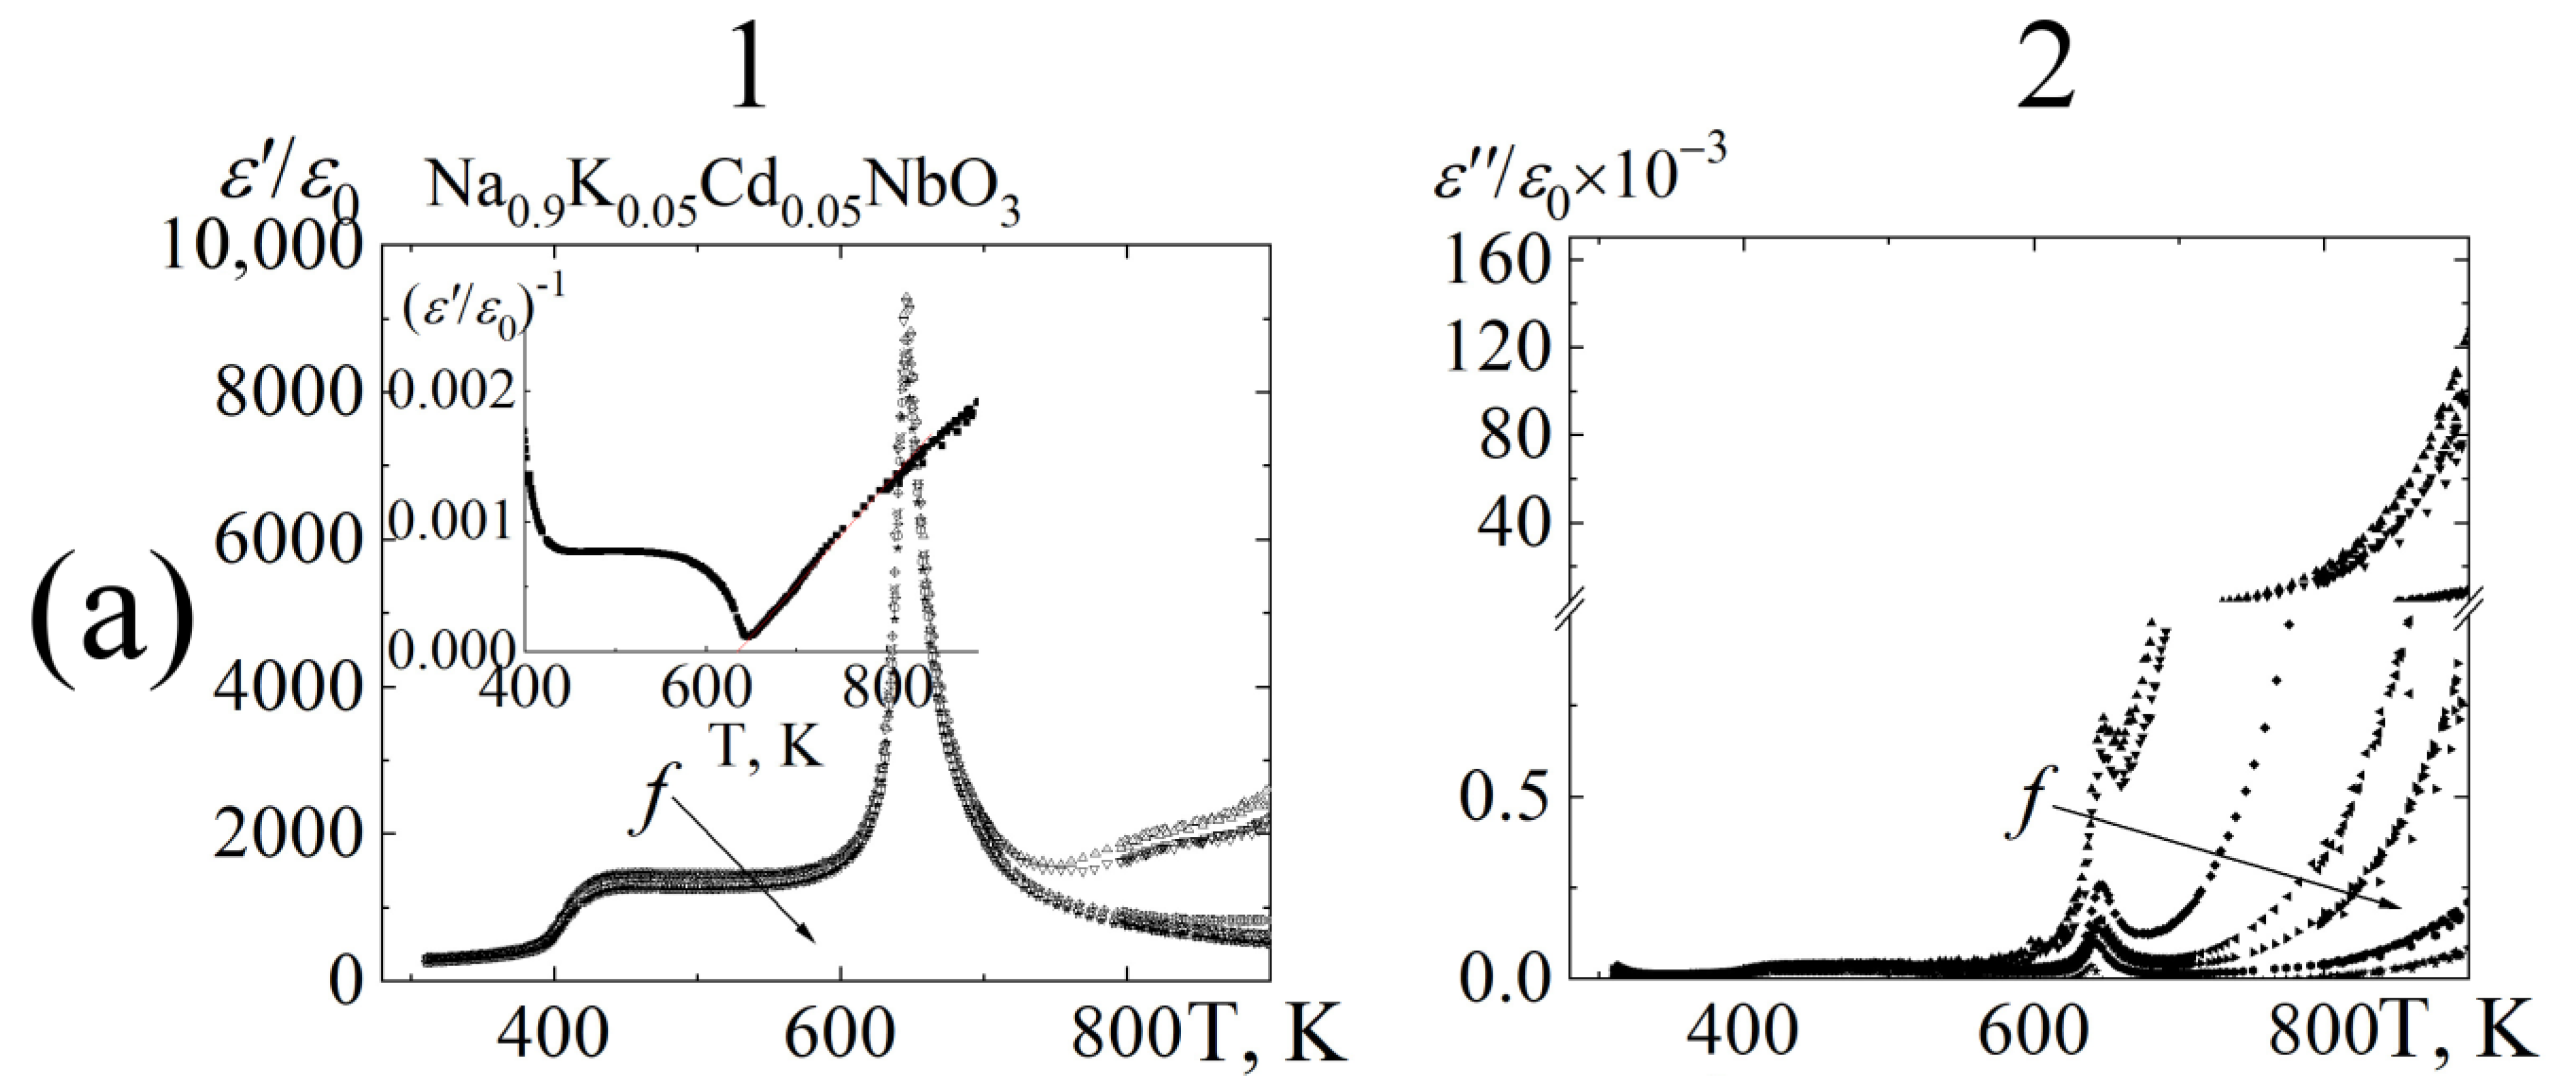
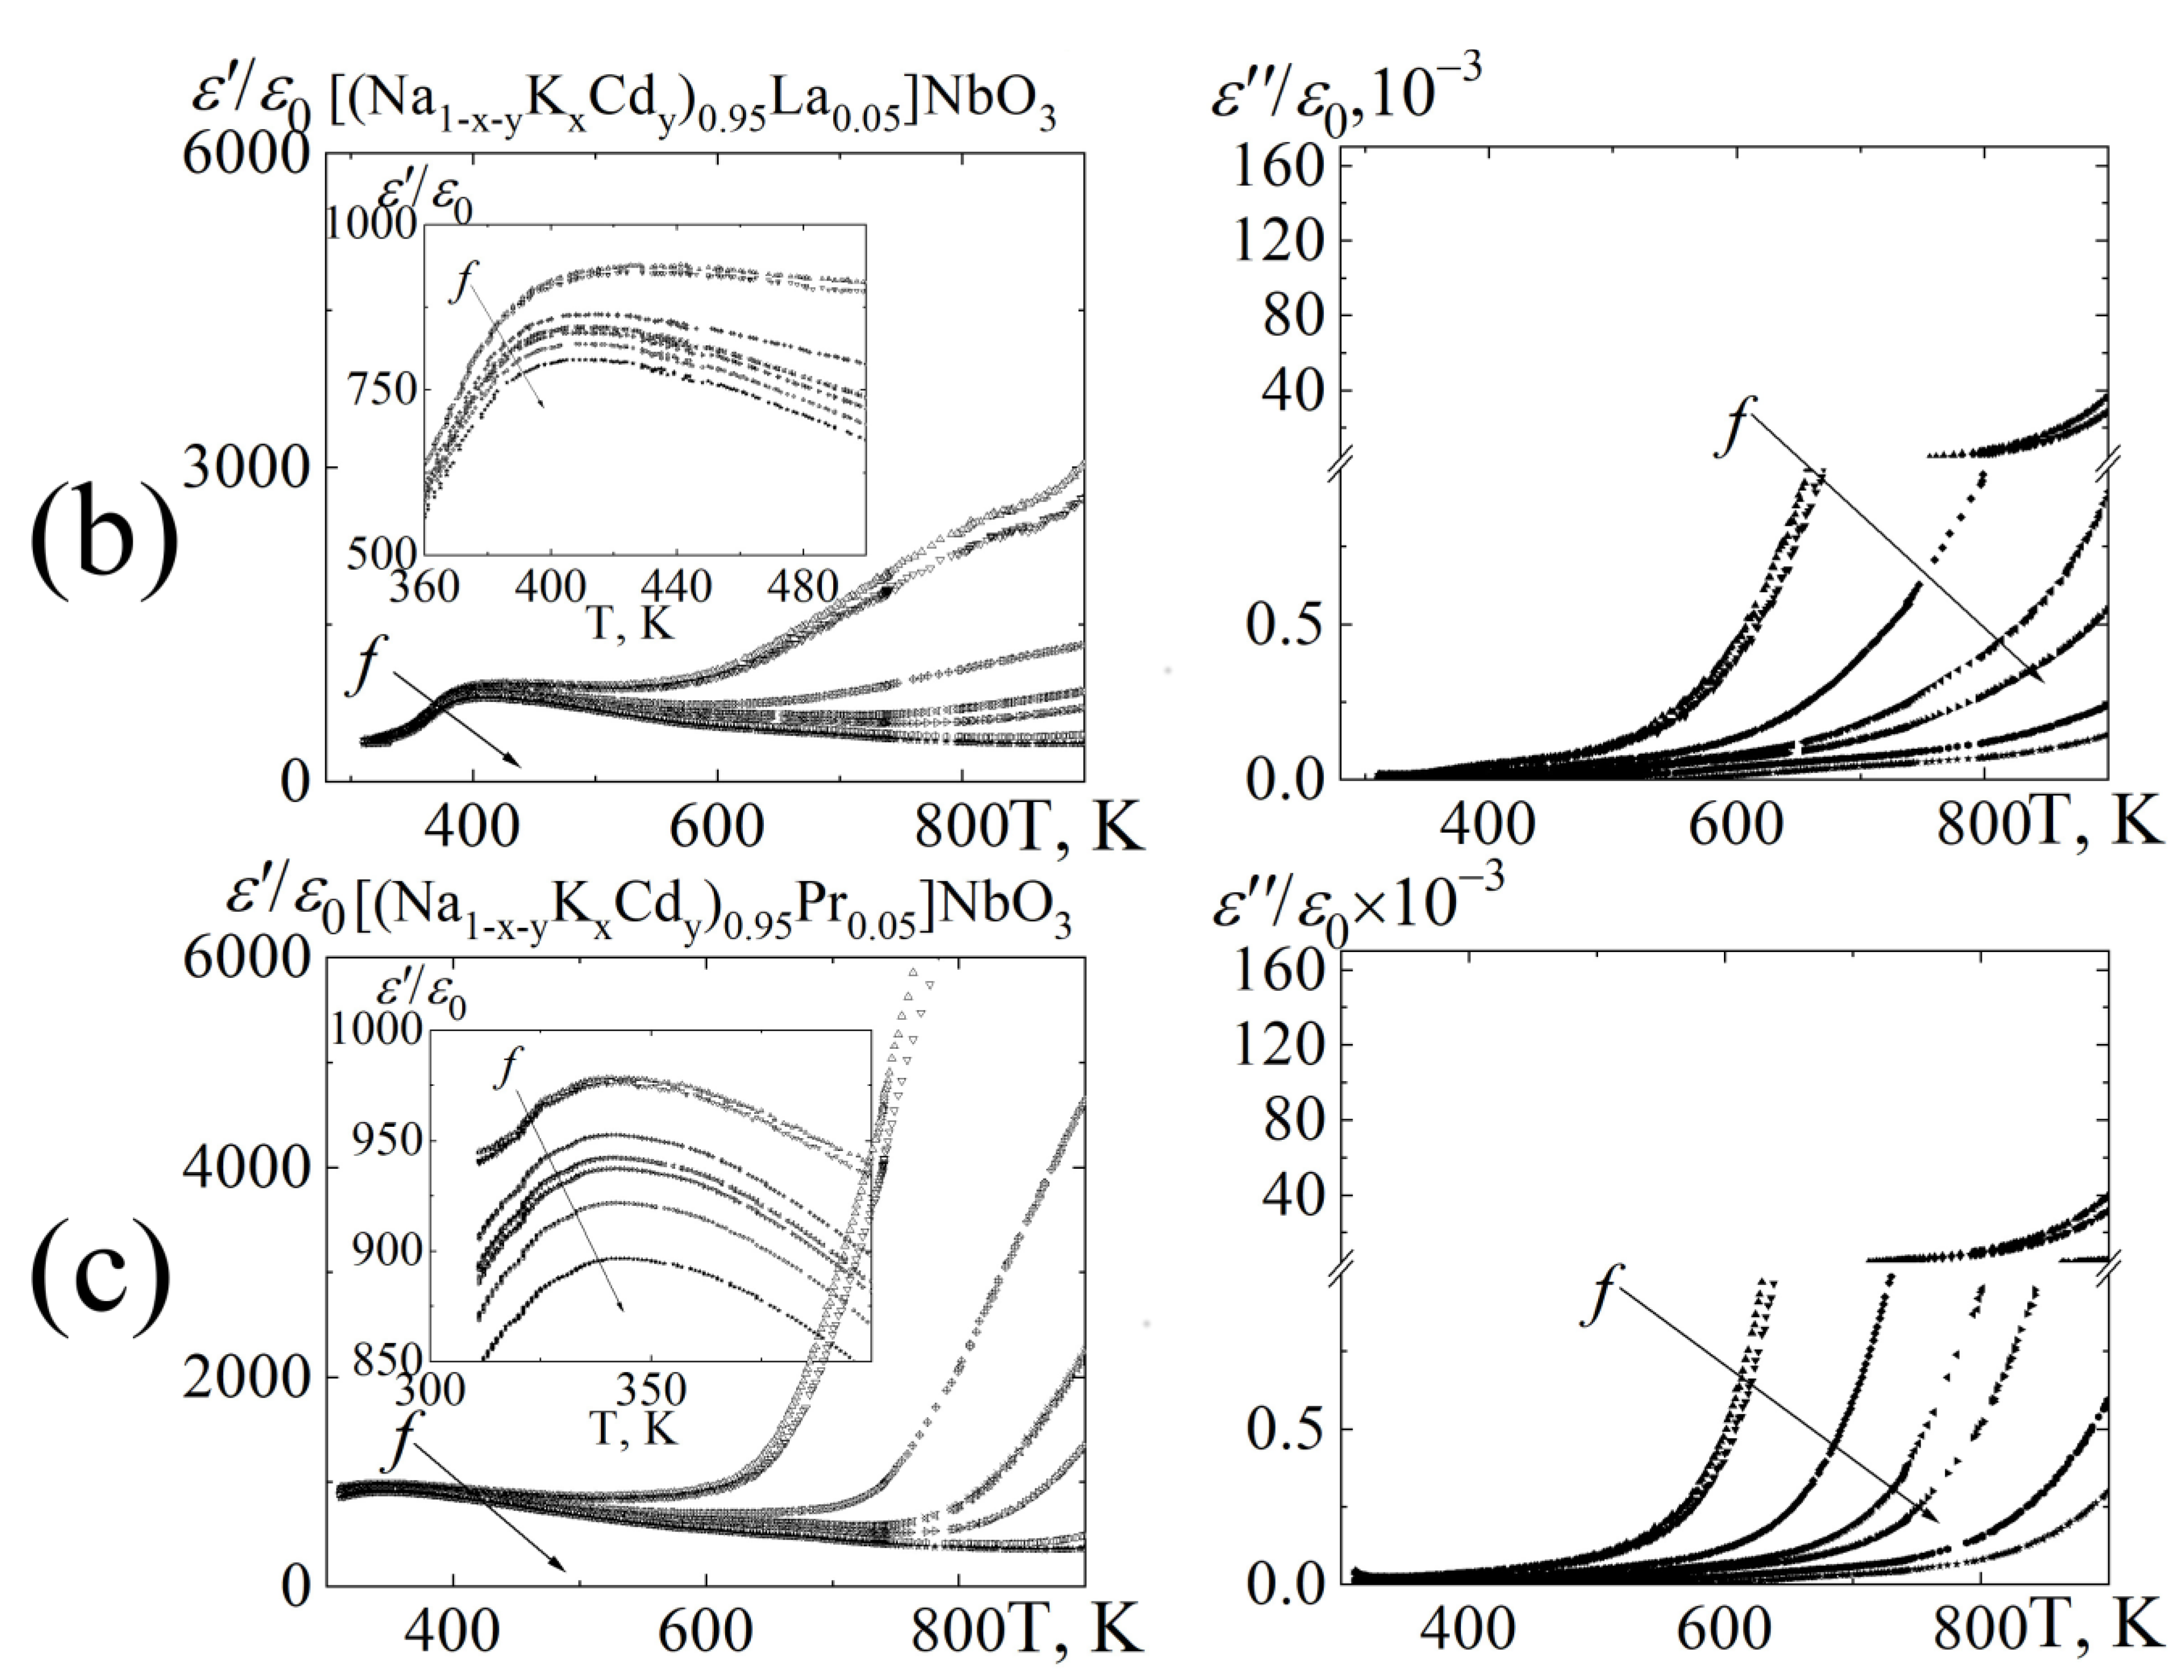
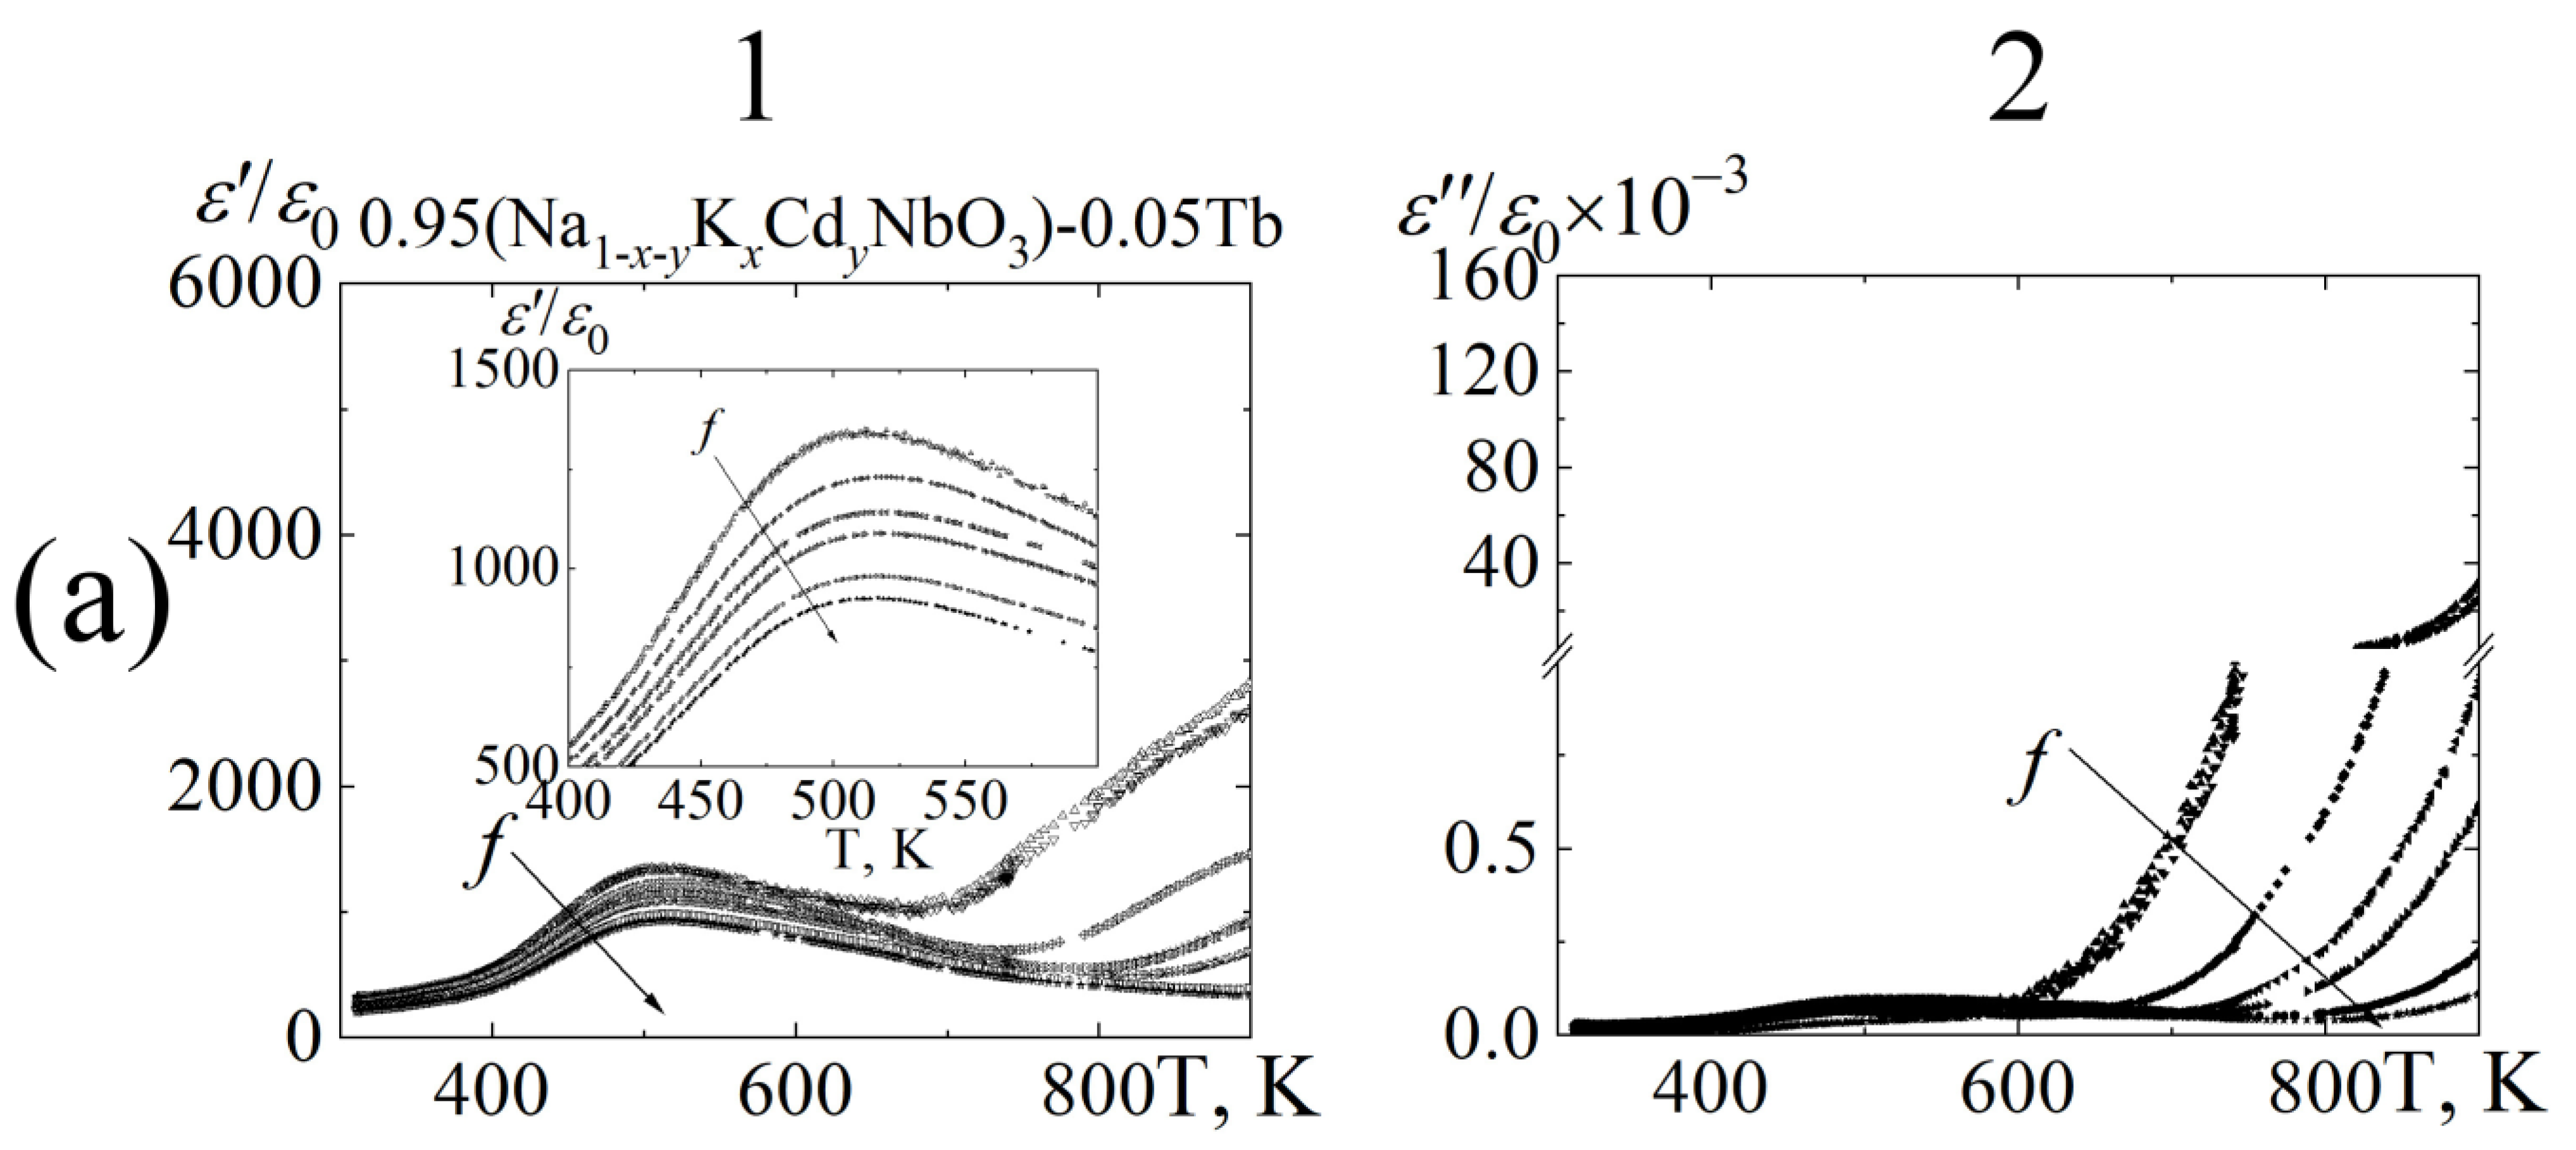
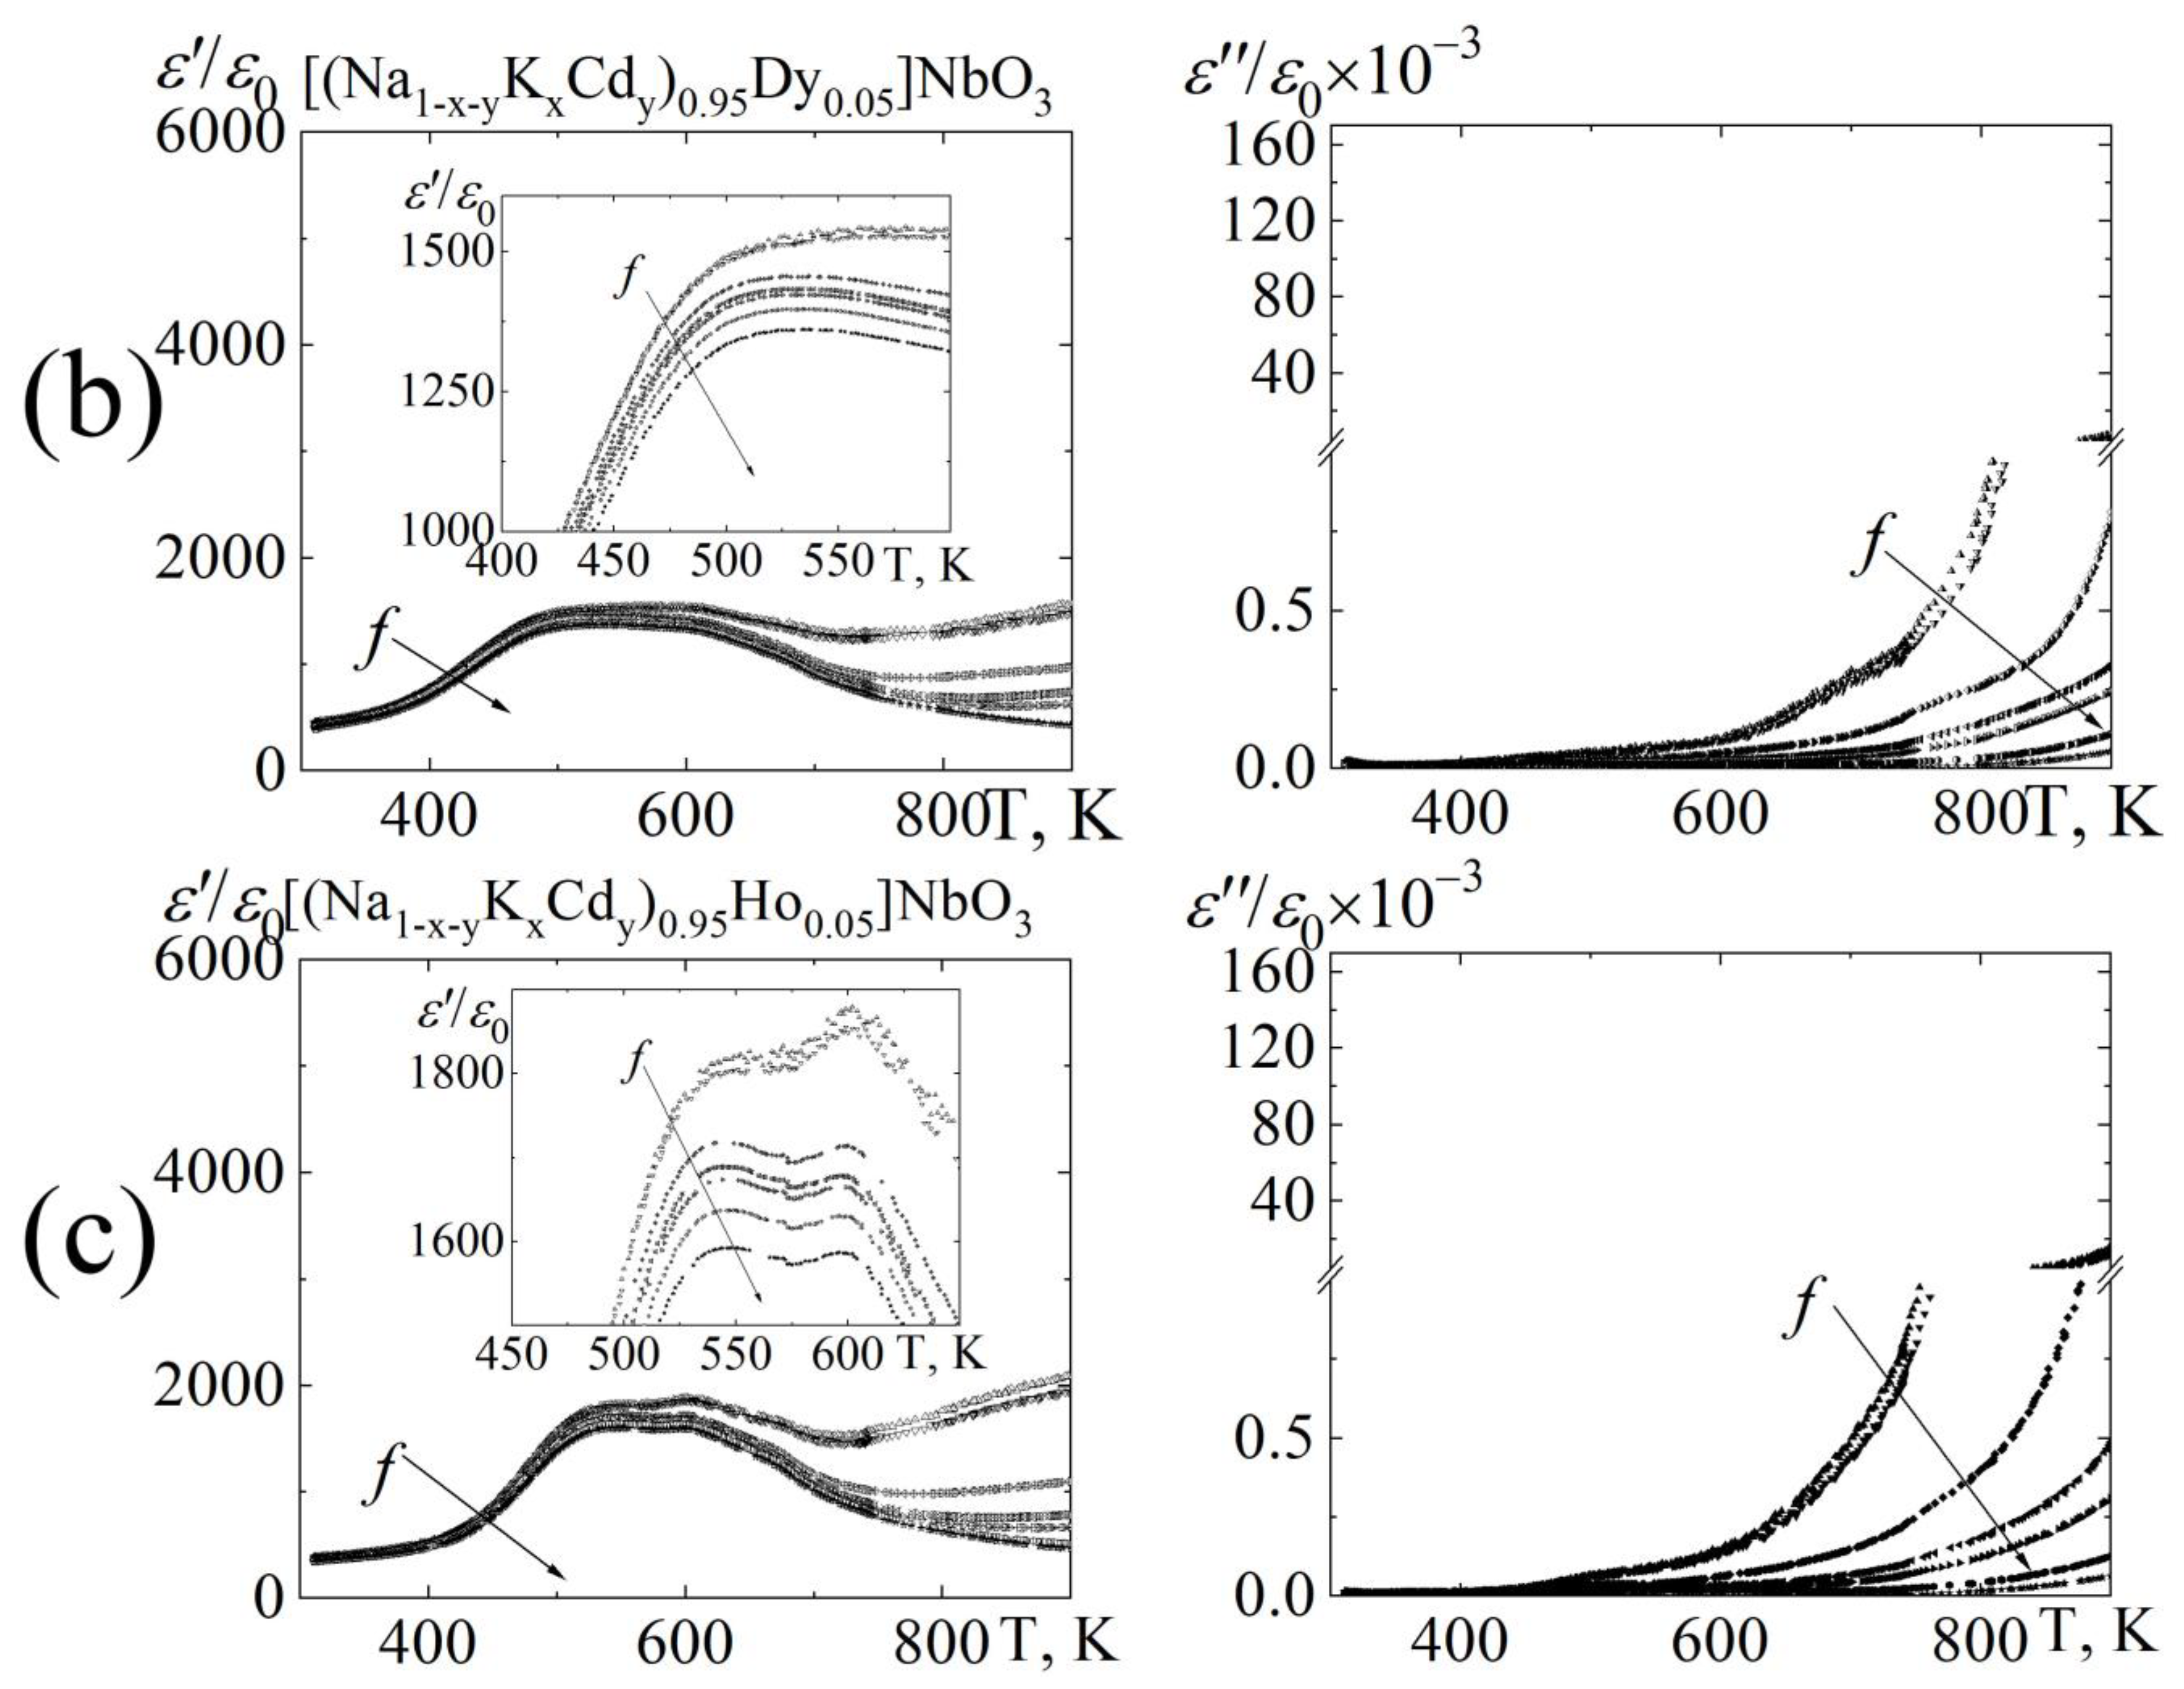
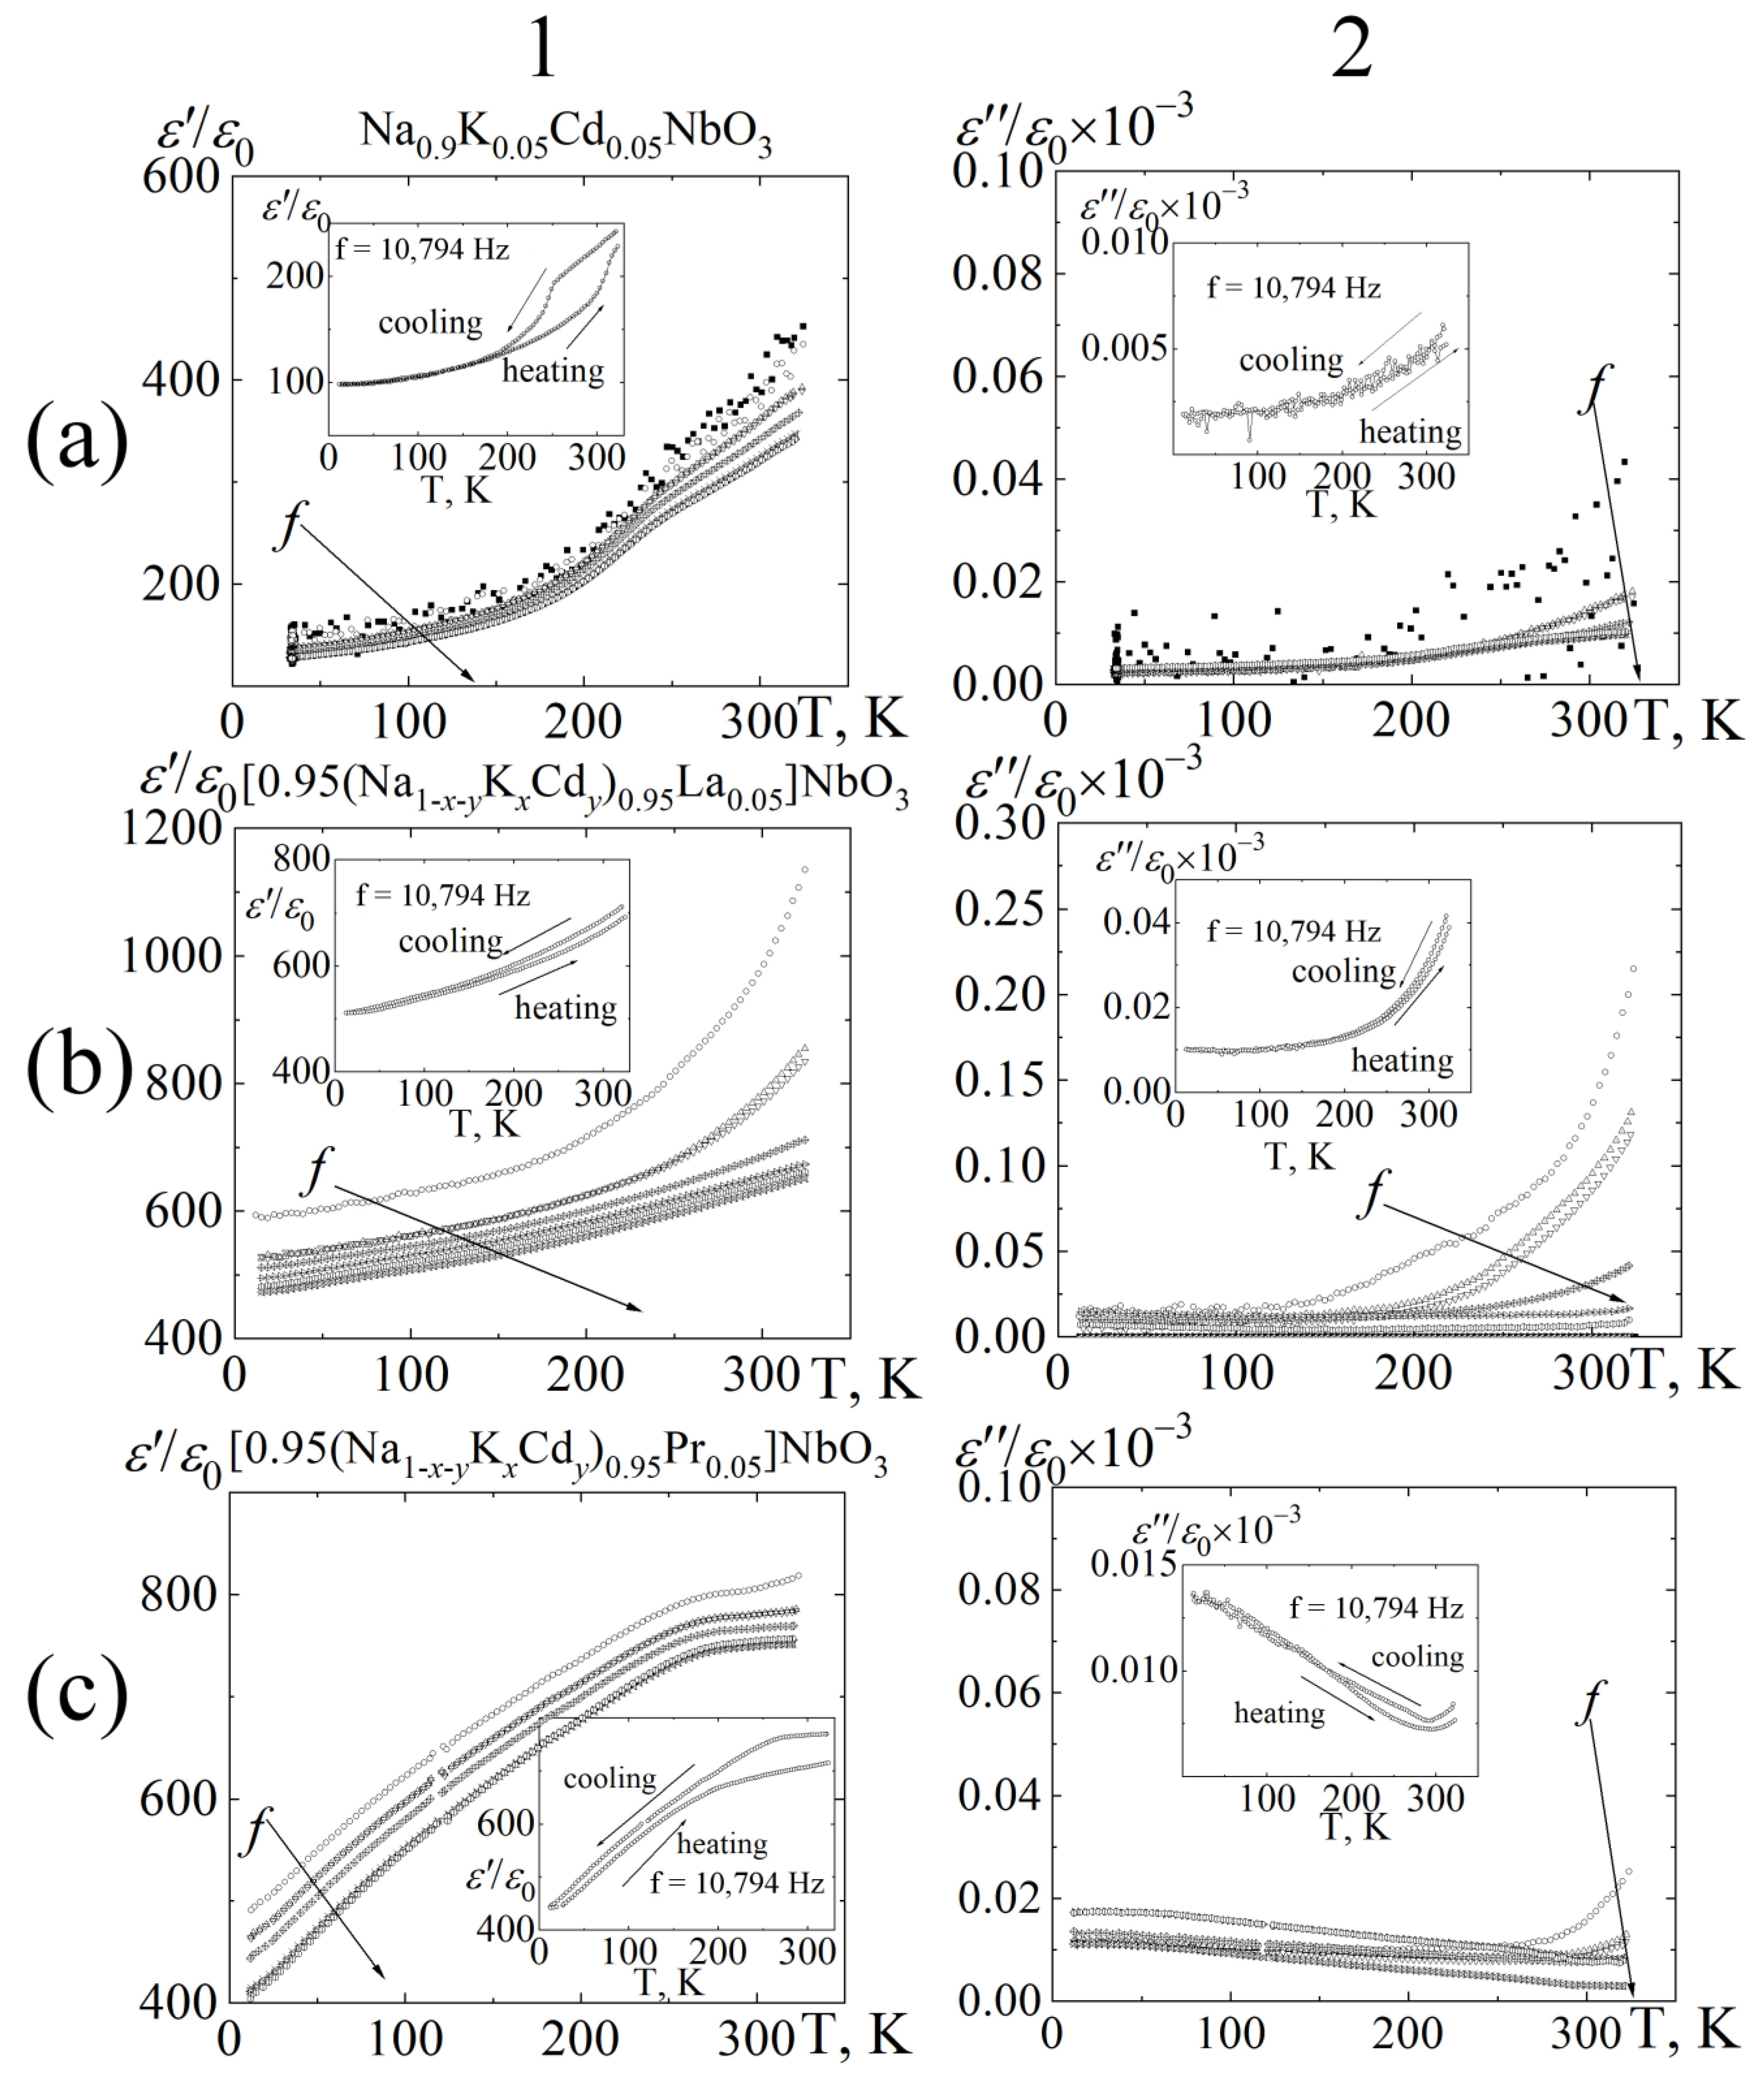
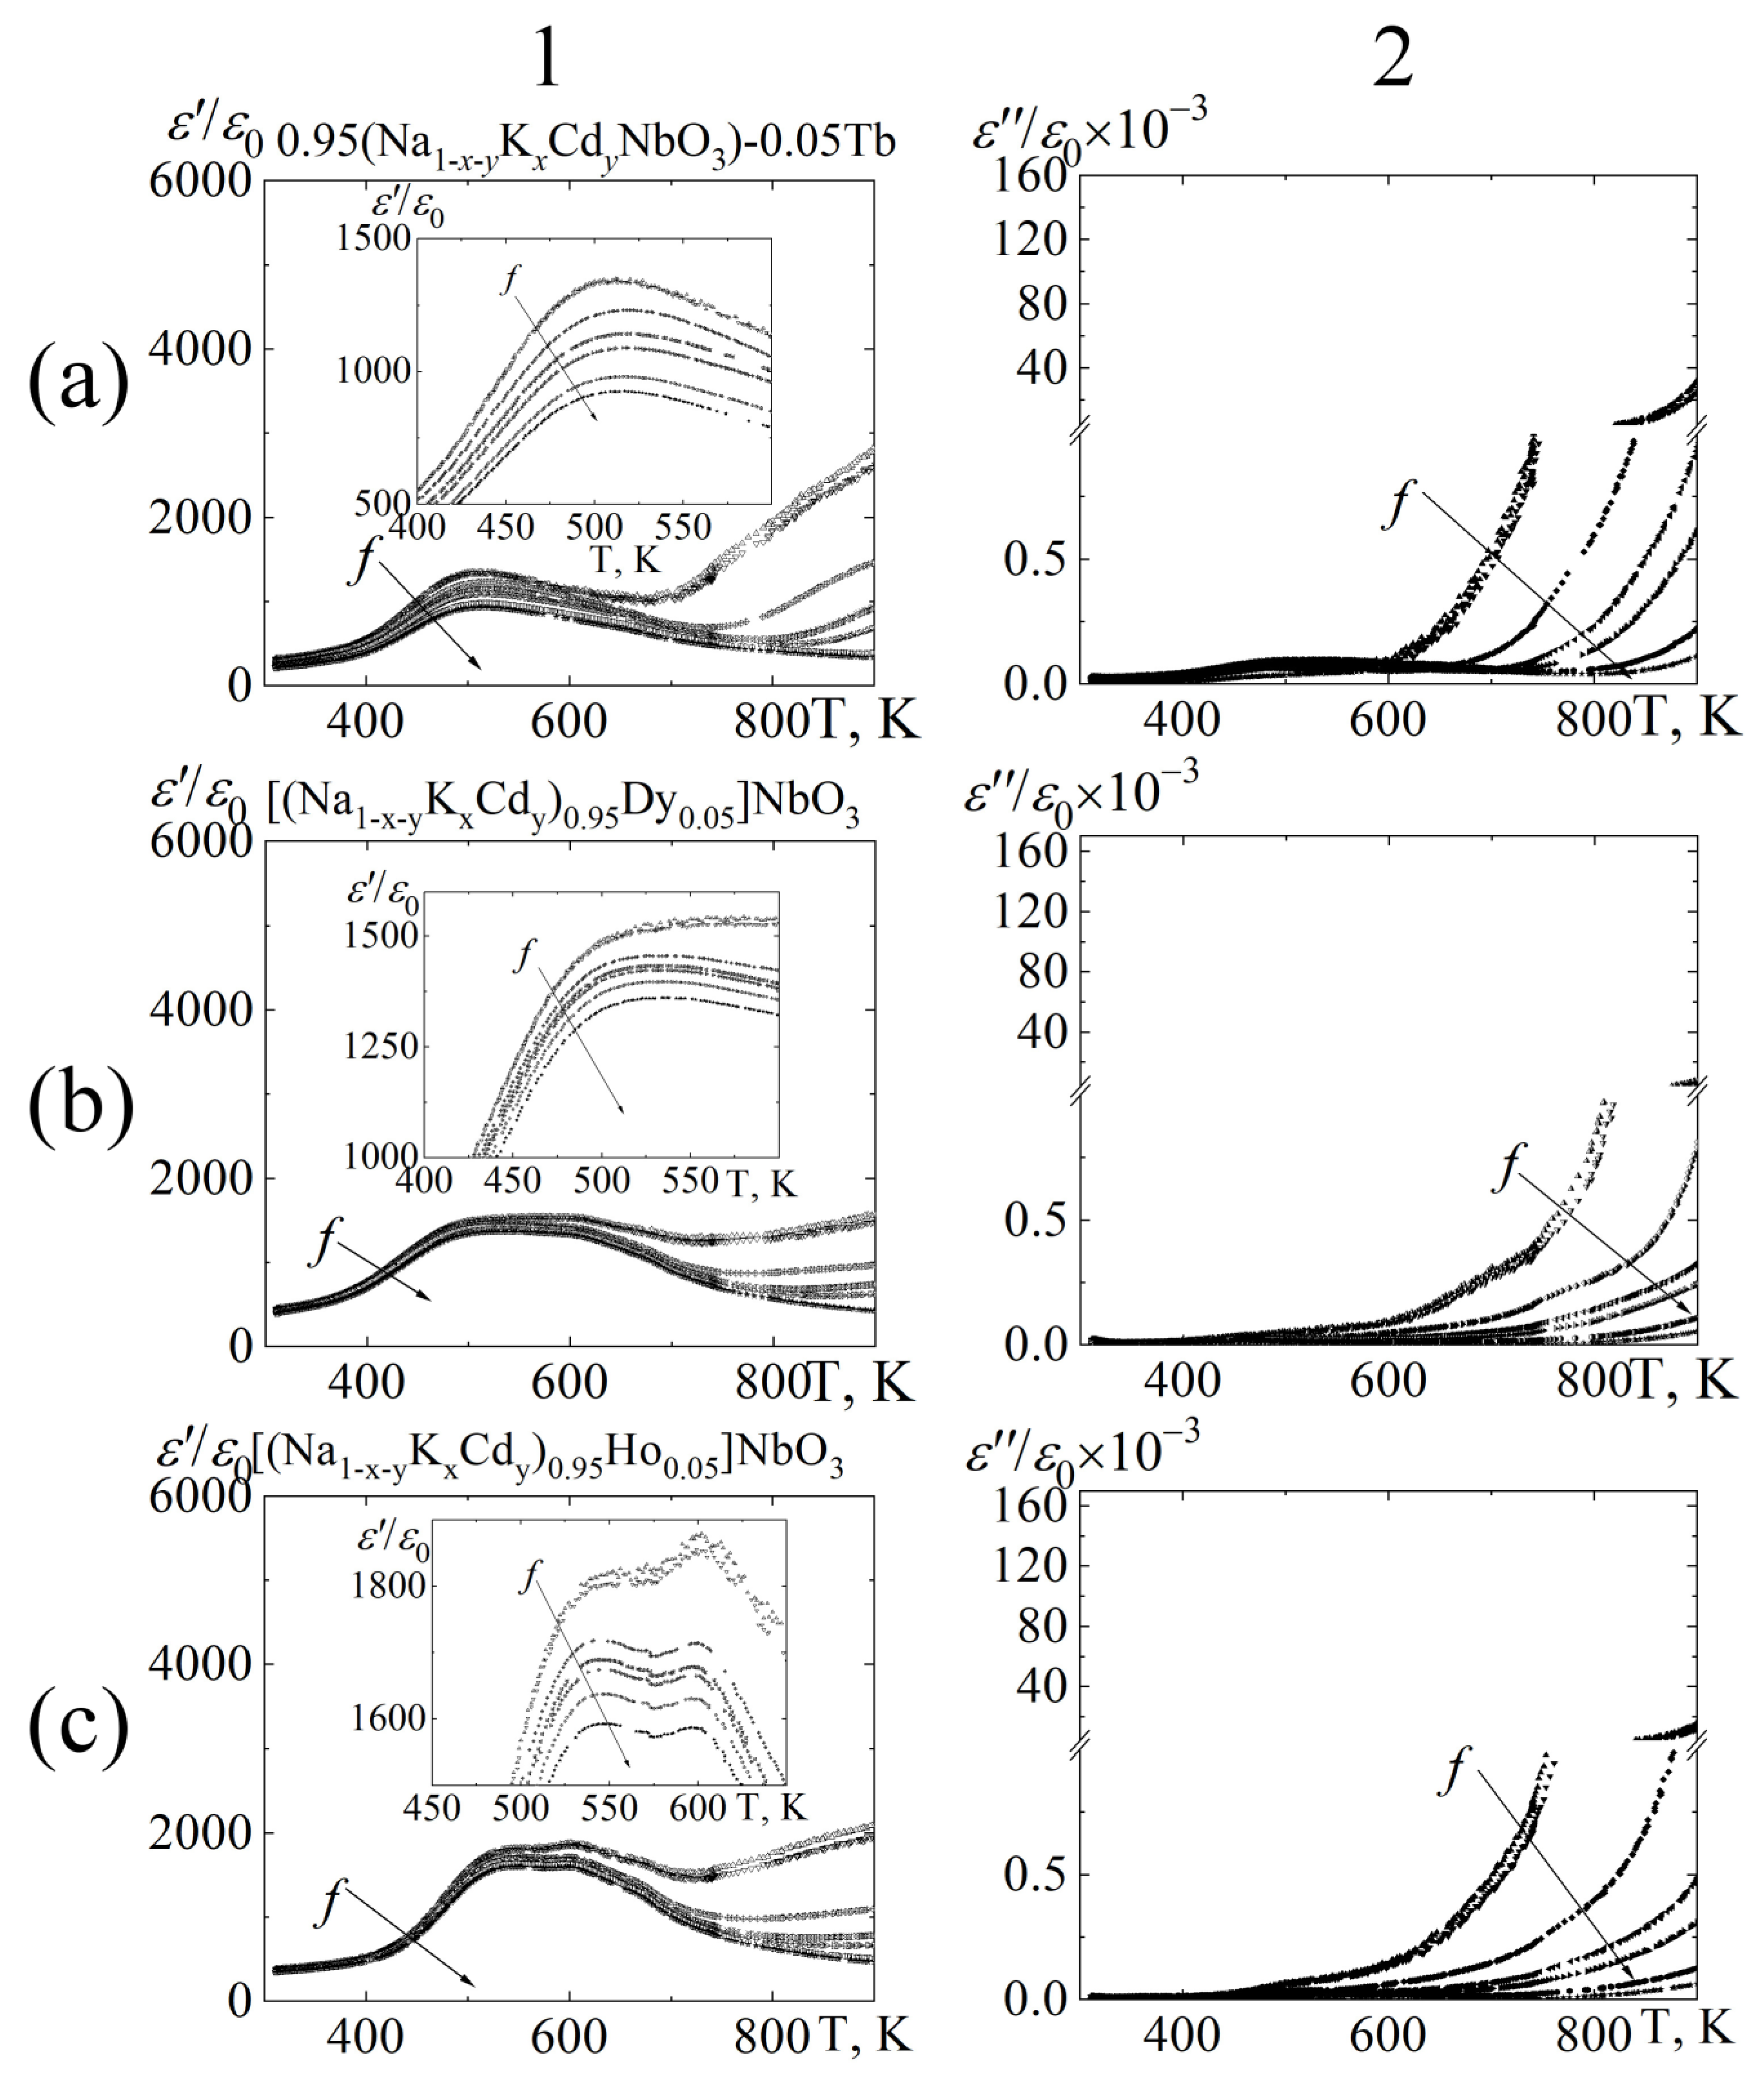
3.3. Dielectric Properties
3.4. Thermophysical Properties
3.5. Microhardness
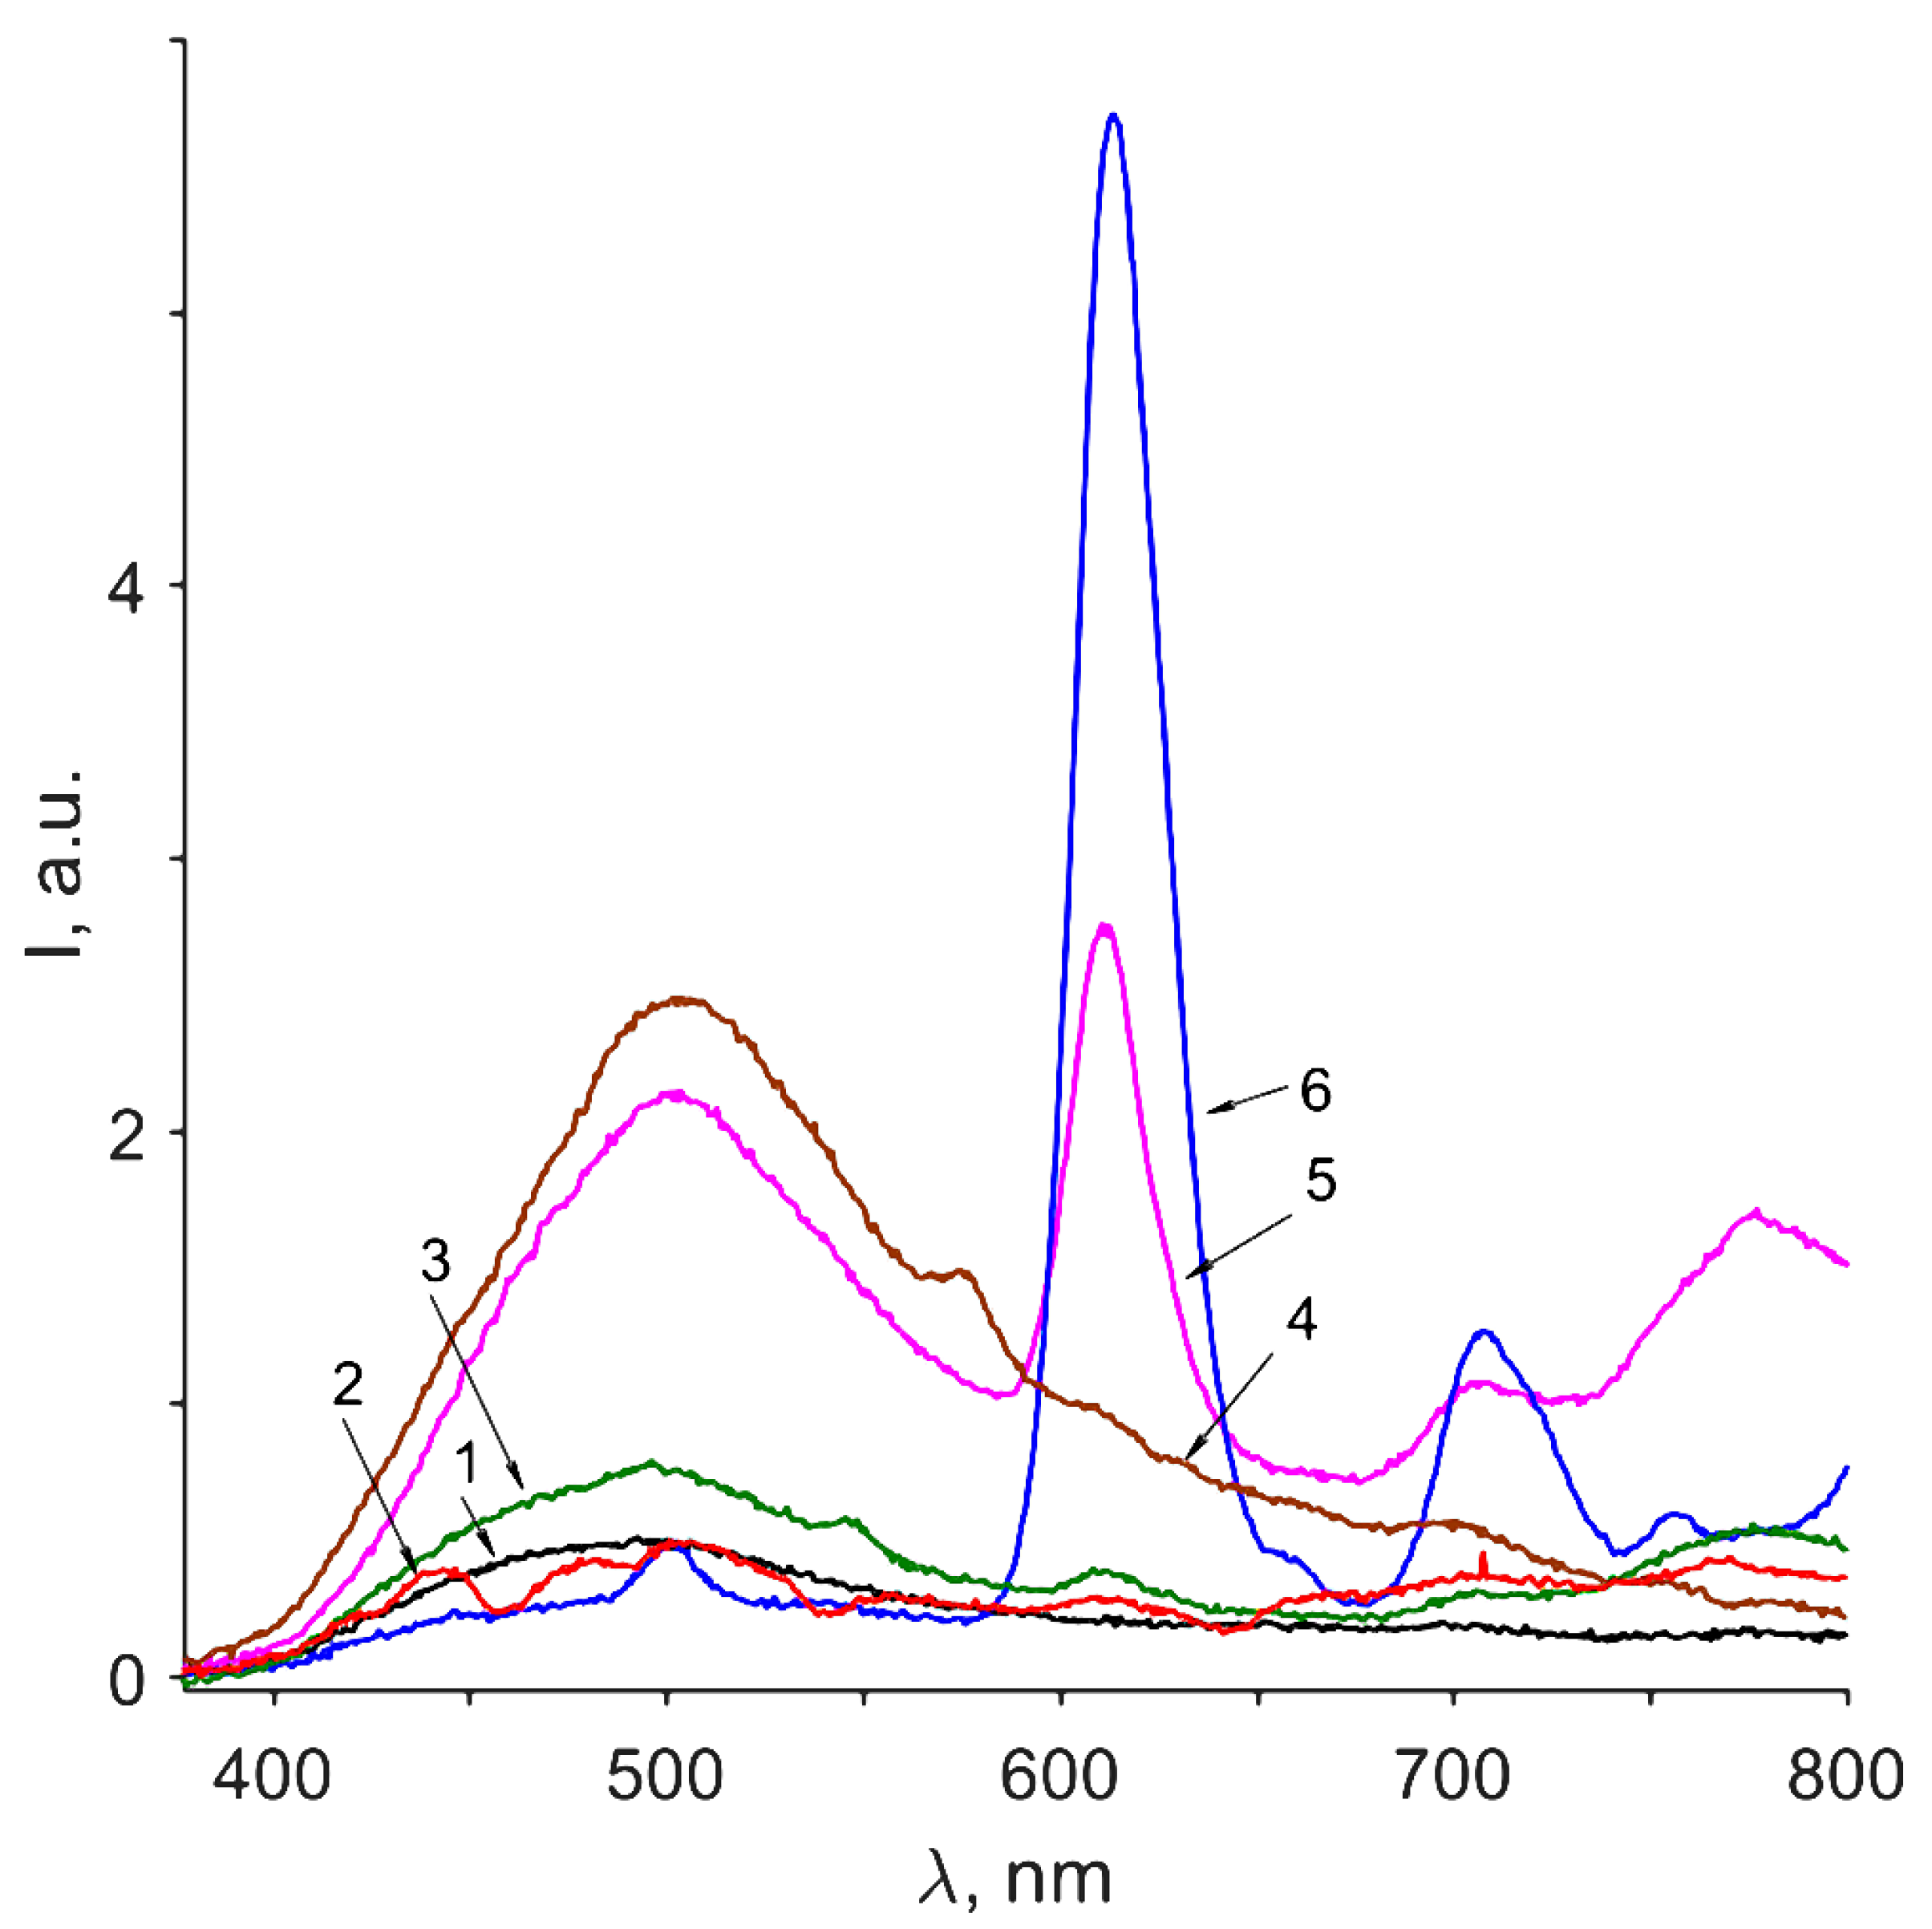
3.6. Photoluminescence
4. Conclusions
Author Contributions
Funding
Institutional Review Board Statement
Informed Consent Statement
Data Availability Statement
Acknowledgments
Conflicts of Interest
References
- Von Hippel, A. Ferroelectricity, domain structure, and phase transitions of barium titanate. Rev. Modern Phys. 1950, 22, 221–237. [Google Scholar] [CrossRef]
- Merz, W.J. Domain properties in BaTiO3. Phys. Rev. 1952, 88, 421–422. [Google Scholar] [CrossRef]
- Landauer, R. Electrostatic considerations in BaTiO3 domain formation during polarization reversal. J. Appl. Phys. 1957, 28, 227–234. [Google Scholar] [CrossRef]
- Last, J.T. Infrared-absorption studies on barium titanate and related materials. Phys. Rev. 1957, 105, 1740–1750. [Google Scholar] [CrossRef]
- Wentz, J.L.; Kennedy, L.Z. Primary pyroelectric effect in the PZT 95/5 ceramic. J. Appl. Phys. 1964, 35, 1767–1770. [Google Scholar] [CrossRef]
- Linde, R.K. Depolarization of ferroelectrics at high strain rates. J. Appl. Phys. 1967, 38, 4839–4842. [Google Scholar] [CrossRef]
- Carruthers, J.R.; Grasso, M. Phase equilibria relations in the ternary system BaO-SrO-Nb2O5. J. Electrochem. Soc. 1970, 117, 1426. [Google Scholar] [CrossRef]
- Itoh, Y.; Lwasaki, H. Tungsten bronze field in the pseudo-ternary system NaNbO5-BaTiO3-BaNb2O6. Mat. Res. Bull. 1972, 7, 663–672. [Google Scholar] [CrossRef]
- Ogawa, T.; Wakino, K. The temperature property of frequency constant of Pb(Sn1/2Sb1/2)O3-PbTiO3-PbZrO3 piezoelectric ceramics. J. Jpn. Soc. Powder Powder Metall. 1977, 24, 123–127. [Google Scholar] [CrossRef]
- Gonnard, P.; Troccaz, M. Dopant Distribution between A and B Sites in the PZT Ceramics of Type ABO3. J. Sol. St. Chem. 1978, 23, 321–326. [Google Scholar] [CrossRef]
- Tsubouchi, N.; Takahashi, M.; Chino, T.; Akashi, T.; Tokyo-to, Japan, Tokyo, Assignors to Nippon Electric Company, Limited. Piezoelectric Ceramic. US Patent No. 3595795, 1971. [Google Scholar]
- Nippon Electric Company, Limited, Tokyo, Japan. Piezoelectric Ceramic Material. France Patent No. FR1580831A, 28 December 1969. [Google Scholar]
- Murty, S.N.; Ramana, K.V.M.; Umakantham, K.; Bhanumathi, A. Modified (NaK)NbO3 ceramics for transducer applications. Ferroelectrics 1990, 102, 243–247. [Google Scholar] [CrossRef]
- Murty, S.N. Piezoelectric (NaK)NbO3 ceramics for ultrasonic delay line applications. Ferroelectrics 1994, 154, 171–176. [Google Scholar] [CrossRef]
- Shan, Y.; Sinozaki, N.; Nakamura, T. Preparation and characterizations of new perovskite oxides (LaxNa1−3x−yLiy□2x)NbO3 (0.0 ≤ x and y ≤ 0.2). Sol. St. Ion. 1998, 108, 403–406. [Google Scholar] [CrossRef]
- Wang, X.; Helmersson, U.; Olafsson, S.; Rudner, S.; Wernlund, L.D.; Gevorgian, S. Growth and field dependent dielectric properties of epitaxial Na0.5K0.5NbO3 thin films. Appl. Phys. Lett. 1998, 73, 927–929. [Google Scholar] [CrossRef]
- EU. Commision Directive 2013/28/EU of 17 May 2013 amending annex II to directive 2000/53/EC of the European Parliament and of the Council on end-of-life vehicles. Off. J. Eur. Union 2013, L135, 14–18. [Google Scholar]
- Zhang, S.T.; Kounga, A.B.; Aulbach, E.; Ehrenberg, H.; Rödel, J. Giant strain in lead-free piezoceramics Bi0.5Na0.5TiO3-BaTiO3-K0.5Na0.5NbO3 system. Appl. Phys. Lett. 2007, 91, 2–5. [Google Scholar] [CrossRef]
- Rödel, J.; Jo, W.; Seifert, K.T.P.; Anton, E.M.; Granzow, T.; Damjanovic, D. Perspective on the development of lead-free piezoceramics. J. Amer. Ceram. Soc. 2009, 92, 1153–1177. [Google Scholar] [CrossRef]
- Matsubara, M.; Yamaguchi, T.; Wataru, S.; Koichi, K.; Yogo, T.; Hirano, S. Processing and Piezoelectric Properties of Lead-Free (K, Na)(Nb, Ta)O3 Ceramics. J. Am. Ceram. Soc. 2005, 88, 1190–1196. [Google Scholar] [CrossRef]
- Verbenko, I.A.; Razumovskaya, O.N.; Shilkina, L.A.; Reznichenko, L.A.; Andryushin, K.P. Production and dielectric properties of lead-free ceramics with the formula [(Na0.5K0.5)1-xLix](Nb1-y-zTaySbz)O3. Inorg. Mater. 2009, 45, 702–708. [Google Scholar] [CrossRef]
- Saito, Y.; Takao, H.; Tani, T.; Nonoyama, T.; Takatori, K.; Homma, T.; Nagaya, T.; Nakamura, M. Lead-free piezoceramics. Nature 2004, 432, 84–87. [Google Scholar] [CrossRef]
- Li, P.; Zhai, J.; Shen, B.; Zhang, S.; Li, X.; Zhu, F.; Zhang, X. Ultrahigh piezoelectric properties in textured (K, Na)NbO3-based lead-free ceramics. Adv. Mater. 2018, 30, 1705171. [Google Scholar] [CrossRef]
- Wu, J.; Xiao, D.; Zhu, J. Potassium-sodium niobate lead-free piezoelectric materials: Past, present, and future of phase boundaries. Chem. Rev. 2015, 115, 2559–2595. [Google Scholar] [CrossRef]
- Jo, W.; Dittmer, R.; Acosta, M.; Zang, J.; Groh, C.; Sapper, E.; Wang, K.; Rödel, J. Giant electric-field-induced strains in lead-free ceramics for actuator applications—Status and perspective. J. Electroceram. 2012, 29, 71–93. [Google Scholar] [CrossRef]
- Li, W.; Hao, J.; Li, W.; Du, J.; Fu, P.; Sun, W.; Chen, C.; Xu, Z.; Chu, R. Electrical properties and luminescence properties of 0.96(K0.48Na0.52)(Nb0.95Sb0.05)–0.04Bi0.5(Na0.82K0.18)0.5ZrO3-xSm lead-free ceramics. J. Adv. Ceram. 2020, 9, 72–82. [Google Scholar] [CrossRef]
- Andryushin, K.P.; Shilkina, L.A.; Andryushina, I.N.; Moysa, M.O.; Rudsky, D.I.; Reznichenko, L.A. Crystal structure, polarization properties and reverse nonlinearity of solid solutions of the KNN-PZT system in a wide range of external influences. Ceram. Intern. 2021, 47, 138–148. [Google Scholar] [CrossRef]
- Nagaenko, A.V.; Chang, S.H.; Andryushin, K.P.; Shilkina, L.A.; Mazuritskiy, M.I.; Andryushina, I.N.; Glazunova, E.V.; Pavelko, A.A.; Trusov, Y.A.; Verbenko, I.A.; et al. Multi-element ferroactive materials based on KNN-PZT compositions with fundamentally different physical properties. Heliyon 2020, 6, e03497. [Google Scholar] [CrossRef] [PubMed]
- Rödel, J.; Webber, K.G.; Dittmer, R.; Jo, W.; Kimura, M.; Damjanovic, D. Transferring lead-free piezoelectric ceramics into application. J. Europ. Ceram. Soc. 2015, 35, 1659–1681. [Google Scholar] [CrossRef]
- Andryushin, K.; Shilkina, L.; Andryushina, I.; Nagaenko, A.; Moysa, M.; Dudkina, S.; Reznichenko, L. Features of the Structure and Electrophysical Properties of Solid Solutions of the System (1-x-y) NaNbO3-xKNbO3-yCd0.5NbO3. Materials 2021, 14, 4009. [Google Scholar] [CrossRef]
- Isupov, V.A. Physical phenomena in ferroelectric complex perovskites. Bull. Acad. Sci. U.S.S.R. Phys. Ser. 1982, 47, 136–141. [Google Scholar]
- Von der Mühll, R.; Sadel, A.; Hagenmuller, P. Structure cristallinea 295 K de la phase ferroelectrique Li0,02Na0,98NbO3. J. Sol. St. Chem. 1984, 51, 176–182. [Google Scholar] [CrossRef]
- Isupov, V.A. Crumbling -type phase transitions. Cryst. Rep. 1959, 4, 603–608. (In Russian) [Google Scholar]
- Megaw, H.D. The Seven Phases of Sodium Niobate. Ferroelectrics 1974, 7, 87–89. [Google Scholar] [CrossRef]
- Chen, J.; Feng, D. In situ TEM studies of para-ferro phase transitions in NaNbO3. Phys. Stat. Sol. A 1988, 109, 427–434. [Google Scholar] [CrossRef]
- Reznichenko, L.A.; Shilkina, L.A. Morphotropic Phase in the NaNbO3-LiNbO3 Solid-Solution System. Bull. Acad. Sci. U.S.S.R. Phys. Ser. 1975, 39, 1118–1121. [Google Scholar]
- Reznichenko, L.A.; Shilkina, L.A.; Razumovskaya, O.N.; Dudkina, S.I.; Gagarina, E.S.; Borodin, A.V. Dielectric and piezoelectric properties of NaNbO3-based solid solutions. Inorg. Mater. 2003, 39, 139–151. [Google Scholar] [CrossRef]
- Fesenko, E.G. The Perovskite Family and Ferroelectricity; (In Russian: Semejstvo Perovskita I Segnetoehlektrichestvo); Atomizdat: Moscow, Russia, 1972. [Google Scholar]
- JCPDS. Powder Diffraction File; Data Card. Inorganic Section. Set, card; JCPDS: Swarthmore, PA, USA, 1948. [Google Scholar]
- Urusov, V.S. Theory of Isomorphic Miscibility; Science: Moscow, Russia, 1977; (In Russian: Teoriya izomorfnoy smesimosti). [Google Scholar]
- Dantsiger, A.Y.; Reznitchenko, L.A.; Dudkina, S.I.; Razumovskaya, O.N.; Shilkina, L.A. Correlation between the microstructure of ferroelectric ceramics and their chemical and phase composition, the degree of perfection of the crystal structure and the preparation conditions. Ferroelectrics 1998, 214, 255–259. [Google Scholar] [CrossRef]
- Rao, C.N.R.; Gopalakrishnan, J. New Directions in Solid State Chemistry; Cambridge University Press: Cambridge, UK, 1986. [Google Scholar]
- Hedvall, J.A. Über die physikalisch-chemischen Prozesse beim Zusammenbacken von angeschmolzenen Pulvern. Z. Phys. Chem. 1926, 123U, 33–85. [Google Scholar] [CrossRef]
- Liu, L.; Huang, Y.; Li, Y.; Fang, L.; Dammak, H.; Fan, H.; Thi, M.P. Orthorhombic to tetragonal structural phase transition in Na0.5K0.5NbO3-based ceramics. Mater. Lett. 2012, 68, 300–302. [Google Scholar] [CrossRef]
- Du, H.; Huang, Y.H.; Tang, H.; Qin, H.; Feng, W. Dielectric and piezoelectric properties of SrZrO3 -modified (K0.45Na0.51Li0.04)(Nb0.90Ta0.04Sb0.06)O3 lead-free piezoceramics. Mater. Lett. 2013, 106, 141–144. [Google Scholar] [CrossRef]
- Shi, W.; Feng, Y.; Lu, T.; Lu, Y.; Shen, J.; Xue, J.; Du, J.; Fu, P.; Hao, J.; Li, W. Photoluminescence and impedance properties of rare-earth doped (K0.5Na0.5)NbO3 lead-free ceramics. J. Mater. Sci. Mater. Electron. 2019, 30, 9–16. [Google Scholar] [CrossRef]
- Egerton, L.; Dillon, D.M. Piezoelectric and Dielectric Properties of Ceramics in the System Potassium—Sodium Niobate. J. Amer. Ceram. Soc. 1959, 42, 438–442. [Google Scholar] [CrossRef]
- Zhang, N.; Lv, X.; Zhang, X.-X.; Lyu, X.; Yang, S.-W.; Wu, J. Low-temperature dielectric relaxation associated with NbO6 octahedron distortion in antimony modified potassium sodium niobate ceramics. J. Mater. Sci. Technol. 2022, 115, 189–198. [Google Scholar] [CrossRef]
- Uchino, K.; Nomura, S. Critical exponents of the dielectric constants in diffused-phase-transition crystals. Ferroelectrics 1982, 44, 55–61. [Google Scholar] [CrossRef]
- Liu, L.; Knapp, M.; Ehrenberg, H.; Fang, L.A.; Fan, H.; Schmitt, L.; Fuess, H.; Hoelzel, M.; Dammak, H.; Thi, M.P.; et al. Average vs. local structure and composition-property phase diagram of K0.5Na0.5NbO3-Bi½Na½TiO3 system. J. Europ. Ceram. Soc. 2017, 37, 1387–1399. [Google Scholar] [CrossRef]
- Zhai, Y.; Du, J.; Chen, C.; Hao, J.; Fu, P.; Li, W.; Xu, Z. Temperature stability and electrical properties of Tm2O3 doped KNN-based ceramics. J. Mater. Sci. Mater. Electron. 2019, 30, 4716–4725. [Google Scholar] [CrossRef]
- Oliver, W.; Pharr, G.M. Measurement of hardness and elastic modulus by instrumented indentation: Advances in understanding and refinements to methodology. J. Mater. Res. 2004, 19, 3. [Google Scholar] [CrossRef]
- Maslenikov, I.I.; Reshetov, V.N.; Useinov, A.S. Mapping the elastic modulus of a surface with a NanoScan 3D scanning microscope. Instrum. Experim. Tech. 2015, 58, 711–717. [Google Scholar] [CrossRef]
- Anstis, G.R.; Chantikul, P.; Lawn, B.R.; Marshall, D. A Critical Evaluation of Indentation Techniques for Measuring Fracture Toughness: I, Direct Crack Measurements. Transformation 1981, 46, 533–538. [Google Scholar] [CrossRef]
- Chantikul, P.; Anstis, G.R.; Lawn, B.R.; Marshall, D. A Critical Evaluation of Indentation Techniques for Measuring Fracture Toughness: II, Strength Method. J. Amer. Ceram. Soc. 1981, 64, 539–543. [Google Scholar] [CrossRef]
- Blasse, G.; Bril, A. Luminescence phenomena in compounds with fergusonite structure. J. Luminesc. 1970, 3, 109–131. [Google Scholar] [CrossRef]
- Blasse, G.; De Haart, L. The nature of the luminescence of niobates MNbO3 (M = Li, Na, K). Mater. Chem. Phys. 1986, 14, 481–484. [Google Scholar] [CrossRef]
- Shaskolskaya, M.P. Crystallography: Textbook. Manual for Technical Colleges, 2nd ed.; Higher School: Moscow, Russia, 1984; (In Russian: Kristallografiya: Ucheb. posobiye dlya vtuzov. -2-ye izd., pererab. i dop.). [Google Scholar]
- Verma, R.K.; Kumar, K.; Rai, S. Inter-conversion of Tb3+ and Tb4+ states and its fluorescence properties in MO-Al2O3: Tb (M = Mg, Ca, Sr, Ba) phosphor materials. Sol. St. Sci. 2010, 12, 1146–1151. [Google Scholar] [CrossRef]
- Wen, R.; Zhou, L.; Zou, X.; Luo, L.; Jiang, N.; Zheng, Q.; Liao, J.; Xu, C.; Lin, D. Phase transition, electrical and luminescent properties of Dy-doped K0.5Na0.5NbO3-based lead-free ceramics. J. Mater. Sci: Mater. Electron. 2015, 26, 8341–8349. [Google Scholar] [CrossRef]
- Ramachari, D.; Moorthy, L.R.; Jayasankar, C.K. Energy transfer and photoluminescence properties of Dy3+/Tb3+ co-doped oxyfluorosilicate glass-ceramics for solid-state white lighting. Ceram. Intern. 2014, 40, 11115–11121. [Google Scholar] [CrossRef]
- Zhang, Y.; Liu, J.; Sun, H.; Peng, D.; Li, R.; Bulin, C.; Wang, X.; Zhang, Q.; Hao, X. Reversible luminescence modulation of Ho-doped K0.5Na0.5NbO3 piezoelectrics with high luminescence contrast. J. Am. Ceram. Soc. 2018, 101, 2305–2312. [Google Scholar] [CrossRef]
- Yang, X.; Zhao, L.; Chen, W.; Liu, Z.; Fan, X.; Tian, S.; Xu, X.; Qiu, J.; Yu, X. Low-temperature red long-persistent luminescence of Pr3+ doped NaNbO3 with a perovskite structure. J. Luminesc. 2019, 208, 290–295. [Google Scholar] [CrossRef]
- Kir’yanov, A.V.; Aboites, V.; Belovolov, A.M.; Damzen, M.; Minassian, A.; Timoshechkin, M.; Belovolov, M. Visible-to-near-IR luminescence at stepwise up-conversion in Yb, Ho: GGG under IR diode pumping. J. Lumines. 2003, 102–103, 715–721. [Google Scholar] [CrossRef]
- Schuyt, J.J.; Williams, G.V.M. Photoluminescence of Dy3+ and Dy2+ in NaMgF3:Dy: A potential infrared radiophotoluminescence dosimeter. Radiat. Meas. 2020, 134, 106326. [Google Scholar] [CrossRef]


 8∙102 Hz;
  1.0 104 Hz;
  1.0∙105 Hz;
  5.2∙105 Hz;
  2.5∙106 Hz;
  7.2∙106 Hz;
  1.2∙107 Hz.
8∙102 Hz; 1.0 104 Hz; 1.0∙105 Hz; 5.2∙105 Hz; 2.5∙106 Hz; 7.2∙106 Hz; 1.2∙107 Hz.
1.2∙107 Hz.
8∙102 Hz; 1.0 104 Hz; 1.0∙105 Hz; 5.2∙105 Hz; 2.5∙106 Hz; 7.2∙106 Hz; 1.2∙107 Hz.
 8 ∙102 Hz; 1.0 104 Hz; 1.0∙105 Hz; 5.2∙105 Hz; 2.5∙106 Hz; 7.2∙106 Hz; 1.2∙107 Hz.
8 ∙102 Hz; 1.0 104 Hz; 1.0∙105 Hz; 5.2∙105 Hz; 2.5∙106 Hz; 7.2∙106 Hz; 1.2∙107 Hz.
8 ∙102 Hz; 1.0 104 Hz; 1.0∙105 Hz; 5.2∙105 Hz; 2.5∙106 Hz; 7.2∙106 Hz; 1.2∙107 Hz.

 96 Hz; 8∙102 Hz; 1.0 104 Hz; 1.0∙105 Hz; 2.5∙105 Hz; 7.2∙106 Hz; 7.2∙106 Hz; 1.2∙107 Hz.
96 Hz; 8∙102 Hz; 1.0 104 Hz; 1.0∙105 Hz; 2.5∙105 Hz; 7.2∙106 Hz; 7.2∙106 Hz; 1.2∙107 Hz.
96 Hz; 8∙102 Hz; 1.0 104 Hz; 1.0∙105 Hz; 2.5∙105 Hz; 7.2∙106 Hz; 7.2∙106 Hz; 1.2∙107 Hz. 96 Hz; 8∙102 Hz; 1.0 104 Hz; 1.0∙105 Hz; 2.5∙105 Hz; 7.2∙106 Hz; 7.2∙106 Hz; 1.2∙107 Hz.
96 Hz; 8∙102 Hz; 1.0 104 Hz; 1.0∙105 Hz; 2.5∙105 Hz; 7.2∙106 Hz; 7.2∙106 Hz; 1.2∙107 Hz.
96 Hz; 8∙102 Hz; 1.0 104 Hz; 1.0∙105 Hz; 2.5∙105 Hz; 7.2∙106 Hz; 7.2∙106 Hz; 1.2∙107 Hz.


| Composition | Symmetry | a = c, Å | b, Å | β (°) | V, Å3 | ρexp. g/cm3 | ρrel., % |
|---|---|---|---|---|---|---|---|
| Na0.9K0.05Cd0.05NbO3 | M | 3.922 | 3.893 | 90.26 | 59.9 | 4.59 | 99.6 |
| [(Na1-x-yKxCdy)0.95La0.05]NbO3 | PsC | 3.921 | 60.3 | 4.58 | 100 | ||
| [(Na1-x-yKxCdy)0.95Pr0.05]NbO3 | PsC | 3.916 | 60.03 | 4.62 | 100 | ||
| [(Na1-x-yKxCdy)0.95Tb0.05]NbO3 | M | 3.921 | 3.903 | 90.43 | 60.0 | 4.54 | 98.2 |
| [(Na1-x-yKxCdy)0.95Dy0.05]NbO3 | M | 3.921 | 3.896 | 90.54 | 59.9 | 4.77 | 102 |
| [(Na1-x-yKxCdy)0.95Ho0.05]NbO3 | M | 3.921 | 3.899 | 90.54 | 59.96 | 4.73 | 102 |
| Composition | Young’s Modulus, E, GPa | Microhardness, H, GPa | Crack Resistance, Kic, MPa m0.5 |
|---|---|---|---|
| Na0.90K0.05Cd0.05NbO3 | 297.8 ± 5.4 | 4.15 ± 0.49 | 2.34 ± 0.15 |
| [(Na0.90K0.05Cd0.05)0.95La0.05]NbO3 | 302.0 ± 3.2 | 6.11 ± 0.62 | 2.06 ± 0.2 |
| [(Na0.90K0.05Cd0.05)0.95Pr0.05]NbO3 | 347.3 ± 4.3 | 8.42 ± 1.33 | 2.2 ± 0.7 |
| [(Na0.90K0.05Cd0.05)0.95Tb0.05]NbO3 | 352.3 ± 5.9 | 4.47 ± 0.7 | 2.32 ± 0.35 |
| [(Na0.90K0.05Cd0.05)0.95Dy0.05]NbO3 | 369.9 ± 4.2 | 5.3 ± 0.96 | 2.02 ± 0.1 |
| [(Na0.90K0.05Cd0.05)0.95Ho0.05]NbO3 | 320.8 ± 5.5 | 4.85 ± 0.59 | 1.86 ± 0.2 |
Disclaimer/Publisher’s Note: The statements, opinions and data contained in all publications are solely those of the individual author(s) and contributor(s) and not of MDPI and/or the editor(s). MDPI and/or the editor(s) disclaim responsibility for any injury to people or property resulting from any ideas, methods, instructions or products referred to in the content. |
© 2023 by the authors. Licensee MDPI, Basel, Switzerland. This article is an open access article distributed under the terms and conditions of the Creative Commons Attribution (CC BY) license (https://creativecommons.org/licenses/by/4.0/).
Share and Cite
Konstantin, A.; Palatnikov, M.; Shilkina, L.; Nagaenko, A.; Shcherbina, O.; Smirnov, M.; Sidorov, N.; Kubrin, S.; Rudskaya, A.; Rudskiy, D.; et al. Multifunctional Materials Based on the Solid Solutions of the (Na, K, Cd0.5)NbO3 (KNN-Cd) System Modified with Rare Earth Elements: Crystal Structure, Microstructure, and Macroresponses. Ceramics 2023, 6, 342-363. https://doi.org/10.3390/ceramics6010021
Konstantin A, Palatnikov M, Shilkina L, Nagaenko A, Shcherbina O, Smirnov M, Sidorov N, Kubrin S, Rudskaya A, Rudskiy D, et al. Multifunctional Materials Based on the Solid Solutions of the (Na, K, Cd0.5)NbO3 (KNN-Cd) System Modified with Rare Earth Elements: Crystal Structure, Microstructure, and Macroresponses. Ceramics. 2023; 6(1):342-363. https://doi.org/10.3390/ceramics6010021
Chicago/Turabian StyleKonstantin, Andryushin, Mikhail Palatnikov, Lidiya Shilkina, Alexandr Nagaenko, Olga Shcherbina, Maxim Smirnov, Nikolay Sidorov, Stanislav Kubrin, Anzhela Rudskaya, Daniil Rudskiy, and et al. 2023. "Multifunctional Materials Based on the Solid Solutions of the (Na, K, Cd0.5)NbO3 (KNN-Cd) System Modified with Rare Earth Elements: Crystal Structure, Microstructure, and Macroresponses" Ceramics 6, no. 1: 342-363. https://doi.org/10.3390/ceramics6010021