Article

Smart Diet Diary: Real-Time Mobile Application for Food Recognition

1
College of Engineering and Technology, American University of the Middle East, Egaila 54200, Kuwait
2
Department of Electrical, Computer, and Software Engineering, The University of Auckland, Auckland 1010, New Zealand
*
Author to whom correspondence should be addressed.
Appl. Syst. Innov. 2023, 6(2), 53; https://doi.org/10.3390/asi6020053
Submission received: 20 February 2023 / Revised: 29 March 2023 / Accepted: 18 April 2023 / Published: 20 April 2023
(This article belongs to the Special Issue Machine Learning for Digital Health and Bioinformatics)

Abstract

:
Growing obesity has been a worldwide issue for several decades. This is the outcome of common nutritional disorders which results in obese individuals who are prone to many diseases. Managing diet while simultaneously dealing with the obligations of a working adult can be difficult. This paper presents the design and development of a smartphone-based diet-tracking application, Smart Diet Diary, to assist obese people as well as patients to manage their dietary intake for a healthier life. The proposed system uses deep learning to recognize a food item and calculate its nutritional value in terms of calorie count. The dataset used comprises 16,000 images of food items belonging to 14 different categories to train a multi-label classifier. We applied a pre-trained faster R-CNN model for classification and achieved an overall accuracy of approximately 80.1% and an average calorie computation within 10% of the real calorie value.

1. Introduction

Obesity is a worldwide issue that accounts for 8% of global deaths annually [1]. People with obesity are at higher risks for many serious diseases and health conditions, including high blood pressure, dyslipidemia, diabetes, cardiac arrest, gallbladder disease, osteoarthritis, sleeping problems, respiratory problems, mental illness, and an overall low quality of life. In addition, this creates problems in maintaining proper posture while working or sleeping, resulting in stress injuries [2,3]. Although the genes of a person play a role in body weight [4], there are other reasons behind obesity, such as certain medications, stress, lack of exercise, and irregular sleep habits. Dietary intake is one of the major causes of excess weight and fat accumulation. A higher than required intake of food results in surplus calories that are not consumed.
Researchers have explored dietary and activity assessments as solutions to raise awareness and address obesity. Recently, many healthcare studies have focused on dietary records and controls to provide useful information to prevent the occurrence of chronic illnesses. Currently, three types of methods are used to manually assess dietary intake: diet records [5], 24 h recall [6], and food frequency questionnaire (FFQ) [7]. For diet histories, users were required to store food intake over three consecutive days. The participants were provided with detailed instructions by trained staff on how to record intake, which was also stored in the Nutrition Data System for Research (NDSR) for analysis. The 24 h Recall (24HR) is a structured interview that permits users to record comprehensive information of the diet consumed by the participant during the previous 24 h. It is primarily used by researchers to understand the habitual consumption of food. However, 24HR has many drawbacks, including high cost and administration time [8]. The FFQ method requires the subject to report the frequency of food and beverage consumption over a period of up to one year. The majority of FFQs are accessible in paper or electronic formats, displaying common questions about daily diet. This requires participants to manually measure their food consumption and then record these facts in a notebook diary.
There are several smartphone-based health applications equipped with features to keep record of the diet consumed and the physical activities performed; however, users must manually enter all their information. In addition, fine-grained and preemptive food intake measurement systems do not exist at present; they are either precise and consume too much time, or are less precise and unobtrusive. The dietary assessment systems that are not tedious and time-consuming are in high demand in the healthcare field. To target these two factors, researchers have placed an extensive amount of effort into analyzing dietary information analysis using visuals [3,4,5,6,7,8]. The available solutions range from manual diet tracking (paper diaries or digital diary/smartphone apps) to more automated applications using image recognition. These solutions can be classified into three main categories: manual self-reporting methods, semi-automatic sensor methods, and automatic sensor and mobile methods.
Recent developments in smartphone digital cameras have provided researchers with the opportunity to develop a system for accurate dietary assessment. Investigations have shown that the image-based approach is more accurate than the proxy-assisted method. Although several promising image-based calorie assessment systems exist, they emphasize on diet recognition and classification without considering food weight and volume. Therefore, the values obtained are not reliable, as without food mass, the calorie content of food cannot be precisely approximated. Thus, extracting the weight of food from an image is an important problem and needs attention. Manual methods rely on the self-reporting of food intake in paper diaries [5] or digital diaries in the form of a mobile app [9]. Semi-automatic methods have been introduced to address under-reporting by utilizing different wearable technologies to automate parts of the meal recording process [10], but many application features still require input from the user. In addition, they do not provide feedback on the user’s diet [11]. Fully automated systems come in the form of wearable devices that aim to minimize user interaction in food intake tracking [12].
The advantages of recording diet intake have been researched extensively [13]. In recent years, a considerable amount of the literature has been published on mobile calorie-tracking applications that utilize built-in cameras [14]. These studies often involve two key components: (1) food recognition and (2) volume estimation. Lately, researchers have suggested a deep learning model called a convolutional neural network (CNN), which eases the complexity and the number of weights due to a shared-weight network arrangement. It is widely applied in the domains of object recognition [15] and image segmentation [16,17]. The research community has investigated the deployment of multitask CNNs for food identification and categorization at the same time [18,19]. The knowledge acquired from an individual CNN can be shared to enhance the accuracy of these functions. It is particularly beneficial for identifying dishes that have similar appearances or for creating a classifier with a wider reach, as food can be recognized by retrieving recipes from the database. The volume is estimated by building a 3D model of the food by extracting salient features from the picture [20] or by reconstructing a voxel description from a similar depth map [21]. An alternative method is to employ a reference article with a known size to match the food items. An example of the reference item can be chopsticks due to their universal size [22]. Other references include checkboard [23] and credit cards [24]. Extracting 3D information from a single image is a complex problem and a hindrance to fully automated solutions which requires attention. Additionally, there is no single food recognition system that could recognize all kinds of foods. Therefore, researchers have focused on developing a solution which can solve their endemic problems.
Other works have been dedicated to developing a food recognition system with greater precision by deploying CNN, but has not been successful in the delivery of processed information to the consumer and a healthcare staff in a quick and flexible way. We propose a user-friendly mobile application called Smart Diet Diary that overcomes the above shortcomings and improves semi-automatic calorie estimation using deep neural networks (DNNs) for object classification and detection; we use this information to calculate the volume and nutritional value. The current version of this application focuses on recognizing some of the most widely consumed food items by university students and their estimated nutritional value.
The major contributions of this study are as follows:
  • We developed a semi-automated diet tracking smartphone application based on a food recognition engine trained using faster R-CNN.
  • We developed our food recognition model for mobile application and extended it with a mechanism to calculate the volume and approximate calorie value.
  • We generated a customized food image dataset composed of over 16,000 images from fourteen classes to train and test the system.
  • We achieved a combined accuracy of approximately 80.1%, with a maximum of 90.2% for some of the classes.
The remainder of this paper is organized as follows. We present a detailed literature review of the techniques for food recognition and the calculation of nutritional values in Section 2. The details of our methodology and the structure of the food detection system are presented in Section 3, followed by Section 4, where features of mobile applications are presented. In Section 5, we evaluate our system using different images from the dataset and present the results of our experiments. In Section 5, we conclude the paper and discuss possible future work.

2. Related Work

Mobile technology is developing swiftly, and each generation is more capable and computationally powerful than the preceding one. Mobile multimedia services and applications, along with the quick development of wireless internet technologies that offer high data rates and wide-scale device connectivity, have the potential to completely change the healthcare industry. Numerous studies have been carried out to examine how mobile apps affect medical procedures. [25,26]. Likewise, social media usage addressing health-related issues has also been studied [27,28]. A comprehensive review and rating of mobile applications is presented in [29].
There are several approaches for food recognition. These are primarily based on sensors and images, are data-driven and hybrid, combining multiple approaches. The sensor-based approaches for food recognition use electronic sensors to detect the physical and chemical properties of food and then identify the food based on those properties. Most commonly used sensors include piezoelectric sensor [30,31,32], microphones [33], textile pressure sensor [34], ultrasonic sensor [35], accelerometers [36], and a combination of accelerometer, gyroscope, and piezoelectric [37]. Electronic sensor-based systems rely on machine learning algorithms for food recognition. These approaches can only recognize a limited number of food items with low accuracy.
Image-based recognition approaches use computer vision techniques to analyze images of food and identify their contents, detecting features sch as color, texture, and shape [38]. Sun et al. [12] recognized food categories using eButton, a camera in a button worn at the chest, for detecting common eating utensils and food. The food image was segmented using color and texture features, whereas the volume was anticipated through the wire-mesh technique. DietCam [20] required three images from different sides of the dish to construct a 3D shape of the food. The regular-shaped food is approximated as cylinders or spheres. From this, the volume is guessed, and calories are computed from the calorie density stored in a database. The accuracy of food detection is further enhanced by matching the dish with the menu of nearby restaurants based on the GPS location obtained from the phone. The author later employed a multi-view recognition approach to identify each food item by determining the optimal viewpoint and employed a probabilistic technique for recognition [39]. Menu-Match [40] identifies the food items and estimates calories from a single food image by utilizing a database of known food items, i.e., a menu. It uses a single image of the meal while factoring in its geometric properties with the help of shape templates to reconstruct the 3D map of the food and calculate its volume estimation. The author used GPS to restrict searches to restaurants within a small vicinity. NutriTrack [15] informs the users regarding the nutritional value of their food and their required calorie intake by using traditional image processing [41]. Miyazaki et al. [42] annotated a large number of food items with their nutritional values and stored them in a database. An image of the food was taken and then used to search similar food items to provide the calorie count, but this method is not accurate. Ref. [43] used Kinect cameras, which provides color as well depth information to estimate the calorie count of food, but they are impractical as mobiles are not equipped with depth cameras.
Data-driven recognition-based approaches use machine learning algorithms to analyze big datasets of the images of food and their labels. The algorithms learn to recognize patterns in the data and can be used to categorize new images using their similarity to the existing dataset [44]. There are several machine learning algorithms that are commonly used for food recognition such as SVM, random forests (RF), CNNs, deep belief networks (DBNs), and RNNs. Snap-n’-Eat [45] uses SVM for estimating nutrient intakes from images by distinguishing foods from the background, as well as from each other without any manual input, using features such as size, texture, and color, and estimates portion sizes based on the number of pixels. The system was trained with 2000 images for 15 classes and obtained an accuracy of around 85%. FoodCam [46] used linear SVM and then Fisher vector (FV) of HoG together with color patches. However, this technique required users to encircle the displayed food item. Keiji Yanai and Taichi Joutou [47] use multiple kernel learning (MKL) for automatic food recognition and reported a combined accuracy of 61% for 50 food classes.
Recently, various architectures of convolutional neural networks (CNNs) such as LeNet, VGGNet, GoogleNet, and AlexNet have also been used for food recognition [15,16,17,18,19,20,21]. Im2Calories [14] used GoogleNet CNN model where a classifier was trained using 250,000 images from existing datasets such as F00d101, Food201, GFoods3D, and NFood-3D. DeepFoodCam [48] is an enhancement of Foodcam [46] and demonstrated that DCNN achieves better accuracy than the traditional methods. Similar results are reported by [49], whereby DCNN was used for food image recognition and to improve accuracy as it provided additional characteristics, such as local feature extraction and feature coding and learning, but required a large dataset for training. Ref. [50] constantly receives images sent by camera, and GrabCut algorithm is used for accurate food segmentation [51]. Akbari Fard et al. [52] used DNNs for automatically recognizing 43 diverse types of fruits with an accuracy of 75%. Ref. [53] used a two-stage pipeline to estimate the calories and reproduce the meal from a single image of the food. The author makes use of deep encoders to extract image features, generate ingredients, and estimate food calories using a deep transferable model. Ref. [54] also used a deep neural network for recognizing multiple foods in a single dish and estimate the calorie count. Ref. [55] applied faster-RCNN to recognize the food items and the accuracy of the classifier was enhanced using the YOLO. They used the UEC FOOD-100 dataset to train the system, which contains the images of the food of a hundred categories. Some researchers make use of machine learning techniques to predict a particular component content such as added sugar [56] or dietary fiber [57] in packaged goods through provided nutrient, ingredient, and data type. Ref. [58] uses ImageAI and RetinaNet feature extraction object detection model to identify the food, create an inventory of ingredients, and compute calories prior to food consumption.
Therefore, some studies focused only on local dishes, such as Chinese [59], Indonesian [60], Japanese [47], Korean [61], and Indian [62]. Ref. [63] used CNN to recognize five different classes of local junk by training the model with 2000 images from an indigenous dataset. Ref. [64] used 10,000 data points to recognize 20 junk food classes and achieved an accuracy of around 80%. There currently exists no single solution for recognizing all foods as some dishes and foods are local to a particular region, thus failing to draw the attention of the researcher globally. Similarly, we propose an application that will also ultimately cater for the needs of the people in New Zealand.

3. Materials and Methods

The Smart Diet Diary system comprises a server at back-end and a mobile application front-end. The former performs the image processing and the latter provides the user a way to interact with the system. The user can also record their dietary intake as well. The back-end server is implemented using the Python CherryPy, and the exposed APIs allow users to request an image to be categorized. Images are classified by deploying a trained TensorFlow object detection model. The results produced by this model are then communicated to the component that computes the nutritional value of the food.

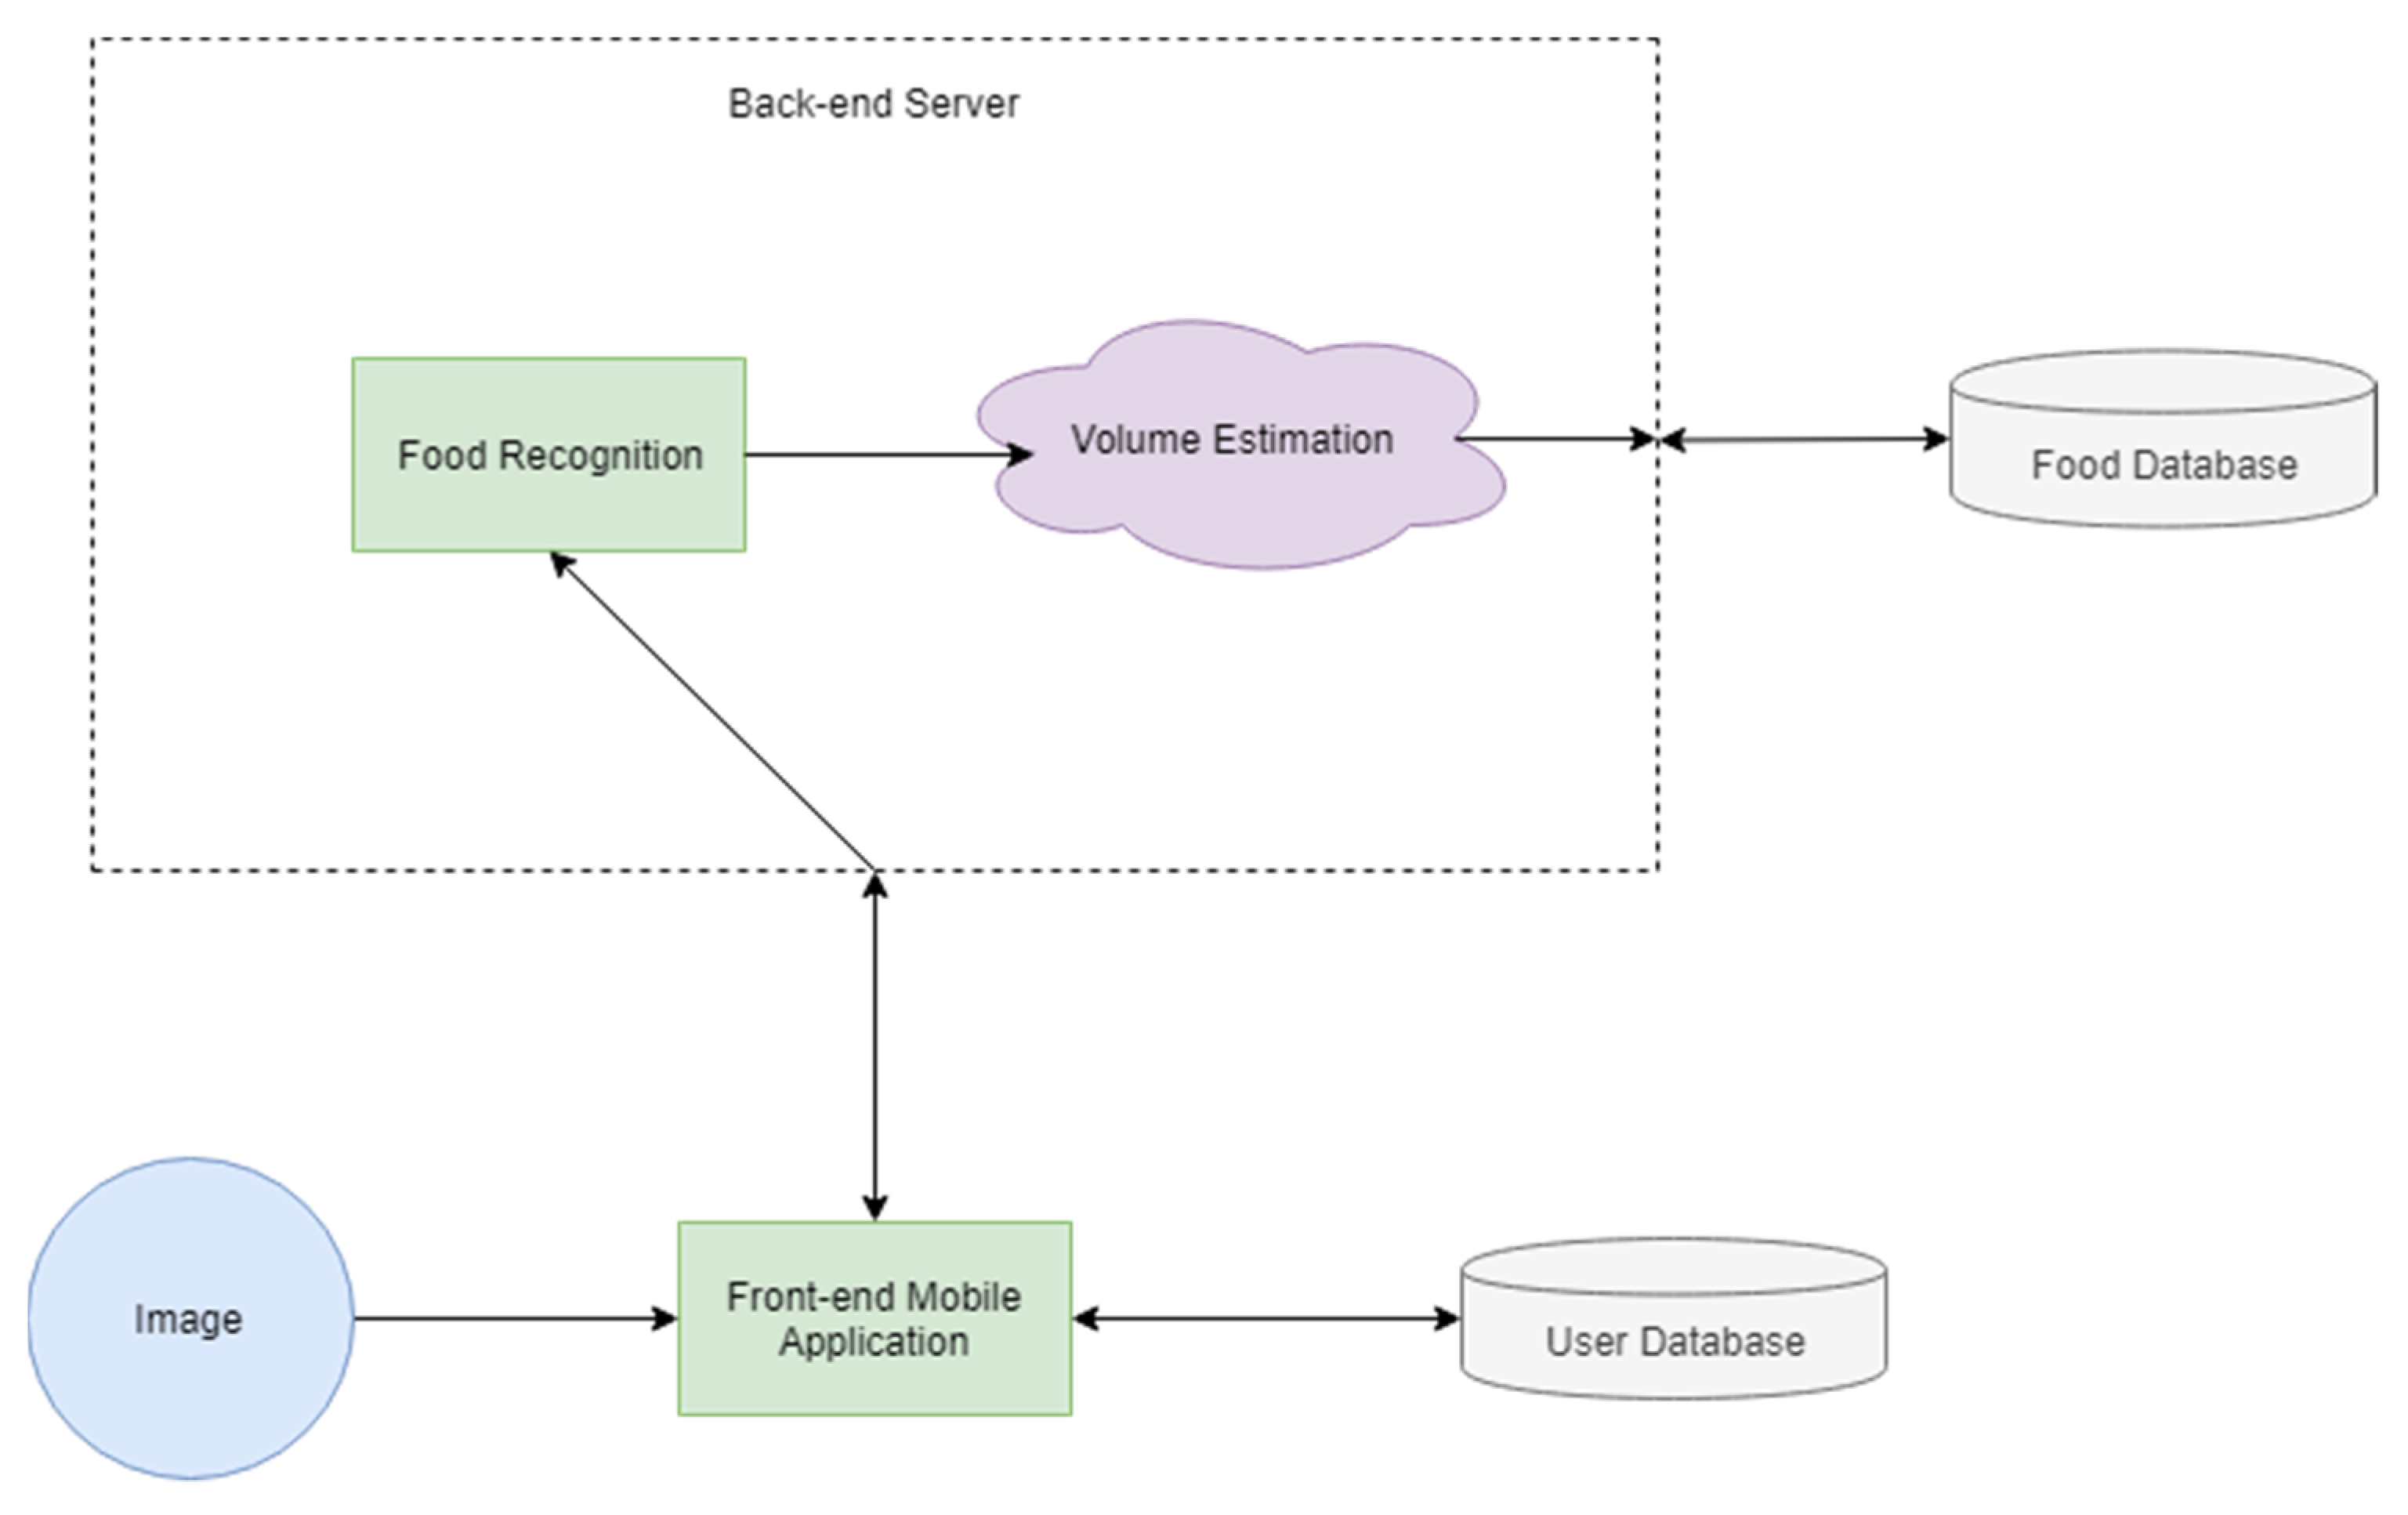
3.1. System Architecture

The architecture of the Smart Diet Diary is shown in Figure 1. It consists of a front-end mobile application and a back-end server. The front-end is developed with the JavaScript React Native framework using the Redux library for global state management as the React-Native framework requires manual passing of information to each component, and Redux circumvents this by placing certain variables in a global store. The front-end also contains the SQLite database to store user information, diary entries, and calorie information regarding food items. The back-end was implemented using the Python CherryPy framework to perform image classification and volume estimation. Cherry Py was chosen because of its user-friendly interface for handling HTTP requests and support for diverse types of servers. In addition, its multithreaded architecture offers high performance owing to its ability to handle multiple requests. The Cherry server is fed with the image of food captured using a mobile camera for further processing. After processing, it responds with presenting the name of the food recognized along with its volume. This information is used to compute the amount of calorie in the given food.

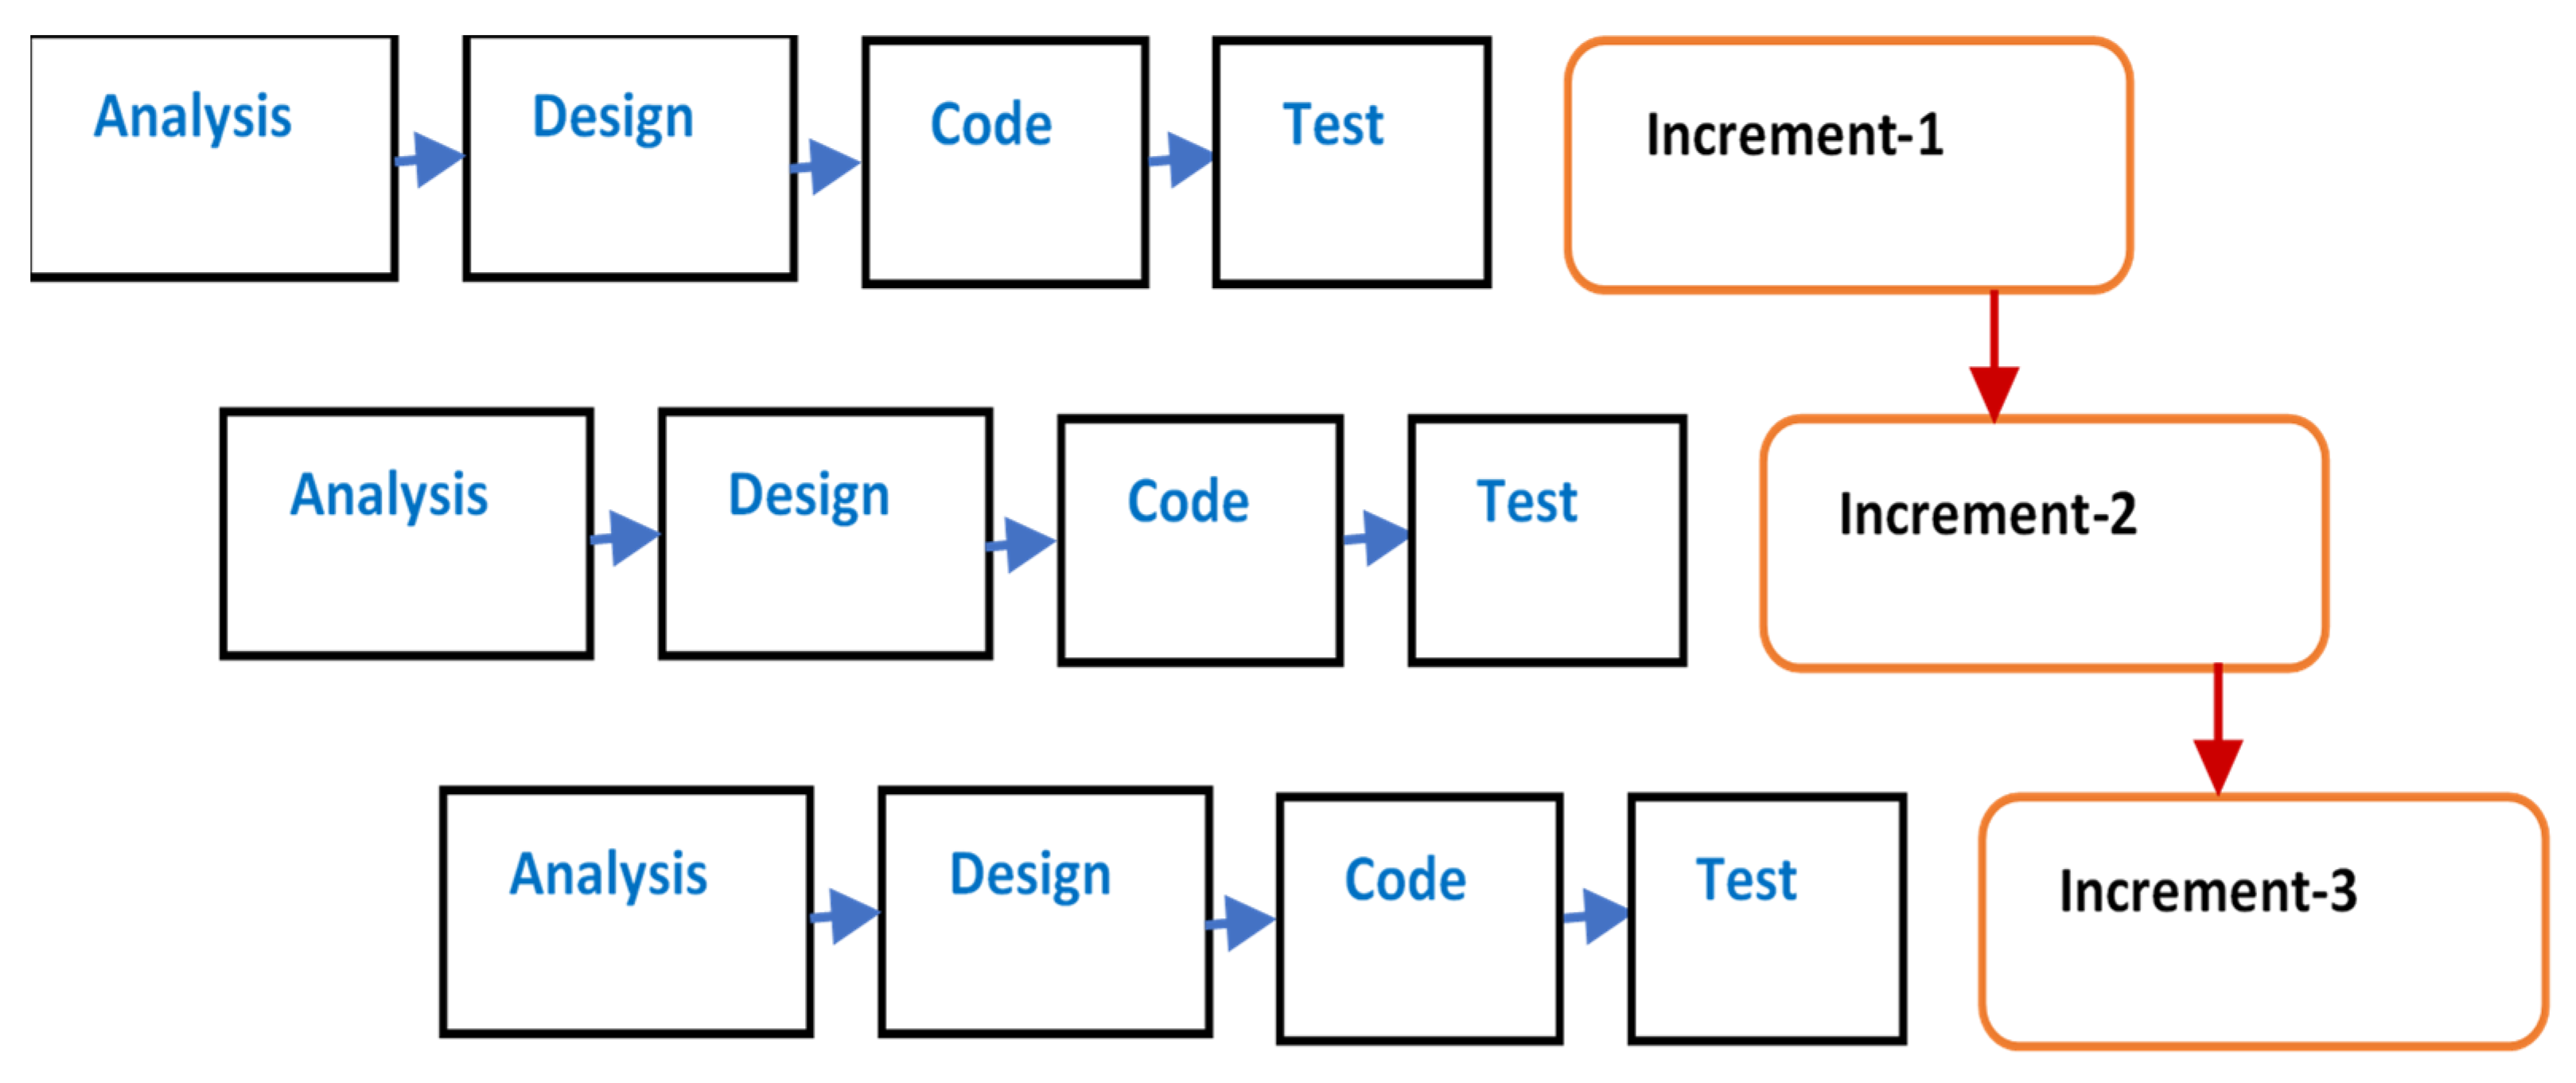
3.2. Application Development
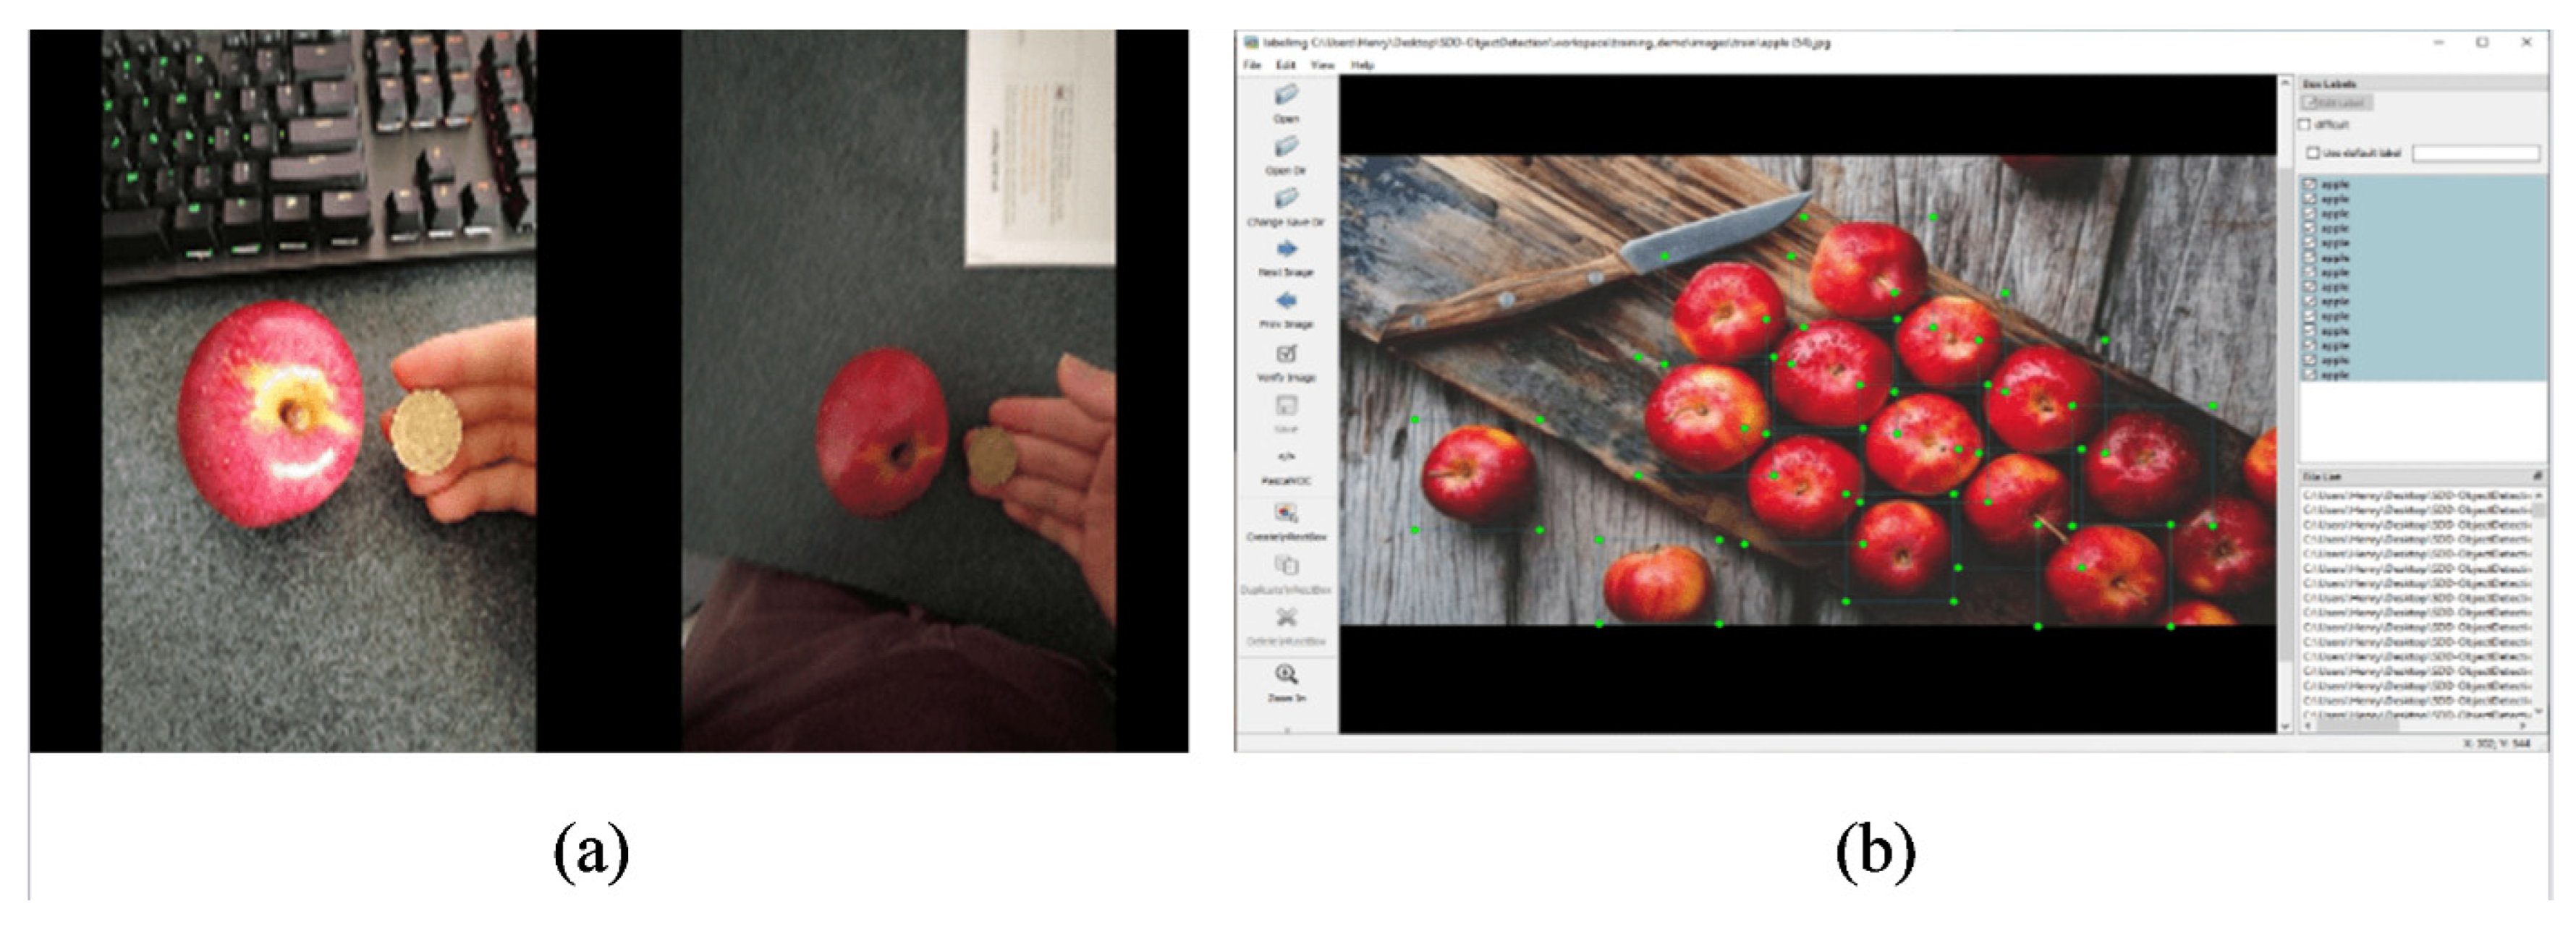
We used an incremental build model for developing the dietary intake tracking system. This is a software development model in which the product is designed, implemented, and tested incrementally until all requirements are satisfied. This model is a blend of the waterfall model and the iterative philosophy of the prototype, which is very well suited to cases where major requirements are already defined and a rapid prototype is needed. It simplifies testing and debugging of the application. Steps involved in the development of mobile applications using the incremental model are illustrated in Figure 2.
The development of the system was divided into three main sections: (1) food recognition using deep learning, (2) volume approximation using image processing, and (3) mobile applications. The initial stages of implementation emphasized the development of a simple functioning version of all individual components so as to obtain an elementary product that has all the components integrated and working. It is vital to complete the application cycle with the essential features and then add further modules or enhance the performance. We developed a storyboard to capture the requirements of the subject application and to guide the development process, as shown in Figure 3. The storyboard communicates both simple and complex interactions to the users. Once the user is satisfied with the storyboard, the conceptual model of the interface is explored. The application has a total of eight screen layouts, including start screen, entering credentials, calculating required dietary intake, image capture and meal recognition, calculation of calorie, dairy, calorie counter, and edit predictions. The sequence of the graphical images in Figure 3 illustrates and allows a pre-visualization of the interactive mobile application.

3.3. Dataset

During the initial phase of implementation, we considered publicly available datasets such as Fruits-360 and FOOD101. Although these datasets were already labelled with the item name, they required labelling with the bounding box so that we could feed it region-based CNN. However, systems trained using these images suffered from accuracy issues as Fruits-360 dataset lacked variation while FOOD101 had low quality images in terms of lighting, angle, and blurriness. To overcome these issues, we developed our own dataset for a training process. The dataset composed of manually collected images of different food items captured using Huawei P9 and Samsung S9 cameras at different angles while occasionally changing the background to allow for some variance in the data. The dataset contained over 16,000 images (for 14 classes, including coin) of a variety of different types of foods, including apples, oranges, chicken curry, potato chips, and canned soda. The details of training and test images for each class is presented in Table 1. The collected images were re-shaped to 600 × 600 resolution and then manually labeled using an open-source image annotation tool, labelImg [24]. This was performed by manually drawing a bounding box around the food item, as shown in Figure 4b. Pixel-to-cm ratio must be determined to estimate the dimensions of an object. Therefore, we required an item with known measurements in the image. We used a NZD 2 NZD coin as shown in Figure 4a, as it is one of the 14 commonplace items that many people carry around, making it very convenient as a reference object. The diameter of the coin was 2.65CM and this value was used to determine the pixel-to-cm ratio for computing the approximate volume. In addition to the food images, we added two thousand images of NZD 2 NZD coins to the dataset in order to train our classifier to recognize the reference item for estimating the item volume. The dataset is available on the link below:

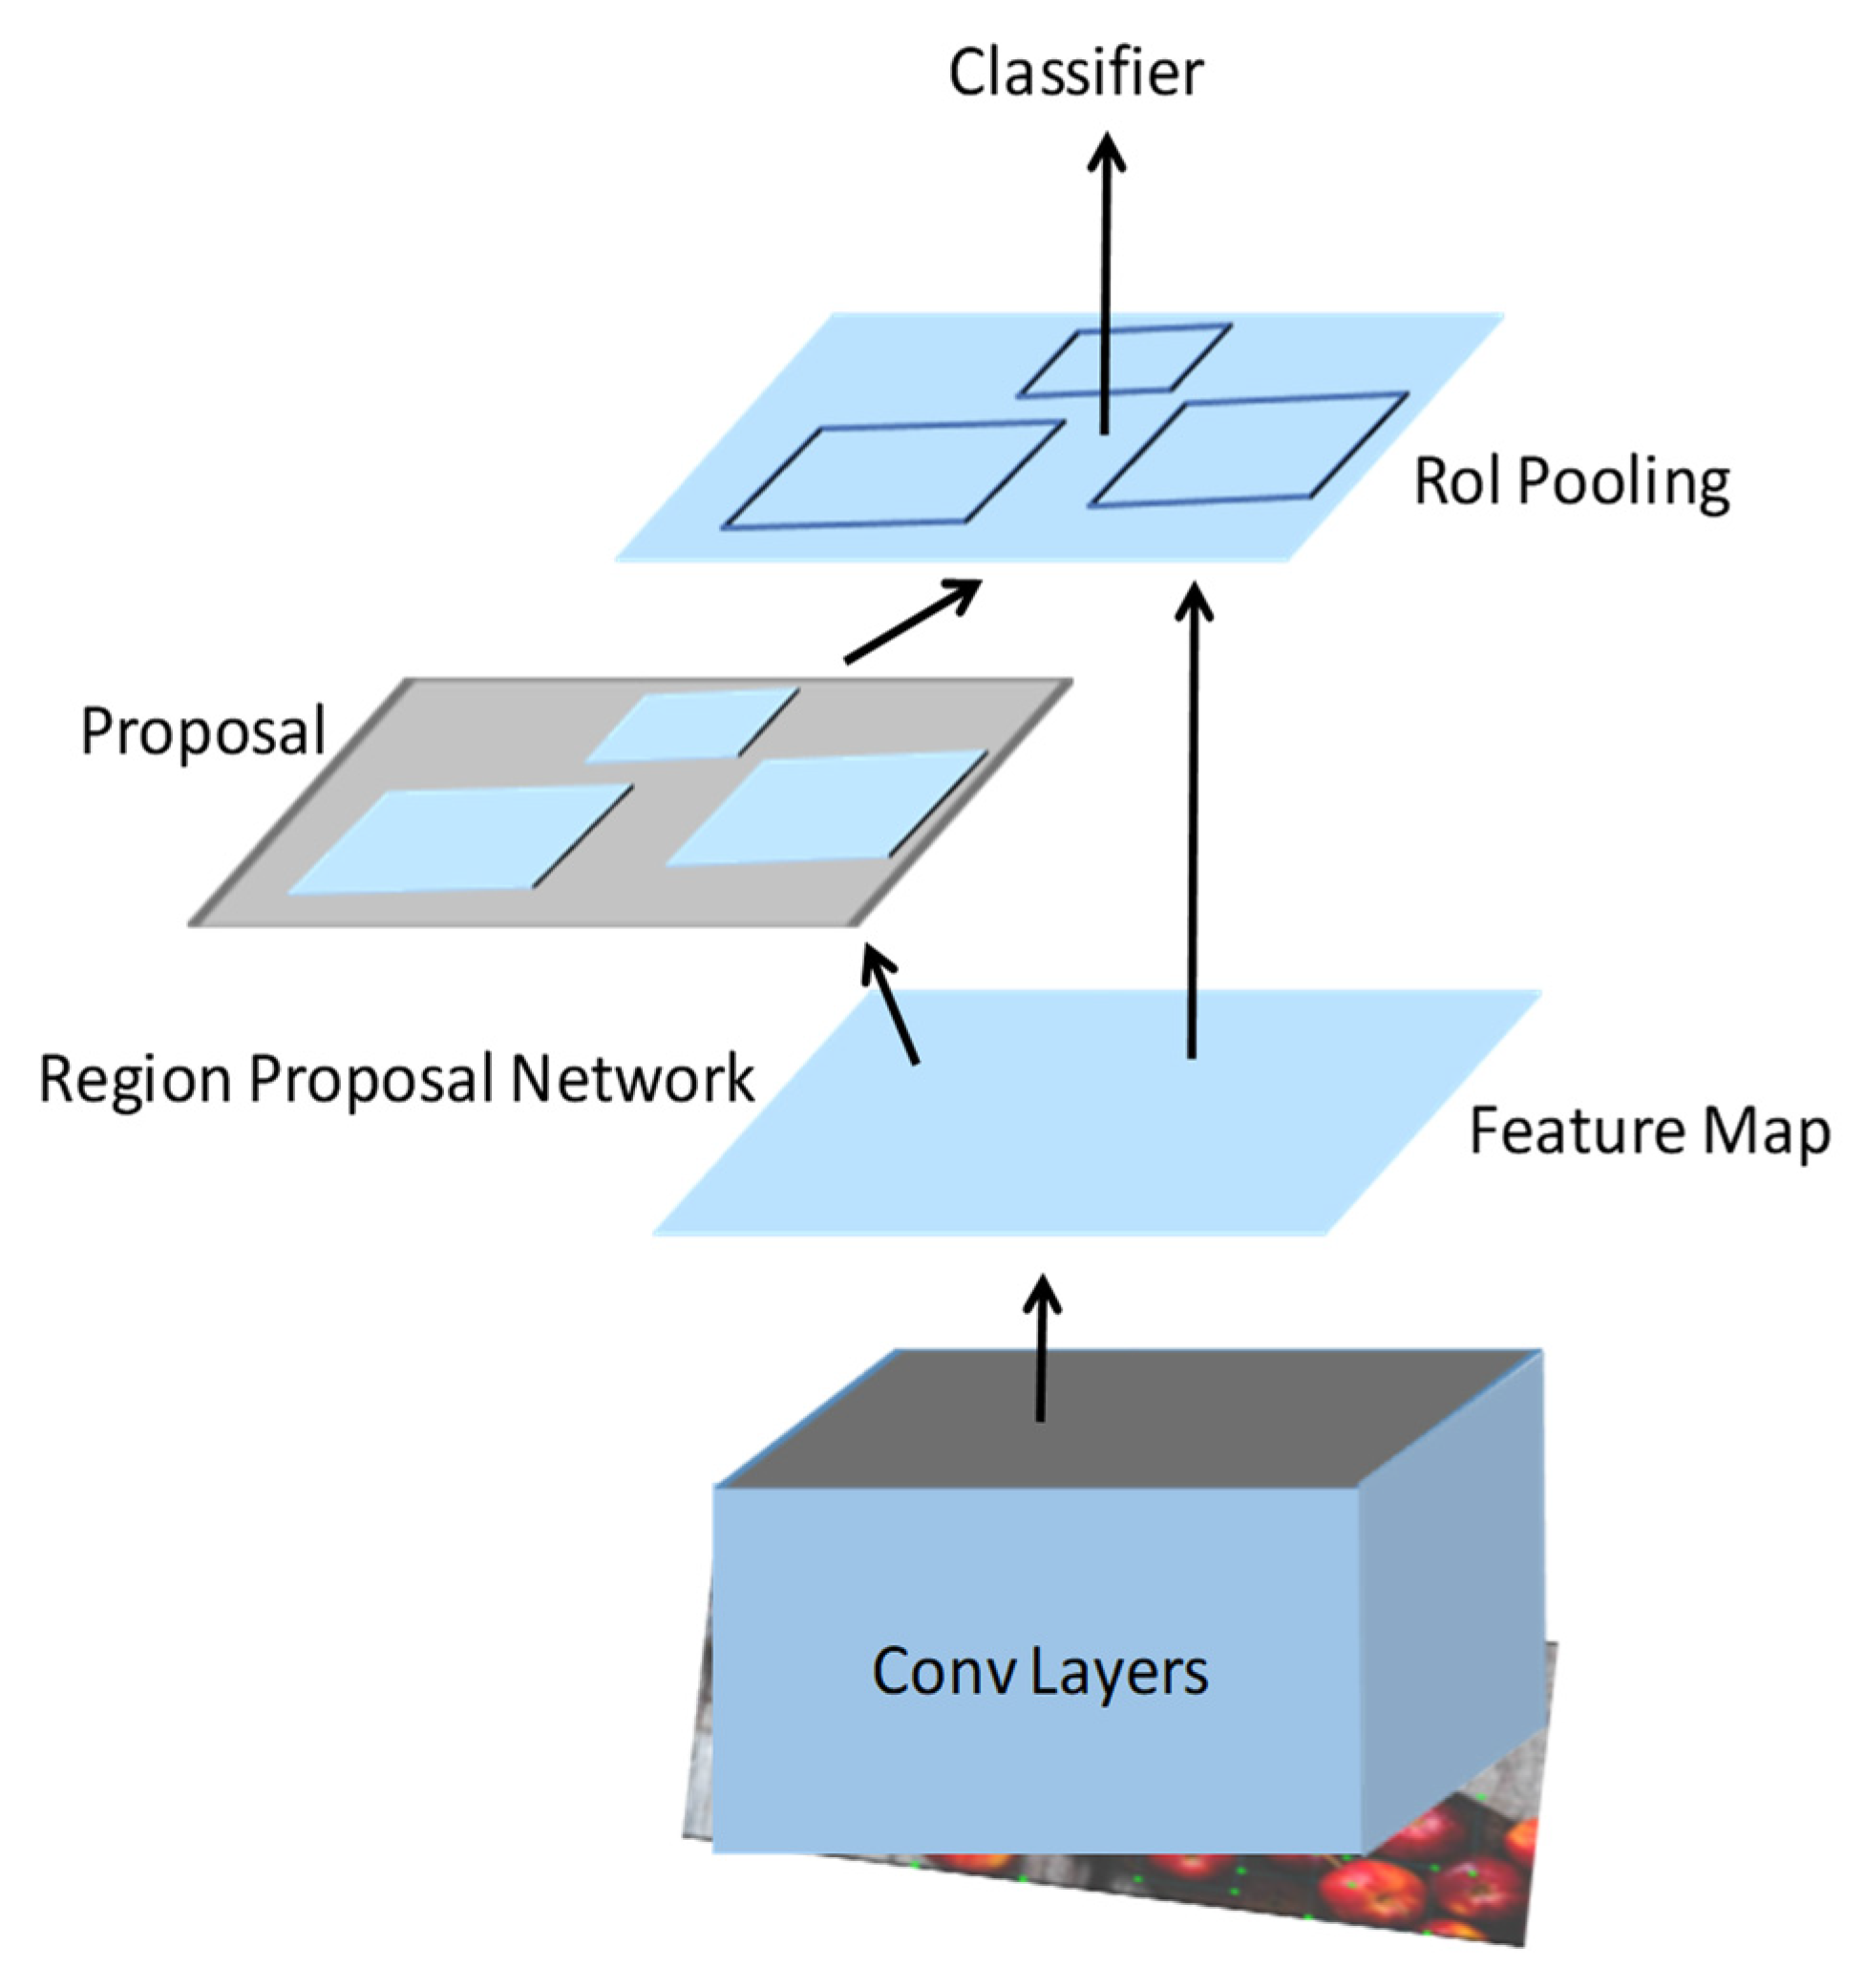
3.4. Object Detection and Classification

Food identification is an image recognition challenge, and deep learning is a powerful instrument for solving such a problem [65], inspired by the animal visual cortex [66]. CNNs need less preprocessing compared to other image classification algorithms. However, this becomes computationally heavy if the ROI has diverse physical positions in the image. This problem is overcome using region-based convolutional neural networks, R-CNNs, which deploy selective search methods and extract fewer regions from the image, called region proposals. It still requires a substantial amount of time to train the network. An improved version of R-CNN is a single-stage fast R-CNN [67] object detection algorithm that eliminates the need for multiple SVMs using a softmax layer to predict object classes and bounding box offsets directly. It is faster and more accurate than the original R-CNN but requires separate region proposal algorithms, thus limiting its performance. A recent incarnation, faster R-CNN, has only one network that predicts both object bounding box and class probability using an RPN and a fast R-CNN-like network, eliminating the need for external regional proposal algorithms. The network learns to generate proposals independently, making it faster, more efficient, and more accurate. Additionally, end-to-end training strategy, flexibility, scalability, and open-source implementation make it a popular choice for object-detection tasks.
There are three neural networks that make up the faster R-CNN: a feature network that creates useful features from images; a region proposal network (RPN) that classifies and creates bounding boxes; and a detection network that produces the ultimate class and bounding boxes. The aim of neural network is to produce bounding boxes or ROI with a higher likelihood of an enclosing object. The final class and bounding box are generated by the detection network using data from the feature network and the RPN. It usually consists of four dense, completely interconnected layers. A classification layer and a bounding box regression layer are both part of these two layered common layers. The features were cut in accordance with the bounding frames to aid in classifying only the area inside of them.
The process used to run the R-CNN algorithm on TensorFlow is shown in Figure 5. ConvNet yields a feature map founded by the input image, and RPN applies to these feature maps. ConvNet then returns the object proposals along with their object scores. These proposals are subjected to a ROI pooling layer to create a small, fixed-size feature image. The proposals are sent to a completely connected layer that consists of a linear regression layer and a soft-max layer. Bounding boxes for objects are categorized and produced using this method.
We deployed a faster R-CNN for detecting foods and classifying them. We trained the model using around 800 images for each class, and 200 images from each class were reserved for testing. Our dataset had 14 distinct classes, roughly more than 16,000 pictures. After resizing the images into a 600 × 600 resolution, the imageries were obtained via the OpenCV library that returns the image as a tensor. These tensors were fed to our model, and we received a collection of projections as output in the sequence of maximum confident to the minimum confident. The bounding box coordinates of each prediction were provided along with it, showing where it was located within the image. Predictions with a confidence level above 50% were selected and passed to the calorie assessment module along with actual data for further computation. The model of the trained classifier can be downloaded from the following link:

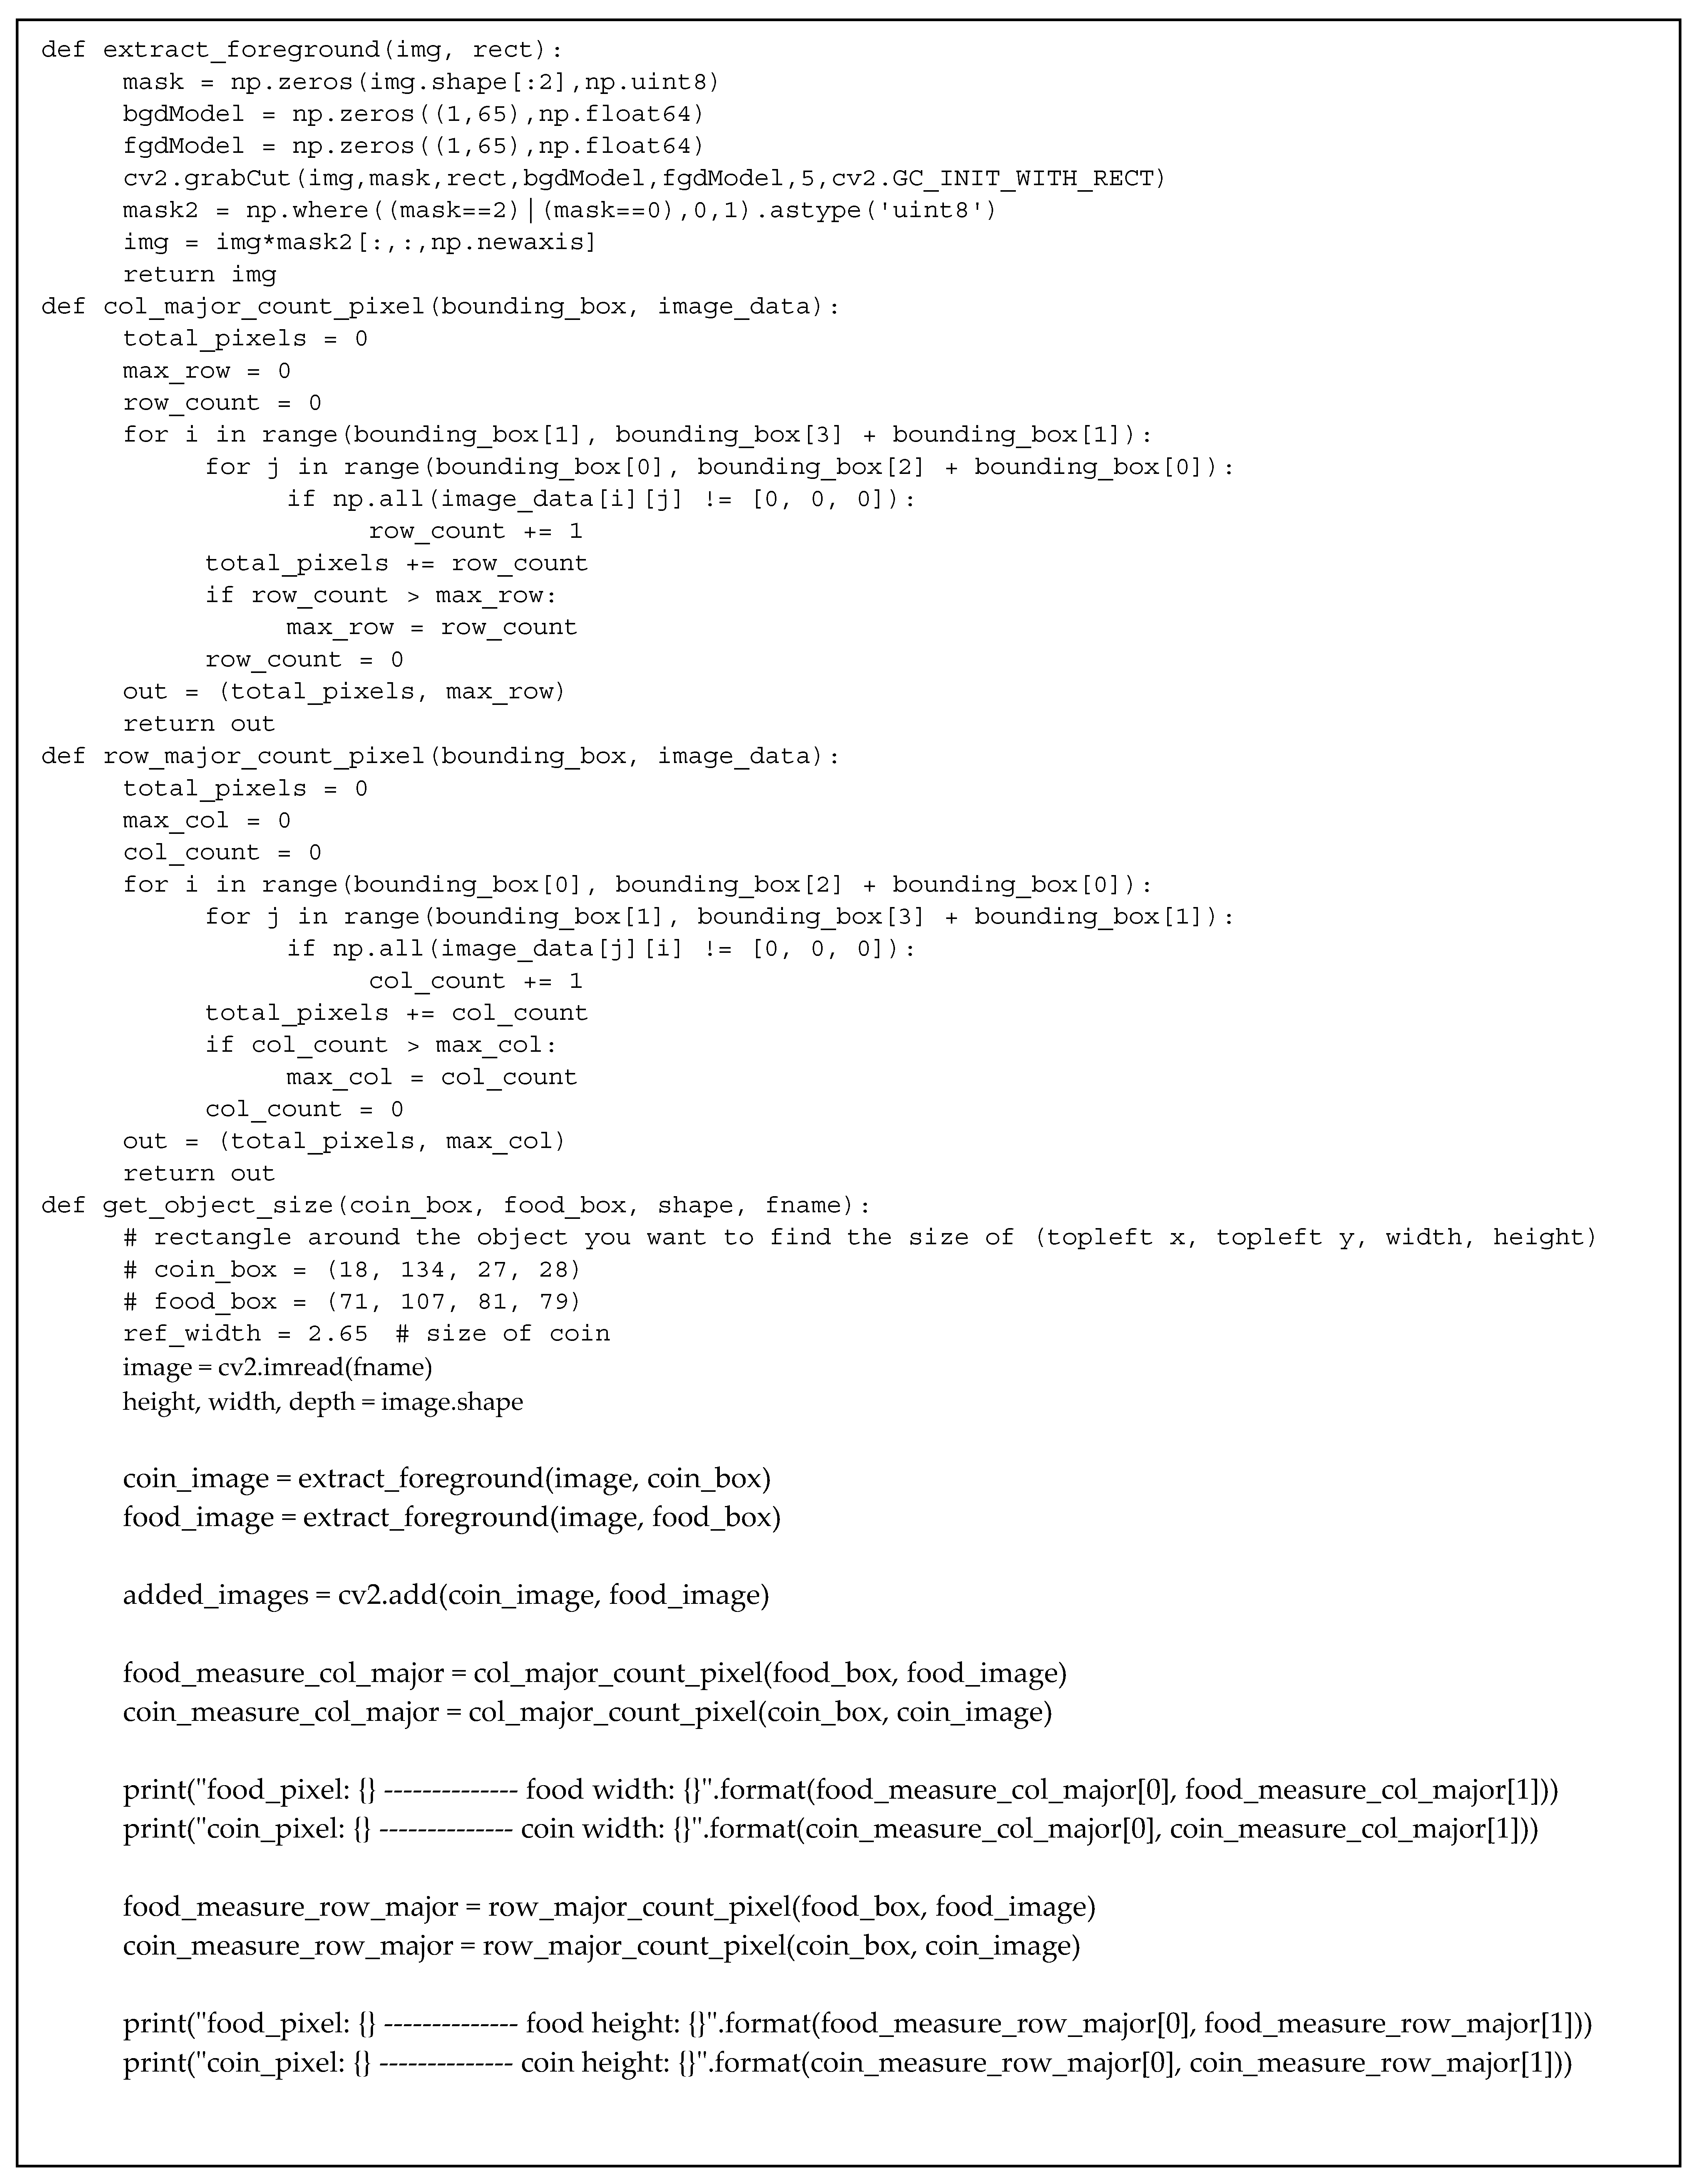
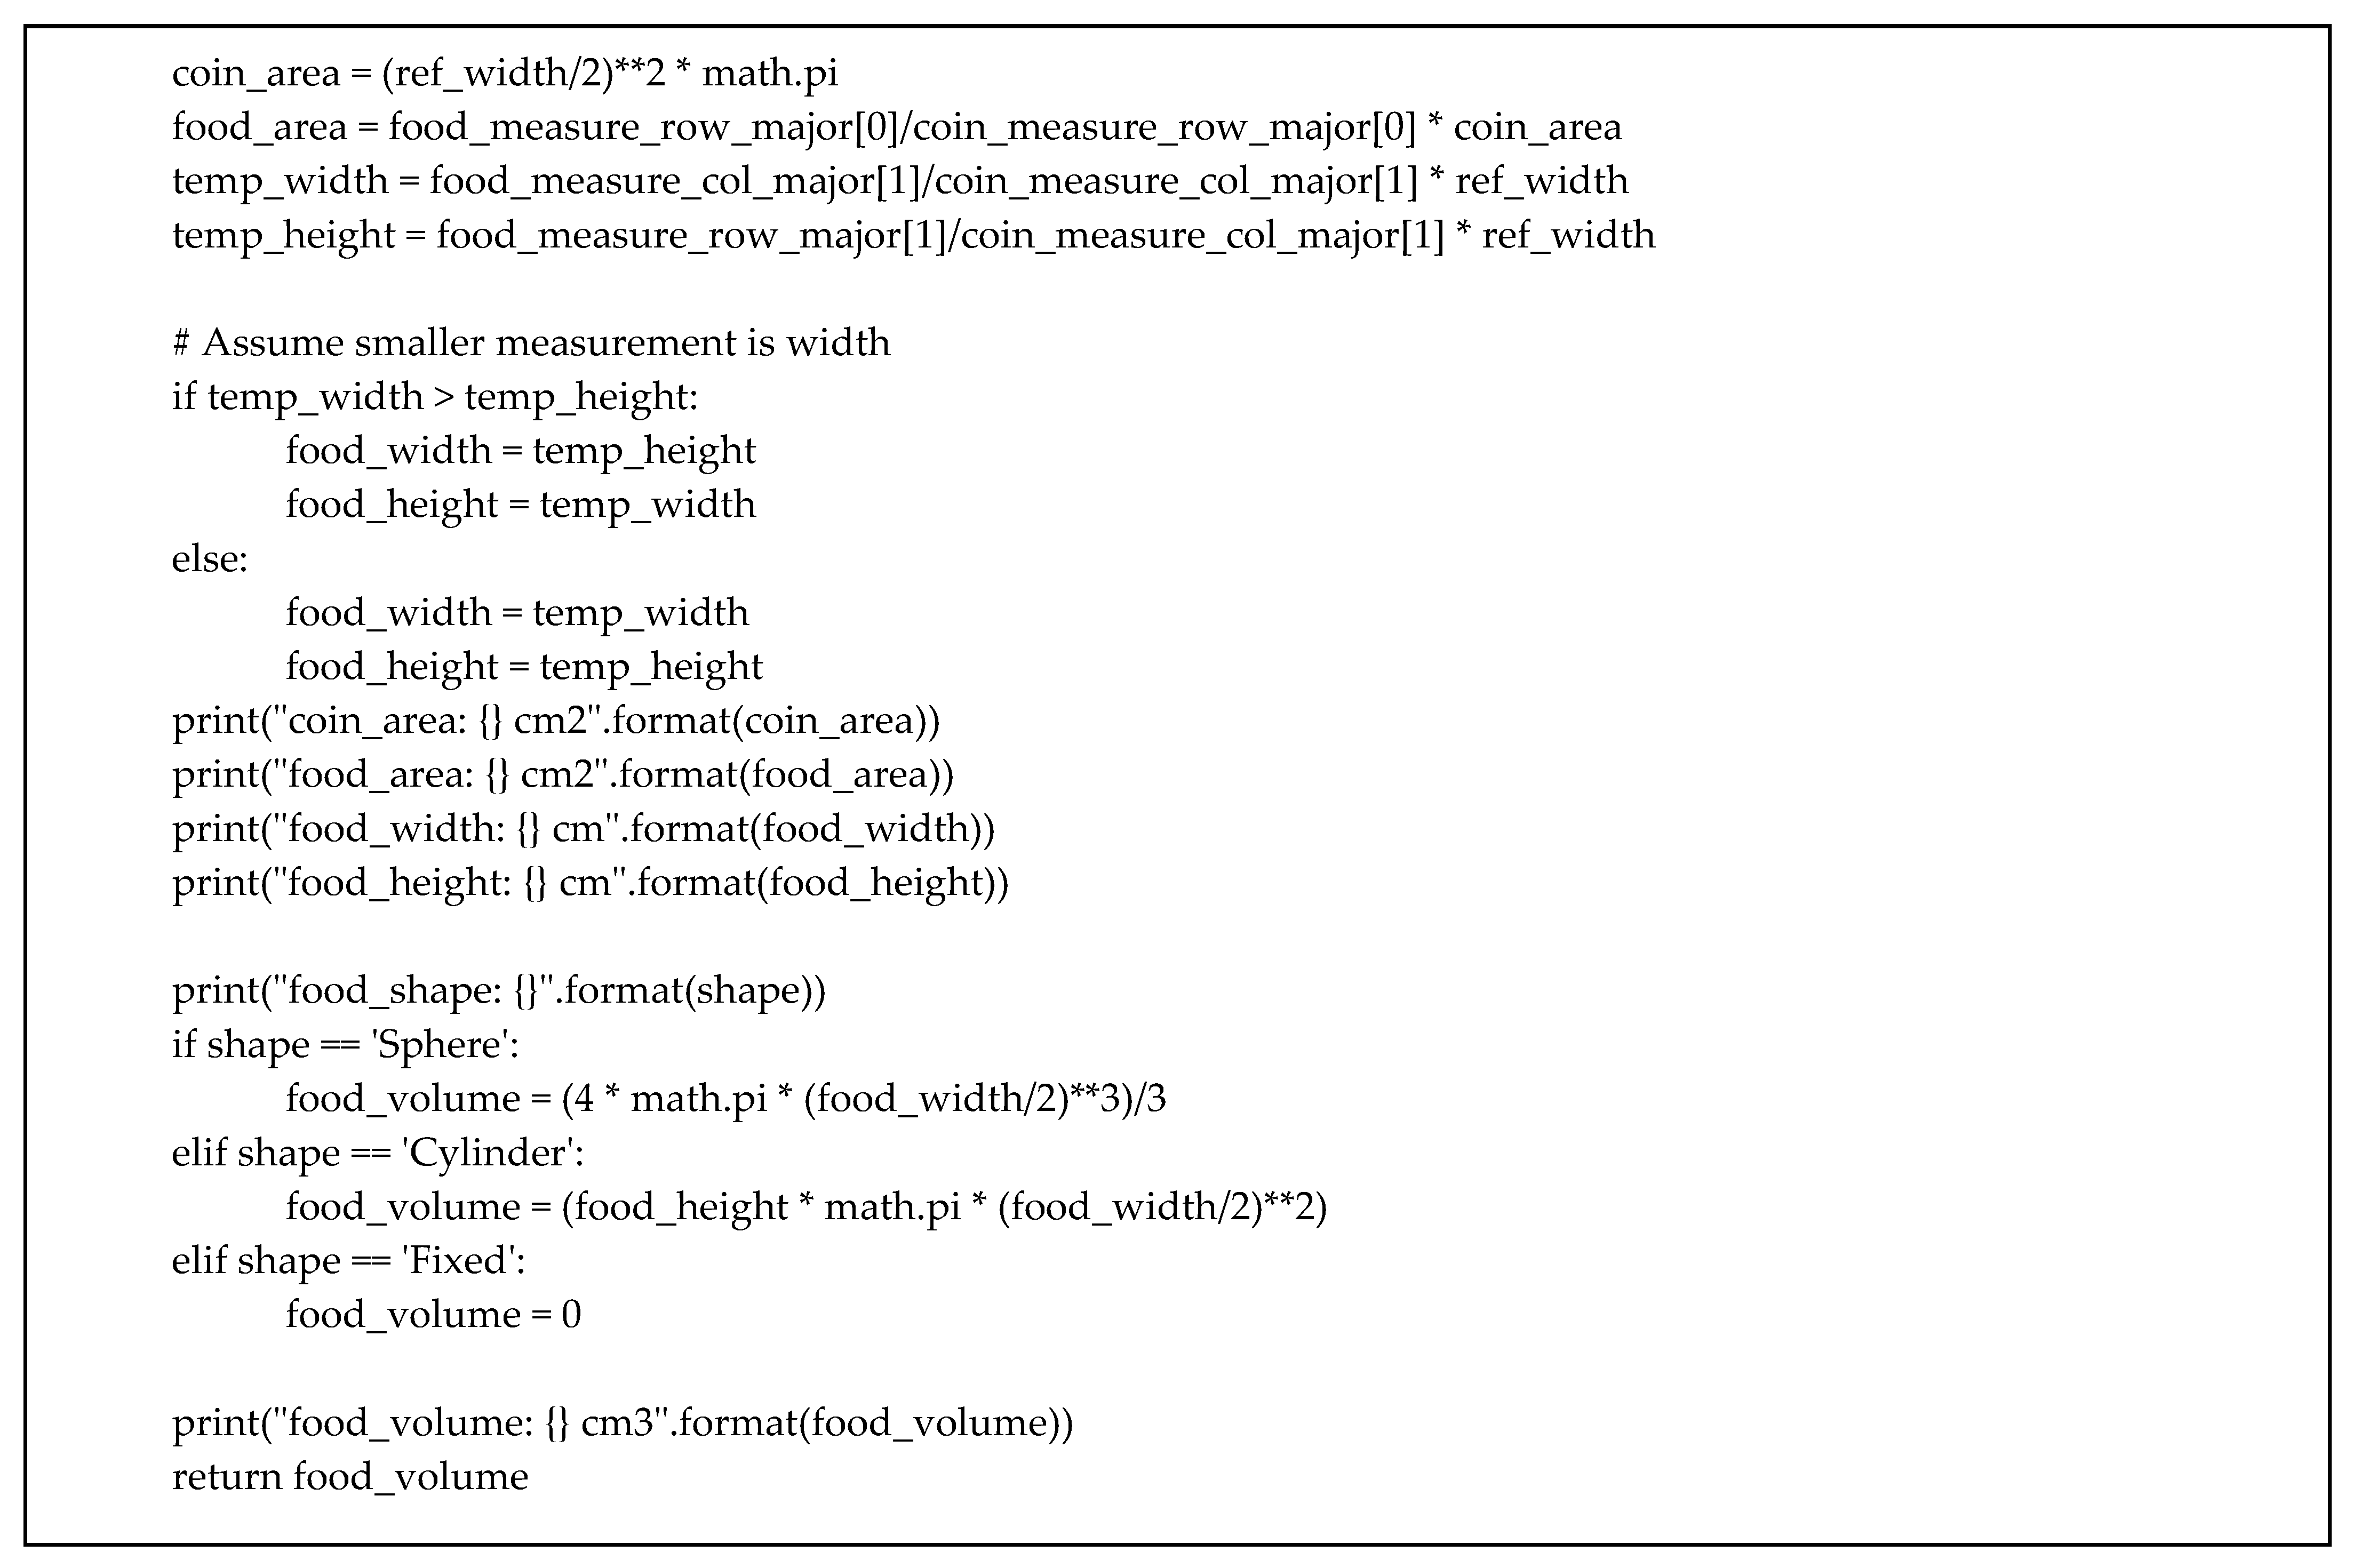
3.5. Volume Estimation

The criterion for selecting a reference object was that it should be a common object possessed by most individuals or is available at the time of undergoing a diet, such as ID cards, thumbnails, or utensils. The problem with these objects was that they had either asymmetrical forms or varying sizes. We decided to use a NZD 2 coin because it is circular in shape and the horizontal and vertical pixels are constant. Additionally, it is easy to carry and people possess it most of the time. Other available coin options were also considered; however, NZD 2 coin was preferred due to its suitable size for the application.
To determine the volume of an item from a 2D image, we applied segmentation methods such as GrabCut algorithm. It is an iterative algorithm that incorporates statistics and GraphCut to obtain exhaustive 2D segmentation. We used it to partition the image by extricating the foreground (food and coin) to estimate their sizes by counting pixels. This process only involves a coarse separation between the foreground and background. This is achieved by sketching a rectangle around the desired item. We carried out coarse partitioning during the classification stage, which returns a bounding box and label. GrabCut erases interior pixels that do not belong to an item. The steps are explained below in Algorithm 1.
Algorithm 1. GrabCut
1.
Initialize the pixels in the foreground
2.
Initialize the pixels in the background
3.
Initialize the pixels of unknown part of the image
4.
Use Orchard-Bouman clustering algorithm to model Foreground and Background as Gaussian Mixture Model.
5.
Each pixel is assigned a Gaussian component most likely in the foreground GMMs and the rest is background GMMs.
6.
GMMs newly learned from a collection of pixels that have been created in step 5 and 7.
7.
Graph Cut is created, and it is used to search for a new classification of the pixels of the foreground and background.
8.
Repeat steps 4–6 until classification is completed
The foreground, background, and the unidentified portion of the picture are fed to the algorithm by sketching a rectangle encompassing the object of interest. The initial image segmentation is created with pixels inside the bounding box considered as the foreground and the pixels outside as the background. Both foreground and background are modeled as a Gaussian mixture model (GMM) by means of the Orchard–Bouman clustering algorithm [68]. GMMs are used to represent normally distributed subpopulations within an overall population without the knowledge of a relationship between subpopulation and data point. Each image is fed as an array of pixels, where each pixel represents the intensity, and GMM partitions the pixels into similar segments for further analysis. Each pixel in the foreground is given the most likely Gaussian factor and pixels in the background are treated in the same way. New GMMs are learned from the pixel sets created in the previous step. The Orchard–Bouman clustering algorithm is used, which provides an optimal solution for clusters with Gaussian distributions. GrabCut then finds a new classification of foreground and background pixels. This process is reiterated until the algorithm converges. The outcome of the segmentation was the food and reference item on a dark background. This technique suffers from the limitation that the height of the food cannot be calculated using this method and we can only provide an average serving size of items based on the shape of food items stored in the server database and use the corresponding volume equation to calculate the volume of the food. The code for volume estimation is provided in Appendix A.

3.6. Calorie Estimation

Determining a food’s calorie content through a single image is a complicated problem. It is difficult to obtain an accurate estimation without additional information. Existing studies use cameras with depth sensors or capture multiple pictures of food from different angles [14]. This additional information can be used to obtain a better estimate of the volume. However, our goal was to minimize the number of actions that users needed to take to record their diet. Thus, we used a single image to obtain an approximation of calories. This was in line with our objective of providing an indicator of the user’s diet, rather than an exact calorie count. The calories are estimated by first identifying the food in the image and then using volume estimation to obtain the relative size of the food to a NZD 2 coin reference object. Volume estimation relies on the fact that most food items are regularly shaped. Thus, they can be assigned an assumed a 3D shape, such as a cylinder or sphere, for simplifying the volume calculation process. The average serving size of the irregularly shaped foods was used.
The calorie computations component tests the guesses for coin and a food item. If one of these items is missing, the server returns a note indicating that the nutritional value of the food cannot be computed. The coin is necessary as a reference object because an object with known sizes is vital for determining the size of all other items in an image. Based on these predictions, the GrabCut algorithm extracts the foreground by changing the background with a solid blackened color. Graph Cut is utilized to acquire a new categorization of foreground and background pixels. This procedure is reiterated until the classification converges. Using the resulting segmented image, the dimensions of the food and coin were estimated by counting the number of non-black pixels. Using the ratio of the coin to the food pixels in the image, the dimensions of the food can be determined by scaling the known dimensions of the coin with this ratio. Now that an estimation of the food’s dimensions has been found, the volume of food can be calculated. A database on the server side contains various types of information about foods that can be predicted by our model. This includes items such as calories per 100 g (CT), food density (Fd), and food shape. For food volume estimation, the shape of the food is approximated as a regular 3D object such as a cylinder or sphere. The food (VF) volume can then be calculated easily using the estimated dimensions. The weight of the food is determined by multiplying its volume by its density, and the approximate calorie count can be calculated using the calories per 100 g for the specific food, as given by Equation (1).
Cal = F d × V F 100 × C T

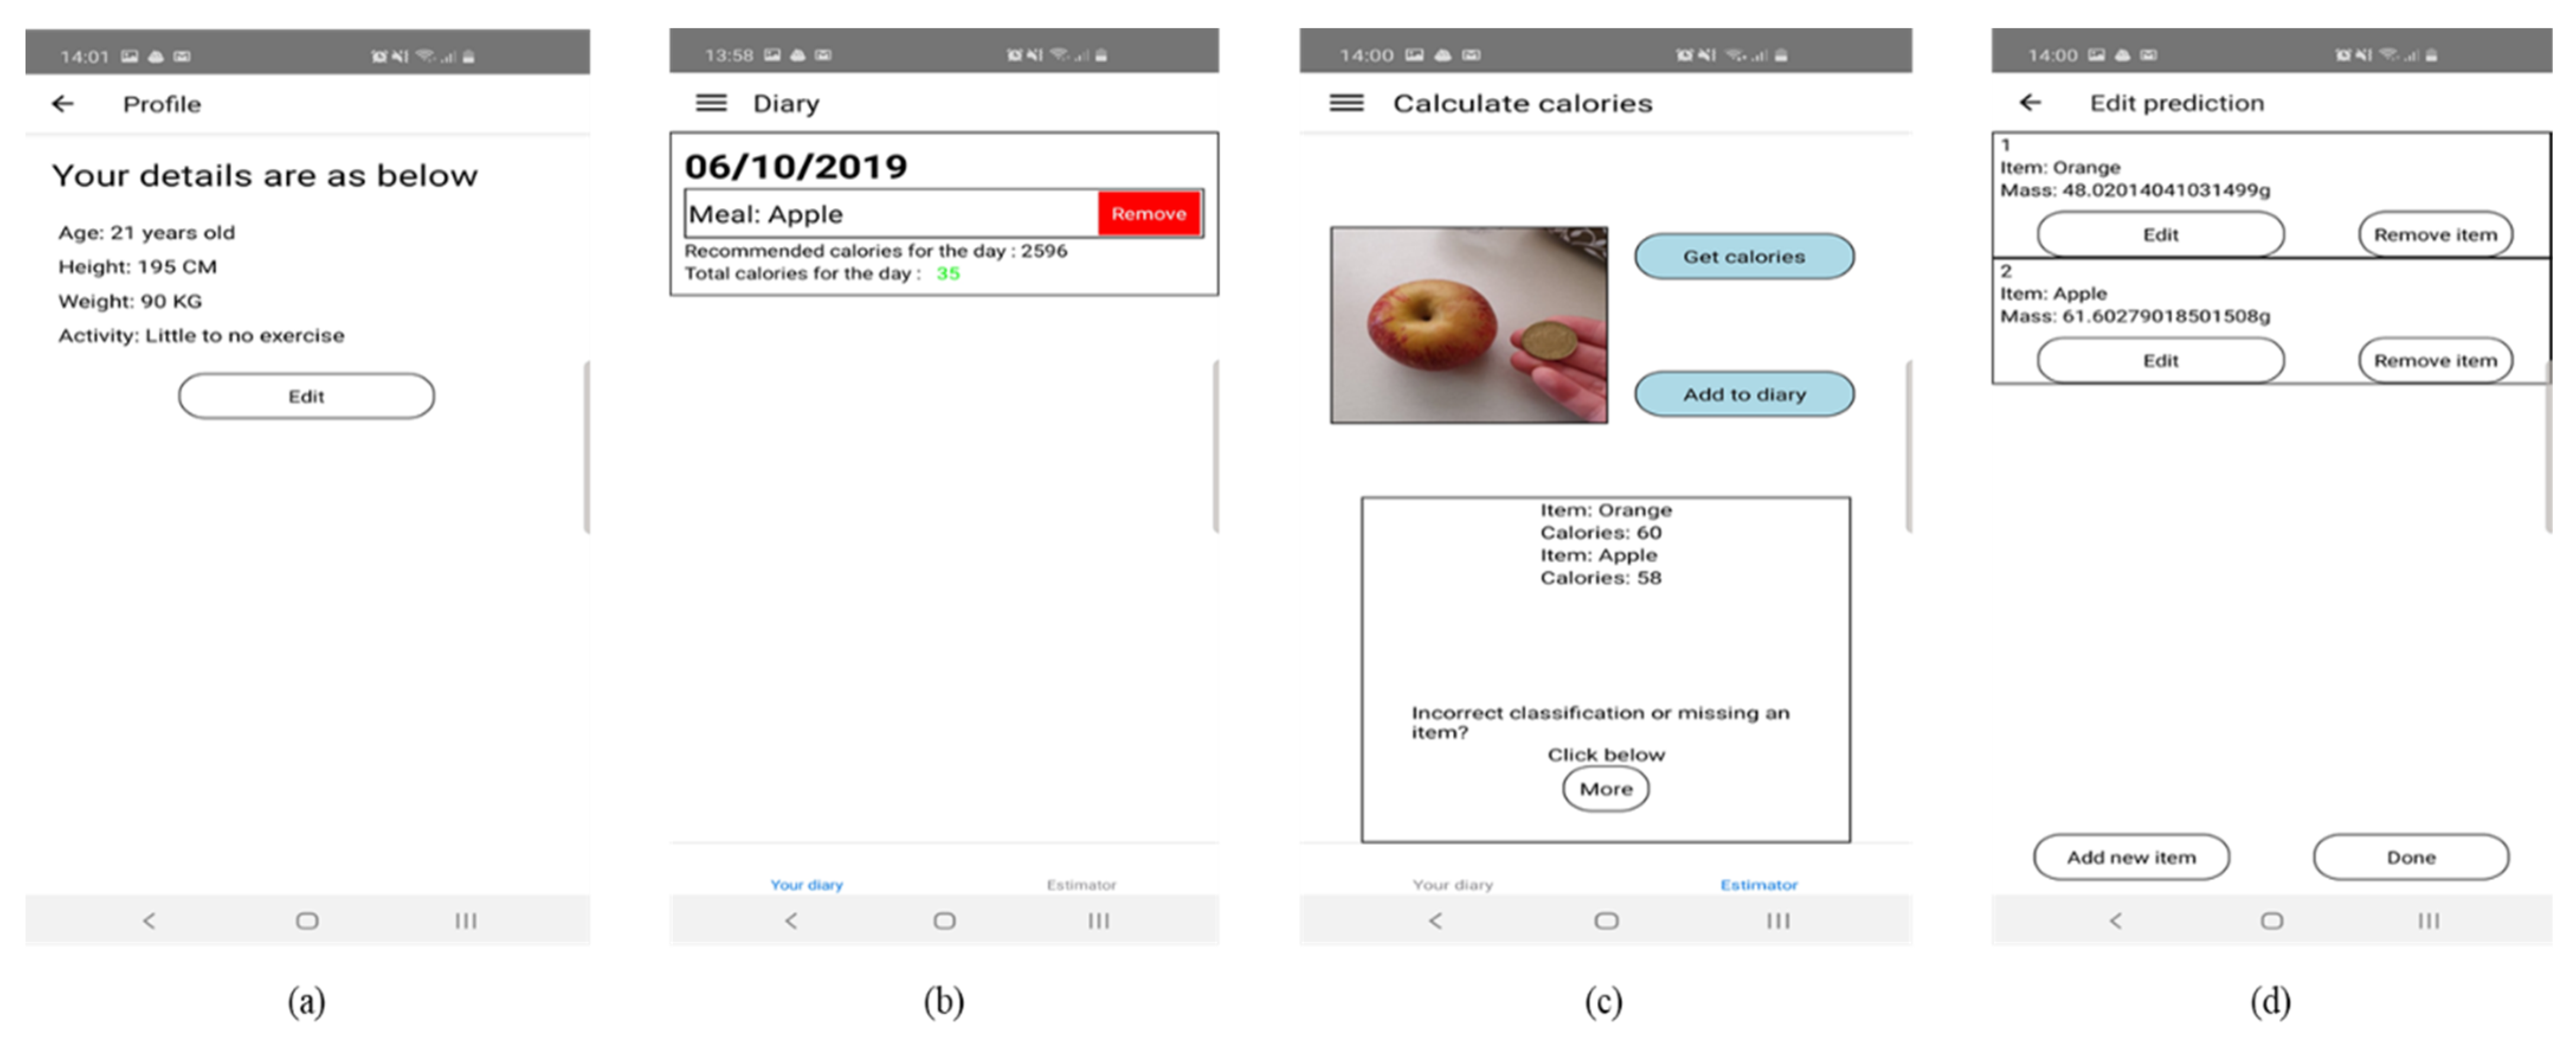
3.7. Mobile Application

The mobile application was realized using the JavaScript react-native framework, which supports IOS and Android. The application was installed in Huawei P9 and Samsung S9 for testing. It also manages user-specific data, such as diaries and personal data. The following functionalities were implemented in a mobile phone-based smart diet diary.

3.7.1. User Profile

Users must fill out their personal information, including their name, last name, and email address, to establish a new account. Figure 6a illustrates how these data were used to build the user’s new profile. The user can check in using the login screen after completing the registration procedure. The body mass index (BMI) and suggested calorie intake to sustain weight are calculated using the user’s height, weight, and age, which are entered when the application is first launched. This information can always be changed and stored locally on the device.

3.7.2. Diary Component and Food Database

The tracked food consumption is shown in this component. The user’s food diary is kept in a local database and contains details such as the time of consumption, the identity of the food, and the number of calories, as shown in Figure 6b. The number of calories consumed for each meal consumed and accumulated calorie count for that day is also dis-played. If the total calorie intake for the current day exceeds the recommended calorie intake, a warning is generated for the user. There were no restrictions on the number of meal entries per day. Users can also see the history of food intake.

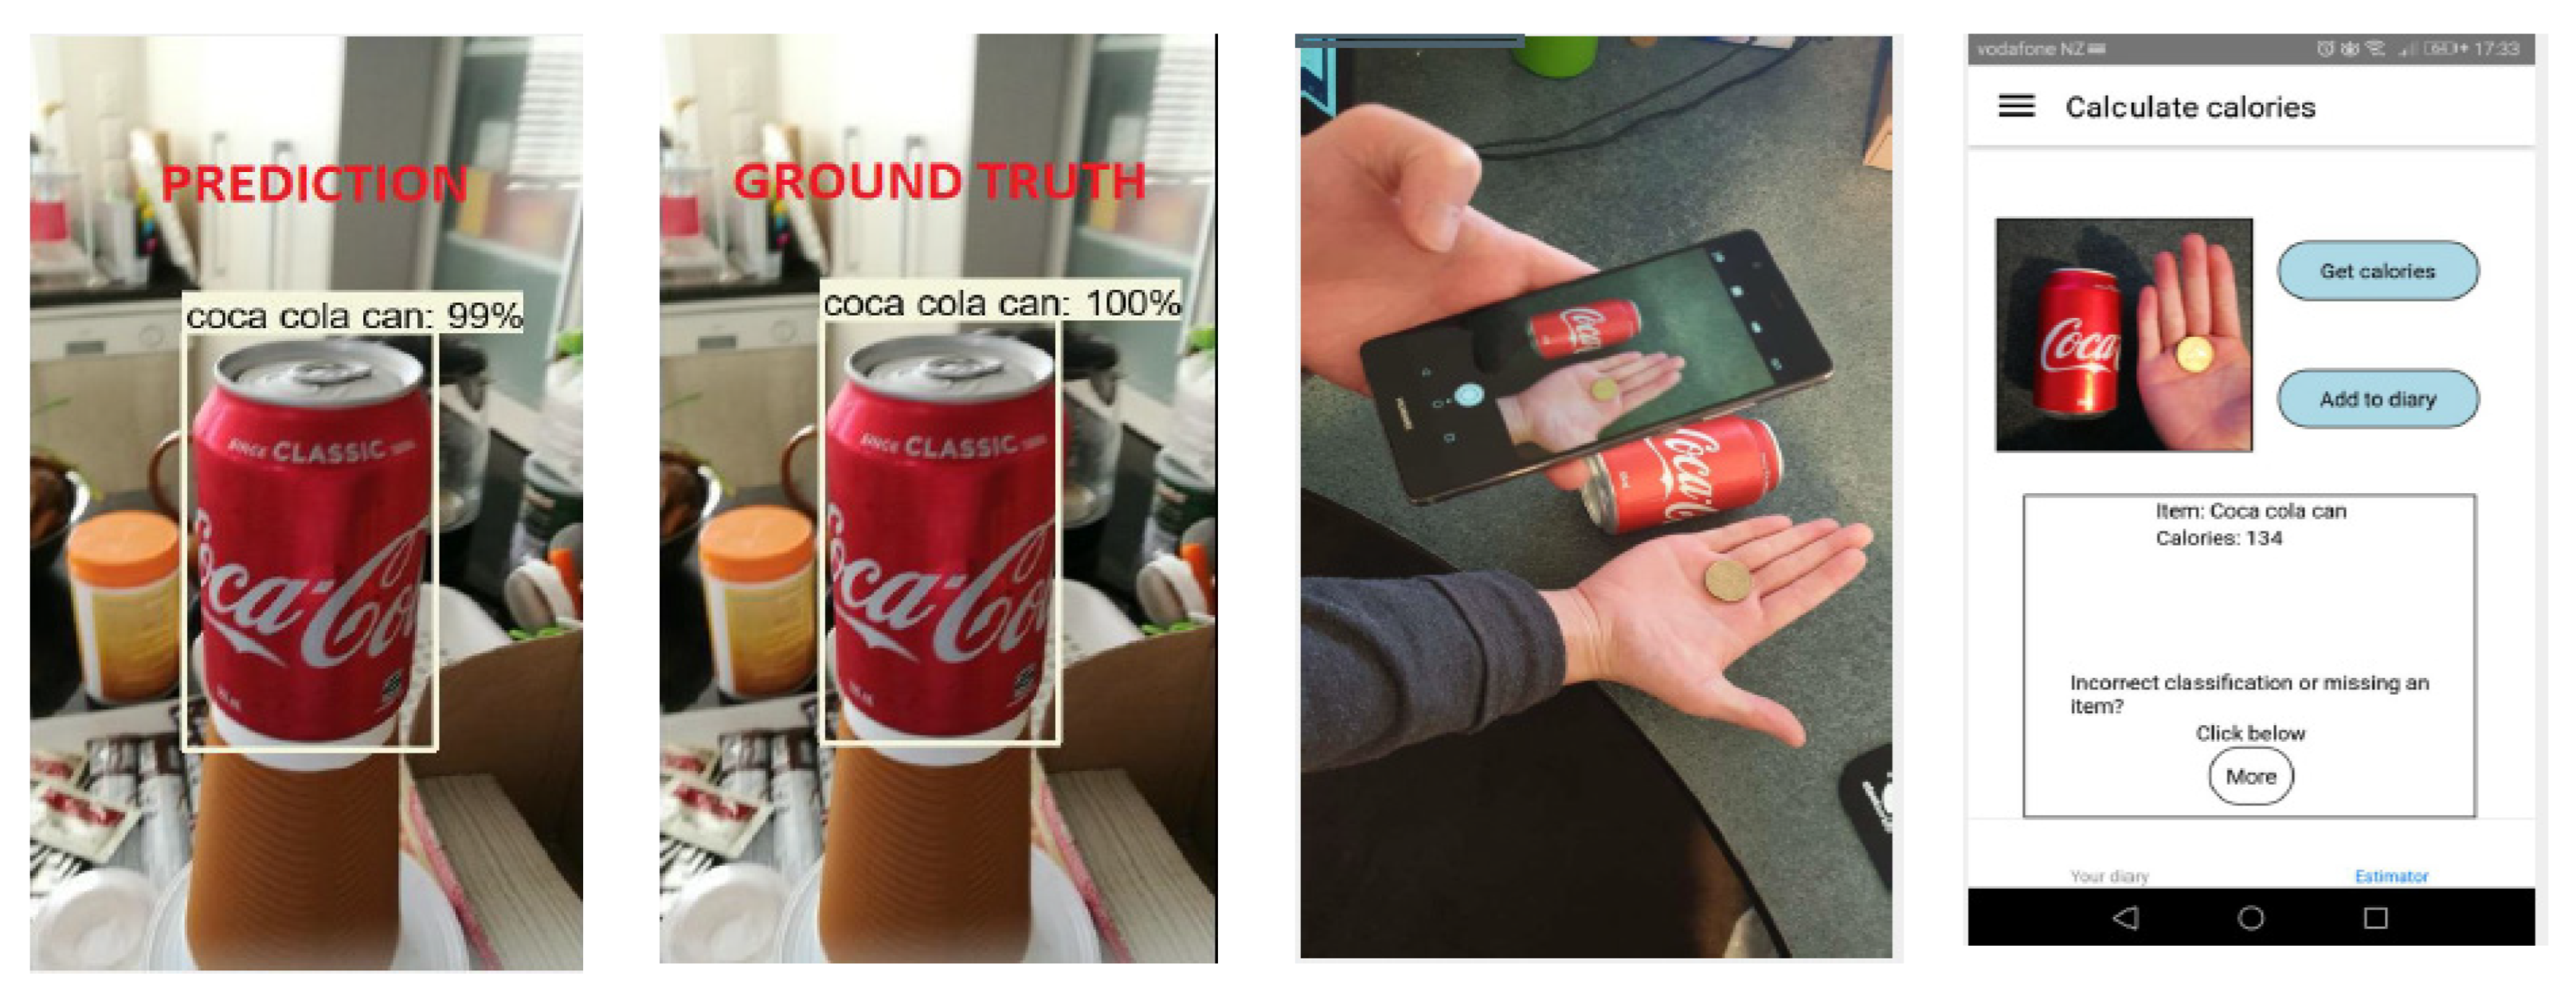
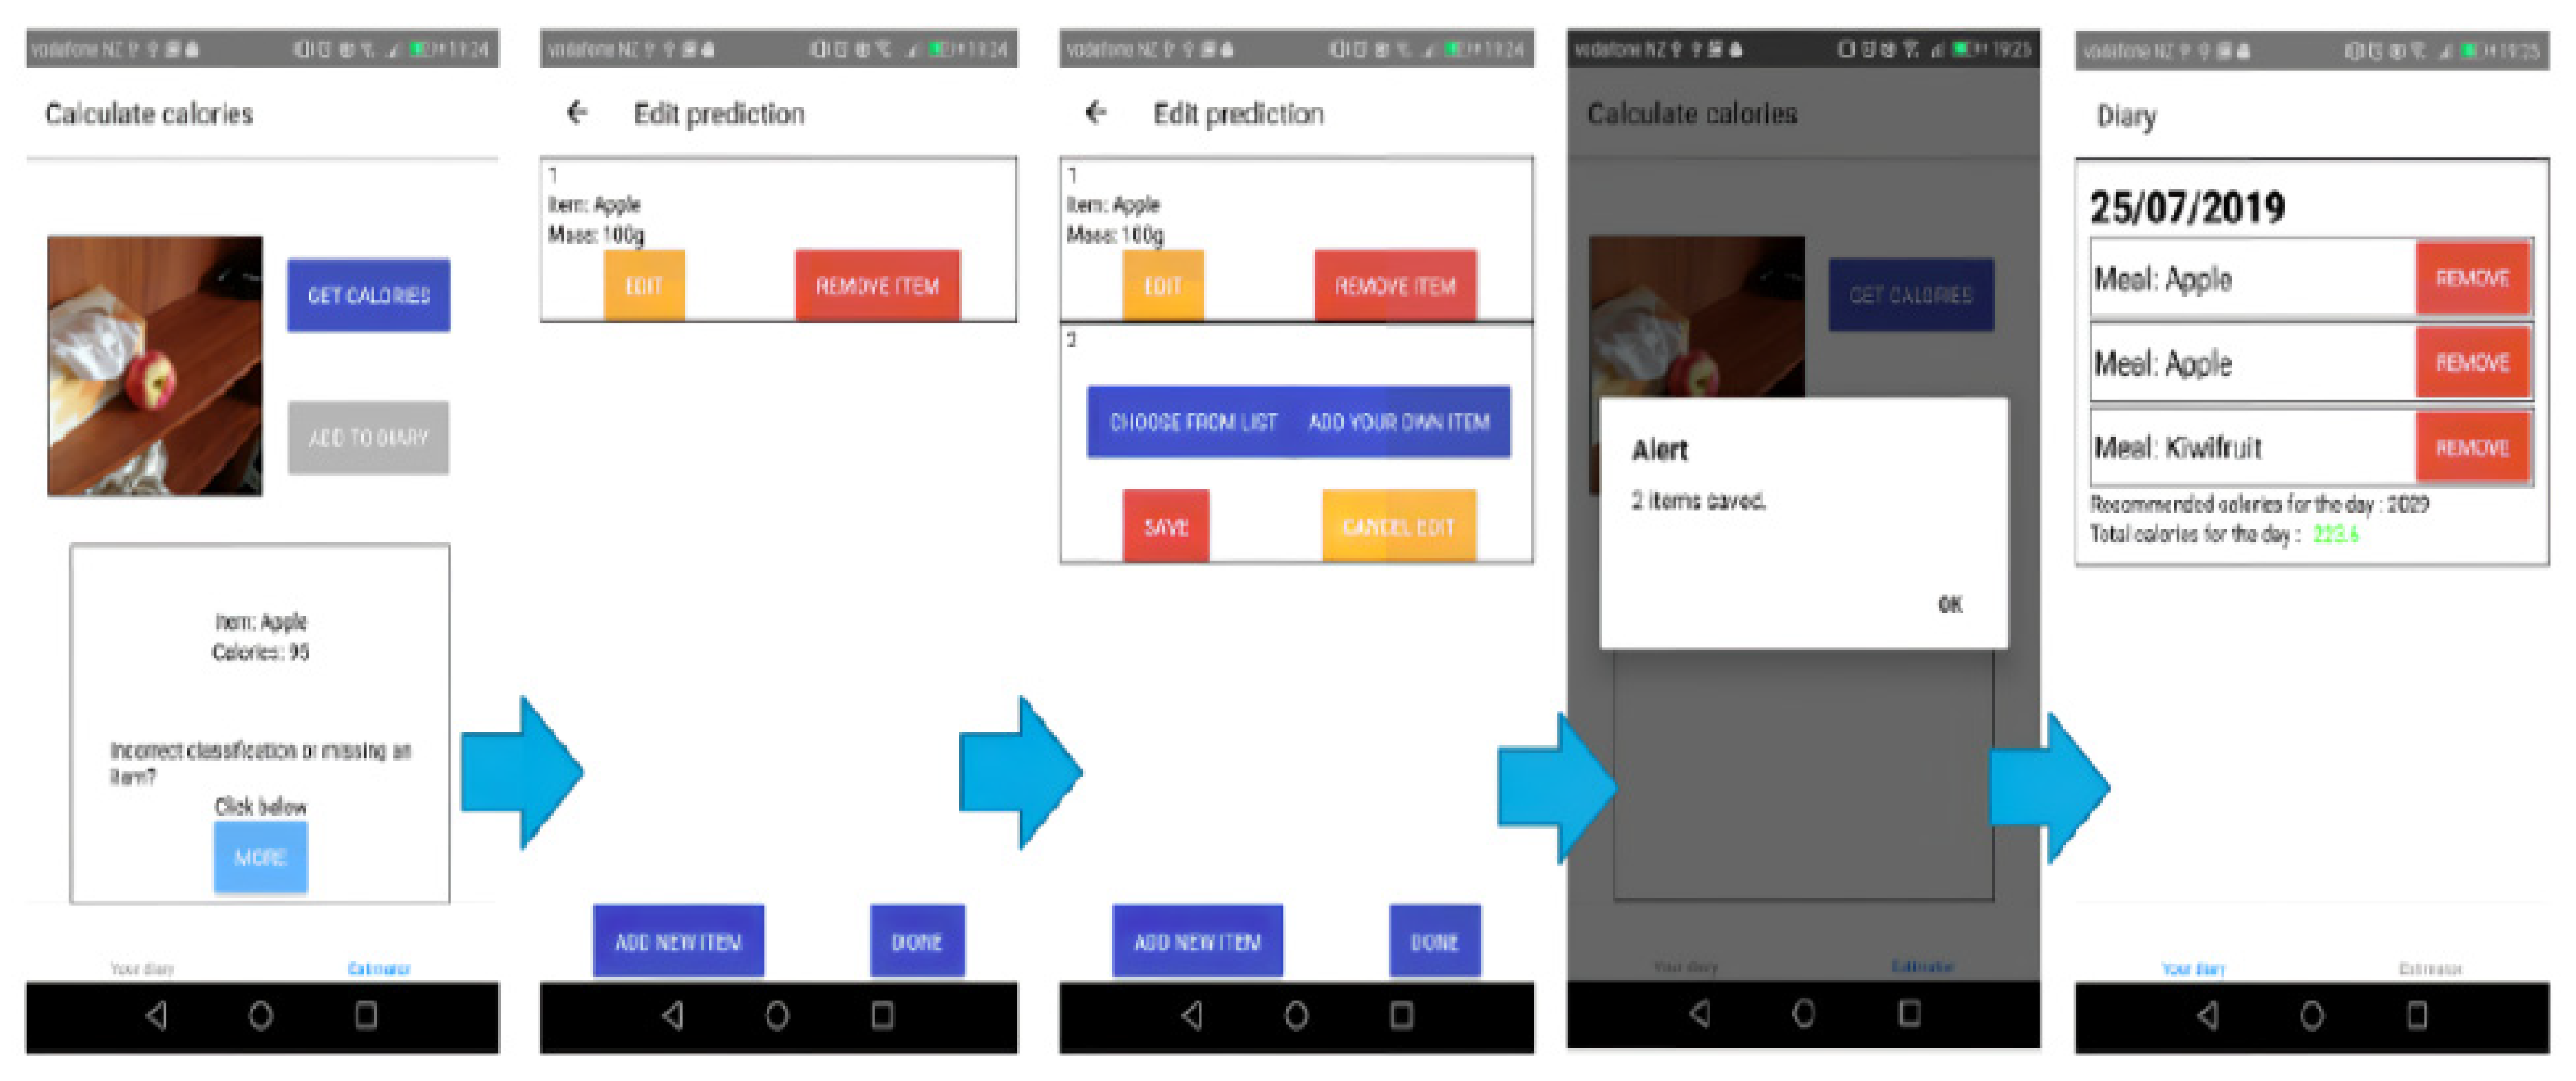
3.7.3. Food Classifier Component

The user can take a picture or select one from their phone’s storage and transmit it to the back-end server for prediction using the food classifier component. The food item’s most distinguishing characteristics must be visible in the photograph. Additionally, as shown in Figure 6c, a coin must be held parallel to the food object at the same height. This is required to obtain a more accurate estimate of calories. When the server responds, a summary of the detected foods and their calorie counts are shown on the screen. The user now has two options: either turn to the food correction panel or put the items on show to their diary.

3.7.4. Food Correction Component

Food prediction is not precise all the time as it is dependent on the angle or brightness of the picture. We have incorporated a food correction capability as a remedy to this problem. The food correction element grants the user the ability to fix the results in case of misclassification or no classification. Users may add, remove, or edit items using this component, as shown in Figure 6d. There are two means to insert or change items. The former allows the user to select the correct food item with the correct calorie density from the database and only require supplying the mass (in grams) of the meal. In the latter case, users can enter custom items along with the calorie count.

4. Results and Discussion

The model developed was trained and evaluated using the TensorFlow Object Detection API designed by Google and pretrained model, the fast-er_rcnn_inception_v2_coco, as a starting point. The pretrained model was acquired from the TensorFlow detection model zoo used in [17] which had a collection of pre-trained models with distinct precisions and speeds. The trained model was assessed using 20% of the images in the dataset. The training was performed with numerous changes to the decaying learning rate and was left for five epochs of training.

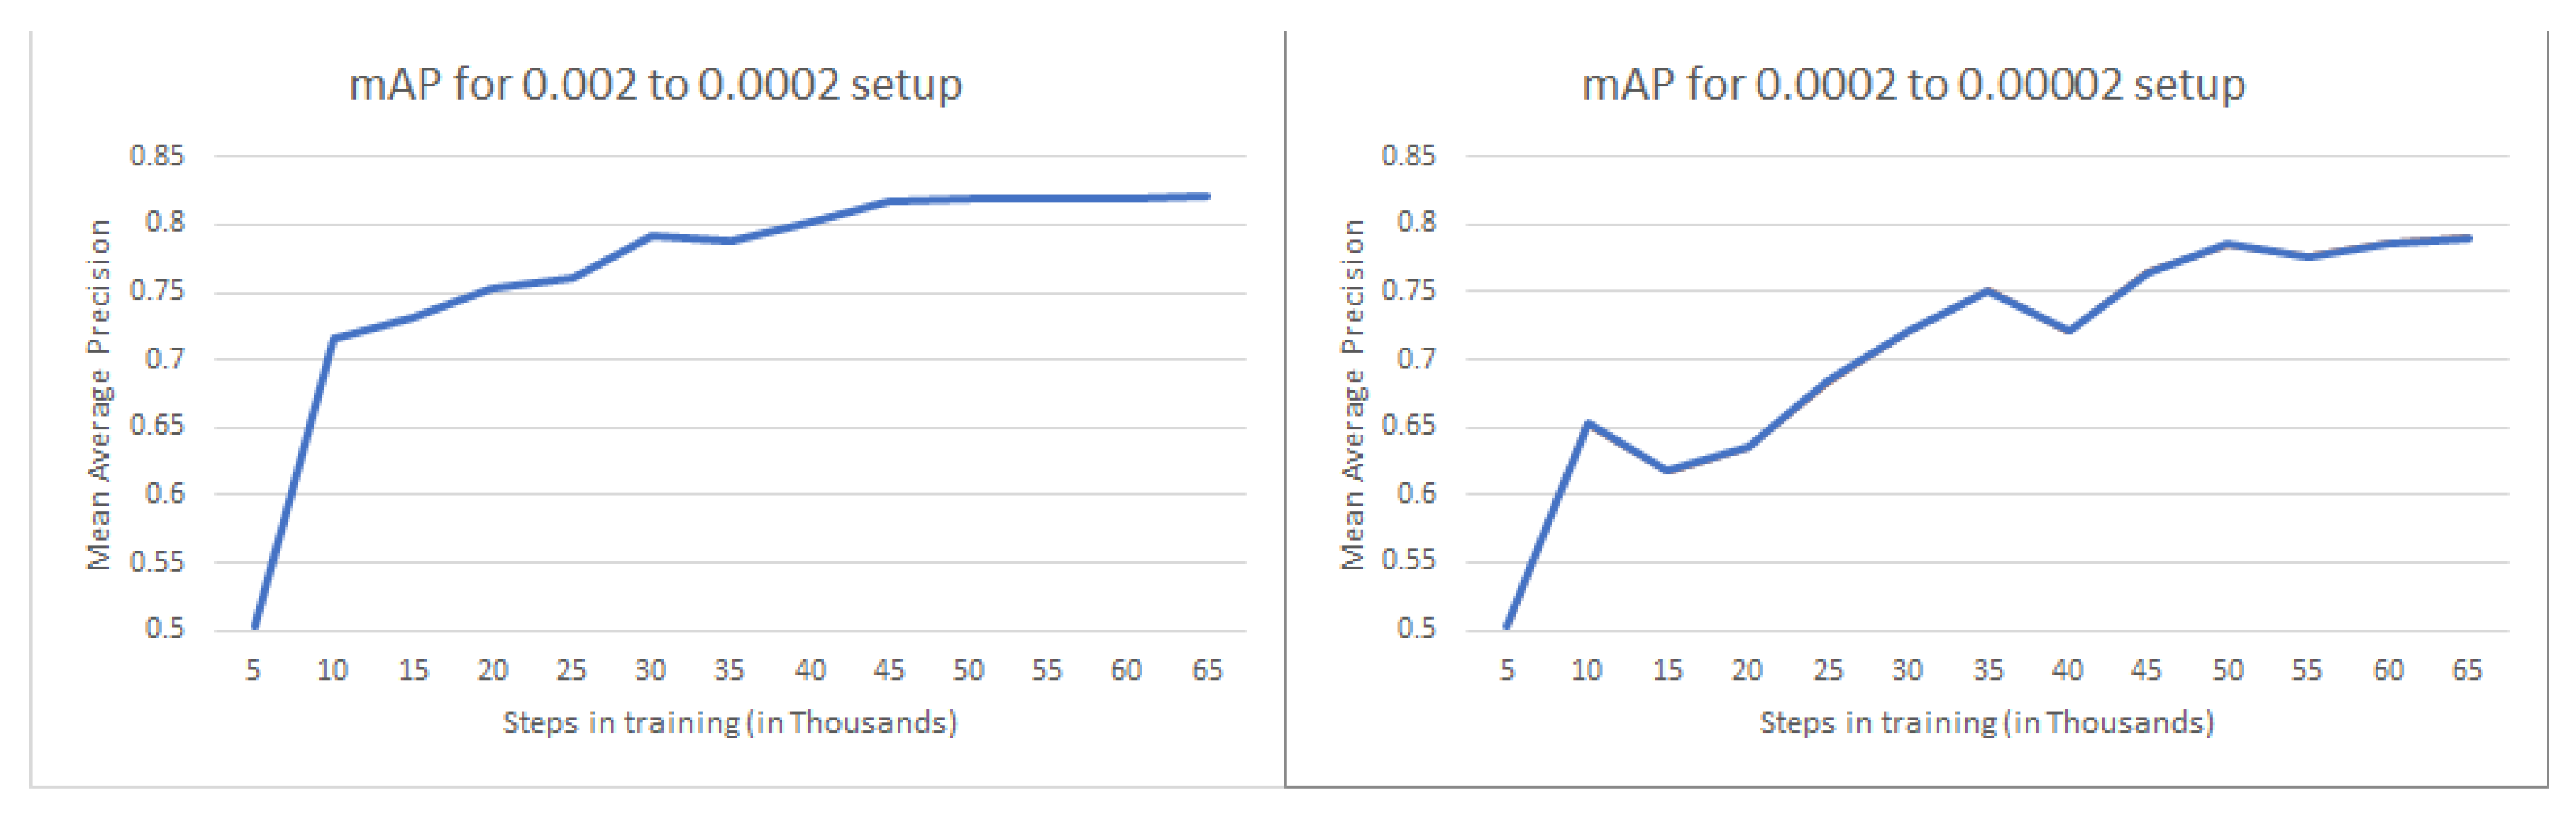
4.1. Evaluation Metrics

We used mean average precision (mAP) to gauge the performance of the system as this is the most frequently applied evaluation metric for object detection and image retrieval. It measures the average precision of a model across multiple classes or queries. The formal definitions for accuracy, precision, and recall are provided in Equations (2)–(4)
Accuracy = TP TP + FP + FN
Prescision = TP TP + FP
Recall = TP TP + FN
AP is the area under the precision–recall curve, which plots the precision against the recall. Once the AP score for each class or query is computed, the mAP score is calculated as the mean of the AP scores across all classes or queries. In other words, the mAP score provides an overall performance measure of the model, considering its ability to retrieve relevant instances across multiple classes or queries, as given by Equation (5).
mAP = n N AP N
where AP is average precision for a query; n is the set N of queries.

4.2. Evaluation Results

The accuracy of the model was evaluated offline and in real-time. The real-time scenario involves identifying certain foods 100 times and determining the probability of correct classification. To evaluate the performance of the calorie estimation, the average calorie count over 100 different images was determined and compared to the ground truth. We used mean average precision (mAP) to evaluate the performance of our system. The following setups had the most success in classification: a decaying learning rate of 0.0002 to 0.00002, achieved a mean average precision (mAP) of 0.7907, an average recall (AR) of 0.8132, and a decaying learning rate of 0.002 to 0.0002 led to a mean average precision (mAP) of 0.8211 and an average recall (AR) of 0.8352. These two methods have remarkably similar accuracies, although the latter slightly outperforms the former, as shown in Figure 7.
Real-time testing of the application was carried out in the locations where they are most likely to exist or where food is consumed, such as convenience stores located inside the premises of the university, food courts, and areas reserved for students to relax. These areas have different lighting conditions. As expected, during real-time validation, the accuracy of the model was affected (increase in misclassifications and decrease in confidence levels) by factors such as lighting, angling, and the image being out of focus. A model with 0.8211 mAP was used for testing in a real-time setup. There were 100 tests for the three classes (coke, apples, and oranges). As seen in Table 2, apples and oranges were correctly identified approximately 90% of the time, while coke cans were correctly identified 60% of the time. Calorie estimation was tested with the 0.8211 mAP model. It was used to estimate the calories of a Coca-Cola can, apples, and oranges 100 times; when the classification was correct, it returned an average calorie count. The average calorie count of these three classes was within a 10% error of the actual calories. The predictions can vary from the ground truth, as listed in Table 2, and this deviation can be very large at times. Coca-Cola can recognition underperformed compared with apples and oranges. This may be due to variations within the Coca-Cola can dataset, as a subset of the data was obtained through web scraping. This may limit the usability of the application because of its misclassification; however, the user is still able to use the food correction screen to choose the correct item manually. This application may have better usability if object detection can be performed on the device. For example, the model classifies food in real-time while simultaneously capturing a photo. In this way, the user can take time to find the perfect position to obtain a correct classification, and the application will be shown on the screen if the item is identified. In the current implementation, we used image augmentation according to which dataset is limited and which may not contain the image under different conditions.
For the volume estimation, the average calories measured for a particular food were within a 10% range of actual calorie count (20 calories lower or higher for the mentioned cases). The overestimation was likely due to the GrabCut algorithm not segmenting the image cleanly; thus, there were additional background pixels left in the image. In addition, the volume varied depending on the location of the coin. The user must hold the coin at the same height as the food item, as shown in Figure 8. If the coin is placed higher than the food, the calorie estimate is lower; if it is placed lower, the calorie estimate is higher. However, it is not difficult to obtain a consistent estimate if the user knows how high it is to hold the coin. Additionally, for the orange and apple estimates, the fruit was not always perfectly spherical. Depending on which side of the fruit faces the camera, calorie estimation is affected. Calorie estimation is limited by the fact that only a single image is used to determine the size of the food. However, this is not a significant issue, as this amount of error is still a reasonable indicator of a user’s dietary intake.
A detailed procedure of the food recognition process and the results obtained in the real-world scenario with the help of a sequence of screenshots taken when using the proposed smartphone application are shown in Figure 9. The system recognizes food and estimates the nutritional value of food items. Different types of alerts are generated by the system, which includes the successful saving of the food item, calorie count, high-nutrition food item detection, and exceeding the recommended calorie count.
We compared the results with those reported in state-of-the-art studies similar to ours. Table 3 summarizes the comparison between our approach and other approaches that use machine learning. Most of the earlier works produced high accuracy, but none of these systems were mobile-based solutions. These are desktop-based solutions that have resources and cannot provide information to the user in real-time. Only [41,45] are mobile-based solutions that have accuracies similar to our solution; in fact, Ref. [28] has a lower accuracy rate than the proposed system, although it can manage more categories of food.

5. Conclusions

In this study, we present the design and development of a mobile-based smartphone application for dietary awareness that helps overweight people lose weight by keeping track of their food intake and nutritional value. We leverage deep convolutional neural network models (e.g., faster R-CNN) by developing an application that uses the TensorFlow Object Detection API and the GrabCut algorithm for food detection and identification. We trained our model with over 16,000 images of fourteen different categories, including the reference object. The experimental results indicated that the proposed system has an overall accuracy of around 80% and calorie count was within a 10% range of actual value. In the current implementation, we recognized fourteen categories of food that include junk food as well as fizzy drinks, which are injurious to health. In the future, we intend to extend our system to include more food categories and enhance the existing dataset using image augmentation to improve the accuracy of the system.

Author Contributions

All authors contributed extensively to the work presented in this paper. Conceptualization, M.N.; methodology, M.N., H.S. and L.C.; software, H.S. and L.C.; validation, H.S., L.C. and M.N.; formal analysis, M.N. and J.M.H.B.; investigation, M.N. and J.M.H.B.; resources, M.N.; data curation, M.N., H.S. and L.C.; writing—original draft preparation, H.S., L.C. and M.N.; writing—review and editing, M.N. and J.M.H.B.; visualization, M.N. and J.M.H.B.; supervision, M.N.; project administration, M.N.; funding acquisition, none. All authors have read and agreed to the published version of the manuscript.

Funding

This research received no external funding.

Institutional Review Board Statement

Not Applicable.

Informed Consent Statement

Not Applicable.

Data Availability Statement

We encourage all authors of articles published in MDPI journals to share their research data. In this section, please provide details regarding where data supporting reported results can be found, including links to publicly archived datasets analyzed or generated during the study. Where no new data were created, or where data is unavailable due to privacy or ethical restrictions, a statement is still required. Suggested Data Availability Statements are available in section “MDPI Research Data Policies” at https://www.mdpi.com/ethics. The datasets used and/or analyzed in the current study are available through links provided in the paper. The dataset are also available the from the corresponding author upon reasonable request.

Acknowledgments

This research work has been carried out in undergraduate lab, department of Electrical, Computer, and Software Engineering, The University of Auckland, New Zealand. The authors are thankful to Rashina Hoda for her support.

Conflicts of Interest

The authors declare no conflict of interest.

Appendix A

Asi 06 00053 g0a1
Asi 06 00053 g0a2

References

  1. Okunogbe, A.; Nugent, R.; Spencer, G.; Powis, J.; Ralston, J.; Wilding, J. Economic impacts of overweight and obesity: Current and future estimates for 161 countries. BMJ Glob. Health 2022, 7, e009773. [Google Scholar] [CrossRef] [PubMed]
  2. Tang, K.; Kumar, A.; Nadeem, M.; Maaz, I. CNN-Based Smart Sleep Posture Recognition System. IoT 2021, 2, 119–139. [Google Scholar] [CrossRef]
  3. Muppavram, S.; Patel, N.; Nadeem, M.P. Posture Alert. In Proceedings of the 2018 IEEE Region Ten Symposium (Ten-symp), Sydney, Australia, 4–6 July 2018. [Google Scholar]
  4. Loos, R.J.; Yeo, G.S. The genetics of obesity: From discovery to biology. Nat. Rev. Genet. 2022, 23, 120–133. [Google Scholar] [CrossRef] [PubMed]
  5. Basiotis, P.P.; Welsh, S.O.; Cronin, F.J.; Kelsay, J.L.; Mertz, W. Number of days of food intake records required to estimate individual and group nutrient intakes with defined confidence. J. Nutr. 1987, 117, 1638–1641. [Google Scholar] [CrossRef]
  6. 24-Hour Dietary Recall (24HR) at a Glance|Dietary Assessment Primer. 17 October 2021. Available online: https://dietassessmentprimer.cancer.gov/profiles/recall/ (accessed on 1 December 2021).
  7. Food Frequency Questionnaire at a Glance|Dietary Assessment Primer. 17 October 2021. Available online: https://dietassessmentprimer.cancer.gov/profiles/questionnaire/ (accessed on 1 December 2021).
  8. Holmes, B.; Dick, K.; Nelson, M. A comparison of four dietary assessment methods in materially deprived house-holds in England. Public Health Nutr. 2008, 11, 444–456. [Google Scholar] [CrossRef]
  9. Wohlers, E.M.; Sirard, J.R.; Barden, C.M.; Moon, J.K. Smart phones are useful for food intake and physical activity surveys. In Proceedings of the Annual International Conference of the IEEE Engineering in Medicine and Biology Society, Minneapolis, MN, USA, 3–6 September 2009. [Google Scholar]
  10. Vu, T.; Lin, F.; Alshurafa, N.; Xu, W. Wearable food intake monitoring technologies: A comprehensive review. Computers 2017, 6, 4. [Google Scholar] [CrossRef]
  11. Boushey, C.J.; Spoden, M.; Zhu, F.M.; Delp, E.J.; Kerr, D.A. New mobile methods for dietary assessment: Review of image-assisted and image-based dietary assessment methods. Proc. Nutr. Soc. 2017, 76, 283–294. [Google Scholar] [CrossRef]
  12. Sun, M.; Burke, L.; Mao, Z.; Chen, Y.; Chen, H.; Bai, Y. eButton: A wearable computer for health monitoring and personal assistance. In Proceedings of the 51st Annual Design Automation Conference, San Francisco, CA, USA, 1–5 June 2014; pp. 1–6. [Google Scholar]
  13. Glanz, K.; Murphy, S.; Moylan, J.; Evensen, D.; Curb, J.D. Improving dietary self-monitoring and adherence with hand-held computers: A pilot study. Am. J. Health Promot. 2006, 20, 165–170. [Google Scholar] [CrossRef]
  14. Meyers, A.; Johnston, N.; Rathod, V.; Korattikara, A.; Gorban, A.; Silberman, N.; Guadarrama, S.; Papandreou, G.; Huang, J.; Murphy, K. Im2Calories: Towards an automated mobile vision food diary. In Proceedings of the IEEE International Conference on Computer Vision, Santiago, Chile, 7–13 December 2015. [Google Scholar]
  15. Ocay, A.B.; Fernandez, J.M.; Palaoag, T.D. NutriTrack: Android-based food recognition app for nutrition awareness. In Proceedings of the 3rd IEEE International Conference on Computer and Communications (ICCC), Chengdu, China, 13–16 December 2017. [Google Scholar]
  16. Tzutalin LabelImg. Free Software: MIT License. 2015. Available online: https://github.com/tzutalin/labelImg} (accessed on 10 September 2021).
  17. TensorFlow. Welcome to the Model Garden for TensorFlow. 2021. Available online: https://github.com/tensorflow/models/blob/7a1da146446d783f1fa41d38e403d04afae453be/research/object_detect (accessed on 17 October 2021).
  18. Ege, T.; Yanai, K. Simultaneous estimation of food categories and calories with multi-task CNN. In Proceedings of the 2017 Fifteenth IAPR International Conference on Machine Vision Applications (MVA), Nagoya, Japan, 8–12 May 2017. [Google Scholar]
  19. Chen, J.; Ngo, C.W. Deep-based ingredient recognition for cooking recipe retrieval. In Proceedings of the 24th ACM International Conference on Multimedia, Amsterdam, The Netherlands, 15–19 October 2016. [Google Scholar]
  20. Kong, F.; Tan, J. DietCam: Automatic dietary assessment with mobile camera phones. Pervasive Mob. Comput. 2012, 8, 147–163. [Google Scholar] [CrossRef]
  21. Martinel, N.; Foresti, G.L.; Micheloni, C. Wide-slice residual networks for food recognition. In Proceedings of the 2018 IEEE Winter Conference on applications of computer vision (WACV), Lake Tahoe, NV, USA, 12–15 March 2018. [Google Scholar]
  22. Hippocrate, E.A.A.; Suwa, H.; Arakawa, Y.; Yasumoto, K. Food weight estimation using smartphone and cutlery. In Proceedings of the First Workshop on IoT-Enabled Healthcare and Wellness Technologies and Systems, Singapore, 30 June 2016. [Google Scholar]
  23. Hassannejad, H.; Matrella, G.; Ciampolini, P.; Munari, I.D.; Mordonini, M.; Cagnoni, S. A new approach to image-based estimation of food volume. Algorithms 2017, 10, 66. [Google Scholar] [CrossRef]
  24. Dehais, J.; Anthimopoulos, M.; Shevchik, S.; Mougiakakou, S. Two-view 3D reconstruction for food volume estimation. IEEE Trans. Multimed. 2016, 19, 1090–1099. [Google Scholar] [CrossRef]
  25. Vodopivec-Jamsek, V.; de Jongh, T.; Gurol-Urganci, I.; Atun, R.; Car, J. Mobile phone messaging for preventive health care. Cochrane Database Syst. Rev. 2021, 12, CD007457. [Google Scholar]
  26. Nasi, G.; Cucciniello, M.; Guerrazzi, C. The role of mobile technologies in health care processes: The case of cancer supportive care. J. Med. Internet Res. 2015, 17, 3757. [Google Scholar] [CrossRef]
  27. Marcolino, M.S.; Oliveira, J.A.Q.; D’Agostino, M.; Ribeiro, A.L.; Alkmim, M.B.M.; Novillo-Ortiz, D. The impact of mHealth interventions: Systematic review of systematic reviews. JMIR MHealth UHealth 2018, 6, e23. [Google Scholar] [CrossRef]
  28. Moorhead, S.A.; Hazlett, D.E.; Harrison, L.; Carroll, J.K.; Irwin, A.; Hoving, C. A new dimension of health care: Systematic review of the uses, benefits, and limitations of social media for health communication. J. Med. Internet Res. 2013, 15, e1933. [Google Scholar] [CrossRef]
  29. Samad, S.; Ahmed, F.; Naher, S.; Kabir, M.A.; Das, A.; Amin, S.; Shariful, I.M. Smartphone apps for tracking food consumption and recommendations: Evaluating artificial intelligence-based functionalities, features and quality of current apps. Intell. Syst. Appl. 2022, 15, 200103. [Google Scholar] [CrossRef]
  30. Hussain, G.; Javed, K.; Cho, J.; Yi, J. Food intake detection and classification using a necklace-type piezoelectric wearable sensor system. IEICE Trans. Inf. Syst. 2018, 101, 2795–2807. [Google Scholar] [CrossRef]
  31. Kalantarian, H.; Alshurafa, N.; Le, T.; Sarrafzadeh, M. Monitoring eating habits using a piezoelectric sensor-based necklace. Comput. Biol. Med. 2015, 48, 46–55. [Google Scholar] [CrossRef]
  32. Alshurafa, N.; Kalantarian, H.; Pourhomayoun, M.; Liu, J.; Sarin, S.; Shahbazi, B.; Sarrafzadeh, M. Recognition of nutrition intake using time-frequency decomposition in a wearable necklace using a piezoelectric sensor. IEEE Sens. J. 2015, 15, 3909–3916. [Google Scholar] [CrossRef]
  33. Bi, Y.; Mingsong, L.; Song, C.; Xu, W.; Guan, N.; Yi, W. AutoDietary: A wearable acoustic sensor system for food intake recognition in daily life. IEEE Sens. J. 2015, 16, 806–816. [Google Scholar] [CrossRef]
  34. Zhou, B.; Cheng, J.; Sundholm, M.; Reiss, A.; Huang, W.; Amft, O.; Lukowicz, P. Smart Table Surface: A Novel Approach to Pervasive Dining Monitoring. In Proceedings of the 2015 IEEE International Conference on Pervasive Computing and Communications (PerCom), St. Louis, MO, USA, 23–27 March 2015. [Google Scholar]
  35. Lee, K. Automatic Estimation of Food Intake Amount Using Visual and Ultrasonic Signals. Electronics 2021, 10, 2153. [Google Scholar] [CrossRef]
  36. Anderez, D.O.; Lotfi, A.; Pourabdollah, A. A deep learning based wearable system for food and drink intake recognition. J. Ambient Intell. Humaniz. Comput. 2021, 12, 9435–9447. [Google Scholar] [CrossRef]
  37. Hussain, G.; Maheshwari, M.K.; Memon, M.L.; Jabbar, M.S.; Javed, K. A CNN based automated activity and food recognition using wearable sensor for preventive healthcare. Electronics 2019, 8, 1425. [Google Scholar] [CrossRef]
  38. Amugongo, L.M.; Kriebitz, A.; Boch, A.; Lütge, C. Mobile Computer Vision-Based Applications for Food Recognition and Volume and Calorific Estimation: A Systematic Review. Healthcare 2023, 11, 59. [Google Scholar] [CrossRef]
  39. Kong, F.; He, H.; Raynor, H.A.; Tan, J. DietCam: Multi-view regular shape food recognition with a camera phone. Pervasive Mob. Comput. 2015, 19, 108–121. [Google Scholar] [CrossRef]
  40. Beijbom, O.; Joshi, N.; Morris, D.; Saponas, S.; Khullar, S. Menu-match: Restaurant-specific food logging from images. In Proceedings of the 2015 IEEE Winter Conference on Applications of Computer Vision, Waikoloa, HI, USA, 5–9 January 2015. [Google Scholar]
  41. Horiguchi, S.; Amano, S.; Ogawa, M.; Aizawa, K. Personalized classifier for food image recognition. IEEE Trans. Multimed. 2018, 20, 2836–2848. [Google Scholar] [CrossRef]
  42. Miyazaki, T.; Chamin, D.S.G.; Aizawa, K. Image-based calorie content estimation for dietary assessment. In Proceedings of the IEEE International Symposium on Multimedia, Dana Point, CA, USA, 5–7 December 2011. [Google Scholar]
  43. Chen, M.; Yang, Y.; Ho, C.; Wang, S.; Liu, S.; Chang, E.; Yeh, C.; Ouhyoung, M. Automatic Chinese food identification and quantity estimation. In Proceedings of the SIGGRAPH Asia 2012 Technical Briefs, Singapore, 28 November–1 December 2012. [Google Scholar]
  44. Zhou, L.; Zhang, C.; Liu, F.; Qiu, Z.; He, Y. Application of deep learning in food: A review. Compr. Rev. Food Sci. Food Saf. 2019, 18, 1793–1811. [Google Scholar] [CrossRef]
  45. Zhang, W.; Yu, Q.; Siddiquie, B.; Divakaran, A.; Sawhney, H. “snap-n-eat” food recognition and nutrition estimation on a smartphone. J. Diabetes Sci. Technol. 2015, 9, 525–533. [Google Scholar] [CrossRef]
  46. Kawano, Y.; Yanai, K. Foodcam: A real-time food recognition system on a smartphone. Multimed. Tools Appl. 2015, 74, 5263–5287. [Google Scholar] [CrossRef]
  47. Joutou, T.; Yanai, K. A food image recognition system with multiple kernel learning. In Proceedings of the 2009 16th IEEE International Conference on Image Processing (ICIP), Cairo, Egypt, 7–10 November 2009. [Google Scholar]
  48. Tanno, R.; Okamoto, K.; Yanai, K. Deepfoodcam: A dcnn-based real-time mobile food recognition system. In Proceedings of the 2nd International Workshop on Multimedia Assisted Dietary Management, Amsterdam, The Netherlands, 16 October 2016. [Google Scholar]
  49. Yanai, K.; Kawano, Y. Food image recognition using deep convolutional network with pre-training and fine-tuning. In Proceedings of the 2015 IEEE International Conference on Multimedia Expo Workshops (ICMEW), Torino, Italy, 29 June–3 July 2015. [Google Scholar]
  50. Kawano, Y.; Yanai, K. Real-time mobile food recognition system. In Proceedings of the IEEE Conference on Computer Vision and Pattern Recognition Workshops, Portland, OR, USA, 23–28 June 2013; pp. 1–7. [Google Scholar]
  51. Boykov, Y.Y.; Jolly, M.P. Interactive graph cuts for optimal boundary & region segmentation of objects in ND images. In Proceedings of the Eighth IEEE International Conference on Computer Vision, ICCV 2001, Vancouver, BC, Canada, 7–14 July 2001. [Google Scholar]
  52. Fard, M.A.; Hadadi, H.; Tavakoli Targhi, A. Fruits and vegetables calorie counter using convolutional neural networks. In Proceedings of the 6th International Conference on Digital Health Conference, Montral, QC, Canada, 11–13 April 2016. [Google Scholar]
  53. Babaeian Jelodar, A.; Sun, Y. Calorie Aware Automatic Meal Kit Generation from an Image. arXiv 2021, arXiv:2112.09839. [Google Scholar]
  54. Pouladzadeh, P.; Shirmohammadi, S. Mobile multi-food recognition using deep learning. ACM Trans. Multimed. Comput. Commun. Appl. (TOMM) 2017, 13, 1–21. [Google Scholar] [CrossRef]
  55. Chopra, M.; Purwar, A. Food Image Recognition Using CNN, Faster R-CNN and YOLO. In Applications of Artificial Intelligence, Big Data and Internet of Things in Sustainable Development; CRC Press: Boca Raton, FL, USA, 2023; pp. 81–89. [Google Scholar]
  56. Davies, T.; Louie JC, Y.; Ndanuko, R.; Barbieri, S.; Perez-Concha, O.; Wu, J.H. A Machine Learning Approach to Predict the Added-Sugar Content of Packaged Foods. J. Nutr. 2022, 152, 343–349. [Google Scholar] [CrossRef]
  57. Davies, T.; Louie, J.C.Y.; Scapin, T.; Pettigrew, S.; Wu, J.H.; Marklund, M.; Coyle, D.H. An innovative machine learning approach to predict the dietary fiber content of packaged foods. Nutrients 2021, 13, 3195. [Google Scholar] [CrossRef]
  58. Kumar, G.K.; Rani, D.M.; Neeraja, K.; Philip, J. Food Calorie Estimation System Using ImageAI with RetinaNet Feature Extraction. In Advanced Techniques for IoT Applications: Proceedings of EAIT 2020; Springer: Singapore, 2020. [Google Scholar]
  59. Yang, H.; Zhang, D.; Lee, D.; Huang, M. A sparse representation based classification algorithm for Chinese food recognition. In Advances in Visual Computing: 12th International Symposium, ISVC 2016, Las Vegas, NV, USA, 12–14 December 2016, Proceedings, Part II 12; Springer: Cham, Switzerland, 2016. [Google Scholar]
  60. Fahira, P.K.; Rahmadhani, Z.P.; Mursanto, P.; Wibisono, A.; Wisesa, H.A. Classical machine learning classification for javanese traditional food image. In Proceedings of the 2020 4th International Conference on Informatics and Computational Sciences (ICICoS), Semarang, Indonesia, 10–11 November 2020. [Google Scholar]
  61. Chun, M.; Jeong, H.; Lee, H.; Yoo, T.; Jung, H. Development of Korean Food Image Classification Model Using Public Food Image Dataset and Deep Learning Methods. IEEE Access 2022, 10, 128732–128741. [Google Scholar] [CrossRef]
  62. Ramesh, A.; Sivakumar, A.; Angel, S. Real-time Food-Object Detection and Localization for Indian Cuisines using Deep Neural Networks. In Proceedings of the 2020 IEEE International Conference on Machine Learning and Applied Network Technologies (ICMLANT), Hyderabad, India, 20–21 December 2020. [Google Scholar]
  63. Khan, T.A.; Islam, M.S.; Ullah, S.A.; Rabby, A.S.A. A machine learning approach to recognize junk food. In Proceedings of the 10th International Conference on Computing, Communication and Networking Technologies (ICCCNT), Kanpur, India, 6–8 July 2019. [Google Scholar]
  64. Shifat, S.M.; Parthib, T.; Pyaasa, S.T.; Chaity, N.M.; Kumar, N.; Morol, M.K. A Real-time Junk Food Recognition System based on Machine Learning. In Proceedings of the Bangabandhu and Digital Bangladesh: First International Conference, ICBBDB 2021, Dhaka, Bangladesh, 30 December 2021; Springer: Cham, Switzerland, 2021. [Google Scholar]
  65. Valueva, M.V.; Nagornov, N.N.; Lyakhov, P.A.; Valuev, G.V.; Chervyakov, N.I. Application of the residue number system to reduce hardware costs of the convolutional neural network implementation. Math. Comput. Simul. 2020, 177, 232–243. [Google Scholar] [CrossRef]
  66. Fukushima, K. Artificial vision by multi-layered neural networks: Neocognitron and its advances. Neural Netw. 2013, 37, 103–119. [Google Scholar] [CrossRef]
  67. Girshick, R. Fast r-cnn. In Proceedings of the IEEE International Conference on Computer Vision, Santiago, Chile, 7–13 December 2015. [Google Scholar]
  68. Orchard, M.T.; Bouman, C.A. Color quantization of images. IEEE Trans. Signal Process. 1991, 39, 2677–2690. [Google Scholar] [CrossRef]
  69. Lu, Y. Food Image Recognition by Using Convolutional Neural Networks (CNNs). arXiv 2016, arXiv:1612.00983. [Google Scholar]
  70. Subhi, M.; Ali, S. A Deep Convolutional Neural Network for Food Detection and Recognition. In Proceedings of the 2018 IEEE-EMBS Conference on Biomedical Engineering and Sciences (IECBES), Kuching, Malaysia, 3–6 December 2018. [Google Scholar]
  71. Islam, M.; Siddique, B.K.; Rahman, S.; Jabid, T. Food Image Classification with Convolutional Neural Network. In Proceedings of the 2018 International Conference on Intelligent Informatics and Biomedical Sciences (ICIIBMS), Bangkok, Thailand, 21–24 October 2018. [Google Scholar]
  72. Jeny, A.; Junayed, M.; Ahmed, T.; Habib, M.; Rahman, M. FoNet-Local food recognition using deep residual neural networks. In Proceedings of the 2019 International Conference on Information Technology, ICIT 2019, Bhubaneswar, India, 20–23 December 2019. [Google Scholar]
  73. Razali, M.; Moung, E.; Yahya, F.; Hou, C.; Hanapi, R.; Mohamed, R.; Hashem, I. Indigenous Food Recognition Model Based on Various Convolutional Neural Network Architectures for Gastronomic Tourism Business Analytics. Information 2021, 12, 322. [Google Scholar] [CrossRef]
Figure 1. Smart Diet Diary architecture.
Asi 06 00053 g001
Figure 2. Incremental developmental model.
Asi 06 00053 g002
Figure 3. Smart Diet Diary storyboard.
Asi 06 00053 g003
Figure 4. (a) Dataset image examples, (b) labelImg user interface.
Asi 06 00053 g004
Figure 5. Running faster R-CNN on TensorFlow.
Asi 06 00053 g005
Figure 6. Different components of front-end: (a) user profile, (b) diary component and database, (c) food classifier component, and (d) food correction component.
Asi 06 00053 g006
Figure 7. Mean average precision for both setups.
Asi 06 00053 g007
Figure 8. Volume estimation of a Coca-Cola can.
Asi 06 00053 g008
Figure 9. Mobile application results.
Asi 06 00053 g009
Table 1. Details of test and training dataset.
Sr. No.CategoryTrainingTestTotal
1Apple671200871
2Bluebird sour cream8052001005
3Chicken curry651200851
4Coca-Cola can10352001230
5Coin15464001946
6ETA chicken8172001017
7ETA sour cream8092001009
8Fanta can10591501209
9McDonalds Big-Mac8492001049
10McDonalds Fillet-o-Fish8722001072
11McDonalds Fries8492001049
12McDonalds McChicken8362001036
13Orange718200918
14Pizza Hut8462001046
Table 2. Results from the real environment test.
ItemAccuracyAverage CaloriesActual Calories
Coca-Cola can60%153142
Apple92%7778
Orange90%5358
Table 3. Results from the real environment test.
AuthorsDatasetCategories Techniques Accuracy
Proposed ApproachSelf-collected10Faster R-CNN80.06%
Yanai et al. (2021) [50]UECFOOD1001000DCNN78.77%
UEC-FOOD2561000 67.57%
Joutou et al. (2009) [47] 50Multiple kernel learning61.34%
Zhang et al. (2015) [45]Online image database, e.g., ImageNet, Flickr, and Google Images15HOG/ SIFT80.30%
Chen et al. (2016) [19]VIREO Food-172100Multi-task DCNN82.12 to 97.29%
Lu (2016) [69]Small-scale dataset10CNN, 3 convolution-pooling layers, 1 fully connected layer74.0%
Ege et al. (2017) [18] Web image mining15multi-task CNN77.90 to 80.60%
Horiguchi et al. (2018) [28,52]FoodLog-FLD213CNN-based fixed-class54.60 to 72.40%
Subhi and Ali (2018) [70]Self-collected Malaysian
foods
11Modified VGG19-CNN,
21 convolutional layers, 3 fully connected layers
Not reported
Islam et al. (2018) [71]Food-11 dataset11CNN, 5 convolution layers, 3 max-pooling layers, 1 fully connected layer74.70%
Inception V3 pre-trained, 2 fully connected layers92.86%
Jeny et al. (2019) [72]Self-collected, Bangladeshi
foods
6FoNet-based deep residual
Neural network with 47 layers
98.16%.
Razali et al. (2021) [73]Sabahan foods11EFFNet + CNN94.01%
Disclaimer/Publisher’s Note: The statements, opinions and data contained in all publications are solely those of the individual author(s) and contributor(s) and not of MDPI and/or the editor(s). MDPI and/or the editor(s) disclaim responsibility for any injury to people or property resulting from any ideas, methods, instructions or products referred to in the content.

