Tutorial

The Project-Based Learning Study of Insurance Information Courses to Simulate the Application of Online Analytical Processing

Department of Insurance and Finance Management, Chaoyang University of Technology, Taichung City 413, Taiwan
*
Author to whom correspondence should be addressed.
Appl. Syst. Innov. 2023, 6(2), 47; https://doi.org/10.3390/asi6020047
Submission received: 29 December 2022 / Revised: 16 March 2023 / Accepted: 20 March 2023 / Published: 29 March 2023

Abstract

:
The use of data warehouses combined with online analytical processing (OLAP) platforms has become popular in Taiwan’s insurance market. However, most schools do not have an insurance data warehouse and OLAP platform for student learning in Taiwan. The researched courses are insurance information system courses for two university classes. Based on the teacher’s experience and innovativeness, those courses are integrated using the guided project-based learning approach. Students need to build a customer micro-database, analyze customer figures through pivot analysis charts, and plan marketing campaigns. The study finds a project-based learning approach is helpful to enhance students’ OLAP analysis abilities. Secondly, the research finds that the flexibility for students to choose the topic of their project is one of the key success factors. Thirdly, the evaluation share of the student’s learning scores is important for the completion of the project. Fourthly, the courses are accompanied with satisfaction questionnaires to monitor the learning results and analyze the learning satisfaction for students among course A, course B, and the college average. Those students in the two classes both have higher satisfaction scores than the college average, but there are still differences between the classes after the t-test.

1. Introduction

1.1. Research Motivation and Objective

Most Taiwanese insurance companies have large amounts of data on their mainframe. For further customer analysis and campaign management purposes, most insurance companies have developed data warehouses and online analytical processing (OLAP) platforms.
On the other hand, most schools in Taiwan do not own an insurance database, policyholder consumption transaction records, or an OLAP platform. The researched courses were two different classes of an insurance information system course taught by the same teacher in a different school year. The learning courses were conducted by simulating the application of the OLAP platform according to the teacher’s industry experience and innovativeness.
Students need to take on the challenges during the learning procedure and operation of technology and software. Teachers need to instruct and demonstrate for students to assist them in overcoming the challenges, and then students need to complete their own project.
The study tries to study if the project-based learning approach has better learning satisfaction for students. Are there any key success factors for those researched courses? Are there any key recommendations or shortcomings that need to be concerned during the learning process?

1.2. Research Scope and Methods

Learning by doing is an important learning theory and application in recent education [1,2,3]. The design of research is based on learning by doing theory through project-based learning. The research scope and methods are summarized as follows, shown in Figure 1.
  • Online analytical processing (OLAP) is convenient for performing multi-dimension analysis from big data. Because schools do not have an OLAP platform, the OLAP courses endeavor to simulate the OLAP process through offline Excel pivot analysis charts.
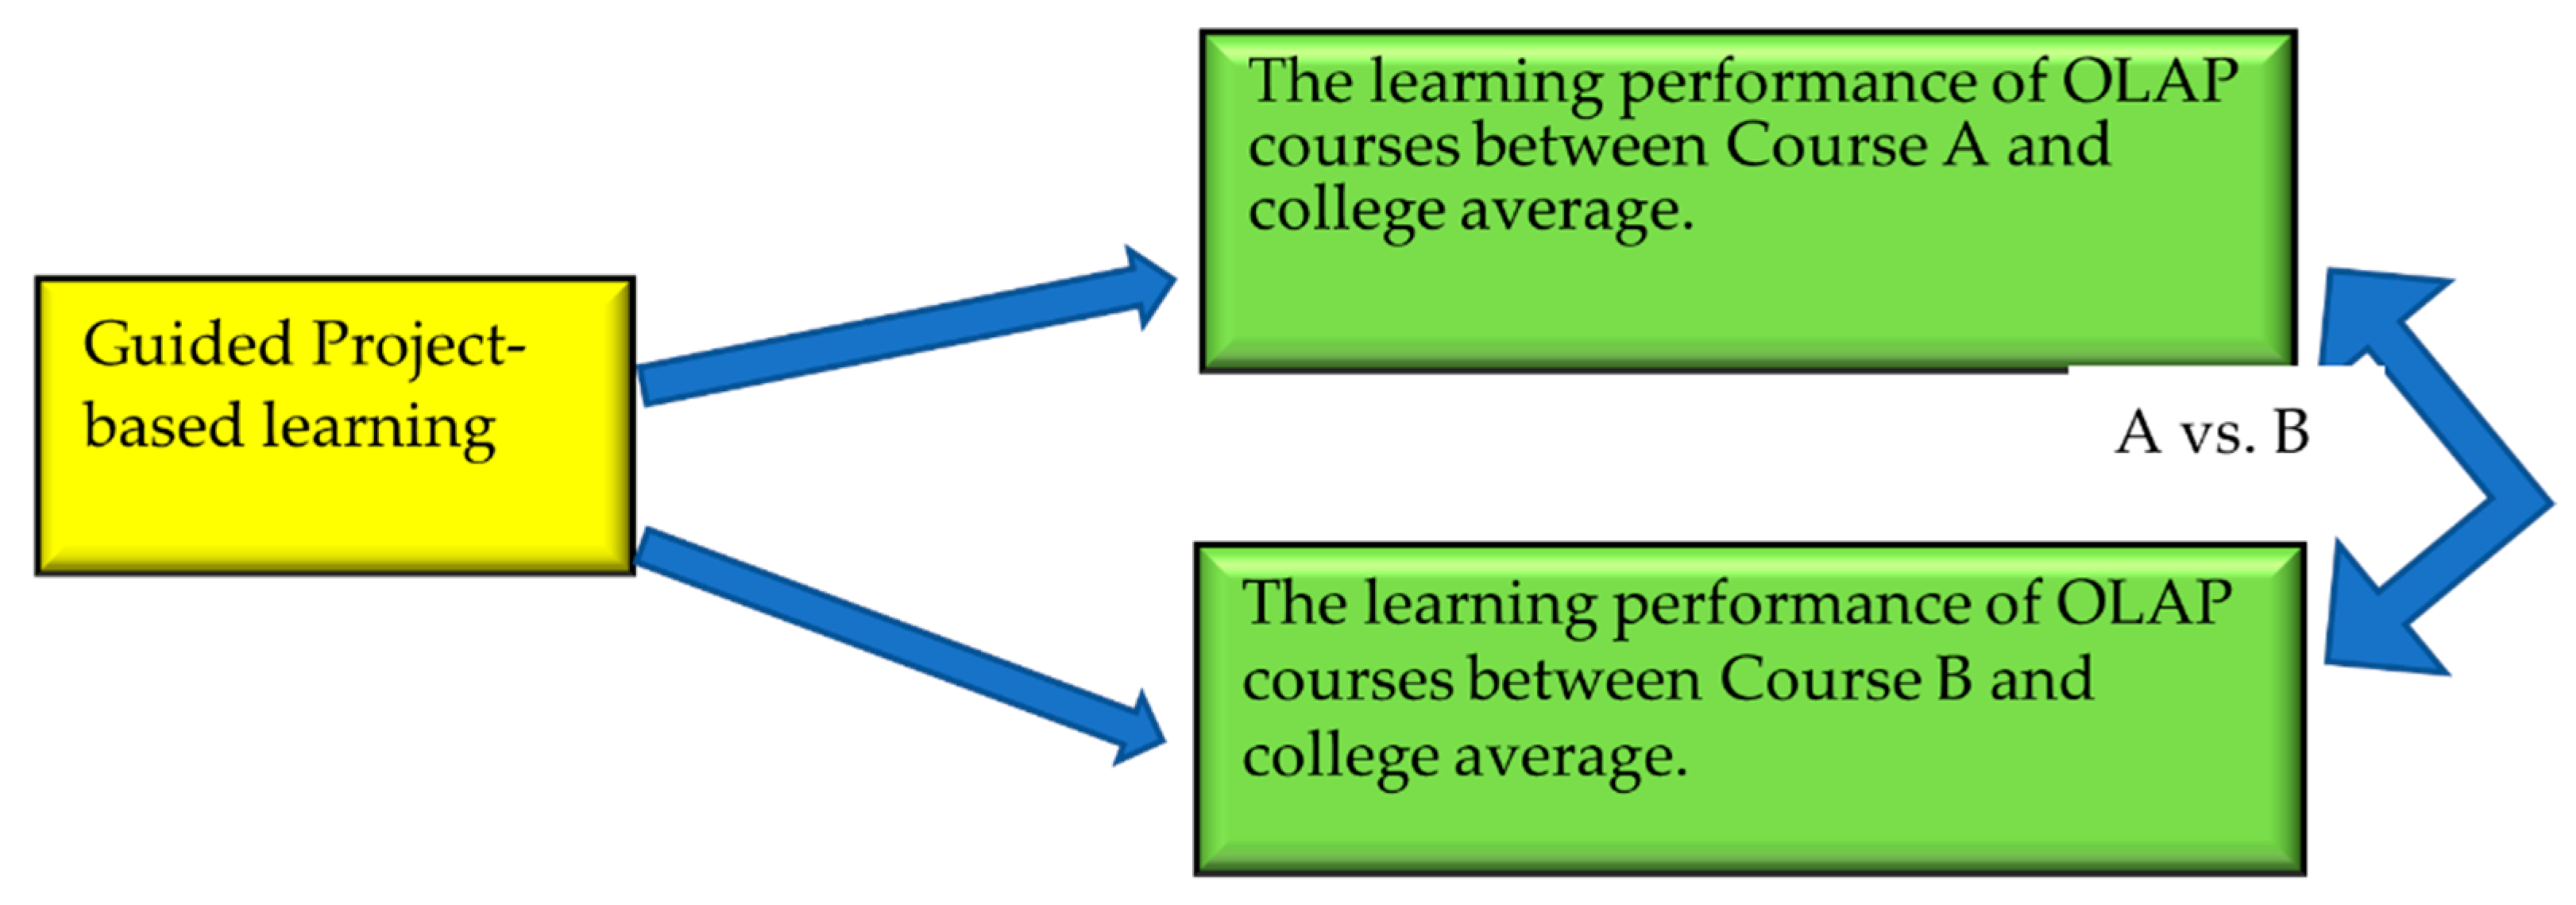
  • The researched courses adopted a guided project-based learning approach to simulate the practical process of the OLAP system. The courses are accompanied with satisfaction questionnaires to monitor the learning results and analyze the learning satisfaction for students among course A, course B, and the college average. Through the research conducted during the learning process, the study tries to simulate the online analytical processing platform and conclude the key success factors by comparing the satisfaction scores among course A, course B, and the college average.
  • The study adopts the t-test method for quantity satisfaction questionaries to compare the same or different figures between courses A and B. Furthermore, the questionnaires include a comparison of the qualitative feedback between courses A and B.
The contributions of this paper can be summarized as follows:
  • The study contains points of related OLAP literature and system functions.
  • Subject to the lack of an insurance OLAP platform and data warehouse in schools, the study develops a simple offline Excel pivot analysis chart for student learning.
  • To verify if the learning satisfaction scores of project-based learning courses are higher than others.
  • To review the key success factors through the research of project-based learning and the OLAP simulation process.

1.3. Research Restrictions

  • The study endeavors to simulate the application of OLAP based on Insurance Information System courses. However, the study is mainly related to the educational or tutorial field.
  • The number of students in courses A and B is, respectively, 20 and 14. The students in those courses are university students with jobs. Subject to the limitation of student numbers, it is not feasible to execute experimental group and control group analysis for every course within the same school year. The research can only assume that the college average score of questionnaires is equal to the score of the general learning approach for the comparison between project-based learning and the general learning approach.
  • Subject to the lack of an insurance OLAP platform and data warehouse in schools, the study focuses on pivot analysis charts skills to simulate the OLAP platform. The technology and description of an OLAP platform and data warehouse are not involved.

2. Literature Review

2.1. Related Literatures for Project-Based Learning

Learning by doing is an important learning theory and application in recent education [1,2,3]. Project-based learning is students work in groups to solve challenging problems [4]. Furthermore, project-based learning is a comprehensive approach to encourage students in learning and authentic problems [5]. Besides, project-based learning is a student-centered form of instruction and learning within real world practices [6].
Studies showed that students had better satisfaction with the project-based learning courses or had the potential to help most students learn science [3,7]. Project-based learning is an approach particularly well suited to achieving better learning results for computing students [8]. On the other hand, problem-based learning and project-based learning are innovative learning strategies for sustainable development in engineering education [9].
According to those literatures, it can be concluded that project-based learning mainly involves students doing “projects” under the guidance of teachers and with student cooperation. The study finds there is less project-based learning literature for insurance information courses. The related literature is summarized as shown in Table 1.

2.2. Related Literatures for Online Analytical Processing (OLAP)

OLAP enables multi-dimension data analysis for business intelligence and indicates the pivot table and chart by the user’s query operation. OLAP technology can be used to solve educational problems [10,11]. OLAP systems enable quick and straightforward querying from data warehouses. There are three types of online OLAP, such as those below [11,12]:
  • Multidimensional OLAP systems (MOLAP): These are multi-dimensional tables with analytical query functions. The MOLAP system has the function of pre-aggregation.
  • Relational OLAP systems (ROLAP): A user’s query is based on relational databases. ROLAP systems are not necessary to have the function of pre-aggregation.
  • Hybrid OLAP systems (HOLAP): The combination between MOLAP and ROLAP. HOLAP has a multi-dimensional query and pre-aggregation function.
Furthermore, an OLAP platform can indicate relevant statistical analysis through online real-time and multi-dimension customer analysis by a user’s simple click and drag operation [13]. OLAP platform is a kind of interactive business intelligence while data querying. Some OLAP allows data pre-aggregation because of its demonstrated performance in data querying [14]. Finally, the OLAP platform has a strong focus on interactive analysis of data to represent multi-dimension data [15].
According to those literatures, it can be concluded that OLAP is convenient for performing multi-dimension analysis from databases. The study finds there is less OLAP literature for insurance information courses. The related literature is summarized as shown in Table 2.
The study contains the points of related OLAP literature and system functions. Furthermore, Excel pivot analysis charts and tables have some similar functions to offline OLAP. The study endeavors to simulate the application of OLAP based on Insurance Information System courses.

3. The Design and Teaching Process for the Study Course

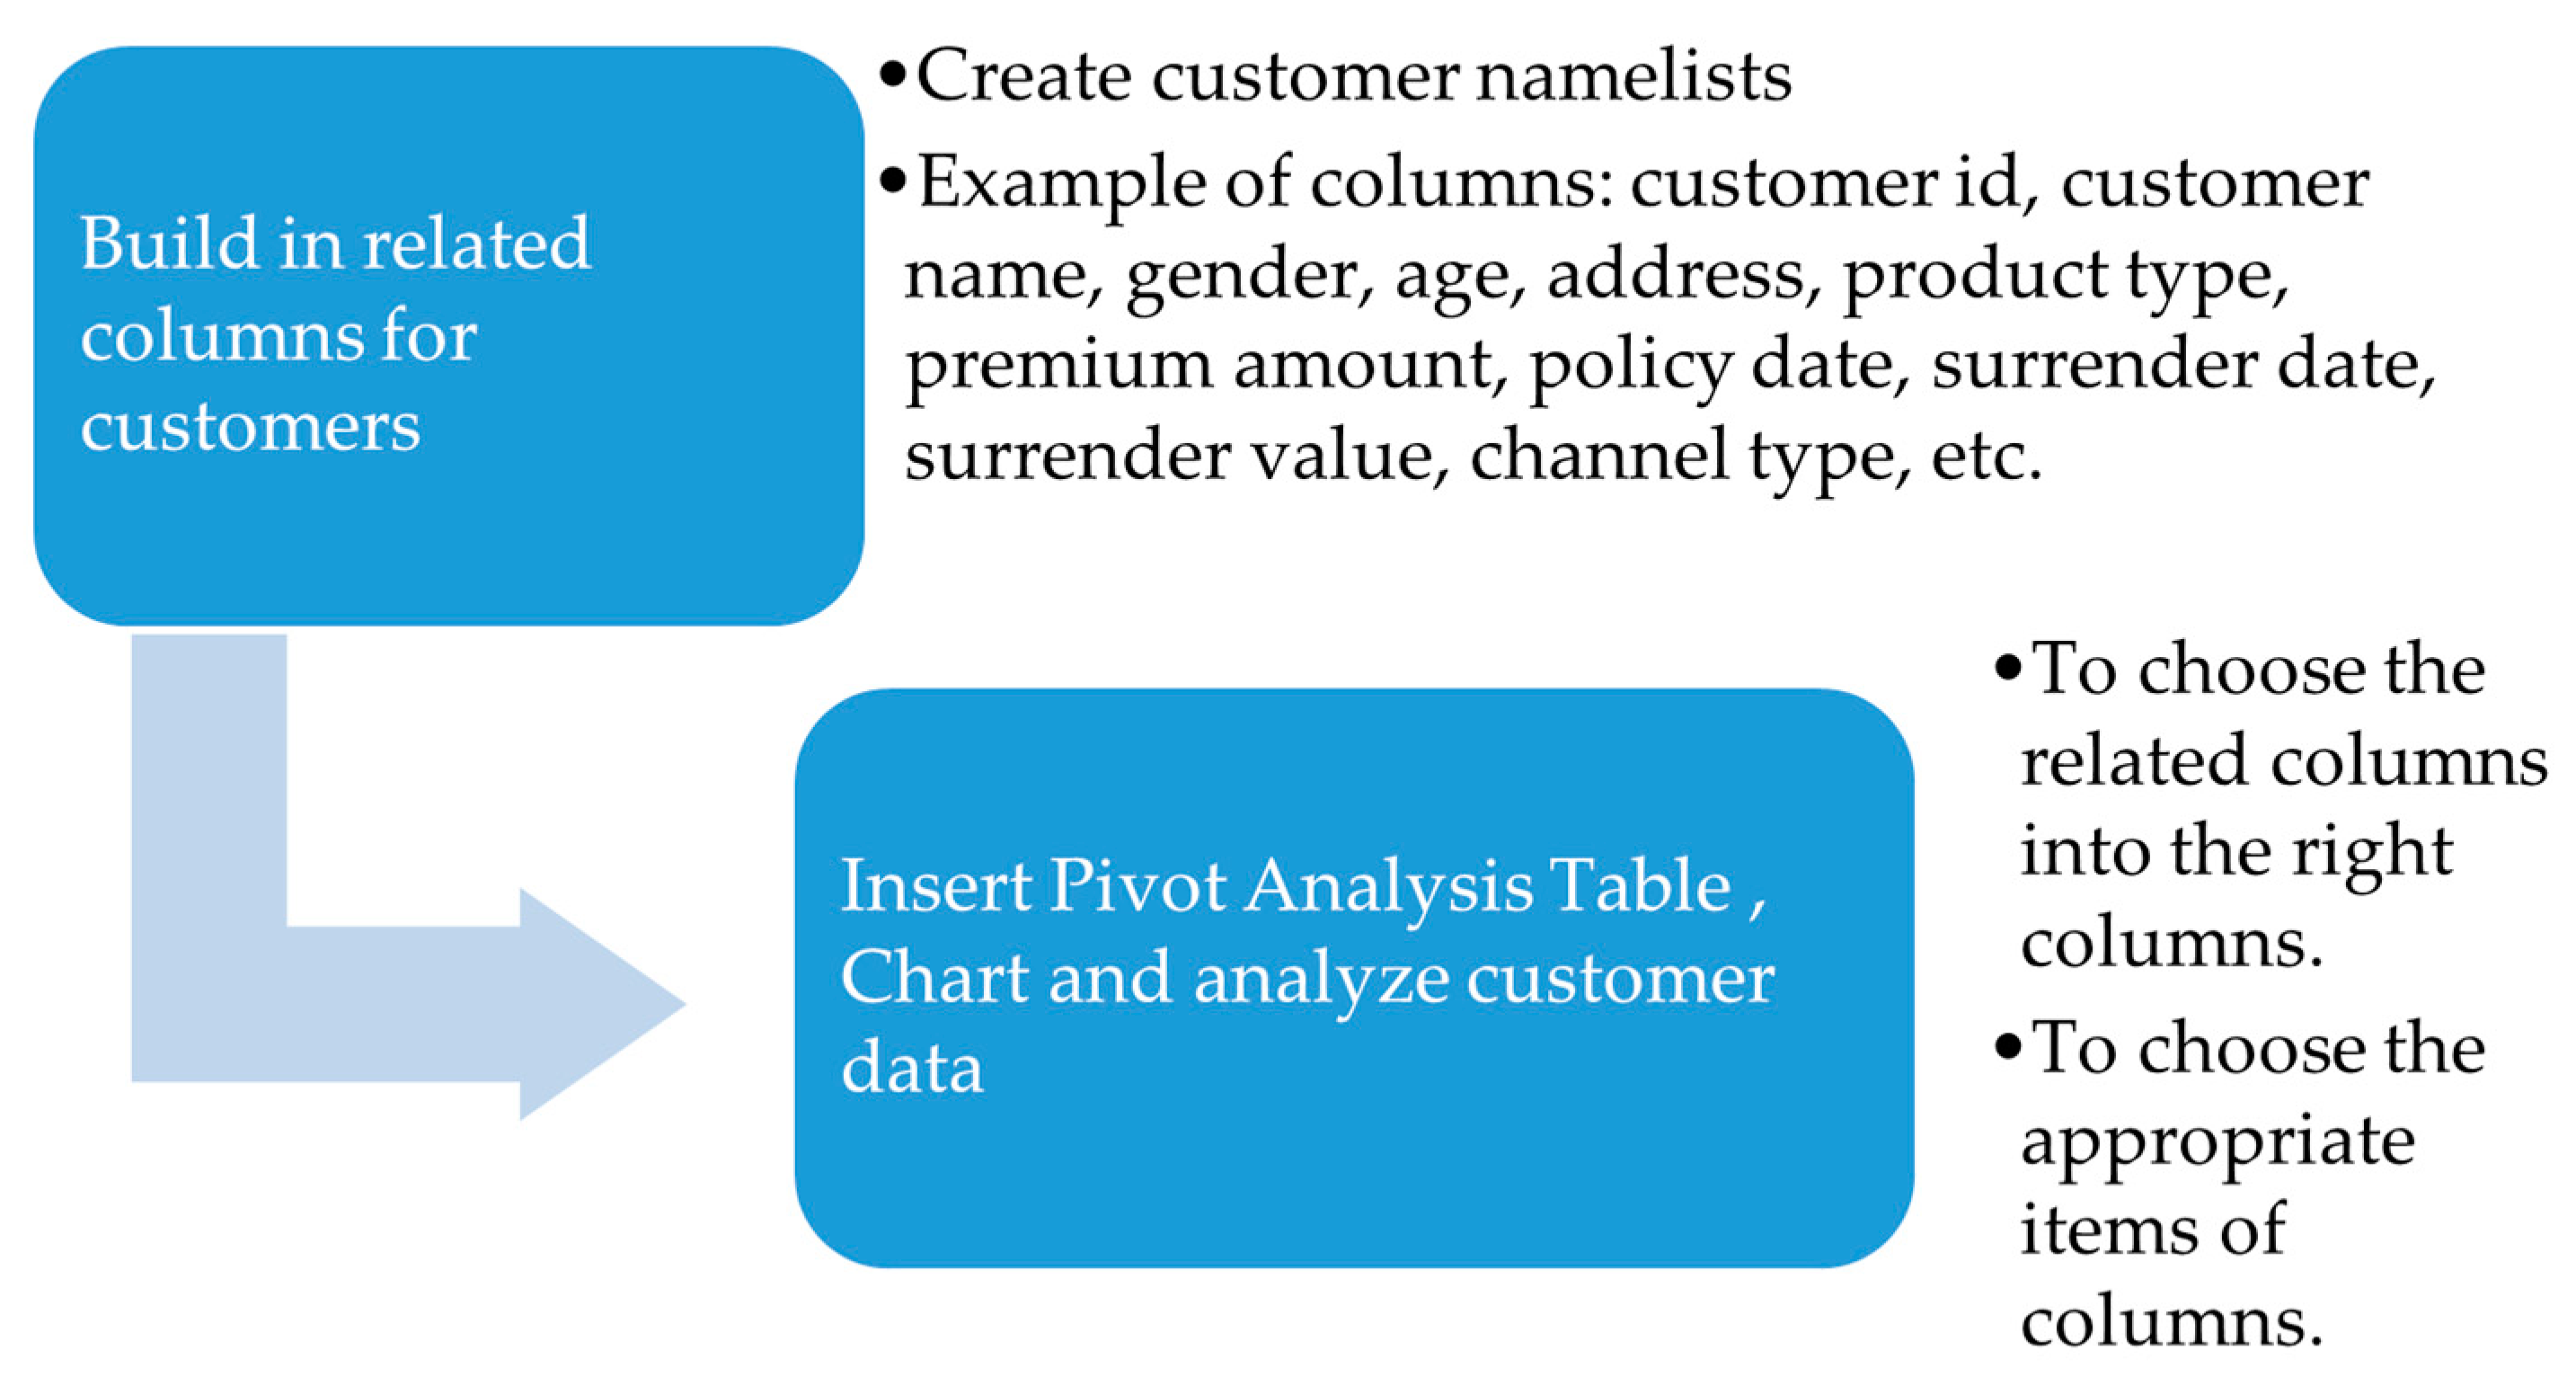
3.1. Course Design of Simulating OLAP Process

Students’ learning abilities for technology and software operation usually differ significantly during the learning process. The procedures for completing the project require a certain understanding of insurance product types, insurance premiums, and insurance channels for the insurance industry. Firstly, students need to establish a micro-customer database as the first step. Secondly, students analyze multi-dimension customer figures by inserting pivot analysis tables and charts in Excel software.
Thirdly, after students have found their meaningful customer analysis results, they need to prepare key company profiles, customer analysis findings, and then create related marketing campaigns for their target market. Finally, students are required to present to all classmates and the teacher. The three steps for the process of developing a project can be shown in Figure 2.
At the beginning of learning, the teacher usually emphasizes the importance of completing the project. In the first step, students need to be divided into different teams and then understand the concept of customer relationship management. To improve students’ learning performance, they were allowed to choose any kind of company for the project they preferred.
The study finds that giving students the freedom to choose the project topic is important to enhance their learning performance and satisfaction. Besides, the study finds the researched courses have enhanced learning performance through mutual team cooperation among members.
In this step, students need to choose their own company, position their company, and build their customer namelists in the micro-database through Excel software. For example, the fieldname of customer name lists contains customer ID, customer name, gender, customer age, occupation type, customer address area, policy number, premium amount, product type, channel type, policy date, surrender date, surrender value, premium paid method, campaign code, etc. After finishing the database, students need to learn the operation of a pivot analysis table or chart and try to execute comprehensive customer analysis.
In common learning procedures, the teacher instructs and operates in advance and then lets students operate by themselves. During the learning procedures, students usually need to take on the challenges for the operation of expanding a micro-database and inserting pivot analysis tables or charts. Students need to choose the related columns in the right place and then choose the appropriate items for the operation of pivot analysis tables or charts. After the teacher’s instruction and demonstration on pivot analysis tables and charts, students usually have lots of operational challenges or difficulties with constructing a database and inserting a multi-dimension pivot table or chart.

3.2. Learning and Instructing for Common Learning Challenges

Teachers usually demonstrate and instruct at the beginning of every step; however, students are not familiar with the operation procedure for every step. Teachers always go down to see the student’s operation and care about whether it is affordable for them to complete the next step of the operation. The common learning challenges of choosing a project company and inserting a pivot analysis table are summarized in Table 3, procedures shown in Figure 3.

3.3. Individual Learning Challenges: Adopting Individual Teaching and Demonstration

While students have individual learning challenges, teachers usually accompany students and demonstrate for them. The teacher needs to demonstrate detailed operation procedures for the student’s project. During the learning procedures of courses, the study finds that cooperation among students and team members is helpful for students’ learning. In the procedures of learning courses, the teacher is usually busier demonstrating and solving problems for students. Mutual learning and interaction among members and students play an important role in providing assistance to reduce the burden on the teacher. The study has summarized some individual learning challenges in Table 4.
Under the execution procedure of pivot analysis charts, students need cooperation and interaction with the teacher and team members to draw and analyze meaningfully multi-dimension analysis, such as the cross analysis among different product types, different channel types, and accumulated surrender values, example as shown in Figure 4.
In the last step, students filter important analysis findings and plan the related target customer campaigns. Every team needs to present it for all students and teachers in the class. After being guided by teachers or learning among themselves, all students have completed their projects in course A and course B.

4. Student’s Learning Satisfaction Analysis

4.1. The Design for Questionnaires of Learning Satisfaction

The questionnaires for students’ learning satisfaction evaluation were based on a Likert scale and held by the school. The learning satisfaction items of both courses are classified into five grades based on the same items of questionaries. The highest score for learning satisfaction is Five points. The grades and score points are listed below:
  • Strongly agree: Five points
  • Agree: Four points
  • Moderate: Three points
  • Disagree: Two points
  • Strongly Disagree: One point
The number of effective questionnaires is 27, and the effective ratio is 79%, as detailed in Table 5.
Besides, students can also fill in their comments or suggestions to their teacher in the last item of the questionnaire. There were two qualitative wordings in the feedback in course A, which were “The teacher is conscientious and responsible”. On the other hand, there is no wording feedback in the questionnaires for course B.

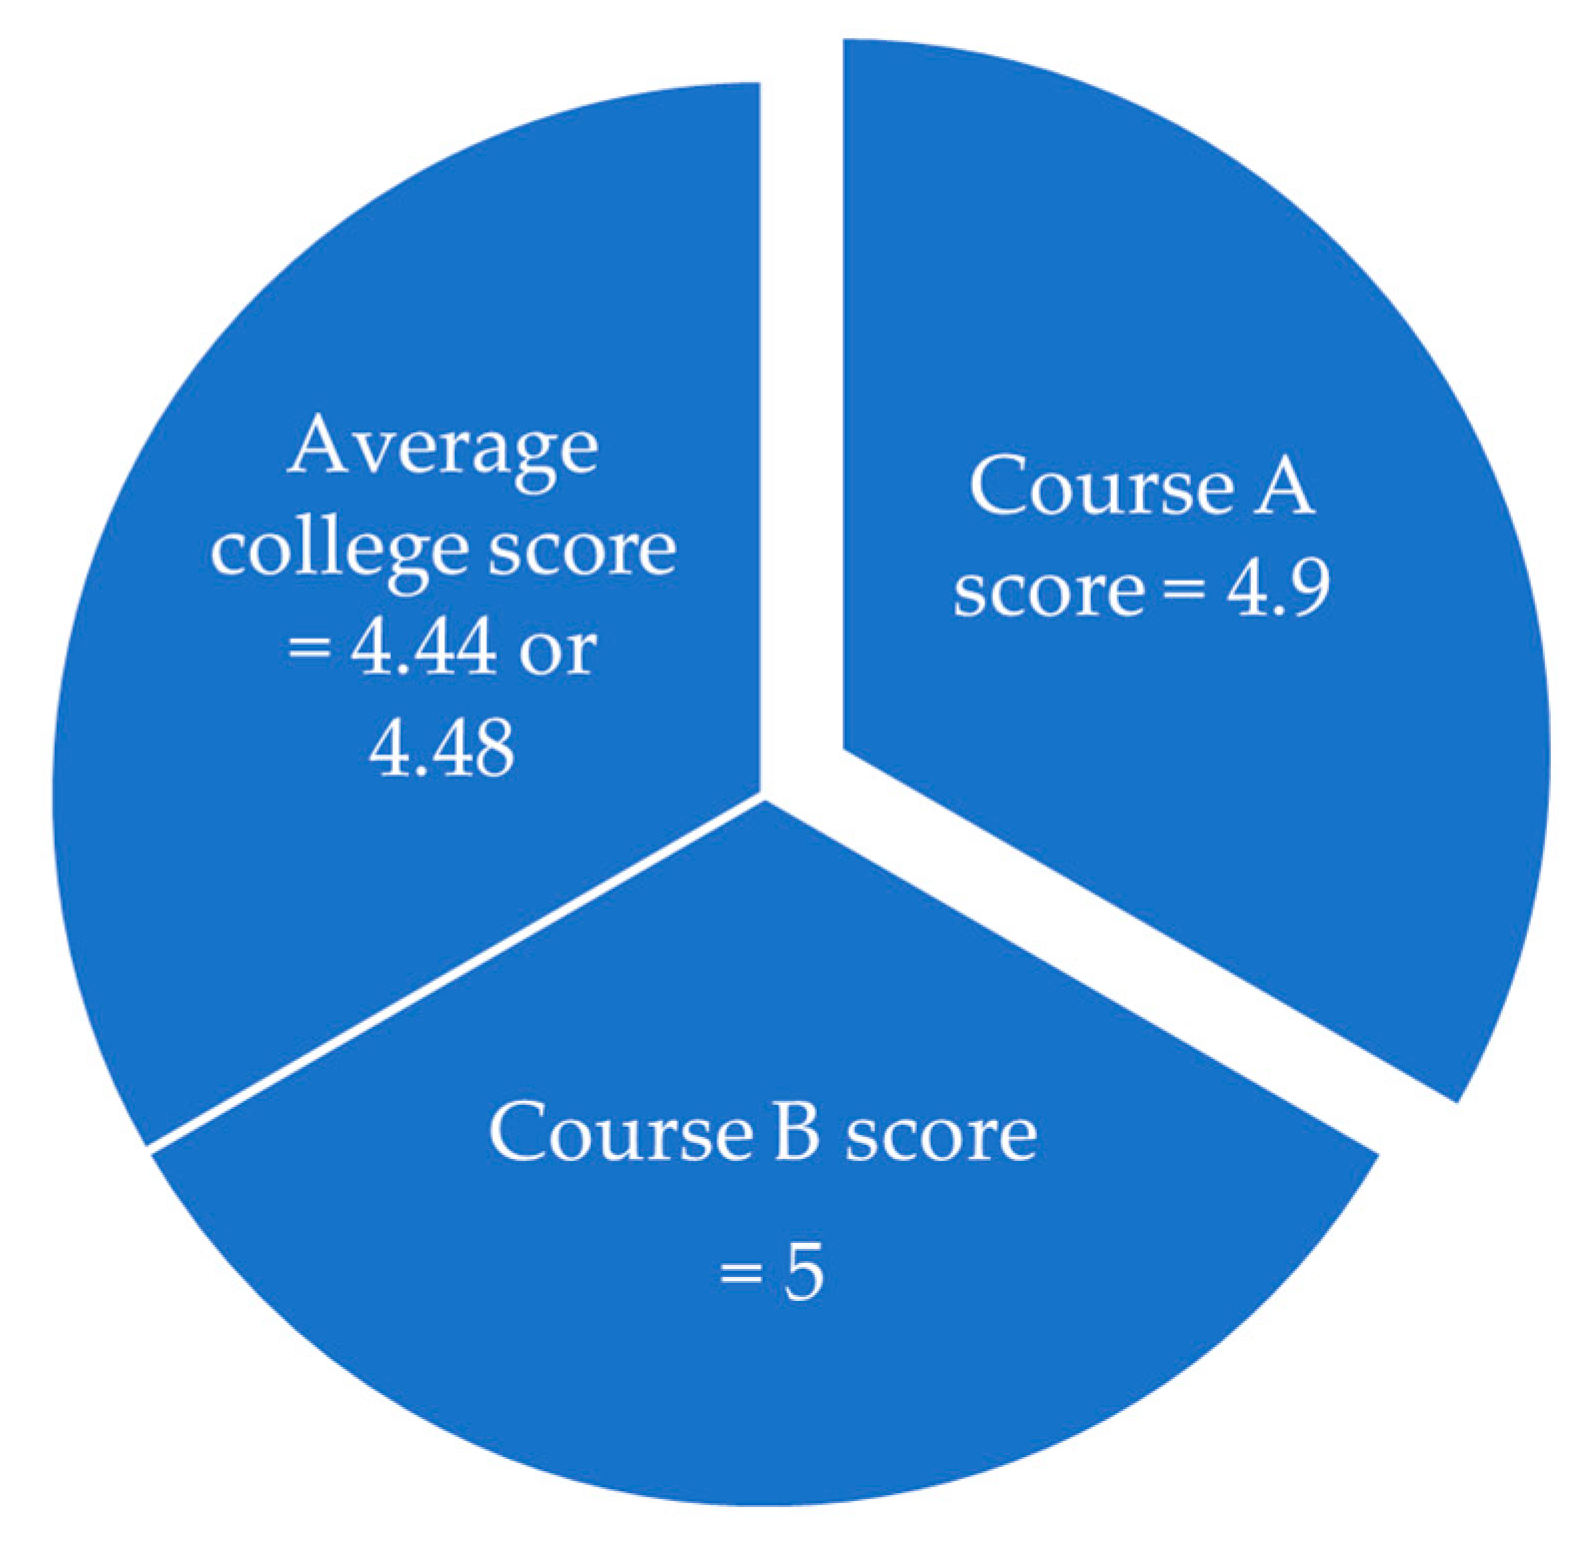
4.2. The Scores of Student’s Learning Satisfaction (Project-Based Learning vs. General Learning)

The satisfaction scores of students in researched courses are higher than the average college scores. For example, average college satisfaction scores are respectively 4.44 or 4.48 points; scores in course A and course B are respectively 4.9 and 5 points, as shown in Figure 5.
According to the satisfaction of questionnaires, the study finds the following key success factors:
  • The guided project-based learning approach has the strength to focus on the completion of OLAP and customer analysis projects.
  • The flexibility to choose the topic of a project for students is one of the key success factors for their learning performance.
  • During the procedure of learning, the group cooperation approach among students is helpful to improve the student’s performance.

4.3. The Comparison between the Two Learning Courses

In the research, we monitored the satisfaction results of students’ learning between course A and course B by t-test [16]. The research compares the satisfaction score between course A and course B, two independent samples. According to the satisfaction questionnaires of the two classes, the average and standard deviation of strongly-agree person shares in course A are respectively 89.4% and 0.0167. The average and standard deviation of a strongly-agree person shares in course B are respectively 100% and 0 [17].
After the t-test for the two classes, the p-value is 0.0000000609416 under a 95% confidence interval. The figures indicate a significant difference between the two courses. To sum up, those students in the two classes have higher satisfaction scores than the college average but still have differences between them, as shown in Table 6.

4.4. The Detailed Score Study for Every Item in Questionnaires

The research finds that accompanying a variety of methods to evaluate students’ scores is especially important. The score evaluation of the learning courses is based on the midterm test, final term test, the student’s class attendance, and the completion of the project. The researched courses established a 20% proportion of scores for project tasks and were announced to students at the beginning of classes. Those scores and evaluation standards are an important approach to let students focus on the completion of their project.
According to the study of learning satisfaction questionnaires, a teacher’s ability to guide students to collect information, think independently, and solve problems are all important items. Besides, guided project-based learning is one good approach to guide students step by step through student’s projects.

4.5. The Important Items Need to Be Concerned or Enhanced

On the contrary, the research finds some important items that need to be concerned or enhanced after reconsidering the learning process. Those concerned or enhanced items are prepared as follows, as detailed in Table 7.
  • While teachers are busier, the assistance and cooperation among team members and students is important. Teachers may assign some assistants to assist other students’ operations and learning.
  • The score evaluation of the pretest and posttest in the learning courses may be involved in comparing the learning performance of students.
  • The numerical score evaluation standard for the student’s project may also be involved in the courses to enhance student’s quality of project.
  • There is one student who fills in “Agree,” not “Strongly agree,” for the first item of the questionnaires in Table 7. The study suggests teachers may consider expressing their teaching contents through comprehensive methods to let all of the students know completely, such as integrating announcements by oral, blackboard, e-learning system, and line group.
  • The satisfaction of learning may be enhanced through increased interaction among students and teachers.

5. Conclusions and Recommendations

5.1. Conclusions

The researched courses tried to simulate the application of the online analytical processing (OLAP) platform based on guided project-based learning and pivot analysis charts. The OLAP system enables quick and straightforward querying from data warehouses. There are three types of OLAP: Multidimensional OLAP (MOLAP), Relational OLAP (ROLAP), and Hybrid OLAP systems (HOLAP).
The study finds there is less project-based learning literature for insurance information courses or OLAP courses. It is highly innovative for the research combined with OLAP, insurance, and project-based learning in real learning courses. Excel pivot analysis charts and tables have some similar functions to offline OLAP. The research finds the guided project-based learning approach has the strength to focus on the operation of simulating OLAP and customer analysis projects rather than the knowledge in a book.
Secondly, the research finds that the flexibility for students to choose the topic of the project is one of the key success factors. If students may choose their preferred topic and company, students’ learning satisfaction has enhanced. Thirdly, during the procedure of project-based learning, group cooperation and assistance are helpful for improving students’ learning performance.
Fourthly, those courses established a 20% proportion of evaluation scores on project tasks, which were announced to students at the beginning of the course. The score share of the evaluation standard is an important item to let students focus on the completion of the project.
Fifthly, the courses accompany satisfaction questionnaires to monitor the learning results and analyze the learning satisfaction for students among course A, course B, and the college average. The study finds students’ satisfaction scores in the two classes have higher satisfaction scores than the college average because of the general learning approach. Furthermore, the study compares the learning performance between course A and course B through a t-test. The p-value is 0.0000000609416 under a 95% confidence interval for the two classes. The figures indicate a significant difference between the two courses.
To sum up, those students in the two classes have higher satisfaction scores than the college average but still have differences between classes. After reviewing the reason for the difference, the main reason is that one student filled in “Agree,” not “Strongly agree” in the “Teacher will clearly express the teaching content” item. Furthermore, the questionnaires are included in the comparison of qualitative feedback between courses A and B. One of the courses has students’ positive wording feedback but another does not.
On the contrary, the research finds some shortcomings or insufficiencies during the learning process. Those items are listed below:
  • Teachers are still busier than ever to assist students’ operations and learning.
  • The numerical score evaluation for the student’s project, pretest, and post-test was not well designed in the course.
  • Subject to the limitation of the number of students, the study did not execute experimental group and control group analysis within the same school year.

5.2. Recommendations

The research finds some important items that need to be concerned or enhanced after reconsidering the learning process. Those items are listed below:
  • The study is mainly related to the educational or tutorial field. The study recommends that future studies should focus on the OLAP system directly.
  • Teachers may assign some assistants to assist other students’ operations and learning.
  • The score evaluation of the pretest and post-test in the learning course may be involved in comparing the learning performance of students.
  • The numerical score evaluation standard for the student’s project may also be announced in the course to enhance the students’ quality of their project.
  • The study suggests teachers may consider explaining their teaching contents through comprehensive methods to let all students know them completely.
  • If there are many courses in the same school year, it is interesting and meaningful to study the same and the differences among project-based learning and general learning approaches.

Author Contributions

Writing—original draft preparation: Y.-C.L.; writing—review and editing: M.-S.C. All authors have read and agreed to the published version of the manuscript.

Funding

This research received no external funding.

Institutional Review Board Statement

Not applicable.

Data Availability Statement

Not available.

Conflicts of Interest

The authors declare no conflict of interest.

References

  1. Dewey, J. Dewey on Education; Teachers College Press: New York, NY, USA, 1959. [Google Scholar]
  2. Bell, S. Project-Based Learning for the 21st Century: Skills for the Future; The Clearing House Published: New York, NY, USA, 2010; pp. 39–43. [Google Scholar]
  3. Hsu, L.I.; Hsu, Y.H. Integration Scaffolding Theory and Flipped Teaching Approaches into Project-Based Course. J. Teach. Pract. Pedagog. Innov. 2020, 3, 129–163. [Google Scholar]
  4. Solomon, G. Project-Based Learning: A Primer; Technology and Learning Magazine: Ambury, UK, 2003; pp. 1–3. [Google Scholar]
  5. Blumenfeld, P.C.; Soloway, E.; Marx, R.W.; Krajcik, J.S.; Guzdial, M.; Palincsar, A. Motivating Project-Based Learning: Sustaining the Doing, Supporting the learning. Educ. Psychol. J. 1991, 26, 369–398. [Google Scholar] [CrossRef]
  6. Kokotsaki, D.; Menzies, V.; Wiggins, A. Project-Based Learning: A Review of the Literature; Durham University: Durham, UK; SAGE Publications: Thousand Oaks, CA, USA, 2016; pp. 267–277. [Google Scholar]
  7. Krajcik, J.S.; Blumenfeld, P.C. Project-Based Learning; Cambridge University Press: Cambridge, UK, 2006; pp. 317–333. [Google Scholar]
  8. Gary, K. Project-Based Learning, Computer Magazine; IEEE Computer Society Published: Washington, DC, USA, 2015; pp. 98–100. [Google Scholar]
  9. Lehmann, M.; Christensen, P.; Du, X.; Thrane, M. Problem-oriented and project-based learning (POPBL) as an innovative learning strategy for sustainable development in engineering education. Eur. J. Eng. Educ. 2008, 33, 283–295. [Google Scholar] [CrossRef]
  10. Liao, Y.C. Research on Insurance Information Courses Using Pivot Analysis Charts to Simulate the Application of Online Analytical Processing Platform; IEEE: Taichung, Taiwan, 2022. [Google Scholar]
  11. Mirabedini, S.; Nourani, S.F. The Research on OLAP for Educational Data Analysts. Int. Res. J. Appl. Basic Sci. 2014, 8, 224–230. [Google Scholar]
  12. Elmasri, R.; Navathe, S.B. Fundamentals of Database Systems; Pearson Publish: London, UK, 2015; pp. 1101–1117. [Google Scholar]
  13. Chia, T.H.; Liao, Y.C. Life Insurance Marketing and Management; Xinfule Culture and Education Published: Taichung, Taiwan, 2021; pp. 263–265. [Google Scholar]
  14. Tardío, R.; Maté, A.; Trujillo, J. A New Big Data Benchmark for OLAP Cube Design, Using Data Pre-Aggregation Techniques. J. Appl. Sci. 2020, 10, 8674. [Google Scholar] [CrossRef]
  15. Kumar, N.; Verma, V.; Saxena, V. Data Cube Representation for Vehicle Insurance Policy System. Int. J. Comput. Appl. 2012, 58, 1–4. [Google Scholar] [CrossRef]
  16. Joseph, M.F. Statistical and Quantitative Approaches as Applied to Insurance; Author Self-Published: Taichung, Taiwan, 1997; pp. 223–229. [Google Scholar]
  17. Website Content of Microsoft Support. T.TEST Function. Available online: https://support.microsoft.com/zh-tw/office/t-test-%E5%87%BD%E6%95%B8-d4e08ec3-c545-485f-962e-276f7cbed055 (accessed on 23 January 2023).
Figure 1. The chart of researched structure.
Asi 06 00047 g001
Figure 2. The three learning steps of project-based learning course. Source: This research.
Asi 06 00047 g002
Figure 3. The procedures to simulate the OLAP through inserting pivot analysis tables and charts.
Asi 06 00047 g003
Figure 4. Example of pivot analysis charts for customers. Source: Micro-excel database built by the author to simulate the policyholder’s insurance database.
Asi 06 00047 g004
Figure 5. Learning satisfaction score among courses A, B, and college average. Source: Learning satisfaction questionnaires of the researched courses.
Asi 06 00047 g005
Table 1. Related literature of PBL.
Year/AuthorTopicKey Contents Related to the Research
  • Dewey (1959) [1]
Project-based Learning
  • Learning by doing is the important learning theory for project-based learning.
2.
Blumenfeld; Soloway; Marx, etc. (1991) [5]
Project-based Learning
  • Project-based learning is a comprehensive approach to classroom teaching and learning of authentic problems.
3.
Solomon (2003) [4]
Project-based Learning
  • The study stated project-based learning is students work in groups to solve challenging problems.
4.
Krajcik; Blumenfeld (2006) [7]
Project-based Learning
  • The study stated that project-based learning has the potential to help most of students learning science.
5.
Lehmann; Christensen; Du; Thrane (2008) [9]
Problem-oriented and Project-based learning
  • Engineer’s education of sustainable problems needs to allow for interplay, mix and diversity. Problem-oriented and project-based learning approach will be involved.
6.
Bell (2010) [2]
Project-based Learning
  • Learning by doing is an application in recent education.
7.
Gary (2015) [8]
Project-based Learning
  • The study stated project-based learning is an approach particularly well suited to achieve better learning results for computing students.
8.
Kokotsaki; Menzies; Wiggins (2016) [6]
Project-based Learning
  • The study summarized the related literature of Project-based learning.
  • Project-based learning is a student left form of instruction and learning within real world practices.
9.
Hsu; Hsu (2020) [3]
Project-based Learning
  • The study stated the purpose of their study is to investigate the student satisfaction and acceptance for the project-based learning course.
  • The results of their study showed that students’ satisfaction with the courses was significantly positively correlated.
Table 2. Related literature of OLAP.
Year/AuthorTopicKey Contents Related to the Research
1.
Kumar; Verma; Saxena (2012) [15]
OLAP
  • The study describes a methodology with OLAP data and pivot table as well as a correlation technique.
  • OLAP systems have a strong focus on the interactive analysis of data.
2.
Mirabedini; Nourani (2014) [11]
OLAP
  • The study stated business intelligence strategies and analysis of online tools can be used in order to overcome some educational problems.
  • The study introduced the different kinds of OLAP.
3.
Elmasri; Navathe (2015) [12]
OLAP
  • The study introduced the different kinds of OLAP and the application of Cube.
  • The literature contains lots of fundamentals among database, data warehouse, data cube, dimension table, and functionality.
4.
Tardo; Maté; Trujillo (2020) [14]
OLAP
  • Some OLAP allows data pre-aggregation because of their demonstrated performance in data querying.
  • The design of OLAP cube needs very advanced knowledge.
5.
Chia; Liao (2021) [13]
OLAP
  • The study stated OLAP platform can conduct relevant statistical analysis through online real-time reports and multi-dimensional customer analysis.
6.
Liao (2022) [10]
Project based learning and OLAP
  • The researched OLAP lessons try to simulate OLAP process through offline Excel pivot analysis charts.
  • It finds student’s satisfaction scores of project-based learning are higher than average.
Table 3. Common learning challenges for students.
Main Common Learning Challenges
1.
What kinds of company or industry may be chosen?
2.
What field name needs to be included?
3.
How many customer name lists need to be created?
4.
How to design selected fields by level of range?
5.
How to expand the value or text in excel software more quickly?
6.
How to insert a pivot analysis chart or table?
7.
How to choose, drag or filter fields?
8.
How to convert accumulated figure into the numbers of customer or policy?
9.
How to execute the range analysis?
10.
How to transfer the appropriate charts? Pie chart, bar chart or line chart.
11.
How many slides should we prepare?
12.
How many pivot charts or tables should be included in my project?
Source: This research.
Table 4. Individual learning challenges for students.
Main Individual Learning Challenges
1.
May you suggest topics of other kinds of companies?
2.
May I fill in an accumulative value in the column?
3.
Why specific fieldname cannot be showed in the pivot table?
4.
Why is the pivot analysis table disappeared?
5.
How to find meaningful findings or business opportunities?
6.
How to choose product type, channel type, aggregated premium amount or surrender value in pivot analysis table or chart?
7.
Are there any promotion campaign suggestions for my project?
8.
How to plan feasible marketing campaigns?
9.
How to revise the content of my pivot chart or table?
10.
How to conclude the key finding for the pivot chart or table?
11.
It is very difficult for a senior age to learn software. Please guide me again and again!
12.
How to revise the content for the charts or slides?
Source: This research.
Table 5. Numbers of effective questionnaires.
ItemsCourse ACourse BTotal Students
Numbers of student in course201434
Numbers of effective questionnaires20727
Effective ratio for questionnaires100%50%79%
Source: Learning satisfaction questionnaires of the researched courses.
Table 6. The comparison between the two learning courses by person shares of strongly agree.
CoursesAverageStandard
Deviation
Questionnaire:
Person Shares of
Strongly Agree
Questionnaire:
Person Shares
of Agree
Questionnaire:
Person Shares of
Moderate, Disagree, Strongly Disagree
Course A89.4%0.016785%~90%10%~15%0%
Course B100.0%0100.0%0%0%
Source: Learning satisfaction questionnaires of the researched courses.
Table 7. Student’s learning satisfaction scores from questionnaires.
Items of QuestionnairesCourse ACourse B
Strongly AgreeAgreeOthers: Moderate, Disagree, Strongly DisagreeStrongly
Agree
AgreeOthers: Moderate, Disagree, Strongly Disagree
1. The teacher will clearly express the teaching content85%15%0%100%0%0%
2. Teachers will use teaching materials (such as slides, multimedia, teaching aids, reference materials, etc.) to enhance learning interest90%10%0%100%0%0%
3. The teacher will guide students to collect information, think independently, solve problems and express opinions90%10%0%100%0%0%
4. The teacher’s teaching content is organized systematically and has learning value90%10%0%100%0%0%
5. The teacher’s teaching content is practical and unique, which meets the needs of students90%10%0%100%0%0%
6. The teacher will teach according to the course outline and complete the scheduled progress90%10%0%100%0%0%
7. The teacher carefully corrects and reviews the students’ homework and examination papers90%10%0%100%0%0%
8. The teacher adopts multiple assessment methods (such as: homework, examination, report, work display, learning attitude, etc.)90%10%0%100%0%0%
9. The teacher’s assessment method is fair and reasonable90%10%0%100%0%0%
Source: Learning satisfaction questionnaires of the researched courses.
Disclaimer/Publisher’s Note: The statements, opinions and data contained in all publications are solely those of the individual author(s) and contributor(s) and not of MDPI and/or the editor(s). MDPI and/or the editor(s) disclaim responsibility for any injury to people or property resulting from any ideas, methods, instructions or products referred to in the content.

