3.2. Analysis of CIM’s Potential for the Calculation of the Indicators
For this analysis, the indicators were evaluated considering the calculation methodology of SBToolPT Urban, as well as similar case studies, found in the literature review. Accordingly, indicators can be calculated through a verification checklist, where points are attributed for each criterion in the list, or by calculating the ratio between the criteria of the indicators. Each indicator has, at least, one parameter to be calculated.
3.2.1. The indicator to measure Passive Solar Planning
This indicator promotes maximization of exposure of the buildings to the sun, promoting shading in summer, and minimizing it in winter. It has been promoted by SBTool
PT Urban, BREEAM C, and LEED ND, while addressed in Levels, ISO 37120, and SDGs. Therefore, this indicator is recognized as a prioritized environmental concern. According to the SBTool
PT Urban Guide, this indicator is calculated through a verification checklist. The criteria of the list are related to the percentage of buildings’ exposure to the sun. As Autodesk Revit allows sun exposure evaluation, this indicator is adaptable in the CIM model. The calculation can be performed by applying a Dynamo routine. An example is developed by Tao and Qian [
26], who have presented a case study where a BIM model is used to evaluate solar exposure, ventilation, and energy consumption.
3.2.2. The Indicator to Measure Ventilation Potential
This indicator promotes the distribution of buildings to provide natural interior ventilation, by enhancing the use of prevailing winds. It has been promoted by SBTool
PT Urban and BREEAM C, while addressed in Levels, ISO 37120, and SDGs. Therefore, this indicator is recognized as a prioritized environmental concern. The calculation method indicated in SBTool
PT Urban Guide is through the verification checklist. The criteria of the list are related to the distribution, location, and orientation of the buildings, and their relationship with the prevailing winds. Luo, He, and Ni [
27], and Sabri et al. [
28] studies have demonstrated the viability of calculating similar criteria using urban digital models. Thus, this indicator is adaptable in CIM, and the calculation can be performed by applying a Dynamo routine.
3.2.3. The Indicator to Measure Urban Network
This indicator promotes connectivity between roads of different hierarchies on a more human scale, reducing distances, and facilitating circulation for pedestrians and cycling in daily travel. It has been promoted by SBToolPT Urban, BREEAM C, and LEED ND, and addressed in SDGs. Therefore, the study has recognized this indicator as a prioritized environmental concern. To calculate this indicator, the SBToolPT Urban Guide indicates two calculation parameters: the Real Intersections Index and the Connectivity Promotion Index, the result is the Urban Network Index obtained by the weighting of the two parameters. The first parameter is obtained by the ratio between the number of intersections and the urban area studied. This calculation can be done through the BIM model and the use of Dynamo’s routine. The second parameter is calculated through the verification checklist. The criteria established by the list are measurable and can be obtained through the information model. In this case, the Dynamo routine can attribute the points for each criterion. Thus, this indicator is adaptable in CIM.
3.2.4. The Indicator to Measure the Used Natural Potential of Land
This indicator encourages the appropriate use of the land according to its natural potential. It has been promoted by SBTool
PT Urban, BREEAM C, and LEED ND, and addressed by SDGs. Therefore, this indicator is recognized as a prioritized environmental concern. According to the SBTool
PT Urban Guide, to calculate this indicator is necessary to sum the areas appropriately used according to their natural potential and make the ratio with the studied area. The requirements for land use and the properties of each area can be added to the digital model using Dynamo [
29]. When the areas are defined in the model, a Dynamo routine can be performed for calculation [
30]. This indicator is identified as adaptable in CIM, as well.
3.2.5. The Indicator to Measure the Used Density and Flexibility
This indicator encourages land-use efficiency, diversity of uses, and increase density through the building height. It has been promoted by SBToolPT Urban, SNTool, and LEED ND, while addressed by ISO 37120, and SDGs. Therefore, this indicator is recognized as a prioritized environmental concern. The SBToolPT Urban Guide indicates two calculation parameters for this indicator: the Percentage of Land Use Efficiency and the Percentage of Areas with Flexibility of Use. The first one is calculated by the ratio of the number of inhabitants and the building footprint area. The second is calculated by the ratio of the areas with flexibility of use and the project area. The study found out both parameters can be calculated using the digital model, once the criteria can be assessed by the model, and applying a Dynamo routine to perform the calculations.
3.2.6. The Indicator to Measure the Reused Urban Land
This indicator promotes the reuse of previously built land areas and land recycling. It has been promoted by SBToolPT Urban, SNTool, and BREEAM C, and addressed by SDGs, which made it to be recognized as a prioritized environmental concern. In order to calculate this indicator, based on the SBToolPT Urban Guide, it is necessary to identify the ratio between the contaminated lands which is rehabilitated and reused, and the total area of contaminated lands. The study found the possibility of calculating this ratio by applying a Dynamo routine since the areas (e.g., contaminated areas to be rehabilitated and reused) are characterized in the model.
3.2.7. The Indicator to Measure the Building Reuse
This indicator promotes the reuse of buildings. This indicator is promoted only by SBToolPT Urban, while addressed in SDGs, which made it to be recognized as a prioritized environmental concern. According to the SBToolPT Urban Guide, this indicator is calculated through the ratio between the built area to be reused or rehabilitate and the total built area. The calculation method using the CIM model is performed in two phases, at first, all the buildings must be characterized in the model, and then the rehabilitated buildings must be identified. The results can be provided by the Dynamo routine.
3.2.8. The Indicator to Measure the Technical Infrastructure Network
This indicator promotes the optimization of technical infrastructures. This indicator is promoted only by SBToolPT Urban, while addressed in SDGs, which made it to be recognized as a prioritized environmental concern. The calculation is made by the ratio of the length of technical infrastructure to be reused and the total length of the technical infrastructure network. This calculation can be performed by using the CIM model, identifying the infrastructure network, and then applying it to a Dynamo routine.
3.2.9. The Indicator to Measure the Conservation of Lands
This indicator encourages the conservation of the proportion of lands, considered to be of value for ecological or agricultural purposes, to remain undeveloped. This indicator is promoted only by SNTool, and LEED ND, and addressed in ISO 37120, and SDGs. Therefore, this indicator is recognized as a prioritized environmental concern. However, as this indicator is not promoted by SBToolPT Urban, analyzing its applicability for the CIM calculation is out of the scope of this study. Even though, a further study could be made when the benchmarks and calculation methods have been defined.
3.2.10. The Indicator to Measure the Distribution of Green Spaces
This indicator promotes the distribution of green space in the sites. This indicator is promoted only by SBTool
PT_U, and addressed in ISO 37120, and SDGs, making it recognized as a prioritized environmental concern. This indicator can be calculated through the CIM. The calculation methodology is described in
Section 3.3 of this study.
3.2.11. The Indicator to Measure Connectivity of the Green Spaces
This indicator promotes the connectivity of green spaces on the site and is promoted only by SBToolPT Urban, but addressed in SDGs. Therefore, this indicator is recognized as a prioritized environmental concern. According to the SBToolPT Urban Guide, this indicator is calculated by the ratio of the area of green spaces connected and the total green area of the site. This calculation can be performed by using the model and applying a Dynamo routine.
3.2.12. The Indicator to Measure Native Vegetation
This indicator promotes the conservation or cultivation of native vegetation on the site. It has been promoted by SBToolPT Urban, BREEAM C, and LEED ND, and addressed by ISO 37120, and SDGs. Therefore, this indicator is recognized as a prioritized environmental concern. Similar to the previous two indicators, this indicator is calculated by the ratio of the green area with native vegetation and the total green area. For this purpose, the green areas of the site must be defined in the CIM model, and then a Revit family of “native plants” must be created and attributed to the specific areas. This calculation can be performed by the Dynamo routine.
3.2.13. The Indicator for Environmental Monitoring
This indicator promotes land-use efficiency, diversity of uses, and increase density through the building height. It has been promoted by SBToolPT Urban, BREEAM C, and LEED ND, while addressed by ISO 37120, and SDGs. Therefore, this indicator is recognized as a prioritized environmental concern. The calculation methodology provided by the SBToolPT Urban Guide is through a verification checklist. To comply with the list, an Environmental Monitoring Plan must be developed. In this case, based on the findings of the study, this indicator is not possible to be calculated though using the CIM model, as the criteria cannot be added and assessed by the model.
3.2.14. The Indicator to Measure Construction Activity Pollution Prevention
The purpose of this indicator is to reduce pollution related to construction activities. This indicator is promoted only by LEED ND but addressed in SDGs. Therefore, this indicator is recognized as a prioritized environmental concern. This indicator is not promoted by SBToolPT Urban, so it is considered not applicable for the CIM calculation analysis. However, a further study can be made when the benchmarks and calculation methods have been defined.
3.2.15. The Indicator to Measure Energy Efficiency (of the Public Facilities)
This indicator encourages energy efficiency in public spaces, by reducing energy consumption and energy-consuming systems (i.e., public lighting and dynamic control systems). It has been promoted by SBToolPT Urban, SNTool, BREEAM C, and LEED ND, while addressed by ISO 37120, and SDGs. Therefore, it is recognized as a prioritized environmental concern. In the case of this indicator, the SBToolPT Urban Guide indicates a verification checklist to calculate it. The list’s criteria could be “PARTIALLY” calculated through the CIM. The first criterion is a Monitoring and Maintenance Plan, and similar to the Environmental Monitoring indicator, this criterion cannot be assessed through the CIM model. However, the other criteria can be calculated using the model and the Dynamo routine.
3.2.16. The Indicator to Measure Renewable Energies
This indicator promotes local renewable energy production or the availability of renewable energy sources in the region. It has been promoted by SBTool
PT Urban, SNTool, BREEAM C, and LEED ND, while addressed by Levels, ISO 37120, and SDGs. Therefore, this indicator is recognized as a prioritized environmental concern. According to SBTool
PT Urban Guide, this indicator can be assessed by calculating the ratio of the renewable energy produced locally per the total estimated energy consumption for the project. To calculate this indicator through the CIM model, the energy data and the estimated energy consumption must be added to the model, and then the calculation can be performed by Dynamo routine. In their study, Padsala and Coors [
31] analyzed similar parameters, proposing a CIM platform to evaluate renewable energy production and building energy consumption in an urban area in Aldingen, Germany.
3.2.17. The Indicator to Measure District Heating and Cooling
This indicator promotes energy management systems in the systems that use energy in public spaces. It has been promoted by SBToolPT Urban, and BREEAM C, and addressed by SDGs. Therefore, this indicator is recognized as a prioritized environmental concern. SBToolPT Urban Guide indicates a verification checklist for the calculation of this indicator. The study found out that not all the criteria of this indicator can be calculated through the CIM model (e.g., Energy Management Goals), but some criteria, such as the electrical energy network measurement, could be assessed and calculated. Therefore, this indicator is considered “PARTIALLY” applicable in CIM.
3.2.18. The Indicator to Measure the Centralized Energy Management
This indicator promotes using district heating and cooling strategies that reduce energy use and energy-related environmental harms. This indicator is promoted only by LEED ND but addressed in SDGs, making it recognized as a prioritized environmental concern. However, as this indicator is not promoted by SBToolPT Urban, analyzing its applicability in CIM is out of the scope of this study. A further study can be made when the benchmarks and calculation methods are defined.
3.2.19. The Indicator to Measure the Efficiency of Water Consumption
This indicator promotes using water conservation practices and reduces water consumption in public spaces, by simultaneously reducing the production of effluents and pressure in the drainage systems. This indicator is promoted by SNTool, BREEAM C, and LEED ND, and addressed by Levels, ISO 37120, and SDGs. Therefore, this indicator is recognized as a prioritized environmental concern. In the SBToolPT Urban Guide, the calculation of this indicator is made by using a verification checklist. Most of the list’s criteria have the possibility of being calculated using a CIM model. However, the criterion for establishing an education program cannot be calculated through the CIM. Thus, the indicator is considered “PARTIALLY” applicable in the CIM model.
3.2.20. The Indicator for Effluent Management
This indicator promotes the recharge of underground reserves, reducing the risk of flooding and the load on public drainage and effluent treatment systems. It also promotes the adequate dimensioning of domestic wastewater treatment systems, responding to the demands generated by the project. This is addressed by SBToolPT Urban, SNTool, BREEAM C, and LEED ND, and addressed by Levels, ISO 37120, and SDGs, making it a prioritized environmental concern. According to the SBToolPT Urban Guide, there are two parameters to calculate this indicator: the Percentage of Infiltration Areas and the Effluent and Soil Permeability Index. The first parameter is obtained from the ratio of Permeable Areas and the Total Intervention Area. It can be calculated through the CIM model, by determining the permeable areas, and then applying it in a Dynamo routine. The second parameter is determined by a verification checklist. For this stage, although the criteria can be added to the CIM model, the list is based on two plans, including Effluent Management Plan, and Water Management Plan, which cannot be assessed through the model. Thus, this parameter is considered “NO” regarding its applicability to CIM modeling.
3.2.21. The Indicator for Centralized Water Management
This indicator encourages the control of water consumption and centralized water systems. This is promoted only by SBToolPT Urban, but ISO 37120 and SDGs address it, which has led to it being recognized as a priority environmental concern. The SBToolPT Urban Guide provides a verification checklist to calculate this indicator. In this checklist, most of the criteria can be calculated using the CIM model, and the points can be determined by applying a Dynamo routine. Despite this, the CIM model cannot assess the criteria associated with energy goals and results dissemination. A CIM assessment is considered to be “PARTIALLY” appropriate for this indicator.
3.2.22. The Indicator to Measure Using Low-Impact Materials
This indicator promotes the use of sustainable materials in public spaces. SBToolPT Urban, SNTool, and BREEAM C encourage these practices, while Levels and SDGs address them. Therefore, this indicator is recognized as a high-level environmental concern. In the SBToolPT Urban Guide, the calculation of this indicator is made by the ratio between the total areas using low-impact materials and the total floor area. This calculation can be made in the CIM model, by applying a Dynamo routine. The model can be used to identify materials and quantities, albeit a materials database should be created in order to assess the information contained therein.
3.2.23. The Indicator to Measure Using Construction and Demolition Waste (CDW)
The indicator recommends reusing construction and demolition waste on the site. This is developed by SBToolPT Urban, SNTool, BREEAM C, and LEED ND, and addressed by Levels, ISO 37120, and SDGs. Therefore, this indicator is recognized as a critical environmental concern. For this indicator, the SBToolPT Urban Guide establishes two calculation parameters: the Percentage of Recycled CDW Incorporated, and the CDW Valorization Index. The first parameter, the ratio between the weight of CDW incorporated into materials and the total CDW weight is calculated. For this, it is necessary to create a materials database, and then it is necessary to characterize the CDW incorporated into the materials. This stage is applicable to CIM, and the ratio is obtained using Dynamo. The second parameter is calculated using a verification checklist, but most of the criteria on the list cannot be assessed using the CIM model. As a result, the parameter is considered to be “NO” in terms of its applicability to CIM.
3.2.24. The Indicator for Urban Solid Waste Management
This indicator promotes the selective separation of waste and the implementation of recovery systems. This is encouraged by SBToolPT Urban, and LEED ND, and addressed by Levels, ISO 37120, and SDGs, making it a prioritized environmental concern. According to the SBToolPT Urban Guide, this indicator is calculated through a verification checklist. Nevertheless, the study found that the criteria on the list cannot be assessed through CIM, and therefore the indicator is classified as “NO”.
3.2.25. The Indicator to Measure GHG Emissions from Energy Embodied in Construction Materials
This indicator promotes measuring the embodied non-renewable primary energy of materials used for building construction. This is only encouraged by SNTool but also addressed by Levels, ISO 37120, and SDGs, which made it to be recognized as a prioritized environmental concern. This indicator is not promoted by SBToolPT Urban, so it is considered not applicable for the CIM calculation analysis in this study. In spite of this, further research can be conducted once benchmarks and calculation methods are defined.
3.2.26. The Indicator to Measure Air Quality
In accordance with this indicator, outdoor air quality can be assessed in order to reduce pollutants in outdoor spaces. This is developed by SBToolPT Urban, SNTool, and BREEAM C, and addressed by Levels, ISO 37120, and SDGs. Therefore, this indicator is recognized as a critical environmental concern. The SBToolPT Urban Guide establishes a verification checklist to calculate this indicator. The CIM model cannot evaluate all of the criteria on the list, and the indicator is classified as “NO” based on the findings of the study.
3.2.27. The Indicator to Measure Outdoor Thermal Comfort
This indicator promotes improving the comfort of inhabitants in outdoor spaces of the site and assessing the percentage of spaces that provide thermal comfort. This is encouraged by SBToolPT Urban, SNTool, BREEAM C, and LEED ND, and also addressed by Levels. Therefore, this indicator is recognized as a high-level environmental concern. According to the SBToolPT Urban Guide, there are two calculation parameters to determine this indicator. The first is the Percentage of Spaces with Thermal Comfort, which is determined by the ratio between the sum of the areas that promote thermal comfort and the total intervened area. This parameter can be calculated using the CIM model, while it is necessary to characterize all the areas and then apply a Dynamo routine to calculate it. Additionally, the second parameter is calculated through the verification checklist, in which the criteria can be assessed using the CIM model, and the points can be attributed using Dynamo.
3.2.28. The Indicator to Measure Acoustic Pollution
This indicator encourages the reduction of outside noise to enhance the acoustic comfort of the site’s residents. This indicator is only available in SBToolPT Urban, SNTool, and BREEAM C, and is addressed by Levels and ISO 37120, which makes it a priority environmental concern. In the SBToolPT Urban Guide, this indicator is determined through a verification checklist. However, as the criteria on the list cannot be assessed through the CIM model, the indicator is classified as “NO”.
3.2.29. The Indicator to Measure Light Pollution
A key objective of the indicator is to reduce light pollution by optimizing the design of public lighting and reducing glare and intrusive light (inside homes). It is promoted by SBToolPT Urban, BREEAM C, and LEED ND, and addressed by Levels. Therefore, this indicator is recognized as a high-level environmental concern. The SBToolPT Urban Guide establishes a verification checklist to calculate this indicator. Based on the findings of the study, although some of the criteria can be calculated using a CIM model, the majority of the criteria cannot be assessed. Thus, this indicator is classified as “NO”, regarding its applicability to CIM.
3.2.30. The Indicator to Measure Street Safety
This indicator promotes recommendations for crime prevention measures. This is encouraged by SBToolPT_Urban, and BREEAM C, and addressed by the SDGs, making it a prioritized social dimension of sustainability concern. The calculation methodology for this indicator in the SBToolPT Urban Guide is a verification checklist. As with the previous indicator, the criteria of the list cannot be assessed by the CIM model based on the findings of the study. In view of its applicability to CIM, this indicator is classified as “NO”.
3.2.31. The Indicator to Measure Natural and Technological Risks
This indicator promotes recommendations for the safety of the population and access to procedural information in the event of natural and technological disasters. This is developed by SBToolPT Urban, SNTool, BREEAM C, and LEED ND, and addressed by Levels, ISO 37120, and the SDGs. Therefore, this indicator is recognized as a crucial social dimension of sustainability concern. Similar to the previous two indicators, the SBToolPT Urban Guide establishes a verification checklist to calculate this indicator. Based on the findings of the study, the criteria cannot be assessed through the CIM model. Accordingly, this indicator is classified as “NO” with regard to its applicability to CIM.
3.2.32. The Indicator to Measure Adaptability to Climate Change
The purpose of this indicator is to determine whether the development is resilient to climate change impacts known and predicted. This is developed by SNTool, and BREEAM C, and addressed by Levels, and SDGs. Therefore, this indicator is recognized as a key social dimension of sustainability concern. This indicator is not promoted by SBToolPT Urban, so it is considered not applicable to the CIM calculation analysis in this study. Nevertheless, further research can be conducted once the benchmarks and calculation methods are established.
3.2.33. The Indicator to Measure Proximity to Services
This indicator promotes recommendations to ensure residents have access to a range of services close to their homes. This is developed by SBToolPT Urban, SNTool, BREEAM C, and LEED ND, and addressed by ISO 37120, and the SDGs. Therefore, this indicator is recognized as critical social dimension of sustainability concern. In the SBToolPT Urban Guide, this indicator is calculated according to the number of available services and their respective distances to the residential zone. The results of the study indicate that this criterion can be calculated using the CIM model. Firstly, the type of services must be identified, and then the distances can be calculated using Dynamo.
3.2.34. The Indicator to Measure Recreational Facilities
This indicator promotes recommendations to ensure residents have access to a set of quality leisure amenities within walking distance of their homes. This is developed by SBToolPT Urban, and LEED ND, and addressed by ISO 37120, and SDGs making it a prioritized social dimension of sustainability concern. The calculation methodology stated in the SBToolPT Urban Guide is similar to the previous ones, while the use of the CIM model is applicable to calculate the indicator. The process of determining the recreational facilities begins with the identification of the facilities, and the remainder of the calculation follows the same procedure as the indicator for the Proximity of Services.
3.2.35. The Indicator to Measure Local Food Production
This indicator encourages recommendations to ensure city dwellers have access to fresh products, promote community food production and improve residents’ nutrition, and support the economic development of the city/urban area. This is developed by SBToolPT Urban, and LEED ND, and addressed by ISO 37120, and SDGs making it a prioritized social dimension of sustainability concern. According to the SBToolPT Urban Guide, to calculate this indicator there are two parameters: Local Food Production Index and Community Garden Promotion Index. The first one is determined by the ratio of the total area destined for food production and the total number of inhabitants. To calculate this ratio using the CIM model, at first, the areas destined for food production must be identified, and then a Dynamo routine must be applied. The second parameter is evaluated through a verification checklist, but only two of the eight criteria can be assessed by the model. Thus, this indicator is classified as “NO”, in terms of its applicability in CIM modeling.
3.2.36. The Indicator for Public Transport
In this indicator, recommendations are made to assess the public transport road network in terms of accessibility and quality, and to encourage the use of clean renewable energy resources for public transportation. This is developed by SBToolPT Urban, SNTool, BREEAM C, and LEED ND, and addressed by ISO 37120, and the SDGs. Therefore, this indicator is recognized as a key social dimension of sustainability concern. Like the previous one, the SBToolPT Urban Guide indicates two calculation parameters for this indicator: Public Transport Index and the Accessibility to Public Transport Index. Both are calculated through a verification list. To calculate the Public Transport Index using the model, it must be considered integration with another platform, like Google Maps. As one of the criteria in the Accessibility to Public Transport Index cannot be determined using the model, it is considered “PARTIALLY”.
3.2.37. The Indicator to Measure Pedestrian Path Accessibility
This indicator promotes recommendations for mobility and pedestrian safety, the accessibility of people with reduced mobility, supports public health by encouraging utilitarian and recreational physical activity, and also encouraging the use of non-polluting means of transport. This indicator is developed by SBToolPT Urban, SNTool, BREEAM C, and LEED ND, and addressed by ISO 37120, and the SDGs. Therefore, this indicator is recognized as a critical social dimension of sustainability concern. The SBToolPT Urban Guide provides a verification list to calculate this indicator, but in general, the criteria cannot be calculated using the model, so the indicator is classified as “NO”.
3.2.38. The Indicator to Measure Cycle Path Network
This indicator promotes recommendations for the quality cycle path network. This is developed by SBToolPT Urban, SNTool, BREEAM C, and LEED ND, and addressed by ISO 37120. Therefore, this indicator is recognized as a crucial social dimension of sustainability concern. The SBToolPT Urban Guide provides a verification list to calculate this indicator. Most of the criteria of the list can be calculated using the model, by characterizing and identifying the criteria and then applying a Dynamo routine. One of the criteria that cannot be assessed through the model is the Education and Awareness Program criterion. In this regard, the indicator is considered “PARTIALLY”.
3.2.39. The Indicator to Measure the Usability of Public Transport for Physically Disabled Persons
This indicator promotes recommendations to provide an autonomous life and ensure equal mobility with others, for people with disabilities. This indicator is developed by SNTool, and addressed the SDGs, making it a priority concern for the social dimension of sustainability. This indicator is not promoted by SBToolPT Urban, so it is considered not applicable to the CIM calculation analysis. In spite of this, a further study could be conducted once benchmarks and calculation methods have been determined.
3.2.40. The Indicator for On-Street and Indoor Car Parking Spaces
This indicator promotes recommendations for parking designs that adopt sustainable principles. It is developed by SNTool, and BREEAM C, making it a priority concern of the social dimension of sustainability. This indicator is not promoted by SBToolPT Urban, so it is considered not applicable to CIM calculation analysis. However, when the benchmarks and calculation method are defined, a further study may be conducted.
3.2.41. The Indicator to Measure Access to Public Spaces
This indicator promotes recommendations for assessing the availability and quality of existing or planned public spaces. This is developed by SBToolPT Urban, BREEAM C, and LEED ND, and addressed by ISO 37120, and the SDGs. Therefore, this indicator is recognized as a key social dimension of sustainability concern. The SBToolPT Urban Guide establishes three calculation parameters for this indicator. The first one is the Percentage of Open Public Spaces, which is determined by the ratio of the Area of Open Public Spaces and the Total Intervention Area. To be calculated using the model, the open areas must be identified and characterized, then a Dynamo routine is applied. The second parameter is the Availability of Public Spaces per Habitant Index, which is calculated by the ratio of the Area of Open Public Spaces and the Total number of inhabitants. Like the previous parameter, the model can calculate this one. It is necessary to add information regarding the total number of inhabitants to the Dynamo routine. The last parameter, the Quality of Public Spaces Index, is determined from a verification list. By using the model, the criteria from the list could be added and assessed.
3.2.42. The Indicator for Valuing Heritage
This indicator promotes recommendations for the valorization of the heritage, which would promote the maintenance of the built and natural historical heritage of the place and encourage public use of it to ensure the heritage is preserved and strengthened for the future. This is developed by SBToolPT Urban, BREEAM C, and LEED ND, and addressed by ISO 37120, and SDGs. Therefore, this indicator is recognized as a key social dimension of sustainability concern. This indicator is calculated in the SBToolPT Urban Guide based on a verification list, however, it is not possible to use the model to assess the criteria listed in the checklist. Accordingly, the indicator is classified as “NO”.
3.2.43. The Indicator to Measure Social Inclusion and Integration
This indicator encourages recommendations for social integration and inclusion, which aims to promote affordable housing for all people and promote local identity and a sense of community. This is developed by SBToolPT Urban, SNTool, BREEAM C, and LEED ND, and addressed by ISO 37120, and SDGs. Therefore, this indicator is recognized as a key societal dimension of sustainability concern. According to the SBToolPT Urban Guide, there are two parameters to determine this indicator. The first parameter is the Percentage of Houses for Integration and Social Inclusion, calculated based on the number of houses for social purposes, the number of houses for youth, and the number of total houses. It is possible to calculate this parameter using the model since the types of houses are identified, then a Dynamo routine is applied to calculate the parameter. The second parameter is the Community Participation Index, which is derived from a verification list. Accordingly, the model cannot be used to assess the criteria on the list; thus, the parameter is classified as “NO”.
3.2.44. The Indicator to Measure Economic Viability
This indicator encourages recommendations to optimize the initial costs of an urban area based on the evaluation of operating and maintenance costs, during the operation phase (cost-effectiveness, economic feasibility). This is developed by SBToolPT Urban, and LEED ND, and addressed by levels, and SDGs. Therefore, this indicator is recognized as a crucial concern of the social dimension of sustainability. This indicator is calculated in the SBToolPT Urban Guide based on a verification checklist, which includes a Viability and Economic Plan. The plan cannot be assessed by the model, and the indicator is classified as “NO”.
3.2.45. The Indicator to Measure Local Economy
This indicator encourages recommendations for supporting the local economy through the diversification of goods and services and enhancing internal circulation. This is developed by SBToolPT Urban, BREEAM C, and LEED ND, and addressed by Levels, ISO 37120, and the SDGs. Therefore, this indicator is recognized as a key social dimension of sustainability concern. The SBToolPT Urban Guide establishes two parameters to calculate it, the Diversity of Uses Index and the Local Economy Promotion Index. Both are calculated from a verification list. By identifying areas, analyzing them, and applying a Dynamo routine, the criteria for the Diversity of Uses Index can be determined. However, the second parameter, the Local Economy Promotion Index, is classified as “NO”. This parameter is calculated based on an Economic Study, and like the previous indicator, cannot be derived from the model.
3.2.46. The Indicator to Measure Employability
This indicator promotes local employment, through the creation of jobs. This is developed only by SBToolPT Urban, but addressed by ISO 37120, and the SDGs. Thus, this indicator is recognized as a critical concern in the context of sustainability. According to the SBToolPT Urban Guide, this indicator is obtained from the ratio of the number of predicted jobs and the predicted population. Those criteria cannot be added and assessed by the model, so the indicator is classified as “NO”.
3.2.47. The Indicator for Sustainable Buildings
The objective of this indicator is to promote sustainability at the building level by encouraging recommendations to reward sustainable building construction. SBToolPT Urban, BREEAM C, and LEED ND have developed this indicator, and it is addressed by Levels and the SDGs. Hence, this indicator can be considered a priority concern of sustainability concern. A verification list is provided in the SBToolPT Urban Guide for calculating this indicator. The model cannot be used to add or assess the criteria of the list.
3.2.48. The Indicator to Measure Environmental Management
This indicator promotes integrated environmental management from a Smart City perspective. It is developed by SBToolPT Urban, SNTool, and BREEAM C, and addressed by ISO 37120 and the SDGs, making it a key concern of sustainability. As with the previous indicator, this one is calculated using a verification list in the SBToolPT Urban Guide. The model cannot be used to add and assess the criteria of the list.
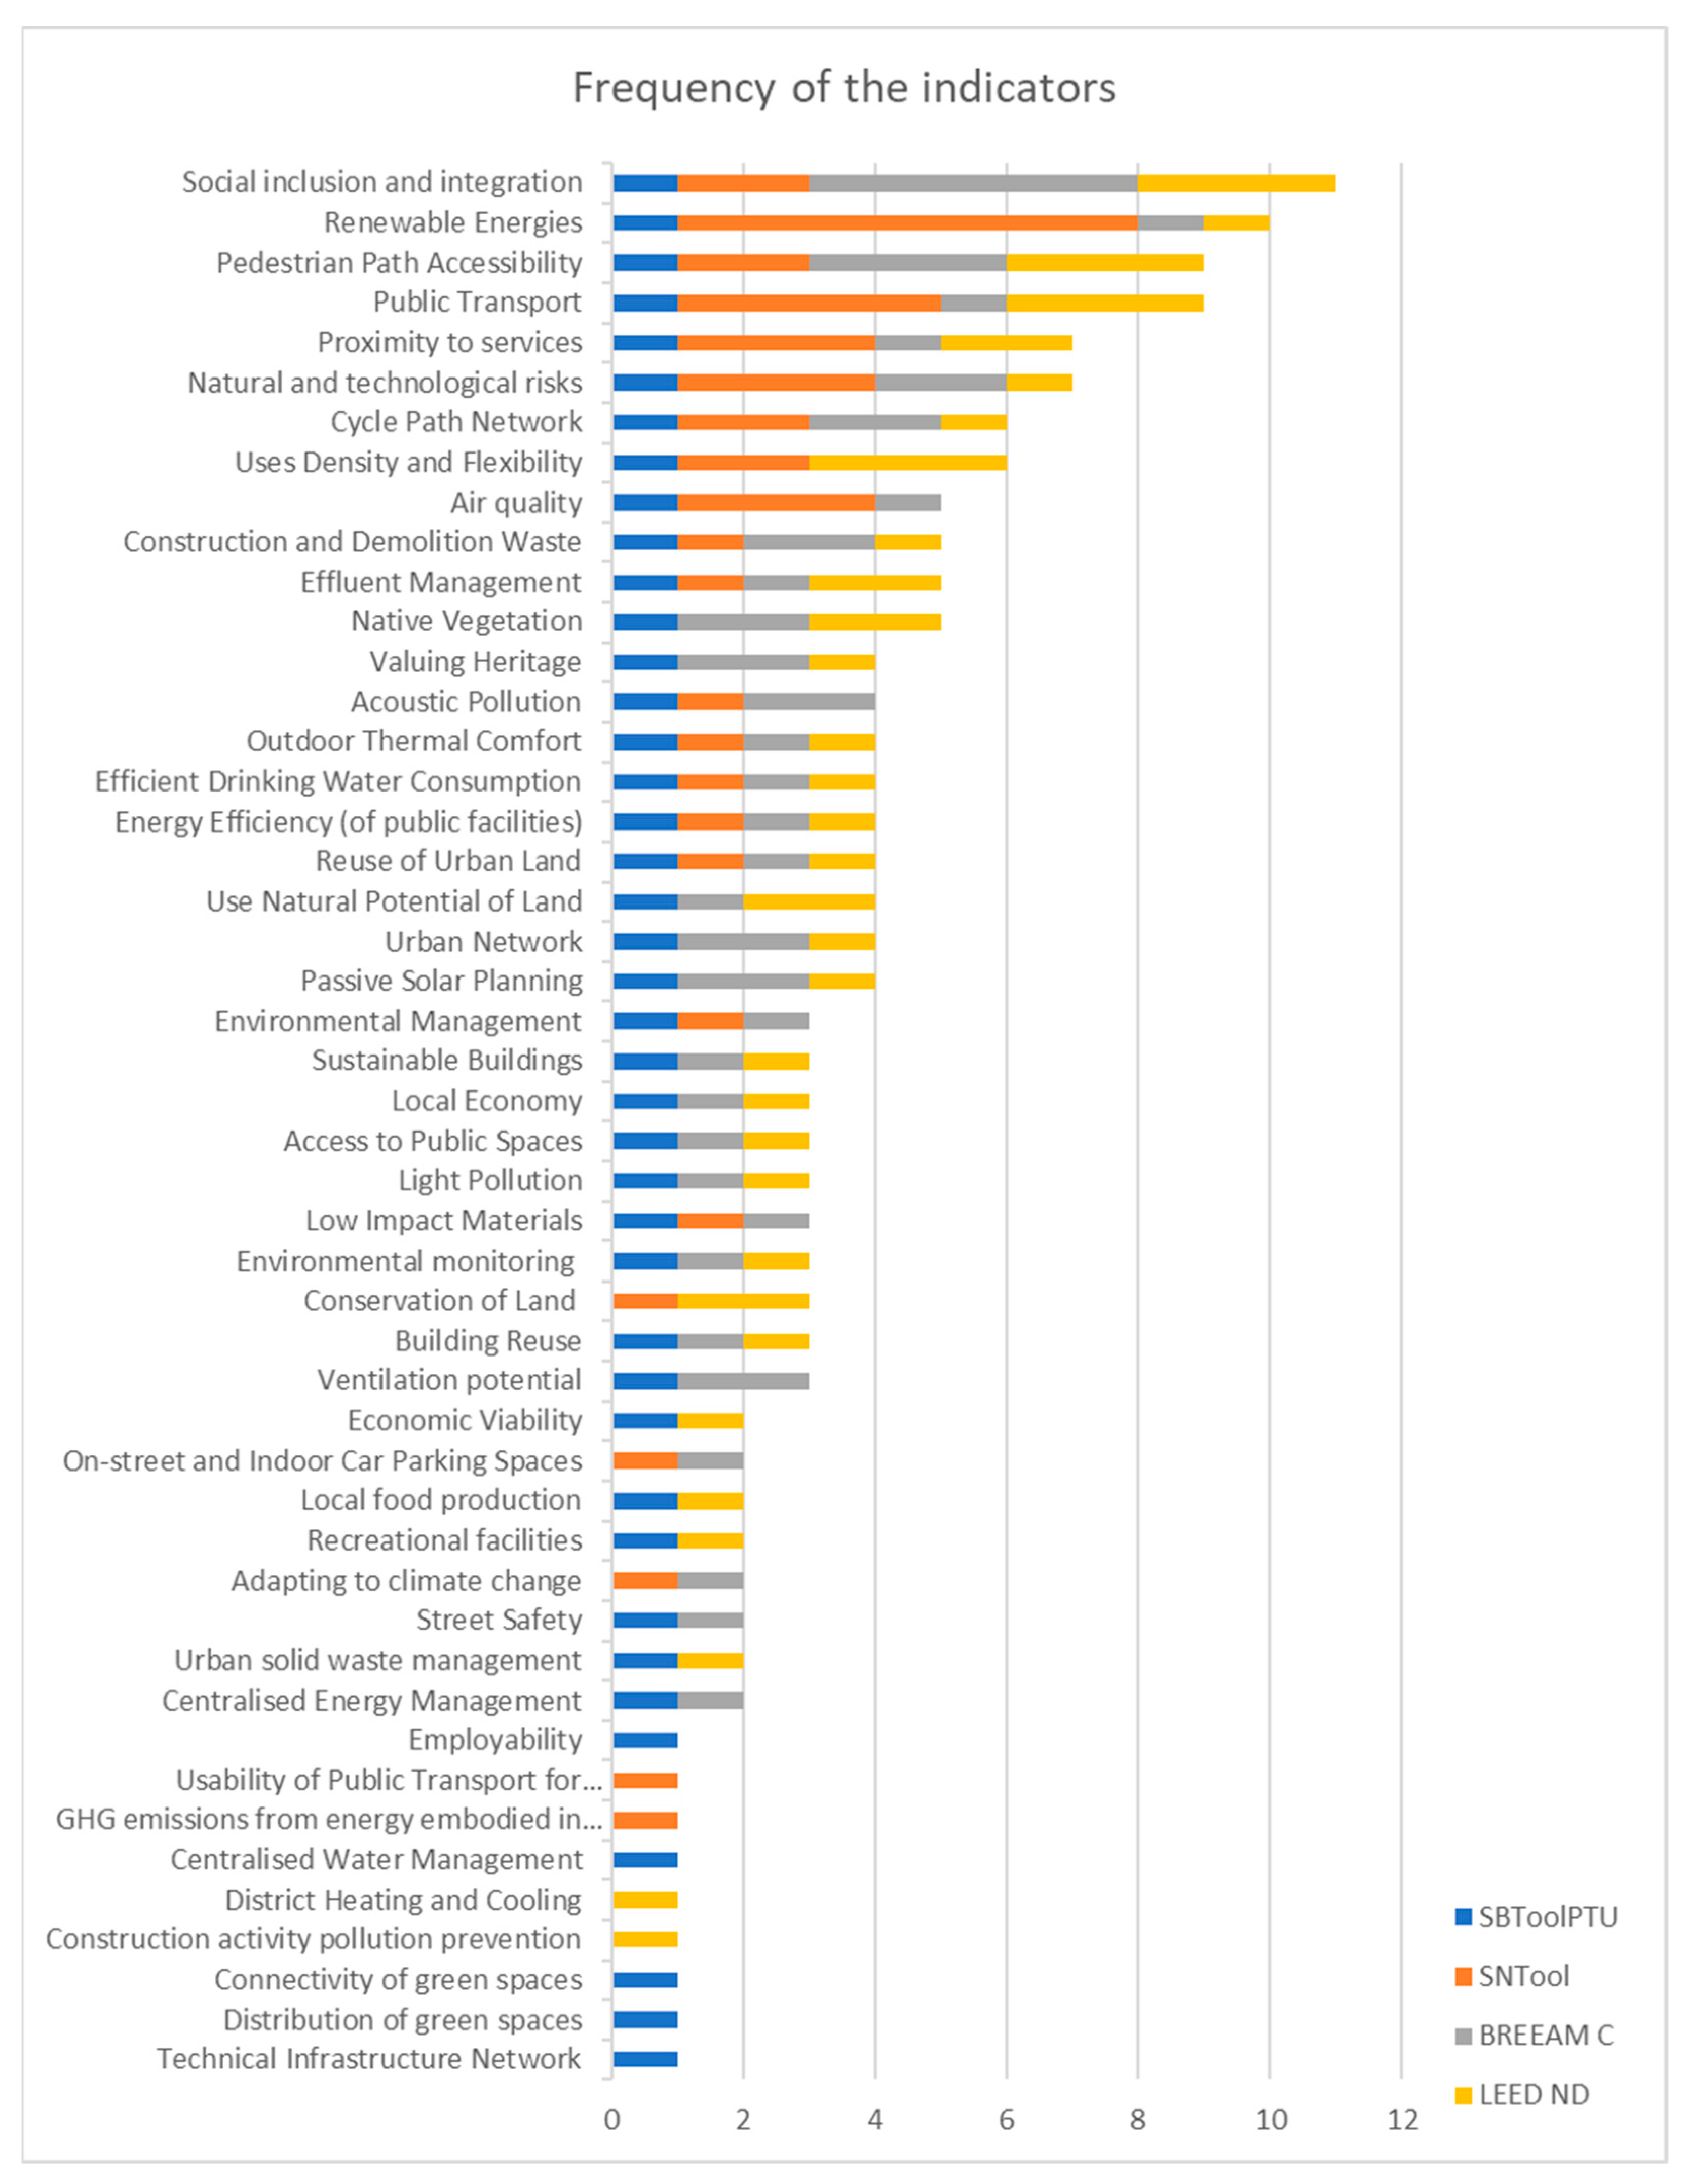
CIM has been found to be a viable method of calculating sustainability indicators and their parameters. In the case of this study, these calculations are based on the SBToolPT Urban methodology. The analysis of sustainability indicators from SBToolPT Urban, SNTool, BREEAM-C, and LEED ND has identified 48 indicators as priorities, of which 41 are presented in the SBToolPT Urban methodology. These 41 indicators, presented by SBToolPT Urban, have 52 calculation parameters, at least one parameter per indicator.
Evaluating how many indicators and their parameters can be calculated using CIM revealed that 28 parameters can be determined by a CIM model. In addition, seven can be partially calculated through CIM. The CIM model could not determine 17 parameters, and seven parameters were classified as “NON-APPLICABLE” since SBTool
PT Urban does not provide them. However, further research in this field may be able to assist in improving the calculations, and it is possible that additional parameters may be determined by the CIM.
Table 1 summarizes the classification of indicators according to their possibility of assessment using CIM.
3.3. Description of the Pilot Case Study
In order to demonstrate the calculation method proposed by this study, this subsection presents its applicability to one of the SBTool
PT Urban indicators. Indicator Distribution of Green Spaces was selected, and it aims to increase the availability of green spaces on sites. It is promoted by SBTool
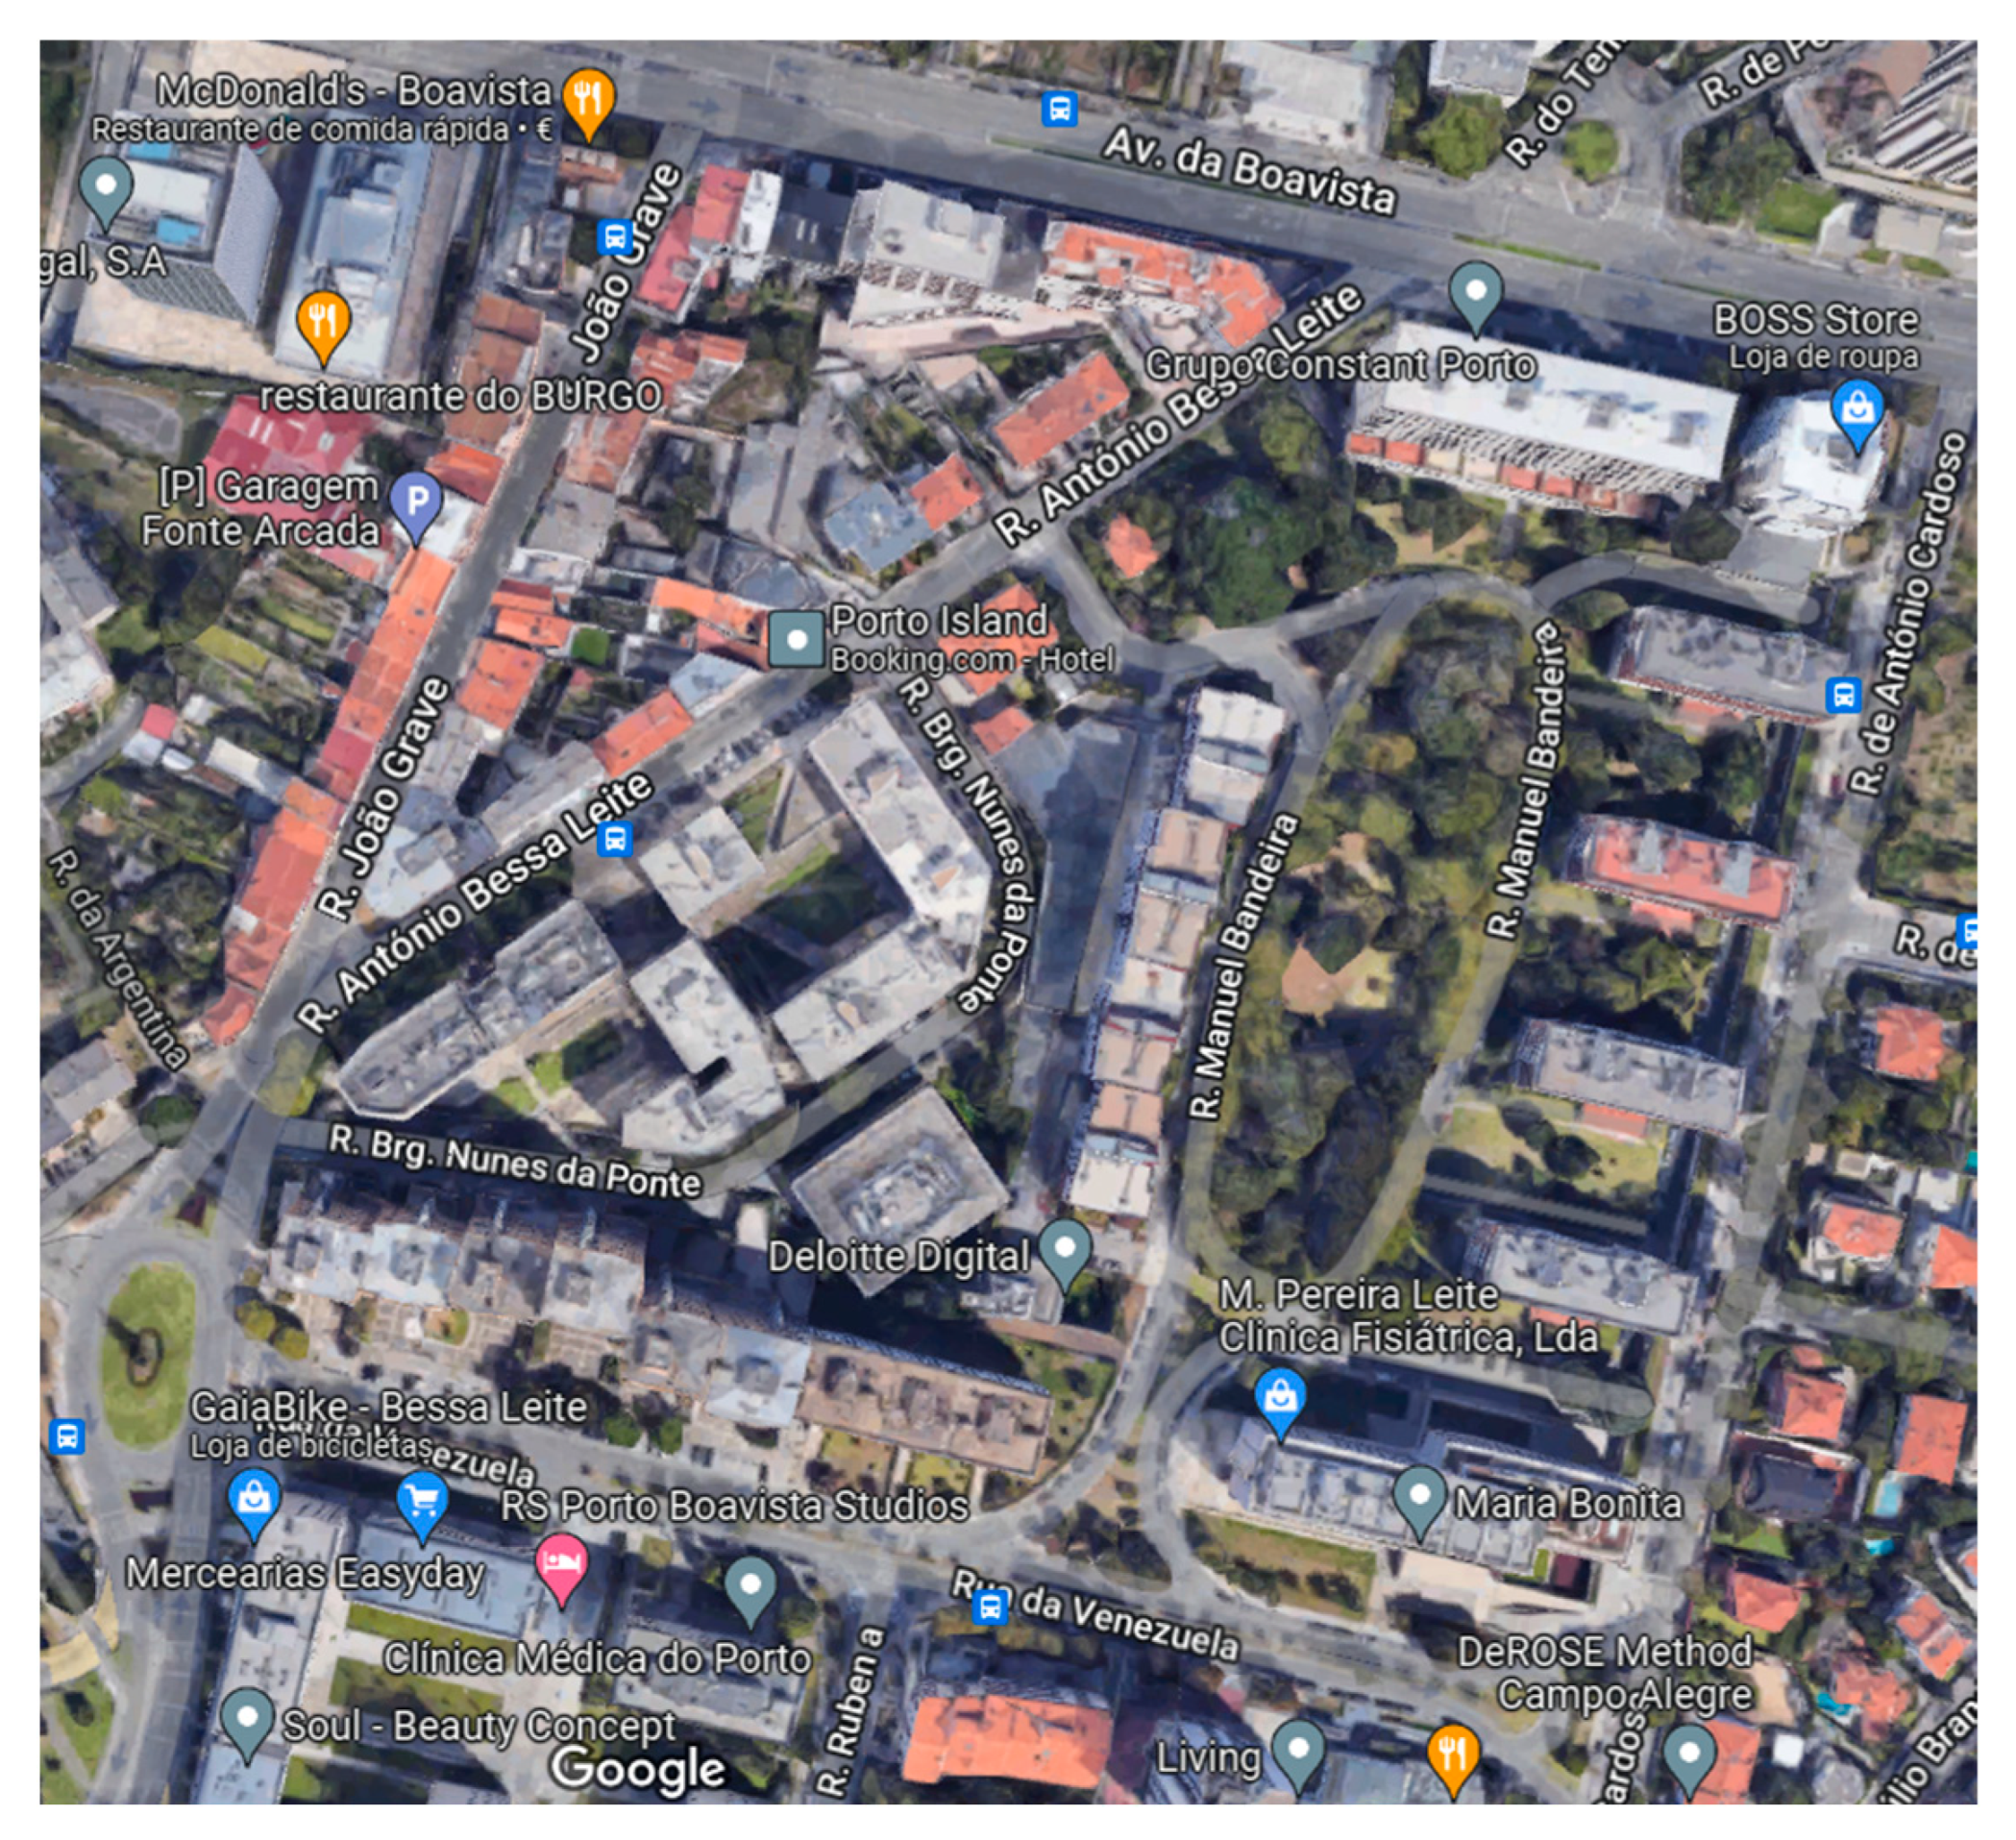
PT Urban, and outlined in ISO 37120, and the SDGs, making it recognized as a prioritized environmental concern. To demonstrate and illustrate the calculation procedure, an urban area located in the Boavista Neighborhood, in Porto city, Portugal, was chosen. It is important to note that SBTool
PT Urban is a methodology adapted to the Portuguese context. Therefore, a Portuguese urban area was selected for the demonstration of the calculation method.
Figure 3 shows the aerial view of the urban area.
The total area in the study corresponds to, approximately, 203,000 m
2. Which, approximately, 176,300 m
2 are built areas (e.g., building footprints, streets, sidewalks), and a total of 26,700 m
2 are considered green areas. The calculation methodology established by the SBTool
PT Guide is the ratio of the Total Green Area and the Total Area of the project. Therefore, the Percentage of Green Spaces is obtained, as shown in Equation (1):
corresponds to the total green area (in this example, 26,700 m2), and is the total area of the project (203,000 m2, in this case). As a result, the Percentage of Green Spaces corresponds to 0.13.
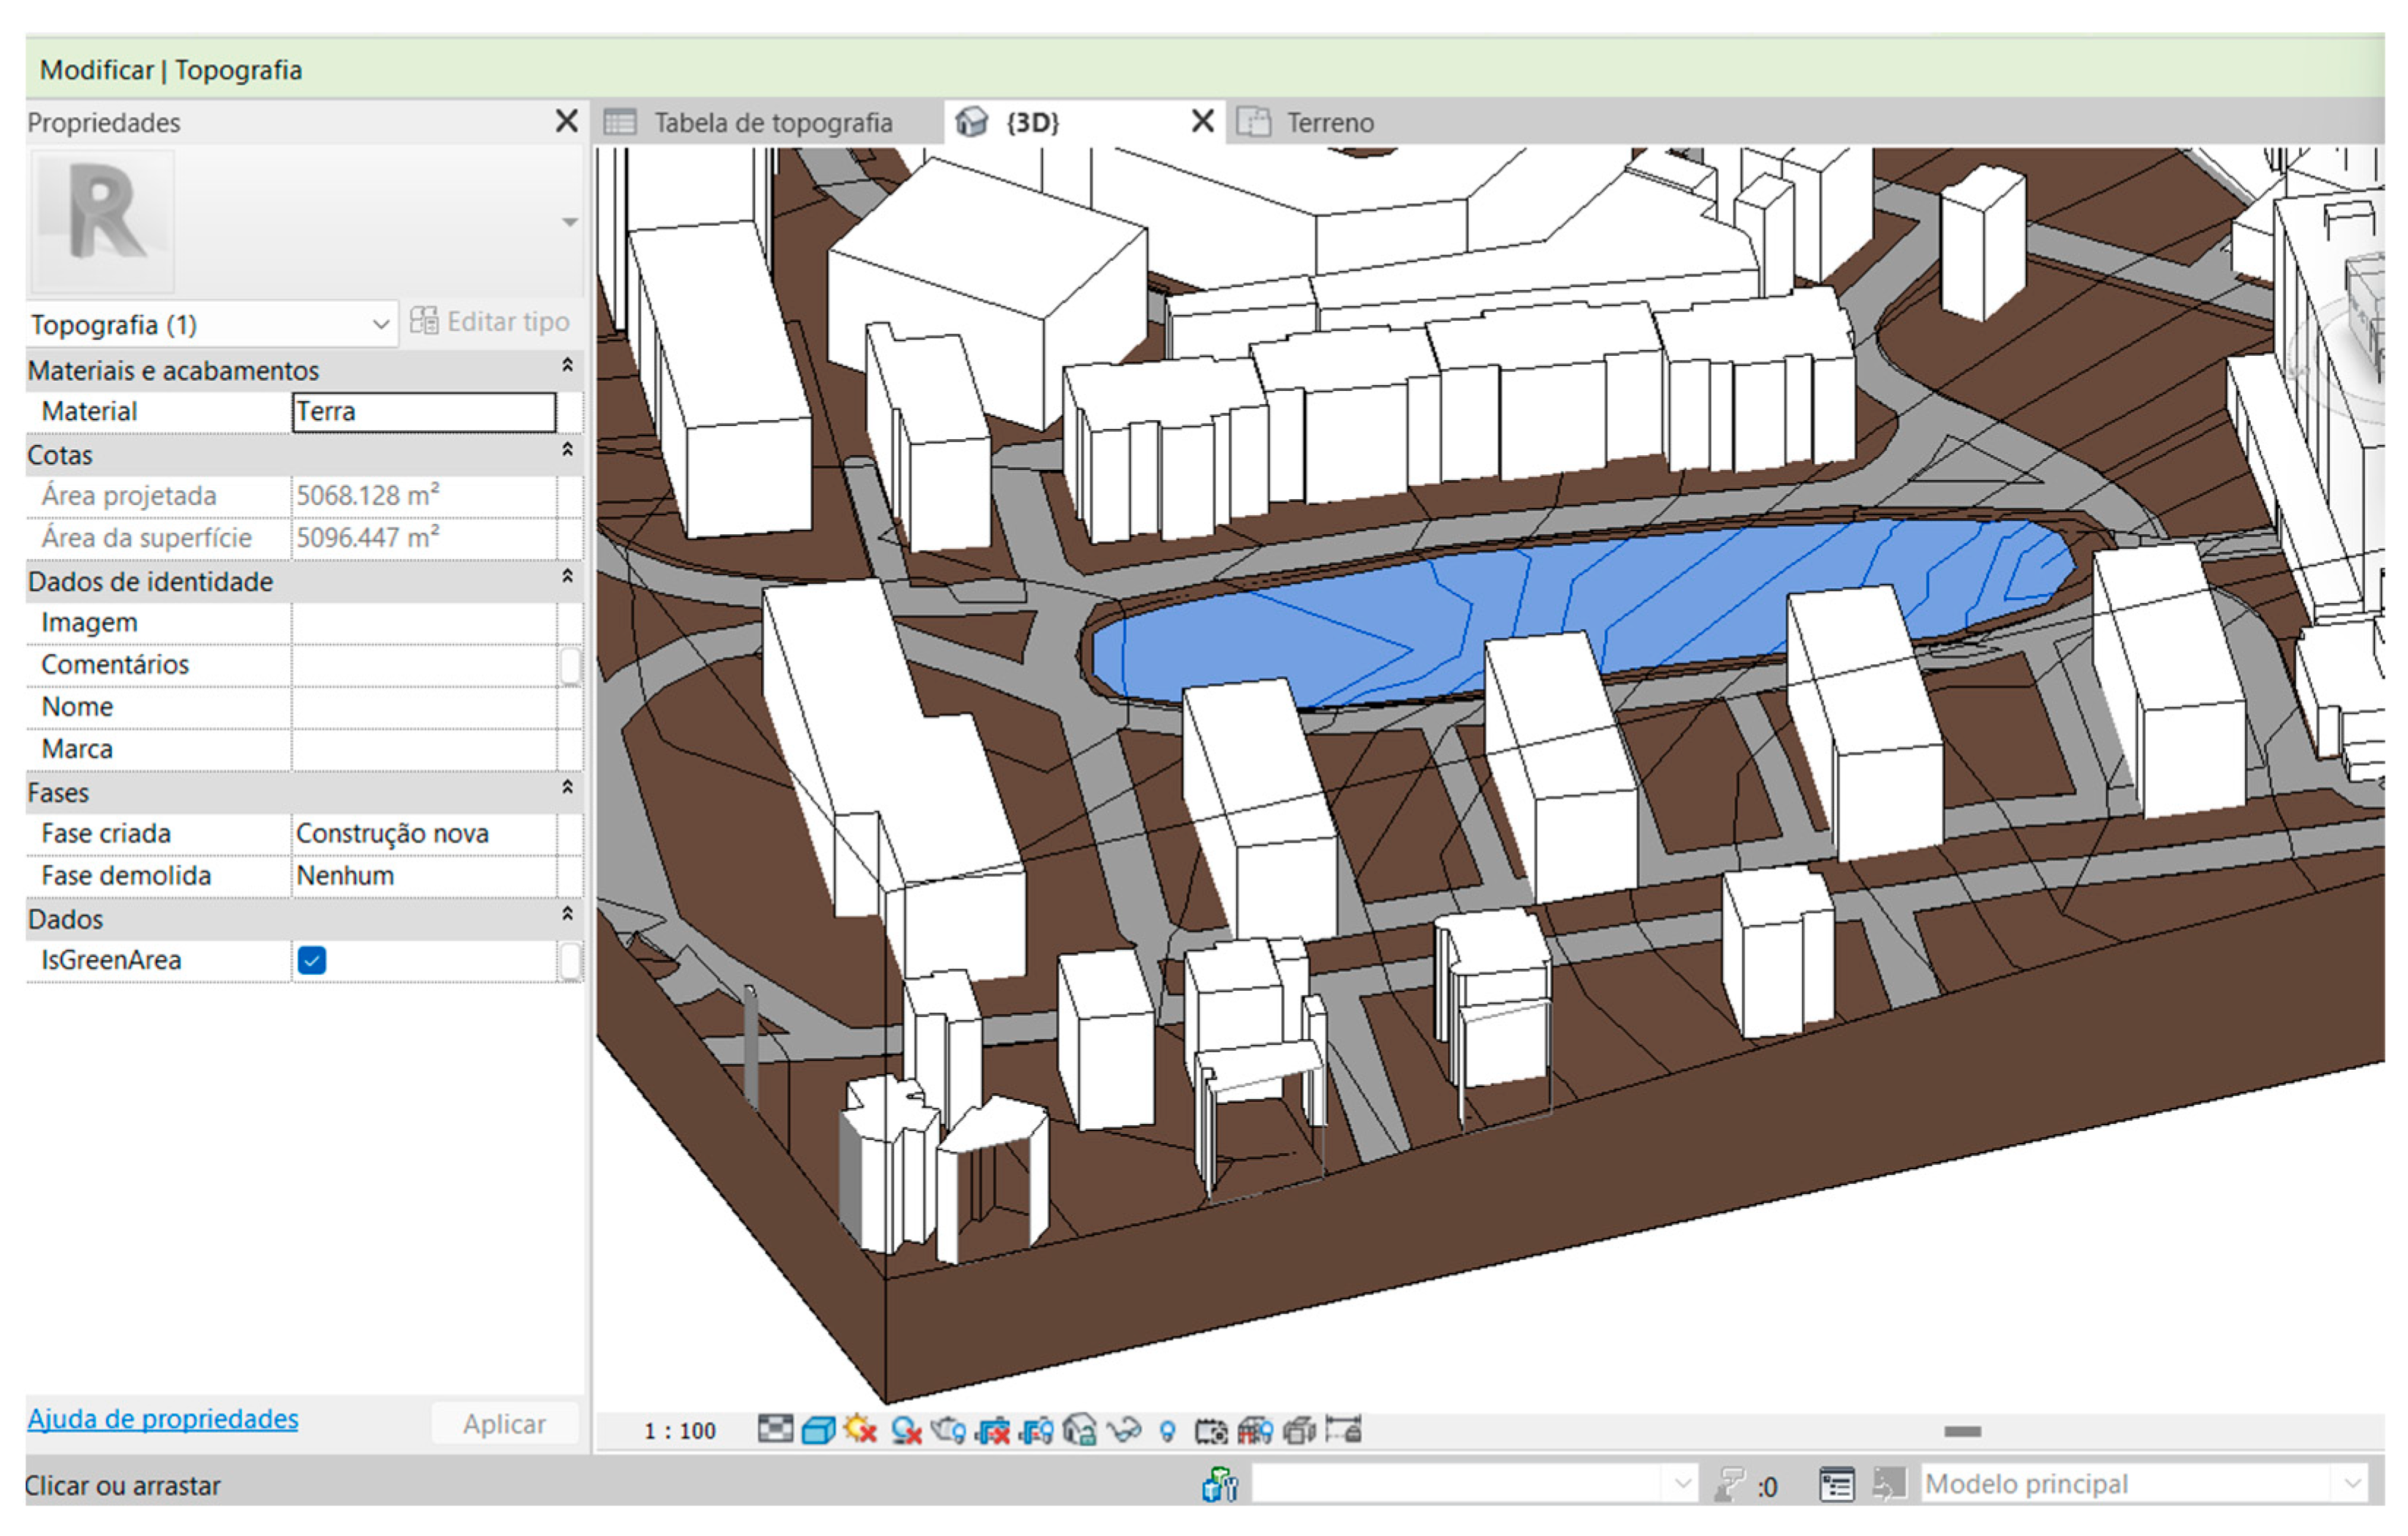
To calculate this ratio through the proposed CIM platform, first, it is necessary to add the urban area to Revit. This can be done by using the online tool CADMAPPER. First, the area is selected, then a tridimensional map is created and added to the Revit model. Once the urban area is added to the Revit model, the second step is the characterization of the surfaces. This includes streets, sidewalks, green areas, and all the necessary information related to the indicator. After that, the parameters for calculating the indicator must be created using the Revit tool
shared parameters. Taking into consideration that the indicator to be calculated is the Percentage of Green Areas, the
shared parameter is named “
IsGreenArea”. Using the
shared parameter created, all the green areas in the project must be characterized.
Figure 4 illustrates the process in Revit, where the area marked in blue is the selected area to be characterized with the
shared parameter “
IsGreenArea”.
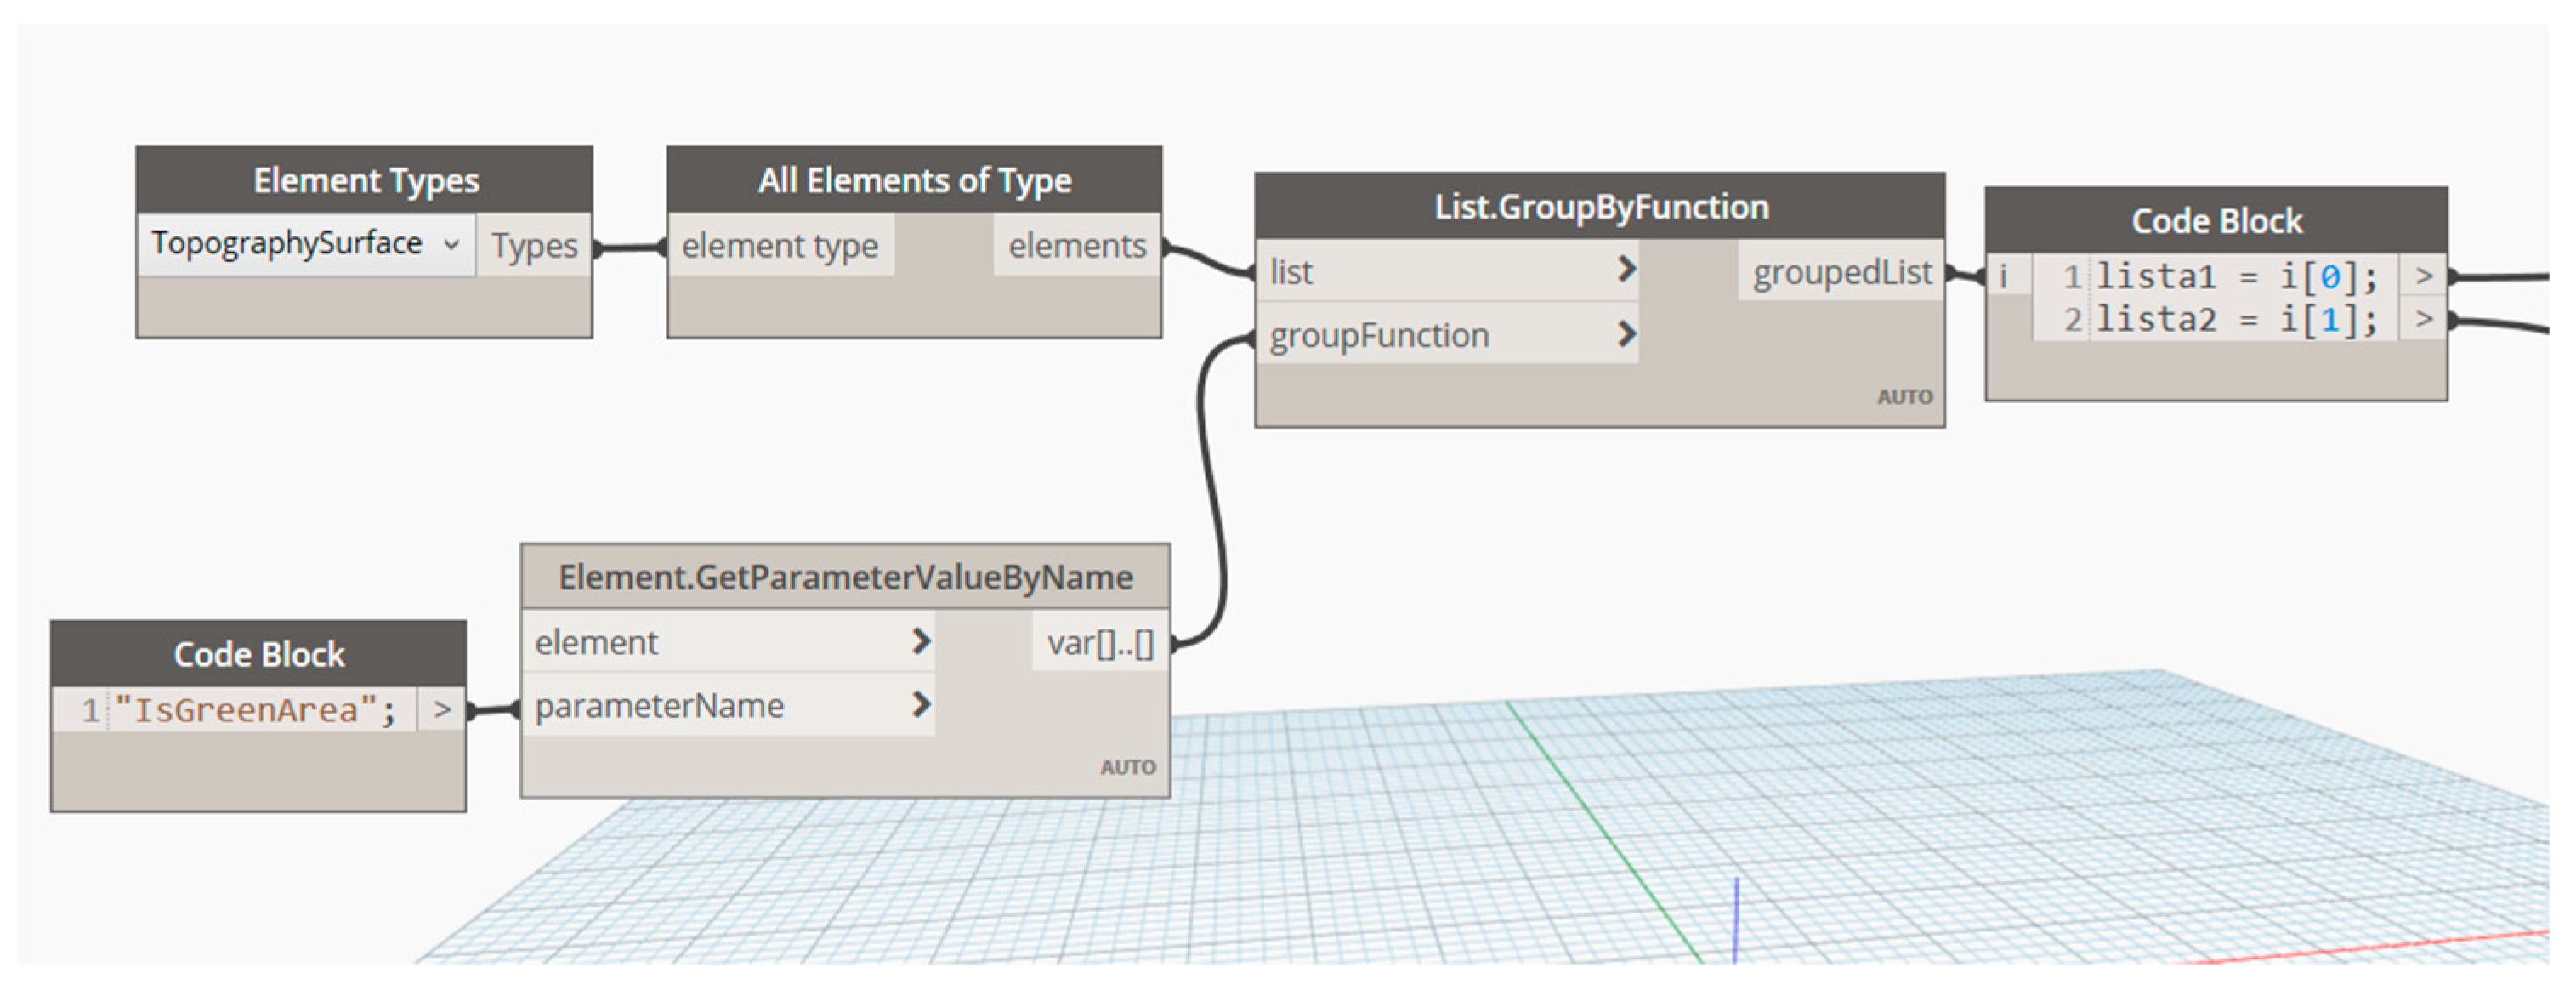
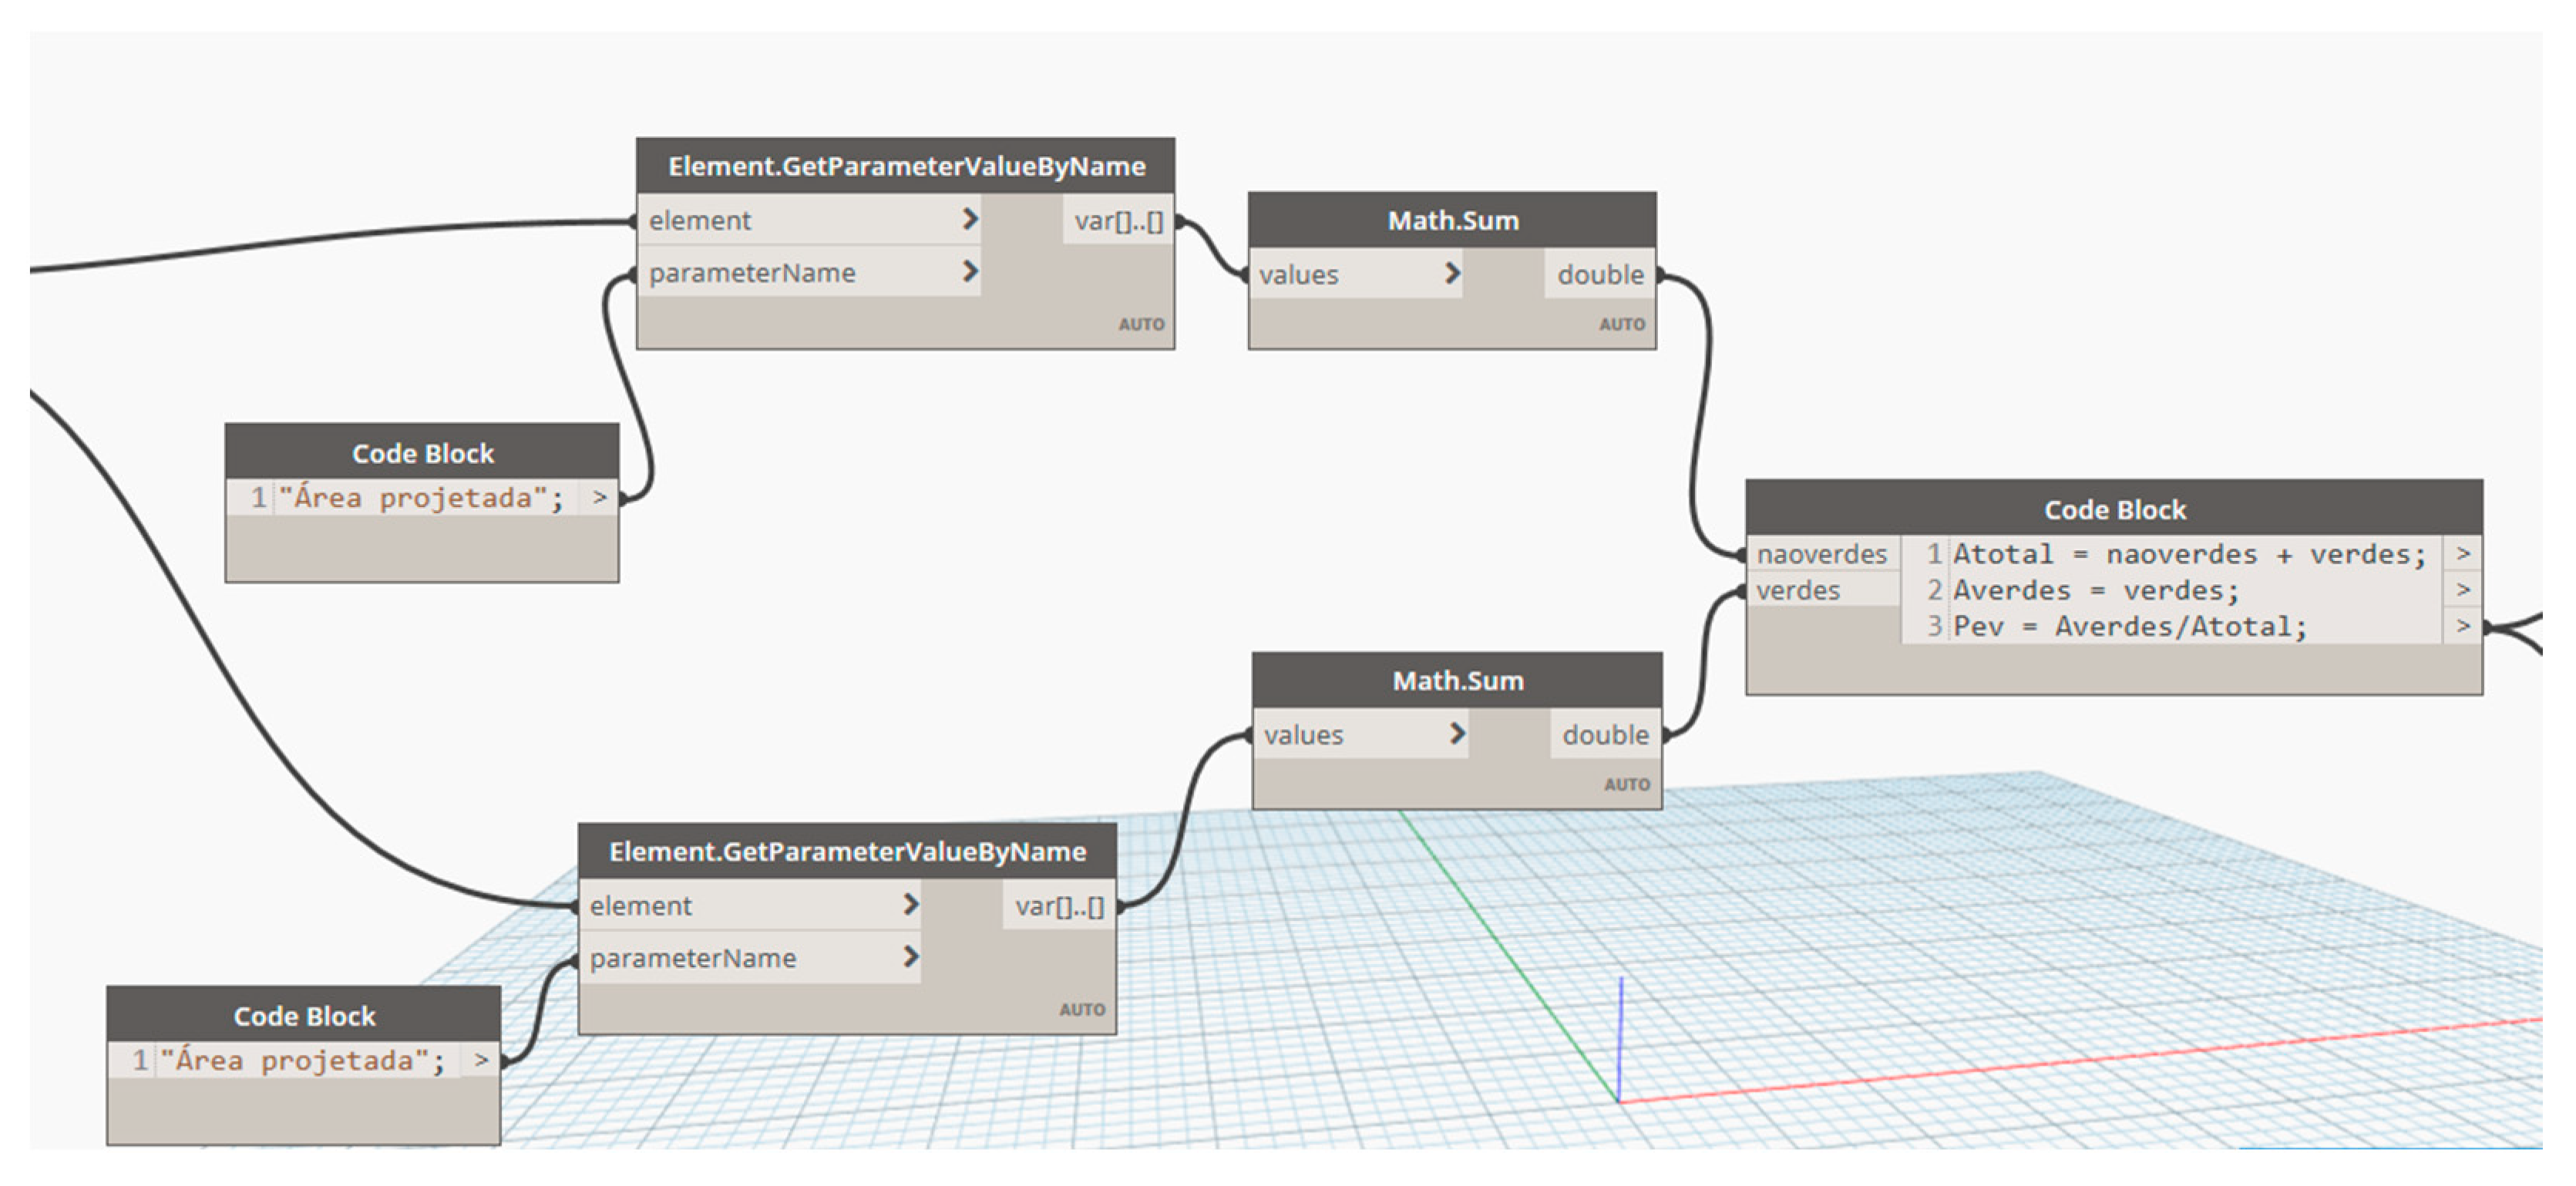
The calculation process is then carried out by creating a Dynamo routine. Generally, programming will check all the areas in the model that are characterized as green areas using the shared parameter “
IsGreenArea”. The routine identifies the areas in the model and creates a list that will be the input of the calculation,
Figure 5 illustrates this first phase of the routine.
Then, using the inputs of the list (total area, total of green area, total of non-green area) the routine will calculate the ratio of the green areas and the total project area, and the result is the Percentage of Green Spaces, shown in
Figure 6.
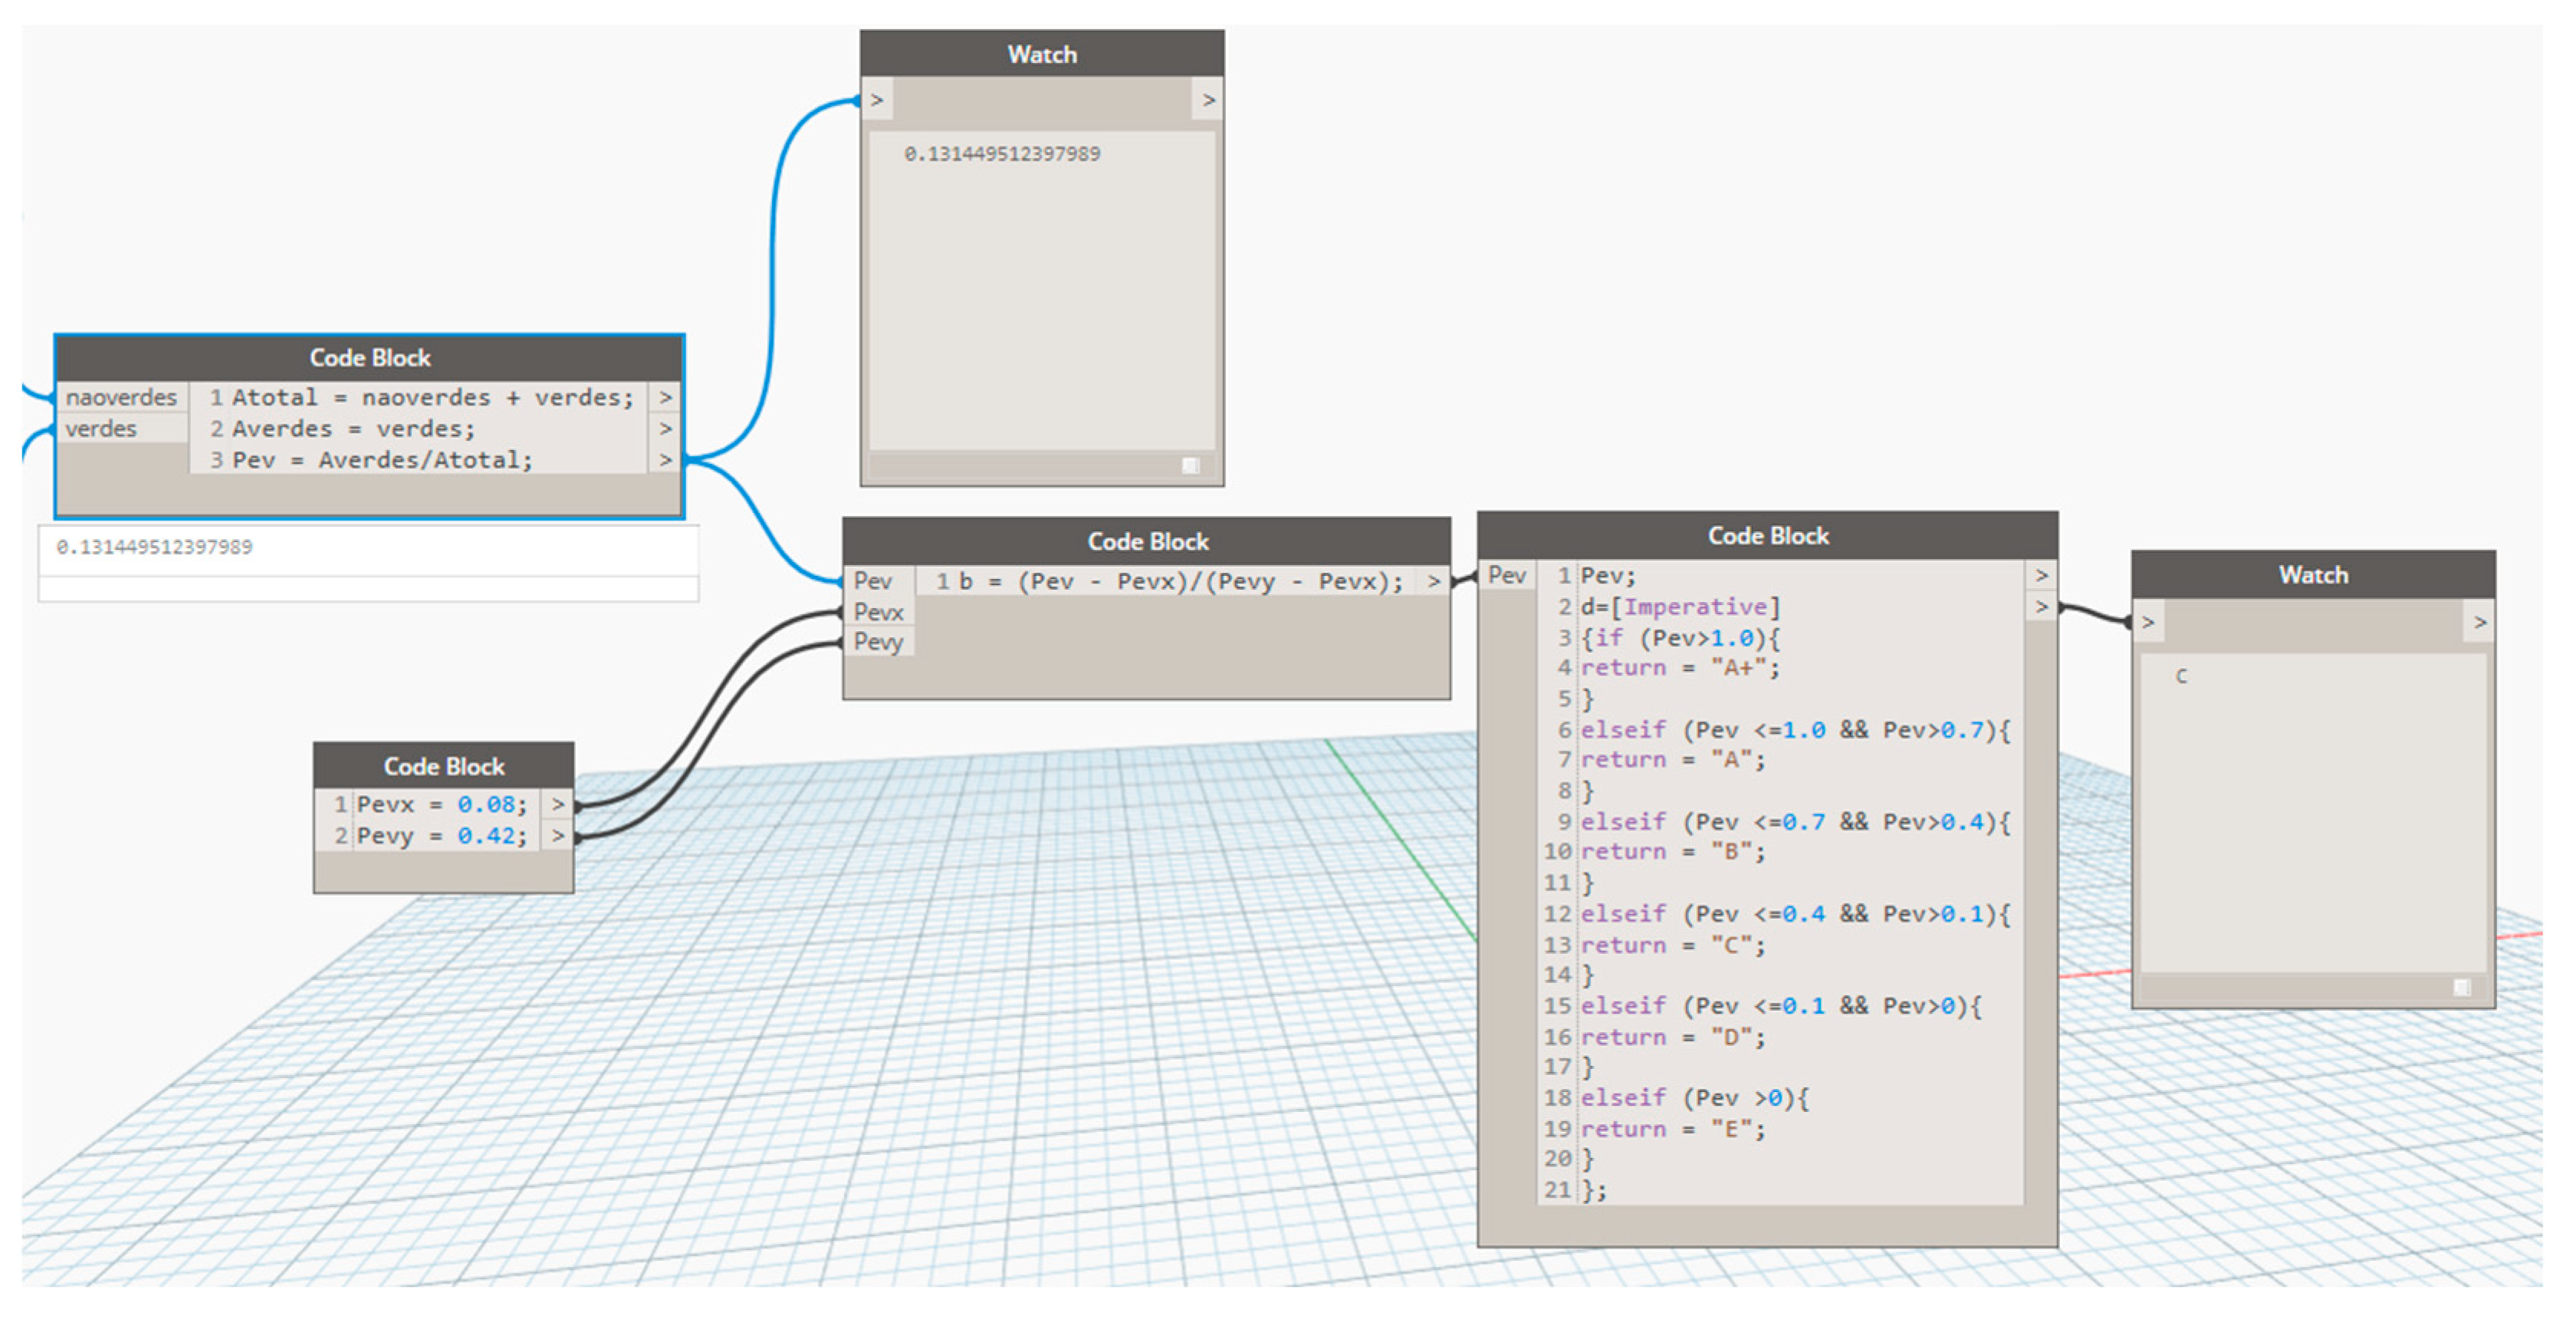
The result of the Percentage of Green Spaces obtained by the routine, shown in
Figure 7 is 0.131449512397989, or simply 0.13, in accordance with the result presented before. According to SBTool
PT Urban, once the Percentage of Green Spaces has been calculated, the next steps are to apply benchmarks and normalize the data in order to obtain the classification. The value is converted into a qualitative scale where A+ represents the most sustainable, while E represents the least sustainable. As illustrated in
Figure 7, Dynamo is capable of performing both processes, and the result is a “C” classification.
In this example, the application of CIM as a method of calculation has been demonstrated, along with the potential for its applicability. There are many advantages to this approach, but there are also some limitations. The ease and speed with which the calculations can be made are among the advantages. As well, this method may be useful for designers and urban planners when evaluating the sustainability of urban projects at an early stage. On the other hand, the first stage is a laborious process because it requires adding a significant amount of information to the model. It must be noted that the results of the Dynamo programming routine depend heavily on this stage. In addition, the size of the urban area is another limitation, large urban areas will require a high level of information to be incorporated into the model.


