
Local Differentiation in the Loess Deposition as a Function of Dust Source: Key Study Novo Orahovo Loess Paleosol Sequence (Vojvodina, Serbia)

 , , , , , ,
Abstract
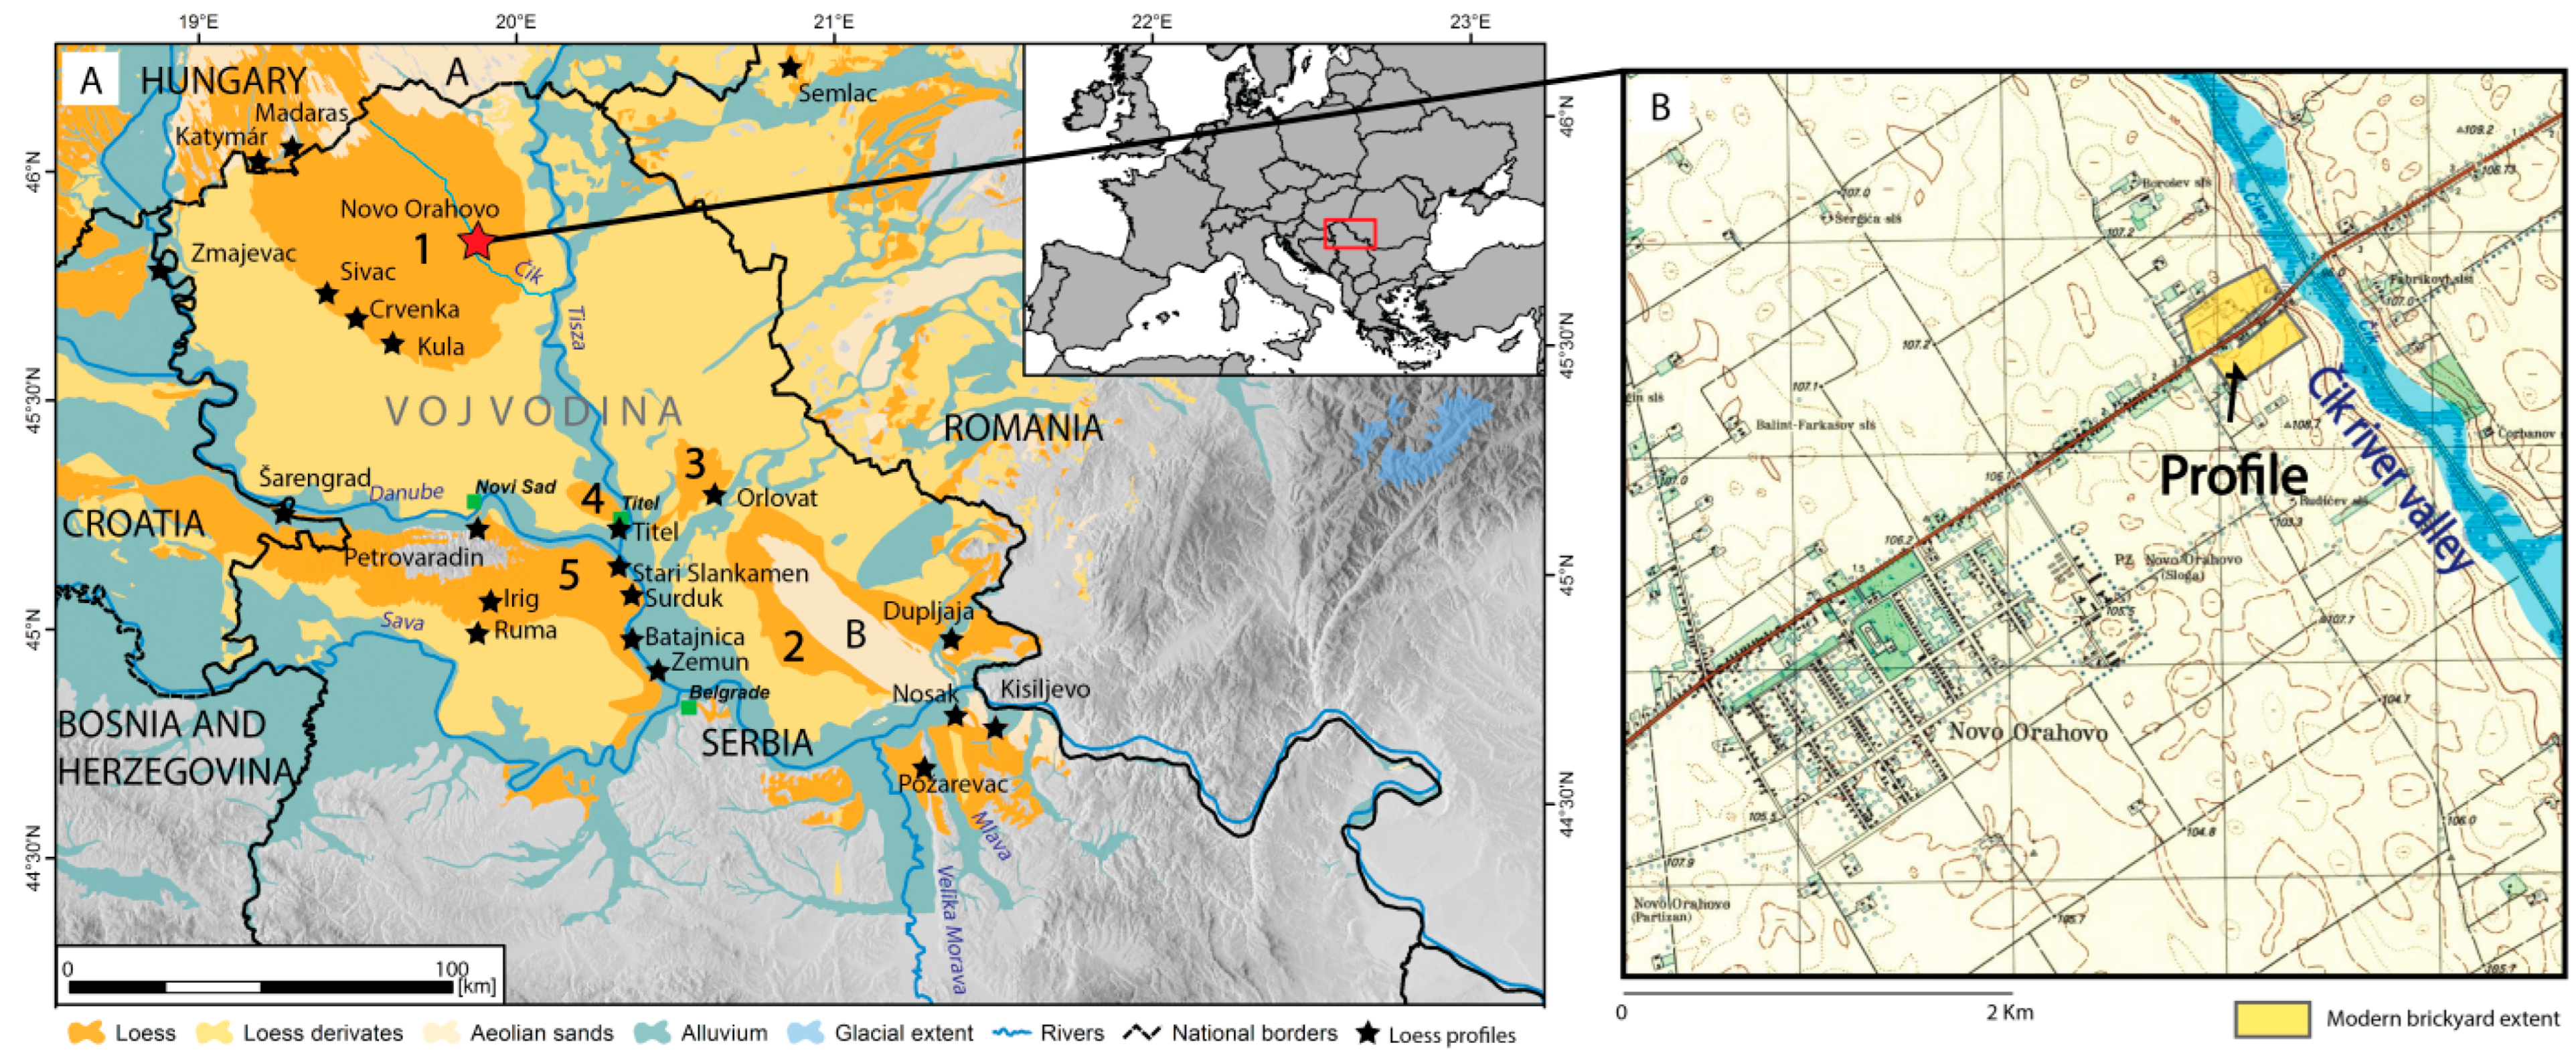
:1. Introduction
2. Material and Methods
3. Results
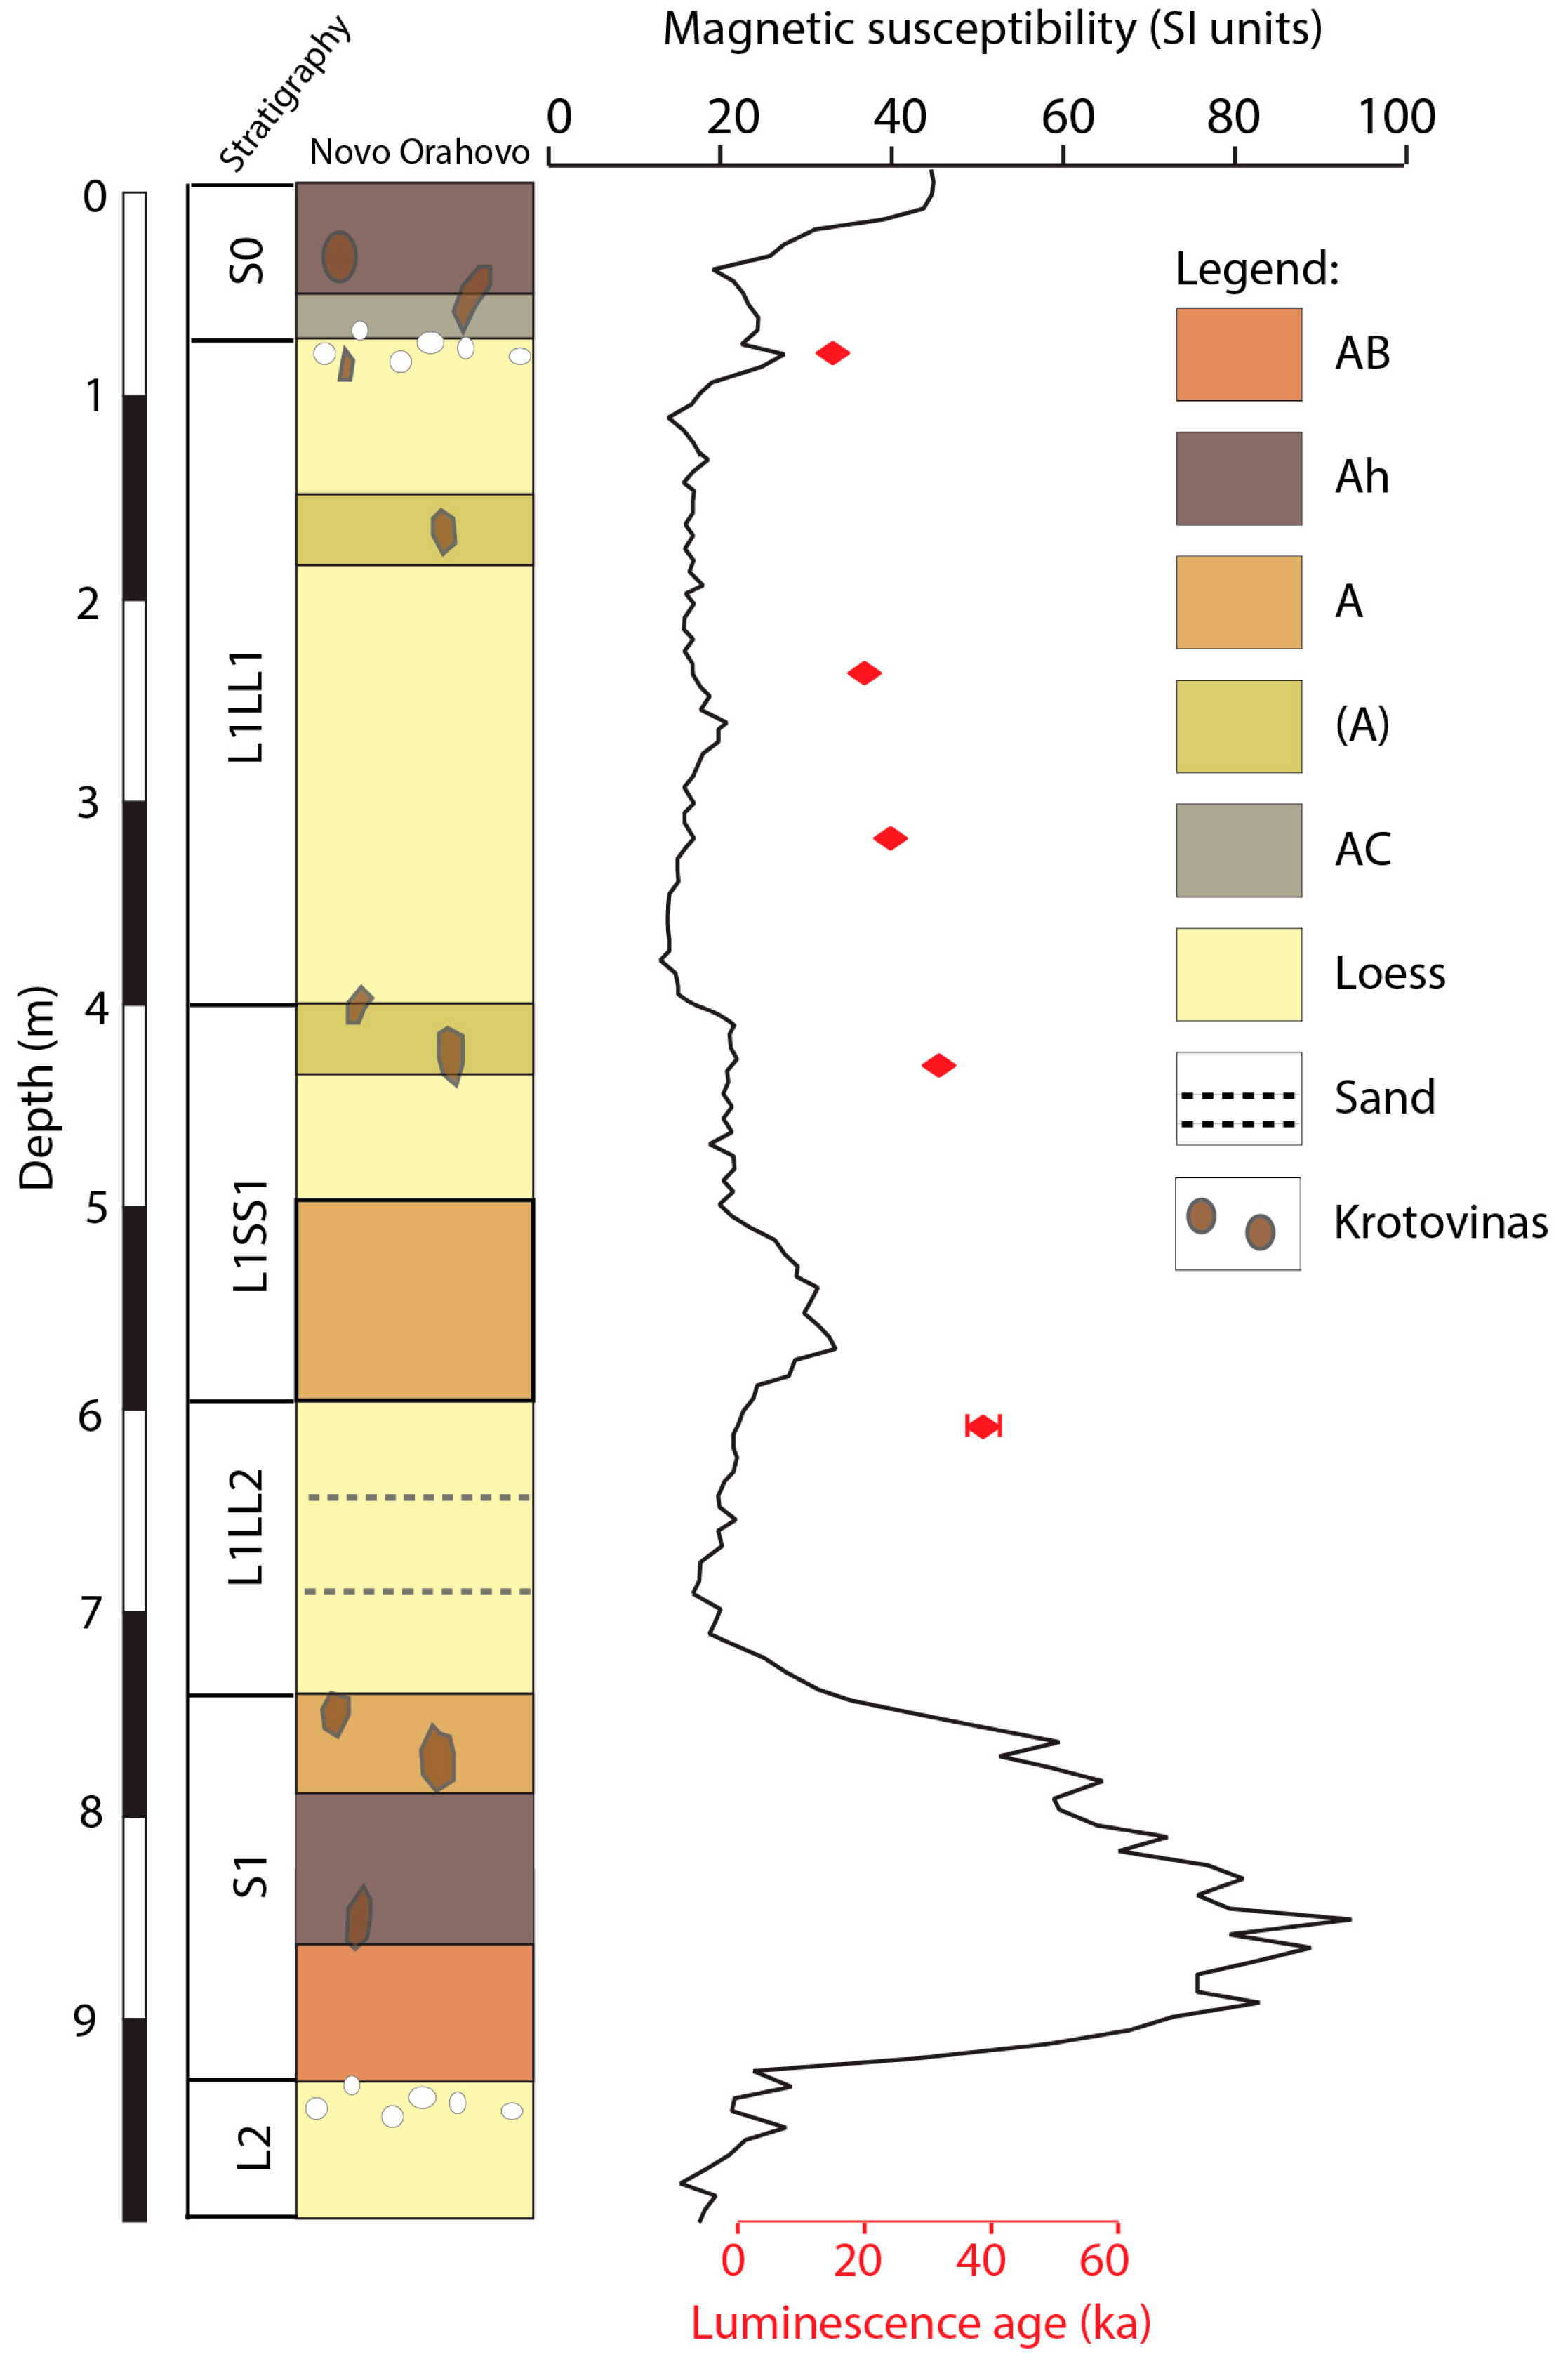
3.1. Lithostratigraphy and Pedostratigraphy
3.2. Magnetic Susceptibility (MS)
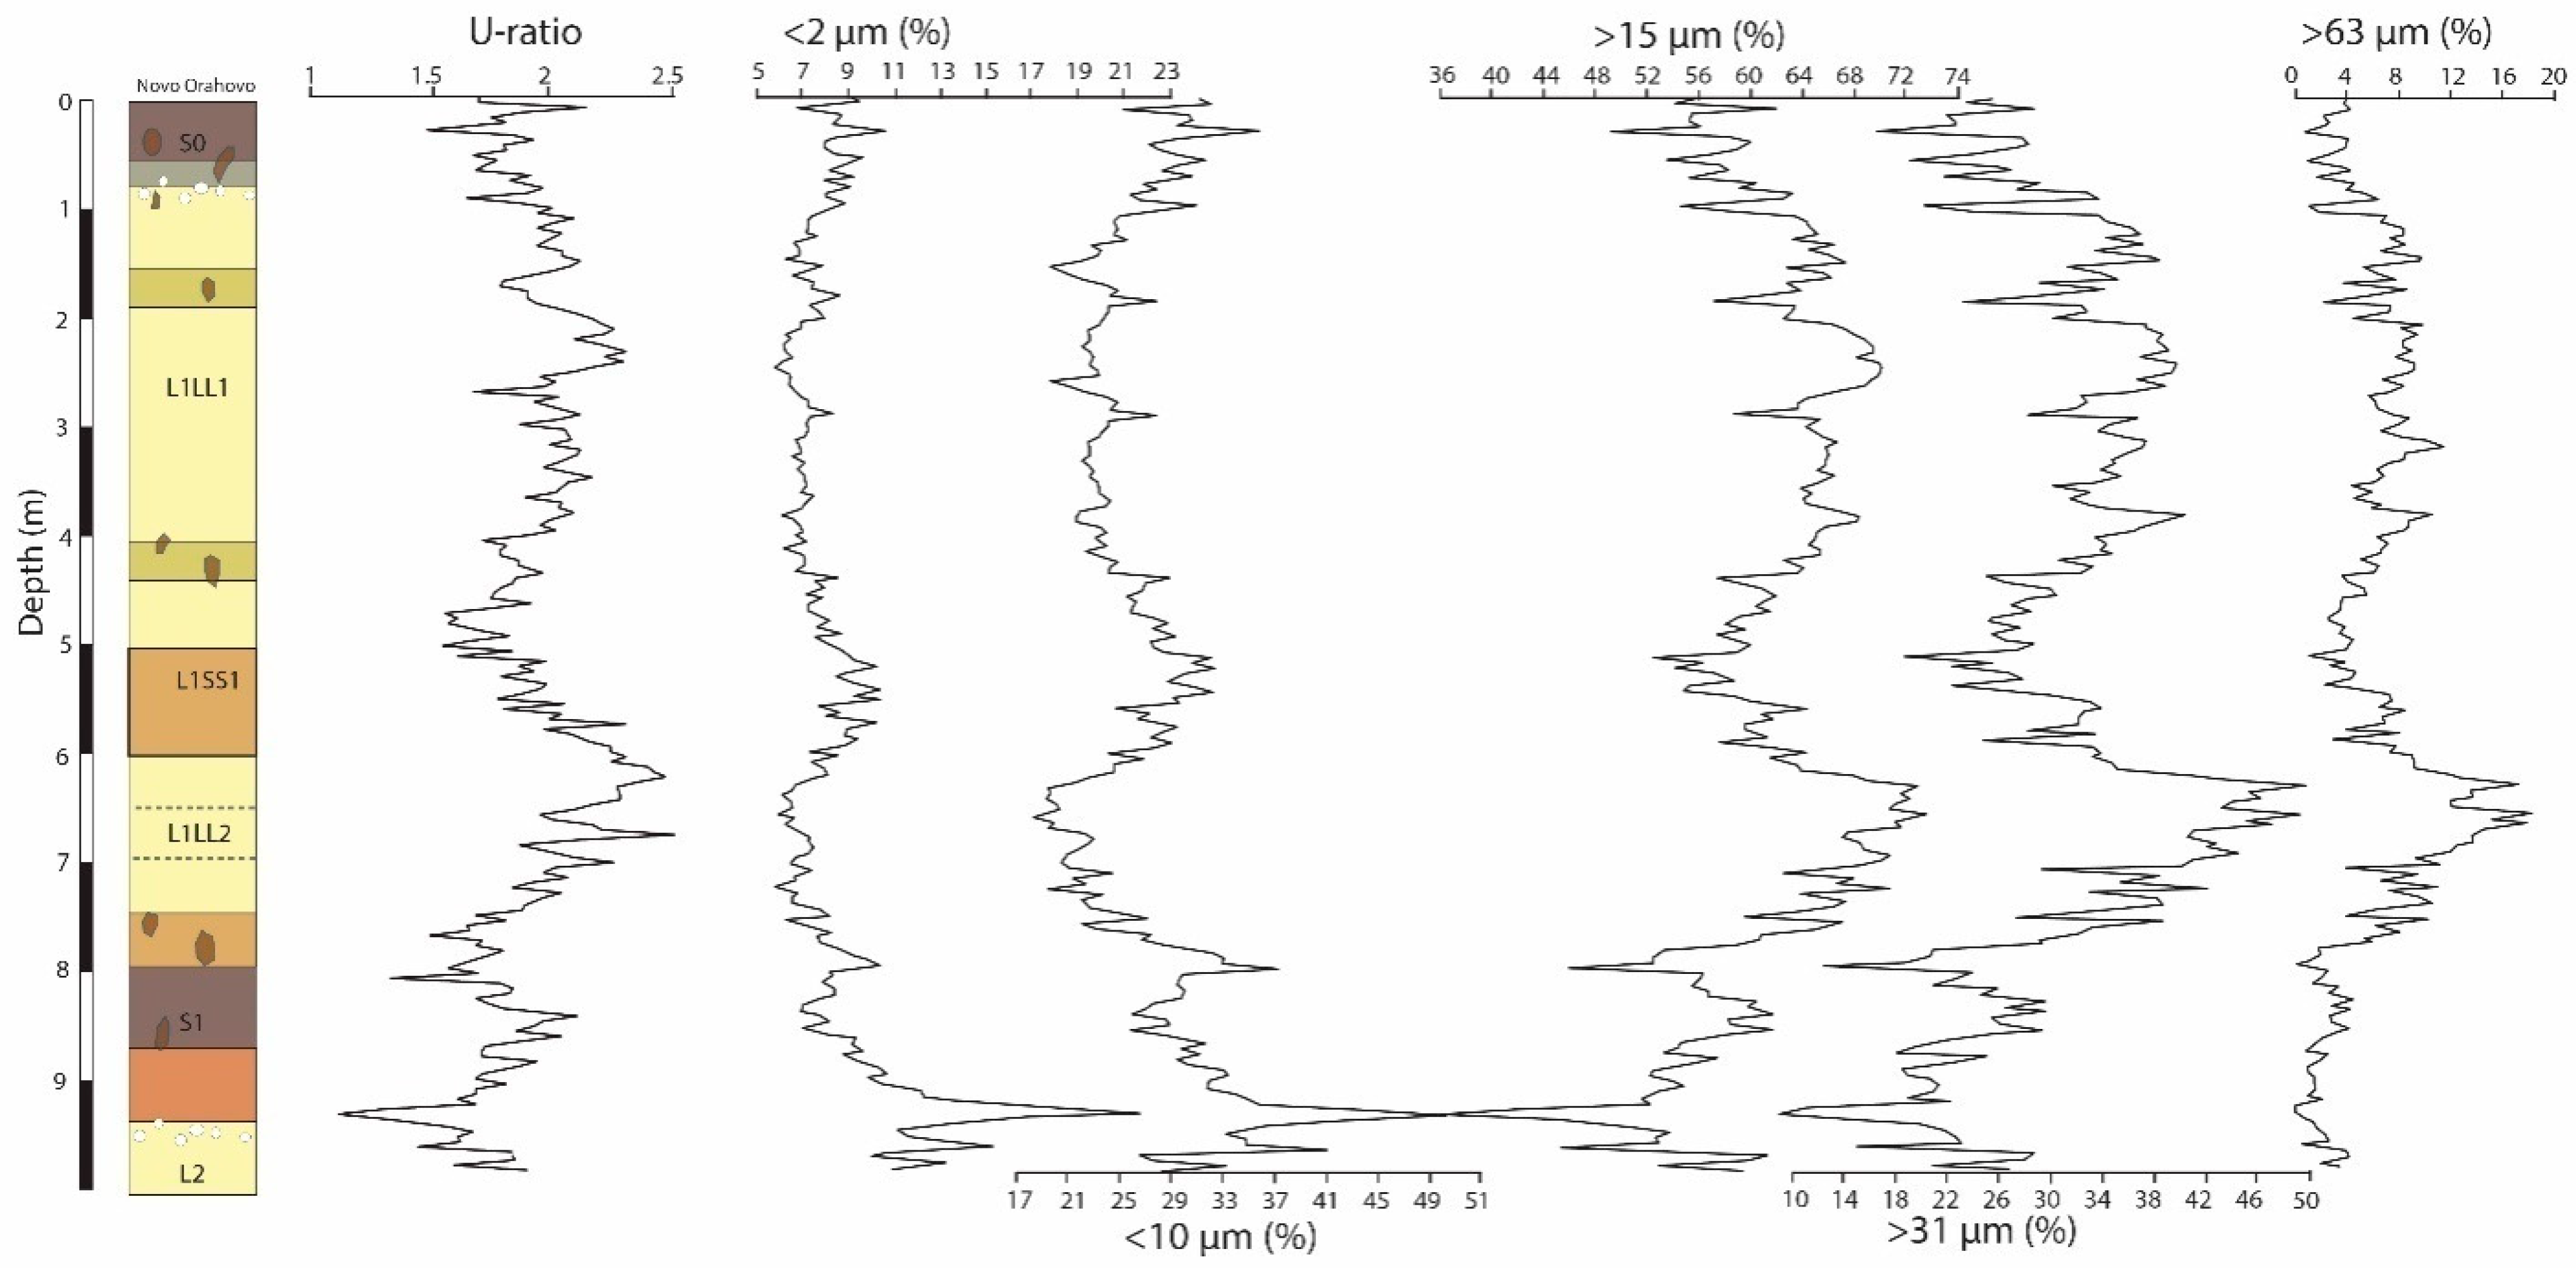
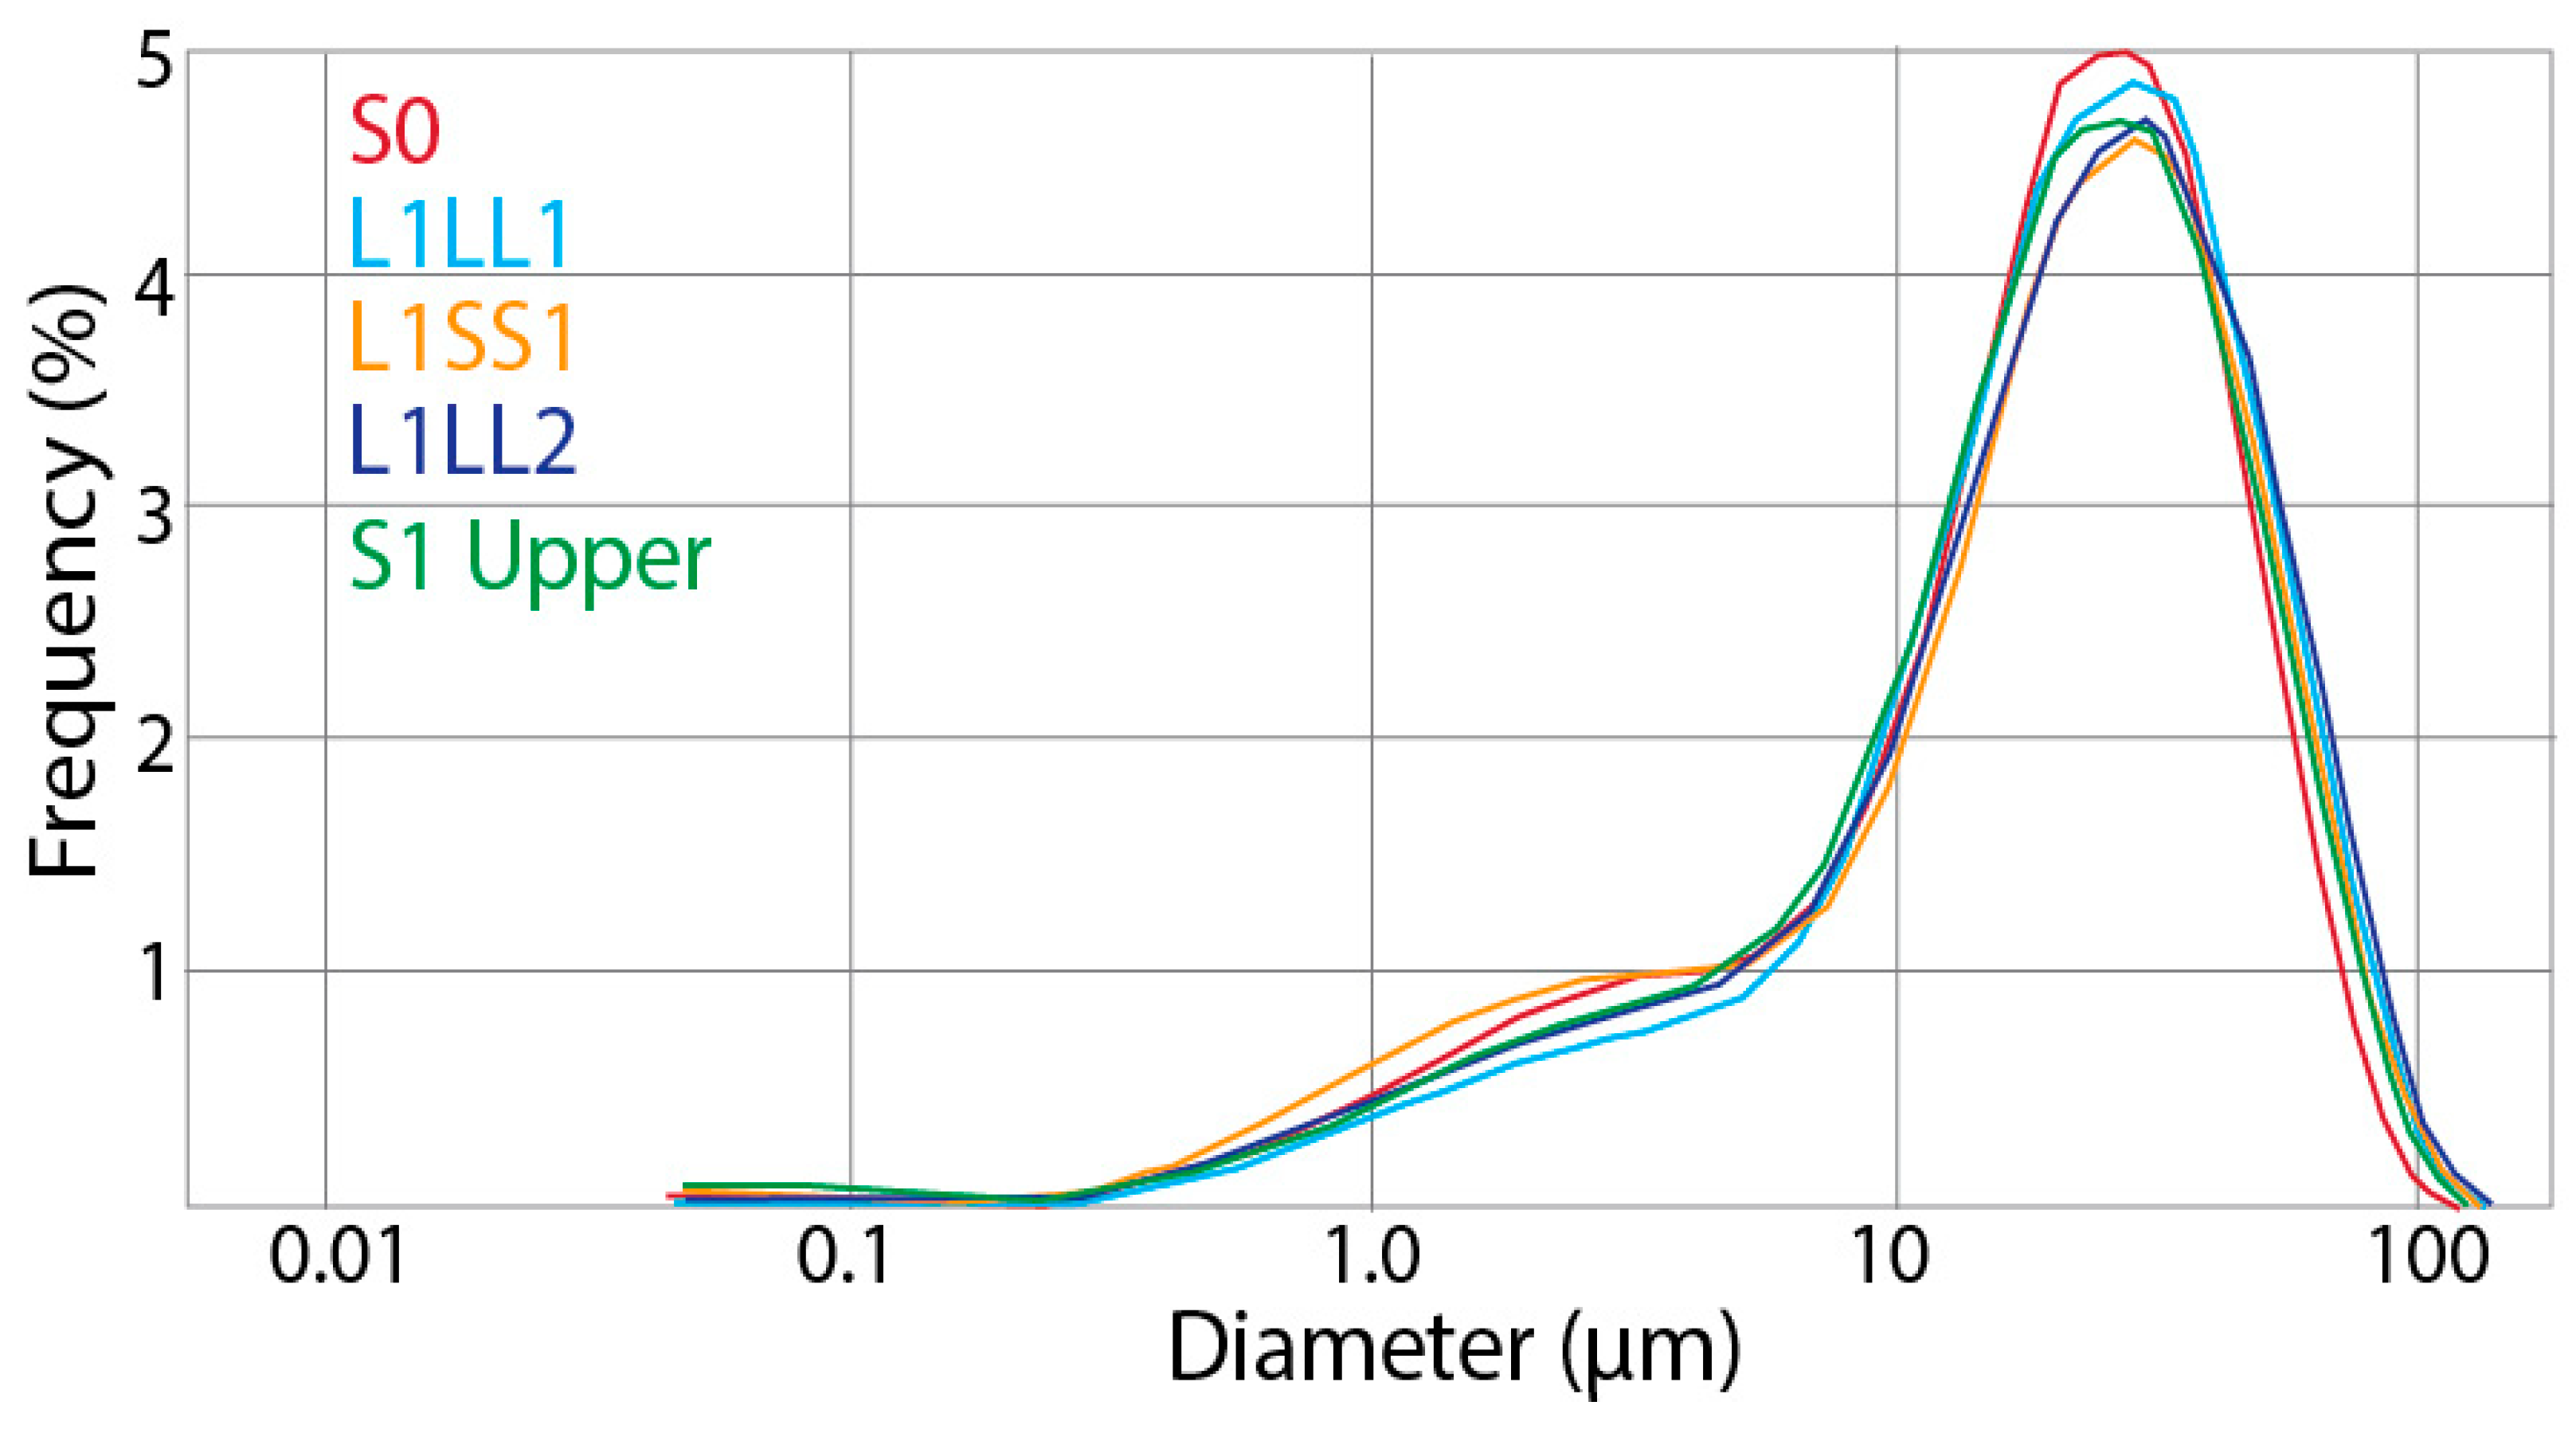
3.3. Grain-Size (GS) Variations
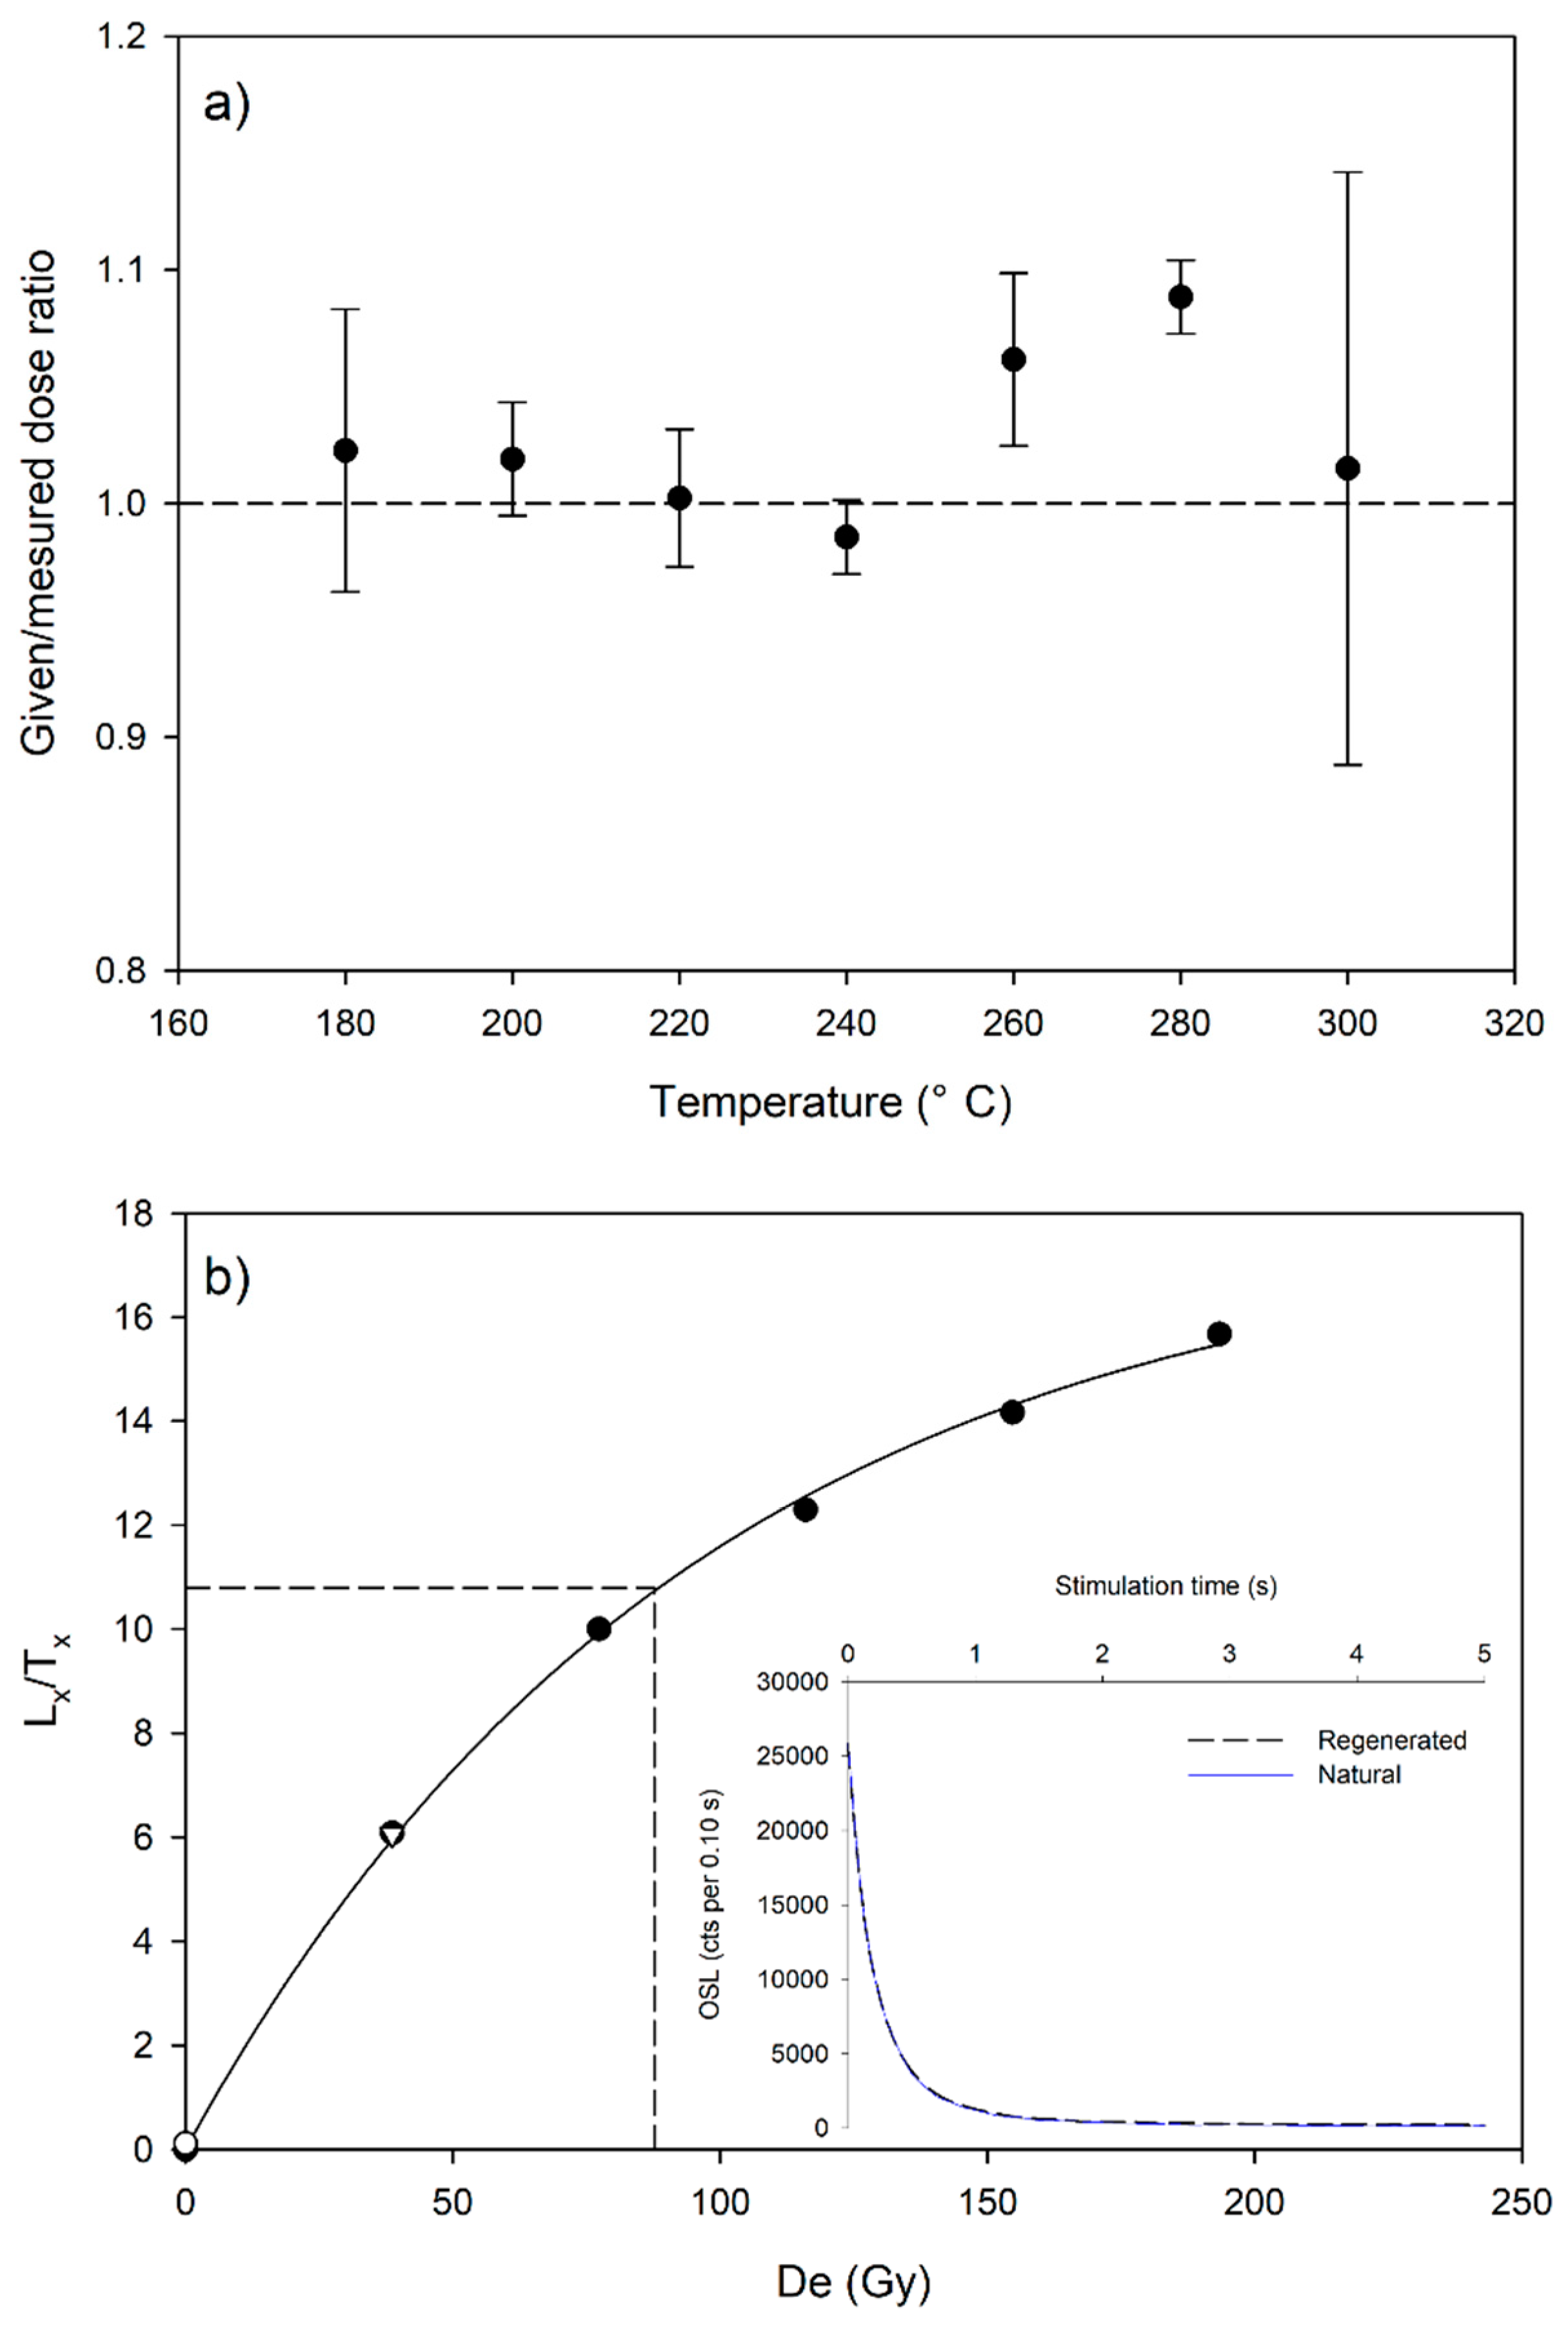
3.4. Luminescence Geochronology
4. Discussion
5. Conclusions
Author Contributions
Funding
Institutional Review Board Statement
Informed Consent Statement
Data Availability Statement
Acknowledgments
Conflicts of Interest
References
- Bronger, A. Correlation of loess–paleosol sequences in East and Central Asia with SE Central Europe: Towards a continental Quaternary pedostratigraphy and paleoclimatic history. Quat. Int. 2002, 106–107, 11–31. [Google Scholar] [CrossRef]
- Marković, S.B.; Bokhorst, M.P.; Vandenberghe, J.; McCoy, W.D.; Oches, E.A.; Hambach, U.; Gaudenyi, T.; Jovanović, M.; Zöller, L.; Stevens, T.; et al. Late Pleistocene loess-palaeosol sequences in the Vojvodina region, north Serbia. J. Quat. Sci. 2008, 23, 73–84. [Google Scholar] [CrossRef]
- Marković, S.B.; Stevens, T.; Kukla, G.J.; Hambach, U.; Fitzsimmons, K.E.; Gibbard, P.; Buggle, B.; Zech, M.; Guo, Z.; Hao, Q.; et al. Danube loess stratigraphy—Towards a pan-European loess stratigraphic model. Earth-Sci. Rev. 2015, 148, 228–258. [Google Scholar] [CrossRef] [Green Version]
- Antoine, P.; Rousseau, D.D.; Lautridou, J.P.; Hatté, C. Last interglacial-glacial climatic cycle in loess-paleosol successions of north-western France. Boreas 1999, 28, 551–563. [Google Scholar] [CrossRef]
- Bokhorst, M.P.; Beets, C.J.; Marković, S.B.; Gerasimenko, N.P.; Matviishina, Z.N.; Frechen, M. Pedo-chemical climate proxies in Late Pleistocene Serbian–Ukranian loess sequences. Quat. Int. 2009, 198, 113–123. [Google Scholar] [CrossRef]
- Stevens, T.; Marković, S.B.; Zech, M.; Hambach, U.; Sümegi, P. Dust deposition and climate in the Carpathian Basin over an independently dated last glacial-interglacial cycle. Quat. Sci. Rev. 2011, 30, 662–681. [Google Scholar] [CrossRef]
- Zech, R.; Zech, M.; Marković, S.; Hambach, U.; Huang, Y. Humid glacials, arid interglacials? Critical thoughts on pedogenesis and paleoclimate based on multi-proxy analyses of the loess-paleosol sequence Crvenka, Northern Serbia. Palaeogeogr. Palaeoclimatol. Palaeoecol. 2013, 387, 165–175. [Google Scholar] [CrossRef]
- Vandenberghe, J.; Marković, S.B.; Jovanović, M.; Hambach, U. Site-specific variability of loess and palaeosols (Ruma, Vojvodina, northern Serbia). Quaternery Int. 2014, 334–335, 86–93. [Google Scholar] [CrossRef]
- Perić, Z.; LagerbäckAdolphi, E.; Stevens, T.; Újvári, G.; Zeeden, C.; Buylaert, J.P.; Marković, S.B.; Hambach, U.; Fischer, P.; Schmidt, C.; et al. Quartz OSL dating of late quaternary Chinese and Serbian loess: A cross Eurasian comparison of dust mass accumulation rates. Quat. Int. 2019, 502, 30–44. [Google Scholar] [CrossRef]
- Lehmkuhl, F.; Bösken, J.; Hošek, J.; Sprafke, T.; Marković, S.B.; Obreht, I.; Hambach, U.; Sümegi, P.; Thiemann, A.; Steffens, S.; et al. Loess distribution and related Quaternary sediments in the Carpathian Basin. J. Maps 2018, 14, 661–670. [Google Scholar] [CrossRef] [Green Version]
- EORC, J. ALOS Global Digital Surface Model “ALOS World 3D-30m”(AW3D30). 2016. Available online: http://www.eorc.jaxa.jp/ALOS/en/aw3d30/index.htm (accessed on 6 August 2020).
- Perić, Z.M.; Marković, S.B.; Sipos, G.; Gavrilov, M.B.; Thiel, C.; Zeeden, C.; Murray, A.S. A post-IR IRSL chronology and dust mass accumulation rates of the Nosak loess-palaeosol sequence in north-eastern Serbia. Boreas 2020, 49, 841–857. [Google Scholar] [CrossRef]
- Fenn, K.; Durcan, J.A.; Thomas, D.S.G.; Banak, A. A 180 ka record of environmental change at Erdut (Croatia): A new chronology for the loess–palaeosol sequence and its implications for environmental interpretation. J. Quat. Sci. 2020, 35, 582–593. [Google Scholar] [CrossRef] [Green Version]
- Pötter, S.; Veres, D.; Baykal, Y.; Nett, J.J.; Schulte, P.; Hambach, U.; Lehmkuhl, F. Disentangling sedimentary pathways for the Pleniglacial Lower Danube loess based on geochemical signatures. Front. Earth Sci. 2021, 9, 600010. [Google Scholar] [CrossRef]
- Sümegi, P.; Gulyás, S. Some notes on the interpretation and reliability of malacological proxies in paleotemperature reconstructions from loess-comments to Obreht et al.’s “A critical reevaluation of paleoclimate proxy records from loess in the Carpathian Basin”. Earth-Sci. Rev. 2021, 221, 103675. [Google Scholar] [CrossRef]
- Laag, C.; Hambach, U.; Zeeden, C.; Lagroix, F.; Guyodo, Y.; Veres, D.; Jovanović, M.; Marković, S.B. A detailed paleoclimate proxy record for the Middle Danube Basin over the last 430 kyr: A rock magnetic and colorimetric study of the Zemun loess-paleosol sequence. Front. Earth Sci. 2021, 9, 600086. [Google Scholar] [CrossRef]
- Marković, S.B.; Oches, E.A.; Sümegi, P.; Jovanović, M.; Gaudenyi, T. An introduction to the Middle and Upper Pleistocene loess–paleosol sequences at Ruma Brickyard (Vojvodina, Yugoslavia). Quat. Int. 2006, 149, 80–86. [Google Scholar] [CrossRef]
- Marković, S.B.; McCoy, W.D.; Oches, E.A.; Savić, S.; Gaudenyi, T.; Jovanović, M.; Stevens, T.; Walther, R.; Ivanišević, P.; Galić, Z. Paleoclimate record in the Late Pleistocene loess-paleosol sequence at Petrovaradin Brickyard (Vojvodina, Serbia). GeologicaCarpathica 2005, 56, 545–552. [Google Scholar]
- Marković, S.B.; Oches, E.A.; McCoy, W.D.; Frechen, M.; Gaudenyi, T. Malacological and sedimentological evidence for ‘‘warm’’ glacial climate from the Irig loess sequence, Vojvodina. Serbia. Geochem. Geophys. Geosyst. 2007, 8, Q09008. [Google Scholar] [CrossRef]
- Marković, S.B.; Oches, E.A.; Perić, Z.M.; Gaudenyi, T.; Jovanović, M.; Sipos, G.; Thiel, C.; Buylaert, J.; Savić, S.; McCoy, W.D.; et al. The Požarevac loess–paleosol sequence: A record of increased aridity in the south-eastern margin of the Carpathian Basin during the last 350 ka. J. Quat. Sci. 2021, 36, 1436–1447. [Google Scholar] [CrossRef]
- Sümegi, P.; Marković, S.B.; Molnár, D.; Sávai, S.; Náfrádi, K.; Szelepcsényi, Z.; Novák, Z. Črvenka loess-paleosol sequence revisited: Local and regional Quaternary biogeographical inferences of the southern Carpathian Basin. Open Geosci. 2016, 8, 390–404. [Google Scholar] [CrossRef]
- Marković, S.B.; Sümegi, P.; Stevens, T.; Schaetzl, R.J.; Obreht, I.; Chu, W.; Buggle, B.; Zech, M.; Zech, R.; Zeeden, C.; et al. The Crvenka loess-paleosol sequence: A record of continuous grassland domination in the southern Carpathian Basin during the Late Pleistocene. Palaeogeogr. Palaeoclim. Palaeoecol. 2018, 509, 33–46. [Google Scholar] [CrossRef]
- Chen, H.; Shao, M.; Li, Y. Soil desiccation in the Loess Plateau of China. Geoderma 2008, 143, 91–100. [Google Scholar] [CrossRef]
- Vandenberghe, J.; Hujizer, B.; Mücher, H.; Laan, W. Short climatic oscillations in a western European loess sequence (Kesselt, Belgium). J. Quat. Sci. 1998, 13, 35–38. [Google Scholar] [CrossRef]
- Antoine, P.; Rousseau, D.D.; Zöller, L.; Lang, A.; Munaut, A.V.; Hatté, C.; Fontugne, M. High resolution record of the last interglacial-glacial cycle in loess palaeosol sequences of Nussloch (Rhine Valley–Germany). Quat. Int. 2001, 76/77, 211–229. [Google Scholar] [CrossRef]
- Rousseau, D.D.; Zöller, L.; Valet, J.P. Climatic variations in the Upper Pleistocene loess sequence at Achenheim (Alsace, France): Analysis of magnetic susceptibility and thermoluminescence chronology. Quat. Res. 1998, 49, 255–263. [Google Scholar] [CrossRef] [Green Version]
- Rousseau, D.D.; Gerasimenko, N.; Matvviishina, Z.; Kukla, G.J. Late Pleistocene environments of central Ukraine. Quat. Res. 2001, 56, 349–356. [Google Scholar] [CrossRef] [Green Version]
- Rousseau, D.D.; Antoine, P.; Christine, H.; Lang, A. Abrupt millennial climatic changes from Nussloch (Germany) Upper Weichselianeolian records during the last glaciation. Quat. Sci. Rev. 2002, 21, 1577–1582. [Google Scholar] [CrossRef]
- Jary, Z. Periglacial markers within the Late Pleistocene loess–palaeosol sequences in Poland and Western Ukraine. Quat. Int. 2009, 198, 124–135. [Google Scholar] [CrossRef]
- Moine, O.; Rousseau, D.-D.; Antoine, P. The impact of Dansgaard–Oeschger cycles on the loessic environment and malacofauna of Nussloch (Germany) during the Upper Weichselian. Quat. Res. 2008, 70, 91–104. [Google Scholar] [CrossRef]
- Lehmkuhl, F.; Nett, J.J.; Potter, S.; Schulte, P.; Sprafke, T.; Jary, Z.; Antoine, P.; Wacha, L.; Wolf, D.; Zerboni, A.; et al. Loess landscapes of Europe—Mapping, geomorphology, and zonal differentiation. Earth-Sci. Rev. 2021, 215, 103769. [Google Scholar] [CrossRef]
- Kun, Á.; Katona, O.; Sipos, G.; Barta, K. Comparison of Pipette and Laser Diffraction Methods in Determining the Granulometric Content of Fluvial Sediment Samples. J. Environ. Geogr. 2013, 6, 49–54. [Google Scholar] [CrossRef] [Green Version]
- Serban, R.D.; Sipos, G.; Popescu, M.; Urdea, P.; Onaca, A.; Ladányi, Z. Comparative Grain-Size Measurements for Validating Sampling and Pretreatment Techniques in Terms of Solifluction Landforms, Southern Carpathians, Romania. J. Environ. Geogr. 2015, 8, 39–47. [Google Scholar] [CrossRef] [Green Version]
- Sipos, G.; Marković, S.B.; Gavrilov, M.B.; Balla, A.; Filyó, D.; Bartyik, T.; Mészáros, M.; Tóth, O.; van Leeuwen, B.; Lukić, T.; et al. Late Pleistocene and Holocene aeolian activity in the Deliblato Sands, Serbia. Quat. Res. 2022, 107, 113–124. [Google Scholar] [CrossRef]
- Vandenberghe, J.; Roebroeks, W.; Gemke, D. Lithostratigraphy and palaeoenvironment of the Pleistocene deposits at Maastricht-Belvédère, southern Limburg, the Netherlands. Analecta Praehist. Maastricht-BelvÈdËre Stratigr. Palaeoenvironment Archaeol. Middle Late Pleistocenedeposits 1985, 18, 7–18. [Google Scholar]
- Mauz, B.; Bode, T.; Mainz, E.; Blanchard, H.; Hilger, W.; Dikau, R.; Zöller, L. The luminescence dating laboratory at the University of Bonn: Equipment and procedures. Anc. TL 2002, 20, 53–61. [Google Scholar]
- Bøtter-Jensen, L.; Thomsen, K.; Jain, M. Review of optically stimulated luminescence (OSL) instrumental developments for retrospective dosimetry. Radiat. Meas. 2010, 45, 253–257. [Google Scholar] [CrossRef]
- Murray, A.S.; Wintle, A.G. The single aliquot regenerative dose protocol: Potential for improvements in reliability. Radiat. Meas. 2003, 37, 377–381. [Google Scholar] [CrossRef]
- Wintle, A.; Murray, A. A review of quartz optically stimulated luminescence characteristics and their relevance in single-aliquot regeneration dating protocols. Radiat. Meas. 2006, 41, 369–391. [Google Scholar] [CrossRef]
- Duller, G.A.T. Distinguishing quartz and feldspar in single grain luminescence measurements. Radiat. Meas. 2003, 37, 161–165. [Google Scholar] [CrossRef]
- Mauz, B.; Packman, S.; Lang, A. The alpha effectiveness in silt-sized quartz: New data obtained by single and multiple aliquot protocols. Anc. TL 2006, 24, 47–52. [Google Scholar]
- Liritzis, I.; Vafiadou, A.; Zacharias, N.; Polymeris, G.S.; Bednarik, R.G. Advances in surface luminescence dating: New data from selected monuments. Mediterr. Archaeol. Archaeom. 2013, 13, 105–115. [Google Scholar]
- Brennen, G.K.; Caves, C.M.; Jessen, P.S.; Deutsch, I.H. Quantum Logic Gates in Optical Lattices. Phys. Rev. Lett. 1999, 82, 1060–1063. [Google Scholar] [CrossRef] [Green Version]
- Brennan, J.D. Preparation and Entrapment of Fluorescently Labeled Proteins for the Development of Reagentless Optical Biosensors. J. Fluoresc. 1999, 9, 295–312. [Google Scholar] [CrossRef]
- Guérin, G.; Mercier, N.; Adamiec, G. Dose-rate conversion factors: Update. Anc. TL 2011, 29, 5–8. [Google Scholar]
- Prescott, J.; Hutton, J. Cosmic ray contributions to dose rates for luminescence and ESR dating: Large depths and long-term time variations. Radiat. Meas. 1994, 23, 497–500. [Google Scholar] [CrossRef]
- Durcan, J.A.; King, G.E.; Duller, G.A. DRAC: Dose Rate and Age Calculator for trapped charge dating. Quat. Geochronol. 2015, 28, 54–61. [Google Scholar] [CrossRef] [Green Version]
- Liu, T.S. The Loess Deposits of China; Science Press: Beijing, China, 1965. (In Chinese) [Google Scholar]
- Kukla, G. Loess stratigraphy in central China. Quat. Sci. Rev. 1987, 6, 191–219. [Google Scholar] [CrossRef]
- Kukla, G.; An, Z. Loess stratigraphy in Central China. Palaeogeogr. Palaeoclim. Palaeoecol. 1989, 72, 203–225. [Google Scholar] [CrossRef]
- Vandenberghe, J.; Zhisheng, A.; Nugteren, G.; Huayu, L.; Van Huissteden, K. New absolute time scale for the Quaternary climate in the Chinese Loess region by grain-size analysis. Geology 1997, 25, 35–38. [Google Scholar] [CrossRef]
- Bassinot, F.C.; Labeyrie, L.D.; Vincent, E.; Quidelleur, X.; Shackleton, N.J.; Lancelot, Y. The astronomical theory of climate and the age of the Brunhes-Matuyama magnetic reversal. Earth Planet. Sci. Lett. 1994, 126, 91–108. [Google Scholar] [CrossRef]
- Martinson, D.; Pisias, M.G.; Hays, J.D.; Imbrie, J.; Moore, T.C.; Shackleton, N.J. Age dating and the orbitaltheory of ice ages: Development of a high-resolution 0 to300,000-year chronostratigraphy. Quat. Res. 1987, 27, 1–30. [Google Scholar] [CrossRef] [Green Version]
- Heller, F.; Evans, M.E. Loess magnetism. Rev. Geophys. 1995, 33, 211–240. [Google Scholar] [CrossRef]
- Maher, B.A. Magnetic properties of modern soils and Quaternary loessicpaleosols: Paleoclimatic implications. Palaeogeogr. Palaeoclimatol. Palaeoecol. 1998, 137, 25–54. [Google Scholar] [CrossRef] [Green Version]
- Heller, F.; Liu, T.S. Paleoclimatic and sedimentary history from magnetic susceptibility of loess in China. Geophys. Res. Lett. 1986, 13, 1169–1172. [Google Scholar] [CrossRef]
- Maher, B.A.; Thompson, R. Mineral magnetic record of the Chinese loess and paleosols. Geology 1991, 19, 3–6. [Google Scholar] [CrossRef]
- Perić, Z.M.; Stevens, T.; Obreht, I.; Hambach, U.; Lehmkuhl, F.; Marković, S.B. Detailed luminescence dating of dust mass accumulation rates over the last two glacial-interglacial cycles from the Irig loess-palaeosol sequence, Carpathian Basin. Glob. Planet. Change 2022, 215, 103895. [Google Scholar] [CrossRef]
- Schmidt, E.D.; Machalett, B.; Marković, S.B.; Tsukamoto, S.; Frechen, M. Luminescence chronology of the upper part of the Stari Slankamen loess sequence (Vojvodina, Serbia). Quat. Geochronol. 2010, 5, 137–142. [Google Scholar] [CrossRef]
- Murray, A.S.; Schmidt, E.D.; Stevens, T.; Buylaert, J.P.; Marković, S.B.; Tsukamoto, S.; Frechen, M. Dating Middle Pleistocene loess from StariSlankamen (Vojvodina, Serbia)—Limitations imposed by the saturation behaviour of an elevated temperature IRSL signal. Catena 2014, 117, 34–42. [Google Scholar] [CrossRef]
- Ludwig, P.; Gavrilov, M.B.; Marković, S.B.; Ujvari, G.; Lehmkuhl, F. Simulated regional dust cycle in the Carpathian Basin and the Adriatic Sea region during the Last Glacial Maximum. Quat. Int. 2021, 581–582, 114–127. [Google Scholar] [CrossRef]
- Fuchs, M.; Rousseau, D.D.; Antoine, P.; Hatté, C.; Gauthier, C.; Marković, S.; Zoeller, L. Chronology of the last climatic cycle (Upper Pleistocene) of the Surduk loess sequence, Vojvodina, Serbia. Boreas 2008, 37, 66–73. [Google Scholar] [CrossRef]
- Marković, S.B.; Hambach, U.; Stevens, T.; Kukla, G.J.; Heller, F.; William, D.; McCoy, W.D.; Oches, E.A.; Buggle, B.; Zöller, L. The last million years recorded at the Stari Slankamen loess-palaeosol sequence: Revised chronostratigraphy and long-term environmental trends. Quat. Sci. Rev. 2011, 30, 1142–1154. [Google Scholar] [CrossRef]
- Marković, S.B.; Hambach, U.; Catto, N.; Jovanović, M.; Buggle, B.; Machalett, B.; Zöller, L.; Glaser, B.; Frechen, M. The middle and late Pleistocene loess-paleosol sequences at Batajanica, Vojvodina, Serbia. Quat. Int. 2009, 198, 255–266. [Google Scholar] [CrossRef]
- Marković, S.B.; Hambach, U.; Jovanović, M.; Stevens, T.; O’Hara-Dhand, K.; Basarin, B.; Smalley, I.J.; Buggle, B.; Zech, M.; Svirčev, Z.; et al. Loess in Vojvodina region (Northern Serbia): The missing link between European and Asian Pleistocene environments. Neth. J. Geosci. 2012, 91, 173–188. [Google Scholar] [CrossRef]
- Lisiecki, L.E.; Raymo, M.E. A Pliocene-Pleistocene stack of 57 globally distributed benthic δ 18O records. Paleoceanography 2005, 20, PA1003. [Google Scholar] [CrossRef]
- Bokhorst, M.P.; Vandenberghe, J.; Sümegi, P.; Łanczont, M.; Gerasimenko, N.P.; Matviishina, Z.N.; Marković, S.B.; Frechen, M. Atmospheric circulation patterns in central and eastern Europe during the Weichselian Pleniglacial inferred from loess grain-size records. Quat. Int. 2011, 234, 62–74. [Google Scholar] [CrossRef]
- Stevens, T.; Sechi, D.; Bradák, B.; Orbe, R.; Baykal, Y.; Cossu, G.; Tziavaras, C.; Andreucci, S.; Pascucci, V. Abrupt last glacial dust fall over southeast England associated with dynamics of the British-Irish ice sheet. Quat. Sci. Rev. 2020, 250, 106641. [Google Scholar] [CrossRef]
- Gavrilov, M.B.; Radaković, M.G.; Sipos, G.; Mezősi, G.; Gavrilov, G.; Lukić, T.; Basarin, B.; Benyhe, B.; Fiala, K.; Kozák, P.; et al. Aridity in the Central and Southern Pannonian Basin. Atmosphere 2020, 11, 1269. [Google Scholar] [CrossRef]
- Sümegi, P.; Krolopp, E. Quatermalacological analysis for modeling of the Upper Weichselianpalaeoenvironmental changes in the Carpathian Basin. Quat. Int. 2002, 91, 53–63. [Google Scholar] [CrossRef]
- Molnár, D.; Sümegi, P.; Fekete, I.; Makó, L.; Sümegi, B.P. Radiocarbon dated malacological records of two Late Pleistocene loess-paleosol sequences from SW-Hungary: Paleoecological inferences. Quat. Int. 2019, 504, 108–117. [Google Scholar] [CrossRef]
- Sümegi, P.; Gulyás, S.; Molnár, D.; Bozsó, G.; Fekete, I.; Makó, L.; Cseh, P.; Molnár, M.; Sümegi, B.P.; Almond, P.; et al. New chronology and extended palaeoenvironmental data to the 1975 loess profile of Madaras brickyard, South Hungary. J. Quat. Sci. 2021, 36, 1364–1381. [Google Scholar] [CrossRef]
- Sümegi, P.; Molnár, D.; Gulyás, S.; Stevens, T.; Makó, L.; Cseh, P.; Molnár, M.; Fitzsimmons, K.; Nett, J.J.; Hlavatskyi, D.; et al. Comparison of High-Resolution 14C and Luminescence-Based Chronologies of the MIS 2 Madaras Loess/Paleosol Sequence, Hungary: Implications for Chronological Studies. Quaternary 2022, 5, 47. [Google Scholar] [CrossRef]
- Sümegi, P.; Molnár, D.; Gulyás, S.; Náfrádi, K.; Sümegi, B.P.; Törőcsik, T.; Persaits, G.; Molnár, M.; Vandenberghe, J.; Zhou, L. High-resolution proxy record of the environmental response to climatic variations during transition MIS3/MIS2 and MIS2 in Central Europe: The loess-paleosol sequence of Katymár brickyard (Hungary). Quat. Int. 2019, 504, 40–55. [Google Scholar] [CrossRef]


| Unit | Thickness (cm) | Depth (cm) | Description |
|---|---|---|---|
| L2 | 75 | 1000–925 | Porous pale yellow (5YR 4/3, 5/4) typical loess with many humic infiltrations and carbonate concretions (ø 1–3 cm), intensively bioturbated. |
| S1 | 155 | 925–890 | A basal transitional AB horizon has granular and partly platy structure (10YR 6/2–4). |
| 890–855 | Ah1 lower humic (10YR 6/3, 4/2) horizon with granular structure, carbonate concretions (ø 1–2 cm), and krotovinas. | ||
| 855–820 | Upper lighter Ah2 (10YR 5/3–4) with carbonate concretions (ø 1–2) has typical granular structure. | ||
| 820–770 | The upper mollic A horizon with brighter color (10YR 6/2–4) and many carbonate pseudomycelia. | ||
| L1 | 680 | 770–515 | Loess subunit L1LL2 is a porous typical loess (5YR 7/3, 5/4) intercalated by sandy layers in some parts with krotovinas. |
| 515–450 | PaleosolL1SS1 is a fossil A horizon (10YR 4/2, 6/3) with intensive granular structure partly disturbed by krotovinas. | ||
| 450–90 | Loess subunit L1LL1 I is a typical porous loess (10YR 7/4, 5/3) intercalated with two weakly developed initial paleosols, L1LL1SSS2 and L1LL1SSS1. | ||
| S0 | 90 | 90–75 | Ck with many soft spherical carbonate nodules (ø 1–5 cm) intensively bioturbated with humic infiltrations and krotovinas. |
| 75–60 | Transitional AC horizon is very porous with many carbonate pseudomycelia. | ||
| 60–0 | Typical strongly developed granular Ah horizon (10YR 6/3, 4/4). |
| Scheme | Depth (cm) | WC (%) | U (ppm) | Th (ppm) | K (%) | α-Values | (Gy.ka−1) | De (Gy) | Age (ka) |
|---|---|---|---|---|---|---|---|---|---|
| 1151 | 110 | 10.0 ± 2.0 | 2.80 ± 0.03 | 8.48 ± 0.15 | 1.23 ± 0.05 | 0.055 ± 0.003 | 3.00 ± 0.07 | 47.9 ± 0.7 | 15.9 ± 0.5 |
| 1147 | 225 | 12.5 ± 2.5 | 2.95 ± 0.03 | 8.70 ± 0.16 | 1.30 ± 0.05 | 0.040 ± 0.004 | 2.90 ± 0.07 | 57.7 ± 1.7 | 19.9 ± 0.8 |
| 1144 | 325 | 12.5 ± 2.5 | 2.83 ± 0.03 | 8.58 ± 0.15 | 1.27 ± 0.05 | 0.036 ± 0.003 | 2.78 ± 0.07 | 65.9 ± 0.8 | 23.8 ± 0.7 |
| 1141 | 435 | 12.5 ± 2.5 | 3.24 ± 0.04 | 10.57 ± 0.18 | 1.61 ± 0.06 | 0.030 ± 0.002 | 3.20 ± 0.08 | 86.1 ± 1.0 | 26.9 ± 0.7 |
| 1138 | 610 | 12.5 ± 2.5 | 2.66 ± 0.03 | 9.22 ± 0.17 | 1.29 ± 0.05 | 0.029 ± 0.002 | 2.64 ± 0.06 | 126.4 ± 3.0 | 47.8 ± 1.6 |
Disclaimer/Publisher’s Note: The statements, opinions and data contained in all publications are solely those of the individual author(s) and contributor(s) and not of MDPI and/or the editor(s). MDPI and/or the editor(s) disclaim responsibility for any injury to people or property resulting from any ideas, methods, instructions or products referred to in the content. |
© 2023 by the authors. Licensee MDPI, Basel, Switzerland. This article is an open access article distributed under the terms and conditions of the Creative Commons Attribution (CC BY) license (https://creativecommons.org/licenses/by/4.0/).
Share and Cite
Marković, S.B.; Vandenberghe, J.; Perić, Z.M.; Filyó, D.; Bartyik, T.; Radaković, M.G.; Hao, Q.; Marković, R.S.; Lukić, T.; Tomić, N.; et al. Local Differentiation in the Loess Deposition as a Function of Dust Source: Key Study Novo Orahovo Loess Paleosol Sequence (Vojvodina, Serbia). Quaternary 2023, 6, 23. https://doi.org/10.3390/quat6010023
Marković SB, Vandenberghe J, Perić ZM, Filyó D, Bartyik T, Radaković MG, Hao Q, Marković RS, Lukić T, Tomić N, et al. Local Differentiation in the Loess Deposition as a Function of Dust Source: Key Study Novo Orahovo Loess Paleosol Sequence (Vojvodina, Serbia). Quaternary. 2023; 6(1):23. https://doi.org/10.3390/quat6010023
Chicago/Turabian StyleMarković, Slobodan B., Jef Vandenberghe, Zoran M. Perić, Dávid Filyó, Tamás Bartyik, Milica G. Radaković, Qingzhen Hao, Rastko S. Marković, Tin Lukić, Nemanja Tomić, and et al. 2023. "Local Differentiation in the Loess Deposition as a Function of Dust Source: Key Study Novo Orahovo Loess Paleosol Sequence (Vojvodina, Serbia)" Quaternary 6, no. 1: 23. https://doi.org/10.3390/quat6010023