Article

Vegetation History and Estuarine Ecology of the Texas Gulf Coastal Plain in Relation to Climate and Sea-Level Changes According to Three Pollen Cores

Department of Archaeology, Durham University, Durham DH1 3LE, UK
Quaternary 2023, 6(1), 19; https://doi.org/10.3390/quat6010019
Submission received: 13 October 2022 / Revised: 27 February 2023 / Accepted: 1 March 2023 / Published: 9 March 2023
(This article belongs to the Special Issue Climate Change and Vegetation Evolution during the Holocene)

Abstract

:
The vegetation history of the Texas Gulf Coastal Plain in the Holocene is considered according to pollen evidence from three coring sites where both terrestrial and marine ecology are reconstructed. These pollen sites record oscillations in the limit of the Southeastern US Forest zone in relation to climate changes, with a major, southward migration of the forest limit and expansion of the range limit of Betula nigra being recorded in the 6th millennium BP and a northward migration in the 4th millennium BP. The appearance of Rhizophora pollen also indicates increased tropical influence in the Middle Holocene. Moreover, changes in the salinity profiles of estuaries are reconstructed in relation to broader coastal environmental changes, such as sea-level oscillations and the formation of barrier islands, with a major sea-level transgression phase being recorded in the 4th millennium BP and still-stand conditions after the 3rd millennium BP. These vegetation changes are finally compared to occupational evidence of prehistoric humans in the Central Texas Gulf Coastal Plain region in relation to ecological factors. Here, human occupation of the coastal zone is correlated with afforestation, the proliferation of pecan and the emergence of low-salinity estuaries.

1. Introduction

1.1. Ecological Overview

In this study, pollen data are used to reconstruct vegetation in the Central and South Texas Gulf Coast Plain (hereafter, TGCP) with the aim of defining floral changes in relation to climate and sea-level changes. Importantly, the marsh and riparian verge flora in this region form a critical environment for a variety of fauna, including fish [1] and avifauna [2]. Moreover, the sustainability of these coastal freshwater (to slightly brackish) marshes is ultimately dependent on inputs of fresh water from rivers and the sheltering of marshlands from hyper-salinity and marine influence (e.g., with barrier island formation).
For human populations, the estuaries form a locus for concentrated food resources in addition to floodplains of entrant rivers. Within the latter, inland zone, the main biogeographic division encountered is the forest–prairie ecotone, whose position is determined by climate conditions, fire history [3] and, to a limited extent, human influences on the environment [4]. While prairies provide ecologies for grazing animals, the highest biomass and most abundant food resources for herbivores as well as humans are found in forest environments, with the highest concentrations of food resources being found in nut-mast trees, including different oak and hickory species, with maximum caloric production (of nut masts) being encountered in the case of pecan (Carya illinoiensis) [5,6]. In this study, both coastal and inland vegetation are considered, with an assessment of environmental factors, focusing on (1) climate and (2) sea-level history during the Holocene. Vegetation impacts of humans, by fire setting and then fire suppression, are recoded during the last 500 years in the region, emerging from bison hunting and early farming practices [7].

1.2. Application of Palynology to Climate and Sea-Level Studies

In terms of biogeography, the Guadalupe River valley constitutes an important ecotone at the southern limit of the Southeastern United States oak–pine–hickory mixtures. This forest limit is controlled by precipitation differences across a significant (NE-to-SW) gradient, while temperature differences are minor within the TGCP. Pollen results of this study are used to reconstruct changes in this ecotone of the TGCP based upon tree pollen levels. Here, discussion is limited to two categories of analysis, including range data of trees that have critical climatic requirements, such as precipitation requirements, for example, the Betulaceae [8,9,10,11,12]. Secondly, absolute climatic requirements for tropical plant species remote to the Modern TGCP are used to establish parameters such as past temperature conditions. In this study, the presence of fully tropical, frost-intolerant species, such as red mangrove (Rhizophora mangle) [13], is important, and a use of analogs is made to establish the presence of mangroves. These analogs use modern land-surface samples proximal to living mangroves, and, notably, these inspect-pollinated taxa are expected to produce minimal pollen unless communities are well-established under optimal temperature conditions [14,15].
Coastal pollen data are used to reconstruct effects of sea-level changes on the ecology of coastal marshes. Most important for pollen analysis is the distinction between halophytic plants (salt-marsh flora) promoted by sea-level transgressions, and, conversely, freshwater or slightly brackish plants that are promoted by still stands or recessions of sea level [16,17,18,19].

1.3. Study Site Overview

In this work, the sites chosen for study derived pollen from both alluvial and estuarine sources and provided pilot pollen data from submergent deposits of the coastal zone. These coring sites included the alluvial site of Core P1 at Buckeye Knoll (hereafter, BK) in the Lower Guadalupe River valley in Victoria County, the estuarine site of Core 2 at Swan Lake (hereafter, SL) in Aransas County and the marine site of Nueces Bay (hereafter, NB) in Nueces County (Figure 1). These sites differ, moreover, from many near-coastal studies in the Mississippi Delta region [20,21,22] in that pollen cores are situated in localities profoundly influenced by coastal processes (see, however, [23]). Long valley profiles of rivers in proximity to the examined pollen sites range in length from 25 km in the case of the Mission River near the SL site to 370 km in the case of the BK site in the Guadalupe River valley to 500 km in the case of the NB at the entrance of the Nueces River in Nueces Bay.

2. Study Region

2.1. Geography and Climate

The TGCP is the focal region of study (Figure 1 and Table 1), a plain situated along the Western Gulf of Mexico and intersected by multiple river valleys, including, most importantly (from north to south), the Brazos River, the Colorado River, the Guadalupe River, the Nueces River and the Rio Grande, with corresponding estuarine and deltaic deposits. Offshore or barrier islands are important in the regional geography and consist of sand deposited by wave action, providing protective barriers for estuarine marsh environments. The climate in the region is subhumid and subtropical in aspect, with mean annual temperatures approximating 22° to 23° C (in the Rio Grande valley) [12]. A significant precipitation gradient is encountered in the study region. For example, precipitation at the BK site is 97 cm per annum, while precipitation at SL is only 92 cm per annum.

2.2. Flora and Fauna

Vegetation in the study region varies principally according to the precipitation variation in the Guadalupe River region. Thus, climax forests are limited to the Guadalupe River valley and the Colorado and Brazos River valleys, where Quercus spp. (oak, multiple species) and Carya illinoinensis (pecan) are important taxa [24]. Southward of the Guadalupe River valley, Quercus virginiana (live oak) constitutes the main tree or shrub. Finally in the southern aspect of the study region, grasslands and prairies prevail, including, today, many invasive species, such as Bothriochloa ischaemum (King Ranch bluestem, from East Asia). Along the coast, an intermittent growth of Avicennia germaniens (black mangrove) mangle is also encountered in major estuaries of the Rio Grande and the San Antonio–Guadalupe delta. These mangroves occur at the margins of resource-rich estuarine marshes, or else inland, near coastal depressions with brackish water seeps. Their present distribution is limited by Modern land use. In coastal areas without rivers, near-shore conditions are more brackish, and here Spartina spp. (cordgrass) and Salicornia biglovii (glasswort) are typical in coastal salt marshes, while Typha spp. (cattails) and Cyperaceae (sedges) are common in freshwater estuarine marshes. Such marshlands are most extensive in the deltas of rivers, such as the Guadalupe or Brazos Rivers [25].
Migratory bird species inhabiting coastal estuaries are numerous and include Egretta thula (snowy egret) and Rynchops niger (black skimmer). Alligator (Alligator mississippiensis) is also present in protected coastal marshes as well as inland river valleys, such as the Nueces River at Choke Canyon State Park. Important coastal fish species include Sciaenops ocellatus (red fish) and Pogonias cromis (black drum). Shellfish in TGCP estuaries include, most importantly, Rangia cuneata or Gulf wedge clam.

2.3. Quaternary Geology and Associated Vegetation Communities

The morphology of the TGCP is of low relief and geologically consists of Quaternary-age sediments with Holocene fills predominating in the river valleys. Important morphological features relating to Quaternary sea-level changes are notable and include the Deweyville Terrace (as old as Marine Isotope Stage 5). Near-surface deposits of Pleistocene-age Beaumont clay are the major units in coastal areas, overlain in places with Holocene sands derived from barrier islands, for example, the South Texas sand sheet situated behind Big Shell Beach in the middle of Padre Island. Notably, barrier islands formed in the Holocene protect marshes that developed in the deltas of major rivers, for example, above prograding deltaic deposits of the Guadalupe River [19,26].
Relationships between vegetation and geology are also important to note in this regional and historical study. For example, important correlations are observable between the accumulation of sand along the TGCP coast and the growth of sub-xeric arboreal flora, such as Quercus virginiana (live oak). In this case, the extent of Quercus virginiana stands (with elements of bay laurel or Laurus nobilis) on dry and acidic substrates depends on the availability of sediment from sandy barrier islands; thus, the most extensive scrub woodlands of Quercus virginiana are found in the South Texas sand sheet (pers. observation, King Ranch, 2005). Where clay is exposed at the surface (Beaumont formation), scrub vegetation consists of Prosopis (mesquite) with an understory of various Asteraceae spp. in inland areas.

3. Previous Environmental Research in the TGCP and Present Hypothesis Testing

3.1. Regional Climate History

The history of vegetation history research in the TGCP and adjacent regions begins with the palynological work of Larson at the Hershop Bog pollen site in South–Central Texas (Figure 1) [27]. Wetland conditions at the site are the result of seepage from sandstone reservoirs, and, importantly, the bog itself accumulates pollen mostly from the local bog sub-environment, according to its dimensions, after the aerodynamic model of Jacobsen and Bradshaw [28]. Within this site, containing only three radiocarbon dates, important finds of Betula pollen of Late Pleistocene age occur in bottom-set sediments. These finds suggest the use of changes in the range of Betula in the tracking of past Texas climate variability, given the present limit of Betula to high-rainfall regions of Texas today [8]. Also noted is testing work of the author at the pollen site at Palo Alto–Resaca in the Lower Rio Grande valley (Ref. [29], Figure 1), at the southern limits of the TGCP. Here, an assessment for the National Park Service of this site showed low arboreal pollen (tree and shrub pollen or “AP”) in the Middle and Late Holocene (please see the Palo Alto pollen diagram supplemental file). The appearance of Carya (cf. illinoiensis) in a sample dating to the 6th millennium BP is significant at this latitude and indicates relatively mesic conditions at this interval. Conversely, a significant increase in xerophytic pollen is notable in the Late Holocene at Palo Alto, as indicated by a rise in Amaranthaceae pollen levels. Further vegetation history records for the TGCP and adjacent regions are also limited, but of note are data of grass phytoliths studied by Robinson for the Choke Canyon project directed by Tom Hester [30]. Data recovered at archaeological sites in Live Oak and McMullen Counties show two important trends. First is the composition of phytoliths recovered from “Middle Archaic” (4000–3000 BP) sites that contain phytoliths indicating xeric, short-grass flora. Subsequently, “Late Archaic” and “Transitional Archaic” (3000–1500 BP) sites at Choke Canyon contain a different phytolith assemblage that indicates mesic, long-grass flora.
Pan-Holocene studies of terrestrial fauna in the TGCP region are limited to coastal archaeological sites [19], to be discussed in the following section relating to sea-level changes. Regarding terrestrial fauna, the speleological site of Hall’s Cave in Central Texas, a Late Quaternary-age cave formed in Cretaceous limestone and containing Late Pleistocene- and Holocene-age sediments [31] is considered. The faunal studies at Hall’s Cave are unique for the state as a whole and are also considered pertinent to this work due to the near-continuous 13,000-year time depth of sediments in the sequence [32]. Within the strata of this cave examined by Toomey and others at the University of Texas at Austin, climate changes are assessed according to proxy data, and, specifically, climatic characteristics of rodents, including finds of the shrew taxa Notiosorex (desert shrew) and Cryptotis (small-eared shrew), each with desert versus forest distributions in Texas today. Trends noted by Toomey include a rise in Cryptotis in the Early Holocene, then circa 5000 BP, and, finally, from 2500 to 1000 BP, indicating afforestation and mesic conditions relative to today. Importantly, these trends are consistent with phytolith data from Choke Canyon with respect to a reconstruction of mesic conditions after 3000 BP. Combined regional proxy climate data thus may be characterized as a succession of provisional xeric and mesic phases that can also be tested in relation to pollen data.
In this study, arboreal pollen (hereafter, AP, calculated as a percentage of total land pollen or TLP, excluding Pinus) is considered, with higher AP values indicating mesic conditions of higher precipitation and lower drought frequency, with lower AP indicating xeric conditions of greater moisture stress on plant communities. Relative climate changes assessed according to AP can also be employed to reconstruct past forest vegetation using pollen of modern samples from different vegetation zones. Such surface samples provide analogs for assessing afforestation levels at different localities within the TGCP region in the past. Further, special attention is paid to Carya in pollen diagrams, as this nut-mast tree is an important measure of woodland subsistence potential after 3000 BP (see Table 1). Notably, Texas archaeologists, including Brown [5] and Hall [6], link the development of cemeteries and increased settlement density post-3000 BP to increased exploitation of nut-mast trees, including a variety of oak, hickory and pecan species providing subsistence to human populations. Expected results (hypothesis testing) of stratigraphic pollen analyses are thus noted in column three in relation to four provisionally defined phases (“Climate model”) characterized as xeric versus mesic in aspect. The Early Holocene mesic phase is only provisionally defined according to faunal data (Cryptotis at Hall’s Cave). Subsequent climate phases are defined according to data from at least two sites.

3.2. Regional Sea-Level History

Past sea-level changes have also been a focus of study in the Western Gulf of Mexico region and include data of (1) sedimentary geology, (2) foraminiferal studies and (3) settlement archaeology. The geological work here includes sedimentation studies (based on offshore coring data) of Frazier from the continental shelf [33]. In work, sedimentary episodes on the continental shelf are interpreted in terms of still-stand conditions and increased discharge of fine sediments offshore, with a most significant phase of sedimentation post-dating 3000 BP. A second geological data point was identified by Mike Blum, in the morphological remains of a raised beach on Copano Bay, dated by foraminifera to circa 7700 BP [34]. This deposit, indicating a sea-level high stand in the earlier Holocene, is importantly proximal to the SL pollen site examined in this work. Sea-level changes at Copano Bare are also assessed according to foraminiferal studies at the Port Bay Marsh, in sediment cores examined by Harry Williams of the University of North Texas [35]. These studies reconstruct a sea-level still stand 3000 to 1000 BP, with resumption of sea-level rise after 1000 BP according to the benthic requirements of foraminifera encountered in the sediment core [35]. Notably, a single basal sample suggests a possible lowering of sea level around 5800 BP, but this is not considered conclusive by Williams [35]. Most recent geological work in the region includes the examination of multiple sediment cores in the Nueces River Delta by Rice and others for the National Science Foundation [36]. This major project defines multiple “retreats” of the Nueces River Delta, attributed to sea-level rise and lowered sedimentation. The most significant “retreats” of the delta date to (1) 6600 and (2) 3800 BP (Table 2).
Finally, archaeological settlement patterns between NB and BK in the TGCP region (Figure 1) studied by Robert Ricklis of the University of Texas at Austin for the National Science Foundation [19] are considered. Within the region, large shell middens and other human occupation sites have been linked to freshwater estuarine conditions according to salinity indicative values of shell eco-facts and dated to two periods. An initial, low-density settlement period has been dated by Ricklis to the earlier part of the Middle (6000–4500 BP, Port Bay marsh base). Following a hiatus of coastal occupation (4500–3000 BP, retreat of Nueces River Delta defined by Rice [35]), a post-3000 BP settlement phase consisting of a large number of intensively occupied sites was then identified [37,38] (Port Bay marsh still stand defined by Williams [35]). Significantly, after 2000 BP, fish otoliths (Sciaenops ocellatus and Pogonias cromis) become numerous at shell midden sites in the TGCP [19], a trend linked by Ricklis to the development of barrier islands and thus sheltered breeding grounds for these aquatic faunas. These archaeological remains are ascribed to the activities of small bands of hunters and fishers, but during 3000 to 2000 BP, mortuary sites, possibly with greater human population densities, become common in the northern parts of the Lower Guadalupe and Brazos River valleys [38,39]. Conversely, a relative poverty of human settlement remains in the coastal zone is pronounced during certain periods, particularly 4500 to 3000 BP, which is associated with a hiatus in sedimentation on the continental shelf due to sea-level rise [33]. Combined proxy sea-level data thus may be characterized as a succession of sea-level rises and still stands hypothetically defined in four phases as follows (Table 2):
This four-phase model (“Sea-level model”) is tested through stratigraphic pollen data, with expected pollen responses noted in column three at sites (BK, SL and NB) also proximal to embayments, as described below (Section 4).

4. Materials: Pollen Site Sediment Cores

Pollen sites reported on here are influenced by coastal marsh flora in terms of their local settings and, moreover, crosscut the present forest limit of the oak–pine–hickory/pecan mixtures on the TGCP, this ecotone being determined by climate conditions. As such, pollen sites are suitable for testing both climate and sea-level models for the TGCP (Table 1 and Table 2). These sites are geo-located, with environmental contexts described as follows:
  • Buckeye Knoll (BK), Lower Guadalupe River valley, Central Texas Coast slack-water paleo-channel deposit, 28°39′16.4″ N, 96°57′40.0″ W (7 m a above msl); sediments were retrieved in a 4.8 m core via the Geo-probe 54 LT operated by Glenn Doran. The site is situated in a within the pre-Modern floodplain of the main river channel below the Holocene terrace of the Guadalupe River, approximately 500 m distant from Green Lake, an earlier Holocene embayment [39]. Modern lobes of the Guadalupe River are situated east of Green Lake. Earliest sediment core strata are thus in close proximity to the coast at the time of sedimentation. Present vegetation consists of mixed oak–pecan woodland. The sediment core is named after the adjacent Buckeye Knoll archaeological site (itself containing two further terrestrial sediment cores, “P2” and “P3”), designated during archaeological site mitigation for the US Army COE Galveston District.
  • Swan Lake (SL), Copano Bay, Central Texas Coast estuarine deposit in incised Pleistocene valley, 28°3′10.2″ N, 97°9′49.9″ W (0 m above msl); sediments were retrieved in a 5.45 m core via the Geo-probe 54 LT. The site is accessed using a corduroy track built for the purpose. Sandy sediments below 5.45 m are poorly consolidated and have not been retrieved for detailed study. The sediment core is situated in an estuarine marsh consisting of Typha domingensis (cattail) and Spartina spartinae (cordgrass) approximately 2 km southeast of the entrance of the Mission River. The position of Copano Bay was stable in the Holocene [26]. The marsh sediment core is named after the adjacent Swan Lake archaeological site (itself containing one terrestrial sediment core, “S1”), designated by site records on file at the Texas Archeological Research Lab, University of Texas at Austin.
  • Nueces Bay (NB), near Nueces River delta, Central Texas Coast pro-grading deltaic deposit, 27°50′19.3″ N, 97°29′11.5″ W (2 m below msl); sediments were retrieved in an 8.0 m vibracore. The site was accessed by a boat operated by Mike Blum and Robert Ricklis. This near-shore site is below sea level (ca. −2 m) but in close proximity (~50 m) to heavily disturbed shoreline vegetation consisting of Salicornia spp., Asteraceae and Poaceae. The position of Nueces Bay was stable in the Holocene [40], although changes in the position of the Nueces River Delta have been reconstructed according to sea-level and mean discharge factors during the Holocene [36]. The site is named after its project designation by Mike Blum and Robert Ricklis (for NSF grant no. SBR-942-3650).
Pollen site deposits described here (Table 3, Table 4 and Table 5) consist of reduced, largely mineragenic sediments in sub-aqueous settings, where pollen is preserved by virtue of a reducing environment and concentrated in low-energy settings [40]. The sediments are described according to Troels-Smith [41] and discussed in this section. First, at BK, sediments are based in Beaumont (Pleistocene) clay which is deeply weathered. Unconformably above the Beaumont, sandy strata occur with calcium carbonate nodules of possible marine biota origin suggestive of a near-coastal context prior to the progradation of the Guadalupe River beyond the Green Lake (earlier Holocene) embayment. The main (sandy silt) layer of the core whence most pollen samples originate is completely reduced, and an intermittent presence of Rangia fragments suggest a freshwater or marginally brackish floodplain environment. An increased terrestrial influence in the sedimentation regime of the core site is then suggested by oxidation evident in top-set aspects (90–130 cm, not sampled) and archaeological artifacts at the edge of a Late Archaic occupation of the Buckeye Knoll site. The latter include burned clay from hearths.
Swan Lake sediments are represented by intervals of sand and fine sedimentation. A massive basal sand deposit, only partly retrieved by the Geoprobe 54 LT, extends to a minimum depth of six meters (or a minimum thickness of 75 cm). This basal deposit might be interpreted as an earlier Holocene beach remnant. Three subsequent sand strata (20–41 cm thick) then exhibit sharply defined lower boundaries (limus score: 4/4 [41]) and might be interpreted as storm splays with a shoreward and longshore reworking of barrier island sands. Important for the question of pollen preservation/degradation, redox features have, furthermore, been noted between 285 and 81 cm (oxidation). Moreover, a possible paleosol is evident (82–53 cm, with clay illuviation), representing a period of reduced marine influence. It is possible that increased terrestrial influence led to diagenetic oxidation in underlying sediments to a depth of 285 cm. Finally, a relatively uniform sequence, dominated by light-gray reduced fines with variable sandy inputs, was observed at NB. This final sequence contains two dense layers of clam, each constituted of a different species: Rangia flexuosa in the lower layer and R. cuneata in the upper aspect, which have been interpreted as shellfish beds [42].

5. Methods

5.1. Pollen Sampling of Sediment Cores

Work at the alluvial pollen sites reported here was guided by practical experience at multiple sites of this type in the Old and New World, beginning with work on sediments of interdigitated organic and mineragenic aspect in the chernozem lowlands [43]. These sites provided a basis for further site selection and site analysis in major projects, for example, among sites in North Mexico (Refs. [44,45,46], University of Texas Laguna Project) and East Texas (Refs. [47,48], Texas Department of Transport, Environmental Affairs Division mitigation projects). This research has shown the potential of slack-water alluvial sites with fine sedimentation for pollen analysis. In this work, pollen sampling avoided coarse sands (pollen concentration potential low) at NB and oxidized deposits (pollen preservation potential low) at SL and BK. Further, at NB, aspects of the core were not sampled due to the presence of dense Rangia shell strata that provide insufficient sediment for laboratory work.

5.2. Analog Methods in the Reconstruction of Tropical Conditions

The potential growth of mangrove trees (mangle) at the examined pollen sites was established through the use of pollen analogs, with the ultimate aim of reconstructing relative tropical influence at examined pollen sites. These mangrove tree analogs included two sites where stands of Avicennia (cf. germinans) native to Texas were found and two sites consisting of stands of Rhizophora (cf. mangle) native to tropical Mexico and Florida. Importantly, Rhizophora mangle is excluded from the TGCP today due to climatic requirements, including the poor frost-resistance of this species. The actual presence of these taxa, found in sediment cores in the past vegetation of the study region, was ascertained by sediment surface samples collected from present stands. From the perspective of climate reconstruction, a presence of Rhizophora indicates a more tropical regime and, inferably, a major shift in the boundary of the Intertropical Convergence Zone in the past, with the exclusion of freezing conditions in winter weather (patterns driven by jet-stream drag of Arctic fronts [49]), with a high sensitivity to temperature conditions in terms of its pollen response [14]. Surface analogs from four mangrove sites in South Texas, North Mexico and Central Florida were sampled using ten pinch samples of 1 cc volume separated by a minimum distance of 1 m. Mangrove pollen analog sites from widely separated areas were chosen according to the northern distribution limits of the main two genera (Rhizophora and Avicennia):
  • Rhizophora Site 1, La Pesca, Tamaulipas State, Mexico, Gulf of Mexico Coast, 23°46′4.3″ N 97°44′21.3″ W (0 m amsl). The site consists of a one-hectare red mangrove mangle in coastal shallows north of La Pesca accessed during a special-purpose trip.
  • Rhizophora Site 2, Orchid Island, Atlantic Coast, Florida, 27°51′30.2″ N 80°27′33.9″ W (0 m amsl). The site consists of a multi-hectare (10 + hectare) red mangrove mangle in the Indian River estuary south of Orchid Island. The center of this red mangrove stand was sampled in a one-hectare area accessed during a special-purpose trip.
  • Avicennia Site 1, Laguna Atascosa Wildlife Refuge, Texas, Gulf of Mexico Coast, 26°12′13.9″ N 97°24′44.7″ W (2 m amsl). The site consists of a ten-hectare black mangrove mangle in a coastal depression in the Laguna Atascosa Wildlife Refuge. The outer edge of this black mangrove stand was sampled.
  • Avicennia Site 2, Laguna Atascosa Wildlife Refuge, Texas, 26°12′17.6″ N 97°24′48.8″ W (2 m amsl). The site consists of a ten-hectare black mangrove mangle in a coastal depression in the Laguna Atascosa Wildlife Refuge. The center of this black mangrove stand was sampled.

5.3. Reconstructing Tree-Limit Oscillations and Precipitation Changes

Towards the testing of the climate conceptual model (Table 1), relative (mesic vs. xeric) climate conditions were assessed according to multiple lines of evidence, including changes in the southern limit of the Southeast US Forests (oak–pine–hickory/pecan mixtures) in the TGCP. Pollen data from three sites presented in detail here, as well as supplemental data (please see the Palo Alto pollen diagram supplemental file) from the southern limit of the TGCP, provided initial pollen data for reconstructing levels of afforestation along a 400 km coastal transect over the last 8000 years. Analogs comparing actual afforestation levels to AP used (Modern) near-surface or top-set samples in sediment cores with the aim of defining prairies and forests in pre-Modern pollen spectra. Modern, top-set spectra were thus used as analogs for past vegetation reconstruction and established a statistical baseline for defining the forest–prairie ecotone based upon ideal vegetation types. The types considered included “prairie” (consisting of interfluves dominated by grasses and forbs and alluvial woodlands mostly restricted to riparian verges) and forest (with partially wooded interfluves near the ecotone and extensive alluvial woodlands on the floodplains of major rivers). Here, the minimal arboreal threshold for “forest” vegetation was defined palynologically by the lower boundary of the AP percentage 95% confidence interval at the forest vegetation type site at BK (AP%s above this threshold thus indicate forest), while the maximal arboreal threshold for “prairie” vegetation was defined by the upper boundary of the AP percentage 95% confidence interval at the forest vegetation type sites close to the present ecotone (NB and SL; see Section 6.2.1, Section 6.2.2 and Section 6.2.3). The ecotone, which is a transition as opposed to a sharp biogeographic boundary, itself lies between the BK and SL sites, and AP% values in between the limits described above were considered indeterminate, with the default assumption being made that Modern-type vegetation was present. Past vegetation changes were reconstructed according to vegetation at three reported pollen sites (and the Palo Alto pollen site in the supplemental data). This forest-limit reconstruction defined as “mesic” any southward advance of the forest limit beyond the Guadalupe River valley. A northward forest migration beyond the Guadalupe River valley (i.e., prairie environment reconstructed at all sites) defined a “xeric” interval. In the calculation of AP percentages, long-distance transport types, particularly Pinus, were excluded from the AP sub-total.
The reconstruction of precipitation changes in relation to forest-limit changes focused on climatically sensitive taxa, such as Betula. In this work, the pollen percentage values of B. nigra [9], in particular, were considered—B. nigra being a tree whose precipitation requirements are of value in climate reconstruction in the regional context, thriving in East Texas today on relatively shaded and wet floodplains [10,11,12]. Analyses of Betula nigra pollen recorded in examined pollen sites [9] focused on establishing a range presence in the TGCP according to sustained (2+ consecutive samples) and significant (2+% TLP) values. This standard was intended to exclude statistical outliers, including occasional long-distance transport of pollen grains and short-term, localized growth of this tree beyond its main range. As noted above (Section 3), Betula exhibited a major extension of its range in the Late Pleistocene and Early Holocene in South–Central Texas, while Modern precipitation variability in the TGCP itself is significant, with a steep gradient extending into Eastern Texas (see Section 2, above). In this study, a key reference point for climate reconstruction was provided by precipitation levels observed at the western range limit of B. nigra in Eastern Texas (~116 cm per annum [8,12]). Beyond this limit, seasonal moisture stress in river-valley floodplains prevents its growth, and it is presently excluded from the Colorado and Guadalupe River valleys.

5.4. Relative Sea-Level Changes

The examined sites in the present study region (see Section 2) are situated in proximity to estuarine environments that are potentially affected by sea-level changes. These are classified as salt marshes and freshwater marshes, the biota being determined by the salinity gradients of their constituent water bodies. In this study, a low biomass salt-marsh flora was defined, including most importantly Amaranthaceae and Bataceae, plant families tolerant of salty soils and saline wet areas. Sea-level transgressions promote the formation of these salt-marsh taxa. Conversely, stable sea level (still stands) allows delta sedimentation to attain equilibrium with base sea level, promoting also the formation of shallows in prograding deltaic regions and embayments. These shallows are prerequisites for the development of a high-biomass freshwater marsh flora. This freshwater marsh biota includes plant taxa represented by pollen types including Nymphaea, Potomogeton, Polygonum hydropiper and Typha spp. Importantly, these taxa include aquatic and insect-pollinated species that are poorly dispersed and thus under-represented in pollen diagrams.

5.5. Pollen Lab Techniques

Ten-cubic-centimeter sample volumes were employed with reduction to pollen facilitated by a multi-stage process. Following deflocculation via 5% sodium hexa-metaphosphate filtering and filtration through 177-micron and 8-micron (Nitex) screens, respectively, samples were treated with HCL and KOH and 49% hot HF. At the HCL stage, a Lycopodium tablet was also added for the calculation of pollen concentration. Acetolysis was limited to less than 60 s (with acetic acid). Samples were dyed in saffranine and tetra-butanol and placed in 2000-viscosity silicone oil for purposes of light microscopic work [50].

5.6. Methods of Interpretation

Pollen diagrams were drawn using the TILIA program. Zonation was performed using a stratigraphically constrained incremental sum of squares cluster analysis according to percentage data, facilitated by the CONISS program of Eric Grimm [51]. This measures the dissimilarity of sample clusters in terms of Edwards and Cavalli-Sforza’s chord distance. A uniform chord distance is chosen in each diagram for grouping of pollen spectra into stratigraphic zones. Pollen taxa are grouped according to the divisions of trees and shrubs on the one hand and herbaceous pollen on the other.
In terms of inferring land areas represented by the analyzed pollen data, the examined sites were divided into inland and coastal groups that may vary in aspect through time according to river sedimentation and delta progradation, influencing the representative flora in different geographic zones. Differential taphonomic characteristics may also be inferred according to geographic context itself. For example, a prevalence of air vs. water transport of pollen grains might be determined by the position of the sediment core relative to river entrants or position within a floodplain, where an alluvial situation, in particular, favors water transport. In estuaries at a remove from river entrants, air transport of pollen generally prevails, and at SL a significant component of sea transport of floating saccate grains, such as Pinus grains, into tidally influenced deposits might also be expected (Table 6). NB, a fully submergent site, is less subject to major influxes of floating saccate pollen grains.

5.7. Dating Methods

For chronological control, nine samples (~10 cc) of bulk sediments were dated via AMS 238 (and one by standard radiocarbon in the case of Beta 164200). The humic acids derived from such bulk sediments originate principally from shallow A-horizons of regional soils. Bulk sediments used in dating were screened for rhizomous, indeterminate wood and indeterminate molluscan or gastropod remains in a 177-micron brass screen from cleaned, one-meter-long sleeved sediment core segments. Rhizomous and indeterminate wood were removed with a view to potentially erroneous dating caused by penetrated tree or herb roots. Indeterminate molluscan or gastropod remains were not considered for dating, as their biotic origins, potentially affecting the dating methodology, were unknown. Such pre-processed sediments were mailed to the Beta Analytic Radiocarbon Laboratory in Miami, Florida, with instructions to assay the humic fraction of each bulk sediment sample. Radiocarbon and AMS dating performed by Beta Analytic employed the CALIB program [52]. Linear age estimates for the dating of sediments used a median calibrated age. Bayesian methods that presume uniformitarian sedimentary conditions were self-evidently not applicable. Expressions of age were made in terms of (calibrated) years before present (BP) significant to century-level timescales.

6. Results

6.1. Dating

All AMS and standard radiometric dates at the examined pollen sites were sequential with respect to depth (Table 7). Inferably, low-energy sites chosen here reduced the potential for the re-working of dated material. The median ages of calibrated ranges of delta-Carbon 13-corrected dates were used for linear age estimates of pollen zones (Section 6.2.1, Section 6.2.2 and Section 6.2.3). These estimates at BK and SL are indicated within a two-Sigma error band (Figure 2 and Figure 3). The age of BK 1 (Section 6.2.1 below) was estimated to be 9300 to 8300 BP after the sedimentation rates established by the lowest two AMS dates here. The dating of this zone was thus extrapolated.
Important for the relative dating of NB, Central Texas Coast shell middens, including those situated around Nueces Bay itself, exhibited an absolute shift of composition of clam species between 6000 and 4500 (Rangia flexuosa) and post-3000 BP (R. cuneata). The absolute chronological separation of Rangia species derived from a corpus of archaeological work on the TGCP [32], expressed by an absence of shell midden sites altogether in the interval from 4000 to 3000 BP, according to radiocarbon dating of shell midden sites. The relative dating of NB pollen core shell layers at 400 to 450 cm (with R. flexuosa) and 250 to 300 (with R. cuneata) cm follows this biostratigraphic pattern for relative dating. Further limits on the absolute age of the NB core follow from base-level conditions necessary for sedimentation of a reduced and prograding deposit, as low sea level until 8000 BP would preclude such sedimentation [36]. From this, as a relative geological dating, the 7.9 m base of NB may be no older than 8000 BP [15].

6.2. Palynology

Laboratory techniques allow for the achievement of pollen counts ranging from 150 to 600 grains per sample in large samples. It is noted that a maximal differentiation of pollen taxa was achieved in conjunction with University of Texas at Austin Herbarium (Main Building) materials. A differentiation of Carya was not absolutely achieved, but a tendency of the examined pollen grains from BK and NB to exhibit relatively heavy exine thickening around pores was noted which corresponded to Carya illinoinensis (this was less evident in hickory species of Carya). An absolute separation of all individual specimens was not possible. It was further noted that the Betula pollen grains encountered exhibited poor vestibulum development (thin endexines) and very likely belonged to the species B. nigra or river birch, according to comparative morphology [
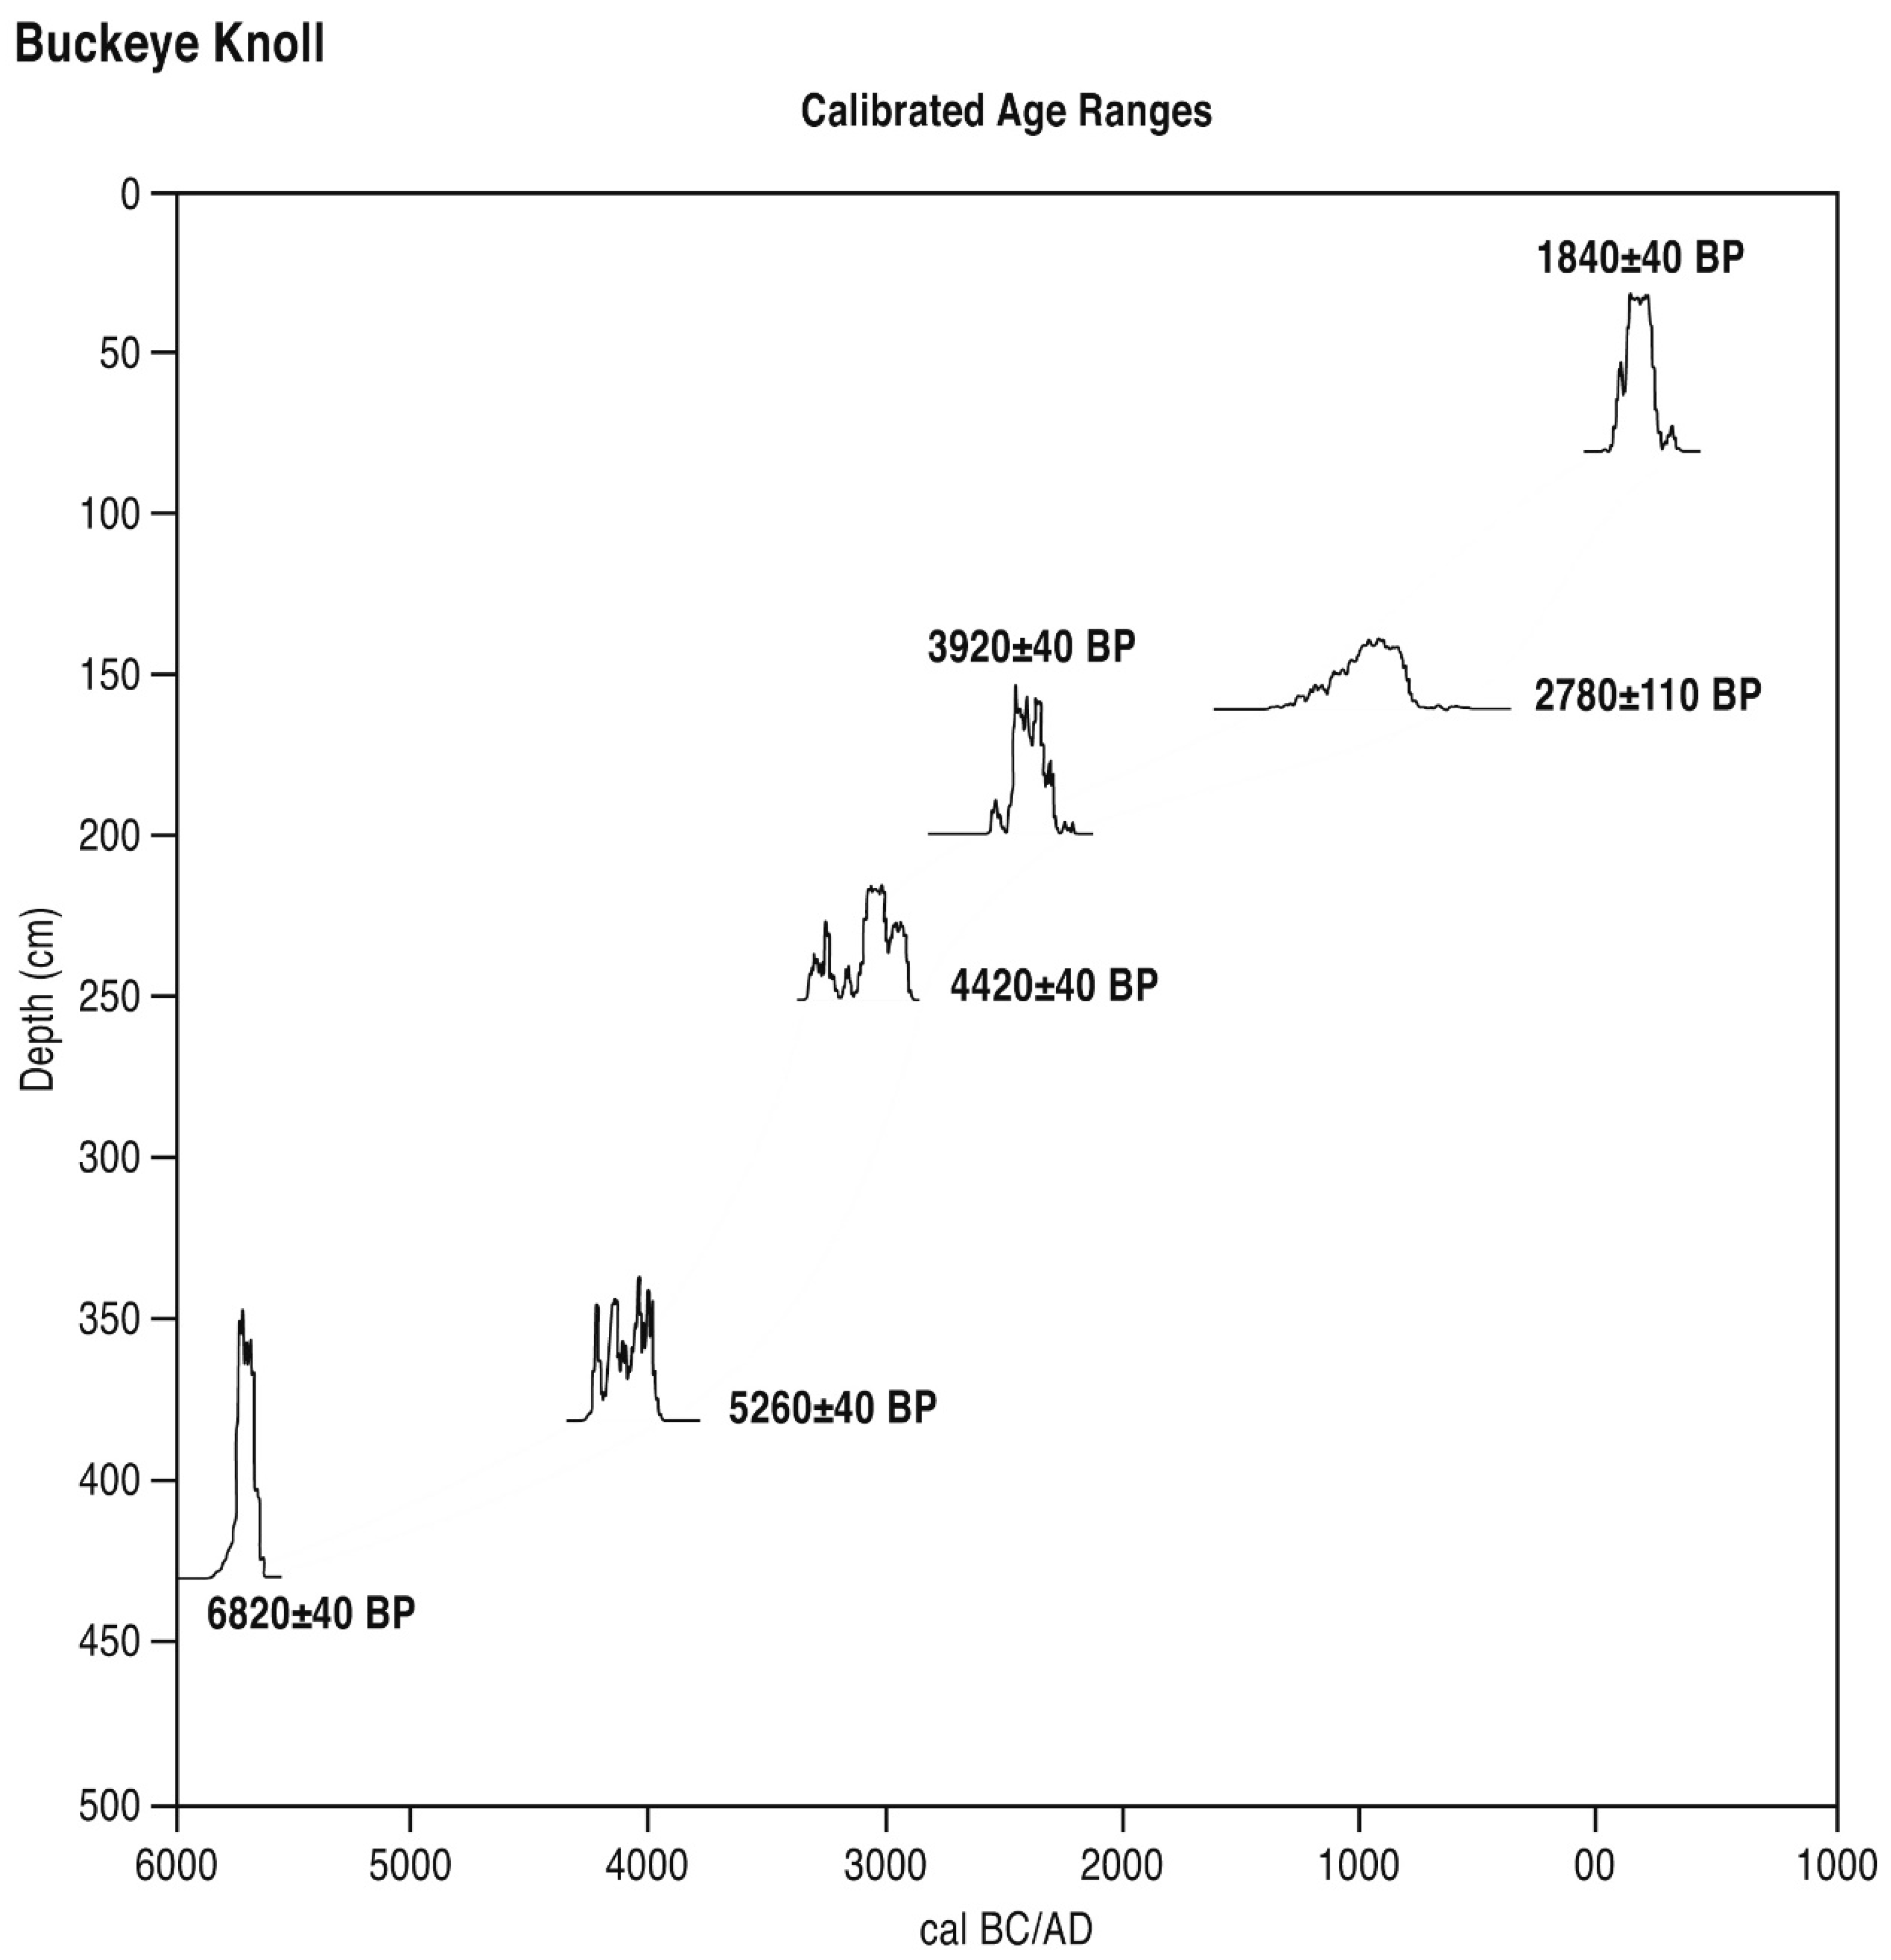
9]. Preservation was pristine for the examined samples. All dating estimates below are presented as calibrated ages in years BP.

6.2.1. Buckeye Knoll (BK, Figure 4 and Figure 5)

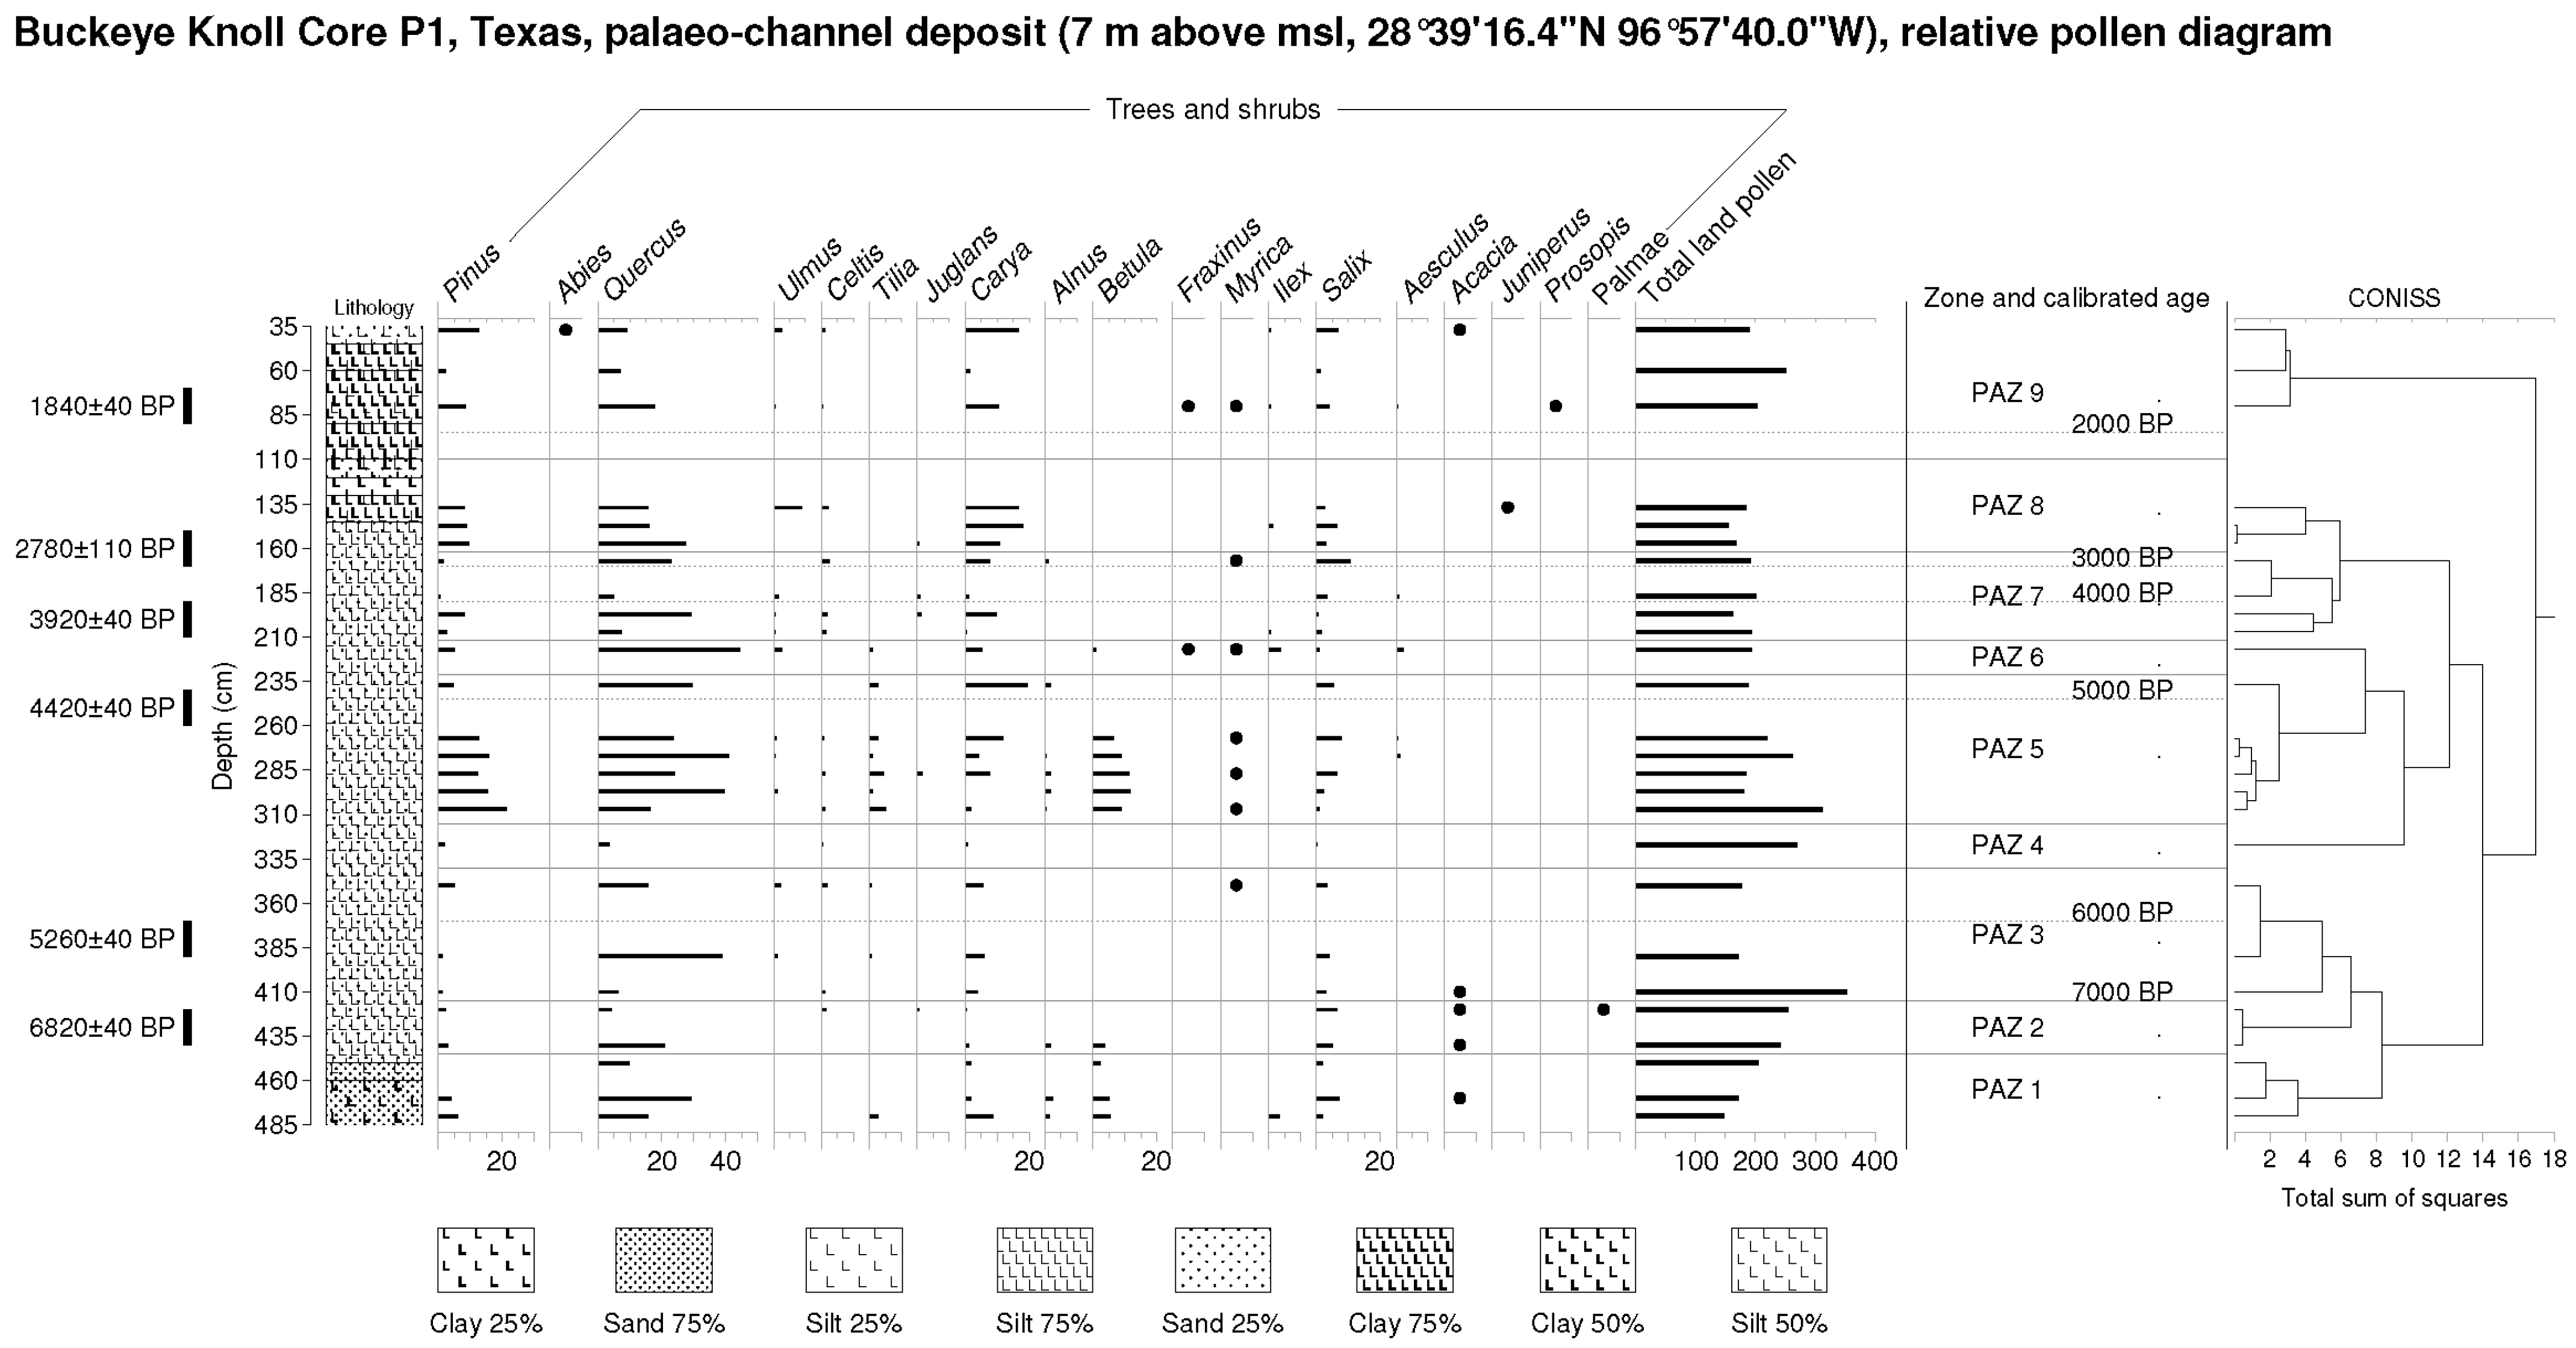
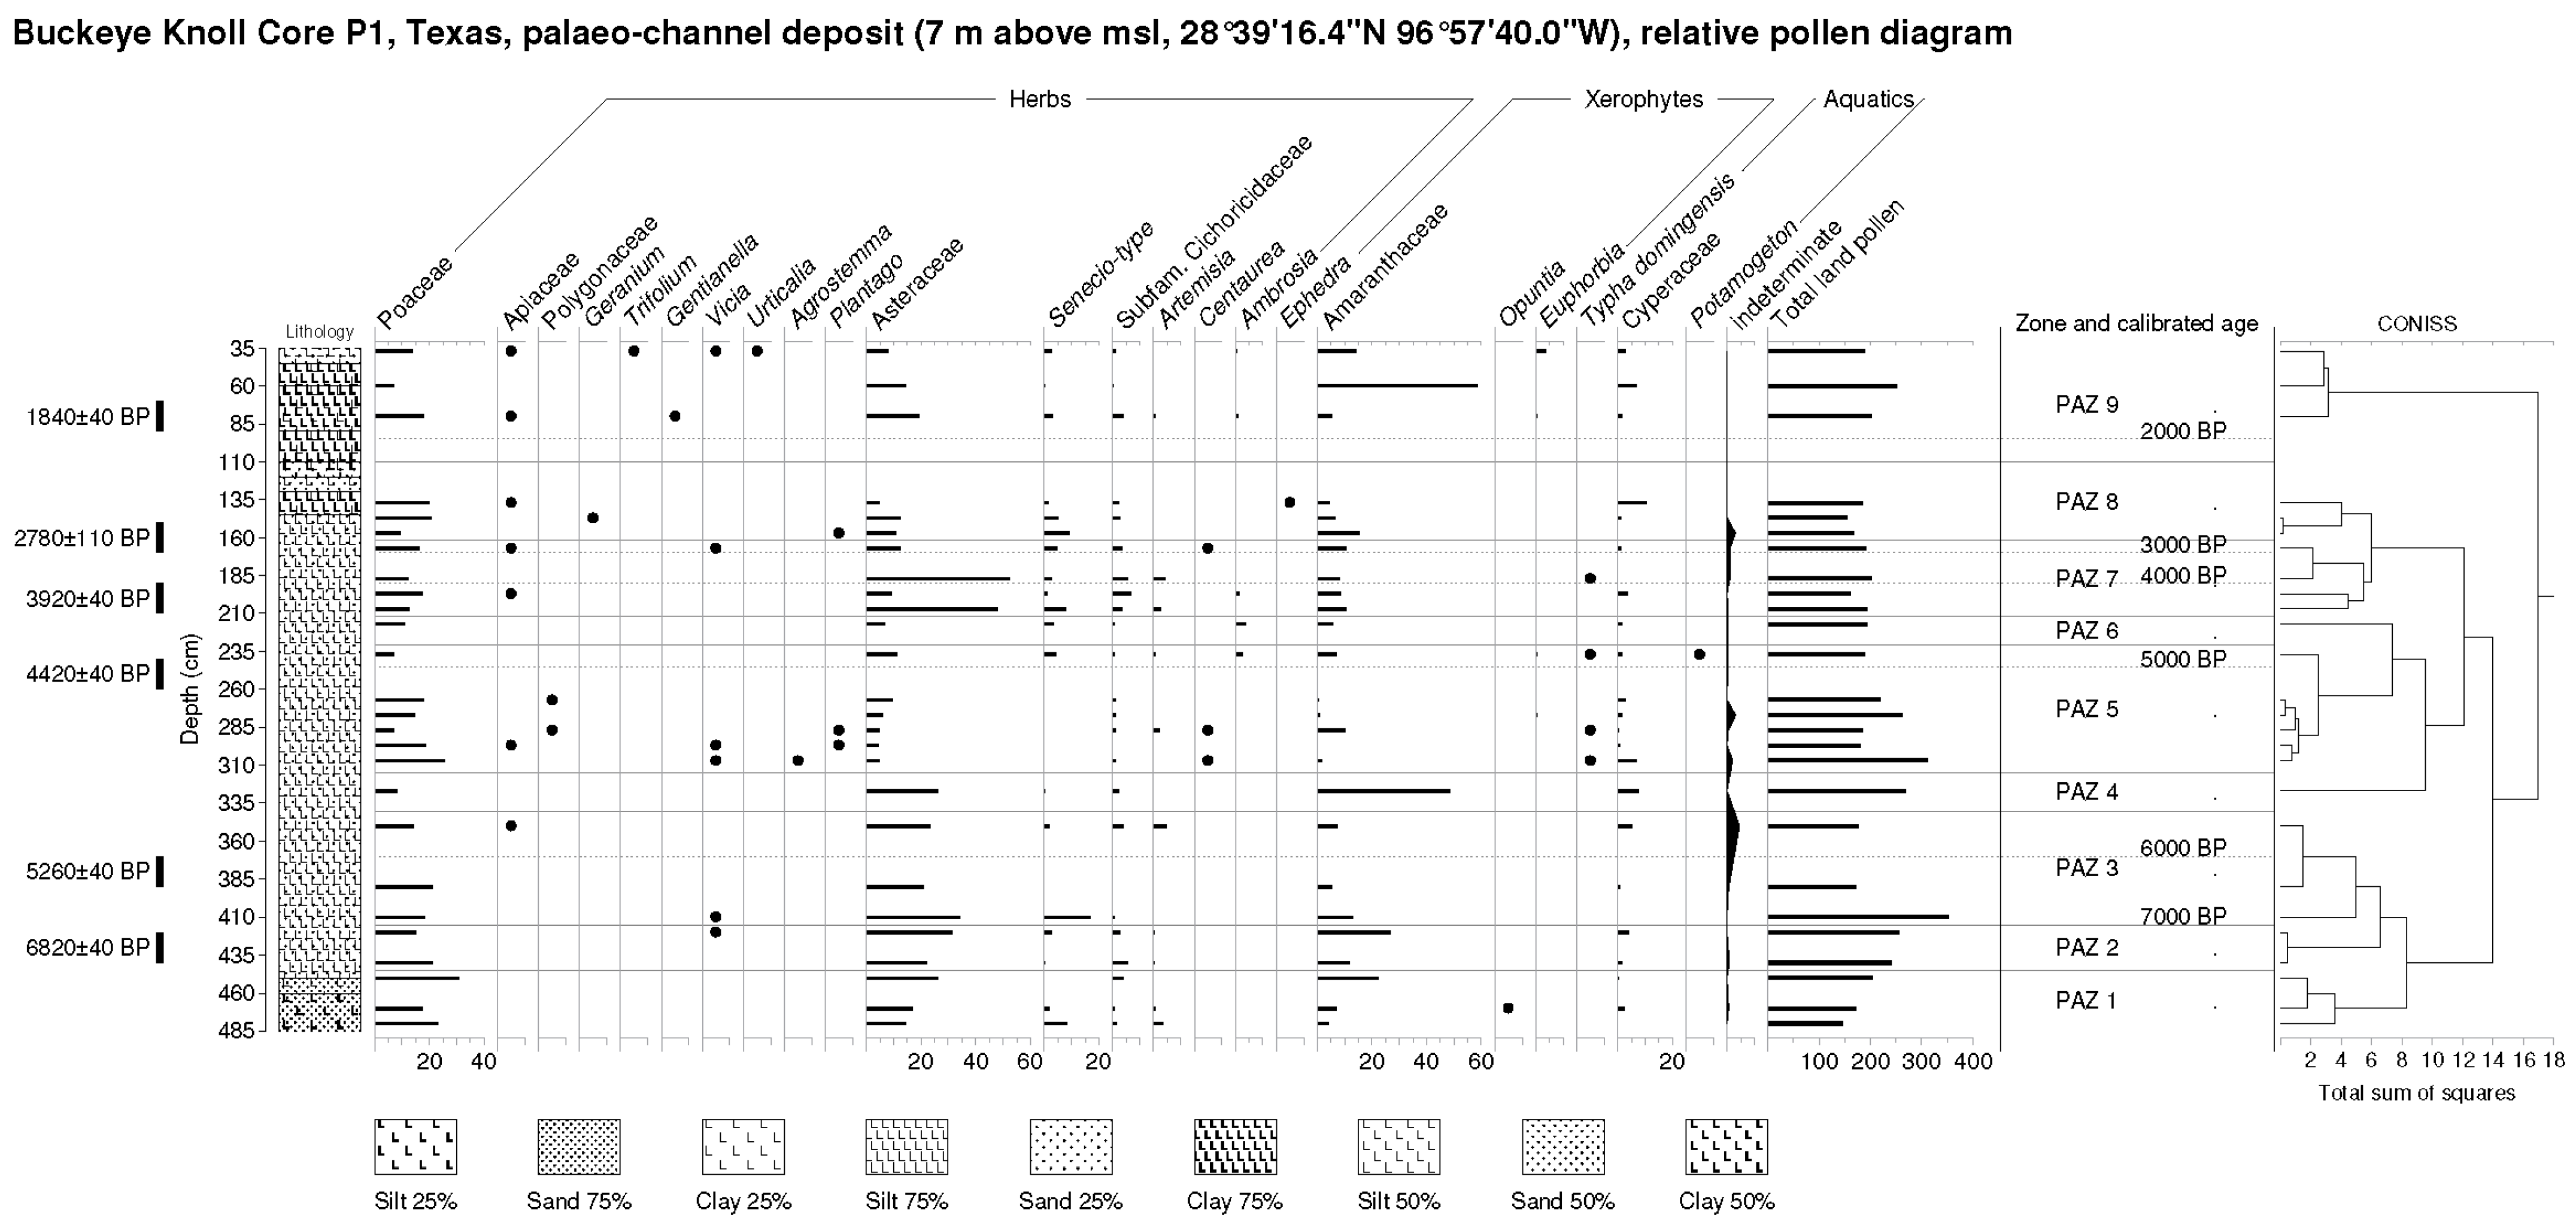
BK Zone 1 (450–480 cm, est. 9300–8300 BP) Quercus (29.2% max.), Carya (8.8% max.), Betula (5.4% max.) and riparian Salix are important trees and shrubs in this pollen zone. Isolates of Alnus and Acacia are noted here. Poaceae (30.7% max.), Asteraceae and other composites are important herbs. Artemisia is present, while values of the xerophyte Amaranthaceae rise (4.2–22.4%). An Opuntia isolate is noted. Freshwater isolates include Cyperaceae.
BK Zone 2 (420–440 cm, 8000–7300 BP). Amaranthaceae values (26.7% max.) remain elevated in this zone, while values of tree pollen (esp. Carya and Betula) decline; however, those of shrubs of the riparian verge as represented by Salix remain unchanged (ca. 5–6%). Isolates of Acacia and Palmae are noted. Herbs include most importantly Poaceae and Asteraceae. Isolates of Cyperaceae are noted.
BK Zone 3 (350–410 cm, 7000–5750 BP). Amaranthaceae pollen levels decline (20.9% min.) in this zone, while tree pollen, particularly Quercus (39.0% max.), rises. Carya establishes a significant presence (ca. 4–6%). Herbs include most importantly Poaceae and Asteraceae. Isolates of Cyperaceae are also noted.
BK Zone 4 (327 cm, 5600 BP). A secondary maximum of Amaranthaceae pollen (48.7%) is noted here as Quercus pollen declines to an absolute minimum (3.7%) as other trees decline. Forbs, as represented by general Asteraceae, exceed grasses, as represented by Poaceae pollen for the first time. Cyperaceae rises here.
BK Zone 5 (237–307 cm, 5400–4800 BP). Tree and shrub pollen led by Pinus (15.6% max.), Quercus (40.8% max.), Carya (19.6% max.), Betula (11.7% max.), and Salix (7.7% max.) increases very significantly in this zone as Amaranthaceae pollen declines markedly (to 0.5% min.). Isolates of Juglans, Alnus, and Myrica are noted. Poaceae rises (to 18.9% max.), also, as Asteraceae declines (to 4.4% min.). Typha grains are further noted.
BK Zone 6 (217 cm, 4600 BP). Quercus (44.3%) dominates tree pollen here, while lower levels of Carya, an absence of Betula, and isolates of Fraxinus and Myrica are noted. Herbaceous pollen is represented by lower values of Poaceae (10.8%) and Asteraceae (6.7%).
BK Zone 7 (167–207 cm, 4400–3200 BP). Lower Quercus, oscillating values of Carya, and rising Salix characterize the tree and shrub pollen of this zone. Herbaceous pollen, particularly Asteraceae (absolute max. 52.5%), rises as Amaranthaceae also increases somewhat (10.5% max.). An isolate of Typha is noted.
BK Zone 8 (137–157 cm, 2900–2600 BP). A further rise of Carya (18.1% max.) is noted along with Quercus pollen as Salix declines in this zone. Herbaceous pollen is constituted principally of Poaceae as Asteraceae declines (to 4.9% min). A maximum of Cyperaceae (10.3%) is noted.
BK Zone 9 (37–80 cm, 1800–400 BP). Tree and shrub pollen consists largely of (declining) Quercus, (oscillating) Carya and Salix in this zone. Isolates of Fraxinus, Myrica and Acacia are noted. Herbaceous pollen consists largely of Poaceae and Asteraceae, while an absolute maximum of Amaranthaceae pollen (58.6%) is noted.
Figure 4. Buckeye Knoll (BK) relative pollen diagram (arboreal pollen as percentage of TLP) and Troels-Smith lithology. Note redox (red coloration) features.
Quaternary 06 00019 g004
Figure 5. Buckeye Knoll (BK) relative pollen diagram (non-arboreal pollen as percentage of TLP) and Troels-Smith lithology. Note redox (red coloration) features.
Quaternary 06 00019 g005

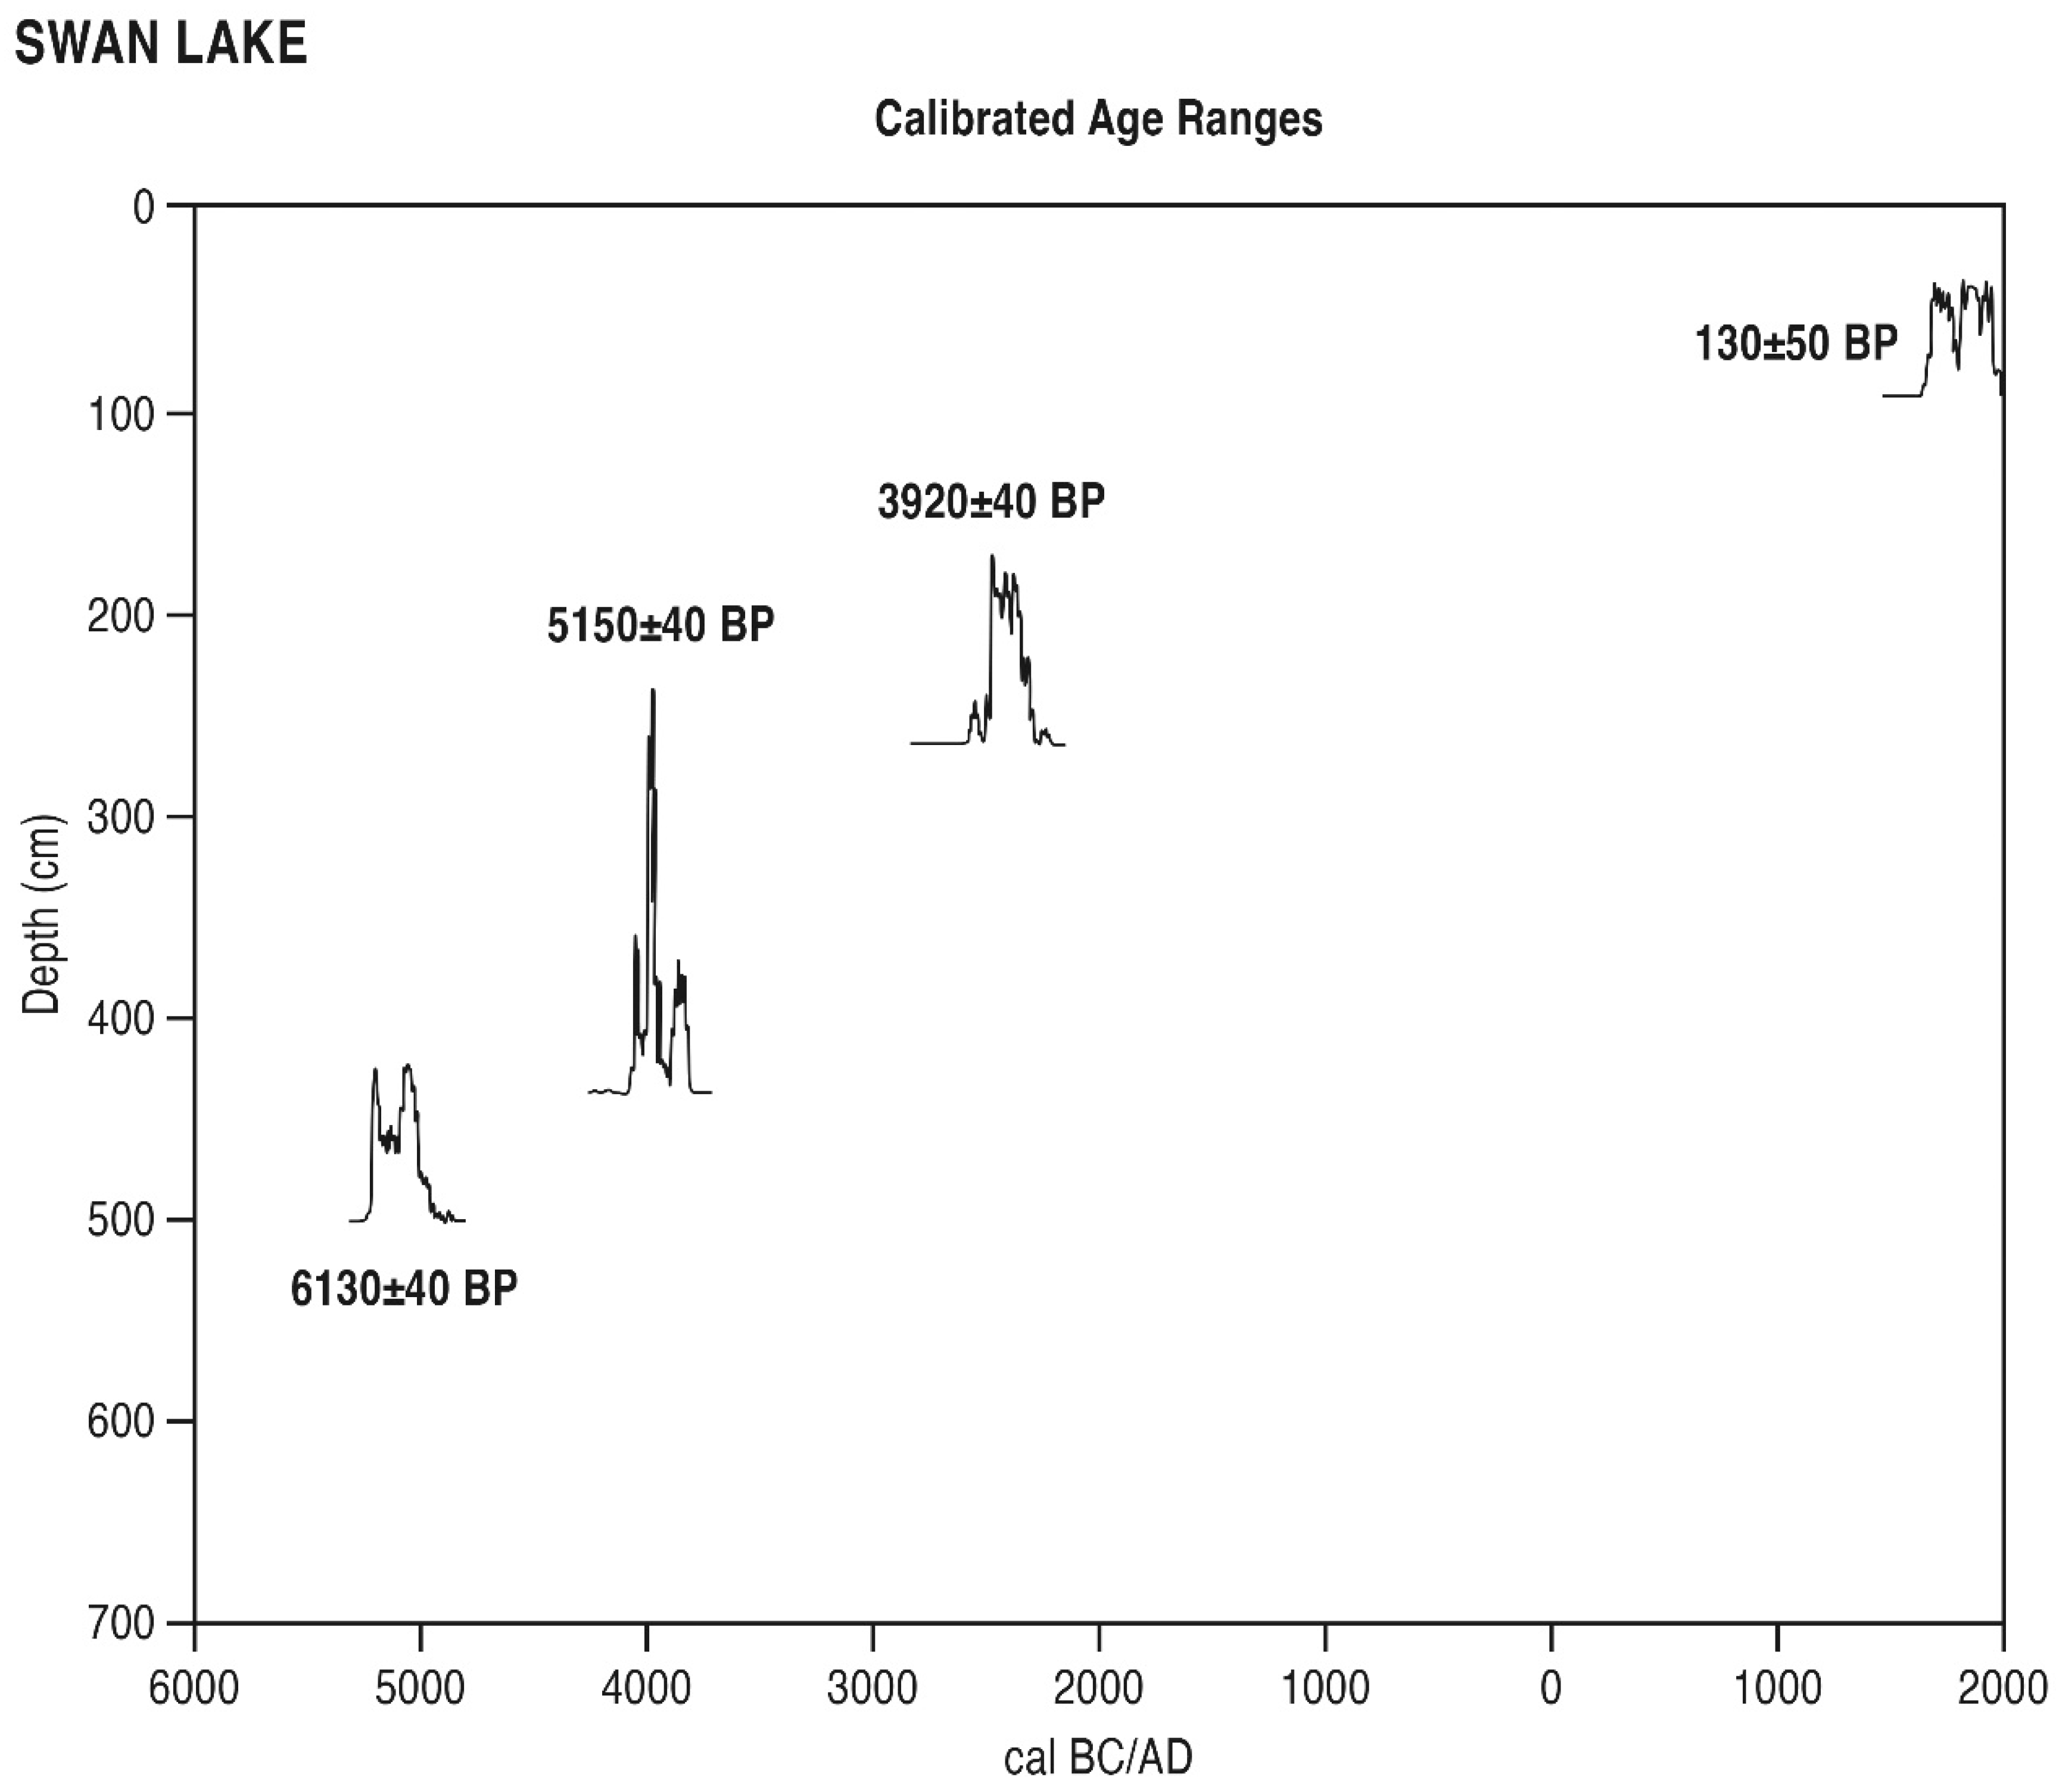
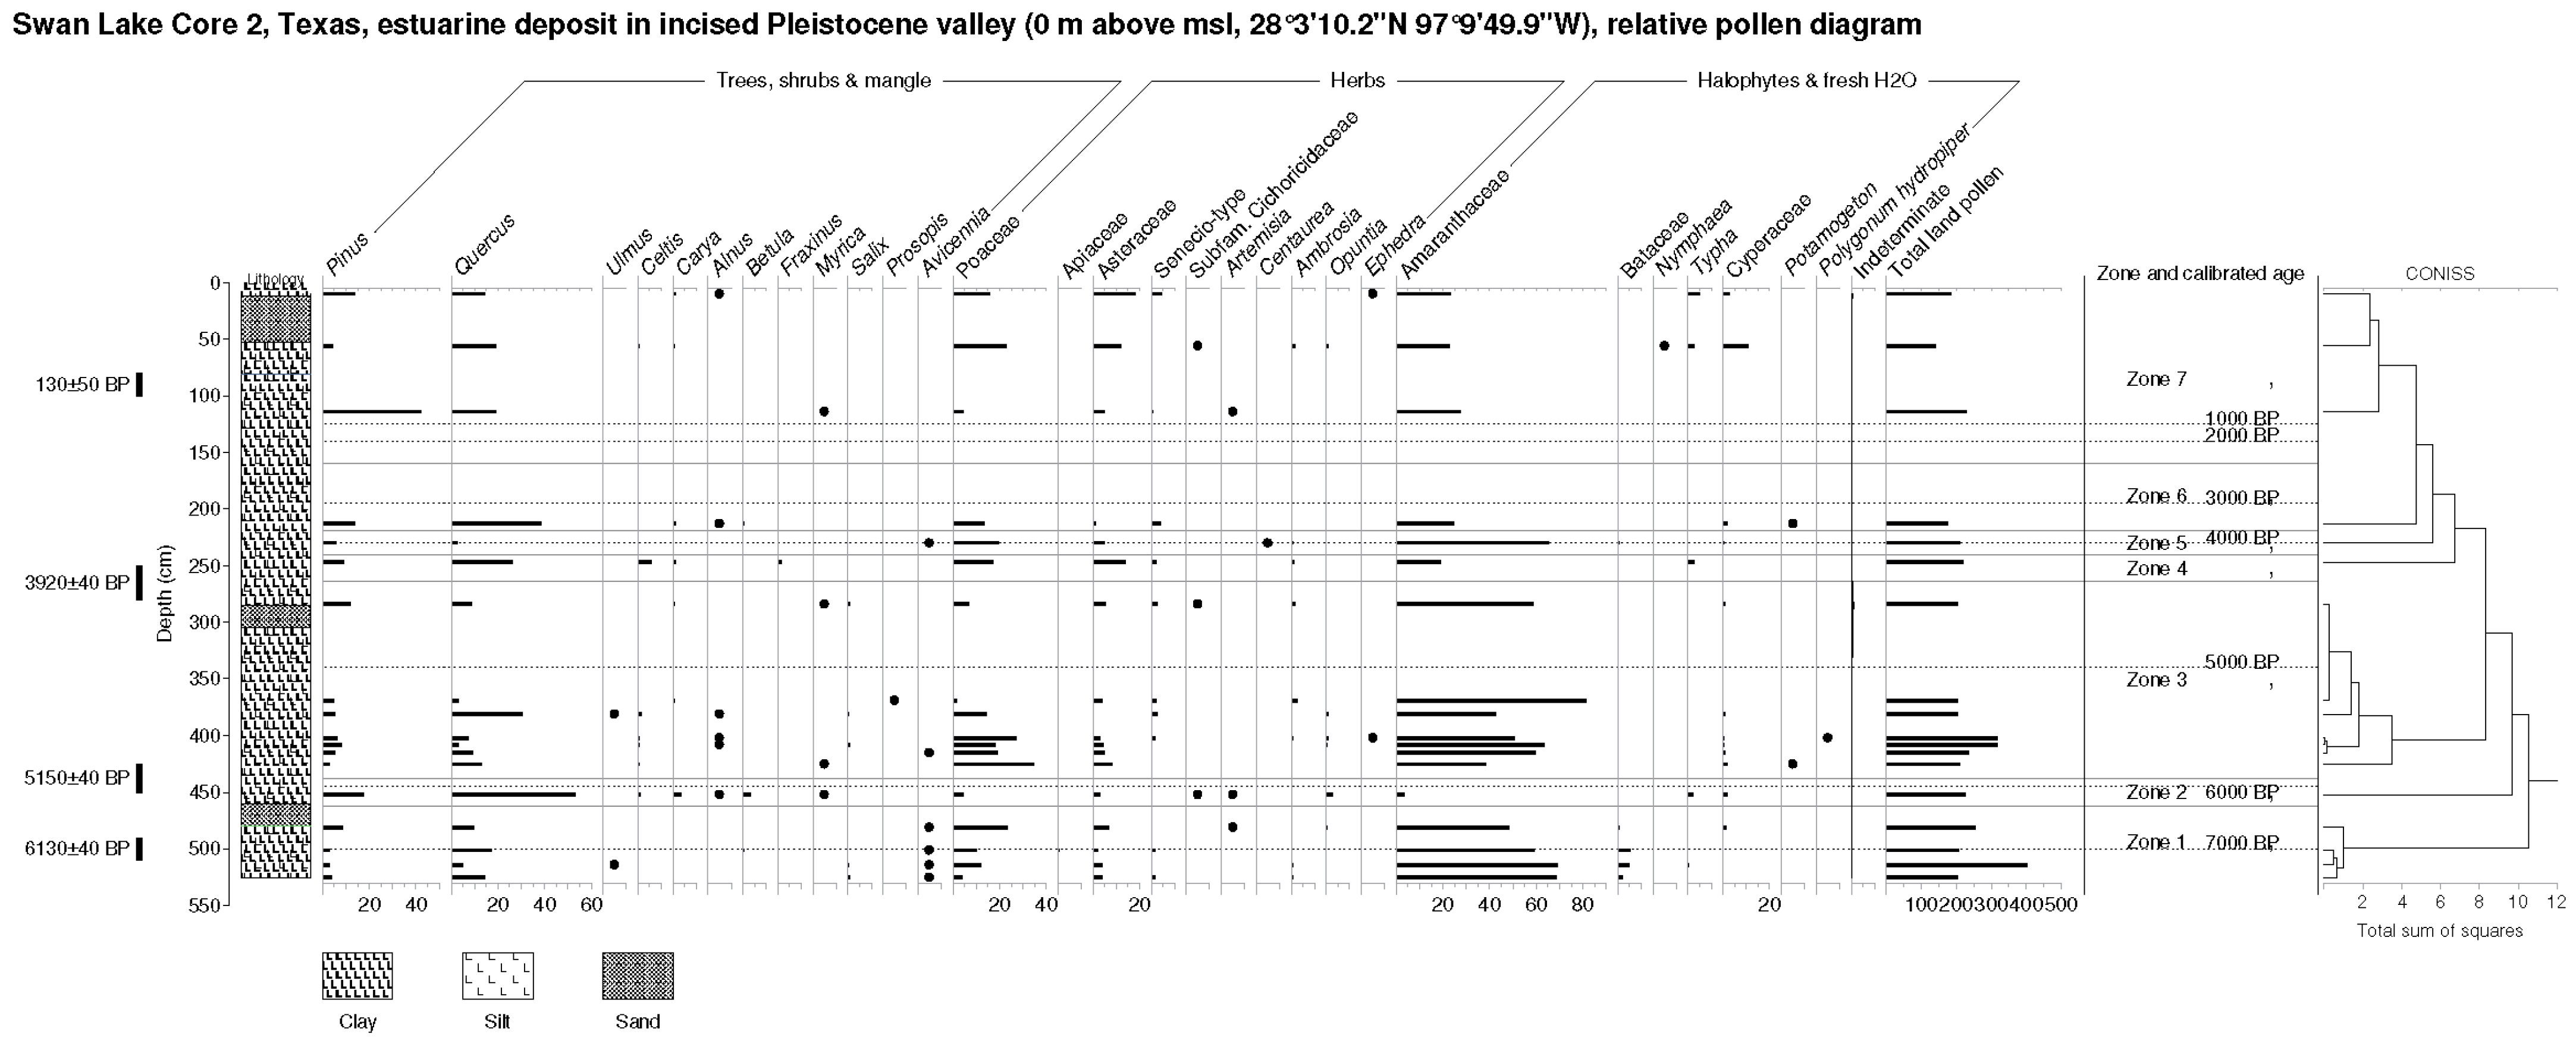
6.2.2. Swan Lake (SL, Figure 6)

SL Zone 1 (481–525 cm, 7100–6650 BP). Relatively low levels of Quercus pollen are observed here, along with isolated Ulmus, Betula, and Salix. A rational representation of Avicennia is observed. Herbaceous pollen consists largely of Amaranthaceae with a significant admixture of Poaceae, Asteraceae, and Bataceae pollen. Freshwater types are represented by isolates only of Typha and Cyperaceae.
SL Zone 2 (452 cm, 5800 BP). Pollen types of trees and shrubs, including, most importantly, Quercus, Pinus, Carya, and Betula, rise in this zone. Isolated Alnus and Myrica also appear here. Herbaceous pollen types include rising Poaceae and Asteraceae. Notable are finds of Opuntia and Artemisia pollen. A rise in Typha and Cyperaceae pollen is observed.
SL Zone 3 (284–425 cm, 5700–4250 BP). Pollen types of trees and shrubs, including, most importantly, Quercus and Carya, decline in this zone. Isolated Ulmus, Celtis, Alnus, Myrica, Salix, Prosopis and Avicennia also appear here. Herbaceous pollen types include rising Poaceae and Asteraceae, along with declining Amaranthaceae. Initial Potamogeton, Polygonum hydropiper and declining Cyperaceae pollen are further observed here.
SL Zone 4 (247 cm, 3650 BP). Pollen types of trees and shrubs, including Quercus and Celtis, rise in this zone. Isolated Fraxinus also appears here. Herbaceous pollen types include rising Poaceae and Asteraceae, along with declining Amaranthaceae. Typha pollen is also observed.
SL Zone 5 (230 cm, 3450 BP). Pollen of trees and shrubs, including, most importantly, Quercus, decline in this zone. Isolated Avicennia also appears. Herbaceous pollen types include Poaceae and Asteraceae, along with rising Amaranthaceae and a Bataceae grain.
SL Zone 6 (213 cm, 3050 BP). Pollen of trees and shrubs, including, most importantly, Pinus and Quercus, rise in this zone. Isolated Celtis and Alnus also appear. Herbaceous pollen types include declining Poaceae and Asteraceae, along with rising Amaranthaceae. Low levels of Typha and an isolated Potamogeton grain are noted.
SL Zone 7 (10–114 cm, 700 BP to recent). Pollen of trees and shrubs declines progressively in this zone. Isolated Alnus and Myrica also appear. Herbaceous pollen types include rising Poaceae and Asteraceae, along with moderate levels of Amaranthaceae and rising terminal values of Typha and Cyperaceae. An isolate of (freshwater) Nymphaea is further noted. Finally, low levels of both Opuntia and Ambrosia are observed here.
Figure 6. Swan Lake (SL) relative pollen diagram (percentage of TLP) and Troels-Smith lithology. Note redox features and pollen hiatus 130–280 cm and absence of pollen samples in sand layers.
Quaternary 06 00019 g006

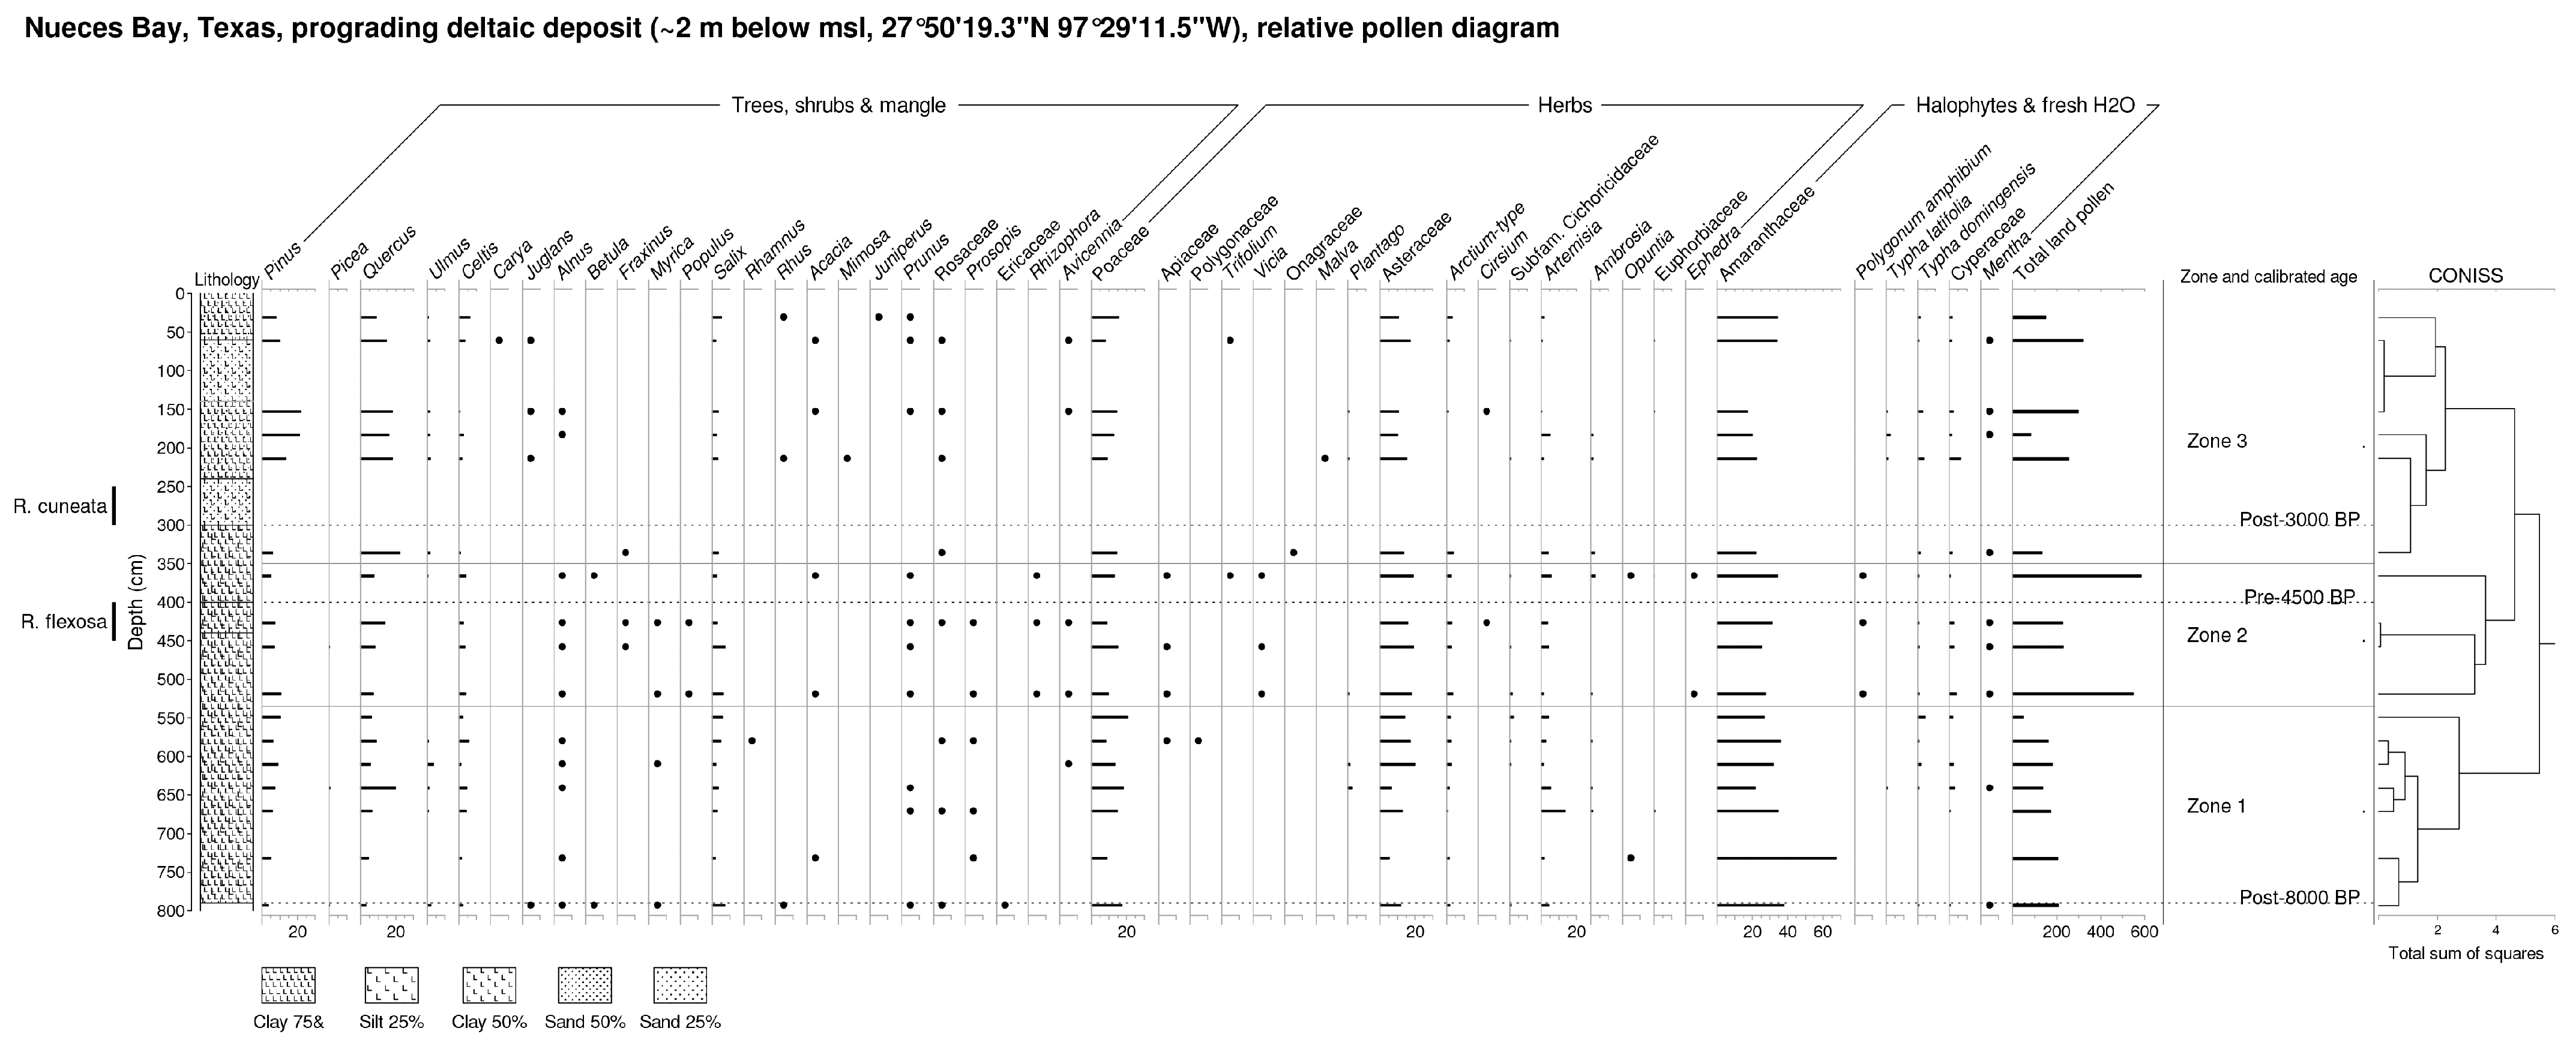
6.2.3. Nueces Bay (NB, Figure 7)

NB Zone 1 (549–793 cm, ~8000–6000 BP). Arboreal pollen (esp. Quercus, Celtis, Ulmus and Salix) rises in this zone. Isolates include Juglans, Alnus, Betula, Myrica, Rhamnus, Rhus, Acacia, Prunus, Prosopis, Ericaceae (cf. Arbutus) and Avicennia (terminally). Herbaceous pollen types include Poaceae and Asteraceae, along with declining Amaranthaceae (site max., at base of sequence) and rising terminal values of Typha and Cyperaceae.
NB Zone 2 (366–519 cm, ~6000–4500 BP). Levels of AP, including Quercus, Celtis and Salix, are stable. In addition to moderate levels of Pinus, isolates of Alnus, Betula, Acacia, Prunus, and Prosopis occur. A near-rational representation of isolates of Avicennia as well as Rhizophora is achieved. Among herbaceous pollen types, Poaceae values decline somewhat, while those of Asteraceae and Amaranthaceae remain stable. Pollen grains of Vicia and Apiaceae are further noted. Freshwater plant pollen now includes Typha, Cyperaceae, Polygonum amphibium and Mentha.
NB Zone 3 (31–336 cm, post-4000 BP). With the exception of Pinus, AP declines, led by Quercus, Celtis and Salix. Isolates of Ulmus, Carya, Juglans, Alnus, Fraxinus, Acacia, Mimosa, Prunus and Avicennia occur. Non-arboreal pollen, led by Poaceae, Asteraceae and Amaranthaceae, are oscillatory. Maxima of Typha and Cyperaceae are noted in the middle part of this zone (~3000 BP).
Figure 7. Nueces Bay (NB) relative pollen diagram (percentage of TLP) and Troels-Smith lithology. Note that the shellfish stratum with Rangia cuneata is unsampled due to the density of this shellfish bed.
Quaternary 06 00019 g007

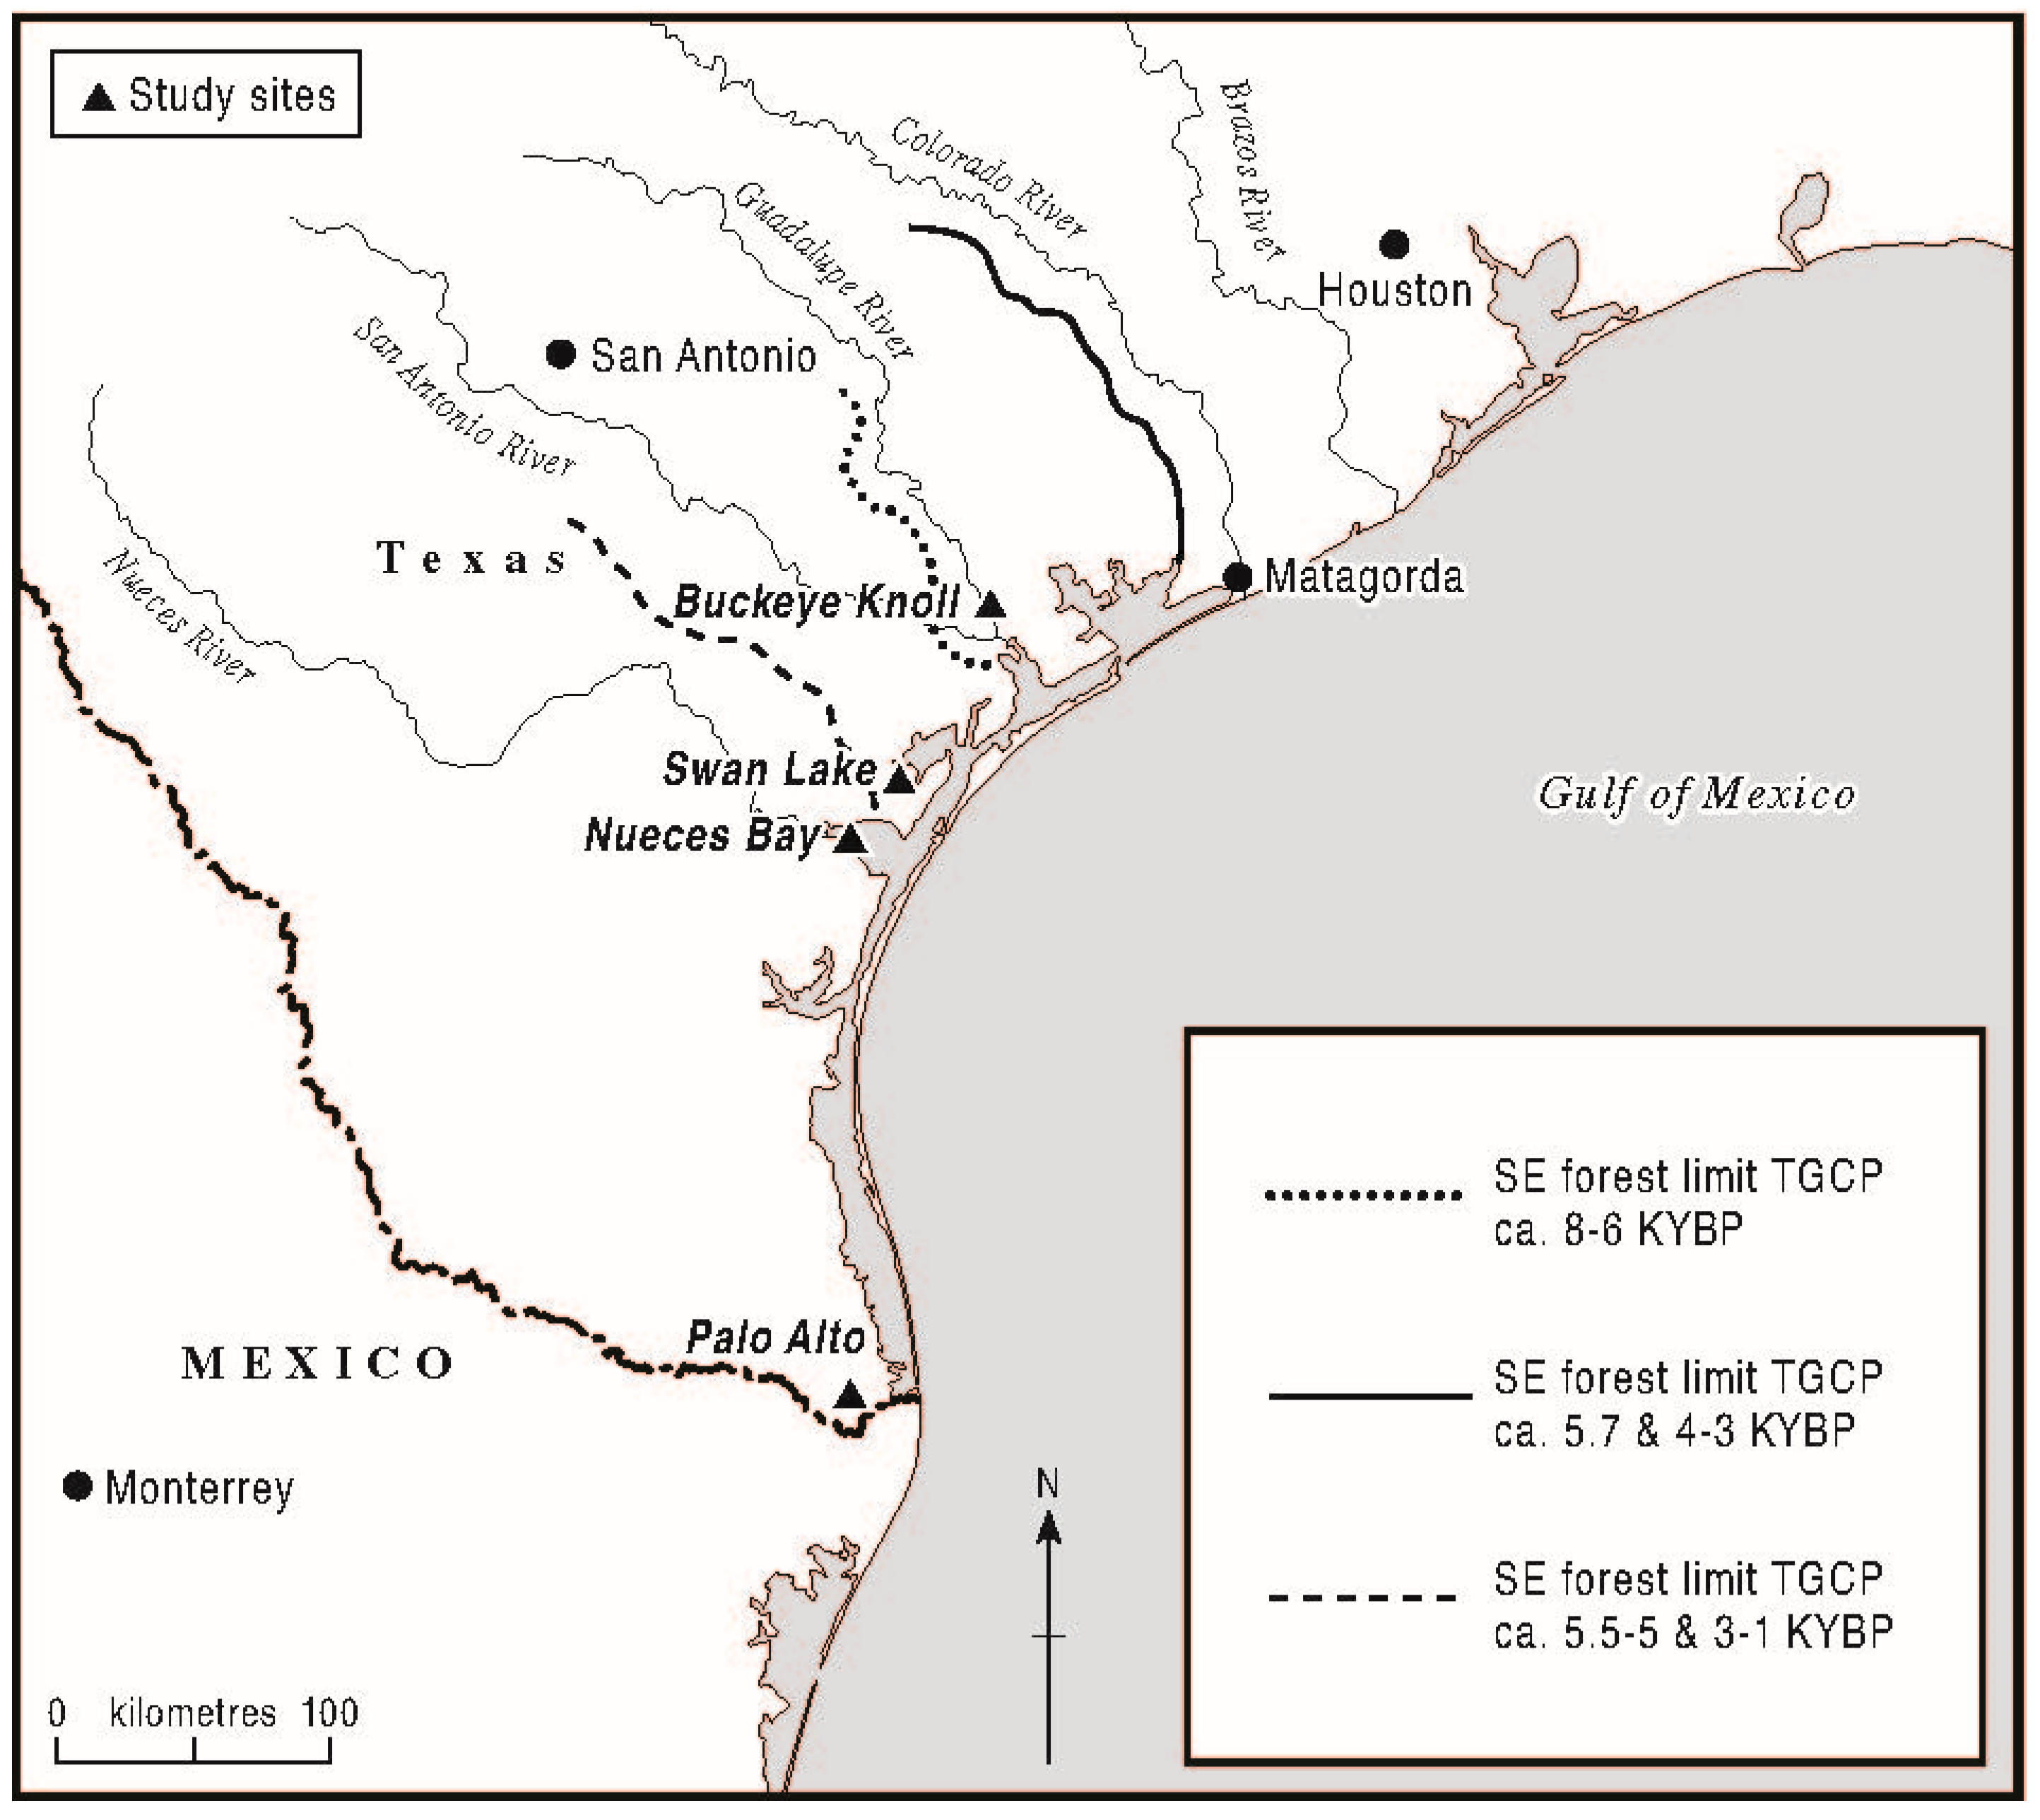
6.2.4. Definition of the Forest–Prairie Ecotone

In the reconstruction of the past, the forest–prairie vegetation changes in the TGCP; a definition of the regional forest–prairie ecotone according to pollen statistics is necessary. In this section, the most recent, top-set samples of the examined pollen sites and the supplemental site of Palo Alto at the southern limit of the TGCP are employed (as analogs) to define the forest–prairie ecotone in terms of AP percentage levels. The sum of AP is calculated as all tree and shrub pollen minus (long-distance) Pinus pollen. These samples were used to statistically define ideal vegetation types, with error bands of the AP level defined by upper confidence limits of AP (%) at prairie sites and the lower confidence limit of AP (%) at the forest site (BK). According to pollen analyses (Section 6.2.1, Section 6.2.2 and Section 6.2.3, please see the Palo Alto pollen diagram supplemental file), the top-set samples at BK, SL, NB and Palo Alto produced AP values ranging from 36.5% at BK in the north to 3.5% at Palo Alto in the south. Notably, top-set AP levels at SL and NB, within 13 min latitude of each other, produced near-equivalent AP levels, with a uniform trend towards higher AP at higher latitudes being evident (small sample number, low statistical noise; Table 8). The sample at SL was chosen to establish expected AP levels in the prairie environment near the ecotone because of its higher pollen count (smaller confidence interval) and biogeography (prairie sample in closest proximity to forested zone). The confidence interval upper boundary here was 22.4% AP, while the lower boundary of BK (sole forest zone site) was 30.0% (bold). According to these data, it was inferred that an AP above 30.0% indicates a forest vegetation type in paleo-pollen spectra. Below 22.4% AP, a prairie vegetation type is indicted, while intermediate AP levels (22.4–30.0%) are deemed transitional or indeterminate as to vegetation type and contain the theoretical ecotone. The application of these results is discussed below (Section 7.1) in an assessment of Holocene climate changes according to earlier sediment core pollen data and comparative (Section 3) data.

6.2.5. Results of Mangrove Pollen Analog Studies

Analogs for mangrove pollen of Avicennia and Rhizophora species from the Gulf of Mexico and the Central Florida Atlantic coast demonstrate that low levels of mangrove pollen can indicate a local presence (Table 9), conformably with the poor dispersion of most insect pollinated species. In general, pollen from the analog sites was dominated by the local herbaceous halophytic taxa (esp. Bataceae and Amaranthaceae) or (in the case of Orchid Island, Florida) other arboreal taxa of the floodplain. In the case of the Orchid Island sample (
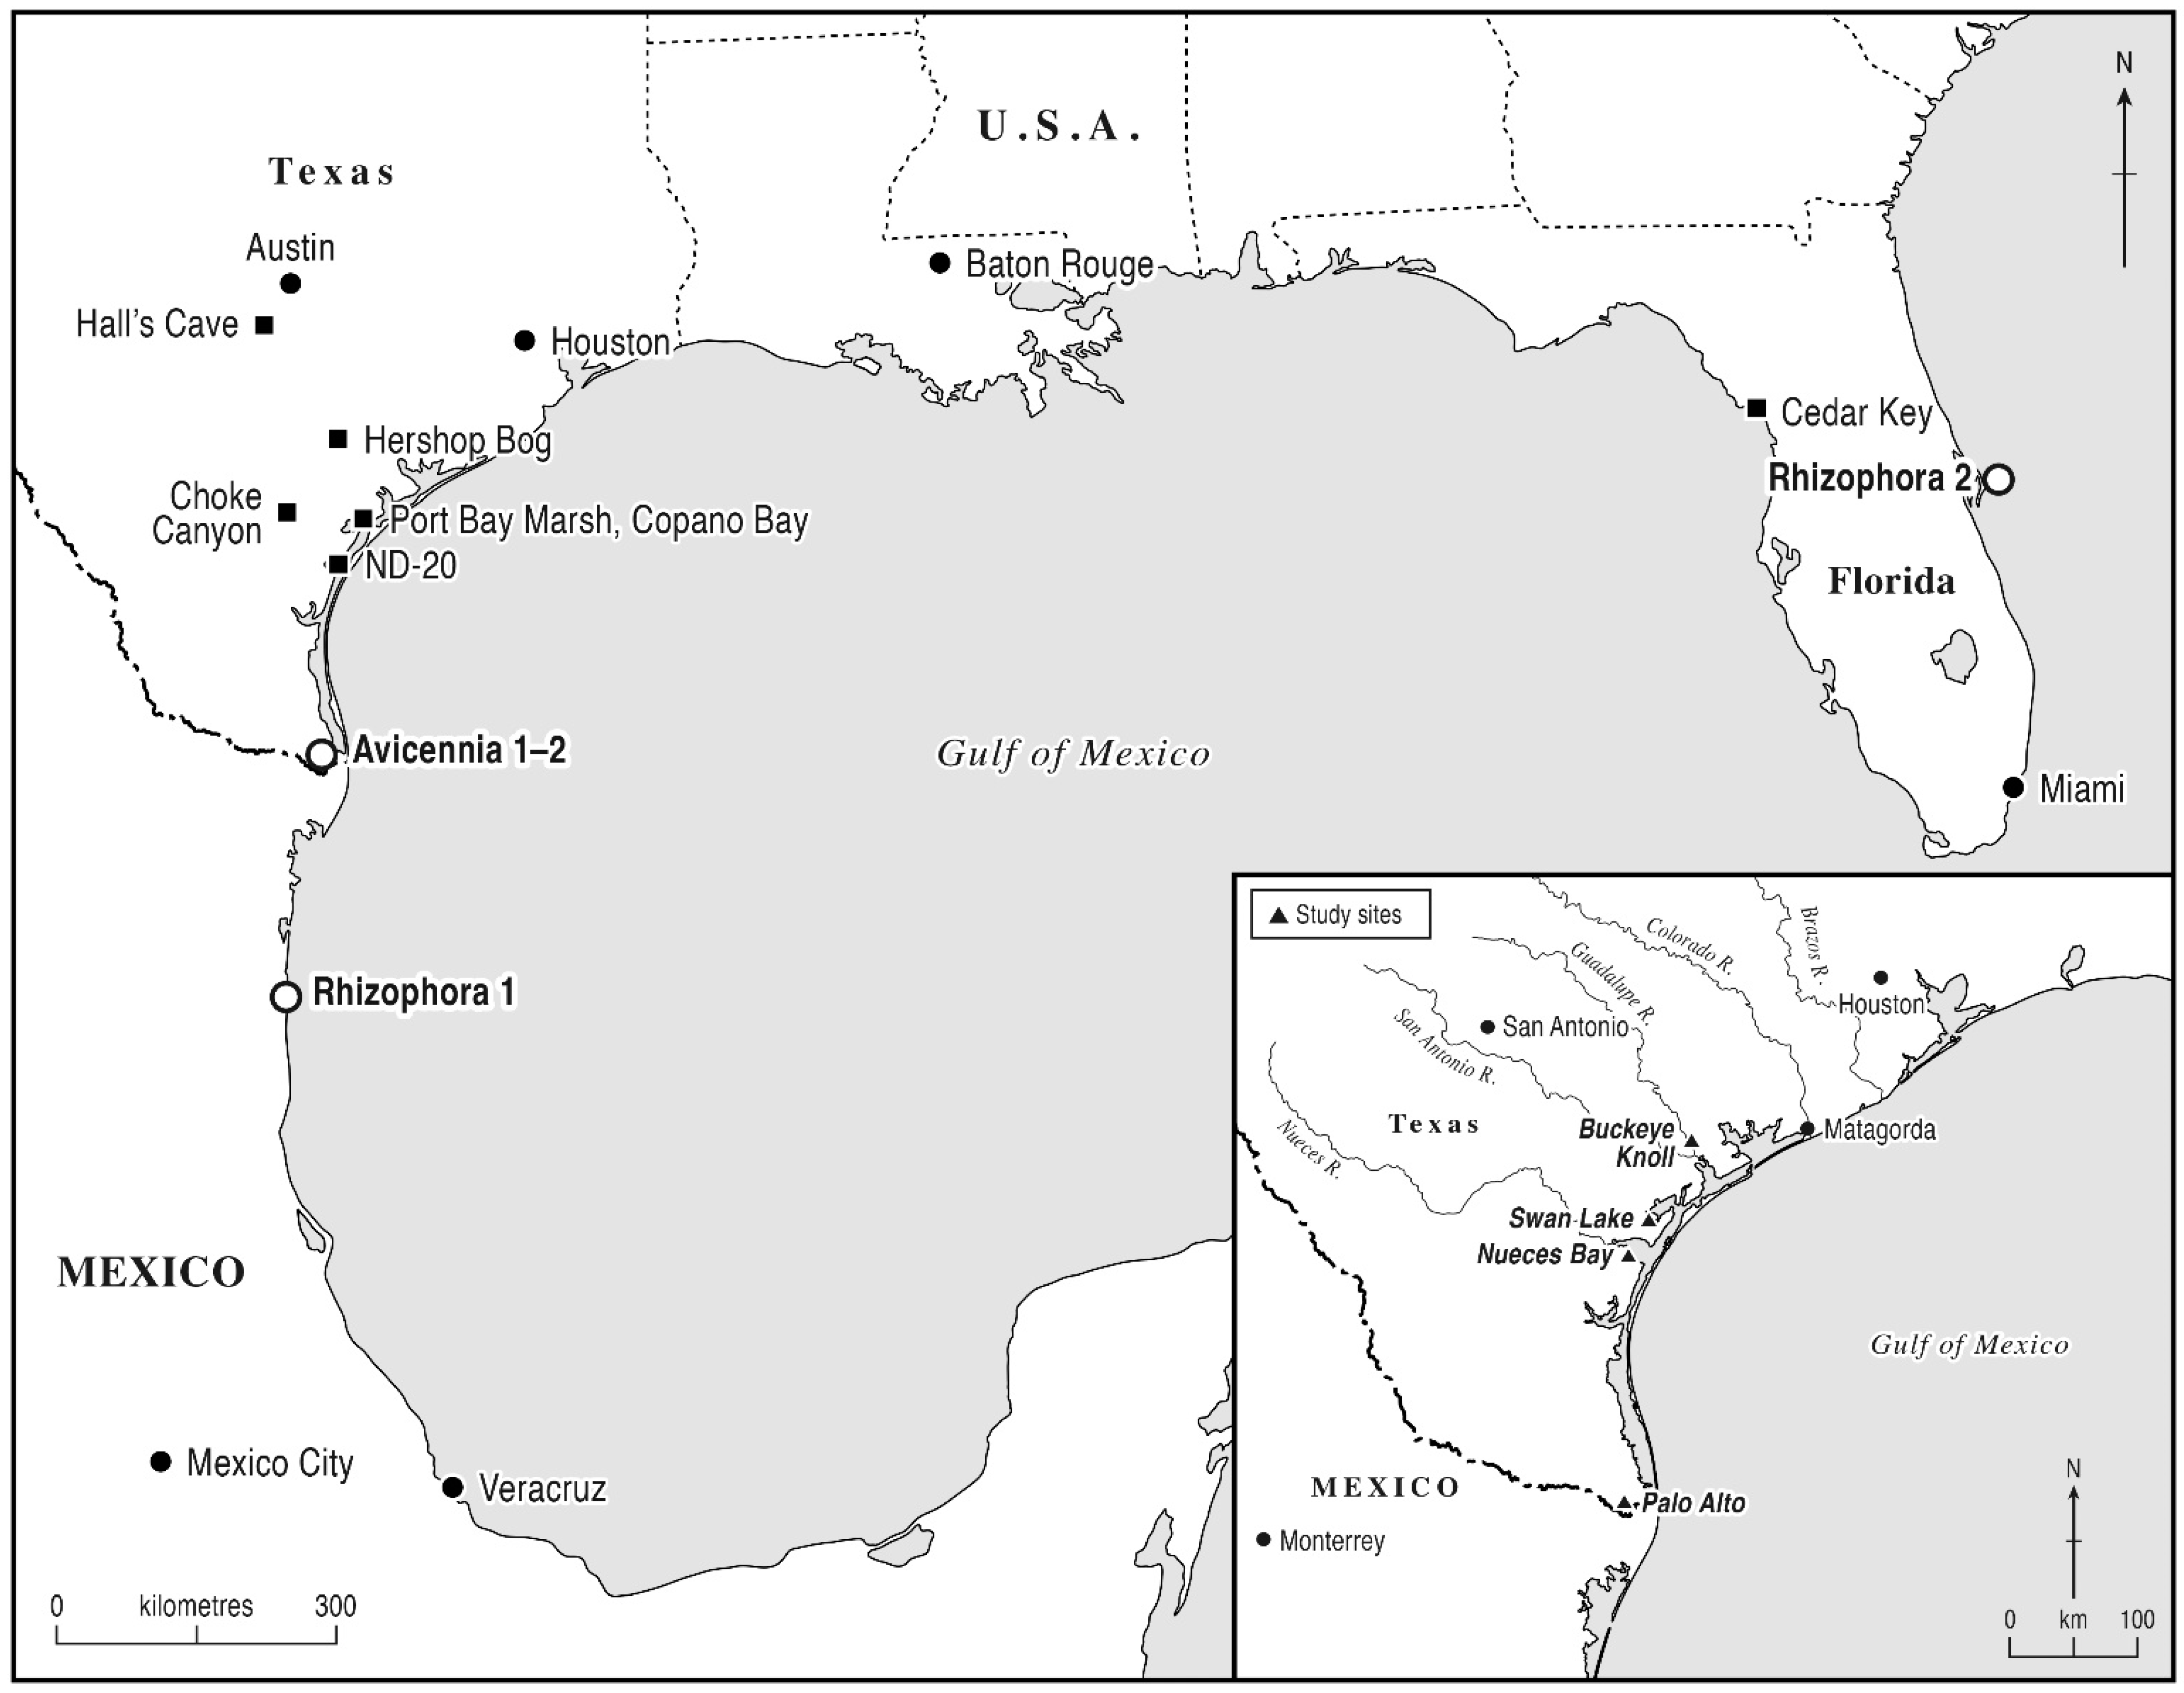
Rhizophora 2), a major pollen taphonomic influence of the Indian River (regional hydrological transport) was inferred according to the high pollen percentages of the mixed oak–pine forest (absent from the local sampling site). From La Pesca data at the northern climatic limit of Rhizophora in Mexico (Rhizophora 1), Rhizophora mangle pollen was found to be absent (comparatively, the pollen response of Rhizophora increased markedly in lower-latitude coastal regions of Mexico [53]). In the case of sampled Avicennia sites from the Laguna Atascosa Wildlife Refuge in the Rio Grande valley, Avicennia pollen percentages approached 2% TLP in both samples, although the sample from the central part of the mangrove stand (Avicennia 2) contained greater quantities of Bataceae, inferably due to greater local, non-anemophilous pollen influence with lower wind velocities. According to these analogs, isolated mangrove pollen grains at the SL and NB sites may thus be interpreted as small mangles representing vegetation patches in the order of one to ten hectares. An absence of mangrove pollen, however, was expected where local mangles were small, in the order of one hectare or less.
In the case of NB (Zone 2), a presence of isolated grains of Rhizophora pollen indicated the local presence of this fully tropical mangrove and thus a boreal extension of its climatic limit. This inference further indicates a tropical Middle Holocene climate in the central TGCP circa 6000 to 4500 BP, according to biostratigraphic dating of proximal Rangia flexuosa fortuitously encountered in the NB pollen core. Importantly, R. flexuosa itself enjoys a tropical distribution today in the Gulf Coast of Mexico, supporting the interpretation of the analog data by virtue of an analogous climatic range change (see Section 7.1).

7. Discussion

7.1. Climate Model: Forest-Limit Oscillations and Range Changes of Betula

According to the climate model (Table 1), shifts in the forest–prairie ecotone (among other parameters) are used to define mesic and xeric climate phases, with the ecotone itself being defined according to an AP band between ideal vegetation type sites (here, SL and BK) in near-Modern samples. According to the latter analyses (Section 6.2.5) and age–depth estimates (Section 6.1) of sediment cores, mesic versus xeric periods are now definable according to the total sediment core (Section 6.2.1, Section 6.2.2 and Section 6.2.3) AP data.
Firstly, mesic periods of increased growing-season precipitation and lower drought frequency were reconstructed according to increased AP in the Guadalupe River valley (BK) and Copano Bay (SL). Arboreal pollen values exceeding 30.0% at SL were recorded during two periods, 5500 to 5000 and 3000 to 1000 BP. During these periods, a southward migration of the forest boundary was reconstructed, and thus relatively mesic climate conditions ([10,54]; Figure 8, dashed line). Importantly, grass phytolith data from Choke Canyon State Park in the Nueces River valley also conform to this reconstructed pattern, with an increase in mesic, C3 grasses noted at “Late Archaic” and subsequent archaeological sites (dating to post-3000 BP, according to the projectile point chronology of Tom Hester [30]). Notably, periods of high Carya pollen (19.6% max.) at BK are also evident at intervals within these periods (esp. ~5000 BP and 2900–2600 BP).
Near-Modern conditions, with a position of the forest limit within the Guadalupe valley, were reconstructed for a long period dated from 8000 to 6000 BP, according to near-Modern AP levels at all sites (Figure 8, stippled line). Within this time period, Carya was first established as a major tree at BK. Finally, xeric periods, with a northward migration of forest beyond the Guadalupe River valley, were defined by AP values below 22.4% at all examined sites during two periods (Figure 8, solid line), circa 5700 BP and between 4000 and 3000 BP. Increased drought frequency, reduced growing season precipitation and/or increased evaporation, promoting high moisture stress in mesophytic woodlands, were inferred. Importantly, the circa 5700 BP period is correlated with major deflation and erosion of the knoll top of the Buckeye Knoll archaeological site (adjacent to the BK pollen site), interpreted as a xeric phenomenon, according to geomorphological criteria of Robert Ricklis [39]. Significantly, the later xeric period (4000–3000 BP) is correlated also with Hall’s Cave faunal data indicating deceased forest cover in Central Texas [27], as well as a predominance of shortgrass phytoliths (typical of dry prairies) at Choke Canyon archaeological sites of the “Middle Archaic” period as defined by Tom Hester. Notably, Carya pollen values at BK itself were consistently less than 10% (and episodically less than 2%) during both xeric periods.
Past range changes of Betula were also an important parameter for the reconstruction of climate changes, and, in relation to the present distribution of B. nigra in Eastern Texas (sole species of the genus [8]), annual precipitation levels of circa 116 cm are required for its growth under Modern temperature conditions [14]. This level is considerably higher than precipitation levels enjoyed today at BK (97 cm per annum). In this study, an enhanced range of this tree in the TGCP (5.3) was reconstructed in two periods. First, Early Holocene evidence for a southward migration of Betula occurs in initial spectra at BK (Betula max. 5.4%, est. age ~9000 BP). This phase might be correlated with final (declining) Betula at Hershop Bog [27], although dating controls are inadequate here for precision correlation (note three radiocarbon dates only). A subsequent, Middle Holocene (1) migration of Betula was then reconstructed at BK in Zone 5 (5400–4800 BP). This period consists of five consecutive spectra with Betula values well exceeding 2%, attaining an absolute maximum of 11.7%, suggestive of a presence in wet micro-environments in the Lower Guadalupe River valley. The high precipitation levels indicated correlate well with a southward migration of the forest limit in the TGCP (Figure 8, dashed line), with a relative increase in rainfall being modulated according to temperature conditions.
Although Early Holocene proxy temperature data are lacking in the present study, carbon isotope data in Central Texas are suggestive of a (relatively) warm climate [55,56]). Middle Holocene data in the TGCP region are more determinate and indicate higher mean temperatures according to range changes of tropical Rhizophora mangle (Section 6.2.5) and associated Rangia flexuoas. Importantly, the latter clam species enjoys a present distribution more tropical than Nueces Bay, where R. cuneata is presently exclusive [43,57], and Rhizophora pollen grains at NB were found in close proximity to R. flexuoasa. These higher temperatures and evaporation potentials suggest that precipitation differentials circa 9000 BP (first Betula migration) and 5500 to 5000 BP (second Betula migration) significantly exceeded 19 cm per annum or an increase in regional rainfall exceeding 10% over secular (century-level time scale) periods.
The results of the pollen analyses thus conform to the Holocene Climate Model (Table 1), while adding further data to the model reconstruction. The Early Holocene (here, 9000 to 6000 BP) climate was reconstructed as mesic (initially, ca. 9000 BP) to near-Modern (8000–6000 BP), with initial increased precipitation in the region (+19 cm per annum) circa ~9000 BP and the establishment of the forest limit in the Guadalupe River valley subsequently. Middle Holocene (1) (6000 to 4500 BP) was reconstructed as mesic, with a migration of the forest limit to the Mission River–Copano Bay region in tandem with a range expansion of Betula 5500 to 5000 BP. The latter further indicate exceptionally wet conditions in the Guadalupe River valley. A fully established Carya presence in the Guadalupe River valley is noted at 5000 BP. Coeval temperature conditions were warmer, moreover, according to NB data, with a presence of Rhizophora indicating fully tropical conditions in the central TGCP. The Later Middle Holocene (2) climate (4500–3000 BP) was reconstructed as xeric, with a retreat of the forest limit north of the Guadalupe River valley. Finally, a Late Holocene mesic phase was defined after 3000 BP, with a return of dense forest in the Guadalupe River valley and an extension to Copano Bay. Moreover, sustained high Carya values (in excess of 10%) obtained during the 3000 to 1000 BP period.

7.2. Sea-Level Model: History of Estuarine Marsh Development

According to the sea-level model (Table 2), shifts in the level of freshwater estuarine, salt-marsh pollen flora in the sediment core data were used to assess the effects of sea-level changes on coastal environments, where geological and archaeological data define sea-level change itself. The results of pollen analysis of sediment cores (Section 6.2.1, Section 6.2.2 and Section 6.2.3) and chronometry (Section 6.1) can now be compared to hypothetical pollen responses modelled according to background data (Section 3). Most data pertaining to the sea-level model derive from the SL, where pollen responses were predominantly influenced by coastal environments and dating controls are adequate as to purpose (Table 6). The pollen responses at the study sites are described periodically as follows:
  • Early Holocene high stand 8000 to 6000 BP. NB Zone 1 site maximum of Amaranthaceae (cf. Salicornia spp.); interpretation: Nueces Bay salt-marsh flora. BK Zone 2 site maximum of Amaranthaceae, Palmae presence; interpretation: Green Lake (Early Holocene embayment) salt-marsh flora with presence of palm on sand deposits. SL Zone 1 high Amaranthaceae and trace values of Typha and Cyperaceae, Amaranthaceae and Avicennia; interpretation: salt marsh with freshwater marsh elements, including telematics, near the Mission River with scattered mangrove stands.
  • Middle Holocene (1) still stand 6000 to 4500 BP. NB Zone 2 declining Amaranthaceae with Avicennia and Rhizophora, establishment of mangroves communities and contracting salt marsh. SL Zone 2 rise of Quercus, Typha and Cyperaceae; interpretation: increased freshwater marsh elements in Copano Bay, establishment of oak mottes with increase in sand sedimentation (barrier island development). SL Zone 3 declining Amaranthaceae, Potamogeton, Polygonum hydropiper and Cyperaceae present; interpretation: continued slow contraction of salt marsh and appearance of perennial aquatic (freshwater) species as well as telematics.
  • Middle Holocene (2) high stand 4500 to 3000 BP. SL Zone 4 rising Quercus, declining Amaranthaceae and Typha presence; interpretation: contraction of salt marsh, establishment of oak mottes with sand sedimentation. SL Zones 5-6 rising Amaranthaceae, Avicennia presence, Quercus variable; interpretation: salt marsh with freshwater marsh elements near the Mission River with rare mangrove stands and intermittent oak motte formation.
  • Late Holocene still stand 3000 to 1000 BP NB Zone 3 low Amaranthaceae with Avicennia; interpretation: establishment of mangroves communities and contracting salt marsh (most recent spectra indicate final expansion of salt marsh). SL Zone 7 rising Typha and Cyperaceae, presence of Nymphaea; interpretation: slow contraction of salt marsh and appearance of deep freshwater species (incl. water lily) as well as telematics.
Comparison of pollen data (Section 6.2.1, Section 6.2.2 and Section 6.2.3) with the sea-level model thus confirms the model with respect to the Early and Late Holocene periods, while failing to confirm the model for the Middle Holocene (1–2). High halophyte influence at all study sites in the Early Holocene was interpreted as a low-diversity coastal environment, correlated with rapid sea-level rise in the Gulf of Mexico as a whole [58]. Contrary to the sea-level model (Table 1, rows 2–3), environmental variability in the Middle Holocene periods (1–2) may be greater than that resolved by geological data. Unfortunately, this variability is defined by single-spectrum zones and requires further investigation for validation. However, a tentative correlation might be proposed between a circa 5800 BP freshwater estuarine phase defined at SL on Copano Bay and the benthic indicative value of a foraminiferal spectrum at the base of the Port Bay core, also on Copano Bay [35] (Figure 7). In the latter basal spectrum, the (limited) benthic data significantly indicate a possible fall in sea level. Finally, Late Holocene pollen data uniformly indicate still-stand conditions with a contraction of salt marsh (3000–1000 BP), with a close alignment of SL and Port Bay Marsh core environmental indicative values.
These initial pollen data thus indicate a significant level of variability in coastal marshland ecology during the Holocene, although the palynological assessment may be limited by the poor pollen productivity of deep, freshwater aquatics of strong indicative value (esp. low-salinity indicators, such as Nymphaea and Potamogeton), the isolated presence of which may be important for interpretations, though the absence is not significant. Relative Amaranthaceae provided the strongest indications (of relative salinity) in statistical terms, although a Modern rise in halophytes at NB was not emphatic, according to incremental sum of squares analysis [51]. Finally, freshwater estuarine development circa 5800 and after 3000 BP, which provides a highly productive biota [32], was also correlated with human occupation sites on the TGCP, according to Robert Ricklis (Figure 9), and geologically defined sea-level still stands. The palynological data presented here thus suggest a potential link between the high biotic productivity of estuarine marshes and sea-level still-stand phases in the TGCP during the last 8000 years.

8. Conclusions

Pollen studies conducted in the TGCP show the potential for low-energy reduced alluvial deposits for regional paleo-ecological work in sub-humid zones for use in reconstructing past vegetation patterns, while submerged bay deposits at NB further illustrate the possibilities of pollen preservation in sub-aqueous coastal situations. In terms of pollen taphonomy, the study sites at BK and SL are similar to shallow lacustrine sites with inlet (and outlet) streams, and sorting of pollen according to factors such as size is not supported [40]; indeed, the results of pollen analysis show a strong relation between afforestation potential according to baseline climate conditions and levels of arboreal pollen in basin catchments [59]. In relation to sea-level history research, the highest potential floral sensitivity to salinity changes was noted at estuarine sites associated with small fluvial systems. For example, the SL site, associated with a 25 km-long valley profile (Mission River), exhibited great statistical variation in salt-marsh flora, with order-of-magnitude changes in halophytic pollen response, while only moderate variation was exhibited at the NB site, associated with a 500 km-long valley profile (Nueces River). Inferably, this was due to higher continuous freshwater inputs at NB, with a Modern sea-level rise [35] producing only moderate rises of (+30%) halophytes in samples near the surface.
Pollen data from three sites on the TGCP suggest, moreover, a significant correlation between high levels of afforestation and nut-mast tree growth (Section 7.1), freshwater estuarine development (Section 7.2) and archaeological indices for higher human settlement densities during the last 9000 years, with enhanced occupation evident in the earlier Middle Holocene (6000–4500 BP) and the Late Holocene (3000–1000 BP). Particularly notable here is the pollen response of Carya, a tree whose nut masts form a concentrated, reliable and storable food source for human populations. Maximum Carya values (19.6%) occur circa 5000 BP at BK and at high values (10+ %) from 3000 to 1000 BP. In contemporary coastal areas, the expansion of productive (high K-capacity) marshlands, moreover, produces a rich fishing niche for hunter-fishers (Early Historic Karankawa [60]). Conversely, periods of rapid sea-level rise (up to +2 m), particularly in the Early Holocene and later Middle Holocene (4500–3000 BP), are associated with high levels of halophytes and, inferably, minimal barrier island development, coeval with a retreat of forest vegetation (and associated nut masts) in inland areas (Figure 8). A combined use of both coastal and inland (river-valley) foods by the same human populations as part of a seasonal cycle, as defined by Ricklis [60], would increase the amplitude of human population fluctuation through time to a significant degree. This amplitude enhancement is due to a positive correlation between periodic changes in inland- and coastal-zone K-capacities (Figure 9). Importantly, a sensitivity of biotic productivity levels of estuarine marshes to sea-level changes is indicated.
The amplitude of regional climate change during the Holocene was also great according to this pilot study, with secular variation in precipitation increasing by a differential of 19 cm per annum during aspects of the 6th millennium BP (a relative increase in precipitation of 20% relative to Modern conditions on the TGCP). Finally, Rhizophora mangle and associated Rangia flexuosa range changes to include Nueces Bay, Texas, are strongly suggestive of a 200+ km northward shift of the Intertropical Convergence Zone boundary during the Middle Holocene according to the climatic requirements of these fully tropical mangroves.

Supplementary Materials

The following supporting information can be downloaded at: https://www.mdpi.com/article/10.3390/quat6010019/s1, the Palo Alto pollen diagram supplemental file.

Author Contributions

B.M.A. is responsible for the fieldwork at Buckeye Knoll and Swan Lake, as well as all pollen laboratory work, pollen analyses, statistical analyses and writing. All authors have read and agreed to the published version of the manuscript.

Funding

National Science Foundation (US) grant no. SBR-942-3650; US Army Corps of Engineers, Galveston District: 41VT98 (Smithsonian trinomial) mitigation project; National Park Service (US), Palo Alto Battlefield Park testing project.

Data Availability Statement

Not applicable.

Acknowledgments

Robert Ricklis, Principal Investigator of Coastal Environments, Inc., Corpus Christi, Texas, US, is acknowledged for the formulation of research designs and the reported studies at Nueces Bay, Swan Lake and Buckeye Knoll and in the organization of the Nueces Bay marine fieldwork. Rolondo Garza’s (Palo Alto Battlefield Park, Cultural Resources) kind assistance at Palo Alto (see supplemental data) is acknowledged. Also acknowledged is the assistance of Jim Innes and Christ Orton (Cartographic Unit) in the drawing of figures by the Department of Geography, Durham University, DH1 3LE, UK. Finally, the kind assistance of the late Glen Doran (Florida State University, Tallahassee) in the operation of the Geoprobe 54 LT at Buckeye Knoll (41VT98) is gratefully acknowledged.

Conflicts of Interest

The author declares no conflict of interest.

References

  1. Texas Parks and Wildlife. Freshwater Inflows and Estuaries—Guadalupe Estuary. 2022. Available online: https://tpwd.texas.gov/landwater/water/conservation/freshwater_inflow/guadalupe/index.phtml (accessed on 1 November 2022).
  2. Environmental Protection Agency. Basic Information about Estuaries. 2017. Available online: https://19january2017snapshot.epa.gov/nep/basic-information-about-estuaries_.html (accessed on 1 November 2022).
  3. Christensen, N.L. The Biogeochemical Consequences of fire. In The Role of Fire in Ecological Systems; Academic Publishers: Syracuse, NY, USA, 1987. [Google Scholar]
  4. Delcourt, P.A.; Haccou, P.; Delcourt, H.R. Prehistoric Native Americans and Ecological Change: Human Ecosystems in Eastern North America since the Pleistocene; Cambridge University Press: Cambridge, MA, USA, 2004. [Google Scholar]
  5. Brown, D.O. Prehistoric subsistence strategies in northeastern central Texas. Bull. Tex. Archeolog. Soc. 1988, 59, 201–244. [Google Scholar]
  6. Hall, G.D. Pecan food potential in prehistoric North America. Econ. Bot. 2000, 54, 103–112. [Google Scholar] [CrossRef]
  7. Albert, B.M. Early and Protohistoric Agents of Vegetation Change in the Environs of Mission Rosario (41GD2) as Reflected in Palynological Data. Bull. Tex. Archeolog. Soc. 1999, 70, 189–195. [Google Scholar]
  8. Diggs, G.M.; George, R.J. Illustrated Flora of East Texas; Botanical Research Institute of Texas: Fort Worth, TX, USA, 2006. [Google Scholar]
  9. Blackmore, S.; Steinmann, J.A.; Hoen, P.P.; Punt, W. Betulaceae and corylaceae. Rev. Palaeobot. Palynol. 2003, 123, 71–98. [Google Scholar] [CrossRef]
  10. Bartlein, P.; Prentice, I.; Webb, T., III. Climatic Response Surfaces from Pollen Data for Some Eastern North American Taxa. J. Biogeogr. 1986, 13, 35–57. [Google Scholar] [CrossRef] [Green Version]
  11. Webb, T.; Bartlein, P.J.; Kutzbach, J.E. Climatic Change in Eastern North America during the Past 18,000 Years: Comparisons of Pollen Data with Model Results; Geological Society of America: Denver, CO, USA, 1987. [Google Scholar]
  12. Larkin, T.J.; Bomar, G.W. Climatic Atlas of Texas; Texas Department of Water Resources: Austin, TX, USA, 1983. [Google Scholar]
  13. Florida Museum. Mangroves. 2022. Available online: https://www.floridamuseum.ufl.edu/southflorida/habitats/mangroves/ (accessed on 1 November 2022).
  14. Yao, Q.; Liu, K.B.; Rodrigues, E.; Fan, D.; Cohen, M. A palynological record of mangrove biogeography, coastal geomorphological change, and prehistoric human activities from Cedar Keys, Florida, USA. Sci. Total Environ. 2022, 859, 160189. [Google Scholar] [CrossRef]
  15. Islam, M.S. Relative Sea Level Change in Bangladesh during the Holocene. Ph.D. Thesis, University of St. Andrews, St. Andrews, Scotland, 1997. [Google Scholar]
  16. Islam, M.S. Sea-level changes along Bangladesh coast: How much do we know about it? In Applied Geomorphology and Contemporary Issues, Geography of the Physical Environment; Mandal, S., Maiti, R., Nones, M., Beckedahl, H.R., Eds.; Springer: Cham, Switzerland, 2022; pp. 611–633. [Google Scholar]
  17. Edwards, R.J. Sea Level Studies/Low Energy Coasts Sedimentary Indicators. In Encyclopaedia of Quaternary Science; Elias, S.A., Mock, C.J., Eds.; Elsevier: Amsterdam, The Netherlands, 2013; pp. 396–408. [Google Scholar]
  18. Shennan, I.; Tooley, M.J.; Davis, M.J.; Haggart, B.A. Analysis and interpretation of Holocene sea-level data. Nature 1983, 302, 404–406. [Google Scholar] [CrossRef]
  19. Ricklis, R.; Blum, M. The geoarchaeological record of Holocene sea level change and human occupation of the Texas gulf coast. Geoarchaeology 1997, 12, 287–314. [Google Scholar] [CrossRef]
  20. Ryu, J.; Bianchette, T.A.; Liu, K.B.; Yao, Q.; Maiti, K.D. Palynological and geochemical records of environmental changes in a Taxodium swamp near Lake Pontchartrain in southern Louisiana (USA) during the last 150 years. J. Coast. Res. 2018, 85, 381–385. [Google Scholar] [CrossRef]
  21. Ryu, J.; Liu, K.B.; Bianchette, T.A.; McCloskey, T. Identifying forcing agents of environmental change and ecological response on the Mississippi River Delta, Southeastern Louisiana. Sci. Total Envviron. 2021, 794, 148730. [Google Scholar] [CrossRef]
  22. Ryu, J.; Liu, K.B.; McCloskey, T.A. Temporal variability in the relative strength of external drivers controlling ecosystem succession in a coastal wetland near Bayou Lafourche, southeast Louisiana, USA. Quat. Sci. Rev. 2022, 276, 107292. [Google Scholar] [CrossRef]
  23. Liu, K.B.; Lu, H.; Shen, C. A 1200-year proxy record of hurricanes and fires from the Gulf of Mexico coast: Testing the hypothesis of hurricane–fire interactions. Quat. Res. 2008, 69, 29–41. [Google Scholar] [CrossRef]
  24. McMahan, C.; Frye, R.; Brown, K. The Vegetation Types of Texas; Texas Parks and Wildlife Department: Austin, TX, USA, 1984. [Google Scholar]
  25. Britton, J.; Morton, B. Shore Ecology of the Gulf of Mexico; University of Texas Press: Austin, TX, USA, 1989. [Google Scholar]
  26. Brown, L.; Malcom, J. Environmental Geologic Atlas of the Texas Coastal Zone, Corpus Christi Area; Bureau of Economic Geology: Austin, TX, USA, 1976. [Google Scholar]
  27. Larson, D.A.; Bryant, V.M.; Patty, T.S. Pollen Analysis of a Central Texas Bog. Am. Mid. Nat. 1972, 88, 358–367. [Google Scholar] [CrossRef]
  28. Jacobsen, G.L.; Bradshaw, R.H. The selection of sites for palaeoecological studies. Quat. Res. 1981, 16, 80–96. [Google Scholar] [CrossRef]
  29. Caran, S.C.; McCulloch, S.; Jackson, J. Report on Geo-Archaeological Investigations of the Palo Alto Battlefield National Historic Site (41CF92), Cameron County, Texas; Morgan Printing: Austin, TX, USA, 2005. [Google Scholar]
  30. Robinson, R.L. Biosilica analysis of three prehistoric sites in the Choke Canyon Reservoir, Live Oak County, Texas: Preliminary summary if climatic implications. In Archaeological Investigations at Choke Canyon Reservoir, South Texas, the Phase I Findings, Choke Canyon; Hall, G.D., Black, S.L., Graves, C., Eds.; Center for Archaeological Research, The University of Texas at San Antonio: San Antonio, TX, USA, 1982; Volume 5, pp. 597–610. [Google Scholar]
  31. Toomey, R.S., III; Blum, M.D.; Valastro, S. Late Quaternary climates and environments of the Edwards Plateau, Texas. Glob. Planet. Chang. 2000, 7, 299–320. [Google Scholar] [CrossRef]
  32. Bousman, C.B.; Brown, D.O. Setting the stage: Previous paleoclimatic research in Texas and surrounding areas. Plains Anthropol. 1998, 43, 105–109. [Google Scholar] [CrossRef]
  33. Frazier, D. Depositional Episodes, Their Relationship to the Quaternary Stratigraphic Framework in the Northwestern Portion of the Gulf Basin; Bureau of Economic Geology: Austin, TX, USA, 1974. [Google Scholar]
  34. Blum, M.; Misner, T.; Collins, E.; Scot, D.; Morton, R.; Aslan, A. Middle Holocene Sea-Level Rise and Highstand at +2 M, Central Texas Coast. J. Sediment. Res. 2001, 4, 81–88. [Google Scholar] [CrossRef]
  35. Williams HF, L. Intertidal benthic foraminiferal biofacies on the central Gulf Coast of Texas: Modern distribution and application to sea level reconstruction. Micropaleontology 1994, 40, 169. [Google Scholar] [CrossRef]
  36. Rice, J.A.; Simms, A.R.; Buzas-Stephens, P.; Steel, E.; Livsey, D.; Reynolds, L.C.; Halihan, T. Deltaic response to climate change: The Holocene history of the Nueces Delta. Glob. Planet. Chang. 2020, 191, 103213. [Google Scholar] [CrossRef]
  37. Storey, D.A. Archeological Investigations at Two Central Gulf Coast Sites. Report No. 13; State Building Commission, Archaeological Program: Austin, TX, USA, 1968. [Google Scholar]
  38. Ricklis, R. Prehistoric Occupation of Central and Lower Texas Coast. Bull. Tex. Archeolog. Soc. 1995, 66, 265–300. [Google Scholar]
  39. Ricklis, R.A.; Weinstein, R.A.; Wells, D.C. (Eds.) Archaeology and Bioarchaeology of the Buckeye Knoll Site (41VT98); Victoria County, Texas; Coastal Environments, Incorporated: Baton Rouge, LA, USA, 2012. [Google Scholar]
  40. Holmes, P. Differential transport of spores and pollen-a laboratory study. Rev. Palaeobot. Palynol. 1990, 64, 289–296. [Google Scholar] [CrossRef]
  41. Troels-Smith, J. Characterization of Unconsolidated Sediments. Geological Survey of Denmark IV Vol 3 No 10; CA Reitzels Forlag, Axel Sandal: Copenhagen, Denmark, 1955; pp. 38–71. [Google Scholar]
  42. Black, B.A.; Heaney, M. Rangia Clam Investigations; Texas Water Development Board: Austin, TX, USA, 2014. [Google Scholar]
  43. Albert, B.M.; Pokorný, P. Pollen taphonomy and hydrology at Vranský potok versus Zahájí alluvial pollen sites: Methodological implications for cultural landscape reconstruction in the Peruc sandstone area, Czech Republic. Interdiscip. Archaeol. 2012, 3, 85–101. [Google Scholar] [CrossRef]
  44. Albert, B.M. Holocene aridification, vegetation change, sedimentation regime and limits of carbon isotope data as indicated by the alluvial pollen sites of Arroyo Grande and El Molino in North-Central Mexico. Quat. Int. 2015, 377, 2–17. [Google Scholar] [CrossRef]
  45. Albert, B.M. Prehistoric and Colonial land-use in the Chihuahuan Desert as inferred from pollen and sedimentary data from Coahuila, Mexico. Quat. Int. 2015, 377, 38–51. [Google Scholar] [CrossRef]
  46. Albert, B.M. Past vegetation influence on the hydrological cycle in the Chihuahuan Desert, North Mexico as indicated by data of four pollen sites. Quat. Int. 2015, 374, 168–181. [Google Scholar] [CrossRef]
  47. Albert, B.M. Climate, Fire, and land-use history in the oak-pine-hickory forests of Northeast Texas during the past 3500 years. Castanea 2007, 72, 81–90. [Google Scholar] [CrossRef]
  48. Albert, B.M. Acidification and pine expansion in East Texas according to pollen evidence from dual cores in alluvium. Castanea 2011, 76, 164–177. [Google Scholar] [CrossRef]
  49. Hall, R.; Erdélyi, R.; Hanna, E.; Jones, J.M.; Scaife, A.A. Drivers of North Atlantic polar front jet stream variability. Int. J. Climatol. 2015, 35, 1697–1720. [Google Scholar] [CrossRef]
  50. Faegri, K.; Iversen, J.; Kaland, P.E.; Krzywisnki, K. Textbook of Pollen Analysis, 3rd ed.; John Wiley and Sons: Chichester, UK, 1989. [Google Scholar]
  51. Grimm, E.C. CONISS: A Fortran 77 Program for Stratigraphically Constrained Cluster Analysis by the Method of Incremental Sum of Squares. Comput. Geosci. 1987, 13, 13–35. [Google Scholar] [CrossRef]
  52. Ramsey, C.B. Development of the radiocarbon calibration program. Radiocarbon 2001, 43, 355–363. [Google Scholar] [CrossRef] [Green Version]
  53. Hendy, I.L.; Minckley, T.A.; Whitlock, C. Eastern tropical Pacific vegetation response to rapid climate change and sea level rise: A new pollen record from the Gulf of Tehuantepec, southern Mexico. Quat. Sci. Rev. 2016, 145, 152–160. [Google Scholar] [CrossRef]
  54. Buckner, E. Evolution of Forest Types in the Southeast. In Proceedings of the Pine-Hardwood Mixtures: A Symposium on Management and Ecology of the Type, Atlanta, Georgia, 18–19 April 1989; USDA Forest Service General Technical Report SE-58. USFS: Asheville, NC, USA, 1989; pp. 27–33. [Google Scholar]
  55. Nordt, L.C.; Boutton, T.W.; Jacob, J.S.; Mandel, R.D. C4 Plant Productivity and Climate-CO2 Variations in South-Central Texas during the Late Quaternary. Quat. Res. 2002, 58, 182–188. [Google Scholar] [CrossRef]
  56. Nordt, L.C.; Von Fischer, J.; Tieszen, L. Late Quaternary temperature record from buried soils of the North American Great Plains. Geology 2007, 35, 159–162. [Google Scholar] [CrossRef] [Green Version]
  57. De Jesús-Carrillo, R.M.; Ocaña, F.A.; Hernández-Ávila, I.; Mendoza-Carranza, M.; Sánchez, A.J.; Barba-Macías, E. Mollusk distribution in four habitats along a salinity gradient in a coastal lagoon from the Gulf of Mexico. J. Nat. Hist. 2020, 54, 1257–1270. [Google Scholar] [CrossRef]
  58. Simms, A.R.; Lambeck, K.; Purcell, A.; Anderson, J.B.; Rodriguez, A.B. Sea-level history of the Gulf of Mexico since the Last Glacial Maximum with implications for the melting history of the Laurentide Ice Sheet. Quat. Sci. Rev. 2007, 26, 920–940. [Google Scholar] [CrossRef]
  59. Brown, A.G.; Carpenter, R.G.; Walling, D.E. Monitoring fluvial pollen transport, its relationship to catchment vegetation and implications for palaeoenvironmental studies. Rev. Palaeobot. Palynol. 2007, 147, 60–76. [Google Scholar] [CrossRef] [Green Version]
  60. Ricklis, R.A. The Karankawa Indians of Texas: An Ecological Study of Cultural Tradition and Change; University of Texas Press: Austin, TX, USA, 1996. [Google Scholar]
Figure 1. Map of pollen sites in the Texas Gulf Coastal Plain study region (inset, triangles), pollen analog sites (circles) and background sites (squares).
Quaternary 06 00019 g001
Figure 2. Age–depth graph of probability distributions of individual AMS and standard radiocarbon dates at Buckeye Knoll (BK) pollen site. Linear age estimates for dating of sediments used median calibrated ages.
Quaternary 06 00019 g002
Figure 3. Age–depth graph of probability distributions of individual AMS and standard radiocarbon dates at Swan Lake (SL) pollen site. Linear age estimates for dating of sediments used median calibrated ages.
Quaternary 06 00019 g003
Figure 8. Oscillations of the Southeastern United States Forest Limit (oak–pine–hickory mixtures) during the Holocene, as reconstructed by multi-site pollen data. Estimates as to the position of the forest–prairie ecotone were made according to 20% AP levels not including Pinus at examined pollen sites. See supplemental data for the Palo Alto pollen diagram for the Lower Rio Grande valley (please see the Palo Alto pollen diagram supplemental file).
Quaternary 06 00019 g008
Figure 9. Radiocarbon date distribution of Central Texas Coast shell midden sites (source: [18]). Among clam species found at regional shell middens, Rangia flexuosa is limited to pre-4500 BP contexts, while R. cuneata appears first after 3000 BP (modified from [2,12]). Breaks in human occupation of the TGCP are inferred according to both a hiatus in dated remains as well as the absence of coeval diagnostic lithic artefacts for the periods 6700 to 6000 BP and 4000 to 3000 BP.
Quaternary 06 00019 g009
Table 1. Summary climate history model and testing by palynology.
Climate PeriodApprox. DatingHypothetical Pollen Response
Early Holocene mesic phase9000–6000 BPHigh AP
Middle Holocene (1) mesic phase6000–4500 BPAP rise with Betula
Middle Holocene (2) xeric phase4500–3000 BPAP decline
Late Holocene mesic phase3000–1000 BPAP rise with Carya rise
Table 2. Summary sea-level history model and testing by palynology.
Sea-Level Period/OscillationApprox. DatingHypothetical Pollen Response
Earlier Holocene high standCirca 7700 BPSalt-marsh pollen flora rise
Middle Holocene (1) still stand6000–4500 BPFreshwater estuarine pollen flora rise
Middle Holocene (2) high stand4500–3000 BPSalt-marsh pollen flora rise
Late Holocene still stand3000–1000 BPFreshwater estuarine pollen flora rise
Table 3. Troels-Smith’s description of Buckeye Knoll (BK) sediments [41].
Depth RangeGranulometryMunsell HueOther Notes
0–45 cmSilt 3, sand 1, humus +10 yr3/1 very dark grayHumus 0–10 cm
45–60 cmClay 3, silt 110 yr4/1 dark gray
60–90 cm Clay 3, silt 110 yr3/1 very dark gray
90–110 cm Clay 3, silt 110 yr5/2 grayish brownRedox (red-colored) features
110–120 cmClay 2, silt 1, sand 110 yr2/1 blackRedox (red-colored) features, burned clay nodules
120–130 cm Silt 2, sand 210 yr3/1 very dark gray
130–145 cmClay 3, silt 110 yr5/2 grayish brown
145–450 cmClay+, silt 3, sand 110 yr3/2 grading to 3/1Rangia shell fragments
450–460 cmSilt 1, sand 310 yr4/1 dark grayCaCO3
460–490 cm Clay 1, sand 310 yr5/1–6/2 gray grading to light brownish gray
490–550 cmClay 410 yr7/4 very pale brownDeep weathering
Table 4. Troels-Smith’s description of Swan Lake (SL) sediments [41].
Depth RangeGranulometryMunsell HueOther Notes
0–12 cmClay 3, silt 110 yr3/1 very dark grayIlluviation of clay
12–53 cmSand 410 yr5/1 grayLower limit limus 4 (sharp boundary)
53–81 cmClay 3, silt 110 yr3/1 very dark grayIlluviation of clay
81–285 cmClay 3, silt 110 yr5/1 grayRedox (red-colored) features
285–305 cm Sand 410 yr5/1 grayLower limit limus 4 (sharp boundary)
305–460 cmClay 3, silt 110 yr5/1 gray
460–480 cm Sand 410 yr5/1 grayLower limit limus 4 (sharp boundary)
480–525 cmClay 3, silt 110 yr5/1 gray
525–548 cmSand 410 yr5/1 graySlumping 548–600 cm
Table 5. Troels-Smith’s description of Nueces Bay (NB) sediments [41].
Depth RangeGranulometryMunsell HueOther Notes
0–60 cm Clay 3, sand 110 yr6/1 gray
60–140 cm Clay 2, sand 210 yr6/1 gray
140–240 cmClay 3, sand 110 yr6/1 gray
240–300 cmClay 2, sand 210 yr6/1 grayRangia cuneata layer
300–400 cm Clay 3, silt 110 yr6/1 gray
400–440 cm Clay 3, silt 110 yr6/1 grayRangia flexuosa layer
440–790 cm Clay 3, silt 110 yr6/1 gray
Table 6. Inferred taphonomic characteristics of pollen sites (BK, SL and NB).
Pollen TaphonomyCoastal Floral ComponentInland Floral Component
BKFluvial hydrological pre-2000 BP, air and gravity deposition post-2000 BP Significant pre-7000 BP, minimal post-7000 BP Dominant (regional pre-2000 BP, local post-2000 BP)
SLAir and gravity, sea transport (Pinus)Dominant, localNo significant representation
NBFluvial hydrological from inland areas, air transport from coastal areasSignificant, localSignificant, regional
Table 7. Pollen site dating by radiocarbon, geology and biostratigraphy. Materials for dating BK and SL derived from bulk sediments in sediment cores. The dating of the NB site relied on relative biostratigraphic indications of Rangia spp. according to finds in regional archaeological sites and geological dating according to the emergence of base-level conditions at the coring site (delta formation at site sedimentation itself prior to 8000 BP can thus be excluded).
Pollen SiteDepth (cm)Material DatedLab Number14C AgeCalibrated Age BP Relative Age BP
BK420–440Humic fractionBeta 1642226820 ± 407700–7660N/A
BK370–390Humic fractionBeta 164215260 ± 406010–5940N/A
BK240–260Humic fractionBeta 1642204420 ± 405050–4950N/A
BK190–210Humic fractionBeta 1642003920 ± 404420–4290N/A
BK150–170Humic fractionBeta 1642182780 ± 1103210–2740N/A
BK70–90Humic fractionBeta 1642171840 ± 401830–1720N/A
SL490–510Humic fractionBeta 1949026130 ± 407130–6940N/A
SL425–450Humic fractionBeta 1949015150 ± 405940–5790N/A
SL250–280Humic fractionBeta 1948993920 ± 404410–4290N/A
SL80–102Humic fractionBeta 194900130 ± 50250–0N/A
NB790–800Core base levelN/AN/AN/AGeological 8000 max.
NB400–450Rangia flexuosaN/AN/AN/ABiostrat. 6000–4500
NB250–300Rangia cuneateN/AN/AN/ABiostrat. post-3000
Table 8. Present vegetation types and Modern AP levels defining the forest–prairie ecotone; 95% confidence interval boundaries used to establish forest–prairie ecotone (AP% band) are in bold.
Pollen SitePalo Alto [29]Nueces BaySwan LakeBuckeye Knoll
Latitude and longitude26°0′50.0″ N, 97°28′33.0″ W27°50′19.3″ N, 97°29′11.5″ W28°3′10.2″ N, 97°9′49.9″ W28°39′16.4″ N, 96°57′40.0″ W
Vegetation typePrairiePrairiePrairieForest
Top-set AP% and pollen count (#)3.5% (189)16.1% (149)16.4% (186)36.8% (190)
95% conf. inter. upper bound7.5%23.0%22.4%44.1%
95% conf. inter. lower bound1.5%10.6%11.4%30.0%
Table 9. Summary pollen percentages at mangrove analog sites.
Rhizophora 1Rhizophora 2Avicennia 1Avicennia 2
Extent of mangle<1 hectares>10 hectares~10 hectares~10 hectares
Sample aspectCenterCenterEdgeCenter
Rhizophora0.01.00.00.0
Avicennia0.00.02.71.7
Pinus6.546.011.41.3
Deciduous trees10.427.522.21.3
Amaranthaceae33.85.030.66.4
Bataceae1.20.55.489.0
Other herbs35.117.027.80.4
Tropicals (varia)13.03.00.00.0
Disclaimer/Publisher’s Note: The statements, opinions and data contained in all publications are solely those of the individual author(s) and contributor(s) and not of MDPI and/or the editor(s). MDPI and/or the editor(s) disclaim responsibility for any injury to people or property resulting from any ideas, methods, instructions or products referred to in the content.

