Article

Evaluation of the Linkages between Ecosystem Services and Land Use/Land Cover Changes in Matenchose Watershed, Rift Valley Basin, Ethiopia

Faculty of Biosystems and Water Resources Engineering, Institute of Technology, Hawassa University, Hawassa P.O. Box 05, Ethiopia
*
Author to whom correspondence should be addressed.
Quaternary 2023, 6(1), 13; https://doi.org/10.3390/quat6010013
Submission received: 20 December 2022 / Revised: 5 January 2023 / Accepted: 1 February 2023 / Published: 3 February 2023

Abstract

:
The global ecosystem services that are essential to sustaining life on the planet have been disrupted by different anthropogenic activities. This study’s objective is to examine how ecosystem services vary with changes in land use and land cover (LULC) across 29 years at the Matenchose watershed. Landsat images for 1991 (TM), 2003 (ETM+), and 2020 (OLI-8) were used for the categorization of LULC. To evaluate the changes in ecosystems service valuations (ESVs) as a result of LULC changes in combination with ArcGIS, the value transfer valuation approach was utilized. Farmlands, towns, and bare land exhibited growing trends among the five major LULC classes, but forest and grassland showed declining trends. From 1991 to 2020, ESVs decreased by a total of US $157.24 million due to the LULC modifications. In terms of ESV functions, provisional services (US $89.23 million) and cultural services (US $69.36 million) made up the majority of the loss of ESV. Overall, the reduction of ESV showed the environment is degrading because of existing LULC changes, this calls for immediate sustainable land management intervention by responsible actors. To attain sustainable development goals regarding food and life on the land, it is imperative to reverse the loss of ecosystem services.

1. Introduction

Ecosystem services (ES) are indispensable to maintaining life on earth, but anthropogenic activities are placing a strain on them [1]. Numerous essential direct and indirect services that are essential for human well-being are provided by the ecosystem [2]. The majority of ecosystem services in the world are crucial to keeping life on Earth alive. The discussion of ESs in the scientific and policy areas has grown quickly [3,4].
One of the key factors contributing to the ES’s decline is the change in land use/cover (LULC), which is mostly brought on by human activity and is characterized by deforestation, the rise of agriculture, urbanization, and built-up areas [2,5,6,7].
A few types of research on the relationship between LULC dynamics and ESs have been carried out in Ethiopia. For instance, Kindu et al. [6] studies in the Shashemen Munisa forest revealed that ecosystem service values (ESVs) reduced from US $164.6 million in 1973 to US $118.7 million in 2012. Similar finding was made by Tolessa et al. [2], who discovered that deforestation was the primary cause of the 68% reduction in the total ESVs in Ethiopia’s Toke Kutaye district. Following Gashaw et al. [8], the value of the upper Blue Nile of the Andessa watershed decreased from US $26.83 million in 1985 to US $15.25 million in 2045. Similarly, Godebo et al. [9] discovered that the ESV at the Bilate Alaba subwatershed decreased from US $35.23 million in 1972 to US $25.87 million in 2017. Mekurai et al. [10] investigated that ESVs reduced to US $62 million over 47 years in Central Rift Valley Basin. Another study conducted by Biratu et al. [11] in central Ethiopia has found a reduction of ESV of US $58.3 million. Shiferaw et al. [12] in the Gojeb watershed of the Omo-Gibe Basin, Shiferaw et al. [13] in Afar, Tolessa et al. [14] in the Dendi watershed, Aneseye et al. [1] in the Winike watershed of Omo-Gibe basin, Muleta and Biru [15] in Guder watershed reported ESV reduction by US $551, 112, 47, 36.4, 36.3 and 6.2 million respectively. Instead, an increase in ESV in the Gedeo–Abaya Agroforestry Dominated Landscape led to an annual total ESV of $147 million in 2015, up 14.2% ($18.3 million) from $129 million in 1986 [16].The area most susceptible to changes in ecosystem services at the landscape level can be identified by combining LULC and ecosystem service valuation data, which can also serve as an entry point for future land management opportunities [1].
Another study found that around 17.7% of Ethiopia’s entire earth’s surface ESV has been lost due to land degradation, which is primarily caused by LULC shifts [17]. Although, there have been numerous kinds of research on LULC alterations in Ethiopia, they have largely concentrated on the fluctuations of these changes and their underlying causes, with a diminutive focus on how these changes affect ESV [2,6,9]. Additionally, there has not been much research done in the southern Rift Valley Basin regarding the variances in ecosystem services along with changes in land uses. In Ethiopia, there were few attempts to quantitatively evaluate how LULC modifications affected ESs.
Owing to Ethiopia’s fast population expansion and increasing food needs, agriculture has significantly increased in many regions of Ethiopia over the past few decades at the cost of forest, shrub land, and grasslands [18,19,20,21]. Current scientific reports from various regions of Ethiopia have shown that there is a continual upward trend in the alteration of traditional ecologies to urban and farmland [18,22,23].
Similar to other Sub-Saharan nations, urbanization, deforestation, recurring droughts, and growth in the number of people and animals in Ethiopia are driving factors in land use changes [10,19,24].
Concern about how to lessen the negative consequences of LULC modification on natural ecosystems and the services they provide is spreading throughout the world. Many initiatives have been made by research communities worldwide to better comprehend, model, value, and manage ESs [2,4]. Combining LULC data of the biomes current in an area of interest is a standard practice for the computation of ESVs established on the ES catalogue [6,25].
Given the benefits of diverse ecosystems for a wealth of anthropological and the possible effects of social activity on those profits, ESVs have drawn increasing attention from a variety of stakeholders [2,4,8,25,26].
Two approaches to quantifying ecosystem service values were tested on a global scale [25,27]. The first approach makes a procedure of a benefit transfer to evaluate the deviations in ESVs on both a temporal and spatial scale. This approach is established on the utilization of universally compiled data sets for various biomes [5,25,27,28]. The 2nd approach relies on the consumption of the Integrated Valuation of Ecosystem Services and Tradeoffs model, which explains variations in ESs with regard to either economics or biophysics [29,30].
In response to changes in LULC, a current global dataset collection that was updated in 2020 by De Groot et al. [31] was utilized to compute the ecosystem service values throughout the period 1991–2020. This data set offered comprehensive values for proxy biomes with the aid of the ESVD. To stop the loss and ensure sustainability in the Rift Valley Basin, landscape-scale studies with relation to previous LULC transitions that cause the loss and degradation of natural resources are essential. By examining LULC variations in the Matenchose watershed in the central Rift Valley Basin and quantifying ES functionality, this study aimed to evaluate the ecosystem services values. The objective of this study was focused to evaluate the effects of LULC changes on the ecosystem service values between 1991 and 2020.

2. Materials and Methods

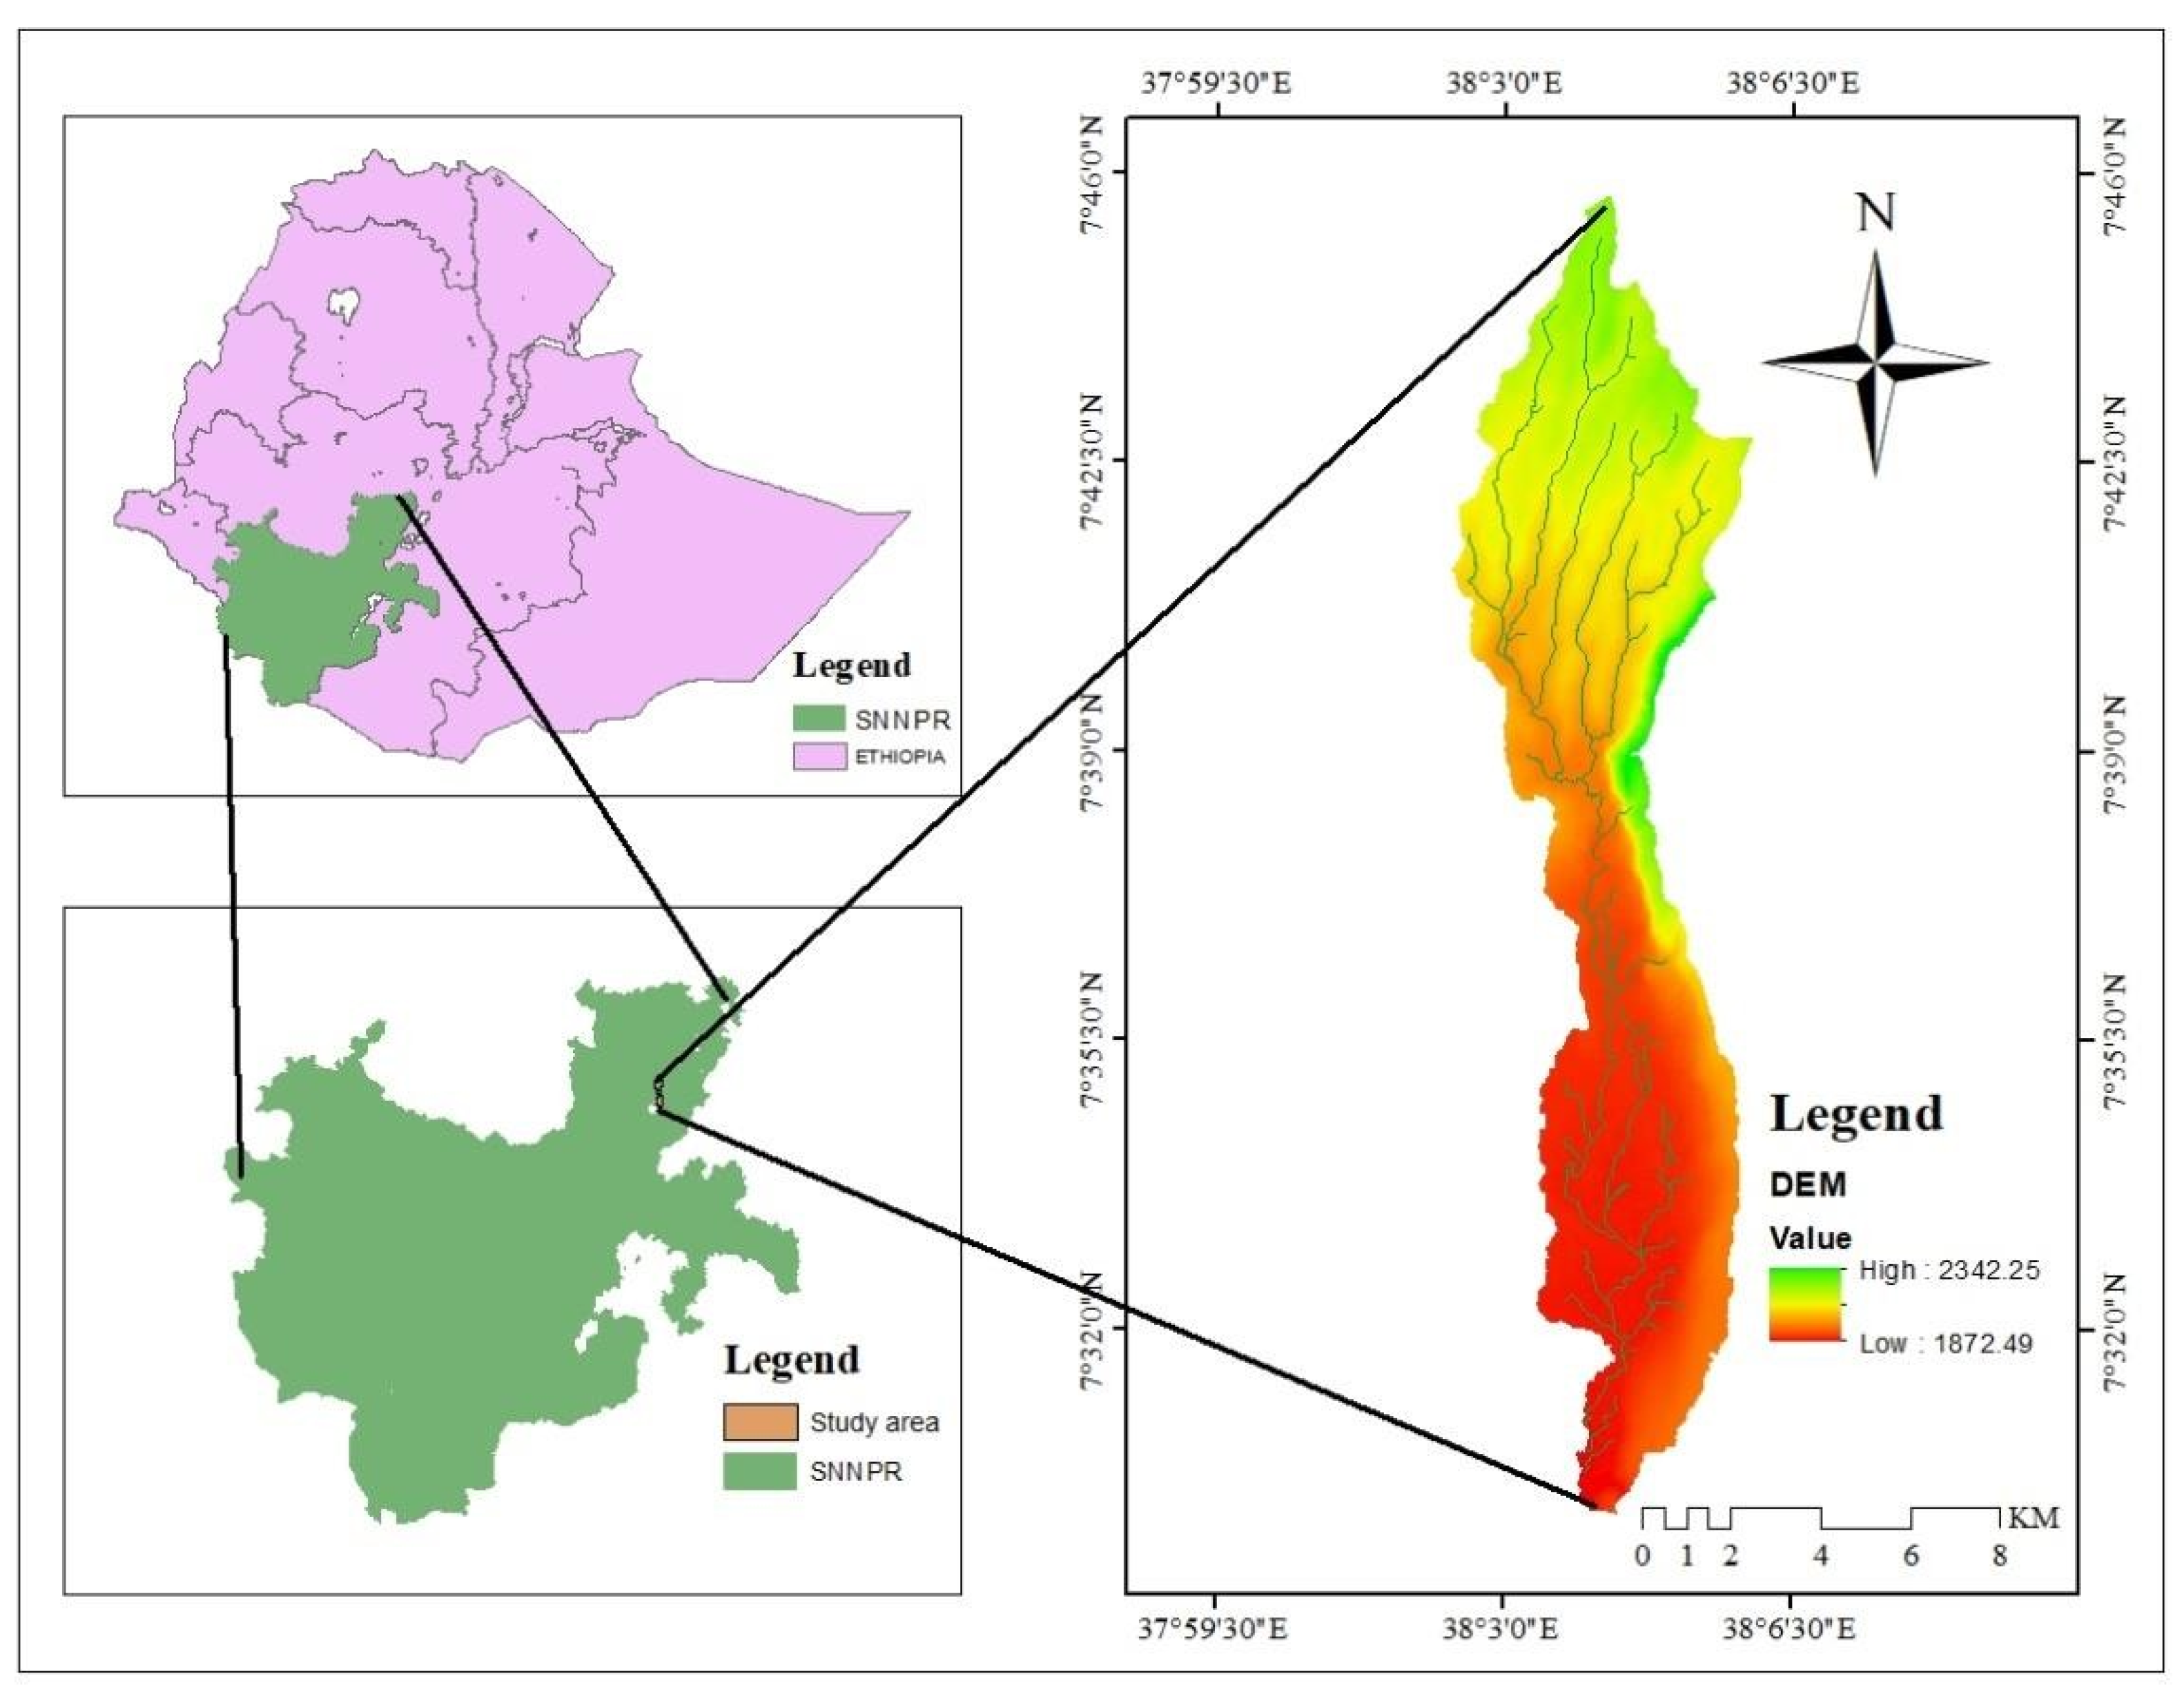
2.1. Description of Matenchose Watershed

The Matenchose watershed is a geographical area with latitudes of 7°30′ to 7°46′ north, 38°2′ to 38°6′ east, and elevation of 1872 to 2342 m above sea level (Figure 1). Its area is 9990.42 hectares (ha). It is situated 200 km south of Addis Ababa, the capital city of Ethiopia, and 120 km from the Hawassa regional state. The study was conducted in Ethiopia which was found in East Africa.
Four important stations in the watershed; Alaba Kulito, Fonko, Hossana, and Wulbereg for which data were available for the previous 32 years were used to calculate the watershed rainfall. In March through May and June through September, the rainfall pattern is bimodal across all sites. According to Ethiopian national meteorological agency, the study area’s mean maximum temperature in February is 26.9 °C and its mean minimum temperature in July is 10.2 °C.
The study area’s natural topography is varied, ranging from flat to rough. The northeastern and southeasterly parts of the region have mountainous terrain. The area’s lowest point lies in the southwest, in the floodplains of Shashogo Woreda, near the base of the main Ethiopian Rift. The physiographic structure of the area was created by rifting, erosion, and deposition processes [32]. The Matenchose watershed has favorable topographic conditions for agriculture. In locations with flat topography, flooding is a common issue. Slopes range from gentle to relatively steep at the research site, with gentle slopes predominating.
Temperature and rainfall, which remain significantly impacted by elevation, have a considerable impact on the type of vegetation in Ethiopia [33]. Farmers in the watershed under study use irrigation and rainfed agriculture to grow food and income crops. In the Matenchose watershed, maize, teff, sorghum, wheat, and pepper are the principal crops grown. Numerous tree species, primarily eucalyptus and pleasant African acacia species, had been found in the watershed. These tree species are established all over the study watershed, however, they are most prevalent in the cultivated areas.

2.2. Land Use and Land Cover Data

The majority of spatial data were produced using a global positioning system (GPS) with a positional error of ±3 m from DEM and satellite images. Landsat imagery was used to generate LULC datasets. The three research years (Landsat-5TM 1991, Landsat 2003, and Landsat-8 OLI-TIRS 2020) were covered by multi-temporal Landsat images. A total of 244 ground actual points were obtained through actual field survey utilizing the global positioning system (GPS) and Google Earth to confirm the accurateness of the LULC cover map for 2020. Google Earth’s LULC maps for the years 1991 and 2003 were used, and 104 and 174 reference points, respectively, were gathered for each research year [34,35]. The Southern Regional Agriculture Office provided the information, which included meteorological, soil, watershed boundary, and land management practices. For convenience of usage, the United States Geological Survey (USGS) made the three years’ worth of satellite images available for download at https://earthexplorer.usgs.gov, which was retrieved on 25 October 2022 (Table 1).
The Landsat images were TM, ETM+, and OLI; their 30 m and 30 m resolution is considered to be medium. The data gathering and image resolution must be as comparable as possible to identify changes in this watershed utilizing images from several years. ArcGIS 10.4 was used for LULC mapping [36].
Each pixel was classified using the parametric maximum probability view according to the accepted ground truth. During the study period of 1991 to 2020, Google Earth and field observations helped to learn about LULC [37,38]. The following classification schemes have been devised for digital analysis: The classification system has been modified by LULC’s definitions [39], and the selected land use and land cover types were patterned and endorsed by ground truthing (Table 2).
In this research, sorting correctness constructed on correctness matrix scrutiny was assessed using kappa coefficient analysis, user accuracy, producer accuracy, and overall accuracy [40,41]. Remote sensing accuracy assessment is necessary and crucial to provide evidence of the precision of the categorization achieved [42].
Quantities for each LULC type between the periods of 1991–2020, 1991–2003, and 2003–2020 were executed to inspect land cover changes in the research watershed (Figure 2). Even though the LULC indicators were obtained in a diversity of ways, the difference in LULC in the three periods was defined by the variation in the values of the same for the years 1991, 2003, and 2020, which are indicated in Equations (1) and (2) below.
Δ A = ( A t 2 - A t 1 ) A t 1 × 100
where ΔA refers to the alteration of LULC (%) among years, At2 and At1 is the area of the LULC at the years of t1 and t2.
Equation (2) is used to estimate the spatial changes in LULC variations by comparing the rate at which LULC varies throughout years.
Δ S = A - C T
where ΔS (ha/yr) is the rate of variation in LULC/year, A refers to the current LULC area, C refers to former LULC, and T is the time duration among study years.

2.3. ESV Assessment

The ecosystem services value coefficients have undergone various modifications by different scholars in the world since its establishment [5,25,28], however, these changes have drawn criticism for the underrepresentation of other regions, specifically Ethiopia, and some ESV were overestimated [2]. The ESVD was revised in 2020 with assistance from the UK Department for Environment in acknowledgment of the importance of having information on spatial ESVs to assist decision-making [31]. The newly revised ESVD added supplementary factors, and information on the study site position, extent and circumstance [10].
The recent ESVD was evolved to overcome the above shortcoming which was updated with the support of different stakeholders in the world [31]. The procedures and methods to estimate changes in ecosystem services valuation were based on the flow chart described in Figure 2.
The most representative biome was used as a proxy for each LULC category including a cultivated area for agricultural land, Tropical forest for forest land, a built-up area for settlement, a desert for bare land, and grassland for grassland. Because both are primarily utilized for producing food for a rising population, cropland can be used to represent cultivated land in our land use. Although none of the proxies were precise fits, they all did a fair job of approximating the values for each recognized land use. The current land use identified in the study area can therefore be represented by the proxy used (Table 3).
The value transfer valuation approach and the recently updated global ESVD were used to assess the changes in ESVs in response to the dynamics of LULC changes in the Matenchose watershed [31].
The following Equations (3)–(5) were used to determine the total ESVs, individual and percentage change in ESVs between the years based on the aforementioned values set and the proxies used for each identified LULC class [9,14,26].
ESV i = ( V ij × A i )  
ESV f = ( A i × V fi )
ESV   change   ( % ) = ( ESV t 2 - ESV t 1 )   ESV t 1  
Additionally, for the specified land uses, the 23 distinct ecosystem services provided by de Groot et al. [31] for biomes were taken into consideration (Table 4).

2.4. Elasticity of ESV Change with Land Use and Land Cover

In this situation, the percentage change in ESV in response to changes in the study watershed’s LULC over a specific period was measured using the elasticity of ESV change. The Value coefficient (VC)of a certain LULC class was modified by 50% while maintaining the VC for the other LULC classes [6,26]. Equation (6) was used to evaluate elasticity in this specific research.
CS = ( ESV a - ESV b ESV i ) ( VC aL - VC aL L )  
where CS refers to the Coefficient of sensitivity, ESVb and ESVa are primary and revised total probable ecosystem service values respectively, and VCak and VCbk refer to primary and probable value coefficients (US $/ha−1/yr−1) for L type of LULC.

3. Results and Discussions

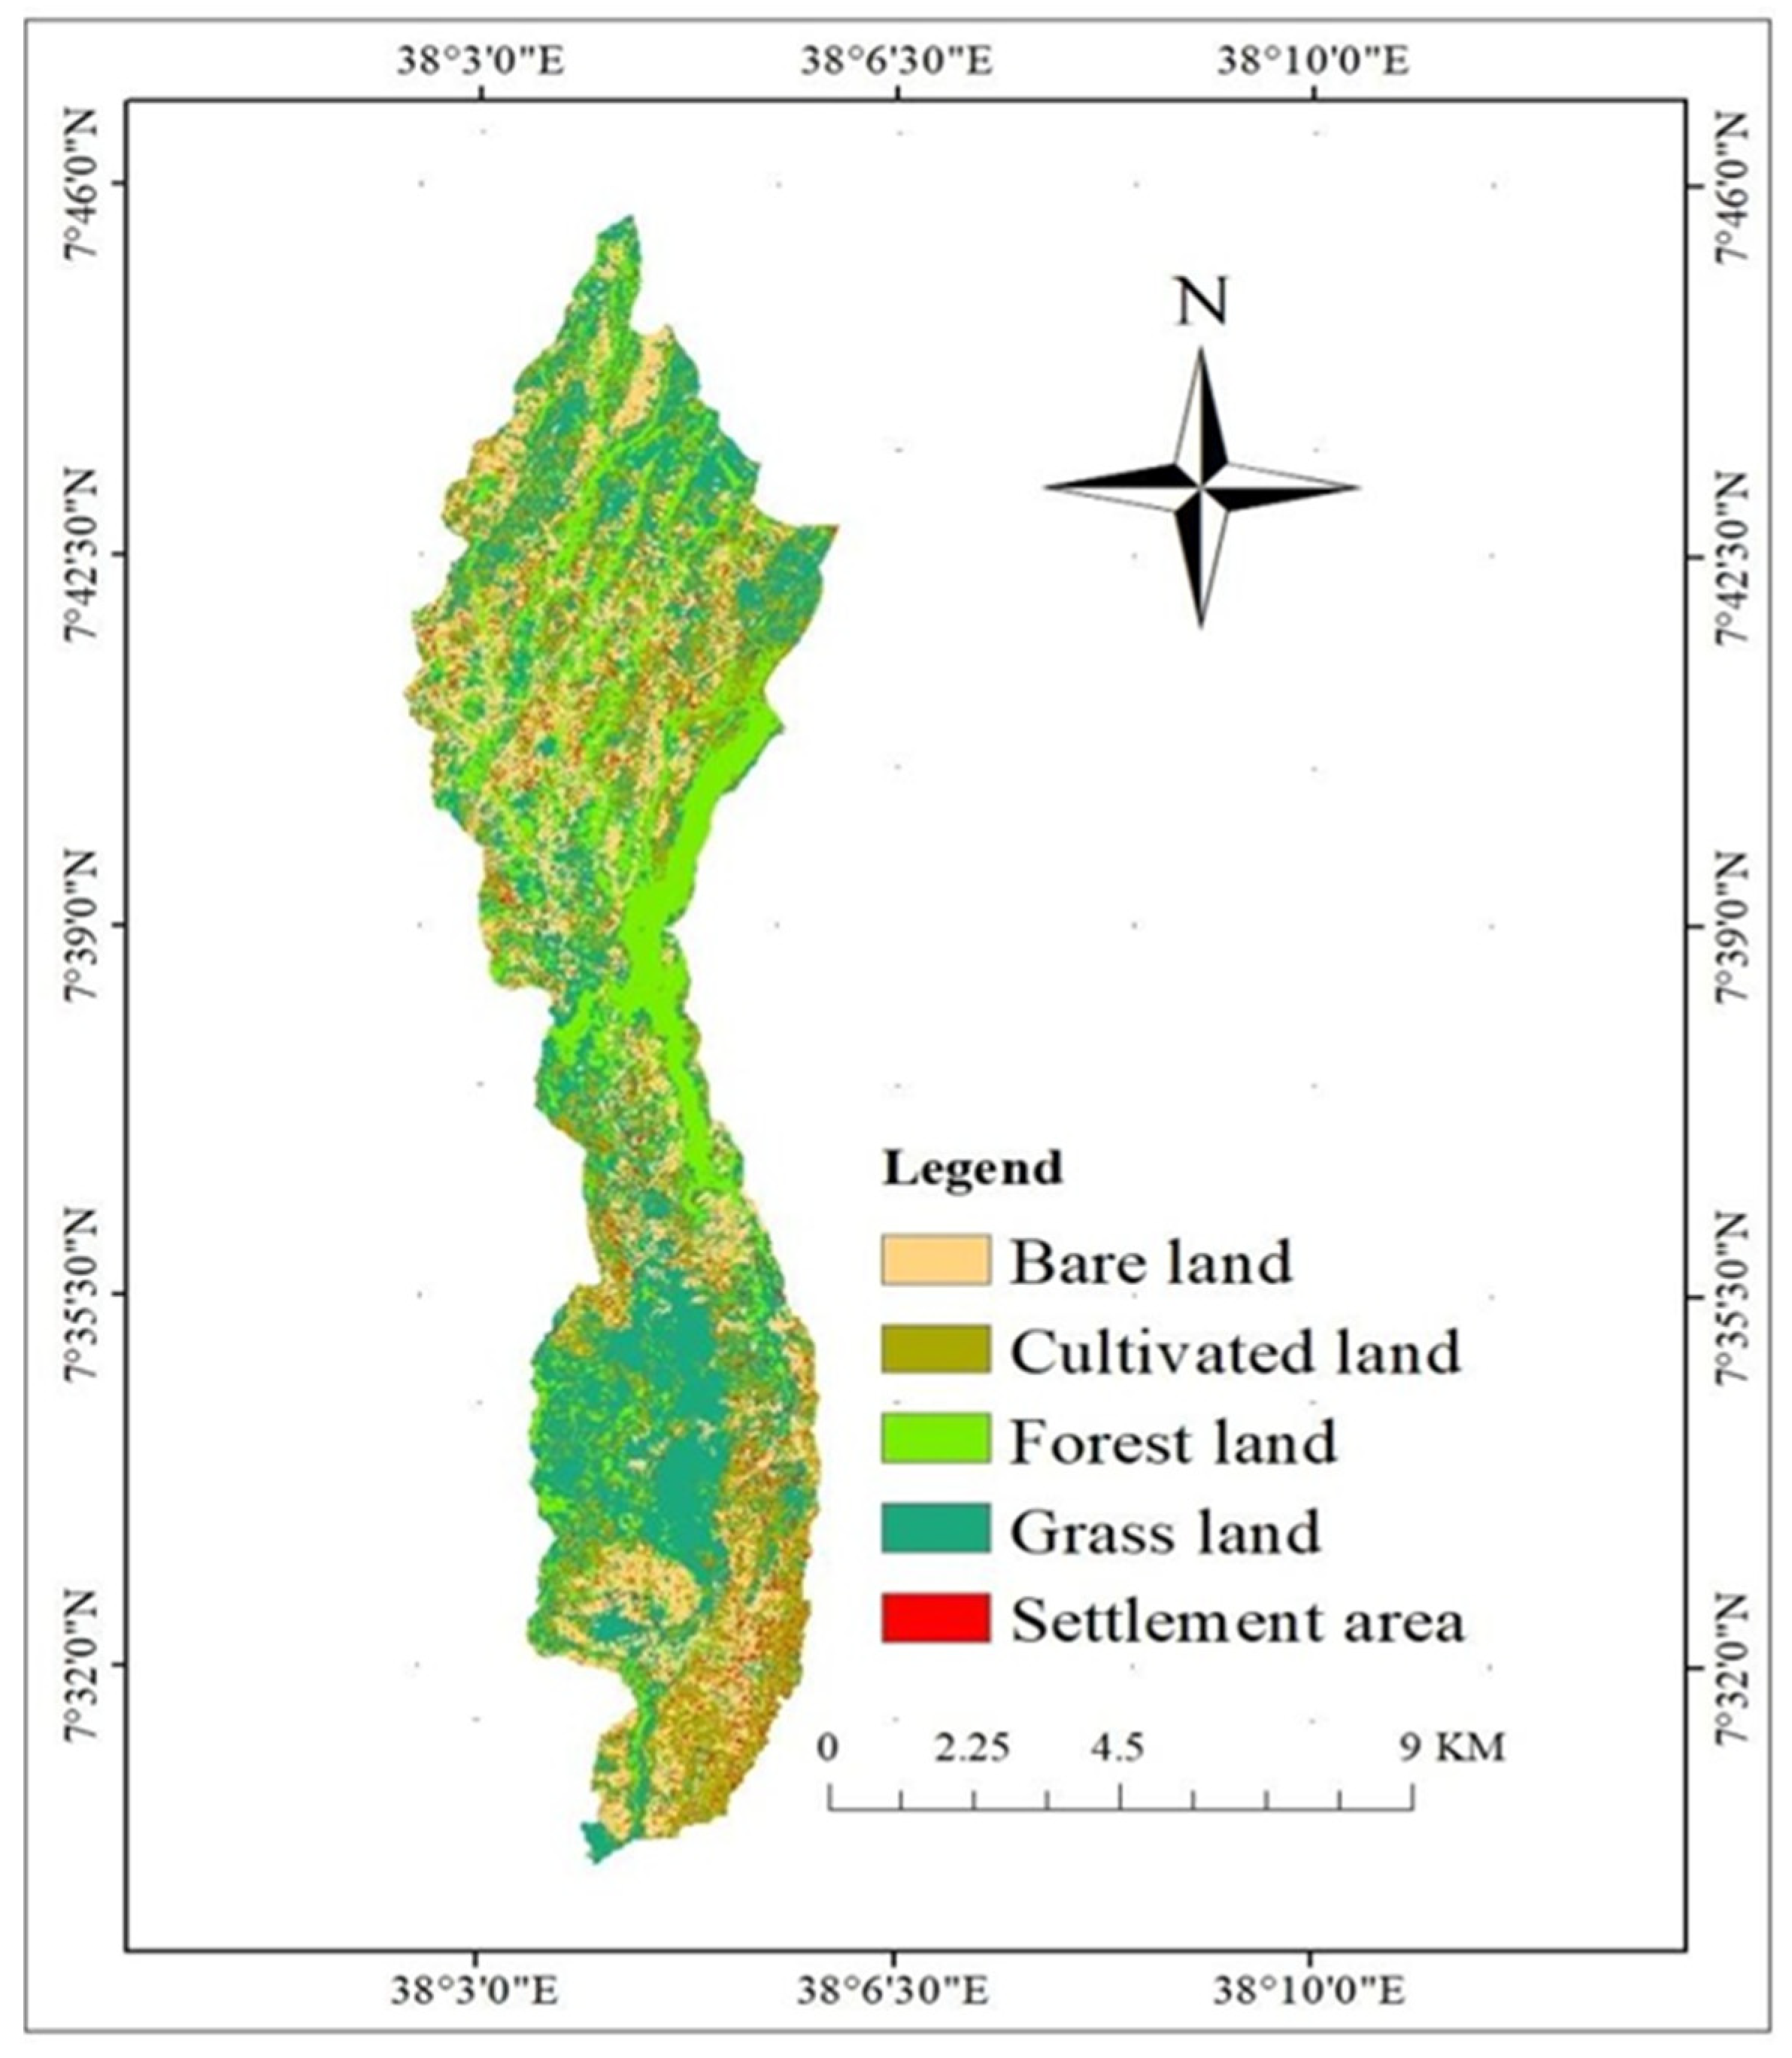
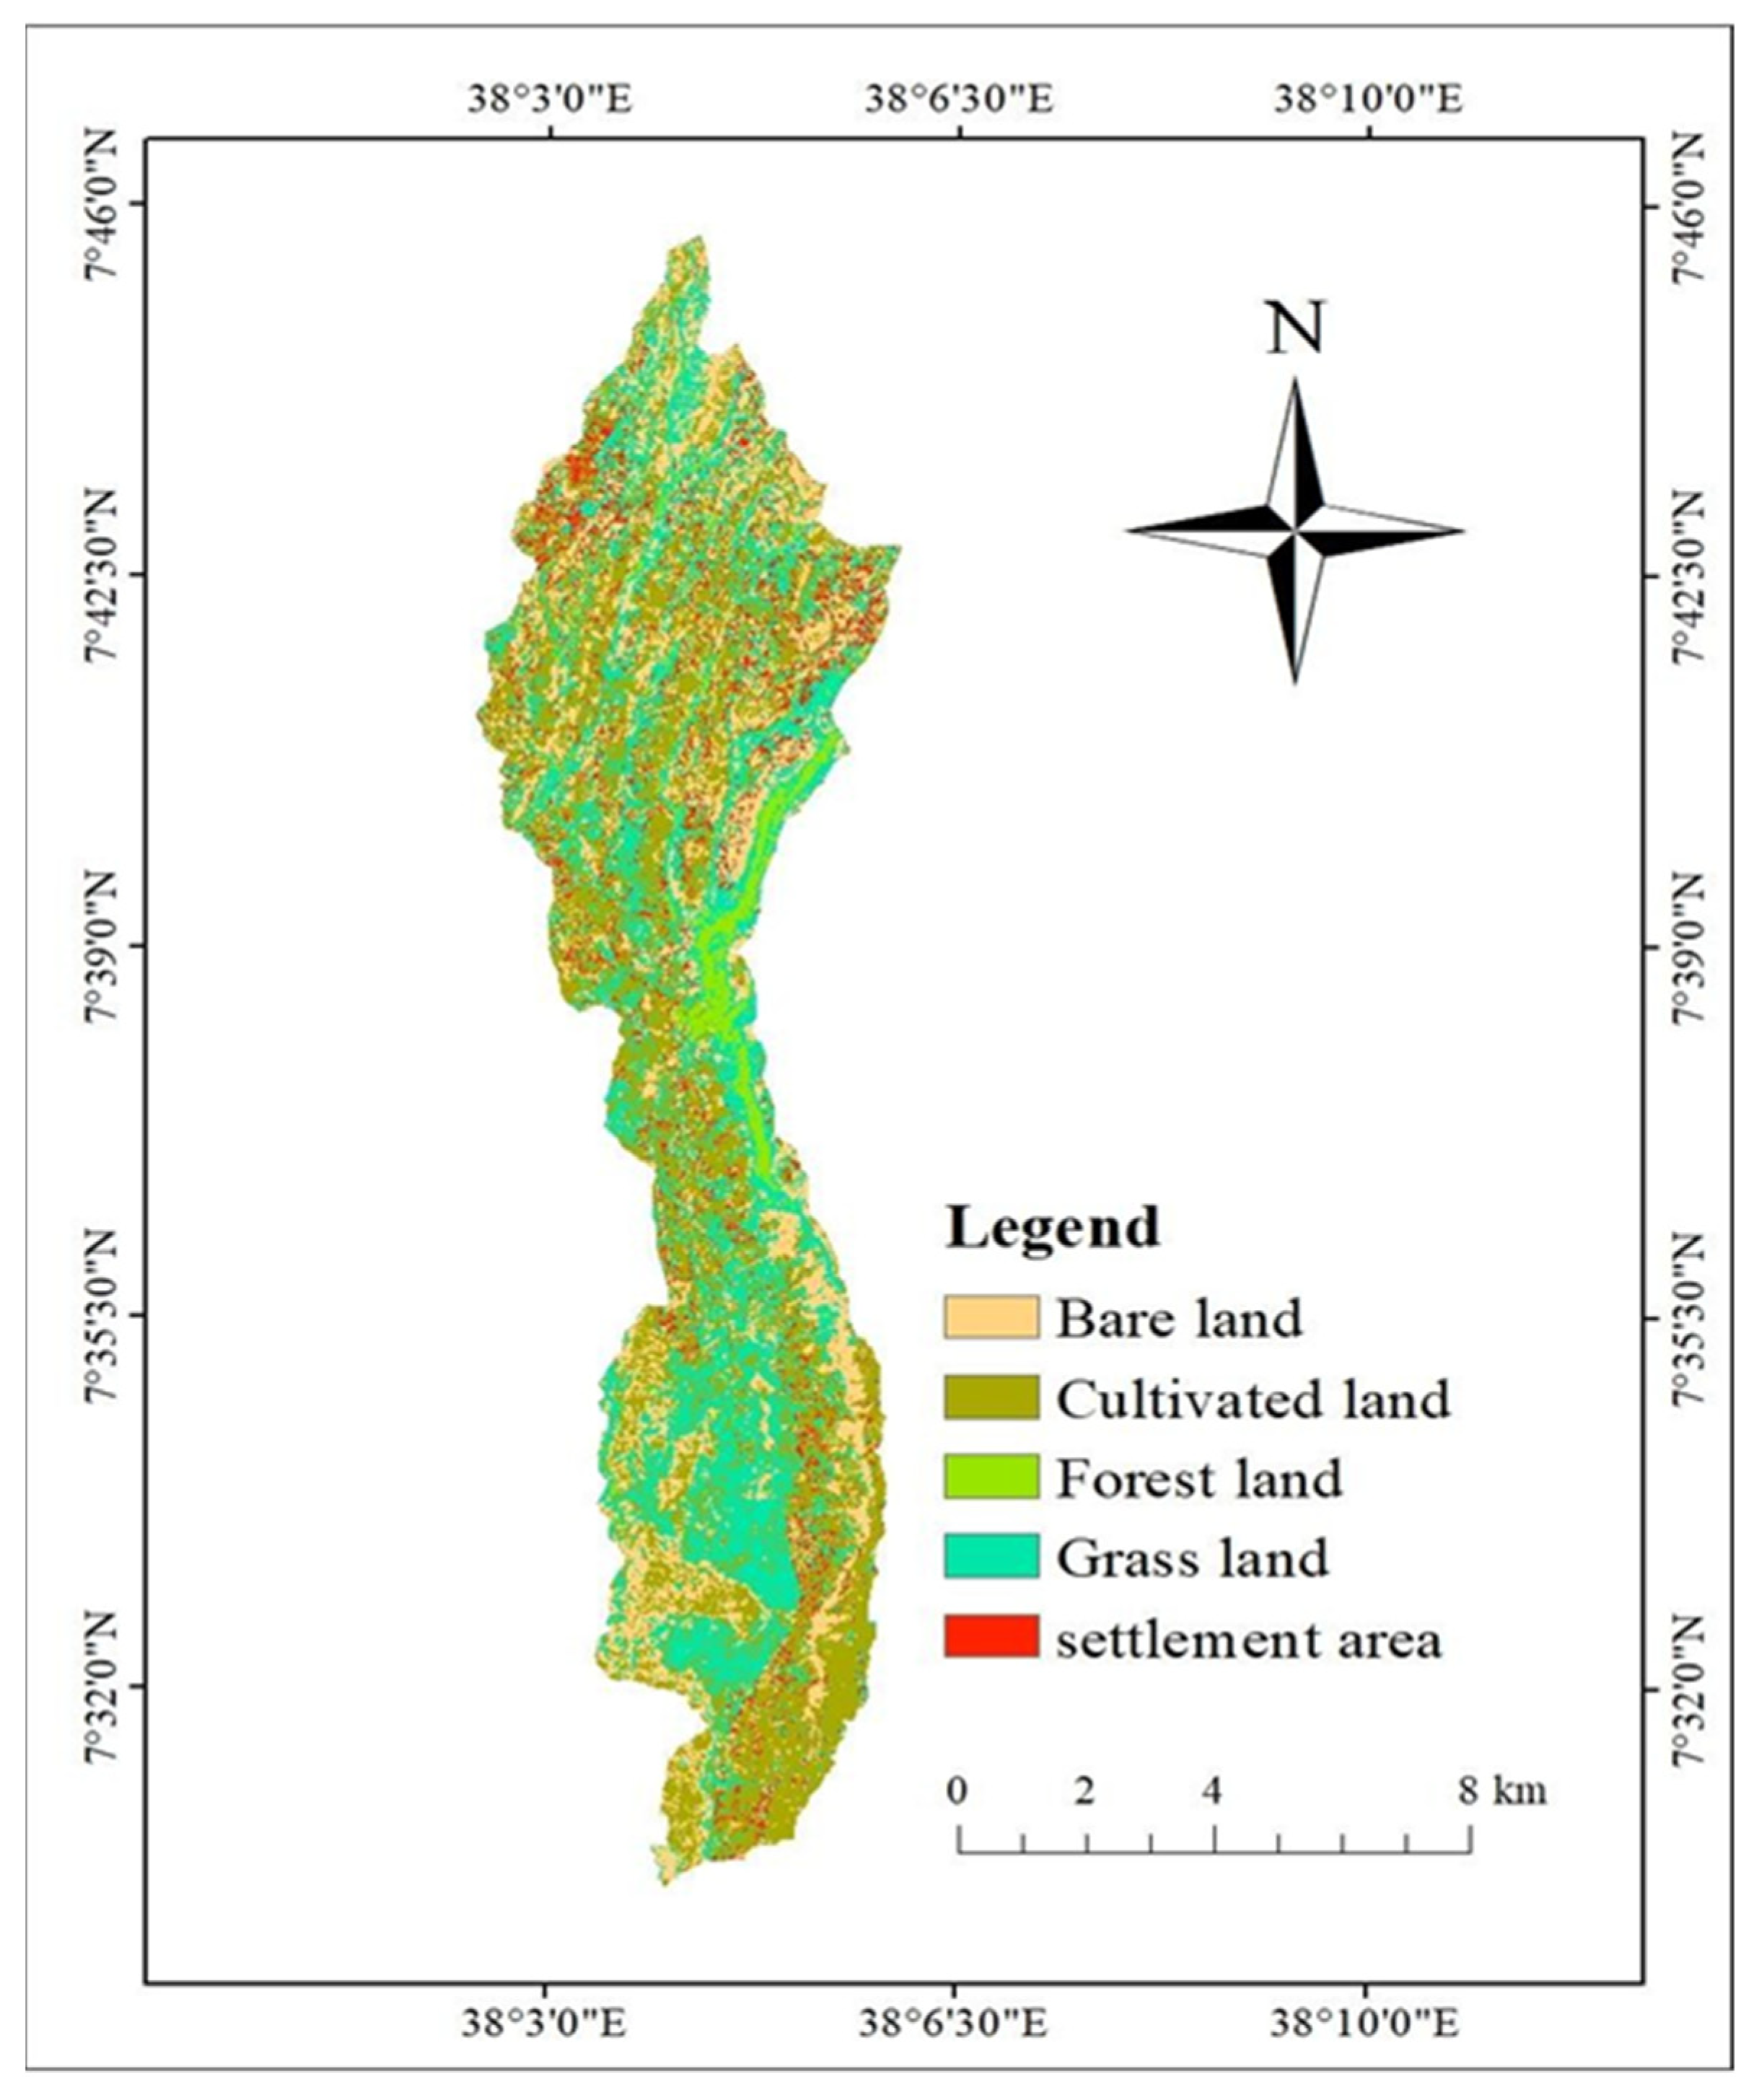
3.1. Land Use and Land Cover Changes

The area of cultivated land increased from 2176.12 hectares (22%) in 1991 to 3549.92 ha (36%) in 2003 and 5209.73 ha (52%) in 2020. This indicates that a temporal rise of 63% was found over 17 years, from 1991 to 2003, and a time-based growth of 47% was noted from 2003 to 2020. Over the 29 years from 1991 to 2020, the research area’s cultivated land increased by 139.40% in terms of temporal growth. The amount of grassland decreased from 3498.76 ha (35% of the total area) in 1991 to 2914.97 ha (29% of the area) in 2003 to 792.26 ha (8% of the area) in 2020. This demonstrated a 17% temporal decline during 12 years between 1991 and 2003, and a −73% temporal reduction over the following 12-year period between 2003 and 2020. Additionally, during 29 years, from 1991 to 2020, there has been a 77% temporal loss of grassland in the watershed (Table 5).
In 1991, the size of the settlement area was 358.84 (4%) but by 2003 it had expanded to 791.33 (8%) and by 2020 it had increased to 1653.11 (17%). This showed that within the settlement area in the watershed, a 12-year period between 1991 and 2003 had a 121% change and a 109% temporal rise. While there was a temporal increase in settlement in the study watershed over 29 years (1991 to 2020) to 361% (Figure 3). In the study watershed, there was a general decline in grassland, forest land, and bare land; however, there was an advanced rise in cultivated land and settlement area.
The settlement area showed the highest percentage of positive change (10.08%). The second-highest rate of change was seen on cultivated land, whereas the rate of change on bare land was only marginally positive (0.75%). In contrast, the study period between 1991 and 2003 saw a negative rate of change for both grassland (−17%) and forestland (−77%) respectively. Additionally, the yearly rate of LULC variation between 2003 and 2020 has shown positive rates of change for both cultivated land and settlement areas. Settlement area has shown the highest positive rate of change (6.41%), followed by cultivated land (2.76%), while grassland (−4.29%), bare land (−0.82%), and forestland (−2.7%) displayed negative rates of change throughout the research (Figure 4).
In this situation, the percentage change in ESV in response to changes in the Matenchose watershed’s LULC over a specific time-period was measured using the elasticity of ESV change.
Forestland maintained through the first research year, but diminishing arrangements in its transformation to agriculture were observed over time claims the study. Owing to this, the fraction of farm land has risen from 22% (2176.12 ha) in 1991 to 36% (3549.92 ha) in 2003 to 52% (5209.73 ha) in 2020 (Table 5).
Based on changes between 1991 and 2020, it was discovered that, the change between different land uses was not evenly distributed, with cultivated land changing its use at the highest rate change (4.81 ha/yr), followed by forest land (−2.79 ha/yr), and bare land changing its use at the lowest rate change (−0.21 ha/yr). On the other hand, cultivated land qualified for the biggest gain throughout the 29 years, indicating that this was the area’s primary land use. Similarly, the uppermost reductions were recorded for forest land (−2.79 ha/yr), followed by grassland (−2.66 ha/yr), and they are nonlinear conversions observed indicating that these land use changes could be attributed due to factors associated with demographic, social, economic and policy changes during 29 years in the study area (Figure 5).
According to similar findings, the most typical LULC change was the increase of agricultural land at the cost of usual vegetation such as forests, shrublands, and grasslands [6,19,21,24,43]. This modification impacted the configuration and operation of the Matenchose watershed’s ecosystems as well as the services and values that citizens obtained from them. In this study, we examined the historical (1991–2020) LULC dynamics of the Matenchose watershed and their effects on the watershed’s ecosystem service values.

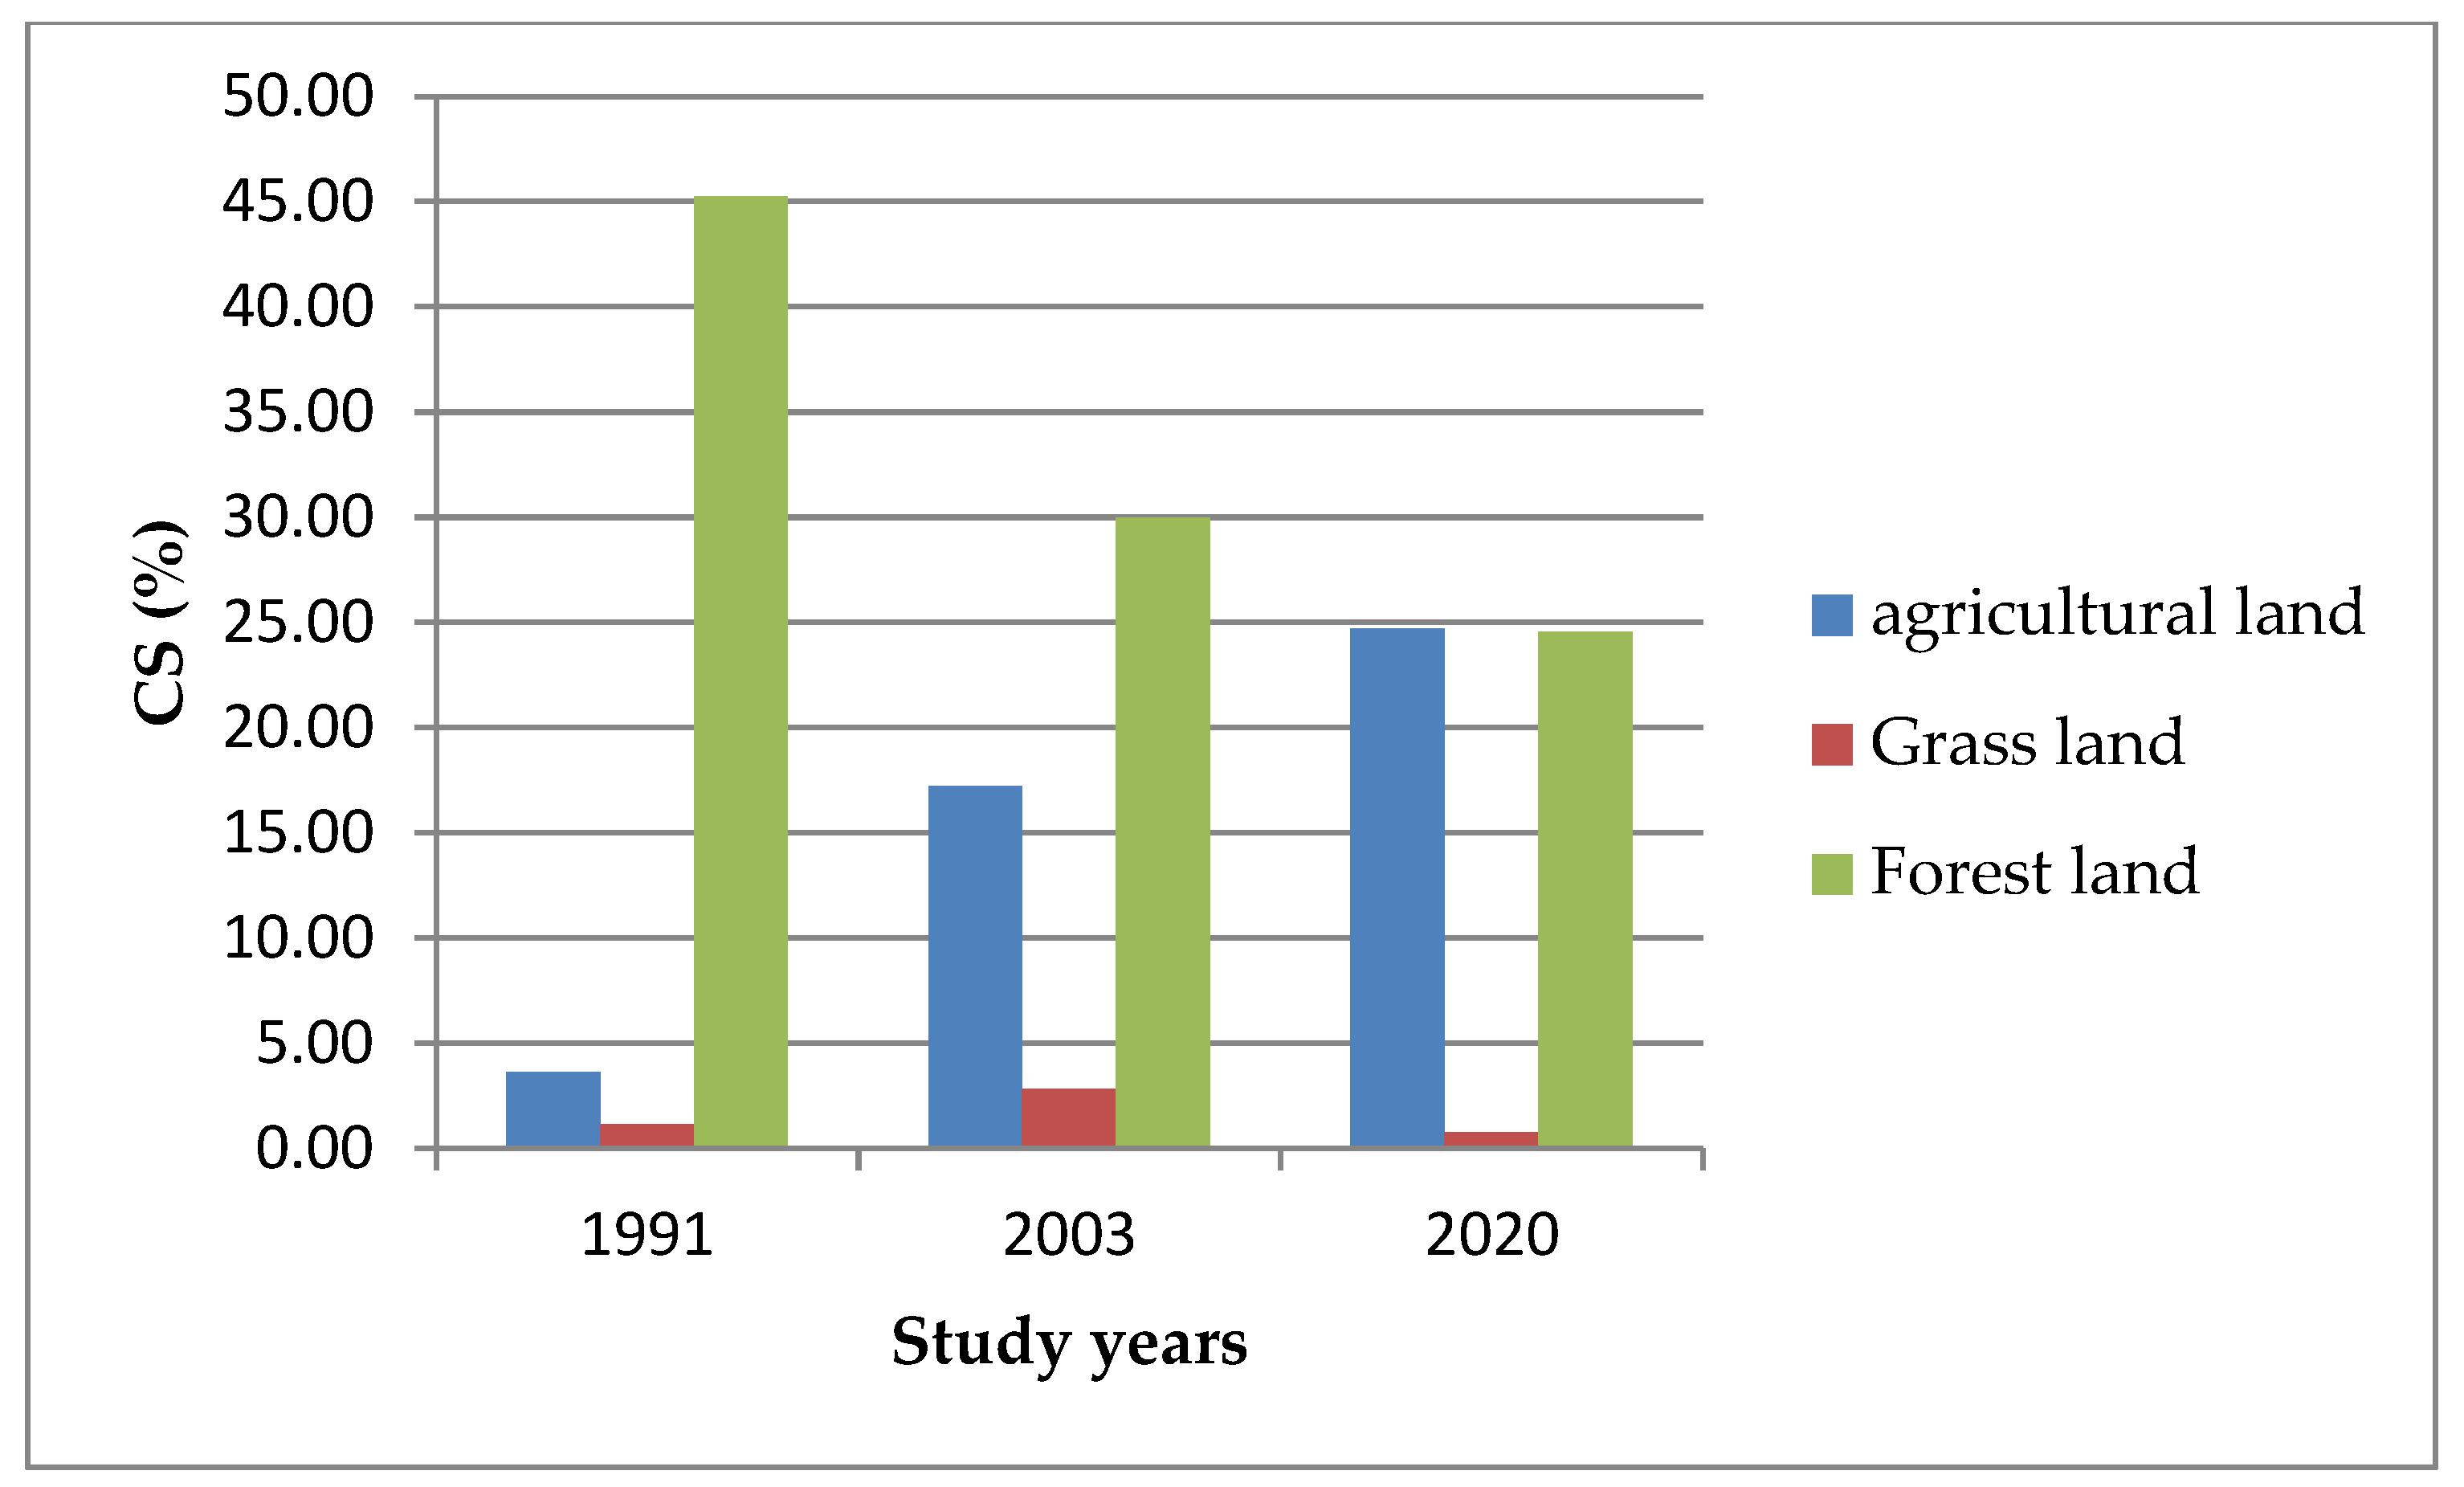
3.2. Variations of Ecosystem Service Values of the Matenchose Watershed

The general ESV of the research watershed for the year 1991 was US $241.87 million, and this value decreased to US $82.67 million in 2003, and further increased to 84.64 million in 2020. The total ESVs for the study years (1991–2020) were decreased by US $157.24 million during 29 years (65%) (Table 6). This research has found that forest land was the foremost provider of the loss of ESV compared with other LULCs. These variations in LULC and accompanying ESV are anticipated to increase in the future. The finding of this research is consistent with others’ results which had shown that the loss of forest and shrubland contributed to the reduction of ESVs [2,6,8,10,14,26,44]. The decrease observed in the total ESVs within the research watershed is agreed with other findings in the highlands of Ethiopia [2,6,8,14,45], Mozambique [46], China [47,48,49], and Nigeria [50].

3.3. Influence of Variation of LULC on Specific Ecosystem Service Value

Over 29 age intervals (1991–2020), the largest ecosystem services reduced were interrelated to water supply (70.28 million), Opportunities for recreation and tourism (69.43 million), and raw materials (19.18 million). Generally, by way of functional values of ecosystem services the major givers to the loss of ESV from 1991 to 2020 (Table 7), in declining in rank were provisional services (US $89.23 million) and cultural services (US $69.36 million). The highest reduction of provision services compared with other ecosystem services might be associated with the reduction of forest and grassland [10] and similar results reported elsewhere that the reduction of the coverage of forest contributed to the reduction of ESVs [2,10,12,26,51].
On the contrary, few ecosystem services namely food production, pollination, waste treatment, biological control enlarged equivalent to the various LULC variations over the 29 years, these positive changes were brought because of the increase of cultivable farms with the cost of other LULC modifications [10,51].
There was a major decline of ESV grassland and forest land by US $11.8 × 10⁶ and US $8.01 × 10⁶, respectively whereas cultivated land and settlement ESV increased by 16.89 and 8.62 million respectively. This is in line with earlier findings from Ethiopia’s highlands [2,6,8,9,26,44].
This result has in line with the results of numerous types of research conducted in Ethiopia and other parts of the world, that showed the presence of distinctive trade-offs between various ESs provided by regular ecosystems (food production, raw material supply, climate regulation, and genetic resource) [6,8,52]. The finding of this research disagreed with other scholarly work by Song and Deng [53] in China has found an increasing trend of ESV with the aid of global unit value recently developed by Costanza et al. [25].
Due to the significant changes in LULC in the research area, the valuations of the majority of specific ecosystem functions have decreased. The development of agricultural farms has brought to increase in food production, waste treatment, and maintenance of soil fertility in the research watershed (Table 8). Meanwhile, the increase in agricultural fields at the cost of forest and grassland impacted the reduction of climate regulation, genetic resources, erosion control, pollination, habitat, gas regulation, and cultural services by 18.80% (7.3 million US $). Similar results were reported by Gashaw et al. [8], Arowolo et al. [50], and Kindu et al. [6] indicated that various ecosystem services over time provision services increased such as food production, genetic resources raw materials whereas regulating services mainly climate regulation, erosion control, pollination declined.
For forestland in 1991, provisioning ecosystem service resulted in at the greatest ($110.68 million), followed by cultural service 102.46 million. Generally, during the 29 years, the order of group ecosystems services followed the trend of decreasing in the order of provision, cultural, regulating ad supporting services (Table 8). The higher allocated ecosystem service value and the increased area of land covered by cultivated land use were both factors in the provisioning service’s increase (Table 8).

3.4. Elasticity Assessment of ESV Changes with Land Use Categories

For the years 1991, 2003, and 2020, the sensitivity scrutiny and the CS determination for individual LULC types were carried out (Figure 6), which gave details on the role of LULC types in the assessment of ESs. In the complete sensitivity analysis, the scrutiny demonstrated the significance of cultivable land, forestland, and grassland. For cultivated land, CS values climbed from 3.61% to 24.71%. A decline in CS values for grassland (1.16–0.75%), and forest land (45.23–24.54%) was observed (Figure 6). The effects of forests and grasslands on the total CS were diminished as a result of their ongoing decline, but settlement and agricultural land were shown to be the most significant LULC kinds, with their effects on LULC gradually increasing (Figure 6).

3.5. Limitation of this study

The major shortcoming of this study is related to the worth and tenacity of the data, which were obtained from a variety of sources for the datasets used in this study. In general, the detected LULC datasets utilized in this research were accurate to a local scale and of high quality. However, given the ongoing changes in the financial, societal, and governmental environments, uncertainty in LULC adjustments are almost inevitable. Furthermore, it is anticipated that climate change would have a significant impact on the ecosystem of the watershed.
A complex pattern of interrelated ecological variations in the watershed and how they affect the ecosystem due to future climate and LULC changes were remain poorly understood. When utilizing this research for decision-makers, it is essential to comprehend these sources of uncertainties in land cover changes.
As in earlier studies in Ethiopia and elsewhere, it anticipated identical ESV coefficients for both LULC classes because there is some qualm over the correctness of LULC classification [6,8,45].
In response to LULC alterations, the estimated changes in ESVs were made at the watershed level; however, the influence at the basin level connecting both upstream and downstream areas and flows of ecosystem services has not been assessed.
Data from England is heavily weighted in this ESVD, with a concentration on inland wetlands and coastal systems that had an influence on the performance of the application of this methodology for terrestrial ecosystems.

4. Conclusions

The Matenchose watershed is subjugated by the increase of agricultural land and settlements by 139.40 and 361%, respectively, whereas forest and grassland were reduced by 81 and 77%, respectively, over the study period (1991–2020). The major ecosystem services are shown a reduction in the order of forestland, grassland, and bare lands whereas farmland and settlements showed increasing trends. Overall, the Matenchose watershed has lost ESVs of US $5.42 million per year. This extended period of LULC changes would have damaging impacts on the majority of ecosystem services (regulating, supporting, and cultural) negatively affected compared with provisional services (food and water). Therefore, changes in LULC were the key contributor to the loss and decline of ESVs in the Matenchose watershed, central Rift Valley Basin. This calls for urgent interventions in the areas of sustainable land management options for the reduction of the watershed from degradation and improving the ecosystem services in the watershed. This finding could be used as a benchmark for policymakers to give due attention when planning and implementing landscape-level interventions of land rehabilitation practices.

Author Contributions

Conceptualization, M.M. and A.O.A.; methodology, M.M.; software, M.M.; validation, M.M. and A.O.A.; formal analysis, A.O.A.; investigation, M.M.; writing—original draft preparation, M.M.; writing—review and editing, M.M. and A.O.A.; supervision, M.M. and A.O.A. All authors have read and agreed to the published version of the manuscript.

Funding

This research received no external funding.

Data Availability Statement

You can request access to the study’s data from the corresponding author.

Acknowledgments

The authors would like to thank the Shashogo wereda agriculture office experts for support in the data collection.

Conflicts of Interest

The authors say they have no competing interests.

References

  1. Aneseyee, A.B.; Soromessa, T.; Elias, E. The effect of land use/land cover changes on ecosystem services valuation of Winike watershed, Omo Gibe basin, Ethiopia. Hum. Ecol. Risk Assess. 2019, 26, 2608–2627. [Google Scholar] [CrossRef]
  2. Tolessa, T.; Senbeta, F.; Kidane, M. The impact of land use/land cover change on ecosystem services in the central highlands of Ethiopia. Ecosyst. Serv. 2017, 23, 47–54. [Google Scholar] [CrossRef]
  3. Braat, L.C.; de Groot, R. The ecosystem services agenda:bridging the worlds of natural science and economics, conservation and development, and public and private policy. Ecosyst. Serv. 2012, 1, 4–15. [Google Scholar] [CrossRef]
  4. Costanza, R.; de Groot, R.; Braat, L.; Kubiszewski, I.; Fioramonti, L.; Sutton, P.; Farber, S.; Grasso, M. Twenty years of ecosystem services: How far have we come and how far do we still need to go? Ecosyst. Serv. 2017, 28, 1–16. [Google Scholar] [CrossRef]
  5. De Groot, R.; Brander, L.; van der Ploeg, S.; Costanza, R.; Bernard, F.; Braat, L.; Christie, M.; Crossman, N.; Ghermandi, A.; Hein, L.; et al. Global estimates of the value of ecosystems and their services in monetary units. Ecosyst. Serv. 2012, 1, 50–61. [Google Scholar] [CrossRef]
  6. Kindu, M.; Schneider, T.; Teketay, D.; Knoke, T. Changes of ecosystem service values in response to land use/land cover dynamics in Munessa–Shashemene landscape of the Ethiopian highlands. Sci. Total Environ. 2016, 547, 137–147. [Google Scholar] [CrossRef]
  7. Gao, J.; Li, F.; Gao, H.; Zhou, C.; Zhang, X. The impact of land-use change on water-related ecosystem services: A study of the Guishui River Basin, Beijing, China. J. Clean. Prod. 2017, 163, S148–S155. [Google Scholar] [CrossRef]
  8. Gashaw, T.; Tulu, T.; Argaw, M.; Worqlul, A.W.; Tolessa, T. Estimating the impacts of land use / land cover changes on Ecosystem Service Values: The case of the Andassa watershed in the Upper Blue Nile basin of Ethiopia. Ecosyst. Serv. 2018, 31, 219–228. [Google Scholar] [CrossRef]
  9. Godebo, M.M.; Ulsido, M.D.; Jilo, T.E.; Geleto, G.M. Influence of land use and land cover changes on ecosystem services in the Bilate Alaba Sub-watershed, Southern Ethiopia. J. Ecol. Nat. Environ. 2018, 10, 228–238. [Google Scholar] [CrossRef]
  10. Mekuria, W.; Diyasa, M.; Tengberg, A.; Haileslassie, A. Effects of long-term land use and land cover changes on ecosystem service values: An example from the central rift valley, Ethiopia. Land 2021, 10, 1373. [Google Scholar] [CrossRef]
  11. Biratu, A.A.; Bedadi, B.; Gebrehiwot, S.G.; Melesse, A.M.; Nebi, T.H.; Abera, W.; Tamene, L.; Egeru, A. Impact of Landscape Management Scenarios on Ecosystem Service Values in Central Ethiopia. Land 2022, 11, 1266. [Google Scholar] [CrossRef]
  12. Shiferaw, H.; Alamirew, T.; Kassawmar, T.; Zeleke, G. Evaluating ecosystems services values due to land use transformation in the Gojeb watershed, Southwest Ethiopia. Environ. Syst. Res. 2021, 10, 22. [Google Scholar] [CrossRef]
  13. Shiferaw, H.; Bewket, W.; Alamirew, T.; Zeleke, G.; Teketay, D.; Bekele, K.; Schaffner, U.; Eckert, S. Implications of land use/land cover dynamics and Prosopis invasion on ecosystem service values in Afar Region, Ethiopia. Sci. Total Environ. 2019, 675, 354–366. [Google Scholar] [CrossRef] [PubMed]
  14. Tolessa, T.; Gessese, H.; Tolera, M.; Kidane, M. Changes in Ecosystem Service Values in Response to Changes in Landscape Composition in the Central Highlands of Ethiopia. Environ. Process. 2018, 5, 483–501. [Google Scholar] [CrossRef]
  15. Muleta, T.T.; Biru, M.K. Human modified landscape structure and its implication on ecosystem services at Guder watershed in Ethiopia. Environ. Monit. Assess. 2019, 191, 295. [Google Scholar] [CrossRef]
  16. Temesgen, H.; Wu, W.; Shi, X.; Yirsaw, E.; Bekele, B.; Kindu, M. Variation in ecosystem service values in an agroforestry dominated landscape in Ethiopia: Implications for land use and conservation policy. Sustainability 2018, 10, 1126. [Google Scholar] [CrossRef]
  17. Sutton, P.C.; Anderson, S.J.; Costanza, R.; Kubiszewski, I. The ecological economics of land degradation: Impacts on ecosystem service values. Ecol. Econ. 2016, 129, 182–192. [Google Scholar] [CrossRef]
  18. Gashaw, T.; Tulu, T.; Argaw, M.; Worqlul, A.W. Evaluation and prediction of land use/land cover changes in the Andassa watershed, Blue Nile Basin, Ethiopia. Environ. Syst. Res. 2017, 6, 17. [Google Scholar] [CrossRef]
  19. Garedew, E.; Sandewall, M.; Söderberg, U.; Campbell, B.M. Land-Use and Land-Cover Dynamics in the Central Rift Valley of Ethiopia. Environ. Manag. 2009, 44, 683–694. [Google Scholar] [CrossRef]
  20. Yesuph, A.Y.; Dagnew, A.B. Land use/cover spatiotemporal dynamics, driving forces and implications at the Beshillo catchment of the Blue Nile Basin, North Eastern Highlands of Ethiopia. Environ. Syst. Res. 2019, 8, 21. [Google Scholar] [CrossRef] [Green Version]
  21. Bewket, W.; Abebe, S. Land-use and land-cover change and its environmental implications in a tropical highland watershed, Ethiopia. Int. J. Environ. Stud. 2013, 70, 126–139. [Google Scholar] [CrossRef]
  22. Mathewos, M.; Dananto, M.; Erkossa, T.; Mulugeta, G. Land Use Land Cover Dynamics at Bilate Alaba Sub-watershed, Southern Ethiopia. J. Appl. Sci. Environ. Manag. 2019, 23, 1521–1528. [Google Scholar] [CrossRef]
  23. Birhane, E.; Ashfare, H.; Fenta, A.A.; Hishe, H.; Gebremedhin, M.A.; G. wahed, H.; Solomon, N. Land use land cover changes along topographic gradients in Hugumburda national forest priority area, Northern Ethiopia. Remote Sens. Appl. Soc. Environ. 2019, 13, 61–68. [Google Scholar] [CrossRef]
  24. Mathewos, M.; Lencha, S.M.; Tsegaye, M. Land Use and Land Cover Change Assessment and Future Predictions in the Matenchose Watershed, Rift Valley Basin, Using CA-Markov Simulation. Land 2022, 11, 1632. [Google Scholar] [CrossRef]
  25. Costanza, R.; de Groot, R.; Sutton, P.; van der Ploeg, S.; Anderson, S.J.; Kubiszewski, I.; Farber, S.; Turner, R.K. Changes in the global value of ecosystem services. Glob. Environ. Chang. 2014, 26, 152–158. [Google Scholar] [CrossRef]
  26. Tolessa, T.; Kidane, M.; Bezie, A. Assessment of the linkages between ecosystem service provision and land use/land cover change in Fincha watershed, North-Western Ethiopia. Heliyon 2021, 7, e07673. [Google Scholar] [CrossRef]
  27. Schmidt, S.; Manceur, A.M.; Seppelt, R. Uncertainty of monetary valued ecosystem—Value transfer functions for global mapping. PLoS ONE 2016, 11, e0148524. [Google Scholar] [CrossRef]
  28. Costanza, R.; d’Arge, R.; De Groot, R.; Farber, S.; Grasso, M.; Hannon, B.; Limburg, K.; Naeem, S.; O’neill, R.V.; Paruelo, J.; et al. The value of the world’s ecosystem services and natural capital. Nature 1997, 387, 253–260. [Google Scholar] [CrossRef]
  29. Duarte, G.T.; Ribeiro, M.C.; Paglia, A.P. Ecosystem services modeling as a tool for defining priority areas for conservation. PLoS ONE 2016, 11, e0154573. [Google Scholar] [CrossRef] [PubMed]
  30. Cerretelli, S.; Poggio, L.; Gimona, A.; Yakob, G.; Boke, S.; Habte, M.; Coull, M.; Peressotti, A.; Black, H. Spatial assessment of land degradation through key ecosystem services: The role of globally available data. Sci. Total Environ. 2018, 628–629, 539–555. [Google Scholar] [CrossRef]
  31. De Groot, R.; Brander, L.; Solomonides, S. Ecosystem Services Valuation Database (ESVD) Update of Global Ecosystem Service Valuation Data; FSD Report No 2020-06 Wageningen, The Netherlands. 2020, pp. 1–58. Available online: https://www.espartnership.org/wp-content/uploads/2020/08/ESVD_Global-Update-FINAL-Report-June-2020.pdf (accessed on 30 January 2023).
  32. Dereje, B.; Nedaw, D. Groundwater Recharge Estimation Using WetSpass Modeling in Upper Bilate Catchment, Southern Ethiopia. Momona Ethiop. J. Sci. 2019, 11, 37. [Google Scholar] [CrossRef]
  33. Beyamo, L.S. Assessment of Land Use Land Cover Dynamics and Its Impact on Soil Loss: Using GIS and Remote Sensing, in Shashogo Woreda. Master’s Thesis, Addis Abeba University, Addis Abeba, Ethiopia, 2010. Available online: http://etd.aau.edu.et/handle/123456789/9959 (accessed on 30 January 2023).
  34. Alawamy, J.S.; Balasundram, S.K.; Hanif, A.H.M.; Sung, C.T.B. Detecting and analyzing land use and land cover changes in the Region of Al-Jabal Al-Akhdar, Libya using time-series landsat data from 1985 to 2017. Sustainability 2020, 12, 4490. [Google Scholar] [CrossRef]
  35. Belay, T.; Mengistu, D.A. Impacts of land use/land cover and climate changes on soil erosion in Muga watershed, Upper Blue Nile basin (Abay), Ethiopia. Ecol. Process. 2021, 10, 68. [Google Scholar] [CrossRef]
  36. Woldemariam, G.; Iguala, A.D.; Tekalign, S.; Reddy, R.U. Spatial Modeling of Soil Erosion Risk and Its Implication for Conservation Planning: The Case of the Gobele Watershed, East Hararghe Zone, Ethiopia. Land 2018, 7, 25. [Google Scholar] [CrossRef]
  37. Leta, M.K.; Demissie, T.A.; Tränckner, J. Modeling and Prediction of Land Use Land Cover Change Dynamics Based on Land Change Modeler (LCM) in Nashe Watershed, Upper Blue Nile Basin, Ethiopia. Sustainability 2021, 13, 3740. [Google Scholar] [CrossRef]
  38. Dibaba, W.T.; Demissie, T.A.; Miegel, K. Watershed Hydrological Response to Combined Land Use/Land Cover and Climate Change in Highland Ethiopia: Finchaa Catchment. Water 2020, 12, 1801. [Google Scholar] [CrossRef]
  39. Abate, S. Evaluating the land use and land cover dynamics in Borena Woreda of South Wollo Highlands, Ethiopia. J. Sustain. Dev. Africa 2011, 13, 87–107. [Google Scholar]
  40. Foody, G.M. Status of land cover classification accuracy assessment. Remote Sens. Environ. 2002, 80, 9–16. [Google Scholar] [CrossRef]
  41. Congalton, R.G.; Green, K. Assessing the Accuracy of Remotely Sensed Data: Principles and Practices, 3rd ed.; Taylor &Francis Group Routledge: Boca Raton, FL, USA, 2019. [Google Scholar] [CrossRef]
  42. Okeke, F.; Karnieli, A. Methods for fuzzy classification and accuracy assessment of historical aerial photographs for vegetation change analyses. Part I: Algorithm development. Int. J. Remote. Sens. 2006, 27, 153–176. [Google Scholar] [CrossRef]
  43. WoldeYohannes, A.; Cotter, M.; Kelboro, G.; Dessalegn, W. Land Use and Land Cover Changes and Their Effects on the Landscape of Abaya-Chamo Basin, Southern Ethiopia. Land 2018, 7, 2. [Google Scholar] [CrossRef] [Green Version]
  44. Kindu, M.; Schneider, T.; Döllerer, M.; Teketay, D.; Knoke, T. Scenario modelling of land use/land cover changes in Munessa-Shashemene landscape of the Ethiopian highlands. Sci. Total Environ. 2018, 622–623, 534–546. [Google Scholar] [CrossRef] [PubMed]
  45. Tolessa, T.; Senbeta, F.; Abebe, T. Land use/land cover analysis and ecosystem services valuation in the central highlands of Ethiopia. For. Trees Livelihoods 2017, 26, 111–123. [Google Scholar] [CrossRef]
  46. Niquisse, S.; Cabral, P.; Rodrigues, Â.; Augusto, G. Ecosystem services and biodiversity trends in Mozambique as a consequence of land cover change. Int. J. Biodivers. Sci. Ecosyst. Serv. Manag. 2017, 13, 297–311. [Google Scholar] [CrossRef]
  47. Wang, X.; Dong, X.; Liu, H.; Wei, H.; Fan, W.; Lu, N.; Xu, Z.; Ren, J.; Xing, K. Linking land use change, ecosystem services and human well-being: A case study of the Manas River Basin of Xinjiang, China. Ecosyst. Serv. 2017, 27, 113–123. [Google Scholar] [CrossRef]
  48. Yushanjiang, A.; Zhang, F.; Yu, H.; Kung, H. Quantifying the spatial correlations between landscape pattern and ecosystem service value: A case study in Ebinur Lake Basin, Xinjiang, China. Ecol. Eng. 2018, 113, 94–104. [Google Scholar] [CrossRef]
  49. Zhang, F.; Yushanjiang, A.; Jing, Y. Assessing and predicting changes of the ecosystem service values based on land use/cover change in Ebinur Lake Wetland National Nature Reserve, Xinjiang, China. Sci. Total Environ. 2019, 656, 1133–1144. [Google Scholar] [CrossRef]
  50. Arowolo, A.O.; Deng, X.; Olatunji, O.A.; Obayelu, A.E. Assessing changes in the value of ecosystem services in response to land-use/land-cover dynamics in Nigeria. Sci. Total Environ. 2018, 636, 597–609. [Google Scholar] [CrossRef]
  51. Elias, E.; Seifu, W.; Tesfaye, B.; Girmay, W. Impact of land use/cover changes on lake ecosystem of Ethiopia central rift valley. Cogent Food Agric. 2019, 5, 1595876. [Google Scholar] [CrossRef]
  52. Wang, S.; Wu, B.; Yang, P. Assessing the changes in land use and ecosystem services in an oasis agricultural region of Yanqi Basin, Northwest China. Environ. Monit. Assess. 2014, 186, 8343–8357. [Google Scholar] [CrossRef]
  53. Song, W.; Deng, X. Land-use/land-cover change and ecosystem service provision in China. Sci. Total Environ. 2017, 576, 705–719. [Google Scholar] [CrossRef]
Figure 1. Matenchose watershed map.
Quaternary 06 00013 g001
Figure 2. Framework for the assessment of the study ecosystem services in Matenchose watershed.
Quaternary 06 00013 g002
Figure 3. Matenchose watershed LULC Map of 1991.
Quaternary 06 00013 g003
Figure 4. Matenchose watershed LULC Map of 2003.
Quaternary 06 00013 g004
Figure 5. The LULC Map of 2020 Matenchose watershed.
Quaternary 06 00013 g005
Figure 6. Coefficient of sensitivity analysis for 1991, 2003, and 2020 in the Matenchose watershed.
Quaternary 06 00013 g006
Table 1. Landsat image characteristics used for LULC change.
PathRowSensorsAcquisition DateSpatial Resolution (m)
169055TM28 December 199130 × 30
169055ETM+2 December 200330 × 30
169055OLI11 December 202030 × 30
Table 2. LULC classified description in the Matenchose watershed.
LULC ClassesDescription
GrasslandPlaces covered in small trees and bushes combined with grasses
ForestlandLand with moderately tall trees, at least 20% canopy coverage, integral open space, and regions that have been felled primarily of eucalyptus trees that are not located close to river courses
Bare landareas with sparse and stunted vegetation, as well as wastelands and badlands with exposed rocks
Cultivated landExtended rain-fed agricultural production zones, primarily for cereals and pulses, are managed.
SettlementArea that is mostly covered by buildings, including urban areas and rural communities
Table 3. ESV coefficients, accompanying equivalent biomes, and LULC classes.
LULC ClassesCorresponding BiomeESV Coefficient (USD ha—1 yr—1)
AgricultureCultivated area8028
GrasslandGrassland1597
Forest landTropical forests119,075
Bare landDesert0
Table 4. Land uses and the associated individual ecosystem service values (in US million dollars per hectare per year at 2020 prices).
Ecosystem ServicesForest LandGrasslandAgriculture
Food602 510
Water47,869313604
Raw material11,7396376
Genetic resources16
Medicinal resources3
Ornamental resources
Air quality regulation309810
Climate regulation6587310
Moderation of extreme events108 993
Regulation of water flows4424317
Waste treatment12 40
Erosion prevention604 173
Maintenance of soil fertility42 34
Pollination877 1498
Biological control14 621
Maintenance of life cycles of migratory species19
Maintenance of genetic diversity7
Aesthetic information 395
Opportunities for recreation and tourism52,789923101
Inspiration for culture, art, and design528416
Spiritual experience
Information for cognitive development 147
Existence and bequest values2960
Total119,07515978028
Table 5. Temporal and spatial rate of change LULC from 1991 to 2020.
LULC Classes199120032020Temporal (%) ChangeThe Annual Rate of the Change (%)
Area(ha)Area(ha)Area(ha)2003–19912020–20032020–19912003–19912020–20032020–1991
Cultivated land2176.123549.925209.736347139.405.252.764.81
Grassland3498.762914.96792.26−17−73−77−1.42−4.29−2.66
Forest land1837.63415.85348.92−77−16−81−6.42−4.77−2.79
bare land2119.062318.361986.389−14−60.75−0.82−0.21
settlement358.84791.331653.1112110936110.086.4112.45
Total9990.429990.429990.42
Table 6. The LULC variation on the ESVs (106 US $ at 2020 price levels) in the Matenchose watershed.
LULC Classes199120032020
ESVs%ESVs%ESVs%
Agriculture land17.477.2228.5034.4741.8249.42
Grassland5.592.314.665.631.271.49
Forest land218.8290.4749.5259.9041.5549.09
Sum241.8710082.6710084.64100
Table 7. Individual Ecosystem services values for the Matenchose watershed (1991–2020) in Millions of USD $/ha/yr.
ESV Variations 1991, 2003, and 2020 (106 US $)
Ecosystem ServicesESVf 1991ESVf 2003ESVf 2020Overall Change
Food provision2.222.062.870.65
Water supply90.3722.9620.10−70.28
Raw material23.816.764.63−19.18
Genetic resources0.030.010.01−0.02
Medicinal resources0.010.000.000.00
Ornamental resources0.000.000.000.00
Air quality regulation0.620.190.17−0.45
Climate regulation1.490.520.34−1.15
Moderation of extreme events2.363.575.212.85
Regulation of water flows1.000.370.28−0.72
Waste treatment0.110.150.210.10
Erosion prevention1.490.871.11−0.37
Maintenance of soil fertility0.150.140.190.04
Pollination4.875.688.113.24
Biological control1.382.213.241.86
Maintenance of life cycles of migratory species0.030.010.01−0.03
Maintenance of genetic diversity0.010.000.00−0.01
Aesthetic information0.861.402.061.20
Opportunities for recreation and tourism104.0833.2334.65−69.43
Inspiration for culture, art, and design1.040.890.31−0.73
Spiritual experience0.000.000.000.00
Information for cognitive development0.510.430.12−0.40
Existence and bequest values5.441.231.03−4.41
Total241.8782.6784.64−157.24
ESVf refers to the ecosystem service valuation function.
Table 8. Major functional units of ESs and LULC types.
YearsFunctional ESVForestGrasslandAgricultureTotal
1991provisional110.683.322.44116.44
regulation3.950.434.068.44
support1.740.003.335.07
cultural102.461.837.64111.93
Sum218.825.5917.47
2003provisional25.052.773.9831.79
regulation0.890.366.627.87
support0.390.005.445.83
cultural23.191.5212.4737.18
Sum49.524.6628.50
2020provisional21.020.755.8327.60
regulation0.750.109.7110.56
support0.330.007.988.31
cultural19.450.4118.3038.16
Sum41.551.2741.82
Disclaimer/Publisher’s Note: The statements, opinions and data contained in all publications are solely those of the individual author(s) and contributor(s) and not of MDPI and/or the editor(s). MDPI and/or the editor(s) disclaim responsibility for any injury to people or property resulting from any ideas, methods, instructions or products referred to in the content.

