Article

Morphological Diversity in Diblock Copolymer Solutions: A Molecular Dynamics Study

by
Senyuan Liu
1 and
Radhakrishna Sureshkumar
1,2,*
1
Department of Biomedical and Chemical Engineering, Syracuse University, Syracuse, NY 13244, USA
2
Department of Physics, Syracuse University, Syracuse, NY 13244, USA
*
Author to whom correspondence should be addressed.
Colloids Interfaces 2023, 7(2), 40; https://doi.org/10.3390/colloids7020040
Submission received: 5 March 2023 / Revised: 26 April 2023 / Accepted: 4 May 2023 / Published: 9 May 2023

Abstract

:
Coarse-grained molecular dynamics simulations that incorporate explicit water-mediated hydrophilic/hydrophobic interactions are employed to track spatiotemporal evolution of diblock copolymer aggregation in initially homogeneous solutions. A phase portrait of the observed morphologies and their quantitative geometric features such as aggregation numbers, packing parameters, and radial distribution functions of solvent/monomers are presented. Energetic and entropic measures relevant to self-assembly such as specific solvent accessible surface area (SASA) and probability distribution functions (pdfs) of segmental stretch of copolymer chains are analyzed. The simulations qualitatively capture experimentally observed morphological diversity in diblock copolymer solutions. Topologically simpler structures predicted include spherical micelles, vesicles (polymersomes), lamellae (bilayers), linear wormlike micelles, and tori. More complex morphologies observed for larger chain lengths and nearly symmetric copolymer compositions include branched wormlike micelles with Y-shaped junctions and cylindrical micelle networks. For larger concentrations, vesicle strands, held together by hydrogen bonds, and “giant” composite aggregates that consist of lamellar, mixed hydrophobic/hydrophilic regions and percolating water cores are predicted. All structures are dynamic and exhibit diffuse domain boundaries. Morphology transitions across topologically simpler structures can be rationalized based on specific SASA measurements. PDFs of segmental stretch within vesicular assemblies appear to follow a log-normal distribution conducive for maximizing configuration entropy.

1. Introduction

Since their first successful chemical synthesis reported in 1956, block copolymer (BCP) architectures have been a subject of numerous investigations [1,2,3,4,5,6,7]. Several BCP structures have been developed by manipulating the permutations of chemically incompatible polymer segments (blocks) with varying affinities to the medium in which the polymers are dispersed, chemical composition, and chain lengths of the segments as well as the molecular weight and concentration of the BCP. The chemical incompatibility between/among the polymer segments, e.g., polyethylene oxide (PEO) and polybutadiene (PB) in a PEO–PB diblock copolymer or PEO, polystyrene (PS), and poly-2-vinypyridine (P2VP) in a PEO-PS-P2VP triblock copolymer, translates to unfavorable heat of mixing when BCPs are dispersed in a solid matrix or dissolved in a solvent. Since the mixing entropies are relatively small, it is energetically favorable for the different blocks to segregate to produce various self-assembled morphologies in bulk or solution [3,4]. These morphologies include micelles of different architectures (e.g., core-corona, star, crew-cut, flower, and core-shell-corona structures), rods, network of flexible wormlike micelles, rectangular/discoid bilayers (lamellae), vesicles (polymersomes), and bicontinuous microphases [8,9,10,11,12,13,14,15,16,17,18,19,20].
Chemical heterogeneity of BCPs finds applications in precision manufacturing of advanced thermoplastic elastomers [5]. Further, they have been extensively used in industry as emulsifiers and compatibilizers. In such roles, they act as traditional surfactants by reducing the interfacial tension between organic and aqueous phases. For instance, assemblies of diblock copolymers comprising hydrophilic and hydrophobic portions could be used to separate and encapsulate hydrocarbons from subterranean porous rock formations to aid enhanced oil recovery processes. Further, BCPs are typically non-ionic. This makes them environmentally less-intrusive candidates for isolating and scavenging spilled oil or organic contaminants from the environment. A distinct advantage of BCPs over traditional surfactants is the ability to vary their chain lengths and comparative chemical affinities of their hydrophilic and hydrophobic segments. Consequently, BCPs have been employed as molecular bridges in the synthesis of mesoporous materials. For instance, BCP molecules have been used to control the overlap distance between the hydrophobic hydration spheres during the growth of inorganic-organic composite structures in zeolite synthesis to manipulate the structure and catalytic function of the final product [21].
Renewed interest in BCP self-assembly in solution was catalyzed in the 1990s by the pioneering discoveries of vesicular morphologies, referred to as polymersomes [8,9,10,11,12,13,14]: see reviews by Bleul et al. [22], Mohammadi et al. [23], Zhang and Zhang [24], Discher et al. [25], and Antonietti and Förster [15]. The nomenclature (polymersomes) is borrowed from the literature on biological vesicles, or liposomes, which are made up of amphiphilic phospholipid molecules. However, as summarized in the review by Bleul et al. [22], BCPs offer robust means of size control of the vesicles by varying the chemical composition and/or molecular weight of the copolymer chain, changing the polymer concentration, the addition of secondary molecules capable of inserting themselves into the assembly and act as spacers, as well as microfluidics-based flow manipulation to produce droplets of controllable sizes. As a result, polymersomes of sizes that range between several nanometers to tens of micrometers can be routinely manufactured with low degrees of polydispersity. Such morphologies form the building blocks of complex nanostructures that offer significant promise in nanomedicine for applications as drug carriers for targeted delivery of therapeutic agents to treat diseases including many cancers, in gene therapy, for breaching biological barriers such as the blood-brain barrier and intestinal epithelium, and as diagnostic agents: see for instanc Table 1 in Karayianni and Pispas [3]. For example, polymersomes and rodlike micelles of PB-PEO copolymers loaded with the anti-cancer drug paclitaxel have experimentally displayed the controlled release profile and long-term stability necessary for inhibiting the growth of MCF-7 human breast cancer cells [26]. Diblock copolymer micelles are also being widely used in targeted drug delivery for lipophilic drugs such as FK506, administered in organ transplant recipients for immunosuppression [27,28]. The versatility and controllability of physical properties as well as biochemical activity of biodegradable polymersome-based nano-constructs are being actively explored for cancer theranostics, an approach that integrates diagnosis (e.g., by imaging) and therapeutics [23].
Despite the insights gained from extensive experimental studies on the phase behavior of BCPs in solution, several questions regarding the thermodynamic and kinetic pathways underlying their self-assembly leading to diverse morphologies remain unanswered. First, real time visualization of spontaneous formation of molecular aggregates in such systems is beyond the spatiotemporal resolution of advanced imaging technologies. Consequently, morphology characterization is achieved often by using cryo-TEM experiments although progress in NMR imaging has made it possible to track the trajectories of individually tagged molecules in native solution as they navigate within and across molecular aggregates [29,30]. Second, experimental observations of shape transitions are often rationalized based on elegant, yet simplified geometric arguments, such as the one based on the packing parameter, which was developed to explain spherical, cylindrical, and vesicular aggregates in amphiphilic surfactants [31]. However, experiments show that self-assembly of BCPs in solution leads to extraordinarily diverse morphologies. Further, a clear demarcation of hydrophilic and hydrophobic domains does not exist in BCP aggregates: e.g., coarse-grained molecular dynamics (CGMD) simulations show significant degrees of chain entanglement and interdigitation of the hydrophobic segments of the upper and lower leaflets of BCP bilayers [32,33].
Questions regarding entropic (e.g., polymer chain stretch and orientation) and energetic (e.g., solvent accessible surface area) changes as well as solvent transport mechanisms underlying morphology transitions, especially rod to lamella as well as lamella to vesicle transitions, remain largely unresolved. For instance, the proposed mechanisms of vesicle formation have been at best speculative. One proposed pathway in which a sufficiently large lamellar structure develops curvature, bends, and folds into a vesicle is based on energetic considerations. Specifically, it is envisioned that during such morphology change, the lamella discards the energy associated with the unfavorable hydrophobic interactions of its edge groups with the surrounding solvent molecules at the expense of gaining curvature energy [15,22,34]. Another proposed pathway entails solvent diffusion into large spherical micelles creating a polymer-free core region [22]. On the other hand, CGMD simulations conducted by Markvoort and coworkers [35] on phospholipid systems predict an increase in the overall potential energy associated with bilayer to vesicle transition, suggesting the existence of entropic driving forces. Configurational entropy associated with the distributions of chain stretch and orientation of hydrophobic/hydrophilic segments within BCP aggregates could influence their macroscopic mechanical properties, e.g., bending rigidity of bilayers. This in turn could have pronounced implications on shape transitions. To date, the relationships among internal molecular architecture of BCP aggregates, their mechanical properties, and shape dynamics remain poorly understood.
The overarching goal of the present work is to develop faithful molecular dynamics (MD) simulations to study spontaneous self-assembly in a model (PB-PEO) diblock copolymer solution leading to the formation of diverse morphologies. The initial conditions of our simulations correspond to a homogeneous BCP solution at a prescribed concentration in which polymer molecules of a given chain length and composition are randomly distributed. No pre-assembly is employed, and spatiotemporal evolution of structures is tracked in real time. In the past, both CGMD simulations with pre-assembled initial conditions [32,33] and dissipative particle dynamics techniques [36,37] have been employed to study self-assembly, bilayer to vesicle transition and kinetics of copolymer exchange between self-assembled aggregates in BCP solutions. In the present study, we employ CGMD simulations which are adapted from our previous investigations of self-assembly and shape transitions in as well as shear/elongational flow dynamics and rheology of cationic surfactant solutions [38,39,40,41,42,43,44,45]. Our simulations utilize the coarse graining approach and force fields provided by the MARTINI framework [46]. Utilizing coarse-grained molecular representations allow for conducting simulations that span sufficiently large length and time scales to capture spontaneous self-assembly processes in the presence of explicit solvent-polymer interactions.
Simulation details and data analytics methods are discussed in Section 2. In Section 3, we summarize the results of a set of over 200 (excluding replicates) CGMD simulations conducted by systematically varying the chain length, hydrophobic to hydrophilic segmental composition, and polymer concentration. Overall, the simulations not only capture experimentally observed morphologies but also render significant geometric, topological, and configurational details to our understanding of the structure of BCP aggregates. Various morphologies predicted by the simulations are organized into a phase diagram. Insights and intuitions provided by this work, together with those gained from experiments, enhance our understanding of morphological diversity in BCP solutions and could lead to the development of more accurate theories of BCP aggregation in the future.

2. Materials and Methods

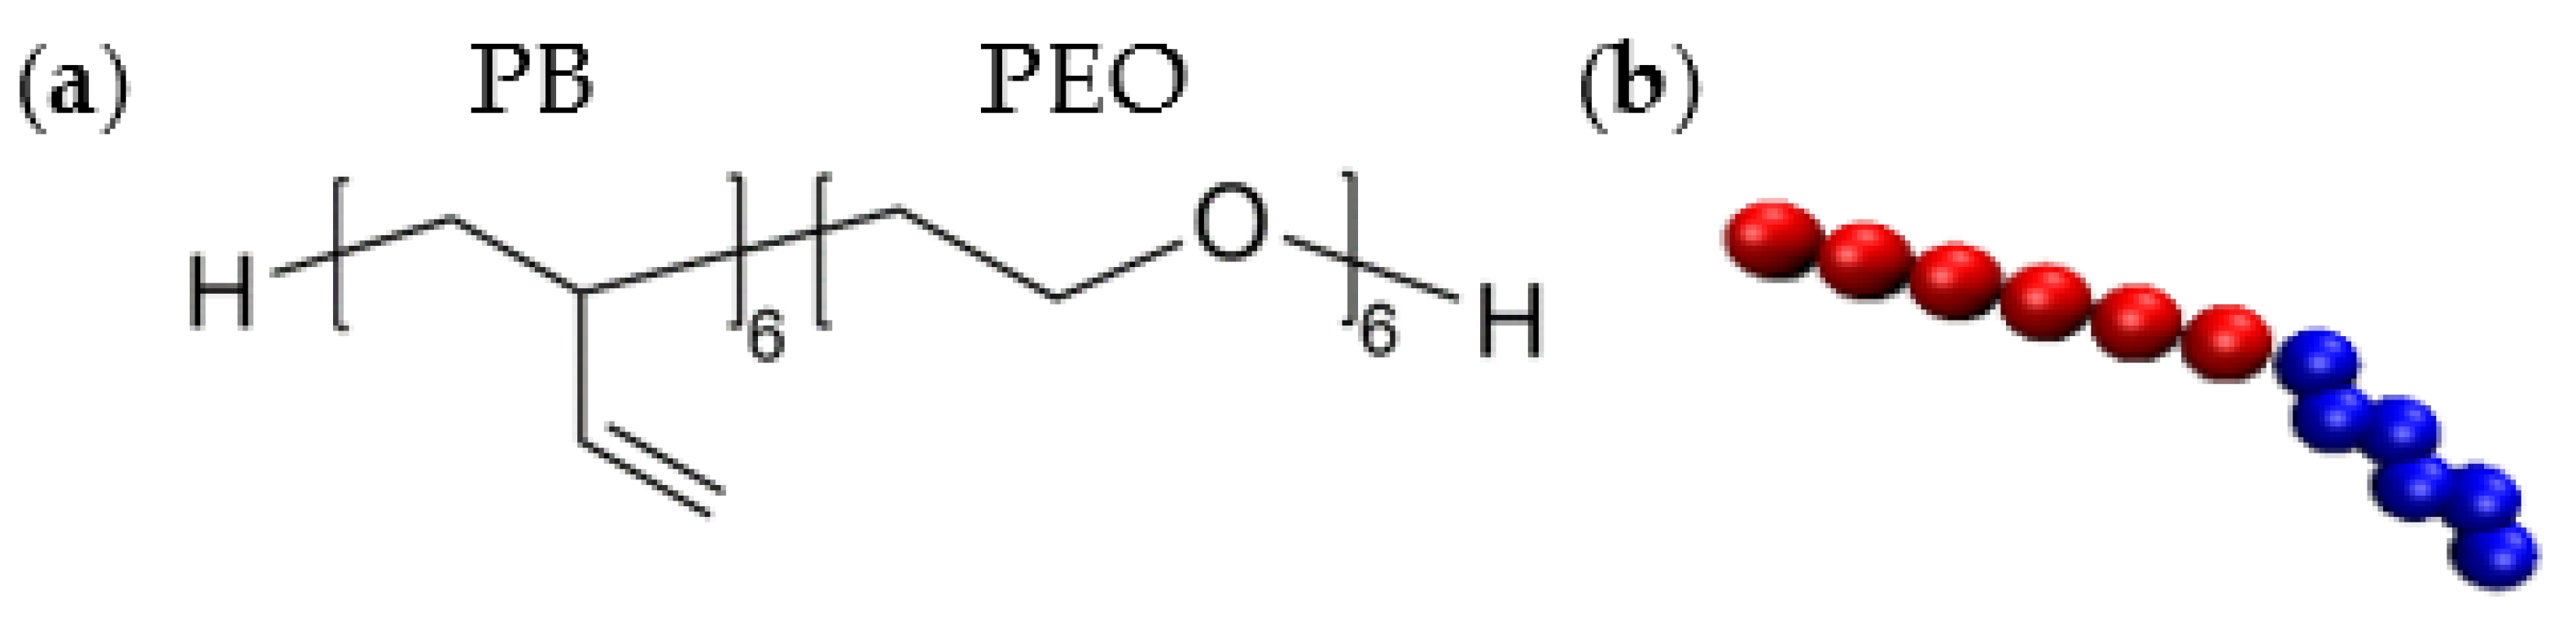
2.1. Coarse-Grained (CG) Polymer Model

Even with the computational prowess available today, it is impractical to access, using all atom descriptions of the polymer and solvent, the length and time scales over which spontaneous copolymer self-assembly takes place in solution. On the other hand, mesoscopic models such as the ones employed in Brownian [47] or dissipative particle dynamics simulations [48] neglect explicit inter-molecular and solvent-mediated physicochemical interactions that govern the self-assembly process. For instance, in Brownian dynamics, the influence of the solvent on polymer motion is modeled by a random force in accordance with the fluctuation-dissipation theorem. In this work, our goal is to simulate structure evolution in the presence of explicit solvent-mediated forces, starting from an initially homogeneous copolymer solution, i.e., without resorting to pre-assembly of molecules as done in the past [32,33]. Indeed, atomistic molecular dynamics (MD) simulations in which the positions and momenta of solvent and polymer atoms are evolved in time subject to Newton’s second law of motion would provide the most detailed portrait of the self-assembly process. However, the number of degrees of freedom and ultrasmall time steps (typically much smaller than the time scale of inter-atomic bond fluctuations) required in atomistic MD make it computationally intractable for conducting simulations that span length and time scales sufficient to capture spontaneous self-assembly of polymeric molecules. Further, interatomic interactions within monomeric units do not have an appreciable influence on thermodynamic self-assembly induced primarily by hydrophobic interactions. Hence, to realize an ensemble of simulations which collectively can provide statistically meaningful results on the effect of concentration, molecular weight, and composition of the copolymer on morphology transitions in monodisperse diblock BCP solutions, we employ a coarse-grained (CG) MD framework. Such CGMD models have been used successfully to probe the role of solvent- and salt-mediated interactions on the aqueous-phase self-assembly of surfactants [44,45], study the topology and energetics of wormlike micelles and micelle networks [41,43], understand flow-induced deformation and rupture of micelles [40,42], and explore the structure and rheology of micelle-nanoparticle complexes [38,39]. A similar approach is employed in the present study.
CG molecular modeling approaches originate from the pioneering work of Levitt and Warshel in the 1970s [49,50]. In the present study, we employ the MARTINI force field, developed by Marrink and coworkers at the University of Groningen, initially used in 2004 for molecular dynamics simulation of lipids [51] and later (2007) extended to various other molecules [46]. In this representation, several atoms are represented by a single CG bead. Based on their interaction sites, the beads are classified into four main types, namely Q, P, N, and C representing beads with charged, polar, nonpolar, and apolar characteristics, respectively. Each bead is further classified into many subtypes, which are used to represent the chemical nature of the underlying atomic structure more accurately [46]. Within one of the four main types, subtypes are either distinguished by their hydrogen-bonding capabilities (d: donor, a: acceptor, da: both donor and acceptor, 0: none), or by a number indicating the degree of polarity, which ranges from 1 (low polarity) to 5 (high polarity). Ring structures are denoted by the prefix ‘S’ [46].
In the present study, water (four molecule cluster, W), PB (one monomer), and PEO (one monomer) are represented by bead types P4, C4, and SNda, respectively [46,52]. The solvent consists of 90.9% of P4 water beads along with 9.1% of “antifreeze” beads (WF), which are of type BP4 and slightly bigger than the P4 beads. The WF beads are employed to disturb the lattice packing of the uniformly sized solvent beads and decrease the solvent freezing point to less than 250 K [46,53]. Figure 1 shows an example of the CG representation of a single copolymer chain that is composed of 6 butadiene and 6 ethylene oxide monomers: see Table S1 for additional details. In the simulations, the number of monomers is varied systematically to study the effect of chain length and chain composition on morphology evolution. Similar representation of PEO was used by Yang [54] in CGMD simulations to study dynamics of PEO chains in uniform shear flow.
The stretching and bending interactions between chemically bonded beads are modeled by weak harmonic potentials Vb and Vθ, respectively, by Equations (1) and (2) as
V b ( b ) = 1 2 K b ( b b 0 ) 2
V θ ( θ ) = 1 2 K θ ( c o s ( θ ) c o s ( θ 0 ) ) 2
where b0 and θ0 represent the equilibrium bond distance and equilibrium bond angle at the minimum energy configuration, respectively, and Kb and Kθ represent constants associated with bond stretching and bending energies, respectively. The non-bonded interactions between beads i and j are described by a 6–12 Lennard-Jones (LJ) potential given by
V L J r i j = C i j 12 r 12 C i j 6 r 6 .
Equation (3) can also be written as
V L J r i j = 4 ε i j σ i j r 12 σ i j r 6 ,
where
C i j ( 12 ) = 4 ε i j σ i j 12   and   C i j ( 6 ) = 4 ε i j σ i j 6 .
In the above equations, r represents the distance between beads i and j, ε i j is the depth (minimum) of the potential well (energy function), and σ i j is the distance at which V L J is zero. ε i j and σ i j are also referred to as the interaction strength and cutoff length, respectively.
MARTINI force field requires the LJ potential to be shifted smoothly to 0 between 0.9 and 1.2 nm, rather than using a hard cutoff to avoid singularities in the computation of the inter-particle forces. This is achieved by using a potential-switch function SV given by
S V r i j = C i j 12 S 12 C i j 6 S 6 ,
where
S α = 1 r α C ; r r s h i f t 1 r α A 3 r r s h i f t 3 B 4 r r s h i f t 4 C ; r s h i f t < r r c u t 0 ; r > r c u t
α = 6   o r   12 .
In Equation (7), the parameters A, B, and C are defined by
A = α α + 4 r c u t α + 1 r s h i f t r c u t α + 2 r c u t r s h i f t 2 ,
B = α ( α + 3 ) r c u t ( α + 1 ) r s h i f t r c u t α + 2 ( r c u t r s h i f t ) 3 ,
and
C = 1 r c u t α A 3 r c u t r s h i f t 3 B 4 r c u t r s h i f t 4 ,
where values of r s h i f t = 0.9 nm and r c u t = 1.2 nm are used. The force field parameters used in the present simulations are listed in Tables S2–S4 [46,52,54].

2.2. Simulation Details

The simulations are performed by using the Gromacs 2020.2 MD software. First, simulations are conducted to minimize the energy of the initial system. This is followed by a short (a few ns in duration) NVT simulation to equilibrate the system at a desired temperature to ensure algorithmic stability. Subsequently, a sufficiently long NPT simulation (production run) is carried out. Velocity generation at the outset of a simulation, which is carried out by sampling from a Gaussian distribution that yields the mean temperature, is imperfect. When coupled with a barostat, initial velocity distributions thus generated can frequently lead to numerical instabilities. Hence, equilibration is better performed for an NVT ensemble for a short period of time to get the correct velocity distribution. Proceeding NPT simulations lead to the establishment of the appropriate system density.
The initial simulation box is cubic with a linear dimension of 40 nm. In comparison, the contour length of the longest copolymer chain is 6.58 nm. The number of water beads (W+WF) is held constant at 440,000, and the number of copolymer beads (chains) is varied to achieve a desired polymer concentration. During the NPT simulation, the box size changes to between 39 and 41 nm to match the correct system density.
To generate a phase diagram of self-assembled morphologies in the chain length (N)-mole fraction (x) space, the length of the copolymer chains is varied from 6 to 15 beads. For each chain length, we carry out simulations for different compositions. The composition sequence is denoted by 2PB(N-2)PEO, 3PB(N-3)PEO, ……, and (N-2)PB2PEO. For example, for a chain length N = 8, we perform simulations for copolymers with compositions denoted by 2PB6PEO, 3PB5PEO, 4PB4PEO, 5PB3PEO, and 6PB2PEO. Additionally, we conduct simulations for 0PB11PEO, 1PB10PEO, 10PB1PEO, and 11PB0PEO. For each composition, simulations are replicated with three different initial conditions. Hence, the total number of simulations used to construct the phase diagram in the present study is 237. The polymer concentration is held approximately constant at 10 mol% in these simulations.
The above choice of polymer concentration was made based on (i) considerations of computational expenses which increases rapidly with increasing number of degrees of freedom and (ii) experimental observations that a variety of self-assembled morphologies manifests at comparable polymer concentrations in PB-PEO and similar systems [11,12,13,14]. Under these simulation conditions, the number of copolymer beads ranges from 7500 to 4000, thus making the total number of monomers between 42,000 and 60,000. The chain lengths used in the simulations translate to polymer molecular weights (MWs) that range between 264 Da (6PEO) and 810 Da (15PB). Hence, these are relatively short polymers with MWs comparable to surfactants with long hydrocarbon chains, e.g., cetyl-trimethyl ammonium chloride, a C-16 cationic surfactant studied extensively in experiments and our previous CGMD simulations [38,39,40,41,42,43,44,45] has a MW of 320 Da. However, as shown in Section 3, the ability to manipulate the relative lengths of the hydrophilic (PEO) and hydrophobic (PB) segments within a polymer chain allows for the generation of diverse morphologies in copolymer solutions as compared to the limited set of structures observed in surfactant systems. We note that the persistence lengths of the PEO and PB chains are comparable to their bond lengths. This renders significant chain flexibility, a property that makes the copolymers amenable to a broad range of packing protocols.
To study concentration effects, we use the symmetric 6PB6PEO chain and vary the copolymer molar concentrations from 5.8% to 38.0%, which correspond to mass concentrations ranging from 4.0% to 29.5%. The reference pressure and temperature are 1 bar and 300 K, respectively. A v-rescale thermostat [55] with a time constant of 1.0 ps is used for temperature coupling. Berendsen barostat [56] with a time constant of 4.0 ps is used for isotropic pressure coupling during the NPT simulations. The simulations employ periodic boundary conditions along all three spatial coordinates. The time step for equilibration runs is 20 fs, and the run time is 2 ns. The time step for production runs is 40 fs, and the run time is up to 600 ns.

2.3. Data Analytics: Methods and Tools

Definition of a cluster: any two beads with center-to-center separation less than the cutoff distance are regarded as part of a cluster (aggregate). Further, within any bead in each cluster, there exists at least one bead at a distance less than the cutoff value. In this study, we use 0.5 nm as the cutoff distance. This is based on the cutoff distance of 0.47 nm for non-bonded LJ interactions between PB and PEO monomers.
Radius of gyration ( R g ): the radius of gyration is used to quantify the size of self-assembled clusters. Radius of gyration is the root mean square distance of the beads in the cluster from its center of mass and is given by
R g = 1 n i = 1 n r i 2
where r i is the distance from the ith bead to the center of mass.
Radial distribution function, RDF (g(r)): radial distribution function describes how the density of B, EO, or W beads varies as a function of distance from the center of mass of a cluster. A larger value of g(r) signifies tighter packing of the beads. RDF is given by
g ( r ) = < ρ ( r ) > ρ = 1 ρ i = 1 N δ 1 ( r i r ) δ 2 ( r + r r i ) 1 V ( r )
where < ρ ( r ) > is the average density of beads at a distance r from the center of mass, ρ = 3 n m / ( 4 π r m a x 3 ) is the average cluster density, nm is the total number of monomer beads contained in the cluster, r m a x is the distance of the farthest bead from the center of mass of the cluster, V ( r ) = ( 4 / 3 ) π ( r + r ) 3 r 3 and
δ 1 ( x ) = 0 , i f   x < 0 1 , i f   x 0   and   δ 2 ( x ) = 0 , i f   x 0 1 , i f   x > 0 .
In the summation in Equation (12), beads with centers at the inner boundary are included while those at the outer boundary are excluded and ∆r = 0.1 nm.
Solvent accessible surface area (SASA): The algorithm for computing SASA is illustrated in Figure S1. Specifically, a probe is slid along the periphery of the beads that constitute a cluster, and the area circumscribed by the motion of the center of the probe is equal to the SASA: see Eisenhaber et al. [57] for details. The radii of the probe, PEO monomer bead, and PB monomer bead are 0.25 nm, 0.215 nm, and 0.235 nm, respectively. Note that the probe radius is slightly greater than one half of the cutoff distance of 0.47 nm for non-bonded interaction between water and PB/PEO.
Linear dimension, surface area, volume, and packing parameter of the aggregates: The data generated from MD simulations include a set of spatial coordinates of the various beads (i.e., the so-called points cloud). The coordinates of its inner and outer bounding surfaces are obtained by using the alpha-shape algorithm, illustrated in Figure 2 [58]. The volume V and surface area A of molecular aggregates are computed from a 3-dimensional mesh constructed from the boundary coordinates. MatlabTM 2023a software is employed for this purpose. The cluster radius is calculated as the average distance between the surface points and the center of mass. Sphericity S is calculated as S = ( 6 π 1 / 2 V ) 2 / 3 / A . For a sphere, S = 1. For monolayer aggregates, the packing parameter, P, is defined as Pv/al, where v, a and l denote the volume of the hydrophobic segment, surface area of the hydrophobic-hydrophilic interface, the hydrophobic chain length, respectively [3,31]. In this work, we employ the same definition for monolayer structures. For bilayers (micelles and vesicles) and mixed structures, a used in packing parameter calculations is the area of the outer PEO-PB interface and the area of the solvent-aggregate interface, respectively. These definitions yield p values of 1/3 for monolayers and mixed structures of spherical shape. For a perfectly spherical bilayer consisting of PB and PEO segments of equal length, the above definition yields p ≈ 0.48.

2.4. Software Used

The initial configurations are built by using PACKMOL 20.14.0 [59]. The simulations are performed using Gromacs 2020.2 [60]. The molecular visualization is performed by using VMD 1.9.3 [61]. Data analysis and graphing are performed using MatlabTM 2023a, WPS officeTM 2021, C++, and OriginProTM 2017.

3. Results and Discussion

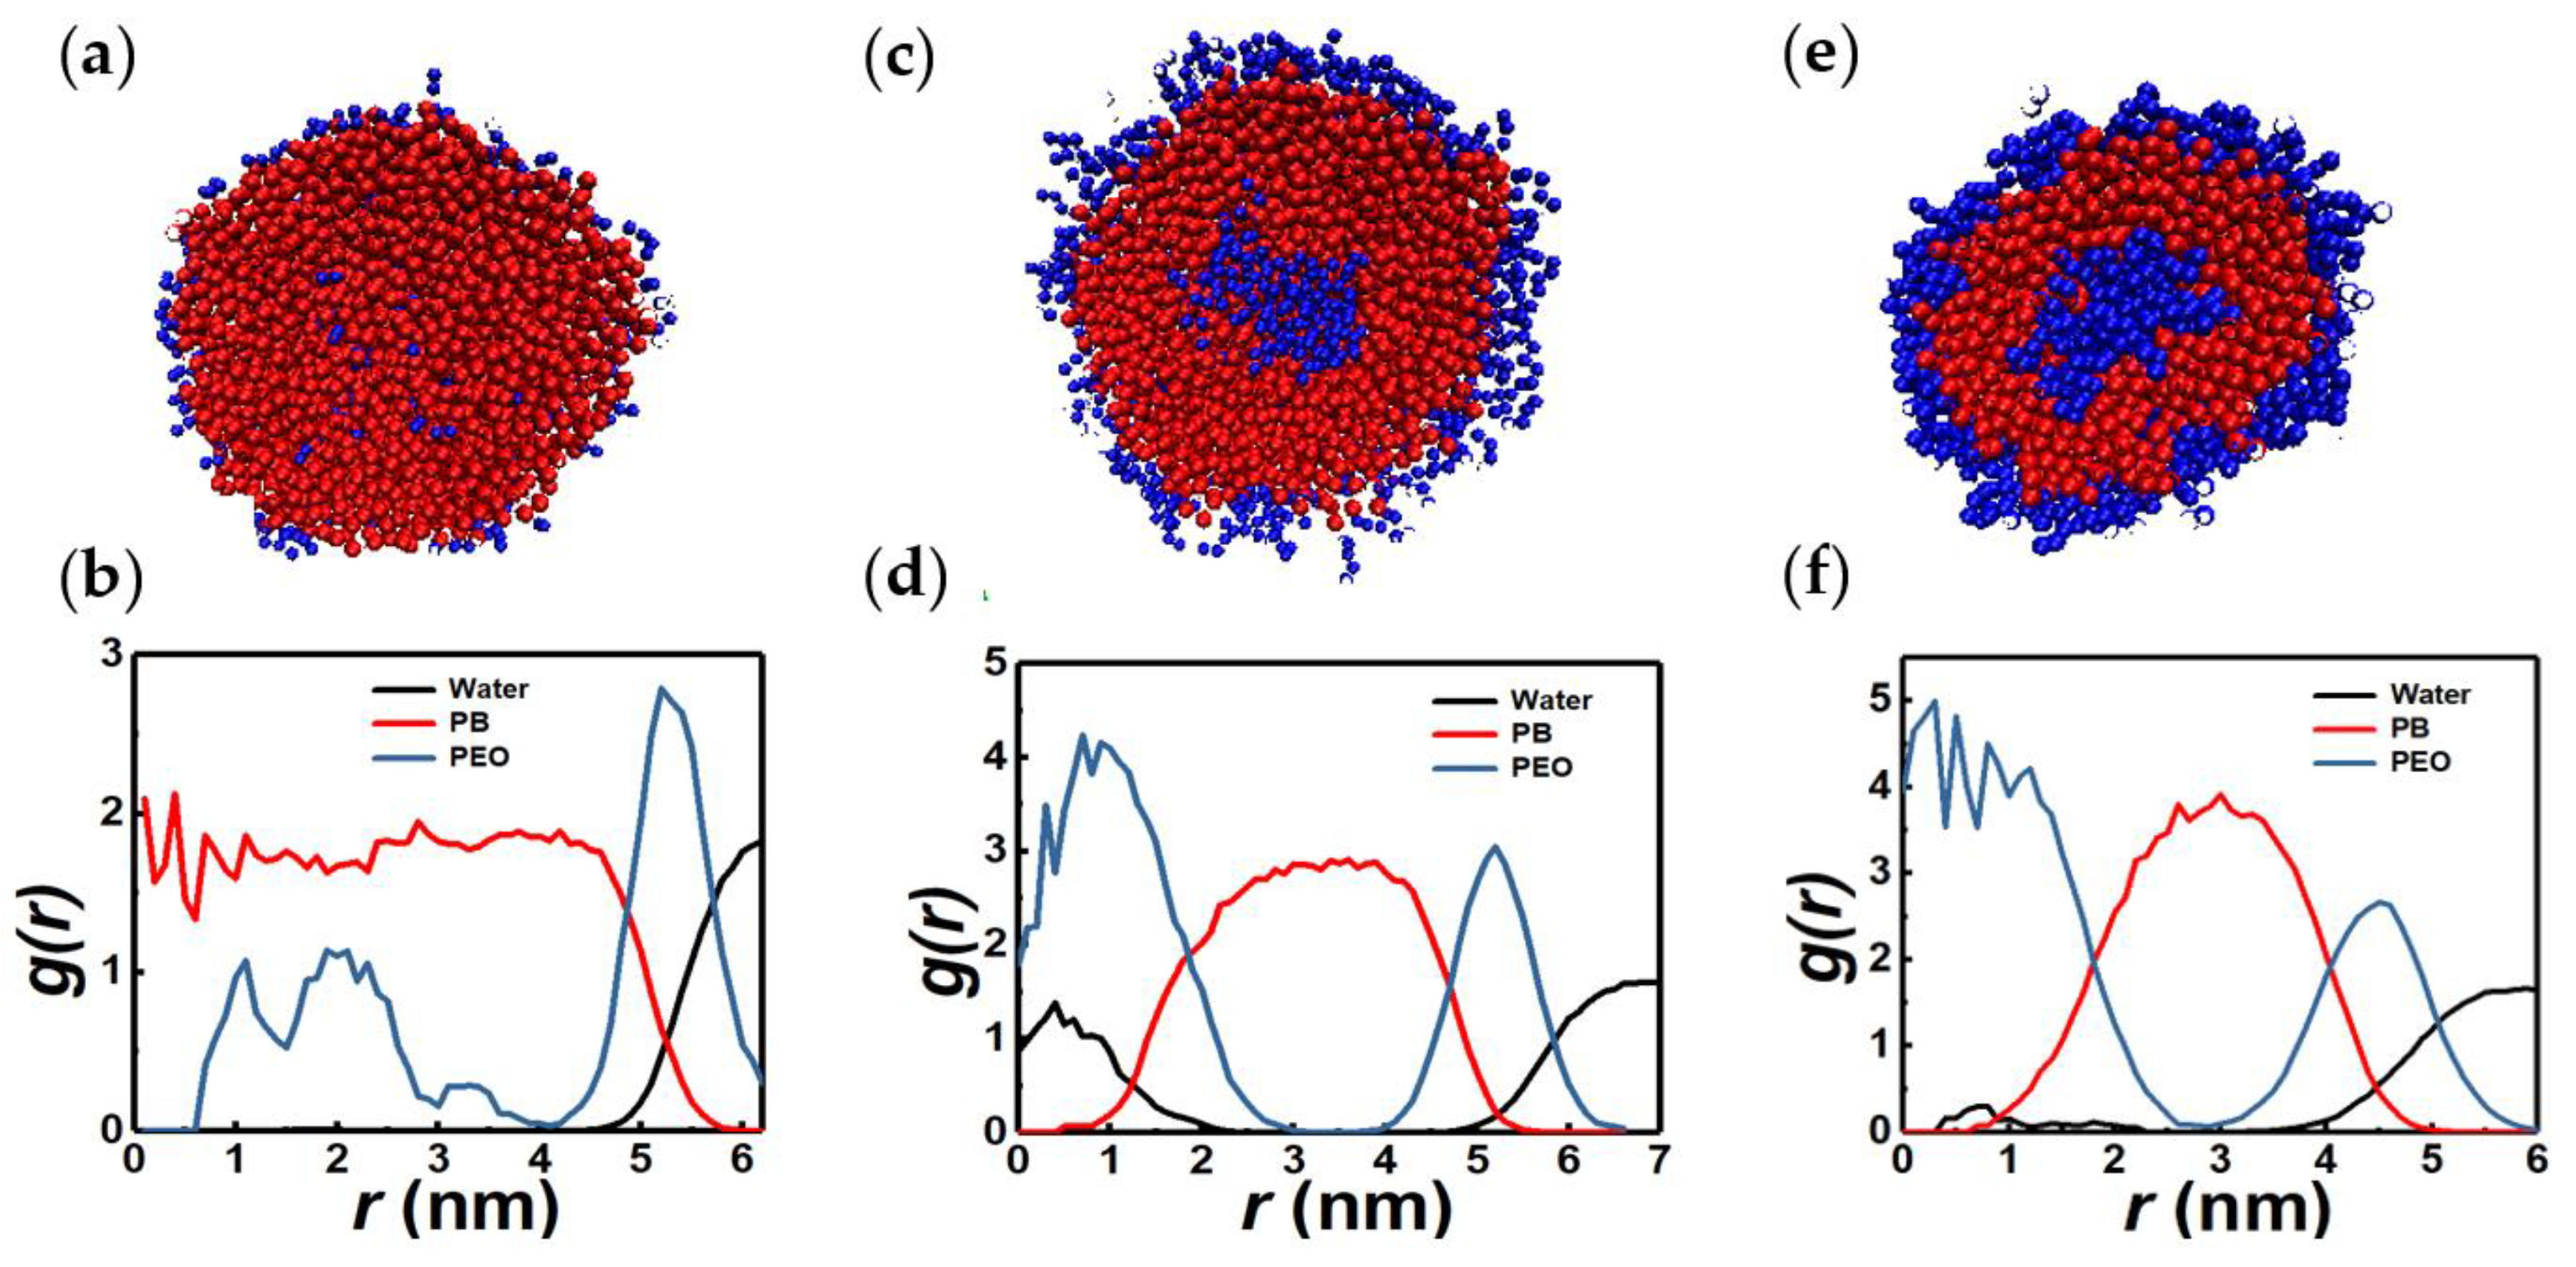
3.1. Vesicles (Polymersomes)

We first describe the various self-assembled morphologies observed in the simulations for different xPEO values for copolymer concentration of 10 mol%. Figure 3a shows the cross section (inset) of a representative vesicular structure and the corresponding RDFs of PB, PEO, and water, respectively, for a 5PB6PEO copolymer. RDFs of vesicles formed by copolymers of different segmental compositions are also shown in Figure 3b–d. Table S5 summarizes the geometric features of the vesicles whose RDFs are shown in Figure 3a–d.
Common features of the vesicular morphologies are the presence of a polymer-free core (center region), two maxima in the PEO RDF, and a single maximum in the PB RDF in between the two peaks in the PEO RDF. Water density in the core region exhibits a maximum close to the center and the inner PEO-water interface of the vesicle. This is attributed to the existence of hydrogen-bonded water-ethylene oxide pairs. The PB layer is almost devoid of water, as expected. Further, the shapes are nearly spherical with S ranging between 0.94 and 0.96 (Table S5). However, the RDFs show that the distribution of the hydrophobic and hydrophilic entities within the vesicle are far from those expected based on ideal geometric depictions often employed in the literature. For instance, the interface between PB and PEO segments is diffuse as inferred from the overlap between their RDFs. Second, the distribution of monomers depends on the chain composition (xPEO) with chains with PB to PEO ratio of unity (cases 4d) exhibiting a nearly symmetric distribution of PB segments. Third, we observe the second (outer) peak in the PEO RDF to be smaller than the first. This is attributed to the more crowded packing of PEO segments around the water core. As seen from Table S5, the density of water within the vesicle core is smaller than that in the bulk. This is a consequence of hydrogen bonding interactions between PEO and water beads and the steric exclusion due to the confinement provided by the PEO-water interface, which prevents a homogeneous distribution of water within the nanometer-sized cores of the vesicles observed in our simulations.
Table S5 shows that the packing parameters of the vesicles are close to 1/2, which is the lower limit of p for polymersomes. This is expected since the sizes of the water core and the copolymer bilayer (corona) are comparable to each other. For instance, for a symmetric copolymer chain (5PB5PEO), the calculated value of p is in good agreement with that for a spherical bilayer structure (≈0.48). Further, the cluster density of all the vesicles is nearly constants at approximately 10 beads per nm3. However, we see significant variations in the aggregation numbers ranging from 500 to 900 depending on the chain length and ratio PB to PEO composition within the copolymer. To probe whether such variability in n might be rationalized based on thermodynamic considerations, we calculate the probability distribution function (pdf) of the end-to-end distance Q, p(Q), of the hydrophobic as well as the inner and outer hydrophilic polymer segments within the aggregates. The information entropy H A associated with the ensemble of molecules that makes up the aggregate can be inferred from such data. Specifically, H A p   l n   p , where p is the pdf associated with the distribution of particles in the ensemble [62]. Figure 4 shows the pdfs of sQmaxQ for a representative vesicle. The distributions are skewed towards lower s values and have long tails. The best fit of p(s) to a log-normal distribution is also shown. The qualitative agreement with a log-normal distribution of the chain-stretch parameter (s), which was also observed for vesicular structures with different N and xPEO in our simulations, is intriguing. It is well known from probability theory that for a random variable with given expectation and variance, log-normal distribution maximizes the information entropy [63]. Further investigations are needed to establish whether such entropy maximization principles constitute self-assembly motifs in BCP solutions.

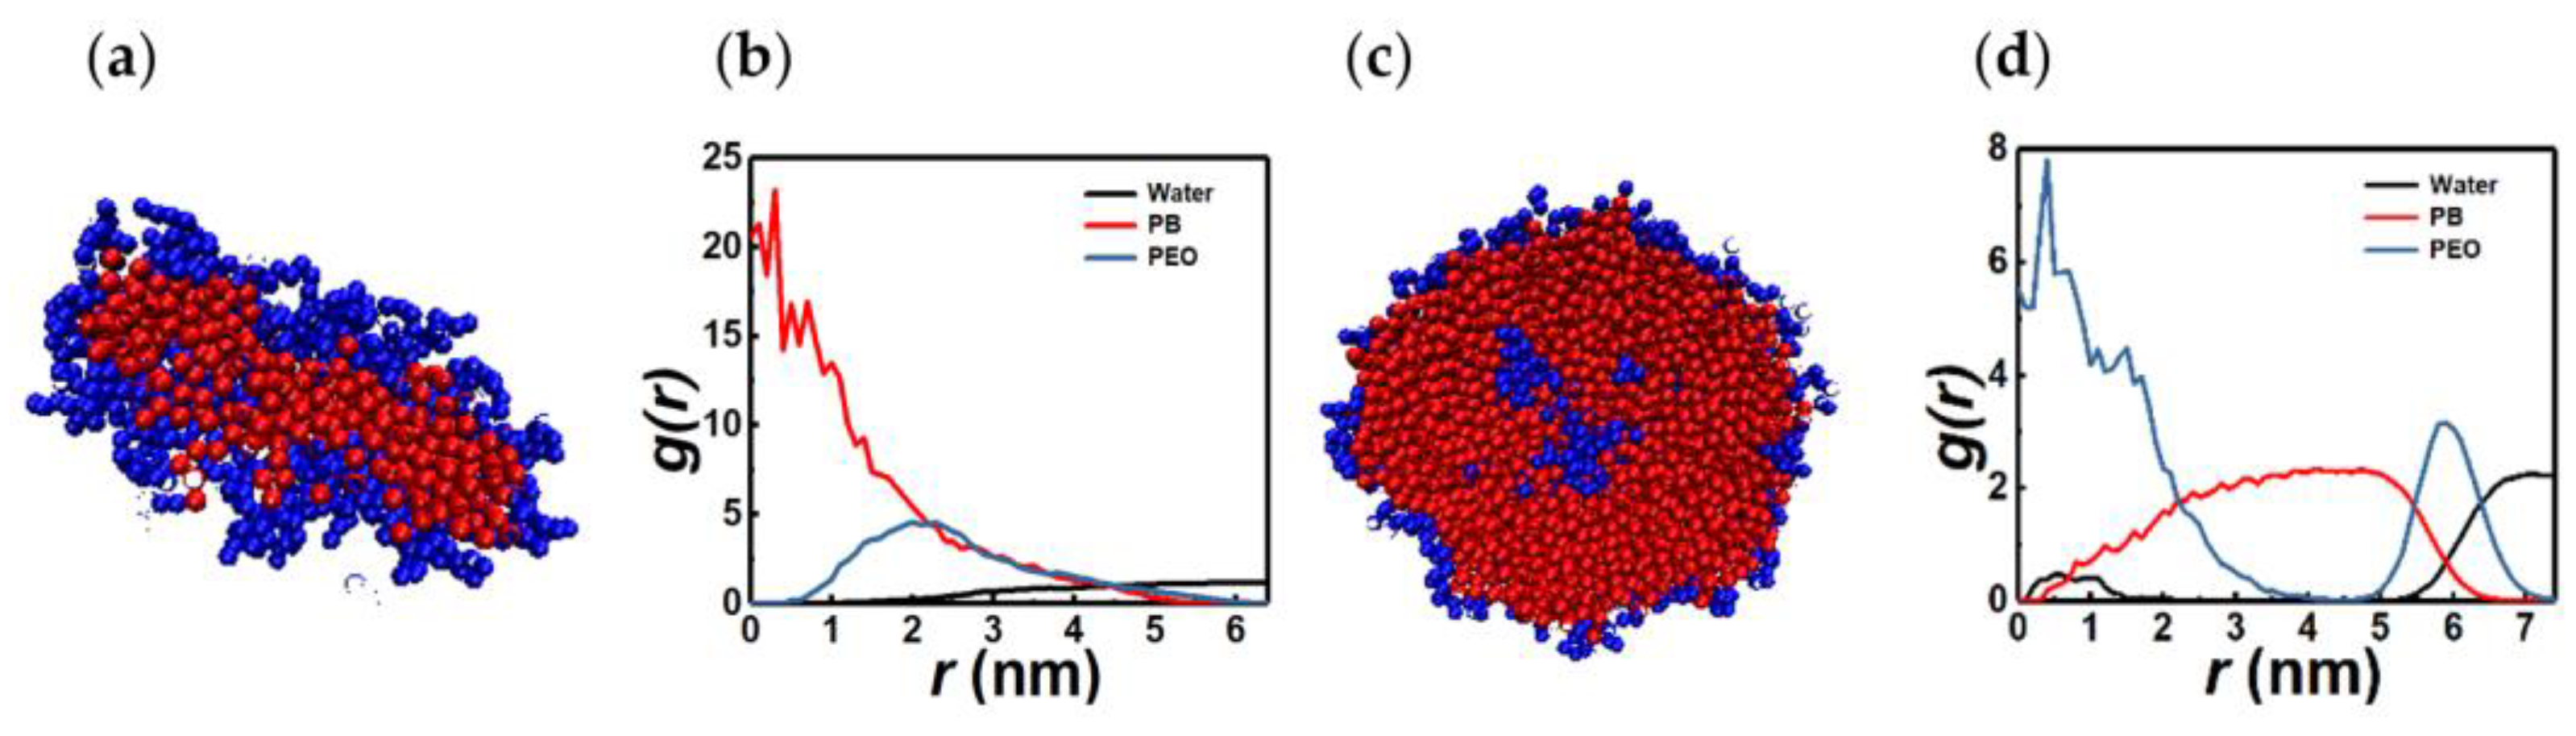
3.2. Spherical Micelles

Figure 5 shows representative cross sections and RDFs of nearly spherical micelles made up of relatively short BCP chains (N = 6). Corresponding geometric parameters are reported in Table S6. It is evident from Figure 5 that for a given chain length, compositional variations have a pronounced influence on the micelle structure. For the 2PB4PEO system (xPEO ≈ 0.67), a PEO-dominated micelle with a small PB core, surrounded by a well-mixed outer region of PB and PEO monomers, are observed. However, for 3PB3PEO chains (xPEO = 0.5), bilayer micelles with well-separated hydrophilic and hydrophobic domains are seen. Further, when xPEO is decreased to ≈0.33 (4PB2PEO system), PB-dominated multilayer micelles with a PEO-rich core, surrounded by a well-mixed intermediate domain and an external region consisting of a PB-rich shell and a PEO-solvent interface, are detected. As seen from Table S6, the aggregation numbers vary significantly across these composite micelle structures: asymmetric chains (4PB2PEO and 2PB4PEO) that form mixed multilayer structures have significantly higher n values as compared to that of the bilayer formed by symmetric chains (3PB3PEO). The packing parameter values are less than 1/3, as expected for nearly spherical assemblies. However, the cluster density is approximately 10 beads/nm3, as it is the case for vesicles observed in this study. This parameter is determined by the bond lengths and non-bonded LJ interaction forces.
Figure 6 shows representative cross sections and RDFs of nearly spherical micelles made up of relatively longer BCP chains (N ≥ 11). Corresponding geometric parameters are reported in Table S7. The cluster formed by chains with a large hydrophobic fraction (xPEO ≈ 0.15), has a PB-rich core devoid of water and a relatively sharp PEO-water interface. In contrast, for chains with larger hydrophilic fraction (xPEO ≈ 0.42 and 0.55), a bilayer structure with a well-defined PEO core is observed. These structures exist adjacent to vesicular and lamellar morphologies in the N-xPEO phase diagram shown in Figure 11. Structures similar to those shown in Figure 6a,c and or Figure 6e are referred to as PB-dominated micelles (PB-S) and spherical micelles, respectively, in the phase diagram.

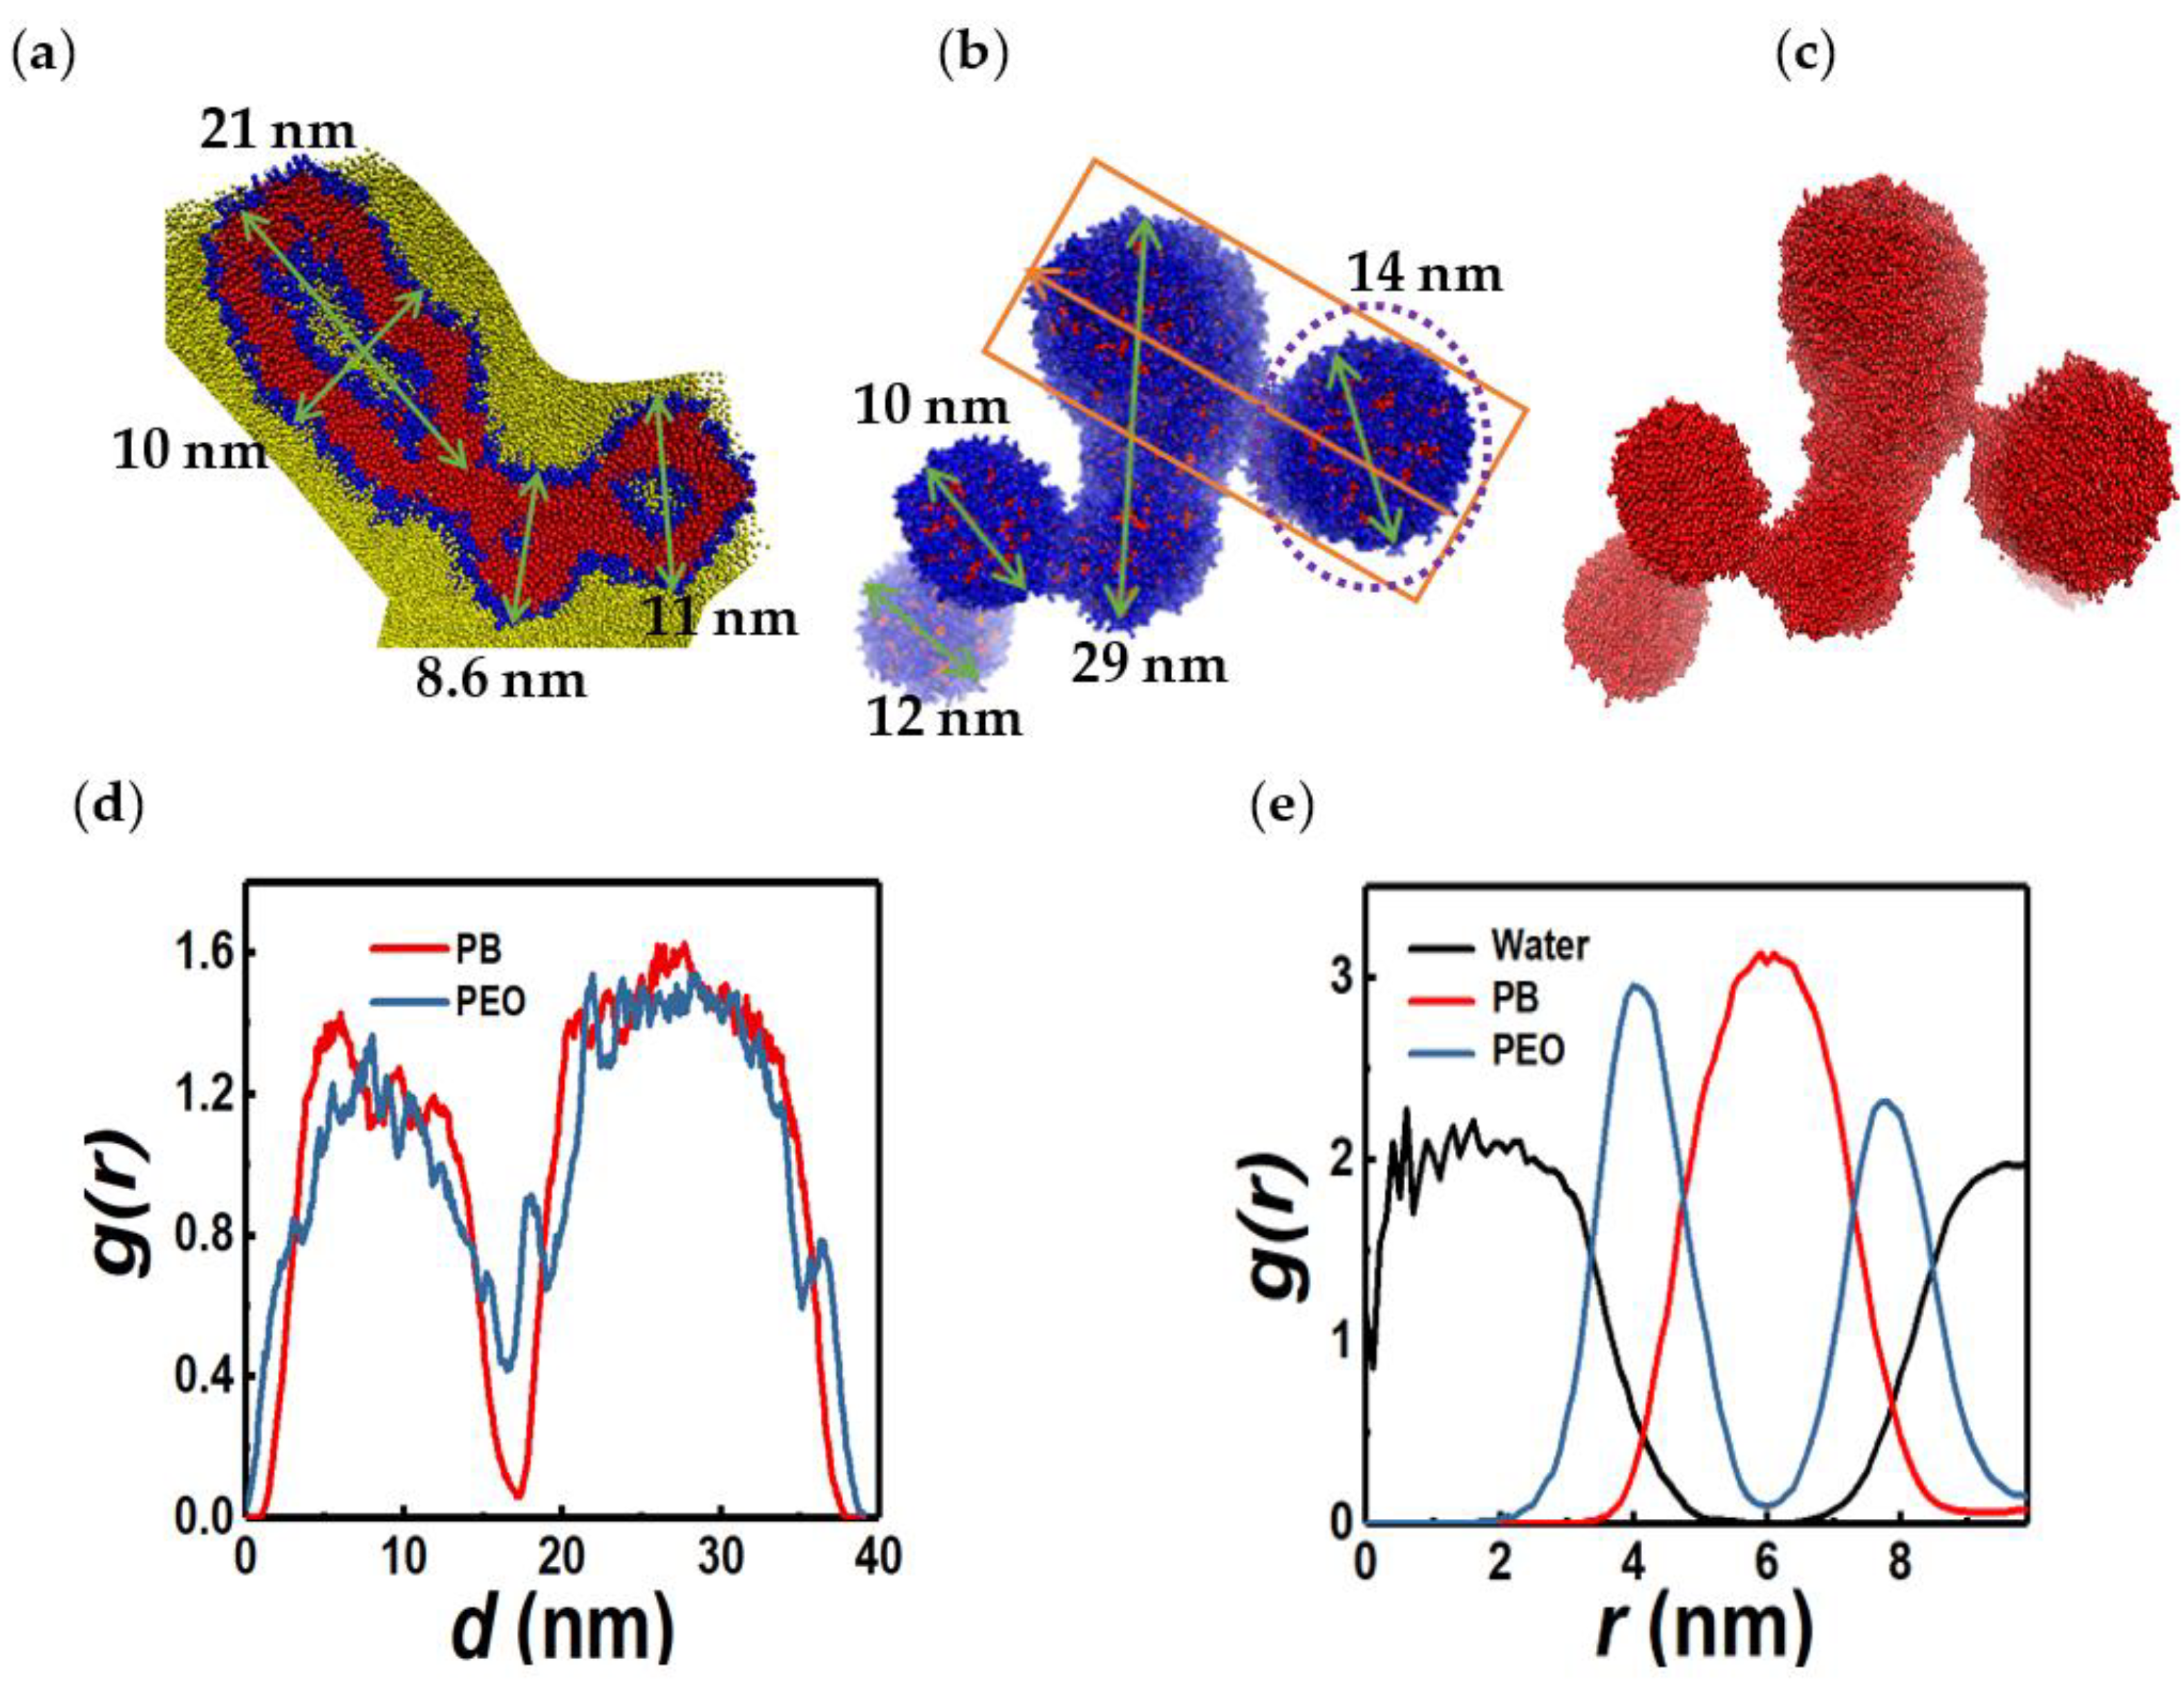
3.3. Irregular-Shaped PEO-Rich Micelles

For longer chains, increasing the hydrophilic fraction leads to the formation of irregular-shaped, single-layer structures with a hydrophobic core and a hydrophilic solvent interface, as shown in Figure 7a,b (3PB8PEO, xPEO = 0.73). The aggregation numbers for these structures range between ≈ 150 and 450 (n = 213 for the cluster shown in Figure 7a). In Figure 7c,d, we show the compact PB-dominated spherical micelle observed for 8PB3PEO (xPEO = 0.27) to contrast it with the irregular-shaped aggregate realized for the complementary chain composition xPEO = 0.73. Overall, BCP chains with larger hydrophilic fractions tend to form water interfaces with greater PEO stretch and mobility. This reduces the sphericity and packing parameter of the BCP assembly as seen in Table S8.

3.4. Linear and Branched Wormlike Micelles, and Micelle Networks

For chain lengths N > 9 and hydrophilic fraction xPEO > 0.4, cylindrical aggregates are observed. These aggregates can grow into flexible, wormlike micelles as shown in Figure 8a. Flexibility is inferred from the large ratio of the contour length of the micelle to its persistence length. To calculate the latter, the micelle is partitioned into cylindrical segments with linear dimension of 2 nm and reconstructed as a chain that connects the centers of mass of these segments. The persistence length is obtained by fitting the average of the cosine of the angle subtended by the vectors connecting the center of masses of adjacent cylindrical segments to a decaying exponential function [64]. A small persistence length implies a fast loss of orientational correlation along the chain contour and consequently a high degree of chain flexibility. RDFs of PB and PEO monomers along the (circular) cross section of the wormlike structure show a PB-dominated core and a PEO corona. However, there is significant overlap between the radial distribution functions of the hydrophobic (PB) and hydrophilic (PEO) segments: the PB-PEO interface is diffuse and the overlap region spans ≈ 2 nm, which is greater than four times the length of the bond connecting the PEO and PB monomers within the copolymer. Further, the RDFs show that the micelle core is free of water.
Cylindrical micelles of amphiphilic surfactants have been known to form branched structures, especially in the presence of added salt. Branch formation has been hypothesized as a mechanism of stress relaxation in micellar fluids [65]. Specifically, the micelle branches, unlike polymeric ones which are held together by strong covalent bonds, can slide along longer backbones of a network structure, thereby healing internal stresses. This mechanism has been confirmed by CGMD simulations [41]. The present study reveals the existence of branched wormlike micelles as well as micelle networks in BCP solutions as shown in Figure 8c,d, respectively. The former structures consist of junctions with Y-shaped branches as seen in the experiments of Jain and Bates [12] which are illustrated in Figure 8e. In fact, these authors suggested that lamellar, rodlike, and Y-shaped structures form the building blocks of complex assemblies seen in BCP solutions. The micelle network closely resembles the bi-continuous rodlike structures seen experimentally in PS-PAA diblock BCP solutions: see Figure 4c in Mai and Eisenberg [11]. The micelle structures shown in Figure 8 are dynamic. To illustrate this, we track the end-to-end distance and the orientation, as quantified by the angle θ subtended by the projection of the end-to-vector on the x-y plane and the z axis, of a wormlike micelle as function of time. During the time interval shown in Figure 9, the micelle can be seen to grow by merging with smaller aggregates. Further, the orientation angle undergoes temporal fluctuations with a relaxation time of approximately 40 ns. The relaxation time is calculated as the inverse of the decay rate of the best exponential fit of the autocorrelation function ACF of θ vs. time during the time interval over which Q remains practically constant. This procedure follows the algorithm employed by Sambasivam et al. [40] for rodlike surfactant micelles.

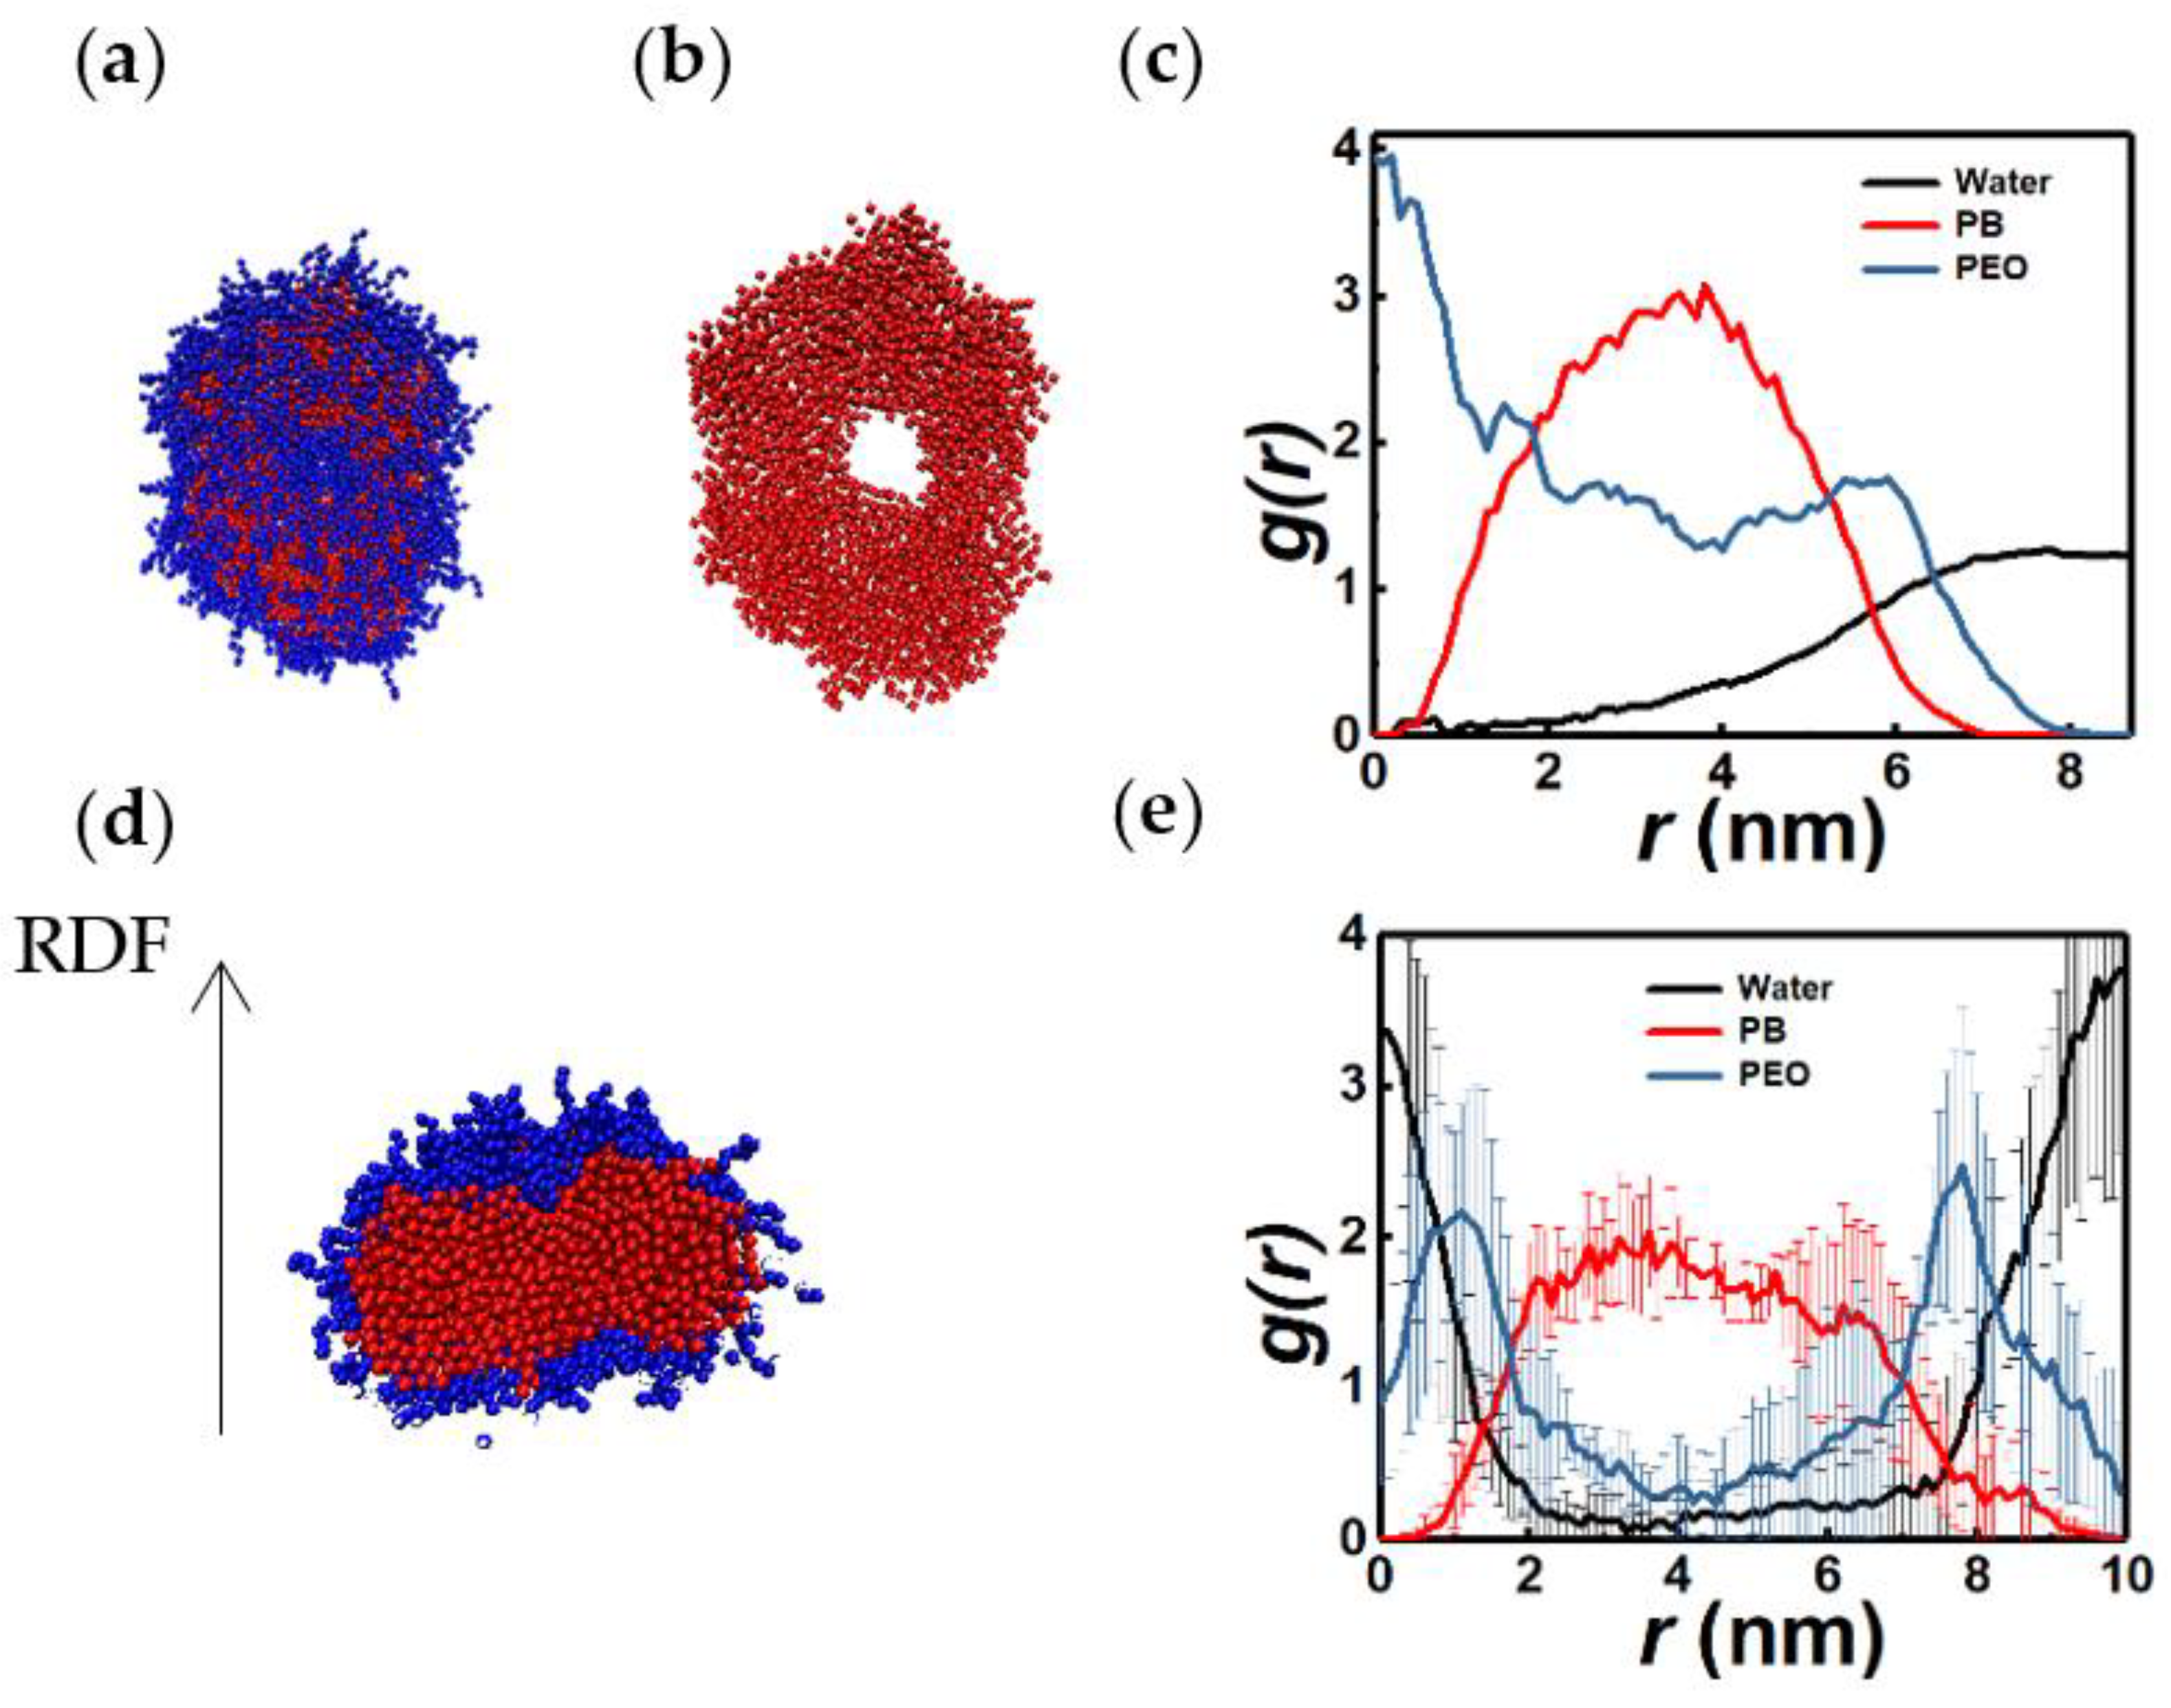
3.5. Tori and Lamellae (Bilayers)
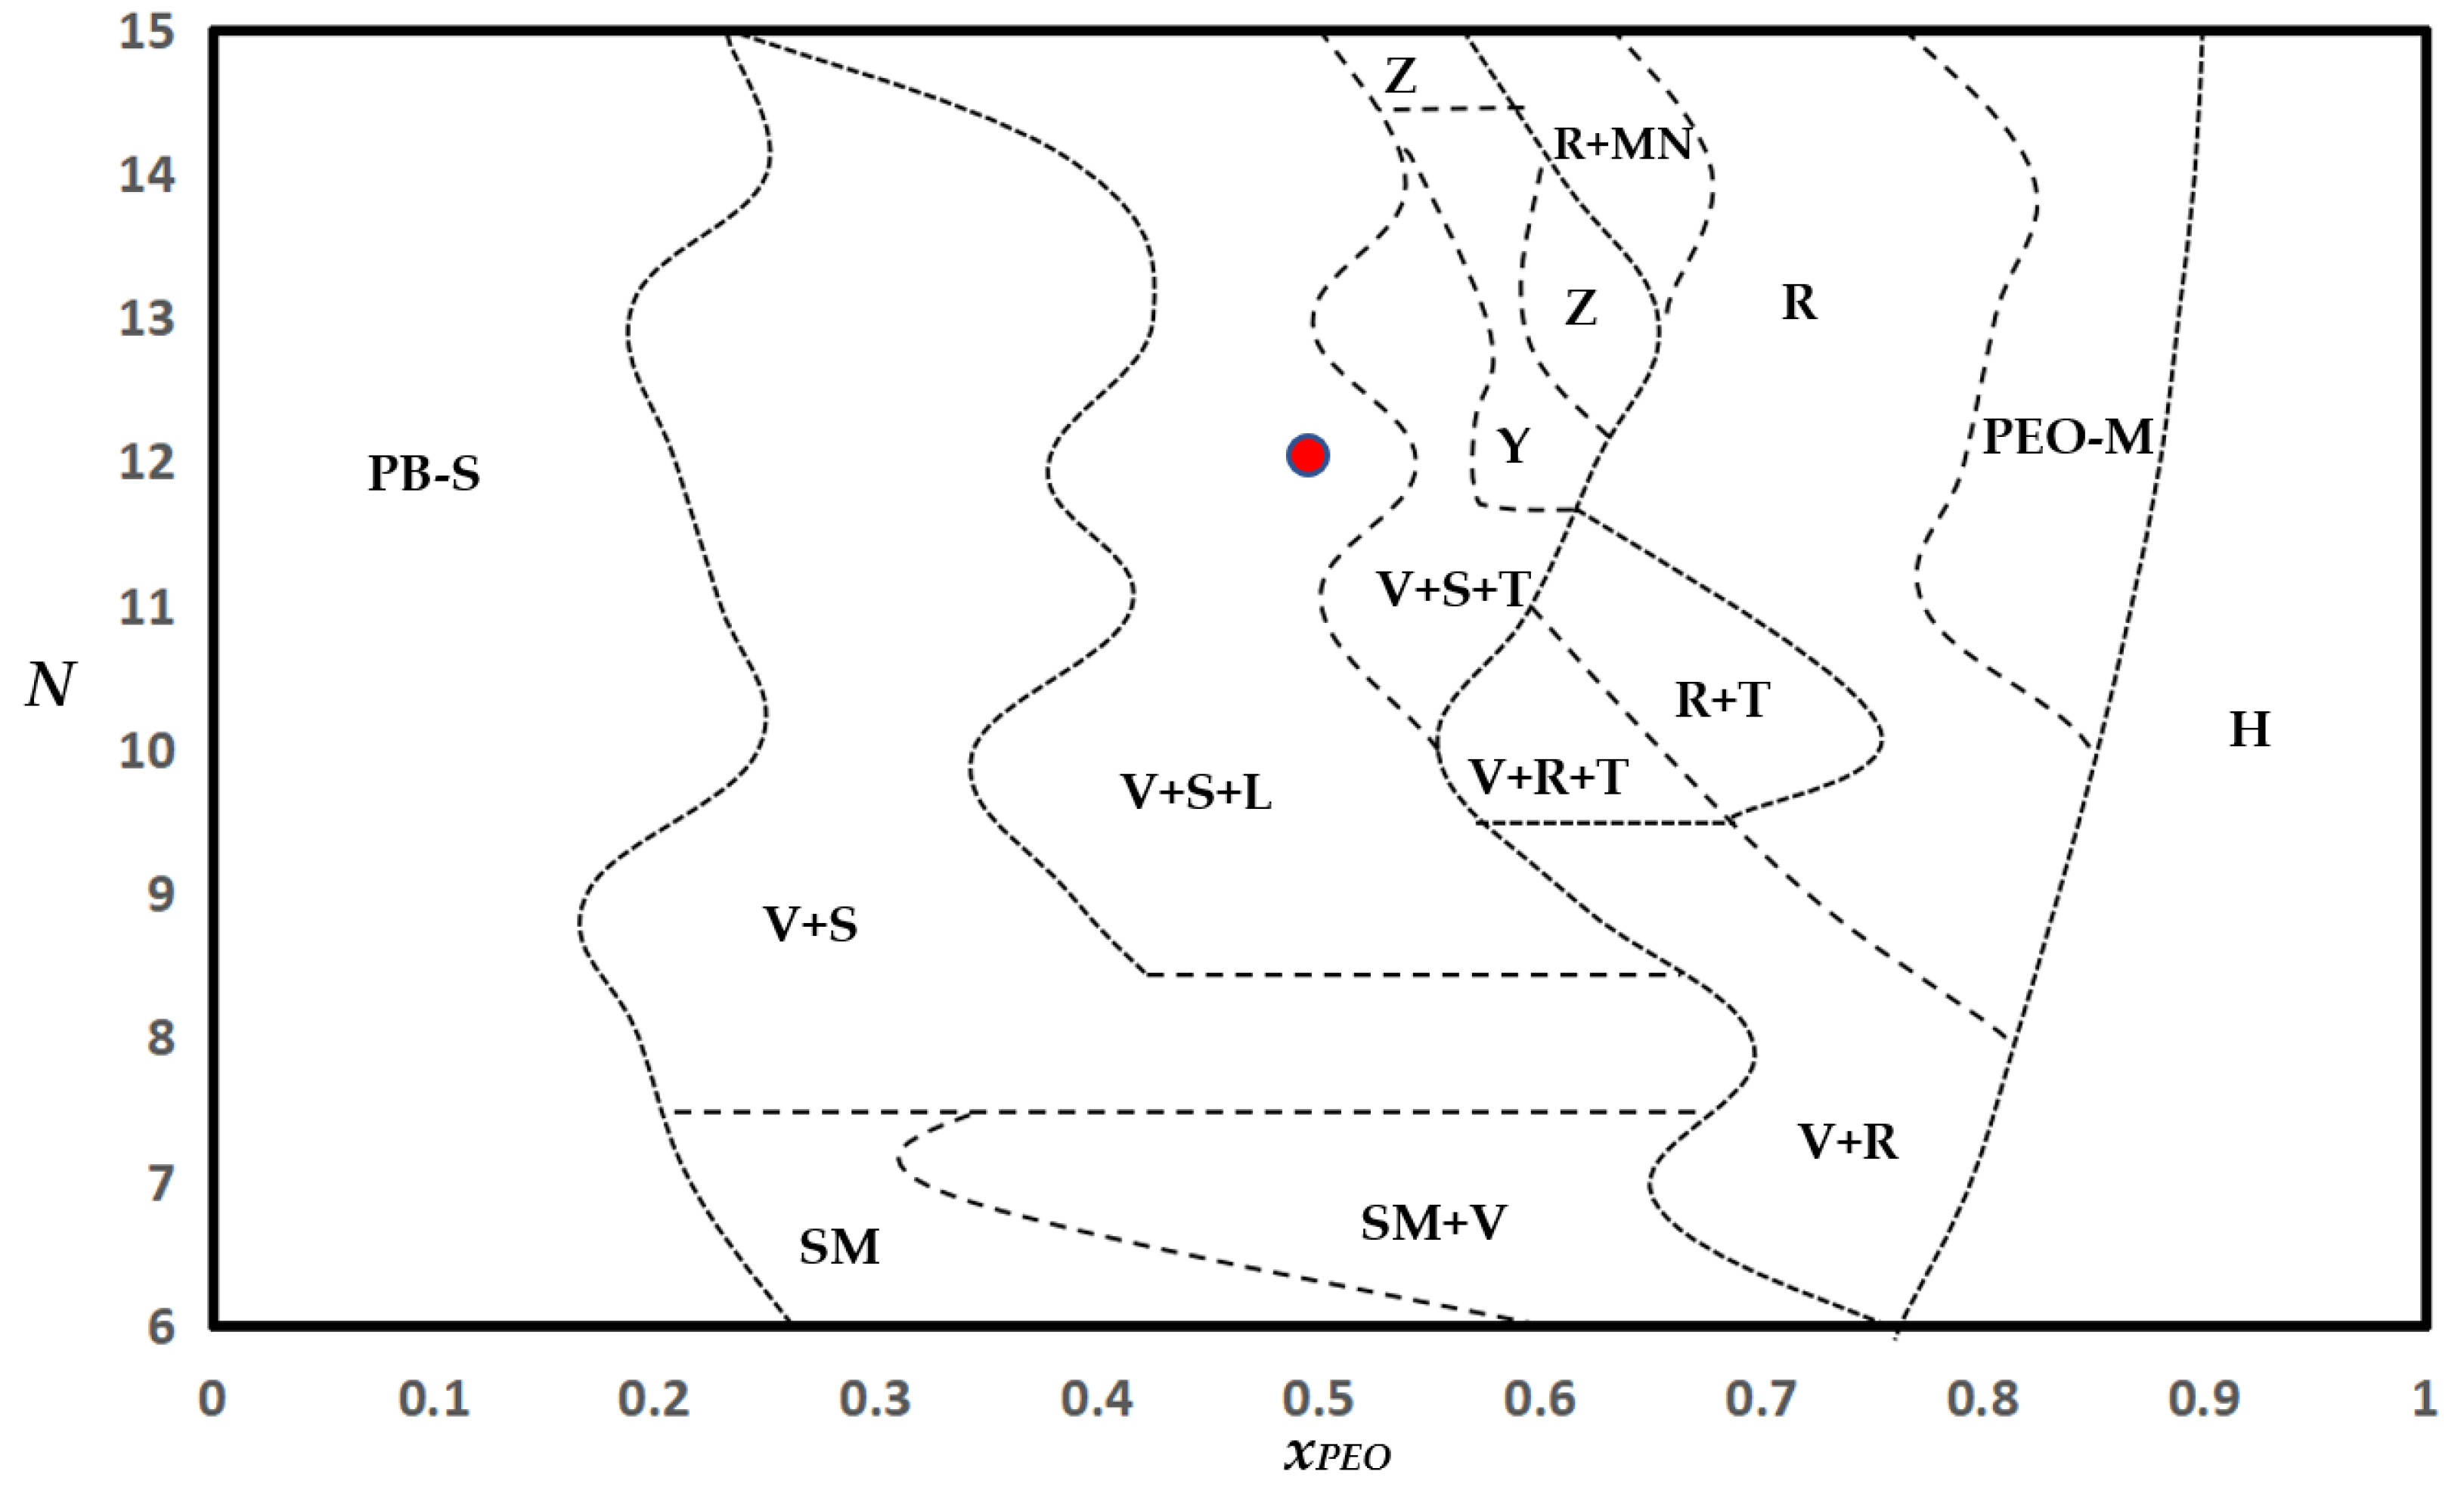
Figure 10a–c show a torus structure, PB organization within the torus, and the RDFs of PB and PEO monomers. This structure consists of a hydrophilic core and a corona. The intermediate region is rich in hydrophobic moieties. There is significant overlap between the PB and PEO RDFs suggesting the presence of diffuse hydrophobic-hydrophilic interfaces. Such diffuse interfaces are also observed in lamellar structures as illustrated in Figure 10d,e. Absence of sharp interfaces in bilayer structures was also reported in previous CGMD studies [32,33].

3.6. Phase Diagram

The BCP morphologies observed in our simulations are organized into a phase portrait in the N vs. xPEO space in Figure 11. For xPEO < 0.15, PB-dominated spherical micelles (Figure 6a) are observed for all chain lengths. In the limit as xPEO → 1, no micellization is observed, as expected. The phase portrait reveals that intermediate chain compositions (0.4 < xPEO < 0.7) lead to remarkable diversity in morphology. Specifically, consistent with experimental observations, simulations predict that rodlike, lamellar, and vesicular structures share phase boundaries [14]. Concentration, thermal, or mechanical (e.g., by flow shear) perturbations of solutions near the phase boundaries can induce topological transitions in BCP solutions. Moreover, the phase portrait shows that two or more morphologies coexist except for very low fractions of PEO or PB and very short chains. Furthermore, for slightly asymmetric hydrophilic chain compositions, i.e., around the neighborhood of xPEO = 0.6, the morphological complexity increases substantially with increasing chain length: see for examples regions Y and Z in the phase diagram where micelle networks (Figure 8d) coexist with vesicles, spherical micelles, and/or tori. Pathways of morphology transitions among these structures need to be investigated further. We have provided representative real-time visualizations of structure evolution constructed from computed MD trajectories in Supplementary Materials (Videos S1–S4).

3.7. SASA and Morphology Transitions

In Figure 12 and Figure 13, we report changes in the cluster size, as quantified by the radius of gyration Rg of the largest aggregate, and solvent accessible surface area (SASA) per monomer for the entire system, respectively. Figure 12 shows that Rg remains practically constant for xPEO values ≤ 0.6, although spherical micelle to vesicle transition is predicted for xPEO ≈ 0.3. However, Rg increases for xPEO > 0.6 as spherical structures merge to form rodlike micelles. Further increase in PEO composition leads to the breakage of rods into smaller PEO-dominated micelles of irregular shapes (Figure 7a). Figure 13 shows that specific SASA increases almost linearly with increasing xPEO in the region where spherical and vesicular structures are observed (xPEO < 0.6). This can be attributed to the enhanced hydrophilicity of the BCP chains in the case of spherical micelles and the availability of an additional water-PEO interface for vesicles. As cylindrical structures form, the solvent-PEO interface also grows rapidly proportional to the lateral surface area of the flexible wormlike micelles (xPEO > 0.6).

3.8. Effects of Copolymer Concentration on Morphology

To explore the effect of copolymer concentration C, expressed in wt%, on the shape and internal structure of self-assembled structures, we perform simulations for C ranging from 4 to 29.5 for N = 12 and xPEO = 0.5, around which pronounced morphological diversity is observed. This point corresponds to the red circle in Figure 11. Figure 14 shows Rg of the largest cluster observed for each copolymer concentration and the number of clusters NC as functions of C. When C reaches 29.5, polymers self-assemble into “giant structures”, that span the entire (periodic) simulation box. Hence Rg is not reported for this value of C as it is not a meaningful measure. Structure coarsening via plausible coalescence of smaller aggregates can be inferred from the data: NC is seen to decrease from 14 to 2 as C is increased from 4 to 29.5. This is also evident from the images of the cross sections of representative structures shown in Figure 15. Geometric features of the dominant structures observed for different C values are reported in Table S9. For the lowest C (=4), irregular-shaped micelles (S ≈ 0.85) are formed. Increasing C to 7.7 results in the formation of vesicles ((n ≈ 900, R ≈ 6.3 nm), which get larger with further increase in C to 11.1 (n ≈ 2700, R ≈ 9.4 nm) with a core thrice the size of the vesicle formed at C = 7.7. The examination of the pdfs of the magnitude of the segmental end-to-end vector Q for the two vesicles, shown in Figure 16, do not reveal appreciable differences between their means and variances. Hence, the increase in vesicle size with increasing C is a consequence of the enhancement in the aggregation number.
For larger C values (=14.3, 20), we observe concatenated vesicles, or vesicle strands, as shown in Figure 17. Each substructure consists of a water core and PEO-PB-PEO shell. The RDFs (Figure 17d) of PB and PEO monomers clearly show that the molecular bridge that attaches constituent vesicles in the strand to each other is compositionally richer in the hydrophilic (PEO) component. We compare the segmental stretches of PEO and PB within the bridge with those farther from it on the vesicle surface. As shown in Figure 18, the segmental Q statistics are practically identical for the two groups. This suggests that the molecular bridges are held together by hydrogen bonding interactions between the PEO segments. Vesicle strands predicted by our simulations have been observed in experiments as well: see, for instance, Figures 7 and 8 in Antonietti and Förster [15]. These authors have rationalized, based on considerations of bending energy minimization, the genesis of vesicular structures of non-spherical shapes and complex topologies/symmetries via mechanisms including swelling/deswelling, budding, and fusion in copolymer systems with bilayer symmetry. A more comprehensive set of simulations and data analytics are necessary to elucidate and quantify the physico-chemical interactions that lead to the formation of such composite structures.
For the largest C value (=29.5) accessible to our present simulations, we observe “giant” structures that consists of lamellar regions, domains with mixed compositions of PEO and PB and water cores: see Figure S2 for representative visualizations of 2D cross sections and RDFs of PB and PEO monomers in the lamellar region. The 3D architectures of such composite structures are quite complex: the loci of the lamella and water core change as a function of depth within the interior of the structure: see Figure S3 and 3D visualizations provided in the Supplementary Materials (Videos S5–S7). Further investigations are needed to quantify their topological and percolation characteristics. We provide representative real-time visualizations of structure evolution of such “giant” structures from computed MD trajectories in Supplementary Materials (Videos S8–S10).

4. Conclusions and Outlook

Coarse-grained molecular dynamics simulations that incorporate explicit water-mediated hydrophilic/hydrophobic interactions are employed to systematically investigate self-assembly in diblock (PEO-PB) copolymer solutions. The simulations do not employ pre-assembled structures as initial conditions. Instead, they track spatiotemporal evolution of copolymer aggregation starting from an initial state that corresponds to a homogeneous BCP solution at a prescribed concentration. The effects of polymer chain length (N), mole fraction of the hydrophilic (PEO) block (xPEO), and polymer concentration (C) are investigated. A phase portrait of the observed morphologies and a detailed discussion of their quantitative geometric features such as aggregation numbers, packing parameters, and radial distribution functions of solvent/monomers are presented. Simulation data are analyzed to glean insights into the energetics and entropy measures relevant to self-assembly such as specific SASA and pdfs of segmental stretch of hydrophilic and hydrophobic segments within the aggregates.
Overall, the simulations qualitatively capture experimentally observed morphological diversity in diblock BCP solutions [9,10,11,12,13,15,27,28]. Topologically, simpler structures predicted include spherical micelles, vesicles (polymersomes), lamellae (bilayers), flexible linear (wormlike) micelles, and tori. More complex morphologies observed for relatively large chain lengths and hydrophilic to hydrophobic molar composition ratio slightly greater than unity include branched wormlike micelles with Y-shaped junctions [12] and networks of cylindrical micelles [11]. For polymer concentrations ranging from 14 to 20, wt% formation of vesicle strands is predicted. The molecular bridges that concatenate the vesicles are compositionally rich in the hydrophilic component and are held together by hydrogen bonds. For polymer concentrations ≈ 30 wt%, structure coarsening leads to the formation of “giant” composite aggregates that consist of lamellar, mixed PEO/PB regions and percolating water cores.
The copolymer morphologies are dynamic, i.e., structure growth or dissociation due to addition/removal of copolymers, reorganization of constituent molecules within the aggregates, and chain length/orientation fluctuations are observed in the simulations. Further, even within a given morphology classification, e.g., spherical micelles or vesicles, significant variability exists in terms of aggregation numbers, sphericity, and copolymer distribution/packing, depending on N and xPEO. However, the cluster density, dictated by the minimum in the potential energy of intermolecular interactions, is constant across these structures. Simulations also reveal that clear demarcation between hydrophobic and hydrophilic domains does not exist within spherical/wormlike micelles, vesicles, lamellae, or tori. Significant overlap is predicted between the RDFs of ethylene oxide and butadiene monomers within the molecular assemblies suggesting that the domain boundaries are diffuse. This is consistent with previous studies [25,32,33,36]. A similar feature is observed for water-polymer interfaces as well.
Morphology transitions across topologically simpler structures can be rationalized based on specific SASA measurements. Simulations also suggest that pdfs of segmental stretch of PEO and PB within vesicular assemblies follow a log-normal distribution, i.e., one that maximizes entropy for a random variable with given mean and variance. The universality of this observation needs to be tested by using larger sets of simulation data. Moreover, the mechanisms of topological transformations which include copolymer exchange, fragmentation or coalescence of aggregates, curvature fluctuations, bending/folding of lamellae, and water/copolymer diffusion within micelles need to be investigated. The present study provides a reliable platform to guide future research along such directions.

Supplementary Materials

The following supporting information can be downloaded at: https://www.mdpi.com/article/10.3390/colloids7020040/s1, Video S1. Evolution of vesicle (C = 10.1 mol%, N = 11, xPEO = 0.55). Video S2. Evolution of spherical micelle (C = 11.7 mol%, N = 13, xPEO = 0.15). Video S3. Evolution of irregular shape and wormlike micelle with Y branch (C = 10.1 mol%, N = 11, xPEO = 0.73). Video S4. Evolution of flexible rodlike micelle (C = 11.7 mol%, N = 13, xPEO = 0.62). Video S5. 3D visualization of giant structure in Figure S2a (C = 29.5 wt%, N = 12, xPEO = 0.5). Video S6. 3D visualization of giant structure in Figure S2b (C = 29.5 wt%, N = 12, xPEO = 0.5). Video S7. 3D visualization of giant structure in Figure S2c (C = 29.5 wt%, N = 12, xPEO = 0.5). Video S8. Evolution of giant structure in Figure S2a (C = 29.5 wt%, N = 12, xPEO = 0.5). Video S9. Evolution of giant structure in Figure S2b (C = 29.5 wt%, N = 12, xPEO = 0.5). Video S10. Evolution of giant structure in Figure S2c (C = 29.5 wt%, N = 12, xPEO = 0.5). Table S1. Molecular structures and coarse-grained representations. Table S2. Parameter values for non-bonded interactions. Table S3. Parameter values for bond stretching interactions. Table S4. Parameter values for bond bending interactions. Table S5. Geometric features of vesicles. Table S6. Geometric features of short chain micelles (N = 6). Table S7. Geometric features of longer chain micelles (N > 11). Table S8. Geometric features of micelles with xPEO = 0.73 and 0.27 (N = 11). Table S9. Features of structures observed for different copolymer concentrations. Figure S1: Illustration of the algorithm used to compute SASA. Figure S2. Visualization and RDF of giant structures. Figure S3. Sliced visualization of a giant structures.

Author Contributions

Conceptualization, R.S.; methodology, software, validation, formal analysis, investigation, S.L. and R.S.; resources, R.S.; data curation, S.L.; writing—original draft preparation, S.L.; writing—review and editing, R.S.; visualization, S.L.; supervision, project administration, funding acquisition, R.S. All authors have read and agreed to the published version of the manuscript.

Funding

The authors gratefully acknowledge partial financial support from Syracuse University under the CUSE grant program. SL acknowledges support via graduate assistantship for the spring 2023 semester from the Graduate School and the College of Engineering and Computer Science at Syracuse University. This research was supported in part through computational resources provided by Syracuse University. The authors gratefully acknowledge the funding from NSF award ACI-1341006 to support research computing at Syracuse University.

Data Availability Statement

Supporting data, figures and animations are provided in Supplementary Materials. Requests for additional data may be sent via email to the authors.

Acknowledgments

The visualization figures were made with VMD 1.9.3. VMD is developed with NIH support by the Theoretical and Computational Biophysics group at the Beckman Institute, University of Illinois at Urbana-Champaign. The authors gratefully acknowledge the developer of Gromacs series software/manual.

Conflicts of Interest

The authors declare no conflict of interest.

References

  1. Szwarc, M. ‘Living’ Polymers. Nature 1956, 178, 1168–1169. [Google Scholar] [CrossRef]
  2. Patterson, G. Sixty years of living polymers. Nature 2016, 536, 276–277. [Google Scholar] [CrossRef]
  3. Karayianni, M.; Pispas, S. Block copolymer solution self-assembly: Recent advances, emerging trends, and applications. J. Polym. Sci. 2021, 59, 1874–1898. [Google Scholar] [CrossRef]
  4. Deng, L.; Wang, W.; Liu, Y. Biogas Technology; Springer: Singapore, 2020; ISBN 9789811549403. [Google Scholar]
  5. Feng, H.; Lu, X.; Wang, W.; Kang, N.-G.; Mays, J.W. Block Copolymers: Synthesis, Self-Assembly, and Applications. Polymers 2017, 9, 494. [Google Scholar] [CrossRef]
  6. Hadjichristidis, N.; Pispas, S.; Pitsikalis, M.; Iatrou, H.; Lohse, D.J. Graft Copolymers. In Encyclopedia of Polymer Science and Technology; John Wiley & Sons, Inc.: Hoboken, NJ, USA, 2002. [Google Scholar] [CrossRef]
  7. Pispas, S.; Siakali-Kioulafa, E.; Hadjichristidis, N.; Mavromoustakos, T. Block copolymers with crystalline/amorphous, crystalline/polyelectrolyte and amorphous/polyelectrolyte blocks. Macromol. Chem. Phys. 2002, 203, 1317–1327. [Google Scholar] [CrossRef]
  8. van Hest, J.C.M.; Delnoye, D.A.P.; Baars, M.W.P.L.; van Genderen, M.H.P.; Meijer, E.W. Polystyrene-Dendrimer Amphiphilic Block Copolymers with a Generation-Dependent Aggregation. Science 1995, 268, 1592–1595. [Google Scholar] [CrossRef]
  9. Zhang, L.; Eisenberg, A. Multiple Morphologies of “Crew-Cut” Aggregates of Polystyrene-b-poly(acrylic acid) Block Copolymers. Science 1995, 268, 1728–1731. [Google Scholar] [CrossRef]
  10. Discher, B.M.; Won, Y.-Y.; Ege, D.S.; Lee, J.C.-M.; Bates, F.S.; Discher, D.E.; Hammer, D.A. Polymersomes: Tough Vesicles Made from Diblock Copolymers. Science 1999, 284, 1143–1146. [Google Scholar] [CrossRef]
  11. Mai, Y.; Eisenberg, A. Self-assembly of block copolymers. Chem. Soc. Rev. 2012, 41, 5969–5985. [Google Scholar] [CrossRef]
  12. Jain, S.; Bates, F.S. On the Origins of Morphological Complexity in Block Copolymer Surfactants. Science 2003, 300, 460–464. [Google Scholar] [CrossRef]
  13. Won, Y.-Y.; Brannan, A.K.; Davis, H.T.; Bates, F.S. Cryogenic Transmission Electron Microscopy (Cryo-TEM) of Micelles and Vesicles Formed in Water by Poly(ethylene oxide)-Based Block Copolymers. J. Phys. Chem. B 2002, 106, 3354–3364. [Google Scholar] [CrossRef]
  14. Chen, L.; Shen, H.; Eisenberg, A. Kinetics and Mechanism of the Rod-to-Vesicle Transition of Block Copolymer Aggregates in Dilute Solution. J. Phys. Chem. B 1999, 103, 9488–9497. [Google Scholar] [CrossRef]
  15. Antonietti, M.; Förster, S. Vesicles and Liposomes: A Self-Assembly Principle Beyond Lipids. Adv. Mater. 2003, 15, 1323–1333. [Google Scholar] [CrossRef]
  16. Hunter, S.J.; Armes, S.P. Shape-Shifting Thermoresponsive Block Copolymer Nano-Objects. J. Colloid Interface Sci. 2023, 634, 906–920. [Google Scholar] [CrossRef]
  17. Kita-Tokarczyk, K.; Grumelard, J.; Haefele, T.; Meier, W. Block copolymer vesicles—Using concepts from polymer chemistry to mimic biomembranes. Polymer 2005, 46, 3540–3563. [Google Scholar] [CrossRef]
  18. Lutz, J.-F. Solution self-assembly of tailor-made macromolecular building blocks prepared by controlled radical polymerization techniques. Polym. Int. 2006, 55, 979–993. [Google Scholar] [CrossRef]
  19. Du, J.; O’Reilly, R.K. Advances and challenges in smart and functional polymer vesicles. Soft Matter 2009, 5, 3544–3561. [Google Scholar] [CrossRef]
  20. Chang, H.-Y.; Sheng, Y.-J.; Tsao, H.-K. Structural and mechanical characteristics of polymersomes. Soft Matter 2014, 10, 6373–6381. [Google Scholar] [CrossRef]
  21. Deng, Y.; Wei, J.; Sun, Z.; Zhao, D. Large-pore ordered mesoporous materials templated from non-Pluronic amphiphilic block copolymers. Chem. Soc. Rev. 2013, 42, 4054–4070. [Google Scholar] [CrossRef]
  22. Bleul, R.; Thiermann, R.; Maskos, M. Techniques To Control Polymersome Size. Macromolecules 2015, 48, 7396–7409. [Google Scholar] [CrossRef]
  23. Mohammadi, M.; Ramezani, M.; Abnous, K.; Alibolandi, M. Biocompatible polymersomes-based cancer theranostics: Towards multifunctional nanomedicine. Int. J. Pharm. 2017, 519, 287–303. [Google Scholar] [CrossRef]
  24. Zhang, X.-Y.; Zhang, P.-Y. Polymersomes in Nanomedicine—A Review. Curr. Nanosci. 2017, 13, 124–129. [Google Scholar] [CrossRef]
  25. Discher, D.E.; Ortiz, V.; Srinivas, G.; Klein, M.L.; Kim, Y.; Christian, D.; Cai, S.; Photos, P.; Ahmed, F. Emerging applications of polymersomes in delivery: From molecular dynamics to shrinkage of tumors. Prog. Polym. Sci. 2007, 32, 838–857. [Google Scholar] [CrossRef]
  26. Li, S.; Byrne, B.; Welsh, J.; Palmer, A.F. Self-Assembled Poly(butadiene)-b-poly(ethylene oxide) Polymersomes as Paclitaxel Carriers. Biotechnol. Prog. 2007, 23, 278–285. [Google Scholar] [CrossRef]
  27. Allen, C.; Eisenberg, A.; Mrsic, J.; Maysinger, D. PCL-b-PEO Micelles as a Delivery Vehicle for FK506: Assessment of a Functional Recovery of Crushed Peripheral Nerve. Drug Deliv. 2000, 7, 139–145. [Google Scholar] [CrossRef]
  28. Allen, C.; Yu, Y.; Maysinger, D.; Eisenberg, A. Polycaprolactone-b-poly(ethylene Oxide) Block Copolymer Micelles as a Novel Drug Delivery Vehicle for Neurotrophic Agents FK506 and L-685,818. Bioconjug. Chem. 1998, 9, 564–572. [Google Scholar] [CrossRef]
  29. Li, X.; Cooksey, T.J.; Kidd, B.E.; Robertson, M.L.; Madsen, L.A. Mapping Coexistence Phase Diagrams of Block Copolymer Micelles and Free Unimer Chains. Macromolecules 2018, 51, 8127–8135. [Google Scholar] [CrossRef]
  30. Holder, S.W.; Grant, S.C.; Mohammadigoushki, H. Nuclear Magnetic Resonance Diffusometry of Linear and Branched Wormlike Micelles. Langmuir 2021, 37, 3585–3596. [Google Scholar] [CrossRef]
  31. Israelachvili, J.N.; Mitchell, D.; Ninham, B.W. Theory of self-assembly of lipid bilayers and vesicles. Biochim. Biophys. Acta (BBA)-Biomembr. 1977, 470, 185–201. [Google Scholar] [CrossRef]
  32. Srinivas, G.; Discher, D.E.; Klein, M.L. Self-assembly and properties of diblock copolymers by coarse-grain molecular dynamics. Nat. Mater. 2004, 3, 638–644. [Google Scholar] [CrossRef]
  33. Srinivas, G.; Shelley, J.C.; Nielsen, S.; Discher, D.E.; Klein, M.L. Simulation of Diblock Copolymer Self-Assembly, Using a Coarse-Grain Model. J. Phys. Chem. B 2004, 108, 8153–8160. [Google Scholar] [CrossRef]
  34. Lipowsky, R. The conformation of membranes. Nature 1991, 349, 475–481. [Google Scholar] [CrossRef]
  35. Markvoort, A.J.; Pieterse, K.; Steijaert, M.N.; Spijker, P.; Hilbers, P.A.J. The Bilayer-Vesicle Transition Is Entropy Driven. J. Phys. Chem. B 2005, 109, 22649–22654. [Google Scholar] [CrossRef]
  36. Ye, X.; Khomami, B. Self-assembly of linear diblock copolymers in selective solvents: From single micelles to particles with tri-continuous inner structures. Soft Matter 2020, 16, 6056–6062. [Google Scholar] [CrossRef]
  37. Li, Z.; Dormidontova, E.E. Equilibrium chain exchange kinetics in block copolymer micelle solutions by dissipative particle dynamics simulations. Soft Matter 2011, 7, 4179–4188. [Google Scholar] [CrossRef]
  38. Sambasivam, A.; Dhakal, S.; Sureshkumar, R. Structure and rheology of self-assembled aqueous suspensions of nanoparticles and wormlike micelles. Mol. Simul. 2017, 44, 485–493. [Google Scholar] [CrossRef]
  39. Sambasivam, A.; Sangwai, A.V.; Sureshkumar, R. Self-Assembly of Nanoparticle–Surfactant Complexes with Rodlike Micelles: A Molecular Dynamics Study. Langmuir 2016, 32, 1214–1219. [Google Scholar] [CrossRef]
  40. Sambasivam, A.; Sangwai, A.V.; Sureshkumar, R. Dynamics and Scission of Rodlike Cationic Surfactant Micelles in Shear Flow. Phys. Rev. Lett. 2015, 114, 158302. [Google Scholar] [CrossRef]
  41. Dhakal, S.; Sureshkumar, R. Anomalous diffusion and stress relaxation in surfactant micelles. Phys. Rev. E 2017, 96, 2605. [Google Scholar] [CrossRef]
  42. Dhakal, S.; Sureshkumar, R. Uniaxial Extension of Surfactant Micelles: Counterion Mediated Chain Stiffening and a Mechanism of Rupture by Flow-Induced Energy Redistribution. ACS Macro Lett. 2015, 5, 108–111. [Google Scholar] [CrossRef]
  43. Dhakal, S.; Sureshkumar, R. Topology, length scales, and energetics of surfactant micelles. J. Chem. Phys. 2015, 143, 024905. [Google Scholar] [CrossRef]
  44. Sangwai, A.V.; Sureshkumar, R. Binary Interactions and Salt-Induced Coalescence of Spherical Micelles of Cationic Surfactants from Molecular Dynamics Simulations. Langmuir 2011, 28, 1127–1135. [Google Scholar] [CrossRef]
  45. Sangwai, A.V.; Sureshkumar, R. Coarse-Grained Molecular Dynamics Simulations of the Sphere to Rod Transition in Surfactant Micelles. Langmuir 2011, 27, 6628–6638. [Google Scholar] [CrossRef]
  46. Marrink, S.J.; Risselada, H.J.; Yefimov, S.; Tieleman, D.P.; de Vries, A.H. The MARTINI force field: Coarse grained model for biomolecular simulations. J. Phys. Chem. B 2007, 111, 7812–7824. [Google Scholar] [CrossRef]
  47. Sprinkle, B.; Usabiaga, F.B.; Patankar, N.A.; Donev, A. Large scale Brownian dynamics of confined suspensions of rigid particles. J. Chem. Phys. 2017, 147, 244103. [Google Scholar] [CrossRef]
  48. Santo, K.P.; Neimark, A.V. Dissipative particle dynamics simulations in colloid and Interface science: A review. Adv. Colloid Interface Sci. 2021, 298, 102545. [Google Scholar] [CrossRef]
  49. Levitt, M.; Warshel, A. Computer simulation of protein folding. Nature 1975, 253, 694–698. [Google Scholar] [CrossRef]
  50. Warshel, A. Bicycle-pedal model for the first step in the vision process. Nature 1976, 260, 679–683. [Google Scholar] [CrossRef]
  51. Marrink, S.J.; de Vries, A.H.; Mark, A.E. Coarse Grained Model for Semiquantitative Lipid Simulations. J. Phys. Chem. B 2003, 108, 750–760. [Google Scholar] [CrossRef]
  52. Lee, H.; de Vries, A.H.; Marrink, S.; Pastor, R.W. A Coarse-Grained Model for Polyethylene Oxide and Polyethylene Glycol: Conformation and Hydrodynamics. J. Phys. Chem. B 2009, 113, 13186–13194. [Google Scholar] [CrossRef]
  53. Darré, L.; Machado, M.R.; Pantano, S. Coarse-grained models of water. Wiley Interdiscip. Rev. Comput. Mol. Sci. 2012, 2, 921–930. [Google Scholar] [CrossRef]
  54. Yang, Y. Structure, Dynamics and Rheology of Polymer Solutions from Coarse-Grained Molecular Dynamics: Effects of Polymer Concentration, Solvent Quality and Geometric Confinement. Ph.D. Thesis, Syracuse University, Syracuse, NY, USA, 2015. [Google Scholar]
  55. Bussi, G.; Donadio, D.; Parrinello, M. Canonical sampling through velocity rescaling. J. Chem. Phys. 2007, 126, 014101. [Google Scholar] [CrossRef]
  56. Berendsen, H.J.C.; Postma, J.P.M.; Van Gunsteren, W.F.; DiNola, A.; Haak, J.R. Molecular dynamics with coupling to an external bath. J. Chem. Phys. 1984, 81, 3684–3690. [Google Scholar] [CrossRef]
  57. Eisenhaber, F.; Lijnzaad, P.; Argos, P.; Sander, C.; Scharf, M. The double cubic lattice method: Efficient approaches to numerical integration of surface area and volume and to dot surface contouring of molecular assemblies. J. Comput. Chem. 1995, 16, 273–284. [Google Scholar] [CrossRef]
  58. Edelsbrunner, H.; Kirkpatrick, D.; Seidel, R. On the shape of a set of points in the plane. IEEE Trans. Inf. Theory 1983, 29, 551–559. [Google Scholar] [CrossRef]
  59. Martínez, L.; Andrade, R.; Birgin, E.G.; Martínez, J.M. PACKMOL: A package for building initial configurations for molecular dynamics simulations. J. Comput. Chem. 2009, 30, 2157–2164. [Google Scholar] [CrossRef]
  60. Lindahl, E.; Abraham, M.J.; Hess, B.; van der Spoel, D. GROMACS 2020.2 Source Code. Zenodo. Available online: https://zenodo.org/record/3773801#.ZFNg8s5BxPY (accessed on 30 April 2020). [CrossRef]
  61. Humphrey, W.; Dalke, A.; Schulten, K. VMD: Visual molecular dynamics. J. Mol. Graph. 1996, 14, 33–38. [Google Scholar] [CrossRef]
  62. Shannon, C.E. A Mathematical Theory of Communication. Bell Syst. Tech. J. 1948, 27, 623–656. [Google Scholar] [CrossRef]
  63. Park, S.Y.; Bera, A.K. Maximum entropy autoregressive conditional heteroskedasticity model. J. Econ. 2009, 150, 219–230. [Google Scholar] [CrossRef]
  64. Doi, M.; Edwards, S.F. The Theory of Polymer Dynamics; Clarendon Press: Oxford, UK, 1986; ISBN 9780198520337. [Google Scholar]
  65. Candau, F.; Ottewill, R.H. An Introduction to Polymer Colloids; Kluwer Academic Publishers: Dordrecht, The Netherlands, 1990; ISBN 9780792306009. [Google Scholar]
Figure 1. Atomistic (a) and coarse-grained (b) descriptions of a single PEO-PB copolymer chain composed of 6 butadiene monomers (red) and 6 ethylene oxide monomers (blue). See Tables S1–S4 for force field parameter values used in the simulations.
Colloids 07 00040 g001
Figure 2. Schematic diagram illustrating interface of self-assembled micelles constructed using the alpha-shape algorithm: (a) mixed structure (left) and mesh representation of the water−aggregate interface (right), (b) bilayer spherical micelle (left), mesh representation of the interface (middle, Only PB beads are shown), and cross sections showing the inner and outer hydrophobic layers (right).
Colloids 07 00040 g002
Figure 3. Sectional view (inset of a) and RDF (a) of a 5PB6PEO (xPEO = 0.55) vesicle. Yellow, red, and blue beads represent water, PB, and PEO, respectively. RDF of vesicles formed by different copolymers: (b): 4PB3PEO (xPEO = 0.43), (c): 3PB4PEO (xPEO = 0.57), and (d): 5PB5PEO (xPEO = 0.50).
Colloids 07 00040 g003
Figure 4. Probability distribution functions of sQmaxQ of internal (a) and external (b) PEO segments as well as PB segments (c) of vesicles corresponding to Figure 3b (5PB6PEO). The solid lines represent the best fit to a log-normal distribution.
Colloids 07 00040 g004
Figure 5. Sectional view and RDFs of representative spherical micelles made of relatively short chains (N = 6). 2PB4PEO (a,b), 3PB3PEO (c,d), 4PB2PEO (e,f). These structures are found close to the micelle-vesicle transition region in the N vs. xPEO phase diagram.
Colloids 07 00040 g005
Figure 6. Sectional view and RDFs of representative PB-dominated spherical micelles (11PB2PEO, panels (a,b)) and spherical micelles (7PB5PEO, panels (c,d); 5PB6PEO, panels (e,f)).
Colloids 07 00040 g006
Figure 7. Sectional view (a) and RDFs (b) of a PEO-dominated micelle of 3PB8PEO chains. For comparison, sectional view (c) and RDFs (d) of an 8PB3PEO micelle are shown.
Colloids 07 00040 g007
Figure 8. Side view (a) and RDFs (b) of a flexible, wormlike micelle (5PB8PEO), side views of branched cylindrical micelles ((c), 3PB11PEO), a micelle network ((d), 6PB8PEO), and wormlike micelle with Y branch ((e), 3PB8PEO). RDFs of (a) are along the radial direction. Persistence length and n of the wormlike micelle are 0.74 ± 0.09 nm and 1429, respectively.
Colloids 07 00040 g008
Figure 9. (a) Orientation angle θ and end-to-end distance Q vs. time for the rodlike micelle are shown in Figure 8a. Snapshots of instantaneous micelle configurations are shown in blue. (b) ACF of θ between 400 ns and 515 ns (0 ns in (b) corresponds to 400 ns in (a)). The exponential fit yields an orientation relaxation time of 40 ± 3 ns.
Colloids 07 00040 g009
Figure 10. Top view (all beads (a), only PB beads (b)) and RDFs (c) of a torus structure (6PB8PEO). Sectional view (d) and RDFs (e) along the direction shown by the arrow of lamella micelle (7PB7PEO). n = 543 (a), 517 (d).
Colloids 07 00040 g010
Figure 11. Phase diagram of equilibrium morphologies at 300 K and polymer concentration of 10 mol%. H: homogeneous solution, V: vesicles (polymersomes, Figure 3), SM: short-chain micelles (Figure 5), PB-S: PB-dominated spherical micelles (Figure 6a), S: spherical micelles (Figure 6c,e), PEO-M: PEO-dominated micelles (Figure 7a), R: rodlike/wormlike micelles (linear or branched, Figure 8a,c,e), MN: micelle network (Figure 8d), T: tori (Figure 10a), L: lamellae (Figure 10d), Y: V + S + MN + T, Z: V + S + MN. The phase portrait is inferred from the results of 237 distinct CGMD simulations excluding replicates. The dotted lines connect the midpoint of two adjacent coordinates at which different structures are observed. The red circle corresponds to N = 12 and xPEO = 0.5, used in studies of polymer concentration effect on morphology changes.
Colloids 07 00040 g011
Figure 12. Radius of gyration Rg of the largest cluster vs. chain composition (N: inset).
Colloids 07 00040 g012
Figure 13. Specific SASA depends on composition and increases rapidly as sphere to rod transition occurs (N: inset).
Colloids 07 00040 g013
Figure 14. Number of clusters NC and Rg depend on concentration (6PB6PEO at 300 K).
Colloids 07 00040 g014
Figure 15. Representative structures realized for copolymer concentrations (in wt%) of 4.0 (a), 7.7 (b), 11.1 (c), 14.3 (d), 20.0 (e), 29.5 (f). (a) Small spherical and irregular micelles, and lamellae; (b) spherical micelles, lamellae, and vesicles; (c) spherical micelles, lamellae, and vesicles; (d) spherical micelles, vesicle strands, rodlike micelles; (e) vesicle strands and thick multilayered rodlike micelles; (f) “giant” composite structure with water-filled hole with diameters ranging from 10 nm to 30 nm.
Colloids 07 00040 g015
Figure 16. Probability distribution functions of Q of internal (a,b) and external (c,d) PEO segments as well as PB segments (e,f) vesicles corresponding to wt% = 7.7 (a,c,e) and 11.1 (b,d,f). Average Q values (in nm) are (a) 1.0 ± 0.3, (b) 1.1 ± 0.3, (c) 1.1 ± 0.3, (d) 1.0 ± 0.3, (e) 1.8 ± 0.2, and (f) 1.8 ± 0.2.
Colloids 07 00040 g016
Figure 17. Vesicle strands observed for copolymer concentrations of 14.3 wt% ((a), cross section) and 20.0% ((b), side view). Panels (ce) show PB monomers in the structure depicted in (b), RDFs along the orange arrow, and RDFs along the radial direction of the vesicle marked by the purple dotted circle in (b), respectively. Green arrows indicate linear dimensions of the structures.
Colloids 07 00040 g017
Figure 18. Probability distribution functions of Q of PEO (a,c) and PB segments (b,d) for copolymers within the molecular bridge (a,b) and those farther from it (c,d). Average Q values (in nm) are (a) 1.1 ± 0.2, (b) 1.8 ± 0.3, (c) 1.1 ± 0.2, and (d) 1.8 ± 0.2.
Colloids 07 00040 g018
Disclaimer/Publisher’s Note: The statements, opinions and data contained in all publications are solely those of the individual author(s) and contributor(s) and not of MDPI and/or the editor(s). MDPI and/or the editor(s) disclaim responsibility for any injury to people or property resulting from any ideas, methods, instructions or products referred to in the content.

