Article

Enhancing Structural Stability of Oil-Shell Microbubbles via Incorporation of a Gold Nanoparticle Protective Shell for Theranostic Applications

1
Department of Mechanical and Aerospace Engineering, University of California Irvine, Irvine, CA 92697, USA
2
Department of Biomedical Engineering, University of California Irvine, Irvine, CA 92697, USA
3
Department of Ophthalmology, Gavin Herbert Eye Institute, UC Irvine School of Medicine, Irvine, CA 92697, USA
*
Authors to whom correspondence should be addressed.
Colloids Interfaces 2023, 7(2), 34; https://doi.org/10.3390/colloids7020034
Submission received: 7 March 2023 / Revised: 18 April 2023 / Accepted: 19 April 2023 / Published: 23 April 2023
(This article belongs to the Special Issue Biocolloids and Biointerfaces)

Abstract

:
Phospholipid-stabilized microbubbles are utilized as contrast agents in medical ultrasound imaging, and researchers are currently investigating their potential as theranostic agents. Due to the inadequate water solubility and poor stability of numerous new therapeutics, the development of stable microbubbles with the capacity to encapsulate hydrophobic therapeutics is necessary. Herein, we proposed a flow-focusing microfluidic device to generate highly monodispersed, phospholipid-stabilized dual-layer microbubbles for theranostic applications. The stability and microstructural evolution of these microbubbles were investigated by microscopy and machine-learning-assisted segmentation techniques at different phospholipid and gold nanoparticle concentrations. The double-emulsion microbubbles, formed with the combination of phospholipids and gold nanoparticles, developed a protective gold nanoparticle shell that not only acted as a steric barrier against gas diffusion and microbubble coalescence but also alleviated the progressive dewetting instability and the subsequent cascade of coalescence events.

Graphical Abstract

1. Introduction

Cancer is the second leading cause of death in the United States. According to the American Cancer Society, in 2022 alone, 1.9 million new cancer patients were likely to be identified, and nearly 609,360 cancer-related deaths were expected in the United States [1]. Chemotherapy is one of the primary treatment methods used either by itself or in conjugation with another treatment approach, such as radiation and surgery, depending on the type and the stage of the disease. However, chemotherapeutics are mostly administrated through intravenous and oral routes, which limits the effectiveness and the safety of this approach due to the lack of specificity, drug resistance, and high toxicity in healthy tissues [2,3]. Serious adverse effects, such as cardiotoxity, neurotoxicity, nephrotoxicity, and severe liver and bone-marrow toxicity have been reported in the literature [4,5]. In the past decade, a lot of effort has been made to realize alternative innovative therapies that can lessen the adverse effects of chemotherapy, among which, targeted and trigger-release drug delivery approaches have attracted the attention of many researchers [6,7]. The goal of this method is to encapsulate the active agent inside a protective carrier, such as liposomes, to minimize the exposure of the healthy tissue to the drug and only release the drug at the specific tumor site. Mechanical- and thermal-based trigger-release mechanisms such as ultrasound (US) [8] and lasers [9] have been investigated. US is especially appealing because of its non-invasive nature, universal availability, and imaging capabilities that allow for real-time monitoring of the drug release, as well as adjustments to the treatment protocol [7]. Microbubbles (MBs) are widely used as ultrasound contrast-enhancing agents (UCAs) in ultrasound imaging, and recently, researchers have considered their potential use as theranostic agents [10,11]. MBs consist of a gas core, coated with a lipid [12], polymer [13,14], or protein [15] shell to stabilize the structure. Different configurations can be adapted to incorporate the drugs inside the MBs, such as direct attachment to the MB shell [16], the attachment of the drug-loaded liposomes to the MB shell [17,18,19], or the incorporation of an intermediate drug-loaded oil layer between the gaseous core and the lipid shell [20]. The encapsulated drug can be released upon enhancing the US intensity. The rapid mechanical oscillation and later destruction of the MBs via US can enhance sonoporation in cell membranes and, thus, enhance the drug uptake by the cells [21,22]. It is important to note that the impact of sonoporation on the cells and the potential negative consequences of ultrasound and nanomaterials on biological systems are not completely understood. The failure of cells to recuperate from the potential adverse biological affects of the sonoporation can be detrimental to the cells and their genetic material. Therefore, it is important to find the optimal US parameters (energy and exposure duration) required to induce the enhanced uptake of therapeutics into cells while minimizing the sonoporation impact on cell viability [23,24]. Additionally, MB shells can be further functionalized to enhance their capabilities. For example, MBs could be functionalized with magnetic and gold nanoparticles (GNPs) to enable visualization in magnetic resonance imaging (MRI) [25] and photo-acoustic imaging [26,27], respectively. In order to maximize the MBs’ contrasting and therapeutic capabilities, it is crucial to generate a stable and monodispersed population of MBs [28]. This is a major challenge that researchers have yet to overcome to realize the successful implementation of MBs in theranostic applications. One effective solution to this problem was demonstrated using microfluidic devices for the production of MBs. Hettiarachchi et al. [29] first proposed microfluidics as a new manufacturing method back in 2007 to produce a highly monodispersed population of MBs. Shih et al. [30] later explored the one-step generation of drug-loadable microbubbles using microfluidics. Although the successful generation of oil-shell microbubbles was demonstrated in this work, the stability and microstructure evolution of the oil-shell microbubbles has not yet been fully characterized. In 2018, Churchman et al. [31] utilized a hybrid microfluidic self-assembly approach to achieve the formation of oil-shell microbubbles. While this technique resulted in the formation of a uniform oil layer around the microbubbles, it required the extra steps of making homogeneous lipid-oil nano-droplets (LONDS) and washing away the excess LONDS after bubble preparation. Moreover, the stability of the oil layer around the bubbles over time was not determined.
One major challenge that researchers face when making double emulsions is dewetting instability, as this determines the structural configuration of the double emulsion [32]. Therefore, to determine double-emulsion microbubble stability, the simple tracking of microbubble size over time is not sufficient, as it is crucial to study the morphologies of the oil-shell microbubbles, as well. In this paper, we reported the stable production of monodispersed double-emulsion microbubbles (DEBs), as lipophilic drug-delivery vehicles. The DEBs were produced using a microfluidic flow-focusing (FF) device, and their stability and morphological evolution were investigated with and without GNP functionalization. Although prior works in the literature reported the generation of multilayer microbubbles with microfluidics, to the best of our knowledge, there have been no investigations into the functionalization of double-layer microbubbles with GNPs, or concerning the stability or morphological evolution of the DEBs, before or after their functionalization with GNPs. In order to ensure safety and efficacy of the usage of DEBs in theranostic applications, it is critical for DEBs to preserve their structural stability and monodispersity over the period of the treatment. This study used GNP functionalization of the treatment agents and a stable one-step microfluidic production workflow to address the aforementioned challenges in order to realize the successful implementation of DEBs in theranostic and drug-delivery applications. Moreover, our approach resulted in the production of multi-modal agents. This was a desired characteristic, as it enhanced the capability and controllability of these agents in theranostic application.

2. Materials and Methods

2.1. Microfluidic Device Preparation

A two-layer microfluidic flow-focusing device was designed in AutoCAD and printed as a transparency mask (Cad/Art Services). The device was designed so the height of the gas inlet microchannel was 10 µm, while all the other microchannels had heights of 30 µm. This would help confine the gas stream inside the other fluid streams for the stable production of double-emulsion microbubbles.A silicon mold was fabricated in a class 1000 cleanroom using two-step photolithography, according to MicroChem’s SU-8 protocol. Microfluidic devices were fabricated using a soft lithography approach [33]. Since PDMS is inherently hydrophobic, the external phase channels and post-junction area were selectively treated with PVA (polyvinyl alcohol, average MW 30,000–70,000, 87–90% hydrolyzed, Sigma Aldrich, St. Louis, MO, USA), similar to the method applied by Vallejo et al. [34], immediately after plasma-bonding to make the channels permanently hydrophilic.

2.2. Material

The 10% pluronic F-68 non-ionic surfactant and 1× phosphate-buffered saline (PBS) were purchased from Thermofisher Scientific (Waltham, MA, USA). Lipid powders were purchased from Avanti Polar Lipids (Alabaster, AL, USA). Octafluorocyclobutane C4F8 was purchased from Airgas (Radnor, PA, USA). Oleic acid, Nile red (lipophilic fluorescent die), and 5 nm gold nanoparticles were purchased form Sigma Aldrich. CY3-functionalized 5 nm gold nanoparticles were purchased from Nanopartz Inc. (Loveland, CO, USA).

2.3. Phospholipid Formulation

The lipid mixture was prepared in a manner similar to Segers et al. [35]. The DPPC, DPPA, and DSPE-PEG5000 lipid powders were dissolved in chloroform in an 80:10:10 molar weight ratio. For the fluorescent studies, 0.05 mg/mL of NBD-DSPE was also added to the lipid mixture. The mixture was then dried on the wall of a glass vial under gentle nitrogen stream. The vial containing the lipid film was then placed inside the vacuum overnight to completely dry. The next day, the lipids were re-suspended in PBS, for a total lipid concentration of 5 mg/mL. The stock lipid solution was then diluted with PBS to the desired lipid concentration before each experiment. No lipid co-solvents or viscosity-increasing agents, such as propylene glycol or glycerol, were added to the formulation, as they have been reported to degrade the monodispersity and the stability of the resulting microbubble suspension [36]. For the formulations containing gold nanoparticles, the desired amount was added to the stock lipid solution. Before each experiment, the 10% pluronic F-68 solution was mixed with the lipid solution at 5% of the prior volume to prevent microbubble coalescence. The lipid solution was then sonicated in a water bath at 60 °C for 20 min and was then saturated with C4F8, as described by Kwan et al. [37]. In order to ensure a similar level of gas saturation between different groups, a custom-made portable automatic gas-saturation device was designed and built via 3D printing. The device was equipped with an Arduino and a servo motor, which was connected to a three-way valve. The servo would change the valve position according to the degassing program fed into the Arduino, allowing for the multiple cycles of degassing and gas injection involved in the gas-saturation process. The phospholipid formulations tested in this study are listed in Table 1.

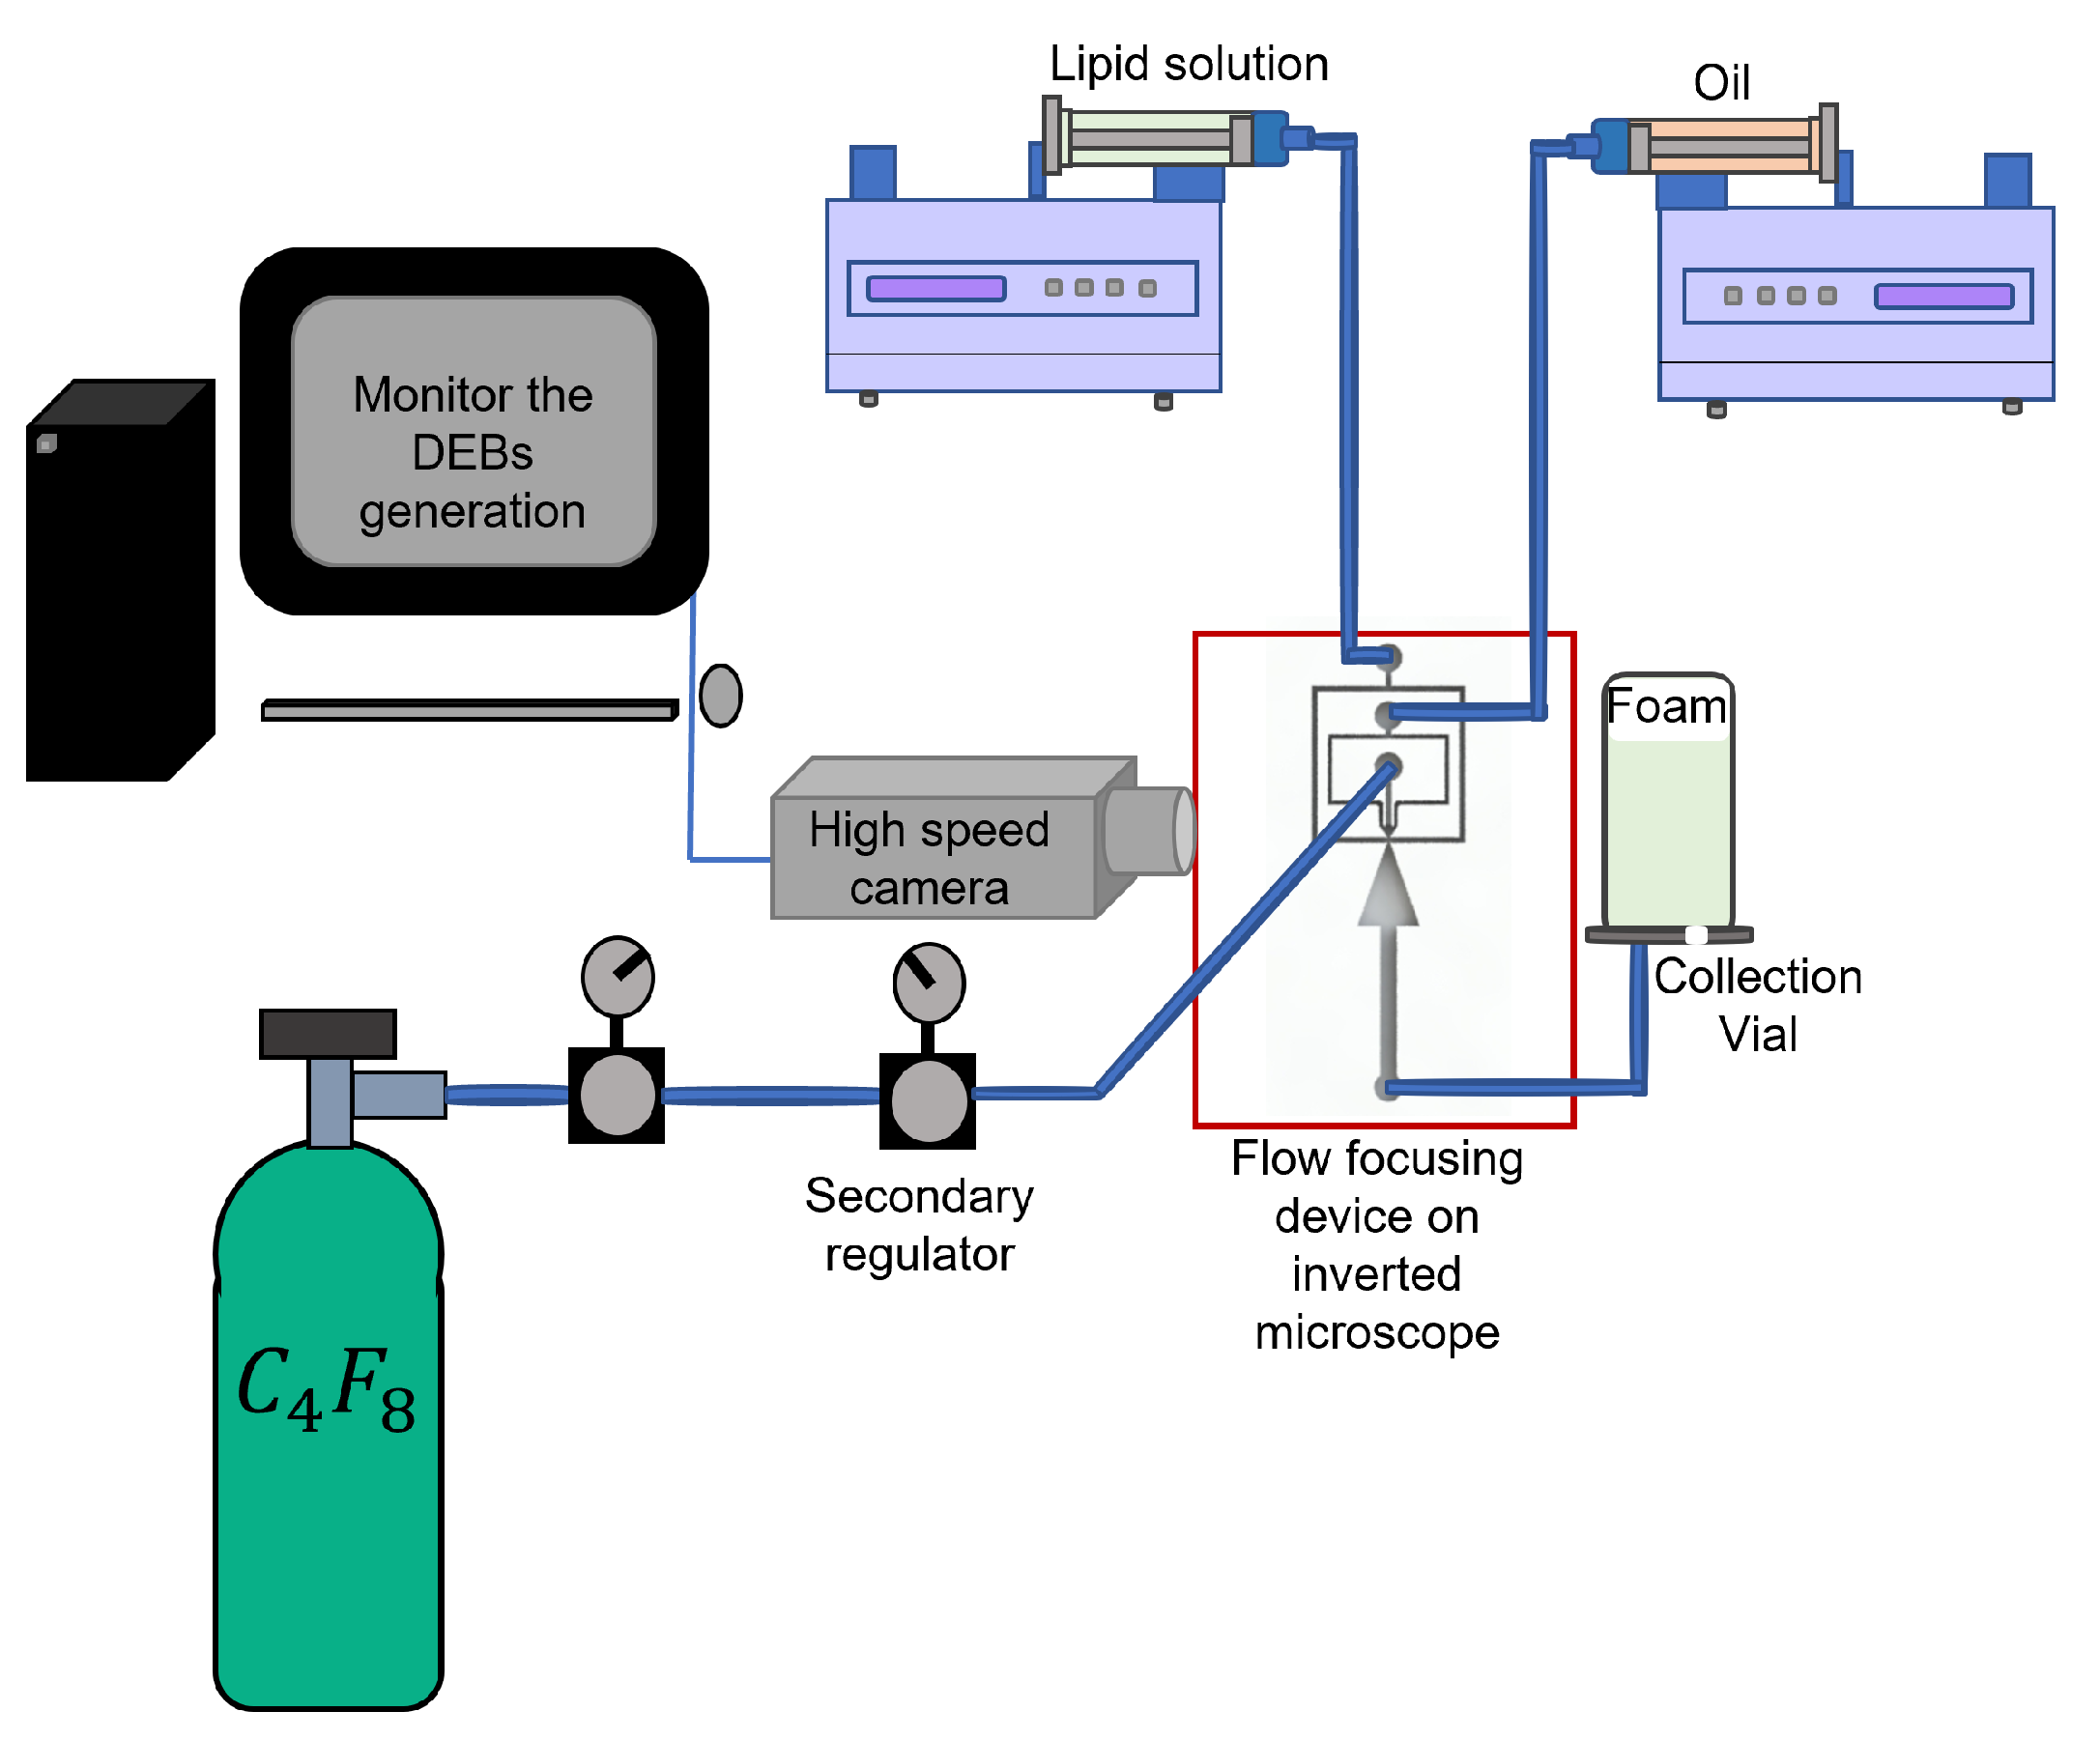
2.4. Experiment Setup and Bubble Production

Oleic acid was used to create an oil shell around the microbubbles. For the fluorescent studies, the lipophilic fluorescent probe Nile red was added to the oil phase at a concentration of 1 µL/mL to visualize and study the oil layer. Oil-and-lipid solutions were each loaded in a syringe tipped with a 23-gauge needle (BD) to fit the tubing and was then delivered to the microfluidic device at a constant flow rate using a digitally controlled syringe pump (Pico Plus, Harvard Apparatus, Holliston, MA, USA). C4F8 was supplied directly from a pressurized tank connected to a primary regulator into a custom-made secondary regulator (Wika); this secondary regulator was used to control the gas pressure inside the microfluidic channel. The outlet of the secondary regulator was connected to flexible Tygon microbore tubing (0.020” × 0.060”OD, ColeParmer, Vernon Hills, IL, USA), which was placed inside the microfluidic gas inlet to deliver the gas phase. After the bubble production had been stabilized, the microbubbles were collected into a 2 mL screw-cap vial, and its headspace was filled with C4F8 gas and contained 1 mL of the C4F8 saturated lipid solution. The optimized flow rates and pressure to produce the microbubbles are presented in Table 2. A schematic of the setup is shown in Figure 1.

2.5. Imaging Setup

Microbubble production was monitored with a Nikon 100S inverted microscope, and high-speed images were captured by a phantom high-speed camera (Vision Research, Wayne, NJ, USA). The images were then used to conduct the statistical analysis of the microbubbles inside the microfluidic chip. For post-production imaging of the microbubbles, 10 µL of the bubbles were loaded onto a Countess slide and placed on an Olympus IX51 inverted microscope.
Fluorescent and bright-field images were then captured using a camera connected to the microscope. The excitation and emission of the fluorophores used in this study are listed in Table 3.

2.6. Image-Processing Pipeline

2.6.1. Statistical Analysis Pipeline

An automated image-analysis pipeline was developed using MATLAB R2021b software to identify microbubbles based on their unique features, such as their size, shape, and color. The algorithm would then measure and report the bubbles statistical attributes, such as their diameter, distribution, and polydispersity index (PDI).
P D I = 100 × s t d a v g
where std and avg denote the standard deviation and average diameter, respectively. In order to measure the growth rate of the microbubbles, images of the microbubbles were captured at various time intervals (0, 10, 20, and 30 min) and then processed by the algorithm. The extracted statistical attributes of the microbubble images were subsequently recorded and analyzed. To calculate the dimensionless average diameter of the microbubbles over time, the average diameter at each time point was divided by the initial average diameter at time zero. Three experiments were conducted for each formula, and the mean value and standard deviation of the samples were used to report the dimensionless average diameter of the microbubbles over time. In each experiment, more than 90 microbubbles were analyzed.

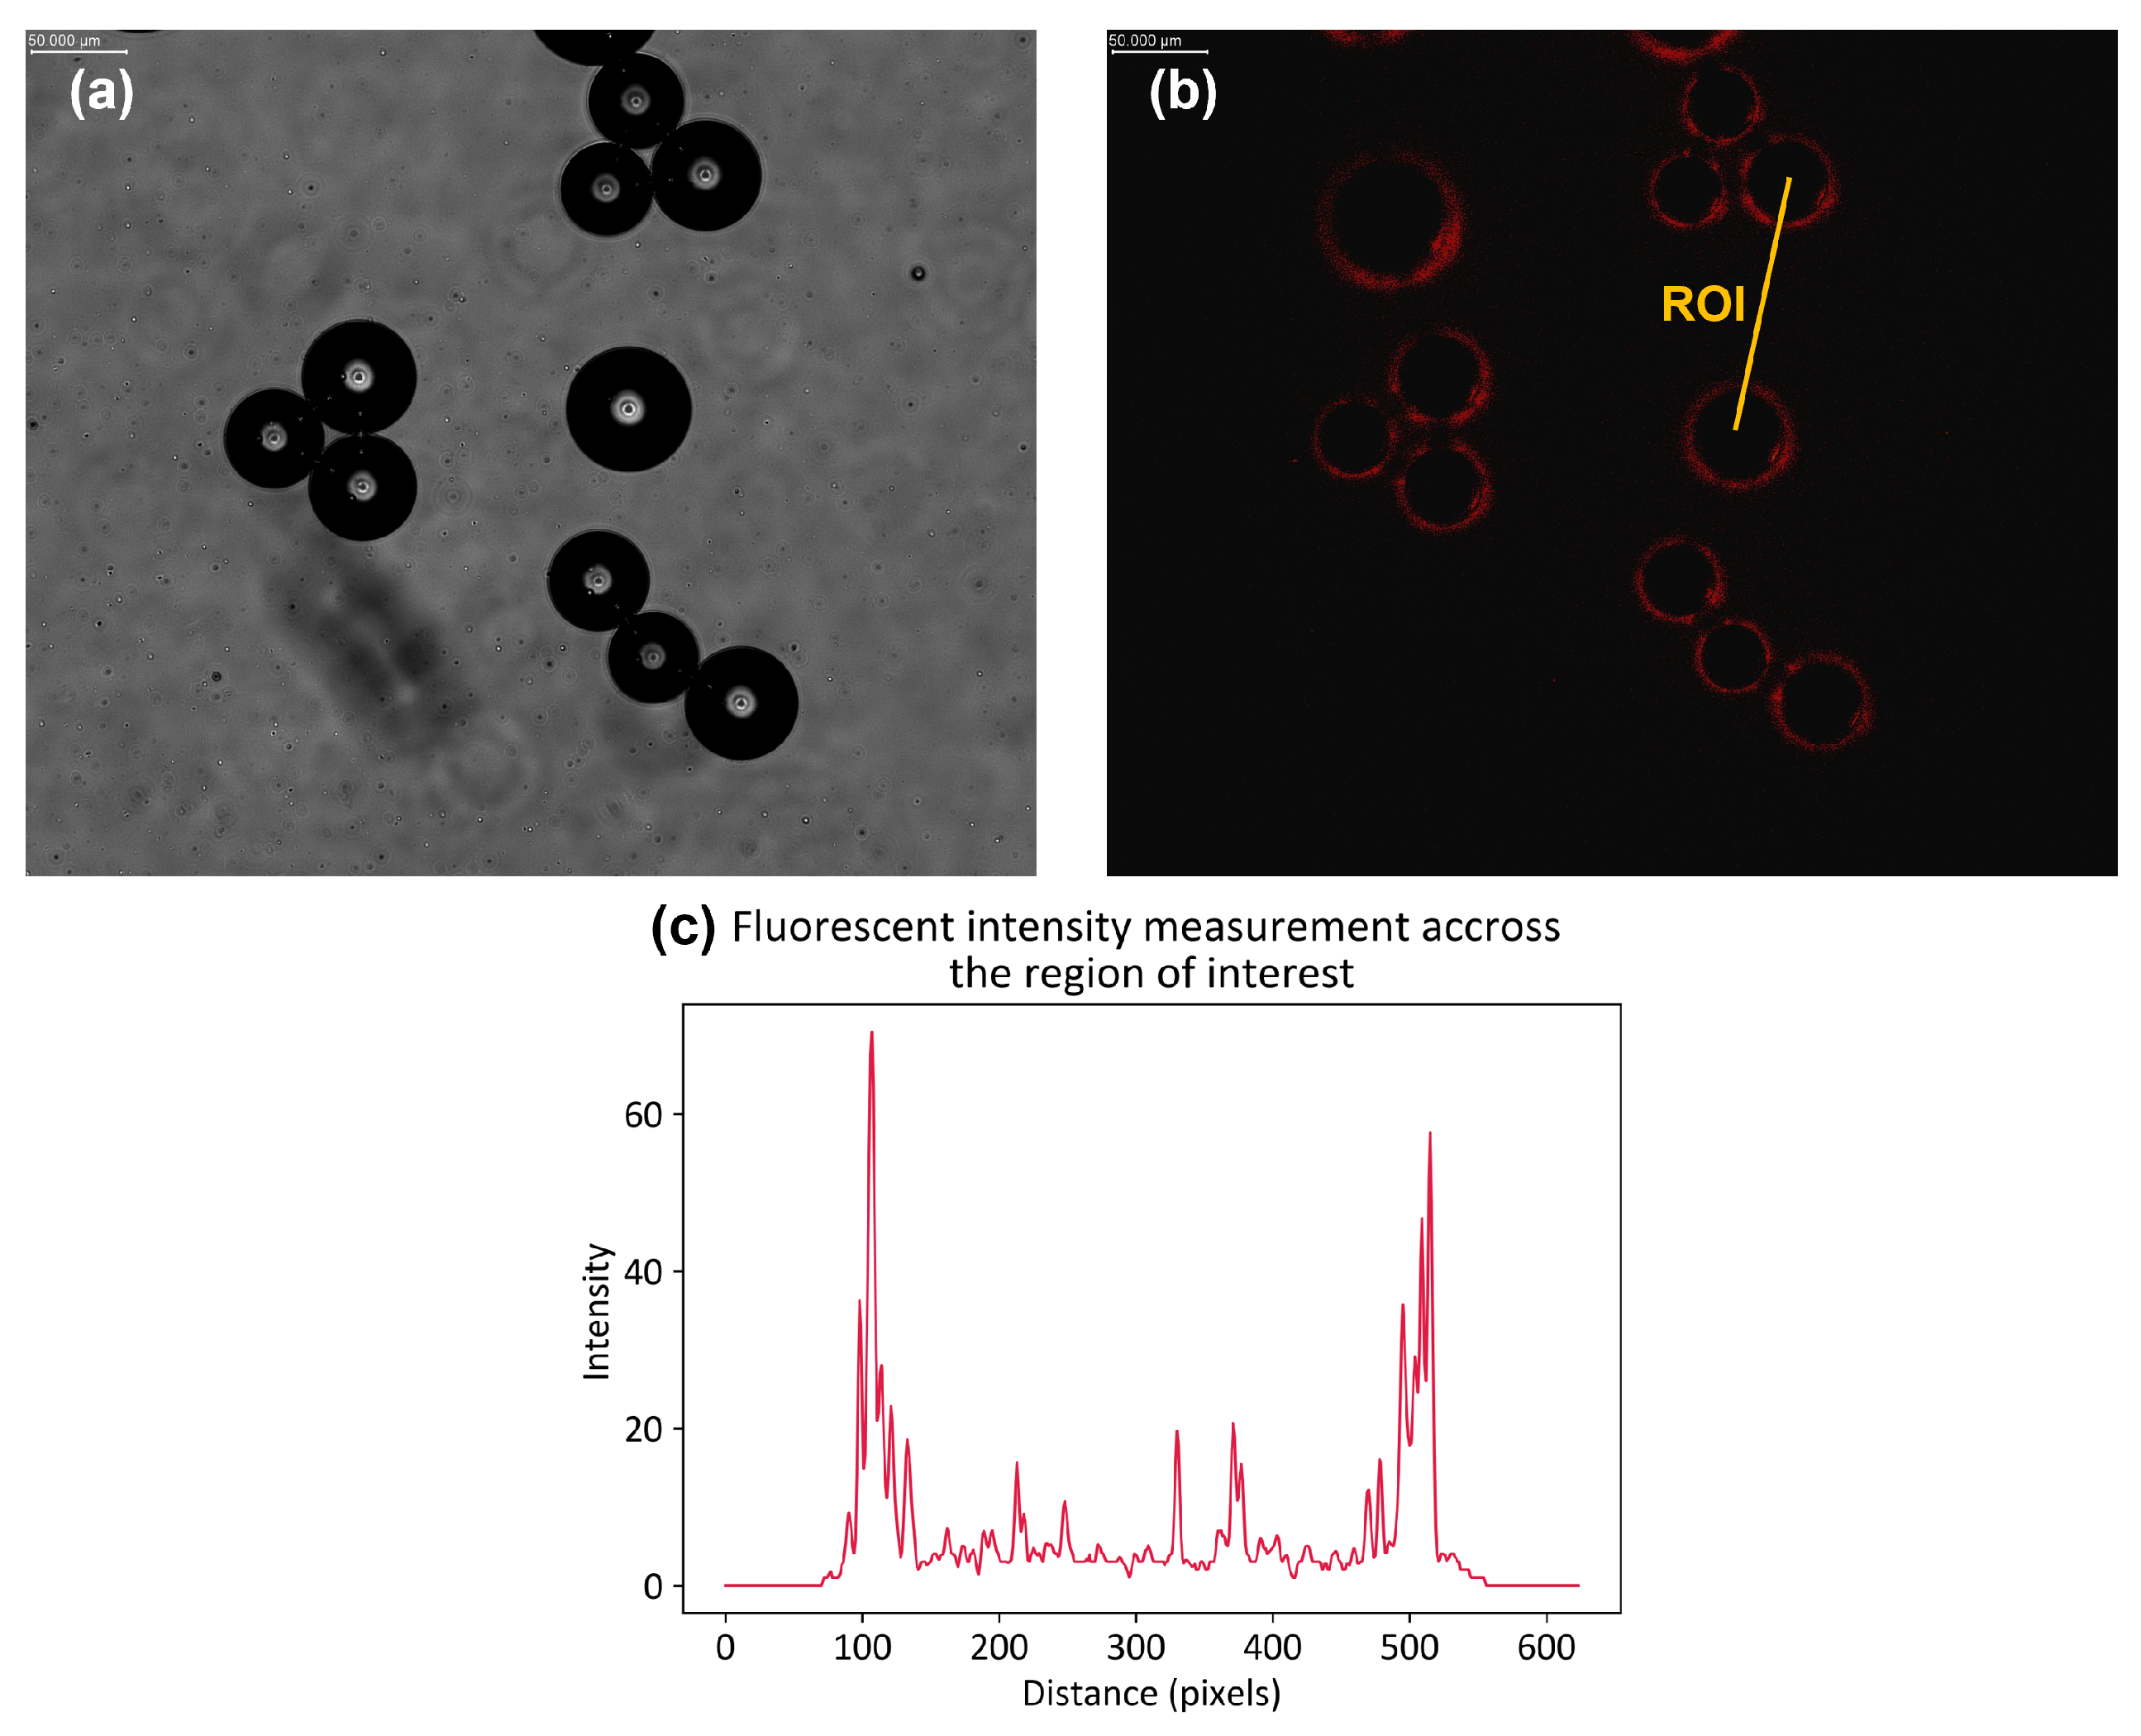
2.6.2. Fluorescent Intensity Measurement

We used ImageJ to measure the fluorescent intensity along a specific region-of-interest. Firstly, we loaded the image into ImageJ, and then we used the built-in ROI tools to draw the region-of-interest. After adjusting the background and reducing noise, we measured the fluorescent signal along the ROI. The measurement data were saved in a CSV file and then imported into Python to plot the intensity along the ROI line. Overall, by using these steps, we were able to accurately measure and analyze the fluorescent intensity of the region-of-interest in our image.

2.6.3. Segmentation for Identification of Dewetting Using Machine-Learning Techniques

Ordinary circular-object-detection algorithms are ill-equipped for microbubble dewetting characterization, as they lack the specificity and sensitivity to only detect the oil droplets that are separated from the microbubbles. Moreover, it would be very difficult and time-consuming for the operator to manually perform this characterization. This made the characterization of microbubble dewetting a challenging task. In order to address this issue, we developed a machine-learning-based segmentation method to detect the dewetted droplets. Segmentation is a process used to divide an image into multiple regions or segments, based on their shared features, such as color and texture attributes. Each region is then classified into one of the pre-defined categories, resulting in a segmented image. This process has been essential for numerous applications in image-processing, including object detection, medical image analysis, and scene-understanding [38,39,40]. We leveraged Labkit, an open-source software tool to achieve image segmentation. Labkit provides an intuitive interface for users to annotate images and train machine-learning models for segmentation tasks [41].
The fluorescent images of the microbubbles were first fed into an image-processing pipeline, developed in Python, to apply pre-processing steps, such as smoothing, noise removal, and thresholding, to enhance the microbubble visibility. The images were then sliced into smaller regions. This approach offered benefits by reducing the computational resources needed for the segmentation step, making the overall image-processing pipeline more efficient. Three random regions of the image were then input into Labkit software to undergo segmentation. Briefly, the Labkit annotation tools were used to manually annotate a few examples of the foreground (dewetted oil droplets) and background in an image. These examples were then used to train a random forest-based pixel classifier within Labkit. The pixel classifier was capable of automatically segmenting the entire image by classifying each pixel into one of the predefined categories, based on the learned decision rules from the annotated examples. This approach leveraged the power of machine-learning algorithms to achieve efficient and accurate segmentation of complex images. In Labkit, the performance of a classifier could be assessed by overlaying the segmentation results on the original image. By this process, areas where the classifier could have been misclassifying pixels or objects were identified. The classifier’s performance and accuracy could be improved by providing more labeled examples in these areas. Overall, the classifier could be iteratively refined and optimized until the desired level of accuracy for a specific application was achieved through this approach. Finally, the segmented image was analyzed to count the number of dewetted oil droplets [41,42].

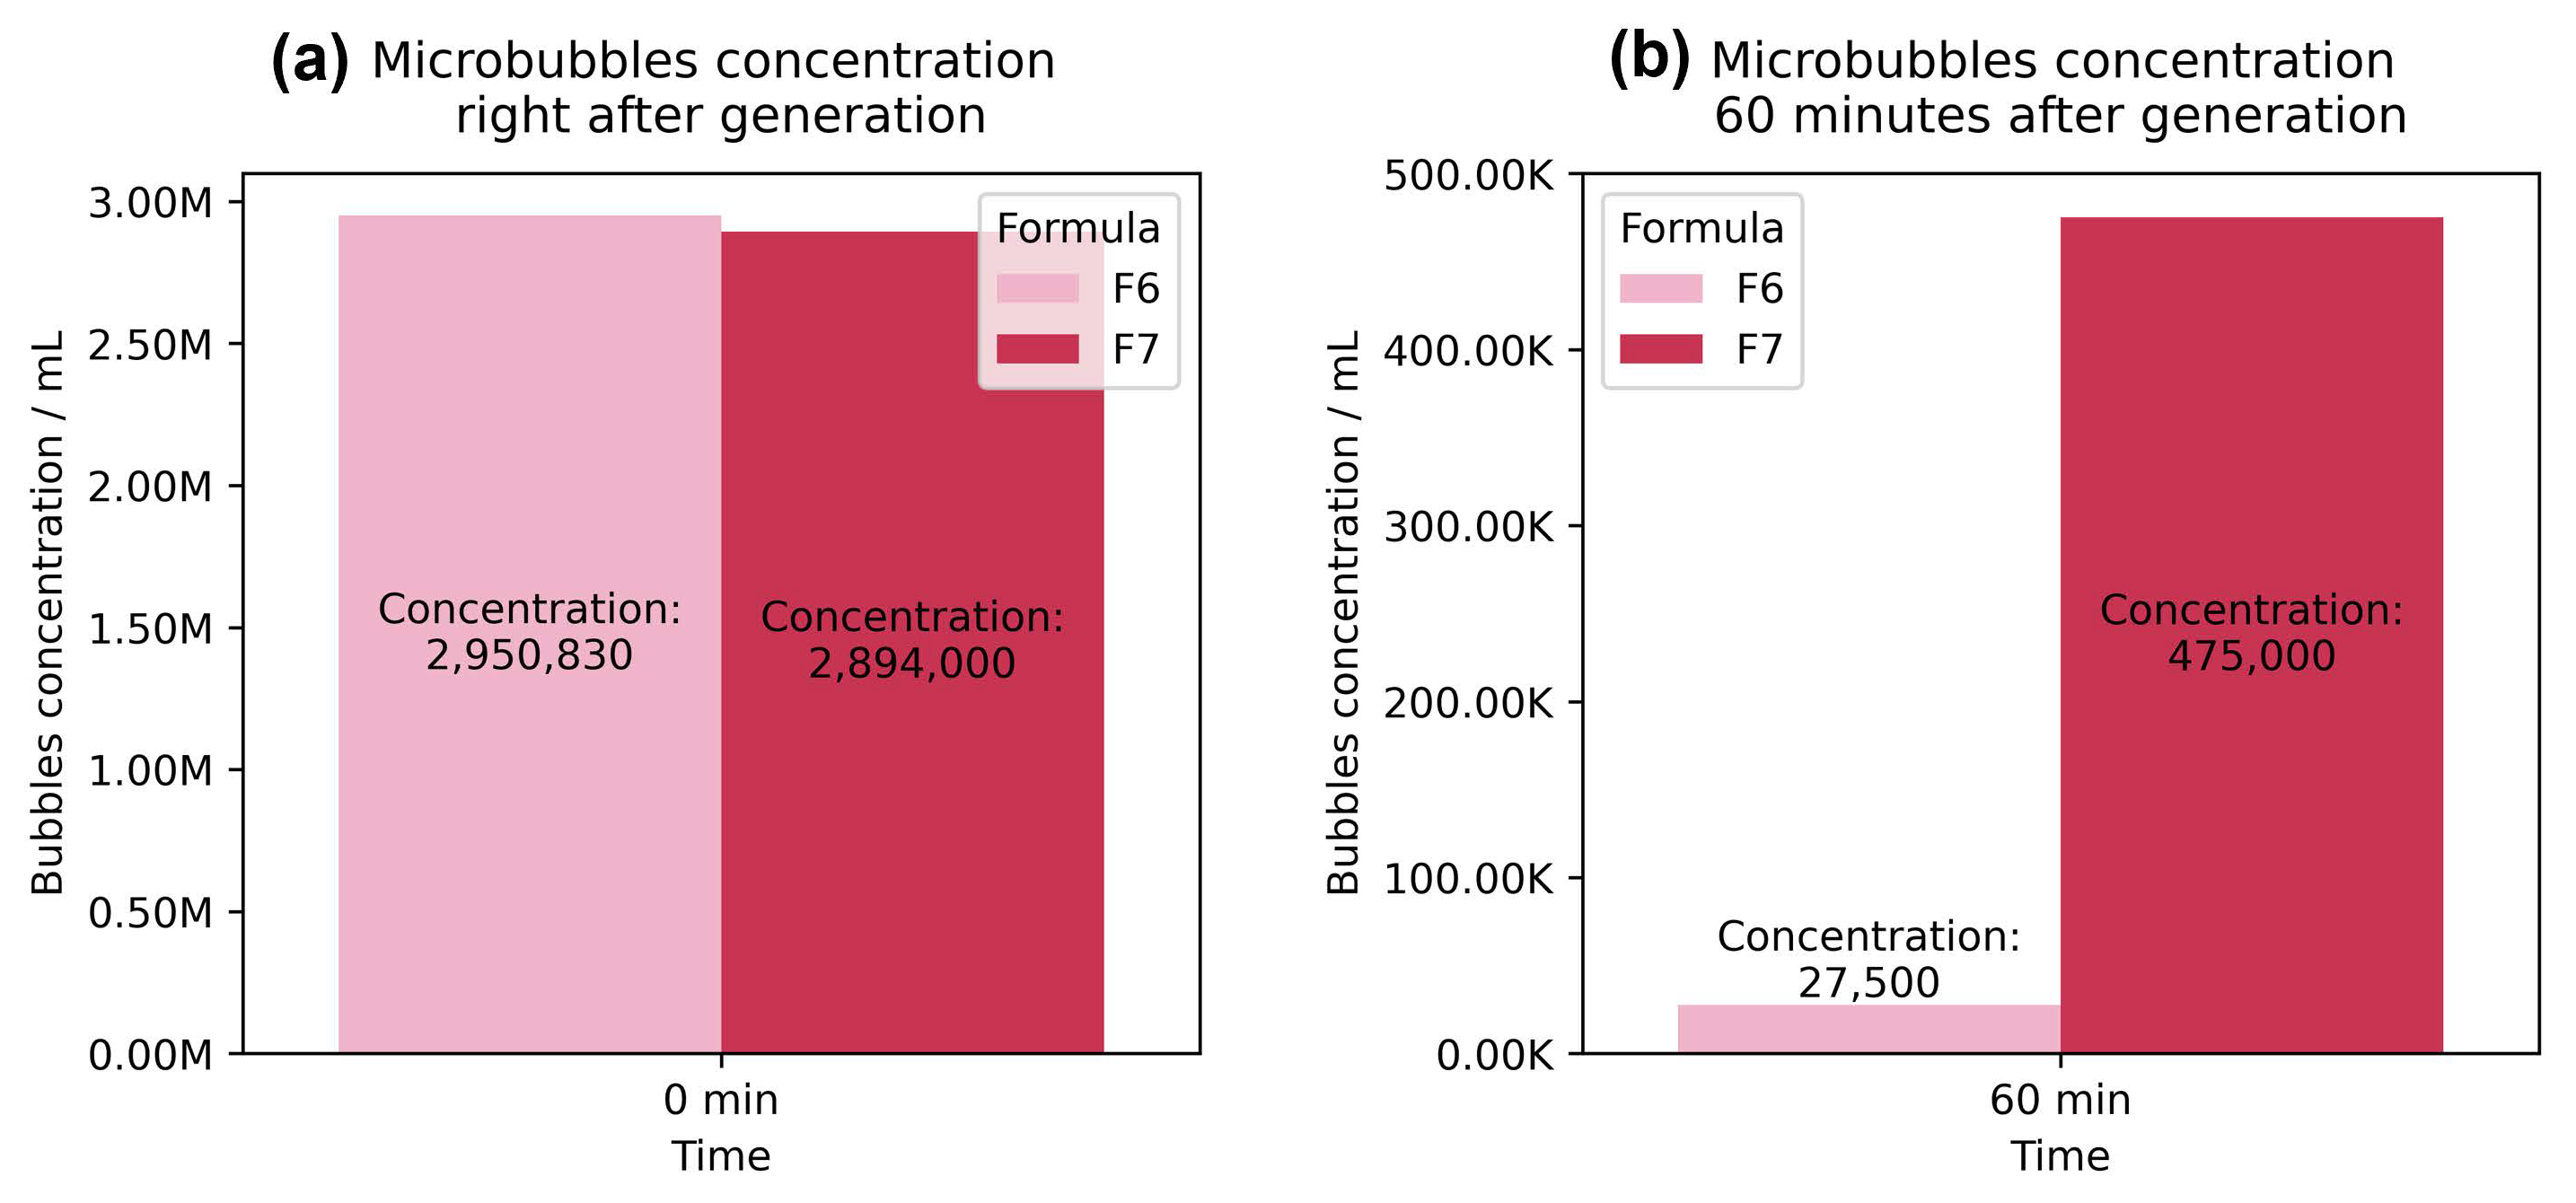
2.7. Microbubble Concentration Detection

The videos of the microbubble production inside the microfluidic device were recorded by a high-speed camera. The videos were then carefully analyzed to determine the number of microbubbles generated per unit-of-time. The initial concentrations of the DEBs were calculated by taking into account the total time of the experiment and the final volume of the solution in which the DEBs were suspended. To calculate the concentration 60 min after generation, we loaded 10 µL of the sample into the hemocytometer and counted the DEBs under the microscope. Based on this result, we calculated the total number of bubbles remaining in the sample.

3. Results and Discussion

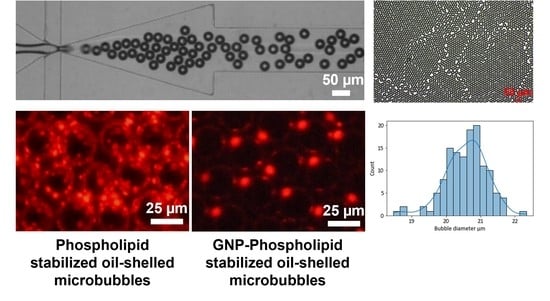
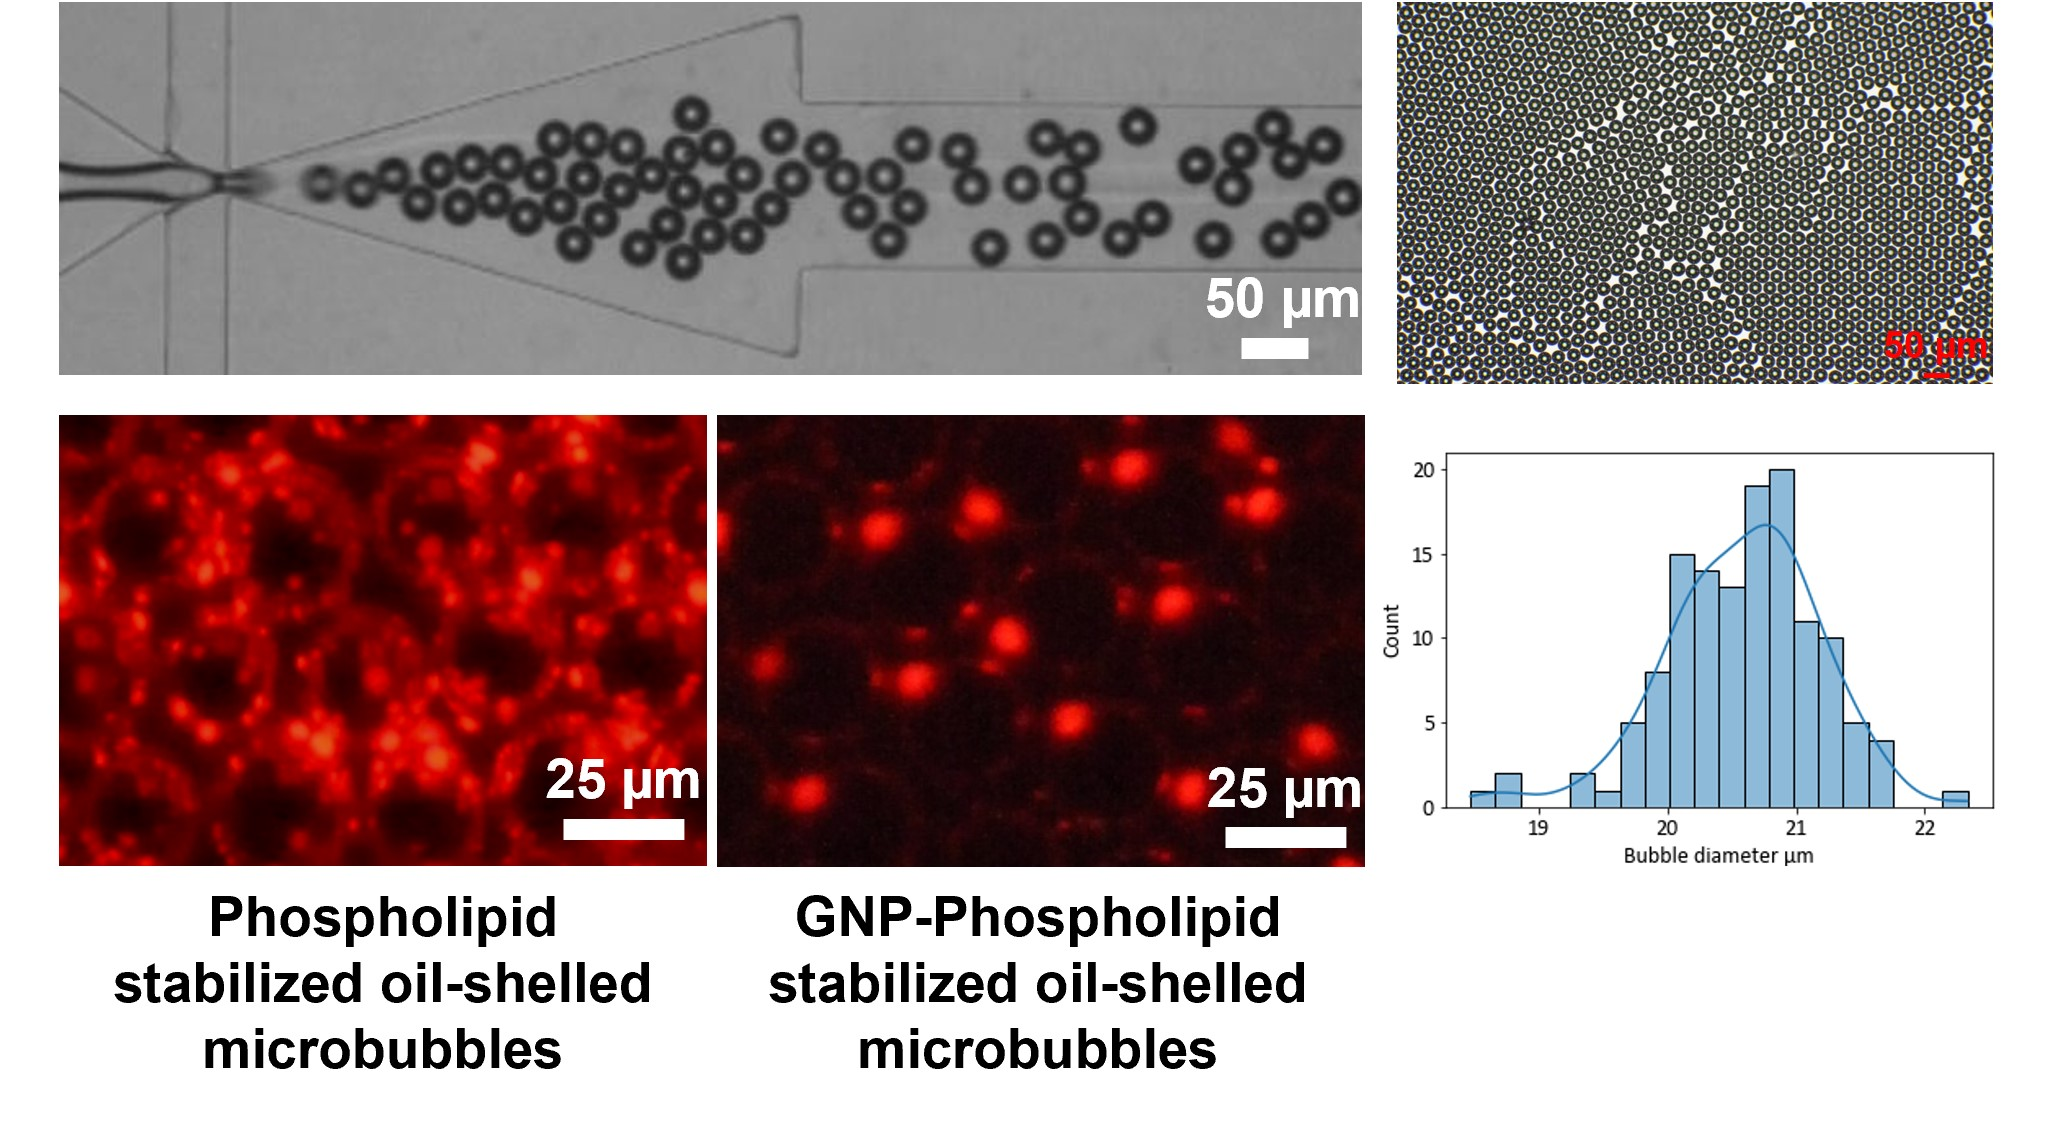
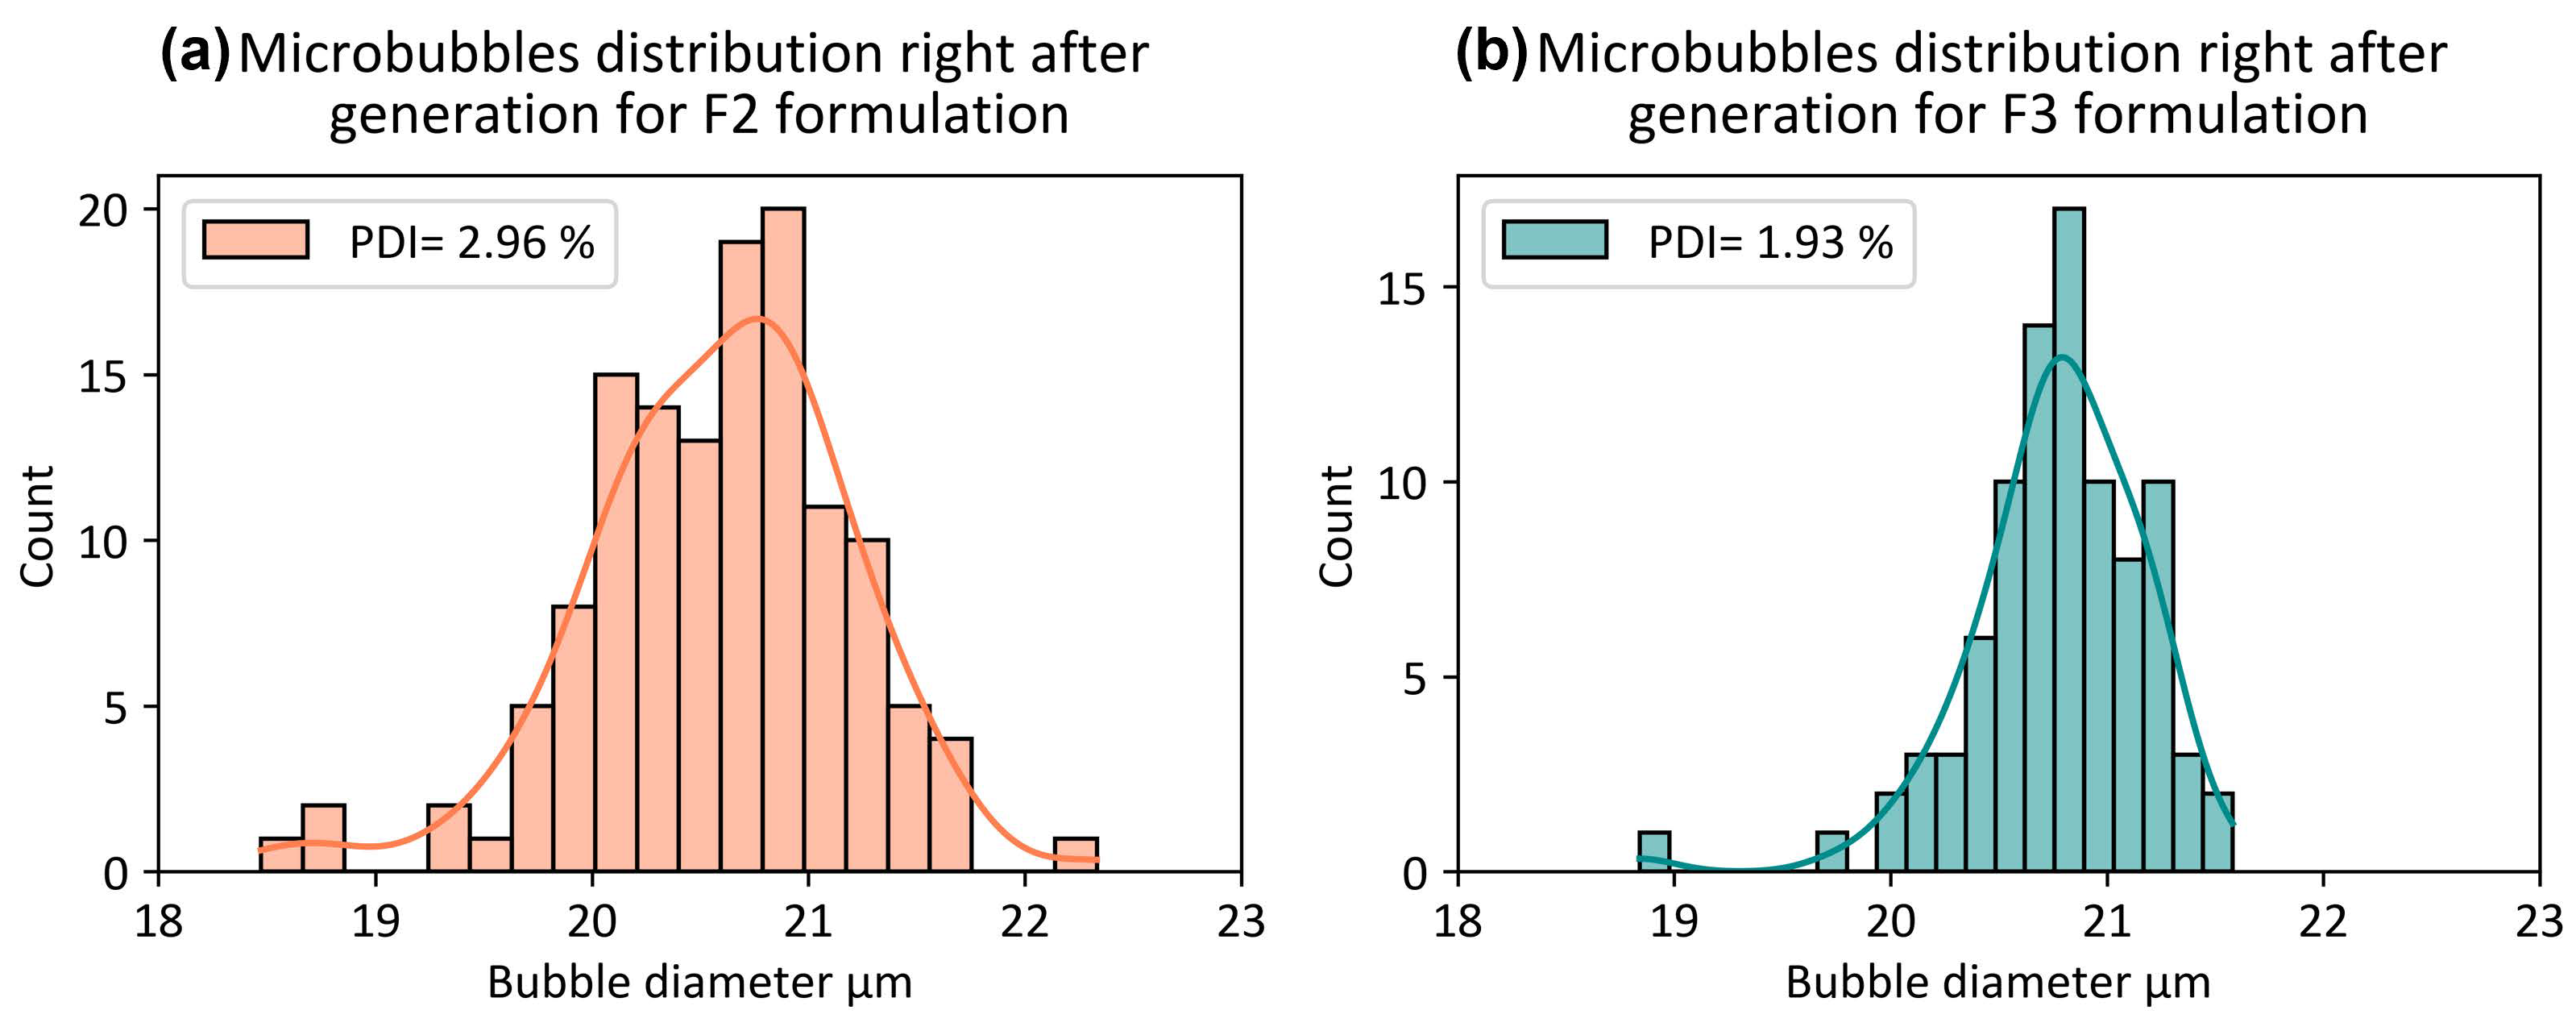
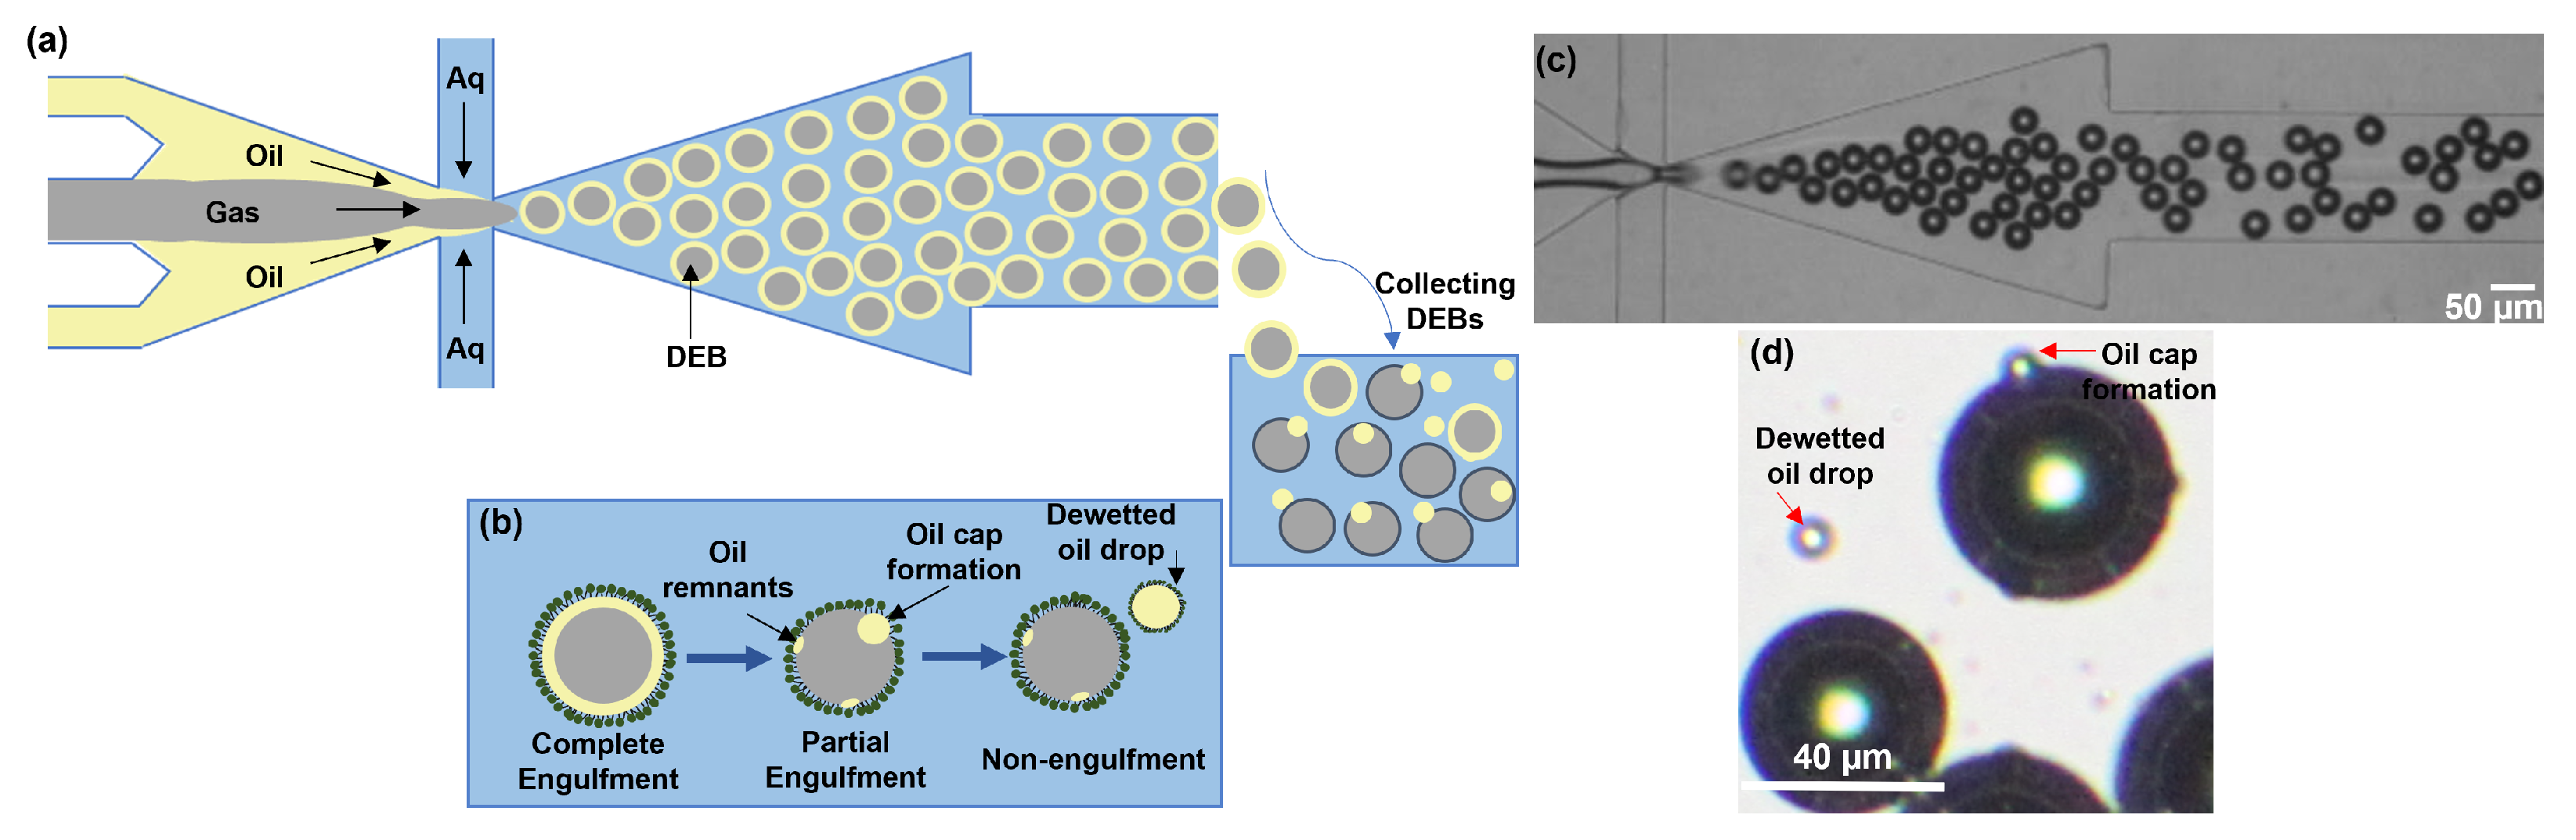
3.1. Formation of phospholipid-shell DEBs

DEBs were formed in a microfluidic FF device, using the setup that is illustrated in Figure 1. The device was designed such that the W/O/G (water/oil/gas) double emulsions were produced at a single flow-focusing junction. The aqueous phase channel surface was selectively modified to be hydrophilic with a PVA, solution as described in the experimental section, while the oil and gas-phase microchannels remain hydrophobic. This surface treatment proved to play a crucial role in the stable and monodispersed production of the DEBs, as well as the prevention of the formation of secondary satellite oil droplets at the junction, as it ensured proper wetting of the FF device walls by the aqueous phase at the junction.The inclusion of a step in the gas-phase microchannel was another crucial factor in the stable generation of the DEBs. This structure ensured that the gas phase was properly sheathed by the oil phase before reaching the pinch-off junction.
The F1, F2, F4, and F6 phospholipid formulations listed in Table 1 were tested to find the total lipid concentration that would result in the most stable and monodispersed population of DEBs. Our observations suggested that the F1 formulation (total lipid concentration of 0.83 mg/mL) increased the coalescence of the DEBs inside the FF device, hindering the collection of the monodispersed DEBs. Therefore, this concentration was excluded from future experiments and characterizations. The F2, F4, and F6 phospholipid formulations demonstrated monodispersed productions of DEBs inside the FF microfluidic device. Figure 2a represents the size distribution of the DEBs generated inside the FF device using the F2 lipid solution. A mean diameter of 20.6 µm and a polydispersity index (PDI) of 2.96% were obtained for the DEB produced with this formula, based on a sample size of 132 microbubbles. Previous attempts to generate double-emulsion bubbles using a single-junction FF device had achieved an initial PDI of 10% [30]. A similar initial distribution was observed for the F4 and F6 lipid formulations.

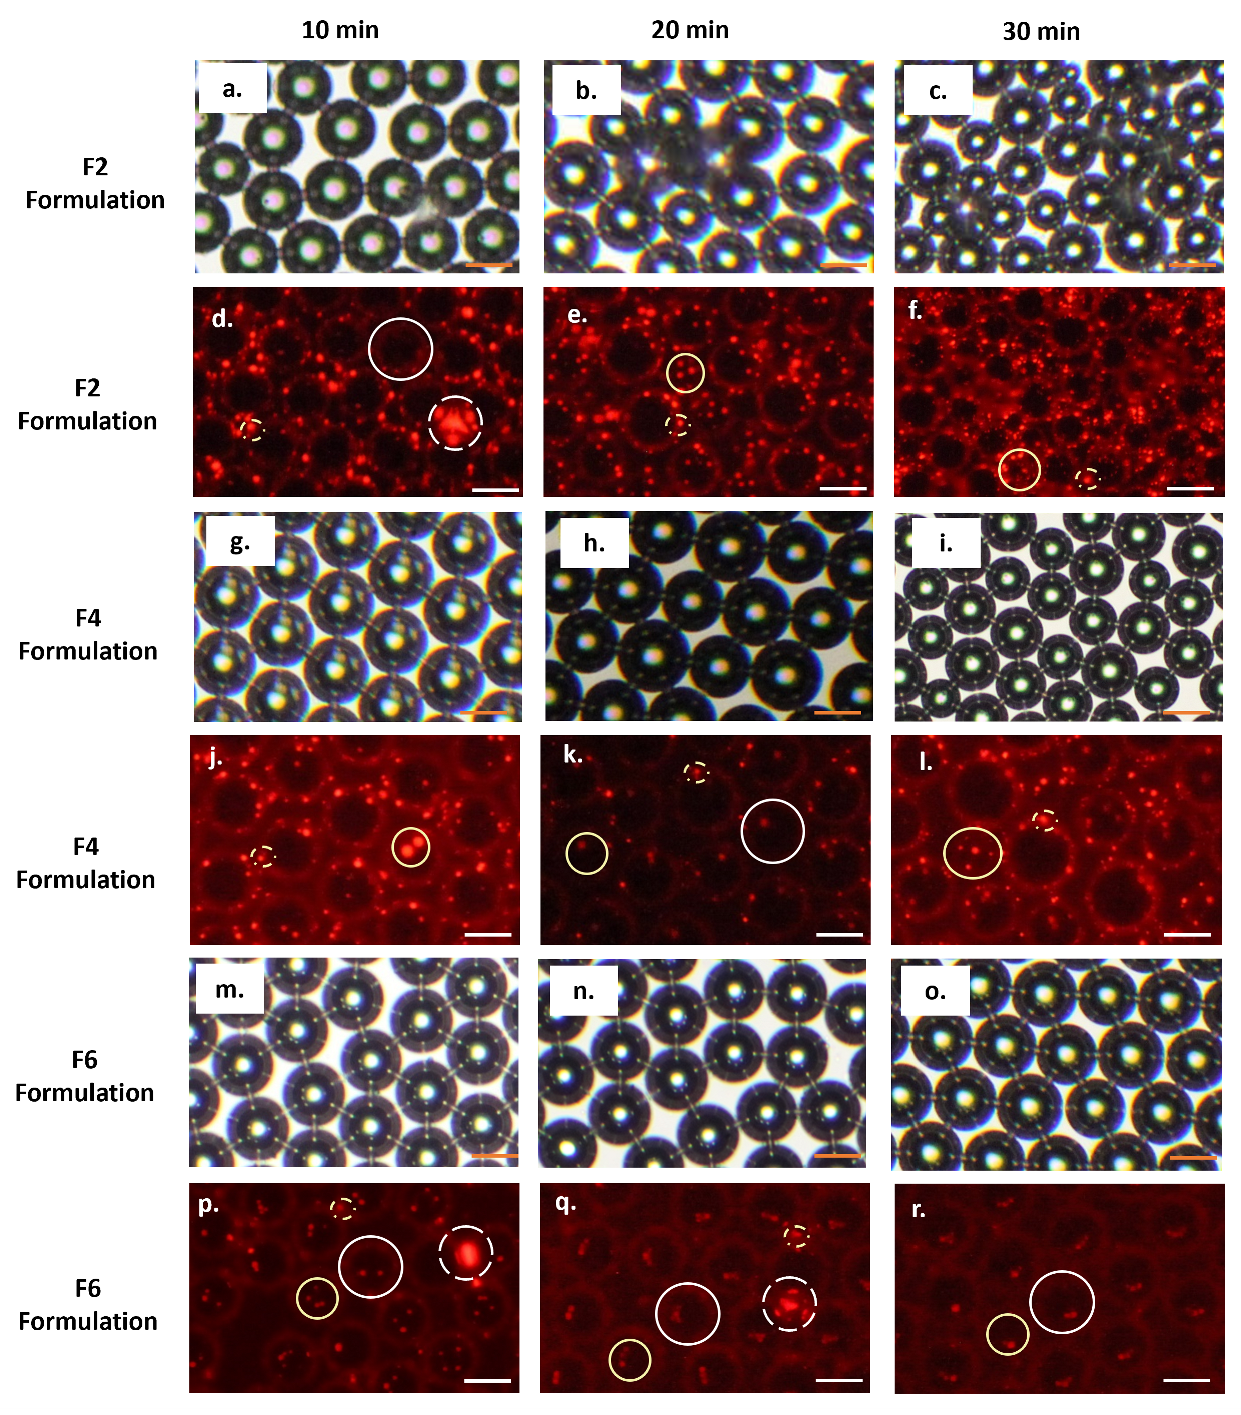
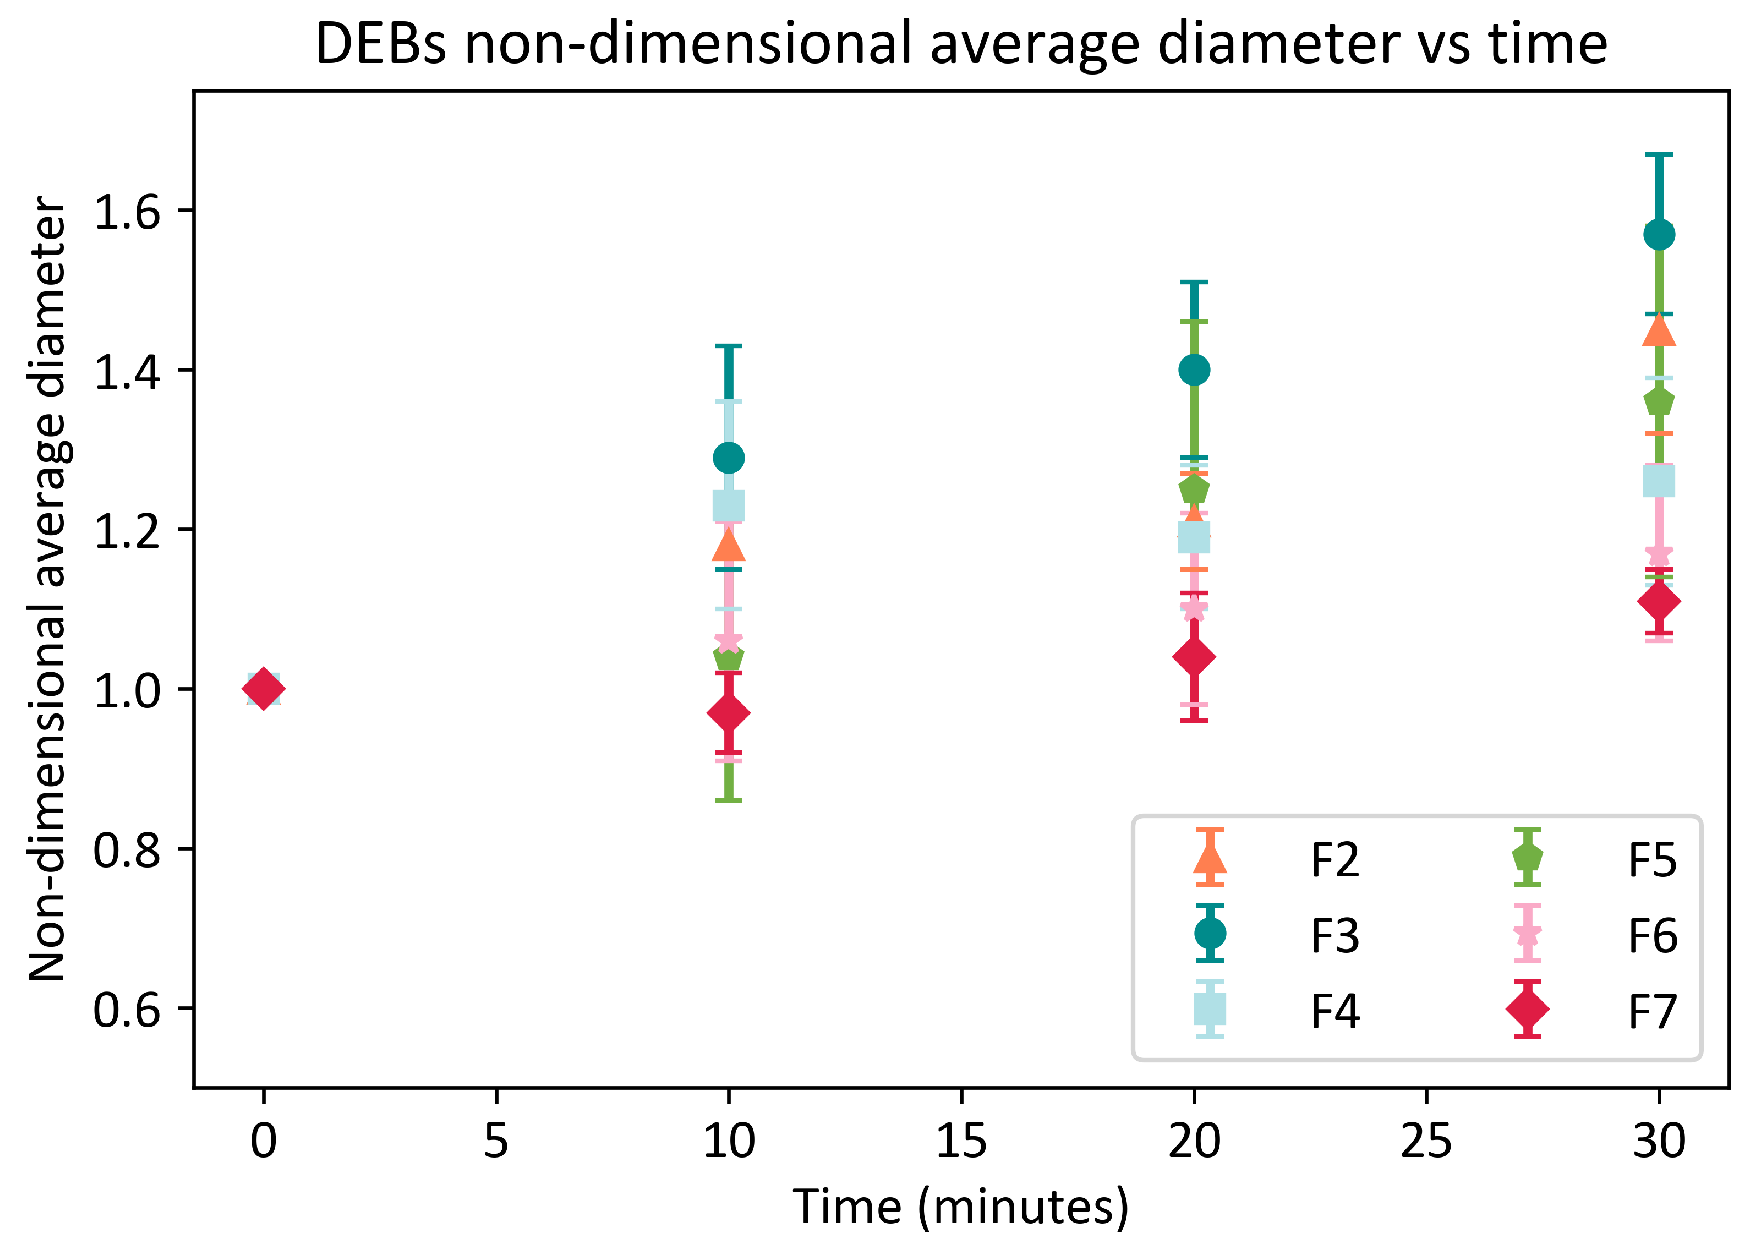
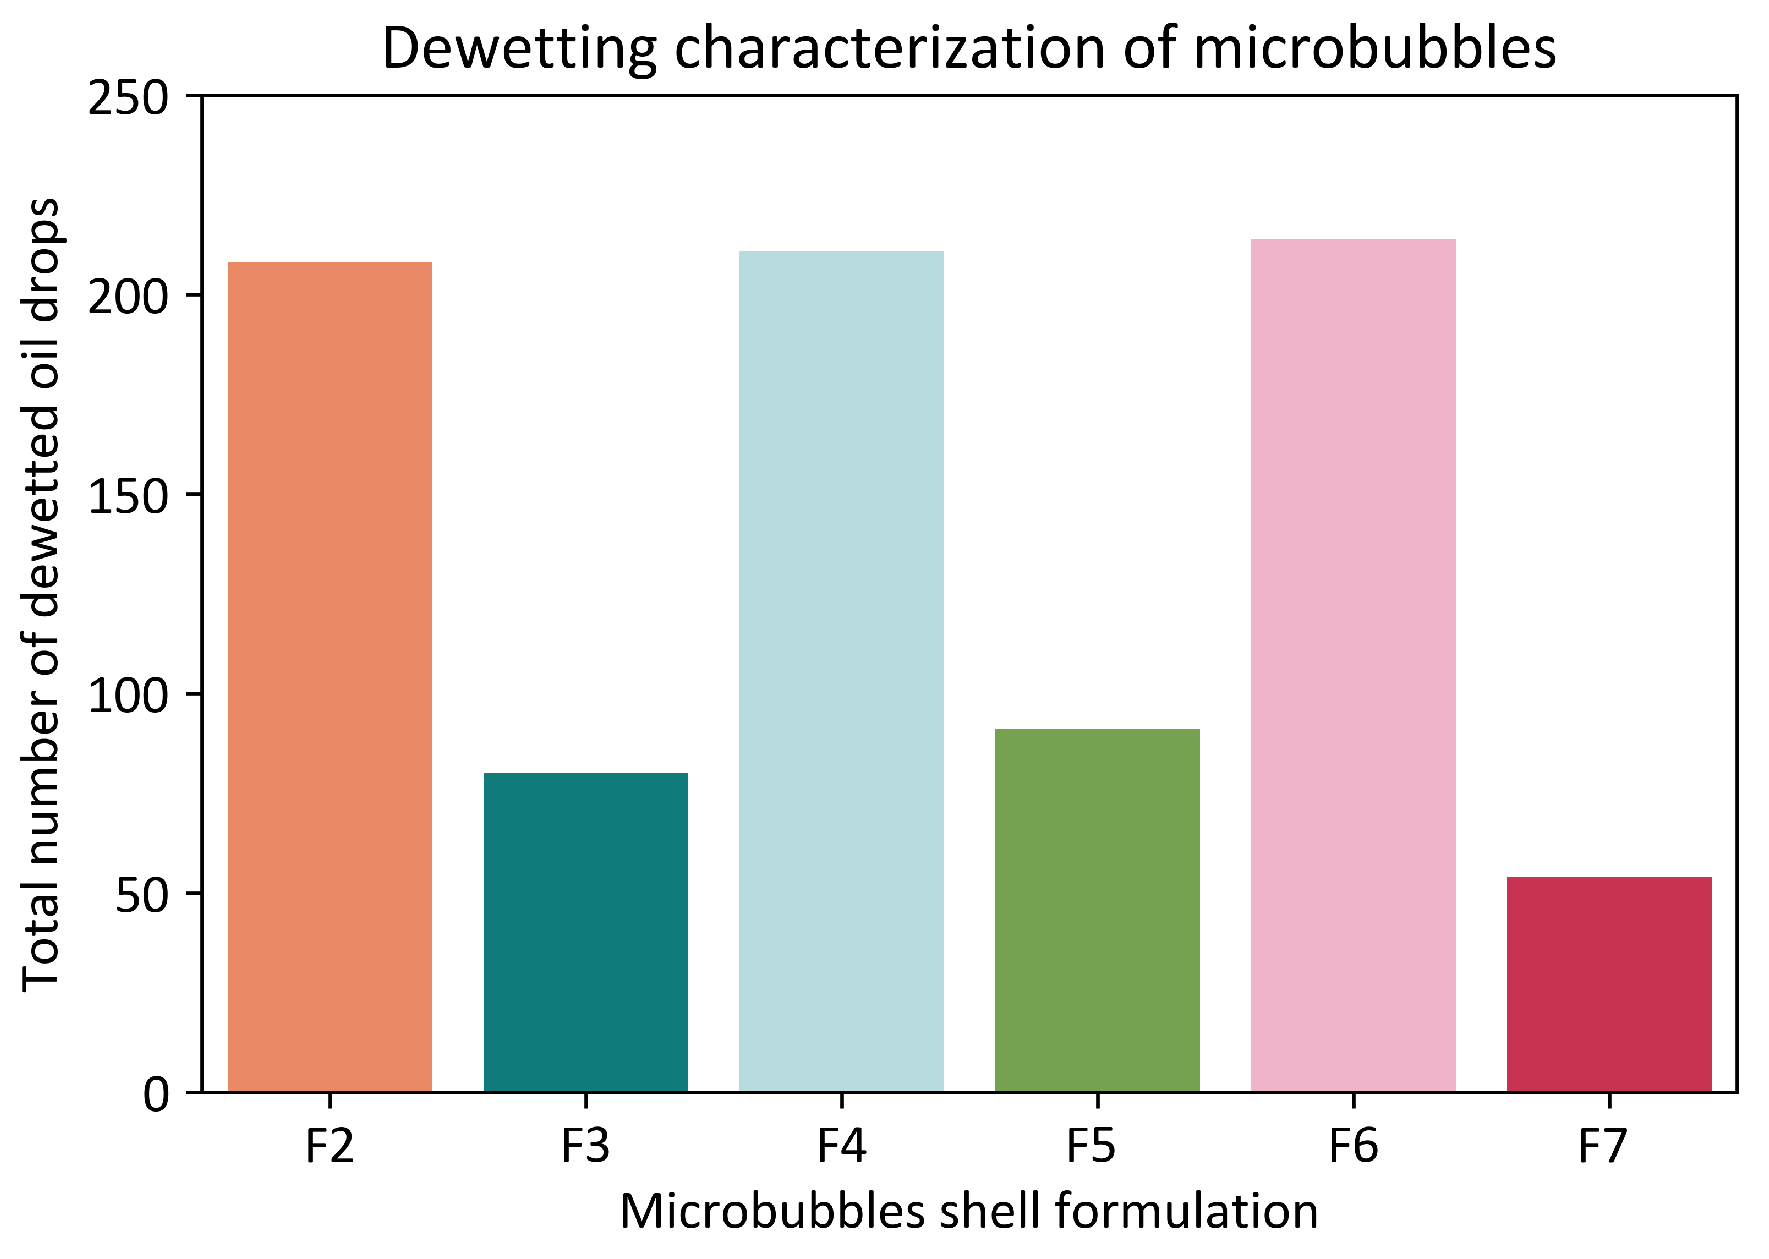
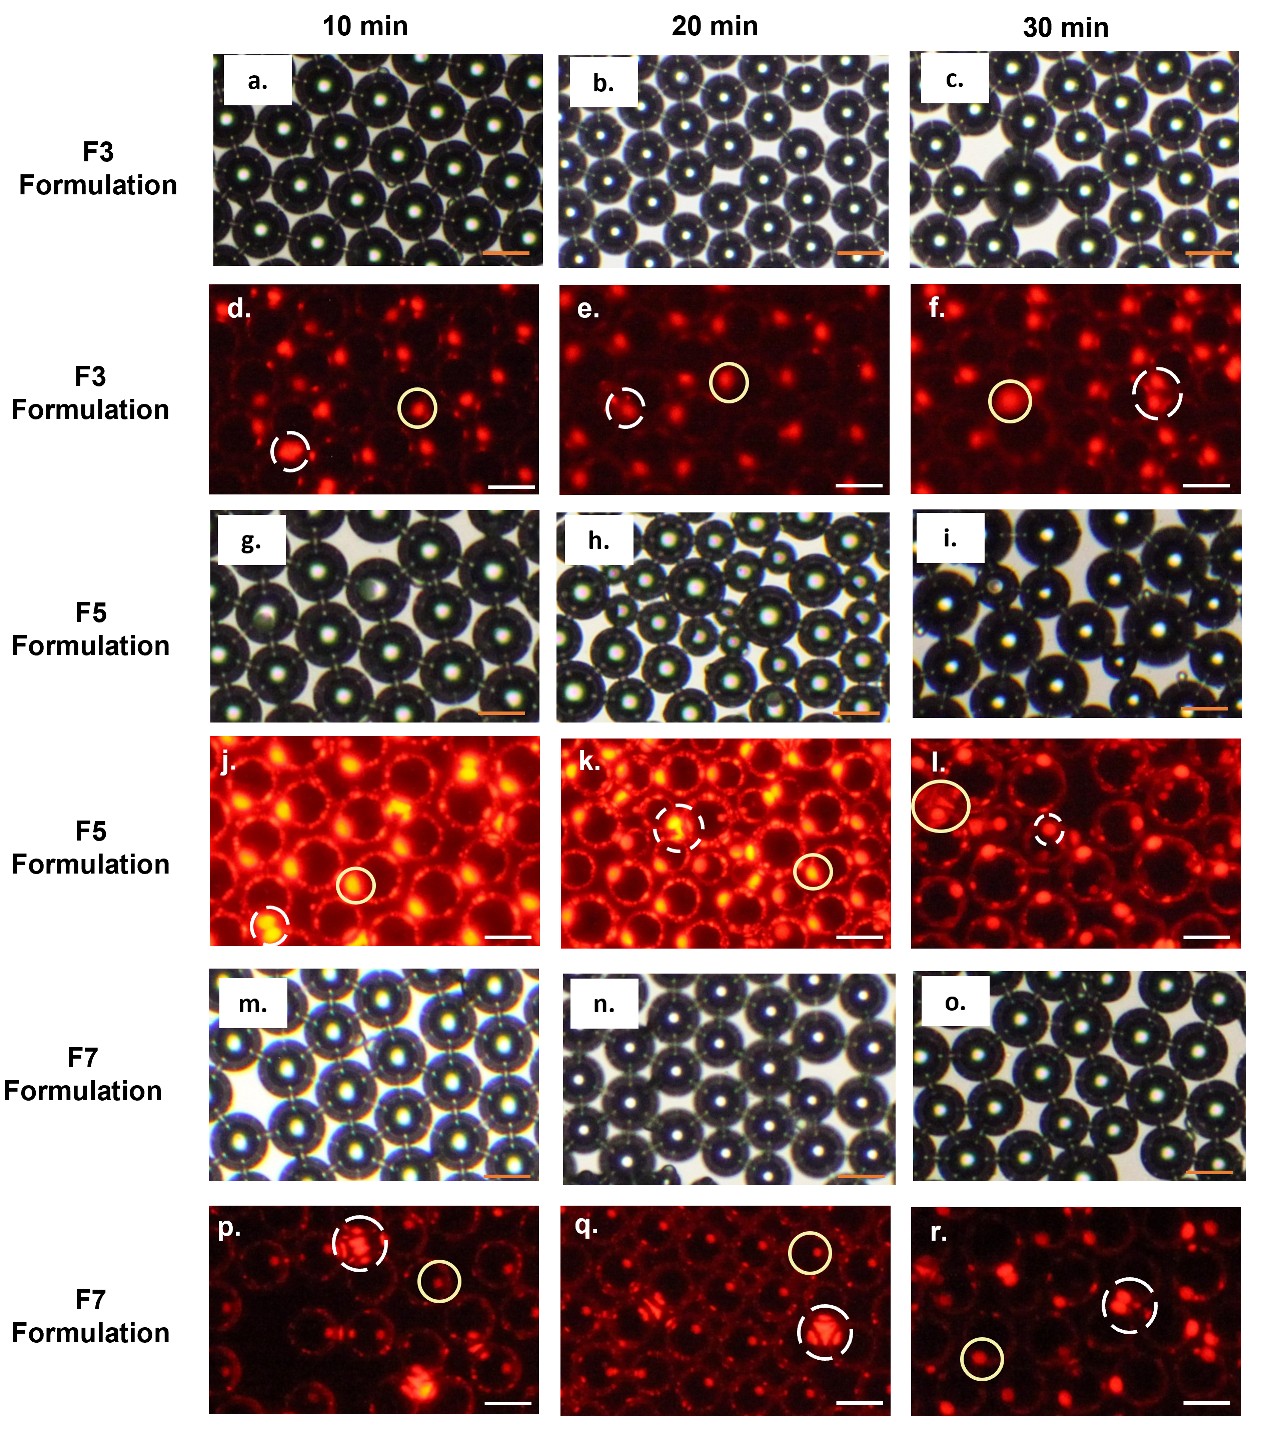
3.2. Morphology and Stability of Phospholipid-Shell DEBs

Figure 3a,c demonstrate the production of the DEBs inside the microfluidic device. In order to examine the morphologies and the distributions of the DEBs, a sample was collected from the outlet of the flow-focusing device and loaded onto a Countess slide before being observed under a microscope. The existence of the oil layer was proved by both bright-field and fluorescent imaging. However, as opposed to observing a uniform oil shell surrounding the gas core, oil droplets were observed on the surface of the DEBs, as shown in Figure 3d.
This phenomenon had previously been observed by researchers and attributed to oil-bead formation on the DEB shell from the excess oil in the shell. [30]. However, in the aforementioned study, researchers did not report on the evolution of the morphologies of these microbubbles or their stability. The results of the current study suggested that the formation of the oil beads on the shell of the microbubbles was due to the onset of the dewetting process. In other words, the DEB morphology transitioned from a complete-engulfment state to a partial-engulfment state within a few minutes after generation. This phenomenon has been observed in many double-emulsion systems and is dictated by the interfacial tensions at the contact lines and the spreading coefficients [32,34,43]. Figure 3a–d demonstrates the production of DEBs and subsequent onset and progress of dewetting for our double emulsion system off-chip.
Dewetting is a dynamic phenomenon. In the water/oil/water (W/O/W) double emulsions, if the complete engulfment and partial engulfment configuration are not thermodynamically stable, the system gradually moves toward the non-engulfment state and two separate droplets are formed. [44]. This approach has frequently been used to make highly controlled vesicles and artificial membranes using W/O/W double-emulsion templates for applications such as drug delivery [34,44]. However, since the three-phase system presented in this work consisted of a gas core, other phenomena such as Ostwald ripening and gas dissolution also affected the stability and the configuration of the W/O/G double emulsions. Previous studies on single-layer microbubbles, stabilized with a lipid membrane, have established that the lipid membrane packing density played a vital role in the formation of a stable and monodispersed MB population. According to these studies, the lipid shell framing the newly formed MBs would be in a disordered state with a low packing density, thus facilitating Ostwald ripening between the MBs. As the MBs continued to dissolve due to Laplace overpressure, the lipid membrane was compressed. This process continued until a terminal size was reached for the bubbles, at which the surface pressure from the mechanical compression of the MBs was balanced by the surface tension.Additionally, the compression of the microbubbles increased the lipid packing density at the interface, creating a barrier for the diffusion of the gas molecules outside the MBs and, thus, further stabilizing the population [28,35,45,46,47].
In the DEBs presented in this paper, it had been hypothesized that the spontaneous onset of the oil-shell dewetting would form an advancing oil droplet that would further stretch the monolayer and thus prohibit the formation of a fully condensed lipid monolayer that could act as an effective diffusion barrier for the gas molecules.Therefore, the DEBs were more susceptible to gas dissolution and Ostwald ripening, which would then affect the population monodispersity and stability.In order to compensate for this effect, more lipid molecules would need to be absorbed at the interface, and given the stationary environment, this process would be diffusion limited.It was worth noting that the diffusion was further hindered due to the fact that bubbles are buoyant and were closely packed at the top of the storage vial, whereas the lipid molecules resided inside the aqueous medium.
Bright-field and fluorescent microscopy techniques were used to characterize the morphologies of DEBs. Figure 4 illustrates the results of this characterization for DEBs made with different lipid formulations, at various points in time. Both bright-field and fluorescent images of the DEBs are incorporated. However, it is important to note that the microbubbles may experience movement during imaging, which can result in discrepancies between the fluorescent and bright-field images, depending on various factors such as the time taken to find the correct focus plane, settings, and region of interest. Therefore, while we have included both image types for completeness, there may be variations between them that should be taken into consideration.
The further examination of the DEB fluorescent images highlighted the presence of the oil remnants in the periphery of the MB shells (marked with solid yellow circles in Figure 4). Several studies reported that fatty acids (FA) were miscible in lipid membranes and tended to form FA-rich micro-regions upon insertion inside the membrane. Furthermore, FA incorporation inside the membrane enhanced the lipid membrane fluidity, lateral diffusivity, and permeability [48,49].
In particular, Kurniawan et al. [49] studied the interaction of oleic acid with the DPPC membrane and showed that the oleic acid was, indeed, miscible in this type of membrane, and upon its incorporation, the stiffness of the membrane was lowered [49]. Given that the lipid monolayer surrounding the DEBs in this study was rich in DPPC, the formation of oleic acid rich microdomains was attributed to the miscibility of the oleic acid inside the monolayer. It was speculated that these microdomains created defective areas and destabilized the ordered structure of the lipid membrane, increasing its lateral diffusivity and permeability, thus promoting gas dissolution. This further supported our hypothesis that the lipid membrane surrounding the DEBs presented in this study would not reach a closed-pack state. Moreover, these FA-rich microdomains could also form protrusions in the DEBs, creating a morphological characteristic similar to a raspberry-like emulsion system.The oily protrusions on the surfaces of the DEBs could further contribute to bubble coalescence and dissolution. When two or more oil drops were near each other, they were only separated by a thin film of the continuous phase. Once this film broke, the two oil drops merged together and formed a larger oil droplet to reach the lowest Laplace pressure [50]. This formed a capillary bridge between the otherwise separated microbubbles and constantly reduced the distance between the DEBs, which increased the probability of their coalescence. The white dashed circle in Figure 4 highlights the formation of a capillary bridge between three neighboring DEBs. The capillary bridge formation between the neighboring droplets had also been observed in other raspberry-like oil/water/oil-emulsion systems [51]. If a capillary bridge formed between similar size DEBs, it could lead to the direct coalescence of the DEBs. However, if the capillary bridge formed between bubbles with large diameter ratios, Ostwald ripening would become the dominant mechanism, which involved diffusion of the gas molecules from the smaller to the larger bubble. Since the DEBs in the current system were densely packed, it was speculated that direct coalescence and Ostwald ripening could coexist together and reinforce each other, leading to a cascade of coalescence events. Figure 5 represents the dimensionless average diameters of the microbubbles over time. It can be seen that over time the population mean is only increasing, which further supports the occurrence of a cascade of coalescence events, leading to the loss of microbubbles and their population monodispersity.
Although Figure 5 suggested that the increase in the lipid concentration decreased the growth rate of the microbubbles, the morphological studies of these structures (Figure 4) suggested that the increase in the lipid concentration tended to speed up the dewetting process. The number of dewetted oil droplets was a valuable metric for evaluating the dewetting process. However, accurately determining this number was a challenging task because conventional circular-object-detection algorithms could not differentiate between dewetted oil droplets and those still attached to the microbubble shell. Therefore, we developed a machine-learning-assisted segmentation method, as was elaborated in the Methods Section, to automate the detection of the dewetted oil droplets. The results depicted in Figure 6 show the total count of dewetted oil droplets for various phospholipid formulations. The results suggested that increasing the phospholipid concentration from 1.19 mg/mL (F2) to 1.56 mg/mL (F4) or to 2.45 mg/mL (F6), led to an increase in the total number of dewetted oil droplets by 1.5% and 3%, respectively. Therefore, as opposed to single-emulsion microbubbles, increasing the concentration of the phospholipids did not lead to more stable double-emulsion microbubble configurations.
It was, therefore, fair to conclude that this DEB system was inherently unstable due to the lack of an effective protective shell and spontaneous dewetting. Moreover, the formation of the raspberry-like structures and the uncontrolled dewetting made it difficult to optimize and calculate the amount of cargo that could be delivered via the DEBs. In order to prevent or slow the the dewetting process, the interfacial tensions could be modified by changing the type of solution or the kind/concentration of the phospholipids and other surfactants present in the system [34]. However, in the current study, we wanted to explore the effect of the addition of a protective gold nanoparticle shell around these double emulsions as a way to control the dewetting process.

3.3. GNP-Functionalized Phospholipid-Shell DEBs

The nanoparticles were initially introduced as a substitute for surfactants for the stabilization of the droplets because they could accomplish three goals: (1) extend the stability of the aqueous droplets; (2) prevent leakage without altering the composition or the properties of the aqueous phase; and (3) establish a strong interface for cellular attachment and growth [52,53]. Over the past decade, the use of nanoparticles (NPs) with single-layer microbubbles has attracted interest, as NPs can stabilize the MBs by modifying the interfacial tension and diffusivity of the gas throughout their shell. The mechanism behind this stabilization has been speculated to be related to the steric barrier provided by the solid particles being adsorbed at the interface. Moreover, the incorporation of NPs in the MBs made them a great candidate for multi-modal imaging contrast agents and theranostic applications [54,55,56,57,58,59]. In this work, the effect of incorporating gold nanoparticles on the stability and the morphologies of the DEBs was investigated. To achieve the production of GNP-functionalized double-emulsion bubbles (GNP-DEBs), GNPs were added to the phospholipid formulations before being fed into the microfluidic device (F3, F5, and F7 formulations in Table 1). Figure 2b demonstrates the size distribution of the DEBs made using the F3 formulation. The figure shows that, based on a sample size of 91 microbubbles, these DEBs had a mean diameter of 20.8 µm, a PDI of 1.93%, and a narrower size distribution, as compared to the group without GNP functionalization, as shown in Figure 2a). A similar trend was observed in the DEBs made using the F5 and F7 lipid solutions.
Figure 7 highlights the influence of the GNPs on the morphological evolution of the GNP-DEBs after 10, 20, and 30 min for the 3 different lipid formulations studied. The microstructures of the GNP-DEBs (Figure 7) was compared to the DEBs (Figure 4), and a marked improvement was observed in the dynamic and extent of the dewetting process. As compared to the non-functionalized DEBs that had developed raspberry-like microstructures; suffered spontaneous dewetting and severe Ostwald ripening; and a cascade of coalescence events, the GNP-DEBs exhibited an acorn-like microstructure and formed a distinct oil pocket on one side (solid yellow circles in Figure 7). It was speculated that the change in the morphology was due to the modification of the surface energy provided by the GNPs. Moreover, the steric barrier provided by the GNPs slowed the advancement and the separation of the side-pocket oil from the structure and increased the stability of the DEBs by alleviating other destructive mechanisms, such as capillary bridge formation and coalescence. It was found that the side-pocket oil remained connected to the structure for up to 30 min. After 30 min, the microbubble population became polydispersed, and the dewetting increased. Even with the acorn microstructure, the bubbles constantly underwent dissolution and Ostwald ripening, as artifacts, such as FA-rich microdomains and advancing oil drops, were still present in the lipid monolayer. As compared to single-emulsion bubbles, the GNP-DEBs did not reach a terminal size or a long stabilization period. However, the addition of the GNPs slowed the detrimental mechanisms and elongate the lifetime of the DEBs for up to 30 min, which was an acceptable window for achieving targeted drug delivery. After comparing the microstructure and the growth rate of the GNP-DEBs prepared with different lipid concentrations (as presented in Figure 7 and Figure 5, respectively), the GNP-DEBs prepared with the F7 formulation underwent slower Ostwald ripening, dissolution, and growth rate, leading to a more uniform population. Figure 8 illustrates how the GNPs mitigated the destructive mechanisms, as previously discussed, and the findings indicated that incorporating GNPs into the lipid solution mixture led to a more than a 17-fold increase in the concentration of DEBs remaining in the sample after 60 min. Moreover, the results depicted in Figure 6 showed that the number of dewetted oil droplets decreased by over 50% after the GNPs had been added to the phospholipid mixture. Specifically, in the F7 formulation, approximately 74% fewer oil droplets were detected, as compared to the F6 formulation. This result further confirmed that the the steric barrier provided by the GNPs slowed the advancement and the separation of the side-pocket oil from the structure and, thus, increased the stability of the DEBs.
To confirm the localization of the GNPs on the DEB shell, a fluorescent study was conducted utilizing the GNPs functionalized with CY3 fluorescent probe. Figure 9 shows the microbubbles that were generated using the aforementioned GNPs. In this study, the oil and lipid shells were not stained with fluorescent probes to avoid cross-talk. The bright red shell of the DEBs under the fluorescent microscope confirmed that the GNPs formed a steric barrier around the microbubble shell. In addition, a region-of-interest was selected in the fluorescent picture (orange line in Figure 9b), and the fluorescent intensity signal was measured along that line. The resulting fluorescent signal profile in Figure 9c showed distinct peaks at the locations where the line crossed the microbubble shell, which further confirmed that the GNPs had been localized on the DEB shell. It was worth mentioning that although the fluorescent signal in the DEB core was zero, the background fluorescent signal could not be at zero since the GNPs had been mixed into the lipid solution. Therefore, they could be present as free particles or residue on the surface of the liposomes that spontaneously form inside the lipid solution.

4. Conclusions

In this work, a facile methodology was presented to achieve the one-step stable production of double-emulsion microbubbles using a FF microfluidic device with a PDI of less than 3%. The microstructure of the DEBs was characterized using microscopy and machine-learning-assisted segmentation of the resulting images. The analysis revealed that the lipid-shell DEBs suffered from severe dewetting instability and were prone to forming raspberry-like structures, making them inefficient as drug delivery vesicles.In addition, it was shown that the addition of the GNPs could substantially delay the onset and the progress of the dewetting instabilities and stabilize the DEB structures by modifying the surface energies and providing a steric barrier. Albeit, only 5 nm GNPs were considered in this study; it is anticipated that nanoparticles of different sizes, compositions, and geometries could be used on the DEBs shell to generate multi-functional and multi-modal contrast agents for theranostic applications. The GNP-DEBs presented herein could be used for applications such as ultrasound-guided photothermal therapy and photo-acoustic-guided ultrasound-mediated drug delivery. While the sizes of the microbubbles presented in this study were large for in vivo applications, they are excellent candidates for in vitro theranostic studies. Particularly for evaluating the delivery of therapeutics to cells or tissue models and their associated biological effects.Our future work will address the generation of DEBs with clinically relevant sizes. The simplicity of the FF microfluidic device makes it easy to scale up, adjust the DEBs size, and produce custom-designed DEBs for drug delivery at the patient’s bedside.

Author Contributions

Conceptualization, M.A.; methodology, M.A.; software, M.A.; validation, M.A; formal analysis, M.A.; investigation, M.A.; resources, A.P.L. and K.Y.L.; data curation, M.A., H.-P.Y. and A.Z.T.; writing—original draft preparation, M.A.; writing—review and editing, M.A., A.P.L. and K.Y.L.; visualization, M.A.; supervision, A.P.L. and K.Y.L.; project administration, A.P.L. and K.Y.L.; funding acquisition, K.Y.L. All authors have read and agreed to the published version of the manuscript.

Funding

This research was funded by a NIH grant, P30 EY034070, The Charles and Judith Fritch Endowment Grant, PR58720, and an unrestricted grant from research to prevent blindness by the Gavin Herbert Eye Institute at the University of California, Irvine.

Data Availability Statement

Data is contained within the article.

Acknowledgments

The authors thank Jui-Yi Chen for her helpful insight regarding microbubble characterization.

Conflicts of Interest

The authors declare no conflict of interest.

References

  1. American Cancer Society. Cancer Facts and Figures 2022; American Cancer Society: Atlanta, GA, USA, 2022. [Google Scholar]
  2. Krzyszczyk, P.; Acevedo, A.; Davidoff, E.J.; Timmins, L.M.; Marrero-Berrios, I.; Patel, M.; White, C.; Lowe, C.; Sherba, J.J.; Hartmanshenn, C.; et al. The growing role of precision and personalized medicine for cancer treatment. Technology 2018, 6, 79–100. [Google Scholar] [CrossRef]
  3. Shapiro, C.L.; Recht, A. Side effects of adjuvant treatment of breast cancer. N. Engl. J. Med. 2001, 344, 1997–2008. [Google Scholar] [CrossRef]
  4. Nurgali, K.; Jagoe, R.T.; Abalo, R. Adverse effects of cancer chemotherapy: Anything new to improve tolerance and reduce sequelae? Front. Pharmacol. 2018, 9, 245. [Google Scholar] [CrossRef]
  5. Ma, H.; He, C.; Cheng, Y.; Yang, Z.; Zang, J.; Liu, J.; Chen, X. Localized co-delivery of doxorubicin, cisplatin, and methotrexate by thermosensitive hydrogels for enhanced osteosarcoma treatment. ACS Appl. Mater. Interfaces 2015, 7, 27040–27048. [Google Scholar] [CrossRef]
  6. Pucci, C.; Martinelli, C.; Ciofani, G. Innovative approaches for cancer treatment: Current perspectives and new challenges. Ecancermedicalscience 2019, 13, 961. [Google Scholar] [CrossRef] [PubMed]
  7. May, J.P.; Li, S.D. Hyperthermia-induced drug targeting. Expert Opin. Drug Deliv. 2013, 10, 511–527. [Google Scholar] [CrossRef] [PubMed]
  8. Klibanov, A.L.; Shevchenko, T.I.; Raju, B.I.; Seip, R.; Chin, C.T. Ultrasound-triggered release of materials entrapped in microbubble–liposome constructs: A tool for targeted drug delivery. J. Control. Release 2010, 148, 13–17. [Google Scholar] [CrossRef]
  9. Wu, G.; Mikhailovsky, A.; Khant, H.A.; Fu, C.; Chiu, W.; Zasadzinski, J.A. Remotely triggered liposome release by near-infrared light absorption via hollow gold nanoshells. J. Am. Chem. Soc. 2008, 130, 8175–8177. [Google Scholar] [CrossRef] [PubMed]
  10. Stride, E.; Segers, T.; Lajoinie, G.; Cherkaoui, S.; Bettinger, T.; Versluis, M.; Borden, M. Microbubble agents: New directions. Ultrasound Med. Biol. 2020, 46, 1326–1343. [Google Scholar] [CrossRef]
  11. Batchelor, D.V.; Abou-Saleh, R.H.; Coletta, P.L.; McLaughlan, J.R.; Peyman, S.A.; Evans, S.D. Nested nanobubbles for ultrasound-triggered drug release. ACS Appl. Mater. Interfaces 2020, 12, 29085–29093. [Google Scholar] [CrossRef]
  12. Unger, E.; Fritz, T.; Shen, D.K.; Lund, P.; Sahn, D.; Ramaswami, R.; Matsunaga, T.; Yellowhair, D.; Kulik, B. Gas fIIIed lipid bilayers as imaging contrast agents. J. Liposome Res. 1994, 4, 861–874. [Google Scholar] [CrossRef]
  13. Capece, S.; Domenici, F.; Brasili, F.; Oddo, L.; Cerroni, B.; Bedini, A.; Bordi, F.; Chiessi, E.; Paradossi, G. Complex interfaces in “phase-change” contrast agents. Phys. Chem. Chem. Phys. 2016, 18, 8378–8388. [Google Scholar] [CrossRef]
  14. Straub, J.A.; Chickering, D.E.; Church, C.C.; Shah, B.; Hanlon, T.; Bernstein, H. Porous PLGA microparticles: AI-700, an intravenously administered ultrasound contrast agent for use in echocardiography. J. Control. Release 2005, 108, 21–32. [Google Scholar] [CrossRef] [PubMed]
  15. Angile, F.E.; Vargo, K.B.; Sehgal, C.M.; Hammer, D.A.; Lee, D. Recombinant protein-stabilized monodisperse microbubbles with tunable size using a valve-based microfluidic device. Langmuir 2014, 30, 12610–12618. [Google Scholar] [CrossRef] [PubMed]
  16. Nesbitt, H.; Sheng, Y.; Kamila, S.; Logan, K.; Thomas, K.; Callan, B.; Taylor, M.A.; Love, M.; O’Rourke, D.; Kelly, P.; et al. Gemcitabine loaded microbubbles for targeted chemo-sonodynamic therapy of pancreatic cancer. J. Control. Release 2018, 279, 8–16. [Google Scholar] [CrossRef]
  17. Yan, F.; Li, L.; Deng, Z.; Jin, Q.; Chen, J.; Yang, W.; Yeh, C.K.; Wu, J.; Shandas, R.; Liu, X.; et al. Paclitaxel-liposome–microbubble complexes as ultrasound-triggered therapeutic drug delivery carriers. J. Control. Release 2013, 166, 246–255. [Google Scholar] [CrossRef]
  18. Peyman, S.A.; Abou-Saleh, R.H.; McLaughlan, J.R.; Ingram, N.; Johnson, B.R.; Critchley, K.; Freear, S.; Evans, J.A.; Markham, A.F.; Coletta, P.L.; et al. Expanding 3D geometry for enhanced on-chip microbubble production and single step formation of liposome modified microbubbles. Lab Chip 2012, 12, 4544–4552. [Google Scholar] [CrossRef]
  19. Bourn, M.D.; Mohajerani, S.Z.; Mavria, G.; Ingram, N.; Coletta, P.L.; Evans, S.; Peyman, S.A. Tumour associated vasculature-on-a-chip for the evaluation of microbubble-mediated delivery of targeted liposomes. Lab Chip 2023, 23, 1674–1693. [Google Scholar] [CrossRef]
  20. Hettiarachchi, K.; Zhang, S.; Feingold, S.; Lee, A.P.; Dayton, P.A. Controllable microfluidic synthesis of multiphase drug-carrying lipospheres for site-targeted therapy. Biotechnol. Prog. 2009, 25, 938–945. [Google Scholar] [CrossRef] [PubMed]
  21. Postema, M.; Gilja, O.H. Ultrasound-directed drug delivery. Curr. Pharm. Biotechnol. 2007, 8, 355–361. [Google Scholar] [CrossRef]
  22. Sanwal, R.; Joshi, K.; Ditmans, M.; Tsai, S.S.; Lee, W.L. Ultrasound and Microbubbles for Targeted Drug Delivery to the Lung Endothelium in ARDS: Cellular Mechanisms and Therapeutic Opportunities. Biomedicines 2021, 9, 803. [Google Scholar] [CrossRef] [PubMed]
  23. Domenici, F.; Capocefalo, A.; Brasili, F.; Bedini, A.; Giliberti, C.; Palomba, R.; Silvestri, I.; Scarpa, S.; Morrone, S.; Paradossi, G.; et al. Ultrasound delivery of Surface Enhanced InfraRed Absorption active gold-nanoprobes into fibroblast cells: A biological study via Synchrotron-based InfraRed microanalysis at single cell level. Sci. Rep. 2019, 9, 11845. [Google Scholar] [CrossRef]
  24. Domenici, F.; Brasili, F.; Giantulli, S.; Cerroni, B.; Bedini, A.; Giliberti, C.; Palomba, R.; Silvestri, I.; Morrone, S.; Paradossi, G.; et al. Differential effects on membrane permeability and viability of human keratinocyte cells undergoing very low intensity megasonic fields. Sci. Rep. 2017, 7, 16536. [Google Scholar] [CrossRef]
  25. Gao, Y.; Chan, C.U.; Gu, Q.; Lin, X.; Zhang, W.; Yeo, D.C.L.; Alsema, A.M.; Arora, M.; Chong, M.S.K.; Shi, P.; et al. Controlled nanoparticle release from stable magnetic microbubble oscillations. NPG Asia Mater. 2016, 8, e260. [Google Scholar] [CrossRef]
  26. Dove, J.D.; Murray, T.W.; Borden, M.A. Enhanced photoacoustic response with plasmonic nanoparticle-templated microbubbles. Soft Matter 2013, 9, 7743–7750. [Google Scholar] [CrossRef]
  27. Meng, Z.; Zhou, X.; She, J.; Zhang, Y.; Feng, L.; Liu, Z. Ultrasound-responsive conversion of microbubbles to nanoparticles to enable background-free in vivo photoacoustic imaging. Nano Lett. 2019, 19, 8109–8117. [Google Scholar] [CrossRef] [PubMed]
  28. Talu, E.; Hettiarachchi, K.; Powell, R.L.; Lee, A.P.; Dayton, P.A.; Longo, M.L. Maintaining monodispersity in a microbubble population formed by flow-focusing. Langmuir 2008, 24, 1745–1749. [Google Scholar] [CrossRef]
  29. Hettiarachchi, K.; Talu, E.; Longo, M.L.; Dayton, P.A.; Lee, A.P. On-chip generation of microbubbles as a practical technology for manufacturing contrast agents for ultrasonic imaging. Lab Chip 2007, 7, 463–468. [Google Scholar] [CrossRef] [PubMed]
  30. Shih, R.; Bardin, D.; Martz, T.D.; Sheeran, P.S.; Dayton, P.A.; Lee, A.P. Flow-focusing regimes for accelerated production of monodisperse drug-loadable microbubbles toward clinical-scale applications. Lab Chip 2013, 13, 4816–4826. [Google Scholar] [CrossRef]
  31. Churchman, A.H.; Mico, V.; De Pablo, J.G.; Peyman, S.A.; Freear, S.; Evans, S.D. Combined flow-focus and self-assembly routes for the formation of lipid stabilized oil-shell microbubbles. Microsystems Nanoeng. 2018, 4, 17087. [Google Scholar] [CrossRef]
  32. Hayward, R.C.; Utada, A.S.; Dan, N.; Weitz, D.A. Dewetting instability during the formation of polymersomes from block-copolymer-stabilized double emulsions. Langmuir 2006, 22, 4457–4461. [Google Scholar] [CrossRef] [PubMed]
  33. McDonald, J.C.; Duffy, D.C.; Anderson, J.R.; Chiu, D.T.; Wu, H.; Schueller, O.J.; Whitesides, G.M. Fabrication of microfluidic systems in poly (dimethylsiloxane). Electrophoresis 2000, 21, 27–40. [Google Scholar] [CrossRef]
  34. Vallejo, D.; Lee, S.; Lee, D.; Zhang, C.; Rapier, C.; Chessler, S.; Lee, A. Cell-sized lipid vesicles for cell–cell synaptic therapies. Technology 2017, 5, 201–213. [Google Scholar] [CrossRef]
  35. Segers, T.; Lassus, A.; Bussat, P.; Gaud, E.; Frinking, P. Improved coalescence stability of monodisperse phospholipid-coated microbubbles formed by flow-focusing at elevated temperatures. Lab Chip 2019, 19, 158–167. [Google Scholar] [CrossRef] [PubMed]
  36. Segers, T.; Lohse, D.; Versluis, M.; Frinking, P. Universal equations for the coalescence probability and long-term size stability of phospholipid-coated monodisperse microbubbles formed by flow focusing. Langmuir 2017, 33, 10329–10339. [Google Scholar] [CrossRef]
  37. Kwan, J.J.; Borden, M.A. Microbubble dissolution in a multigas environment. Langmuir 2010, 26, 6542–6548. [Google Scholar] [CrossRef]
  38. Pham, D.L.; Xu, C.; Prince, J.L. Current methods in medical image segmentation. Annu. Rev. Biomed. Eng. 2000, 2, 315–337. [Google Scholar] [CrossRef]
  39. Pal, N.R.; Pal, S.K. A review on image segmentation techniques. Pattern Recognit. 1993, 26, 1277–1294. [Google Scholar] [CrossRef]
  40. Seo, H.; Badiei Khuzani, M.; Vasudevan, V.; Huang, C.; Ren, H.; Xiao, R.; Jia, X.; Xing, L. Machine learning techniques for biomedical image segmentation: An overview of technical aspects and introduction to state-of-art applications. Med Phys. 2020, 47, e148–e167. [Google Scholar] [CrossRef]
  41. Arzt, M.; Deschamps, J.; Schmied, C.; Pietzsch, T.; Schmidt, D.; Tomancak, P.; Haase, R.; Jug, F. LABKIT: Labeling and segmentation toolkit for big image data. Front. Comput. Sci. 2022, 4, 10. [Google Scholar] [CrossRef]
  42. Schroff, F.; Criminisi, A.; Zisserman, A. Object Class Segmentation using Random Forests. In Proceedings of the BMVC, Leeds, UK, 1–4 September 2008; pp. 1–10. [Google Scholar]
  43. Shum, H.C.; Santanach-Carreras, E.; Kim, J.W.; Ehrlicher, A.; Bibette, J.; Weitz, D.A. Dewetting-induced membrane formation by adhesion of amphiphile-laden interfaces. J. Am. Chem. Soc. 2011, 133, 4420–4426. [Google Scholar] [CrossRef] [PubMed]
  44. Deng, N.N.; Yelleswarapu, M.; Huck, W.T. Monodisperse uni-and multicompartment liposomes. J. Am. Chem. Soc. 2016, 138, 7584–7591. [Google Scholar] [CrossRef] [PubMed]
  45. Segers, T.; De Rond, L.; De Jong, N.; Borden, M.; Versluis, M. Stability of monodisperse phospholipid-coated microbubbles formed by flow-focusing at high production rates. Langmuir 2016, 32, 3937–3944. [Google Scholar] [CrossRef]
  46. Segers, T.; Gaud, E.; Casqueiro, G.; Lassus, A.; Versluis, M.; Frinking, P. Foam-free monodisperse lipid-coated ultrasound contrast agent synthesis by flow-focusing through multi-gas-component microbubble stabilization. Appl. Phys. Lett. 2020, 116, 173701. [Google Scholar] [CrossRef]
  47. Zalloum, I.O.; Paknahad, A.A.; Kolios, M.C.; Karshafian, R.; Tsai, S.S. Controlled Shrinkage of Microfluidically Generated Microbubbles by Tuning Lipid Concentration. Langmuir 2022, 38, 13021–13029. [Google Scholar] [CrossRef]
  48. Cerezo, J.; Zuniga, J.; Bastida, A.; Requena, A.; Ceron-Carrasco, J.P. Atomistic molecular dynamics simulations of the interactions of oleic and 2-hydroxyoleic acids with phosphatidylcholine bilayers. J. Phys. Chem. B 2011, 115, 11727–11738. [Google Scholar] [CrossRef] [PubMed]
  49. Kurniawan, J.; Suga, K.; Kuhl, T.L. Interaction forces and membrane charge tunability: Oleic acid containing membranes in different pH conditions. Biochim. Biophys. Acta-(BBA)-Biomembr. 2017, 1859, 211–217. [Google Scholar] [CrossRef]
  50. Fredrick, E.; Walstra, P.; Dewettinck, K. Factors governing partial coalescence in oil-in-water emulsions. Adv. Colloid Interface Sci. 2010, 153, 30–42. [Google Scholar] [CrossRef]
  51. Chen, W.; Yu, B.; Wei, Z.; Mao, S.; Li, T. The creation of raspberry-like droplets and their coalescence dynamics: An ideal model for certain biological processes. J. Colloid Interface Sci. 2022, 615, 752–758. [Google Scholar] [CrossRef]
  52. Pickering, S.U. Cxcvi.—Emulsions. J. Chem. Soc. Trans. 1907, 91, 2001–2021. [Google Scholar] [CrossRef]
  53. Pan, M.; Rosenfeld, L.; Kim, M.; Xu, M.; Lin, E.; Derda, R.; Tang, S.K. Fluorinated pickering emulsions impede interfacial transport and form rigid interface for the growth of anchorage-dependent cells. ACS Appl. Mater. Interfaces 2014, 6, 21446–21453. [Google Scholar] [CrossRef] [PubMed]
  54. Azmin, M.; Mohamedi, G.; Edirisinghe, M.; Stride, E. Dissolution of coated microbubbles: The effect of nanoparticles and surfactant concentration. Mater. Sci. Eng. C 2012, 32, 2654–2658. [Google Scholar] [CrossRef]
  55. Yang, Y.; Fang, Z.; Chen, X.; Zhang, W.; Xie, Y.; Chen, Y.; Liu, Z.; Yuan, W. An overview of Pickering emulsions: Solid-particle materials, classification, morphology, and applications. Front. Pharmacol. 2017, 8, 287. [Google Scholar] [CrossRef] [PubMed]
  56. Mohamedi, G.; Azmin, M.; Pastoriza-Santos, I.; Huang, V.; Perez-Juste, J.; Liz-Marzan, L.M.; Edirisinghe, M.; Stride, E. Effects of gold nanoparticles on the stability of microbubbles. Langmuir 2012, 28, 13808–13815. [Google Scholar] [CrossRef]
  57. Yoon, Y.I.; Pang, X.; Jung, S.; Zhang, G.; Kong, M.; Liu, G.; Chen, X. Smart gold nanoparticle-stabilized ultrasound microbubbles as cancer theranostics. J. Mater. Chem. B 2018, 6, 3235–3239. [Google Scholar] [CrossRef] [PubMed]
  58. Tay, L.M.; Xu, C. Coating microbubbles with nanoparticles for medical imaging and drug delivery. Nanomedicine 2017, 12, 91–94. [Google Scholar] [CrossRef]
  59. Palmieri, D.; Brasili, F.; Capocefalo, A.; Bizien, T.; Angelini, I.; Oddo, L.; Toumia, Y.; Paradossi, G.; Domenici, F. Improved hybrid-shell perfluorocarbon microdroplets as ultrasound-and laser-activated phase-change platform. Colloids Surfaces A Physicochem. Eng. Asp. 2022, 641, 128522. [Google Scholar] [CrossRef]
Figure 1. Experimental setup demonstration of the DEB production. The liquid phases were delivered using syringe pumps, while the gas phase was directly delivered from a pressurized cylinder; two regulators were attached for precise pressure control. The microfluidic device was positioned on an inverted microscope attached to a high-speed camera for real-time observation of the DEB generation. The DEBs were collected in a vial attached to the outlet of the FF device.
Colloids 07 00034 g001
Figure 2. Initial size distribution of the microbubbles generated inside the microfluidic device, using the (a) F2 and (b) F3 lipid solutions. The legend shows the polydispersity index of the respective populations.
Colloids 07 00034 g002
Figure 3. (a) Schematic demonstration of the FF device used for DEBs generation (gray: internal gas phase; yellow: oil (oleic acid) phase; blue: external aqueous phase containing phospholipids and surfactant in PBS). (b) Schematic illustration of off-chip dewetting and its attributed features. (c) Snapshot of the microfluidic device during DEB production.(d) Off-chip dewetting of the microbubbles.
Colloids 07 00034 g003
Figure 4. Morphologies of the dual-layer microbubbles created with F2 (af), F4 (gl), and F6 (mr) lipid formulations, after 10, 20, and 30 min. The solid white circles mark the dewetted microbubbles, the dashed white circles mark the capillary bridge formation between microbubbles, solid yellow circles mark regions with dewetted oil droplets, and the dashed yellow circles mark FA-rich micro-regions. The scale bar is 25 µm.
Colloids 07 00034 g004
Figure 5. Dimensionless average diameter of the DEBs over time in different lipid formulations. For each formula, three experiments were conducted, and the solid shape in the graph represents the mean value. The error bars on the graph indicate the standard deviation of the sample.
Colloids 07 00034 g005
Figure 6. The total number of dewetted oil droplets identified in DEB samples after 30 min post-production, using various lipid formulations.
Colloids 07 00034 g006
Figure 7. Microstructural evolution of the GNP–phospholipid-stabilized dual-layer microbubbles created with F3 (af), F5 (gl) and F7 (mr), after 10, 20, and 30 min. The dashed white circles mark the capillary bridge formation between microbubbles, and solid yellow circles mark regions with advancing oil droplets. The scale bar is 25 µm.
Colloids 07 00034 g007
Figure 8. Concentration of DEBs (a) immediately after generation and (b) after 60 min, using F6 and F7 formulations.
Colloids 07 00034 g008
Figure 9. (a) Bright-field and (b) fluorescent image of the DEBs made using CY3-functionalized GNPs. The yellow line annotated as "ROI" marks the region-of-interest. (c) Fluorescent intensity measurement along the ROI, as marked on the fluorescent image. The scale bar is 50 µm.
Colloids 07 00034 g009
Table 1. Different lipid phase formulations.
Formulation ReferenceTotal Lipid ConcentrationGNP Concentration
F10.83 mg/mL0 Particles/mL
F21.19 mg/mL0 Particles/mL
F31.19 mg/mL1013 Particles/mL
F41.56 mg/mL0 Particles/mL
F51.56 mg/mL1013 Particles/mL
F62.45 mg/mL0 Particles/mL
F72.45 mg/mL1013 Particles/mL
Table 2. Microbubble production parameters.
SolutionPressure/Flow Rate
Lipid phase40–45 µL/min
Gas phase27.5–34.5 KPa
Oil phase0.1 µL/min
Table 3. Purpose of the fluorophore study and their excitation/emission wavelengths.
Fluorophore TypeFluorophore PurposeExcitation/Emission Wavelength (nm)
Nile redVisualization of the oil layer, Wavelength and DEB structural integrity559/635
CY3Visualization of the GNP protective Wavelength shell on the GNP-DEBs555/570
Disclaimer/Publisher’s Note: The statements, opinions and data contained in all publications are solely those of the individual author(s) and contributor(s) and not of MDPI and/or the editor(s). MDPI and/or the editor(s) disclaim responsibility for any injury to people or property resulting from any ideas, methods, instructions or products referred to in the content.

