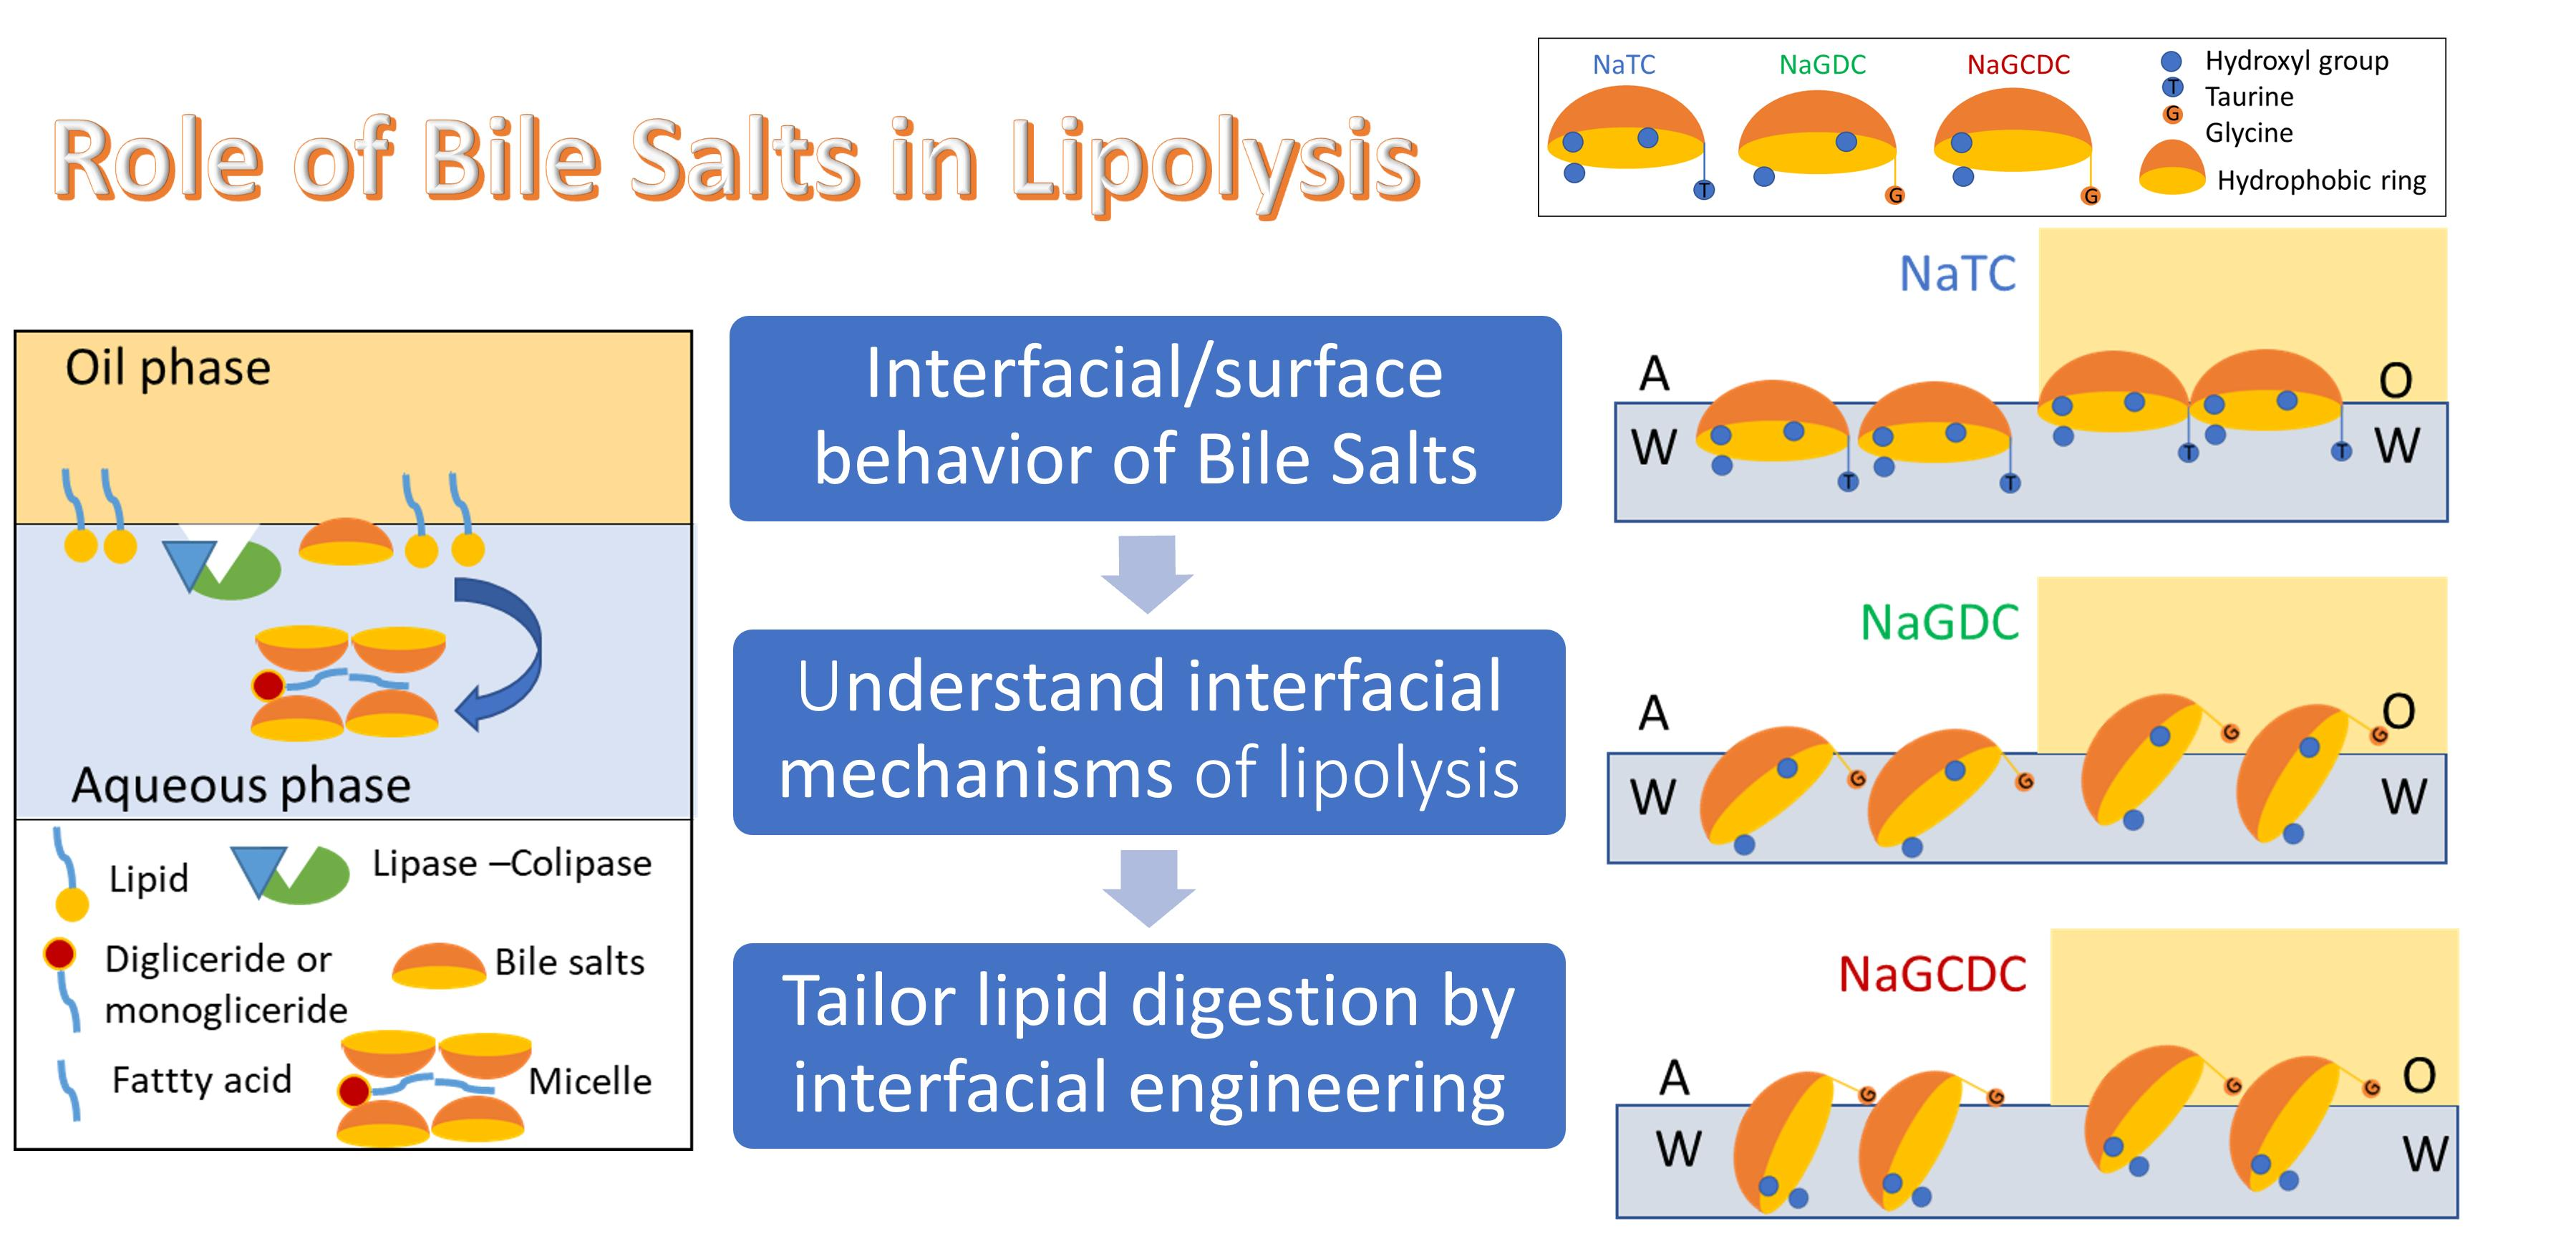
As already stated, BS are surface active molecules with a planar structure which impacts the surface/interfacial activity compared with linear amphiphilic molecules with a head–tail distribution (head-hydrophilic and tail-hydrophobic). The structure of BS resembles a spoon where the convex part is hydrophobic and the concave is hydrophilic, and it contains conjugation groups (Glycine or Taurine) and hydroxyl groups (two or three) [
2,
3]. This peculiar structure promotes rapid adsorption onto surfaces/interfaces, which facilitates lipolysis, and the formation of fluid and mobile films, which facilitate the transport of lipolytic products [
2,
3]. The adsorption rate and the interfacial attachment can be assessed by measuring the adsorption and desorption profiles of BS at air– or oil–water interfaces, respectively [
9]. First, the adsorption isotherms of three BS (NaTC, NaGDC and NaGCDG) are compared at air/oil–water interfaces. Second, the desorption of these BS is analyzed at the two interfaces. Finally, the dilatational moduli of BS films adsorbed at air/oil–water interfaces are reported. Combined analysis provides new information on the mechanical and structural properties of BS films and how they impact functionality through adsorption/desorption.
3.1. Adsorption of BS onto Air–Water and Oil–Water Interfaces
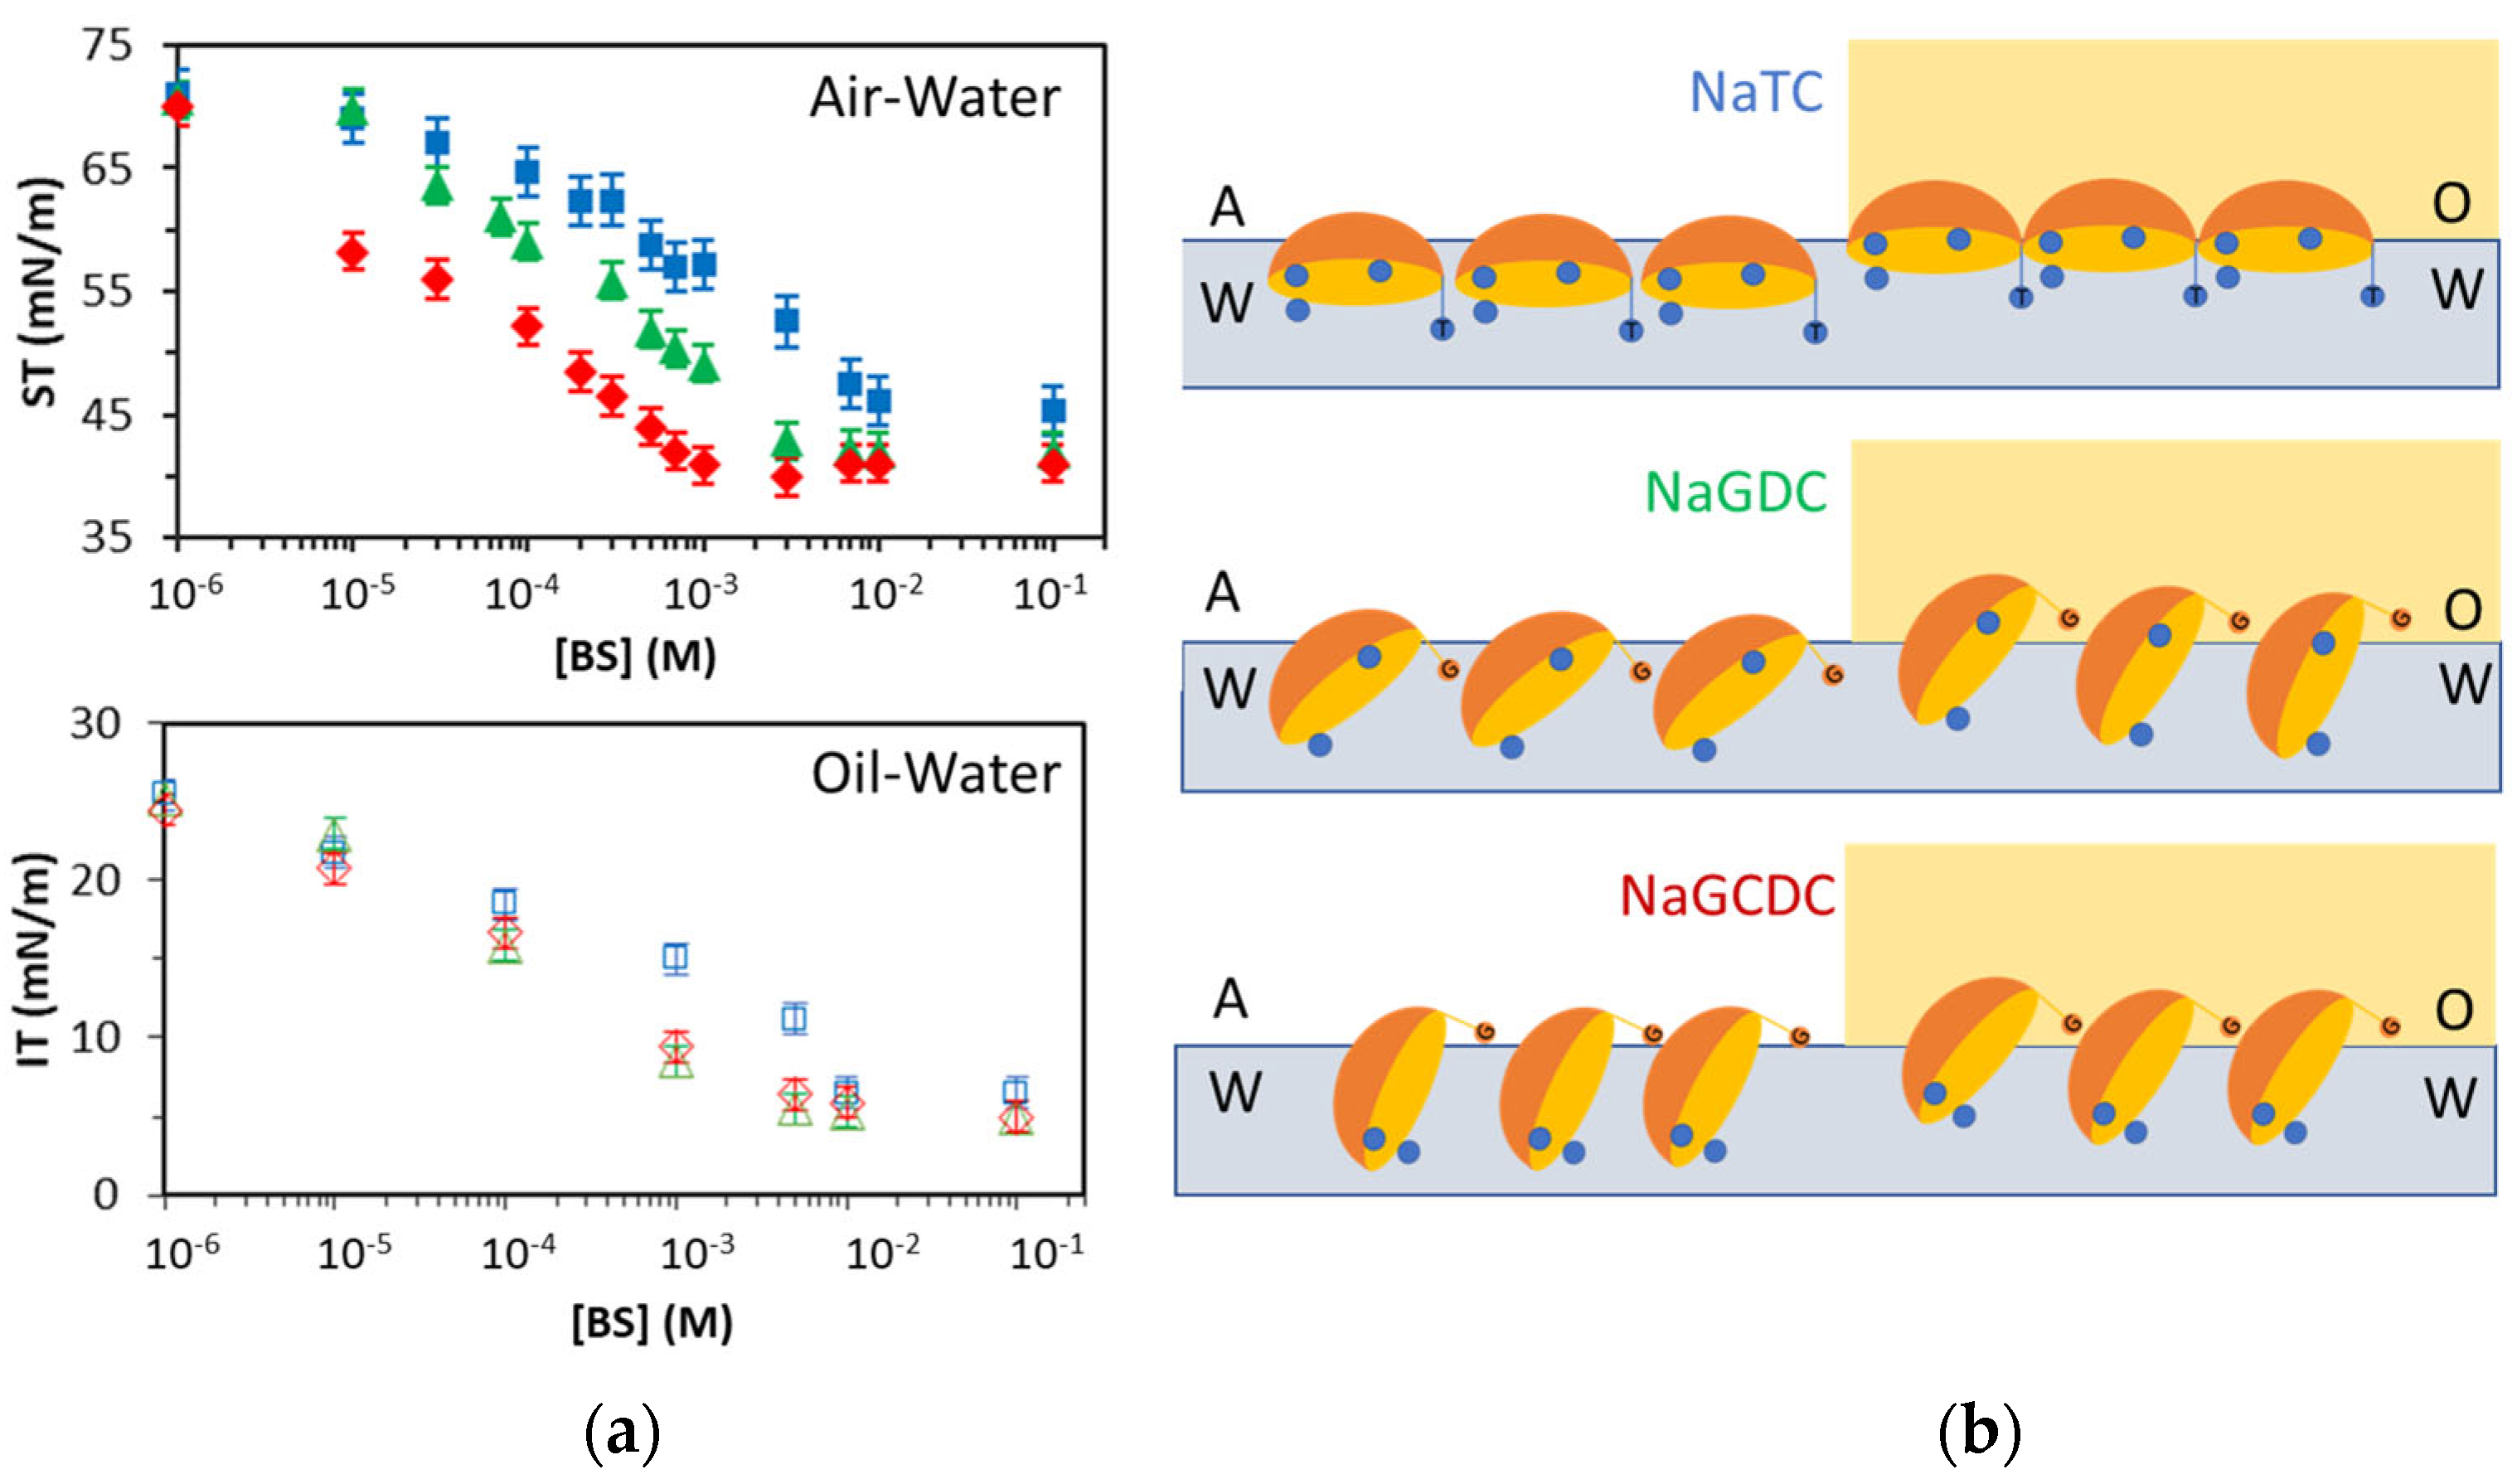
Figure 3a shows the surface/interfacial tension attained after 1 h adsorption of different concentrations of NaTC, NaGDC and NaGCDC at air/oil–water interfaces. At the lowest concentrations, the values remain close to that of clean air/oil–water interfaces. This is due to the number of molecules adsorbed being low and non-interacting, so the surface/interface tension remains unchanged. As the number of adsorbed molecules increases at the interface, the surface/interfacial tension decreases. Above a certain critical concentration, the surface/interfacial tension becomes independent of the concentration. This critical concentration is called the Critical Micelle Concentration (CMC) of amphiphiles and is determined by the chemical potential balance between a micelle and a monomer surfactant. In micelles, amphiphilic molecules orient their hydrophilic heads outwards and the hydrophobic tails inwards. Hence, the surface of micelles is hydrophilic and does not have surface/interfacial activity. Concerning the minimum value of the surface tension (
Figure 3a), this is reached at the air–water interface (around 45 mN/m), and it is relatively high compared to values reached by linear head–tail surfactants [
21]. Conversely, at the oil–water interface, the interfacial tension reaches quite low values (below 10 mN/m) (
Figure 3a). This fact already indicates possible differences in the lateral packing of BS at air/oil–water interfaces, owing to a hydrophobic interaction with the oil. Also, the shape of the isotherms shows slight slope discontinuities in agreement with literature reports [
22].
A remarkable feature in
Figure 3a is that different BS display significant differences in their adsorption isotherms at the air–water interface, while these differences seem to diminish at the oil–water interface (
Figure 3a). At the air–water interface, NaGCDC appears more surface active, followed by NaGDC and NaTC (
Figure 3a). Conversely, at the oil–water interface, the adsorption isotherms of NaGDC and NaGCDC overlap, while NaTC appears just slightly displaced to higher bulk concentrations, indicative of lower interfacial activity (
Figure 3a). The trends are similar at air/oil interfaces; the presence of Taurine (NaTC) reduces the surface/interfacial activity compared to Glycine (NaGDC and NaGCDC). This trend also correlates with other studies reporting that the amphiphilicity of BS is influenced by the Cholate conjugation group, with Glycine-conjugates being more hydrophobic than Tauro-conjugates [
9,
22].
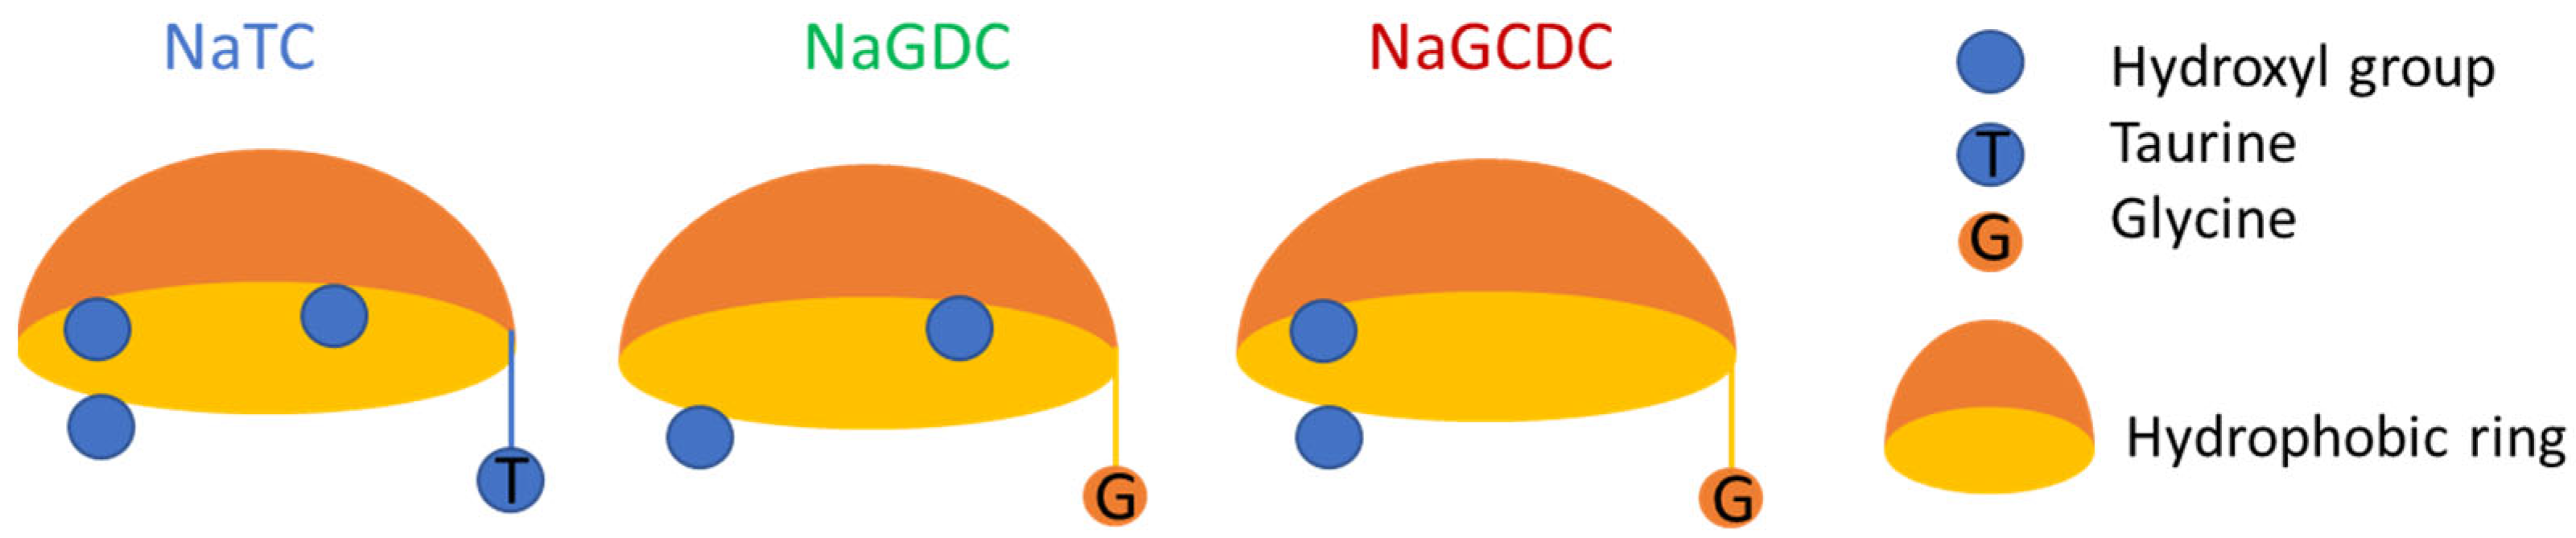
Apart from the conjugation group, the number and position of hydroxyl groups in BS (
Figure 1) also affect the adsorption isotherms recorded (
Figure 3a). At the air–water interface, the surface activity of BS decreases in this order: Chenodeoxycholate > Deoxycholate > Cholate. At the oil–water interface, the interfacial activity follows this trend: Chenodeoxycholate = Deoxycholate > Cholate. This can be further appreciated by analyzing the values of the CMCs as calculated in
Figure 3a. In fact, CMCs are clearly identified at the air–water interface, with the lowest CMC value obtained for Chenodeoxycholate (NaGCDC, ~1 mM), closely followed by Deoxycholate (NaGDC, ~2 mM), while the highest CMC corresponds to Cholate (NaTC, ~10 mM). These results agree qualitatively with those reported in the literature for BS [
1,
3]. An explanation for this is found in Cholate having three hydroxyl groups (
Figure 1) and therefore being more hydrophilic. Thus, it provides a lower surface/interfacial activity and higher CMC (
Figure 3a). Chenodeoxycholate and Deoxycholate both have two hydroxyl groups (
Figure 1) and hence provide more similar CMCs, which are lower than Cholate’s (
Figure 3a). Then again, the position and proximity of the two hydroxyl groups (3 and 7) at the bottom of the rigid steroid ring might explain the slight but significant difference in CMCs spotted at the air–water interface for NaGCDC and NaGDC (
Figure 3a).
Figure 3b shows a schematic diagram of a possible packing and orientation of BS at the air/oil–water interface. This representation (
Figure 3b) is hypothesized in view of the surface/interfacial activity and CMCs inferred from
Figure 3a. However, a more detailed analysis of the displacements and orientations of BS at interfaces would be required to ensure the validity of the representation depicted. It is hypothesized that NaTC should lie rather planar at the surface orienting hydrophilic Taurine and three hydroxyls towards the water. Conversely, NaGDC and NaGCDC should lie more vertically, orienting the more hydrophobic Glycine towards the air phase. This verticality could be favored by the close positions of hydroxyl groups in NaGCDC, which tend to remain in the water (
Figure 3b). This proposed improved packing would also explain the lowest surface tension values obtained for NaGCDC followed by NaGDC and NaTC.
The CMC values are less distinguishable at the oil–water interface as the curves appear smoother (
Figure 3a). However, the obtained results correlate with findings at the air–water interface, producing a similar CMC for Cholate (NaTC, ~10 mM); this is again higher than Chenodeoxycholate and Deoxycholate, which now show a similar CMC (~3 mM). This value is slightly higher than that obtained at the air–water interface and this again correlates with an improved packing achieved at the oil–water interface. This agrees with orientational differences of BS upon adsorption onto air/oil–water interfaces as proposed in
Figure 3b. Other authors report different surface/interfacial activity of surfactants. Wojciechowski et al. showed a higher interfacial activity of the Quillaja bark saponin at an olive oil–water interface compared to an air–water interface [
23]. Similar results have been published recently, where sunflower proteins adsorbed differently at air/oil–water interfaces [
24]. A recent work compared the adsorption of surfactants onto different fluid interfaces and claimed that linear surfactants compete with polar oil molecules at the interface, resulting in a lower interfacial packing and larger interfacial area at oil–water interfaces [
21]. However, findings from
Figure 3a suggest a different trend when comparing BS at air/oil–water interfaces, which are depicted in
Figure 3b. At the air–water interface, the lack of hydrophobic interactions with the air phase might result in lower surface packing and larger molecular areas while the BS molecules protrude into the oil phase, hence compensating for the orientational differences at the air–water interface and explaining the more similar behavior found for BS adsorption onto an oil–water interface. Furthermore, an improved packing at the oil–water interface would also explain the low values of interfacial tension reached and the higher CMCs obtained for BS at oil–water interfaces (
Figure 3).
3.2. Desorption of BS from Air–Water and Oil–Water Interfaces
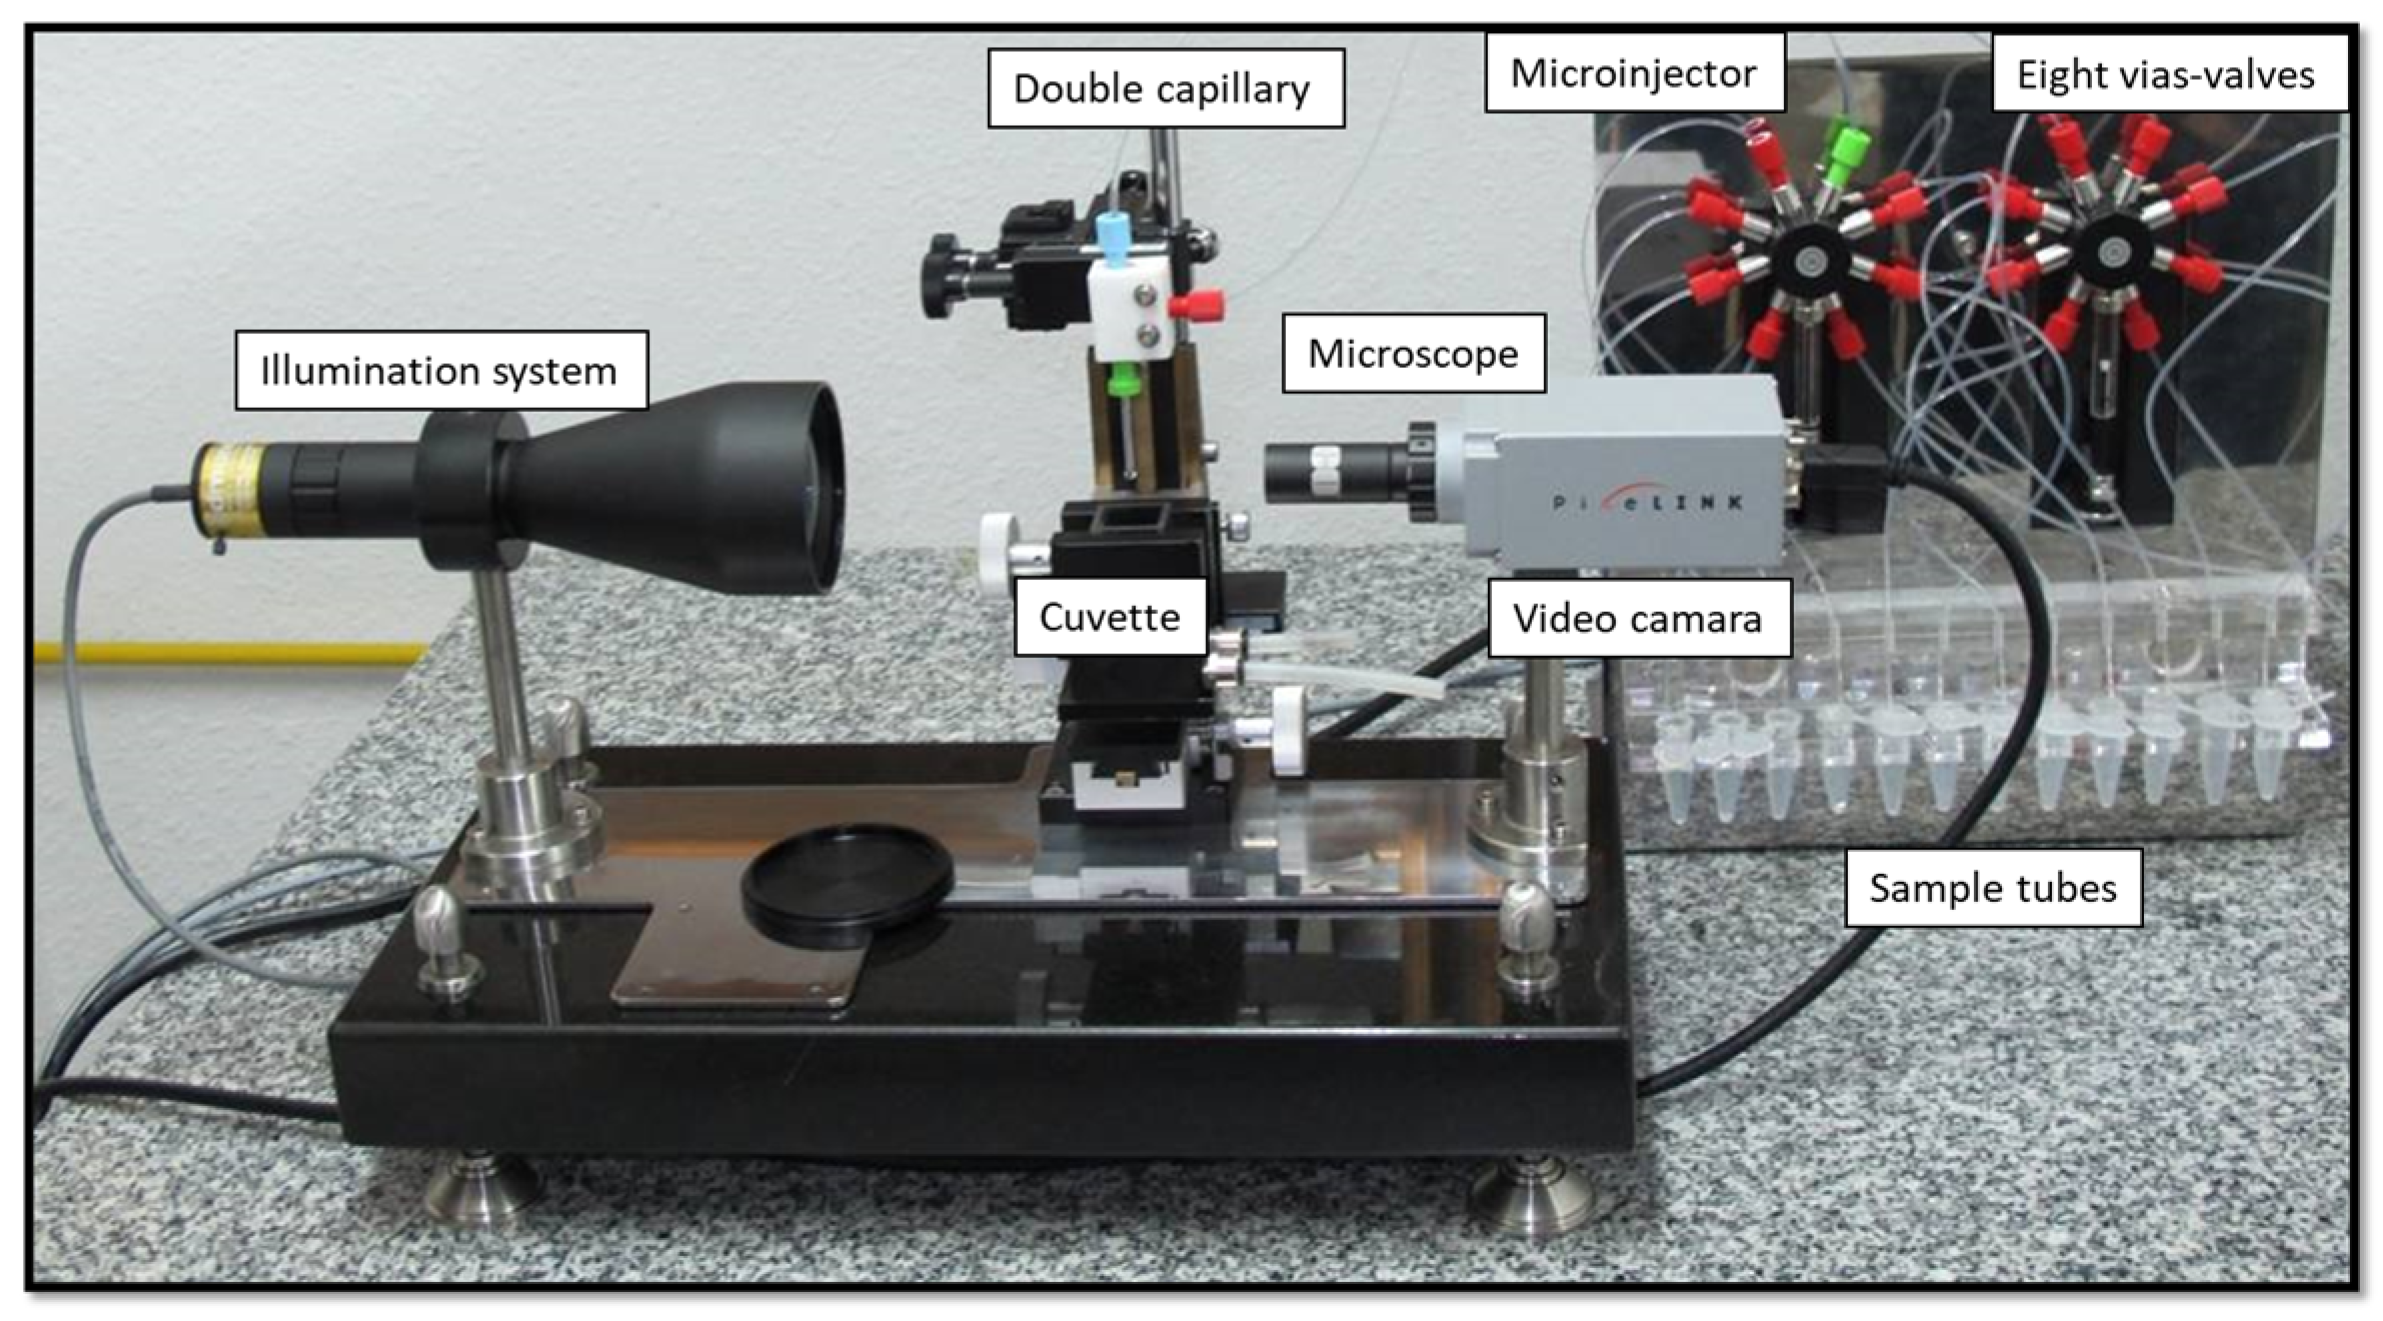
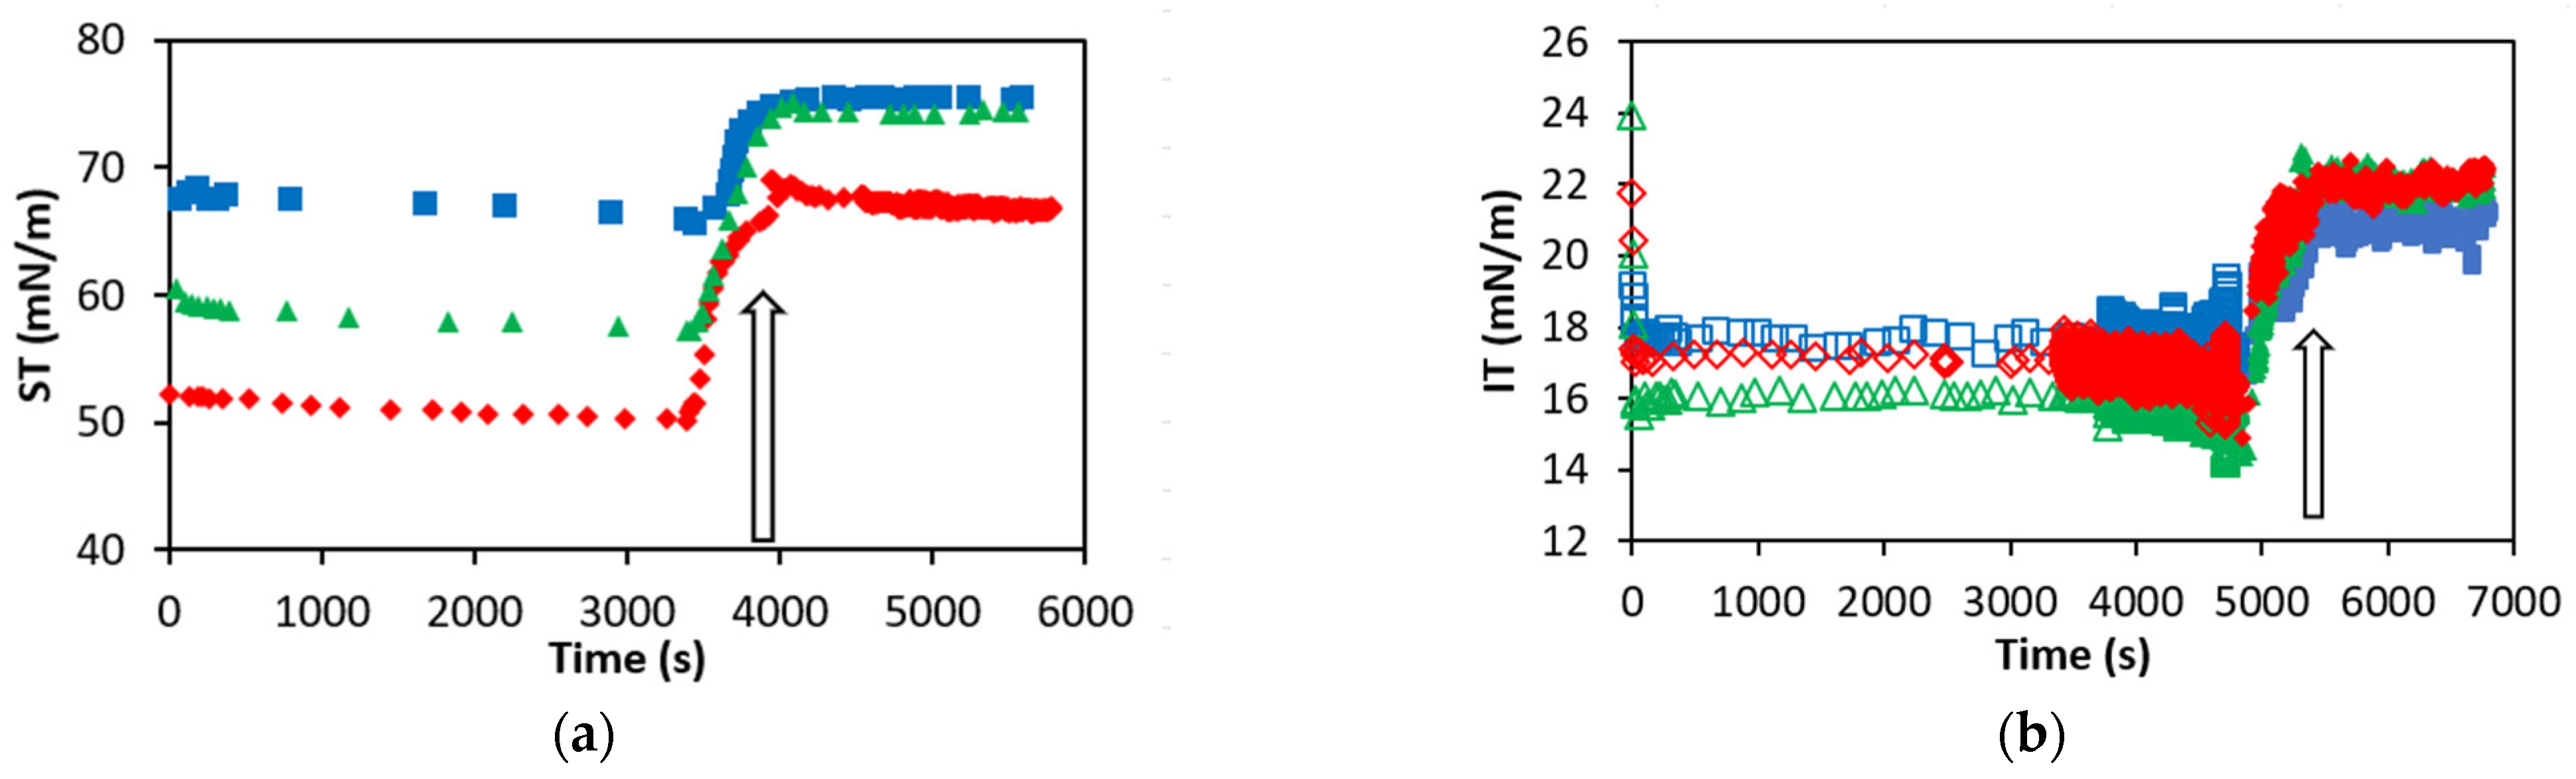
Figure 4 shows the dynamic adsorption–desorption profiles recorded with the OCTOPUS for NaTC, NaGCD and NaGCDC at a single concentration of 0.1 mM at the air–water (
Figure 4a) and at the oil–water (
Figure 4b) interfaces.
Figure 4 again highlights significant differences between the adsorption/desorption profiles of different BS at the air/water interface which practically vanish at the oil–water interface. At the air–water interface (
Figure 4a), the adsorption process is very rapid, and a practically constant value of surface tension is reached immediately after drop formation. At the oil–water interface (
Figure 4b), the adsorption process is also very rapid, but some dynamic data are recorded within the first seconds. Nonetheless, the adsorption kinetics of BS is hardly measurable by pendant drop tensiometry, and hence only steady-state values of surface/interfacial tension will be discussed herein. This result differs from proteins which show a slower dynamic of adsorption at the air/oil–water interface [
15,
16,
25]. The different adsorption behaviour of NaTC, NaGDC and NaGCDC at the air–water interface has already been discussed in the previous section.
Figure 4 shows that NaTC attained a final surface tension of 65 ± 2 mN m
−1, NaGDC reached 55 ± 2 mN m
−1 and NaGCDC reached 50 ± 2 mN m
−1 (air–water). This trend is consistent with Taurine being more hydrophilic and NaTC having three hydroxyl groups, as discussed in detail above. Conversely, the more hydrophobic Glycine is possibly responsible for the lower surface tension reached by NaGDC and NaGCDC (
Figure 3a). Finally, the different positions of hydroxyl groups in Deoxycholate and Chenodeoxycholate could explain differences in the surface tension attained for NaGDC and NaGCDC. As discussed above, we hypothesize that the closer position of hydroxyl groups in NaGCDC might result in a more vertical orientation of the molecule allowing for better packing and explaining the lower surface tensions (
Figure 3). The desorption profile reported for BS at the air–water was analyzed by the evolution of the surface tension as the bulk subphase of the drop is exchanged with buffer, and it is indicated with an arrow in
Figure 4. At the air–water interface (
Figure 4a), the surface tension increases after subphase exchange. In particular, for NaTC and NaGCD, the surface tension practically recovers the value of the clean air–water interface and is hence indicative of complete desorption of the adsorbed layer. In contrast, for NaGCDC, the surface tension increases after subphase exchange but does not recover the value corresponding to the clean interface. Accordingly, some irreversibly adsorbed NaGCDC remains at the surface after bulk depletion, at least at this bulk concentration (
Figure 4a).
Figure 4b shows the adsorption and desorption profiles of the three BS recorded at the oil–water interface. The interfacial tensions attained after 1 h of adsorption were between 17 and 15 mN/m, and the curves practically overlap. This is consistent with findings from
Figure 3a and the proposed orientation of BS monolayers depicted in
Figure 3b. Concerning the desorption profile, in all three cases, the interfacial tension increased after the subphase exchange but did not recover the value of the clean oil–water interface. Accordingly, some irreversibly adsorbed BS remain at the oil–water interface for NaTC, NaGDC and NaGCDC (
Figure 4). A reason for this could again originate from the improved hydrophobic interaction with the oil as proposed in
Figure 3b.
The dynamic curves shown in
Figure 4 reveal important differences in the adsorption/desorption profiles of BS at air/oil–water interfaces. Therefore, the adsorption/desorption profiles of BS were measured for the rest of the concentrations plotted in the adsorption isotherms (
Figure 3), and the results are summarized in
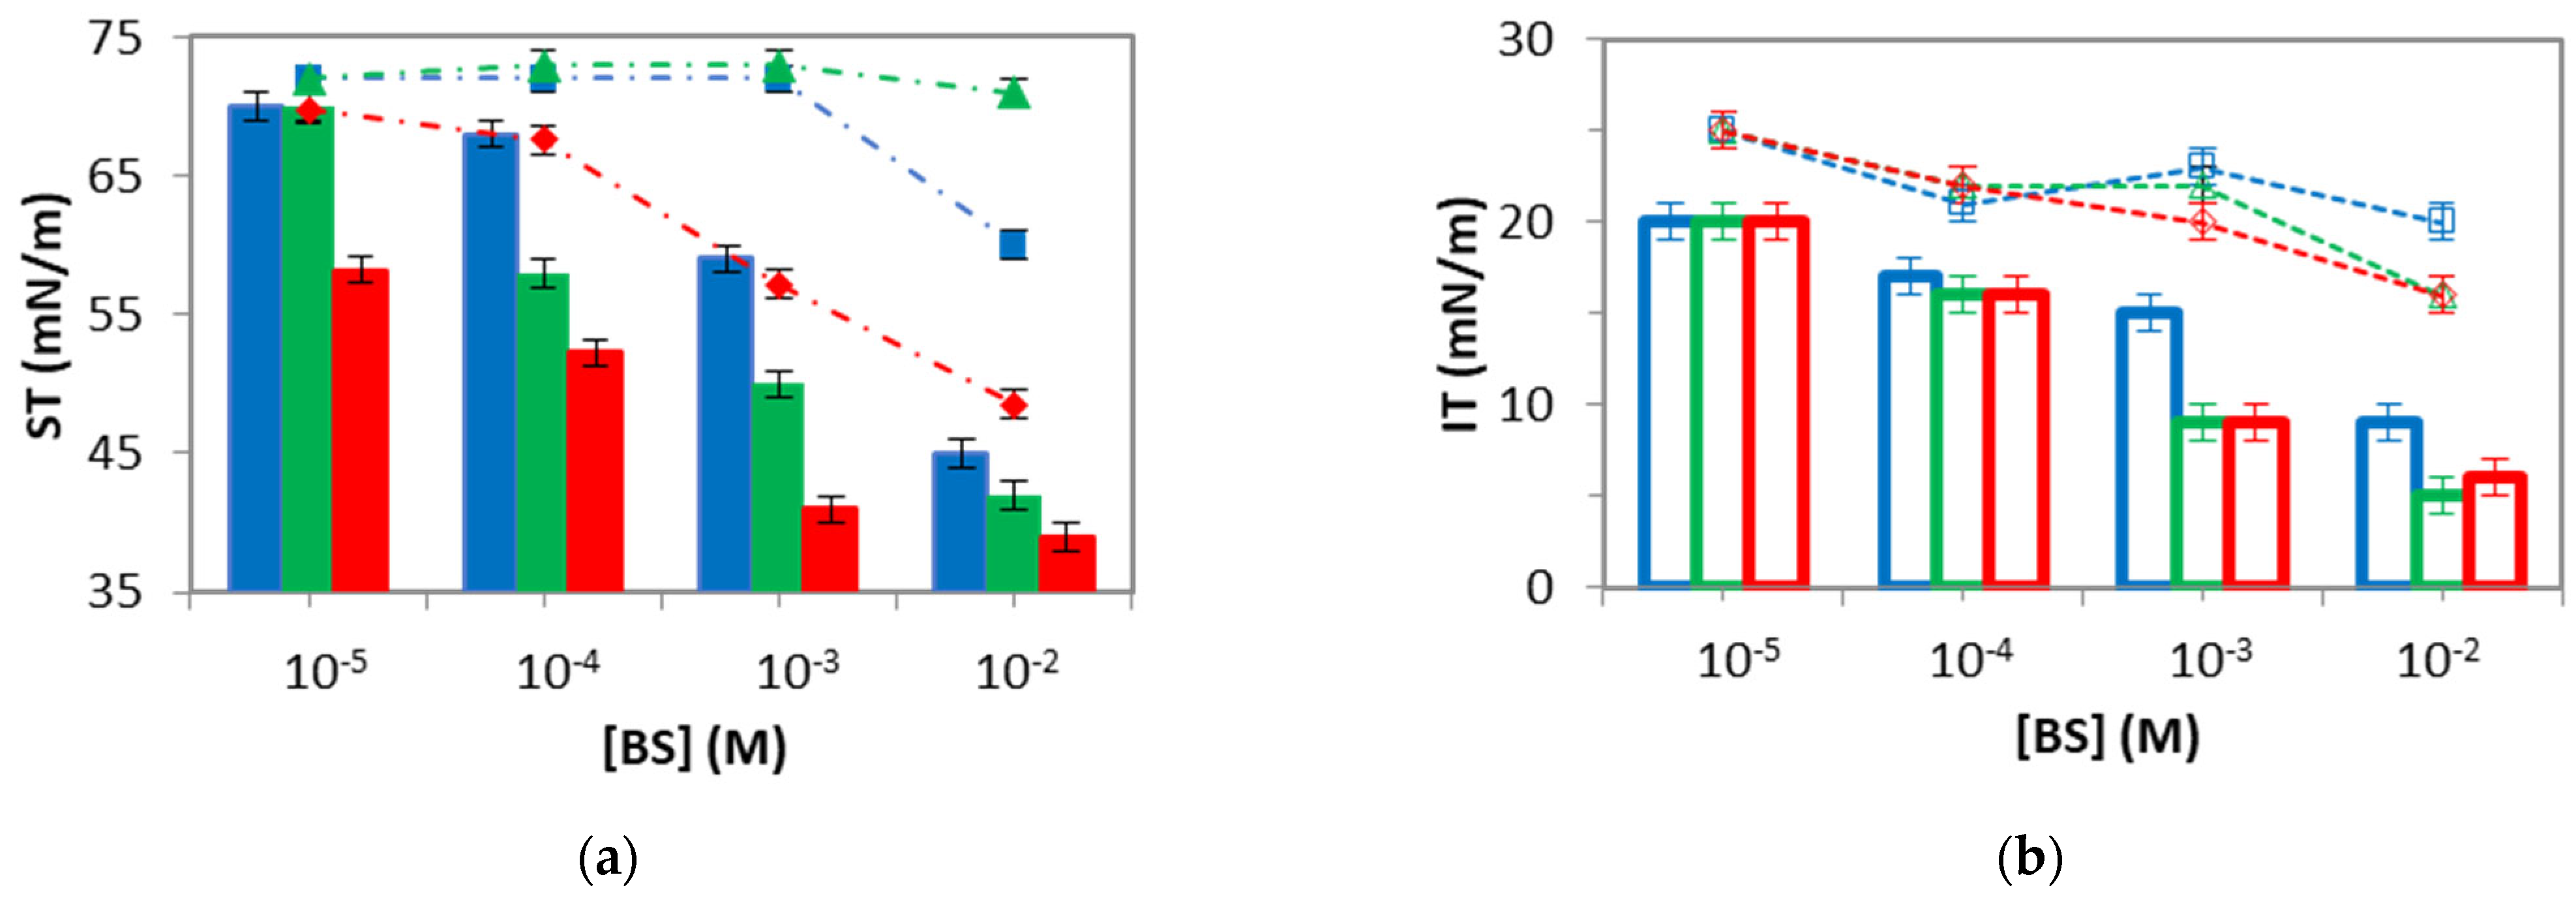
Figure 5, namely, the steady state surface/interfacial tension attained after adsorption/desorption of BS at the air–water (
Figure 5a) and at the oil–water (
Figure 5b) interfaces during the 1 h period. Again, it is worth mentioning the differences between the desorption of BS from the air–water interface (
Figure 5a), which practically vanish at the oil–water interface (
Figure 5b).
At the air–water interface (
Figure 5a), the surface tension obtained after desorption revealed the presence of different irreversibly adsorbed layers. In all cases, the amount of irreversibly adsorbed material increased as the bulk concentration increased, shown by the lower surface tensions obtained after desorption for the highest concentrations. This has been already reported in the literature and is related to surface aggregation/complexation at high concentrations of BS [
8,
9]. However, the three BS analyzed also display subtle differences in the desorption profiles at the air–water interface (
Figure 5a). NaGDC fully desorbs from the surface as the surface tension recovers the value of the pure air–water interface within all the concentration ranges. NaTC reveals the presence of irreversibly adsorbed film only at the highest bulk concentration (10 mM). Finally, NaGCDC shows an irreversibly adsorbed layer at a concentration above 1 mM. Differently, at the oil–water interface (
Figure 5b), in all cases, the interfacial tension obtained after desorption revealed the presence of some irreversibly adsorbed material, especially for Glycine-conjugates, as measured by the lower interfacial tension of 10 mM curves obtained for NaGDC and NaGCDC after desorption. This trend agrees with the more hydrophobic nature of Glycine compared to Taurine and again suggests the existence of hydrophobic interactions with oil promoting irreversible adsorption to some extent, maybe via surface complexation, as suggested by [
8].
The adsorption/desorption profiles of BS from a solid surface were studied by dual polarization interferometry by Parker et al. [
6]. Remarkably, the results obtained therein reproduce qualitatively the observed trend here for BS desorption at the air–water interface (
Figure 4a and
Figure 5a). Specifically, Parker et al. showed that Cholates adsorbed irreversibly to solid surfaces while Deoxycholates desorbed completely after washing with buffer, regardless of the conjugation group [
6]. Those measurements were performed under similar conditions (3 mM BS and 2 mM Bis-Tris, pH 7.0, 150 mM NaCl and 0–10 mM CaCl
2). According to Parker et al., Chenodeoxycholate also adsorbed irreversibly onto solid surfaces, but its behavior was more dependent on the conjugation group [
6]. Moreover, atomic force microscopy images showed that NaGDC adsorbed as disrupted structures which could be desorbed, in contrast to NaTC, which adsorbed as a continuous film with a granular texture [
6]. Accordingly, adsorption/desorption of BS at a solid surface correlates largely with that seen at the air–water interface (
Figure 5a) but differs significantly from that obtained at the oil–water interface (
Figure 5b). Indeed, the hydrophobic interaction of BS with oil might induce orientational differences with respect to a non-interacting air and solid interface, as recently reported for linear surfactants [
21]. A hypothesis for the different desorption profiles encountered for BS at the air–water interface could be found again in the positions of hydroxyl groups in the molecule. These are in closer positions in NaGCDC (positions 3 and 7), while they appear at the extremes of the concave side for NaTC (3, 7, 12) and NaGDC (3 and 12) (
Figure 1). Having the hydroxyl groups in closer positions and located on the same side might favor the surface complexation of NaGCDC at the air–water interface, which could be responsible for irreversible adsorption. Given that, at the oil–water interface, the hydrophobic interaction possibly determines the desorption profile. The conjugation group plays a major role in desorption, as also happens in the adsorption profile (
Figure 3).
Figure 5b shows that Glycine conjugates display a lower interfacial tension after desorption, meaning that Glycine conjugates adsorbed more irreversibly than Taurine conjugates at the oil–water interface. The hydrophilic interaction of hydroxyl groups seems irrelevant at the oil–water interface, as the desorption behavior of NaGDC and NaGCDC is completely similar (
Figure 5b).
According to these results, the different compositions of the interface can affect the level of adsorption and desorption of surface-active molecules and how they are oriented and anchored at the interface. Experiments at the air/solid interface reveal important differences with respect to the oil–water interface. A reason for this can be the lack of hydrophobic interactions with the air/solid phase, which are present at oil–water interfaces, hence altering the adsorption and the desorption. Moreover, the conjugation of groups determines the anchoring at the oil–water interface, while the number/location of hydroxyl groups seems to impact the desorption from the air–water interface. Hence, the hydrophobic interaction with conjugates at the oil–water interface could determine interfacial complexation and, hence, desorption profiles of BS. The final section evaluates the dilatational viscoelasticity of adsorbed films to shed light on this speculation and to look into the surface/interfacial conformation of different BS upon adsorption to air/oil–water interfaces.
3.3. Dilatational Elasticity of BS Adsorbed at Air–Water and Oil–Water Interfaces
The mechanical response of an interface to a small harmonic area deformation was measured at a fixed frequency of 1 Hz by increasing/decreasing the drop volume. This provides the dilatational viscoelasticity of the surface/interfacial layer, which contains information on the organization and interactions of molecules adsorbed at air/oil–water interfaces, highlighting composition, orientations, and intermolecular forces and associations [
9,
15,
16,
26]. The behavior of the dilatational modulus of interfacial layers depends on the bulk concentration and on the oscillation frequency [
27]. For soluble surfactants, upon monolayer compression/expansion, some surfactant molecules dissolve into the bulk/adsorb back onto the surface to restore the equilibrium surface concentration. At the low-frequency limit, the monolayer always has time to adapt to deformation and recover equilibrium, and the dilatational stress is zero (Equation (1)). At the high-frequency limit, the monolayer has no time to adapt to deformation and the interfacial stress is mostly elastic, as the monolayer behaves as if it were insoluble. At an intermediate frequency range, there is an elastic and viscous contribution to the dilatational stress. BS are highly surface-active molecules, and the applied oscillation frequency was the highest compatible with the instrument, i.e., 1 Hz, so as to minimize the viscous response of the interfacial layer. In addition, this high frequency/insoluble monolayer regime provides an elastic response only for a monolayer, i.e., at low bulk concentrations, whereas at higher bulk concentrations, the interfacial layer adapts to the deformation, instantaneously reducing the dilatational stress [
27].
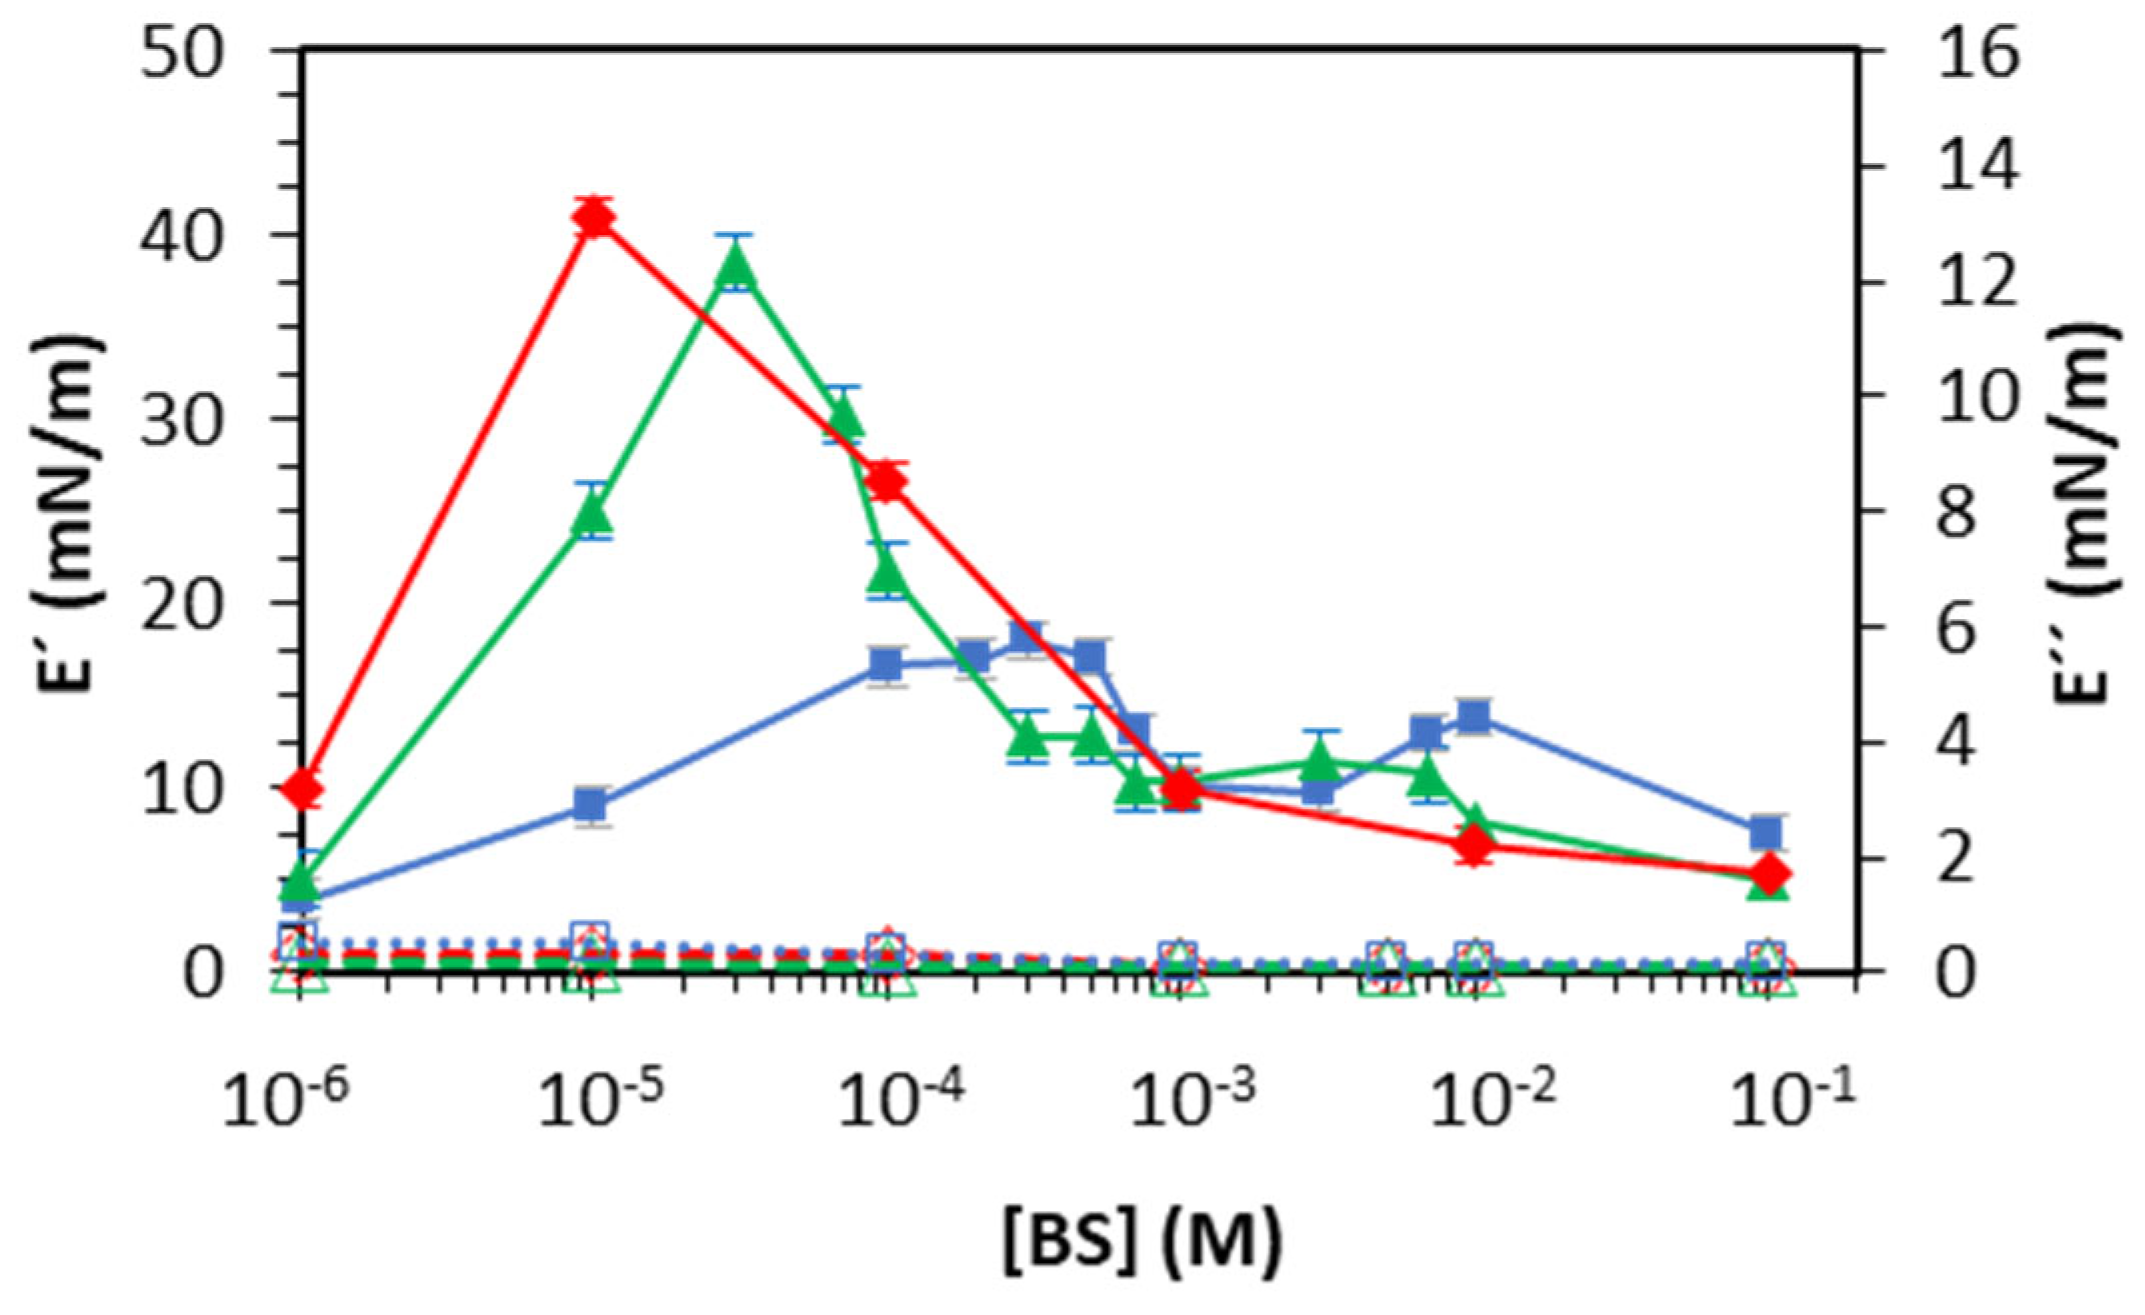
Figure 6 and
Figure 7 show the storage and loss modulus (Equation (3)) of BS-adsorbed layers at the air–water and oil–water interfaces, respectively. In both cases, E″<<E′ is indicative of the elastic nature of the interfaces formed. The dependence of E′ with the bulk concentration matches that predicted for soluble surfactants. Namely, E′ increases with bulk concentration to a maximum, followed by a gradual decrease, providing a practically null dilatational response at the highest bulk concentrations.
At the air–water interface (
Figure 6), the location of the maximum in the concentration range follows the same trend as the CMC: NaGCDC < NaGDC < NaTC. In addition, Glycine-conjugates (NaGDC and NaGCDC) display a similar value of maximum elasticity (~40 mN/m) that was significantly higher than that of Taurine conjugate (NaTC, ~20 mN/m), which also shows a second maximum of (~15 mN/m) located at higher bulk concentrations. A maximum dilatational modulus corresponds to the formation of a cohesive surface layer in which the molecules spread at the surface in a single conformation. The height of the maximum relates to the molecular interconnections at the surface/interfacial layer. The stronger dilatational response of Glycine-conjugates at the air–water interface agrees with the higher surface activity and the improved surface packing discussed and schematized in
Figure 3. Similarly, a lower dilatational elasticity suggests the formation of a more fluid surface layer, with fewer lateral interactions [
9].
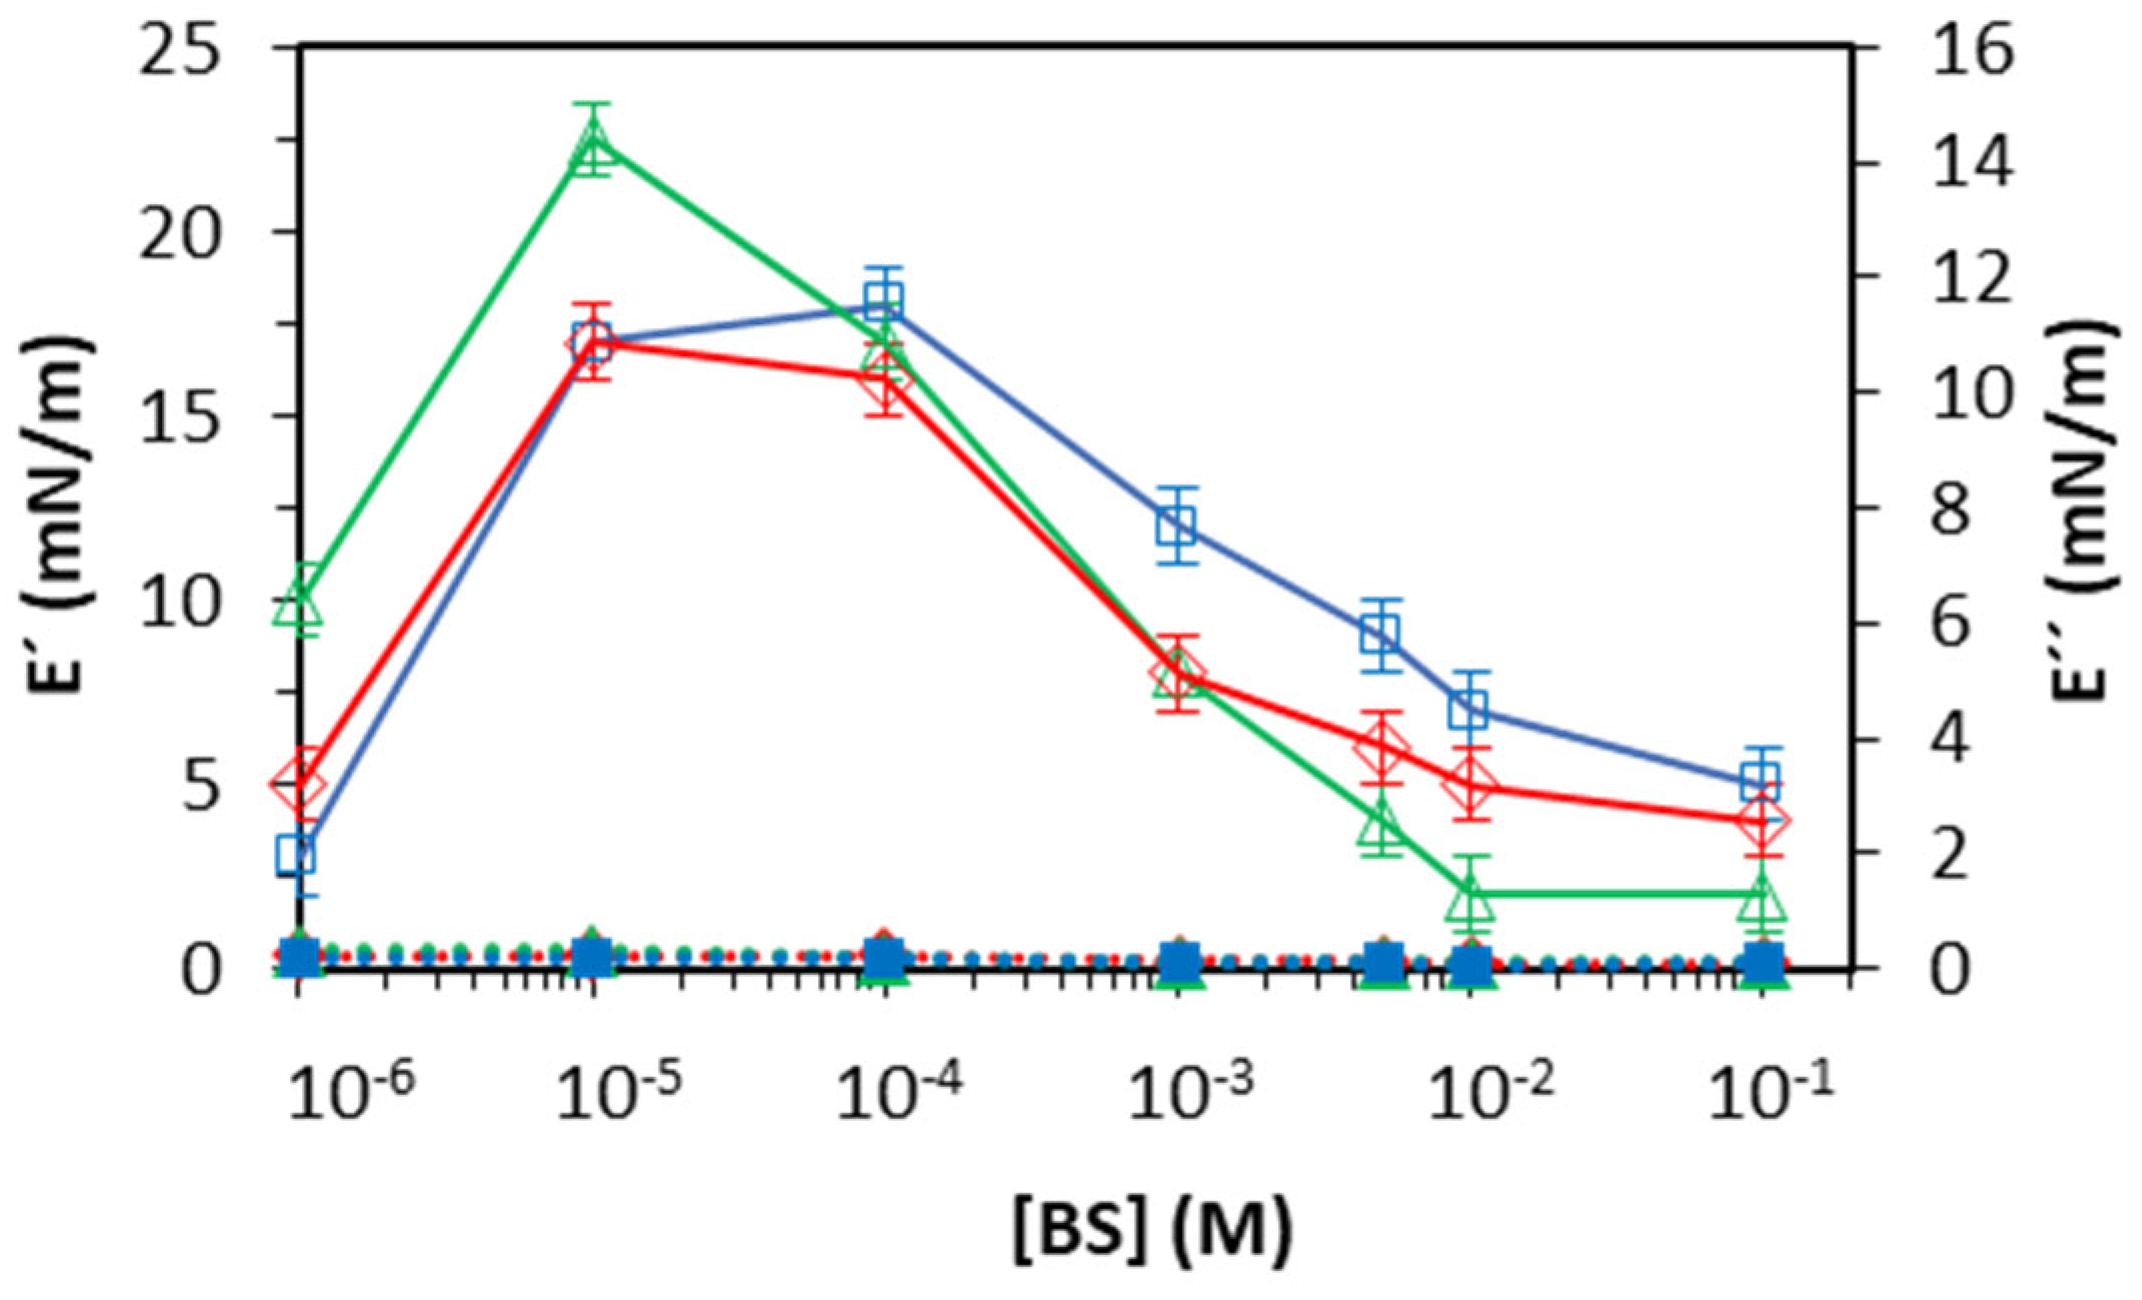
At the oil–water interface (
Figure 7), all the assayed BS showed one single maximum located at the same concentration, which appears just slightly higher for NaGDC compared to NaTC and NaGCDC (
Figure 7). These maxima of the elasticity (E′) and the concentration range match recent results reported by Wu et al. for NaTC and NaGC adsorbed at the decane–water interface [
8]. These authors also suggest that the interfacial complexation of BS through their conjugation groups is responsible for the dilatational response.
In general, BS films display a lower dilatational response at the oil–water interface compared with the air–water interface. Weaker intermolecular interactions in BS films adsorbed at the oil–water interface can originate from the preferred hydrophobic interactions between the molecules of BS and oil, weakening the intermolecular interactions. This effect has also been reported for linear surfactants [
21] and proteins [
28] at air/oil–water interfaces and suggests that the improved hydrophobic interactions of the oil with molecules of the BS result in a more fluid and mobile interface. However, there are quite a few systems where the hydrophobic interactions of the surfactant with the oil lead to an opposite situation, as reported by Guttman et al. [
29], where the hydrophobic interactions of the surfactant with the oil lead to the oil’s co-crystallization with the surfactant taking place at an elevated temperature: that is, the interactions lead to a more solid, rather than a more fluid, interfacial layer.


