Article

A Microfluidic Approach to Investigate the Contact Force Needed for Successful Contact-Mediated Nucleation

Institute for Thermal Process Engineering, Karlsruhe Institute of Technology (KIT), 76131 Karlsruhe, Germany
*
Author to whom correspondence should be addressed.
Colloids Interfaces 2023, 7(1), 12; https://doi.org/10.3390/colloids7010012
Submission received: 27 December 2022 / Revised: 26 January 2023 / Accepted: 26 January 2023 / Published: 31 January 2023
(This article belongs to the Special Issue Recent Advances in Emulsions and Applications)

Abstract

:
Emulsions with crystalline dispersed phase fractions are becoming increasingly important in the pharmaceutical, chemical, and life science industries. They can be produced by using two-stage melt emulsification processes. The completeness of the crystallization step is of particular importance as it influences the properties, quality, and shelf life of the products. Subcooled, liquid droplets in agitated vessels may contact an already crystallized particle, leading to so-called contact-mediated nucleation (CMN). Energetically, CMN is a more favorable mechanism than spontaneous nucleation. The CMN happens regularly because melt emulsions are stirred during production and storage. It is assumed that three main factors influence the efficiency of CNM, those being collision frequency, contact time, and contact force. Not all contacts lead to successful nucleation of the liquid droplet, therefore, we used microfluidic experiments with inline measurements of the differential pressure to investigate the minimum contact force needed for successful nucleation. Numerical simulations were performed to support the experimental data obtained. We were able to show that the minimum contact force needed for CMN increases with increasing surfactant concentration in the aqueous phase.

Graphical Abstract

1. Introduction

The kinetics of crystallization in terms of the nucleation probability of a droplet and the influence of the surfactant on crystallization has been studied in recent years, especially in the field of solid-liquid nanoparticles [1,2,3,4,5,6].
Contacts between subcooled, liquid droplets and already crystallized droplets, i.e., particles, can occur during the crystallization of melt emulsions and their storage at rest or in stirred vessels. These contacts may lead to contact-mediated nucleation (CMN), resulting in the crystallization of the subcooled droplets. Direct contact with the blank interfaces of the colliding droplet and particle seems to be needed for CMN. Adsorbed surfactants may shield the droplets from direct contact with each other and hinder CMN. Moreover, a minimum contact time and a minimum relative velocity of the two collision partners must be overcome so that the liquid droplet is inoculated by the particle [7].
In this study, we aim to determine the minimum contact force needed for CMN as a function of the aqueous surfactant concentration.
McClements et al. [8] formulated the hypothesis of CMN for quiescent emulsions due to Brownian motion, to explain their observation that crystallization of the droplets of an n-hexadecane-in-water emulsion with Tween®20 (TW20) as the surfactant accelerated when already solidified droplets were present. Emulsions with only subcooled, liquid droplets did not crystallize or crystallized negligibly slowly [9].
The hypothesis of CMN was strengthened in [10], where the crystallization progress (time-resolved change of the solid fraction of the dispersed phase) of several emulsions with 50% liquid and 50% solid dispersed phase fractions was investigated over a period of 175 h. Spectroscopic nuclear magnetic resonance measurements were used to study the crystallization progress of n-hexadecane-in-water emulsions with TW20 contents between 0 and 14 wt-% added to the continuous phase. Emulsions with already solidified droplets continued to crystallize even at low subcooling, whereas emulsions with completely liquid or solidified droplets did not change their number of solid particles over time and the droplet size distribution of all the emulsions remained constant. Since no other external forces had been applied to the emulsion which could have induced nucleation, CMN was assumed.
In addition to the influence of solid and liquid dispersed phase fractions, different observations had been made regarding the impact of the surfactant concentration. Dickinson et al. [9] and McClements et al. [10] demonstrated that increasing the surfactant concentration was associated with faster crystallization due to an increased rate of CMN. Different approaches are known to explain the impact of surfactants on CMN. They assumed that, for example, micelles in the continuous phase may form a bridge between the approaching reaction partners (subcooled, liquid droplet and crystalline, solid particle), containing a small concentration of oil and surfactant molecules forming a transient connection [9]. Another possible explanation was depletion flocculation, which is enhanced by increasing aqueous surfactant concentrations [10]. Additionally, Povey et al. [11] described a significant impact of the type of surfactant on the CMN. In contrast to what Dickinson et al. and McClements et al., Kaysan et al. [12] found, by a targeted contact between a liquid and a solidified droplet in a microfluidic setup, a reduction in the nucleation efficiency (percentage of collisions that led to the crystallization of the subcooled, liquid droplet compared to the total number of experiments) of the CMN when micelles were present in the continuous phase.
In this work, a differential pressure sensor is connected to a microfluidic chip. By measuring the pressure drop Δ p during the CMN, we aim to determine the force needed for CMN due to the fluid field F c . At a constant relative velocity of the droplet and the particle, the minimum force needed for nucleation F C M N , m i n increases only due to F c , as the force caused by the impulse F i should be the same for all experiments (compare Equation (8)). It is therefore crucial to understand the flow and pressure pattern within the microfluidic channel.
The pressure drop within a straight pipe section can be determined by
Δ p = f L d h ρ u 2 2 ,
where f represents the so-called friction factor, L the channel length, d h the hydraulic diameter of the pipe, ρ the fluid density, and u the average velocity. f is dependent on the Reynolds number [13], the flow properties, the channel geometry, and the roughness of the walls [14]. Here, the Reynolds number is defined as
R e = u   ρ   d h η ,
where η represents the dynamic viscosity of the fluid. The hydraulic diameter is calculated as
d h = 4   A c P W ,
where A c represents the cross-sectional area of the flow channel and P W is the wetted perimeter [14]. Regarding noncircular channel cross-sections and laminar flows, the pipe friction coefficient is calculated using φ , which depends on the geometry of the channel:
f = φ 64 R e .
According to [15], φ = 0.92 for the channel used in this work with a width W = 300 µm and depth D = 200 µm. The pressure loss is directly proportional to the fluid velocity in laminar pipe flows. This results in a calculation of the pressure drop as
Δ p = φ   64 R e L ρ u 2 2 d h = φ 32 η u L d h 2   .
The wall roughness in conventional pipes has a negligible impact on the pressure drop during laminar flows. However, the roughness in microfluidic systems may obstruct a significant part of the flow channel, which is discussed in the next section [14].
If mini- or microchannels are utilized instead of conventional channels, not all assumptions and equations mentioned above may be used. Kandlikar and Grande [16] proposed a classification of the different kinds of channels depending on their hydraulic diameter d h . The channel is classified as a microchannel for 10 µm < d h ≤ 200 µm and as a minichannel for 200 µm < d h ≤ 3 mm.
Length-related effects become more important on a smaller scale, such as the entrance length of a flow [17]. Chan et al. [18] investigated fluid films between molecularly smooth plates at distances in the nanometer range and found that the conventional Navier-Stokes equations are still valid up to a distance of 50 nm. The liquid can no longer be regarded as a continuum when the film thickness is less than ten molecular layers (5 nm) [18]. Therefore, continuum mechanical behavior can still be assumed for fluid flows in the micrometer range.
Qu et al. [19] and Xu et al. [20] carried out numerical and experimental tests to investigate flow development and pressure loss in micro- and minichannels. They found that the conventional Navier-Stokes equations also predict the flow in microfluidics. R e in mini- and microchannels are significantly lower than in commercial pipe systems due to smaller d h and u . This means that the frictional forces dominate and, simultaneously, the inertial forces are weak. However, the critical Reynolds number R e c r i t , describing the transition from laminar to turbulent flow, must be adjusted in microfluidics. The transition from laminar to turbulent flow may start below R e c r i t = 2300, due to the impact of surface roughness, as determined for conventional pipe flows [14]. This transition already takes place for R e c r i t = 300 − 900 for hydraulic channel diameters d h = 30 − 344 μm [21]. In this work, d h = 240 μm. Kandlikar [14] also considered the impact of the wall roughness on R e c r i t . With the relative roughness ϵ of our channel (compare Figure 3, ϵ ~0.02), R e c r i t ~1800. Compared to both values, our experiments are strictly laminar (compare Appendix A Table A1 and Table A2).
According to Mirmanto et al. [22], the friction factors of microfluidics in fully developed flows (either laminar or turbulent) are consistent with those in conventional theory. Ghajar et al. [23] reviewed the existing literature and came to the same conclusion. In addition, they found that the relative roughness of the channels in microfluidics has a major influence. Steinke and Kandlikar [24] compared the friction factors presented in the literature with those from theory and noted that the values are very similar. They explained deviations by inaccuracies related to the irregularity of the channel dimensions.
In addition, droplets moving along the channel can impact Δ p . Monodisperse droplets can be generated in microfluidic setups using a T-junction where two fluids meet (e.g., [7,25,26]). Due to the chemical change of the hydrophobicity of the channel walls, droplets can be formed which are not in contact with the channel walls and, therefore, do not fill the channel but almost reach its width and height and form rounded ends, i.e., caps [27]. The volume of a droplet in a rectangular channel can be approximated according to Musterd et al. [27].
If the droplets flow along the channel together with the continuous phase, an increased pressure loss is likely compared to the simple single-phase flow. Fuerstmann et al. [28] list the following parameters for this pressure loss: the number of droplets, their total length (body and cap), the aspect ratio of the channel, the emulsifier concentration, and the viscosity of the continuous phase. When the Reynolds number is low, transition zones between these areas can be neglected [28]. Considering the flow around the droplet bodies, this can be further subdivided into fluid moving through a thin gap between the droplet and the channel walls, as well as a part that flows through the gap formed by the round droplets and the rectangular channel corners (bypass flow). According to Ransohoff and Radke [29], the contribution to the pressure drop by the thin films between the flowing drop and the wall can be neglected because the pressure drop in the corners is predominant.
Fuerstmann et al. [28] considered different concentrations of the emulsifier to calculate the pressure drop in a channel with flowing liquid droplets. Regardless of whether no emulsifier, a very low ( c < 0.01 critical micelle concentration [ c m c ] ) or a very high concentration c of emulsifier ( c > 1000 c m c ) were present, the pressure drops to a higher degree in the area of the caps rather than over the bodies of the droplets. Therefore, the number of droplets in the channel is decisive, as more droplets also mean a higher number of caps.
The pressure drop across the body of the flowing droplets was the greatest for intermediate emulsifier concentrations (1–2 orders of magnitude of c m c ), which is why the total length of the droplets was most important in this case.
One possible reason for the different components of the pressure drop is the dependence of the flow velocity within the corners on the concentration of the emulsifier. If no emulsifier is present, the flow in the corners is negligible and the droplets moved at the same speed as the continuous fluid. At intermediate concentrations of surfactant, the bypass flow is fast, causing the continuous phase to move 1.2 times faster than the droplets. At c > 1000 c m c , the flow velocity within the corners decreased again [28].
To the best of our knowledge, no investigations have been made that deal with a particle partially blocking the cross-sectional area of a rectangular channel with laminar flow.
In this work, the minimum contact force F C M N , m i n needed for successful CMN will be investigated. F C M N , m i n is a combination of the force due to the impulse of the decelerating droplet F i and the force due to the fluid field F c (compare Equation (8)). F c is determined in microfluidic experiments by analyzing the pressure drop between the inlet and the outlet of a microfluidic chip during the crystallization of a liquid droplet due to contact with an already crystallized and immobile particle. A detailed understanding of the different pressure drop contributions that can influence the total pressure drop during the process is necessary for the interpretation of the data and testing of the setup. The influence of particle geometry on the pressure loss, which has barely been considered so far, will be especially investigated in more detail with both, experiments and simulations.

2. Materials and Methods

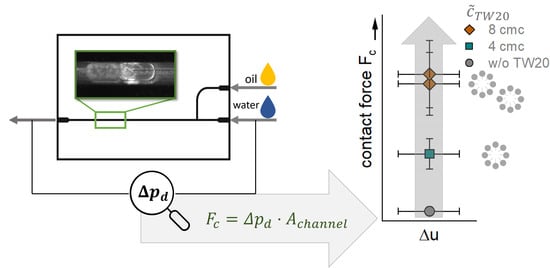
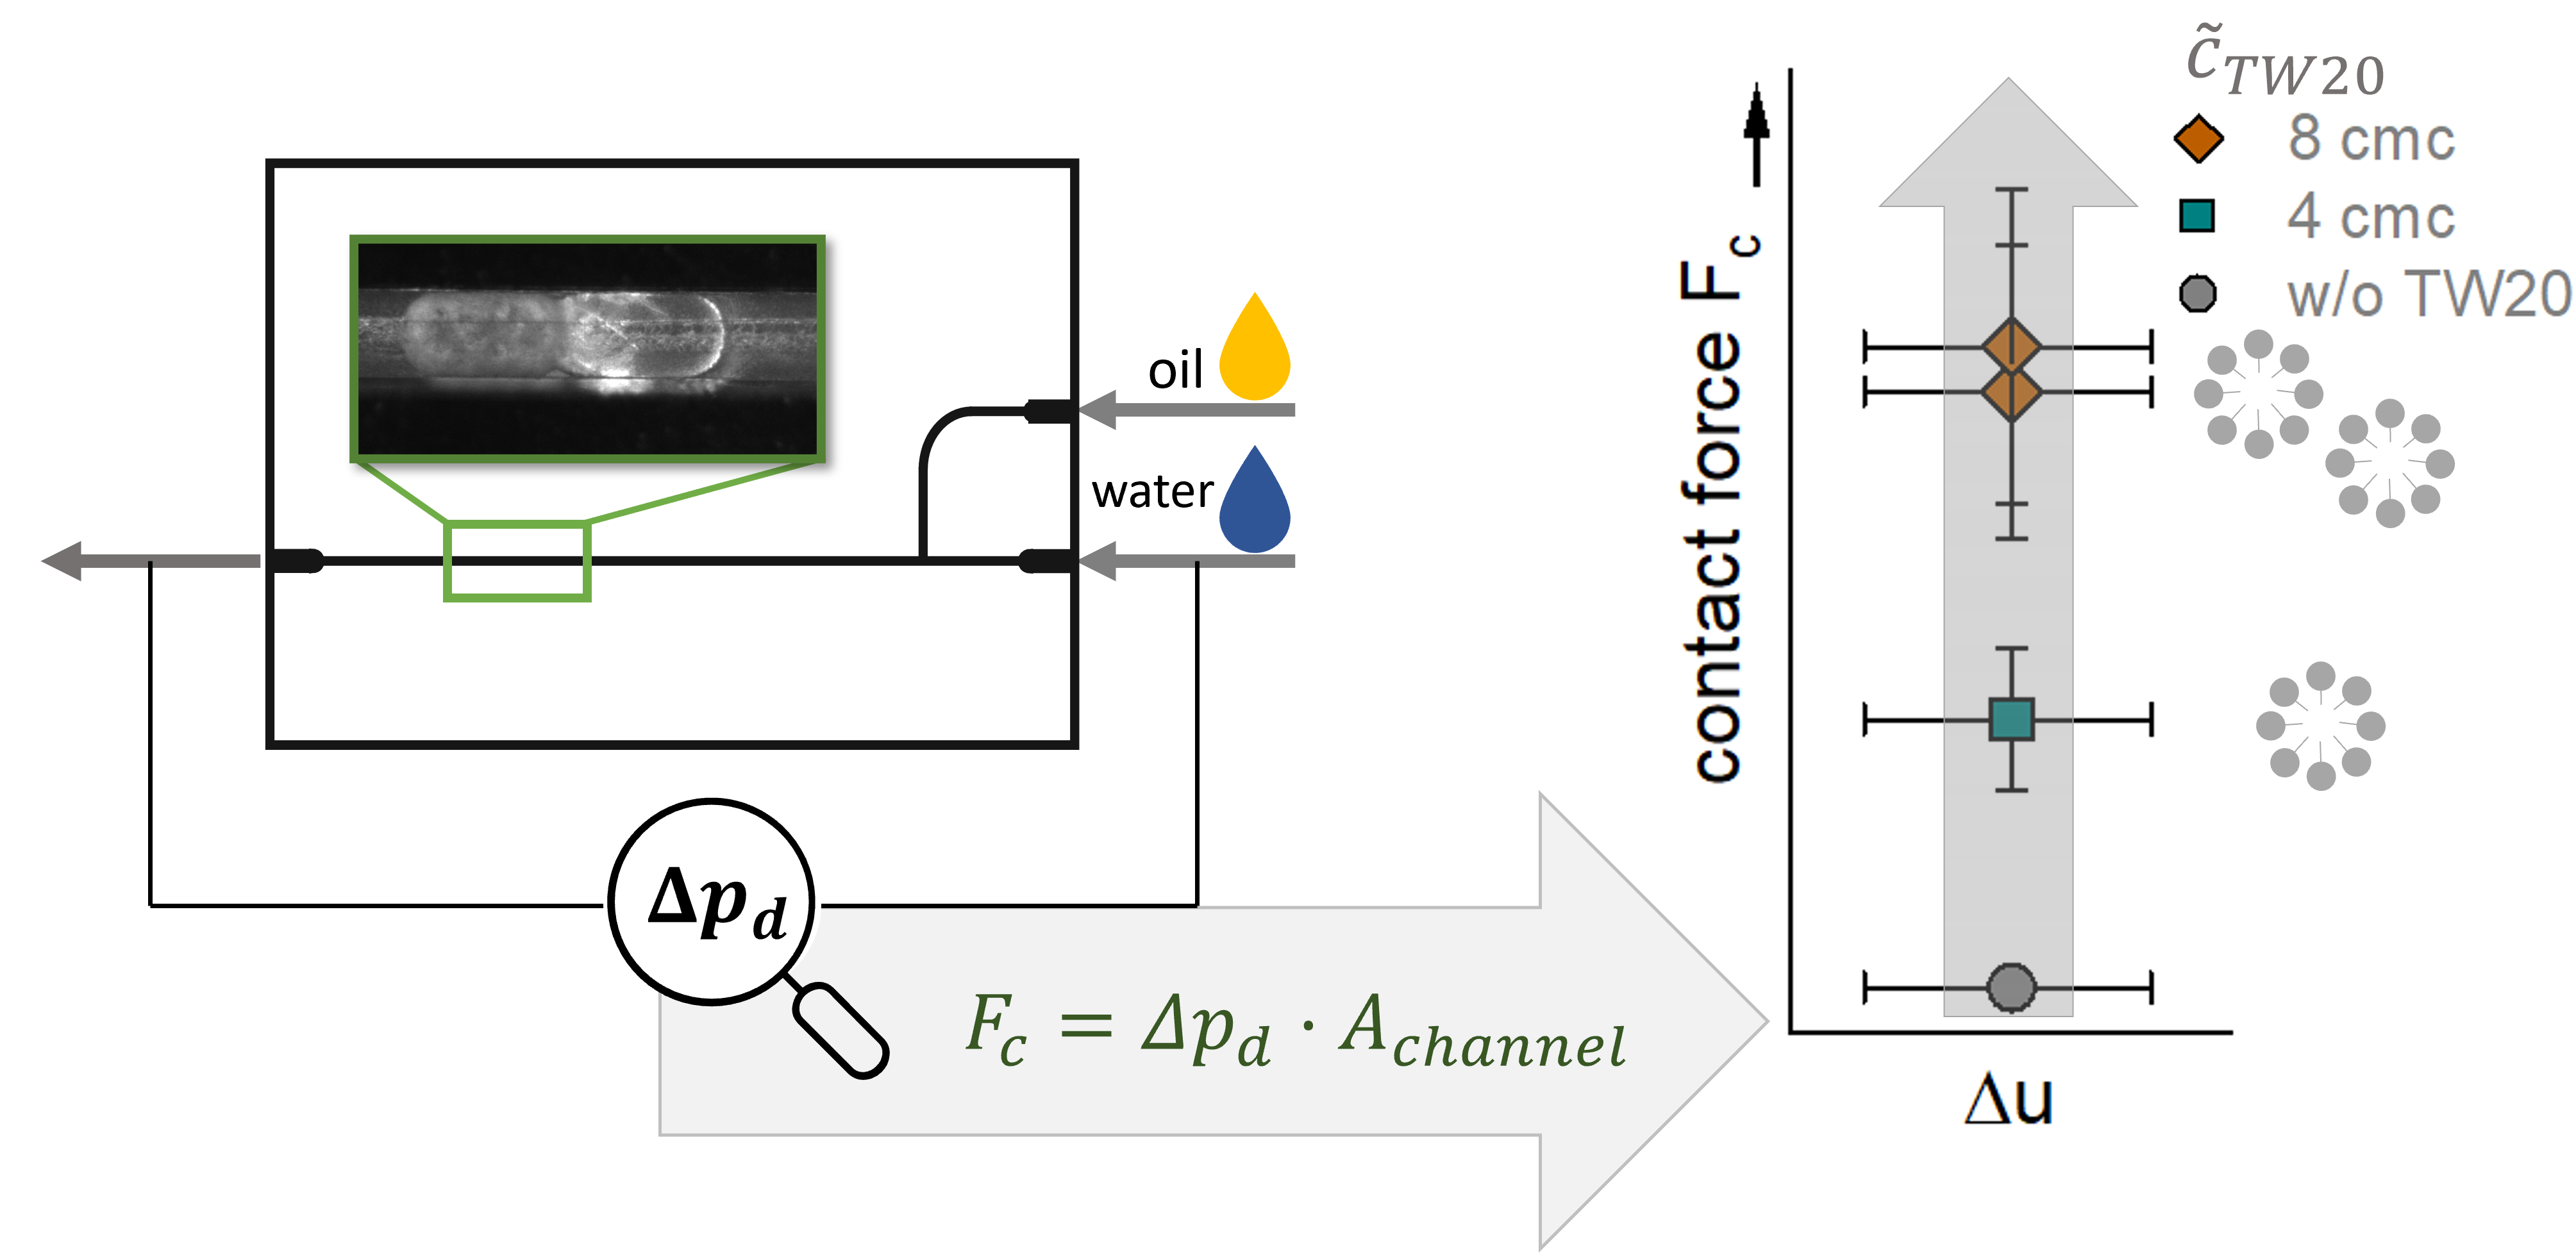
2.1. Microfluidic Setup

The production and set up of the microfluidic chip used are described elsewhere [7,25]. Rectangular channels with a width of W = 300 µm + 10 52 µm and depth of D = 200 µm ± 20 µm were milled into a polycarbonate chip. A differential pressure sensor (Deltabar S PMD70, Endress + Hauser, Reinach, Switzerland) was connected to the inlet and outlet of the microfluidic channel (Figure 1).
The differential pressure sensor gives an analogous output current signal to the signal transducer (General Industrial Controls Private Limited, Pune, Maharashtra, India), which converts the current into a voltage signal. This signal is then transferred to the computer using an analogous digital converter (Measurement Computing Corporation, Norton, MA, USA) and the measurement data are recorded using the software DAQamiTM v4.2.1 (Measurement Computing, Norton, MA, USA). The calibration of the sensor led to a linear relationship between the voltage output signal and the actual differential pressure. The signal data were smoothed with OriginPro 2021 (OriginLab, Northampton, MA, USA) using the ‘floating average’ method, averaging ten measurement points. Compensation measurements without the polycarbonate chip were carried out and the influences of valves, connectors, and hose connections were determined to consider only the pressure drop of the main channel. These corrections are always considered for all Δ p data presented.
Ultrapure water was used (electrical conductivity 0.057 μS cm−1, OmniTap, Stakpure GmbH, Niederahr, Germany) as a continuous phase. The dispersed phase was the organic substance n-hexadecane (Hexadecane ReagentPlus®, 99%, Sigma-Aldrich, St. Louis, MO, USA) and for some experiments, the droplets were additionally stabilized with the surfactant Tween®20 (TW20, Merck KGaA, Darmstadt, Germany) at a concentration of either c ˜ T W 20 = 0.24 mol m−3 (~4 c m c ) or 0.41 mol m−3 (~8 c m c ). The surfactant was dissolved in the continuous phase. The production of TW20 includes esterification and further chemical reactions, therefore, its purity may differ from batch to batch. The same bottle of TW20 was used for all experiments to exclude any fluctuations in purity and composition and guarantee comparable experimental conditions. The c m c of TW20 is given by Linke et al. [30] as 0.059 mol m−3 at 298 K. The melting point of n-hexadecane was determined previously as ϑ m , h e x = 18.6 °C [7]. Volume flows of the continuous phase between 50 µL h−1 and 500 µL h−1 were investigated. This resulted in Reynolds numbers between 0.05 and 0.52 (compare Appendix A Table A2) and, consequently, a strictly laminar flow.
Figure 2 summarizes the procedures to investigate Δ p for the following different setups: The channel is filled with continuous phase only (1A), liquid droplets are moving along the minichannel (2A), the channel is partly blocked by a solid particle (2B), or the CMN itself (2C). A more detailed description of the experimental procedure to introduce droplets in the microfluidic channel and of the temperature profile used for CMN can be found in [7].
Whereas the liquid droplet can move along the channel, the solid particle no longer changes its position, which finally enables the direct contact of the particle and the droplet at a given droplet velocity and subcooling Δ T . The continuous phase flows 1.01 to 1.1 times faster than the droplets moving through the channel.
The wall roughness (Figure 3) mainly impacts the flow in the mini- and microchannels. Therefore, the structure of the minichannel was investigated optically using a digital microscope (VHX-700, Keyence, Osaka, Japan).
An evaluation of the arithmetical mean height of the channel resulted in an absolute roughness of R a = 4.2 µm ± 1.5 µm (averaged over 11 datasets across the whole channel width and length). The relative roughness ϵ differed mainly between the determination across the channel width and along the channel length, which is a result of the milling process.

2.2. Numeric Flow Simulations
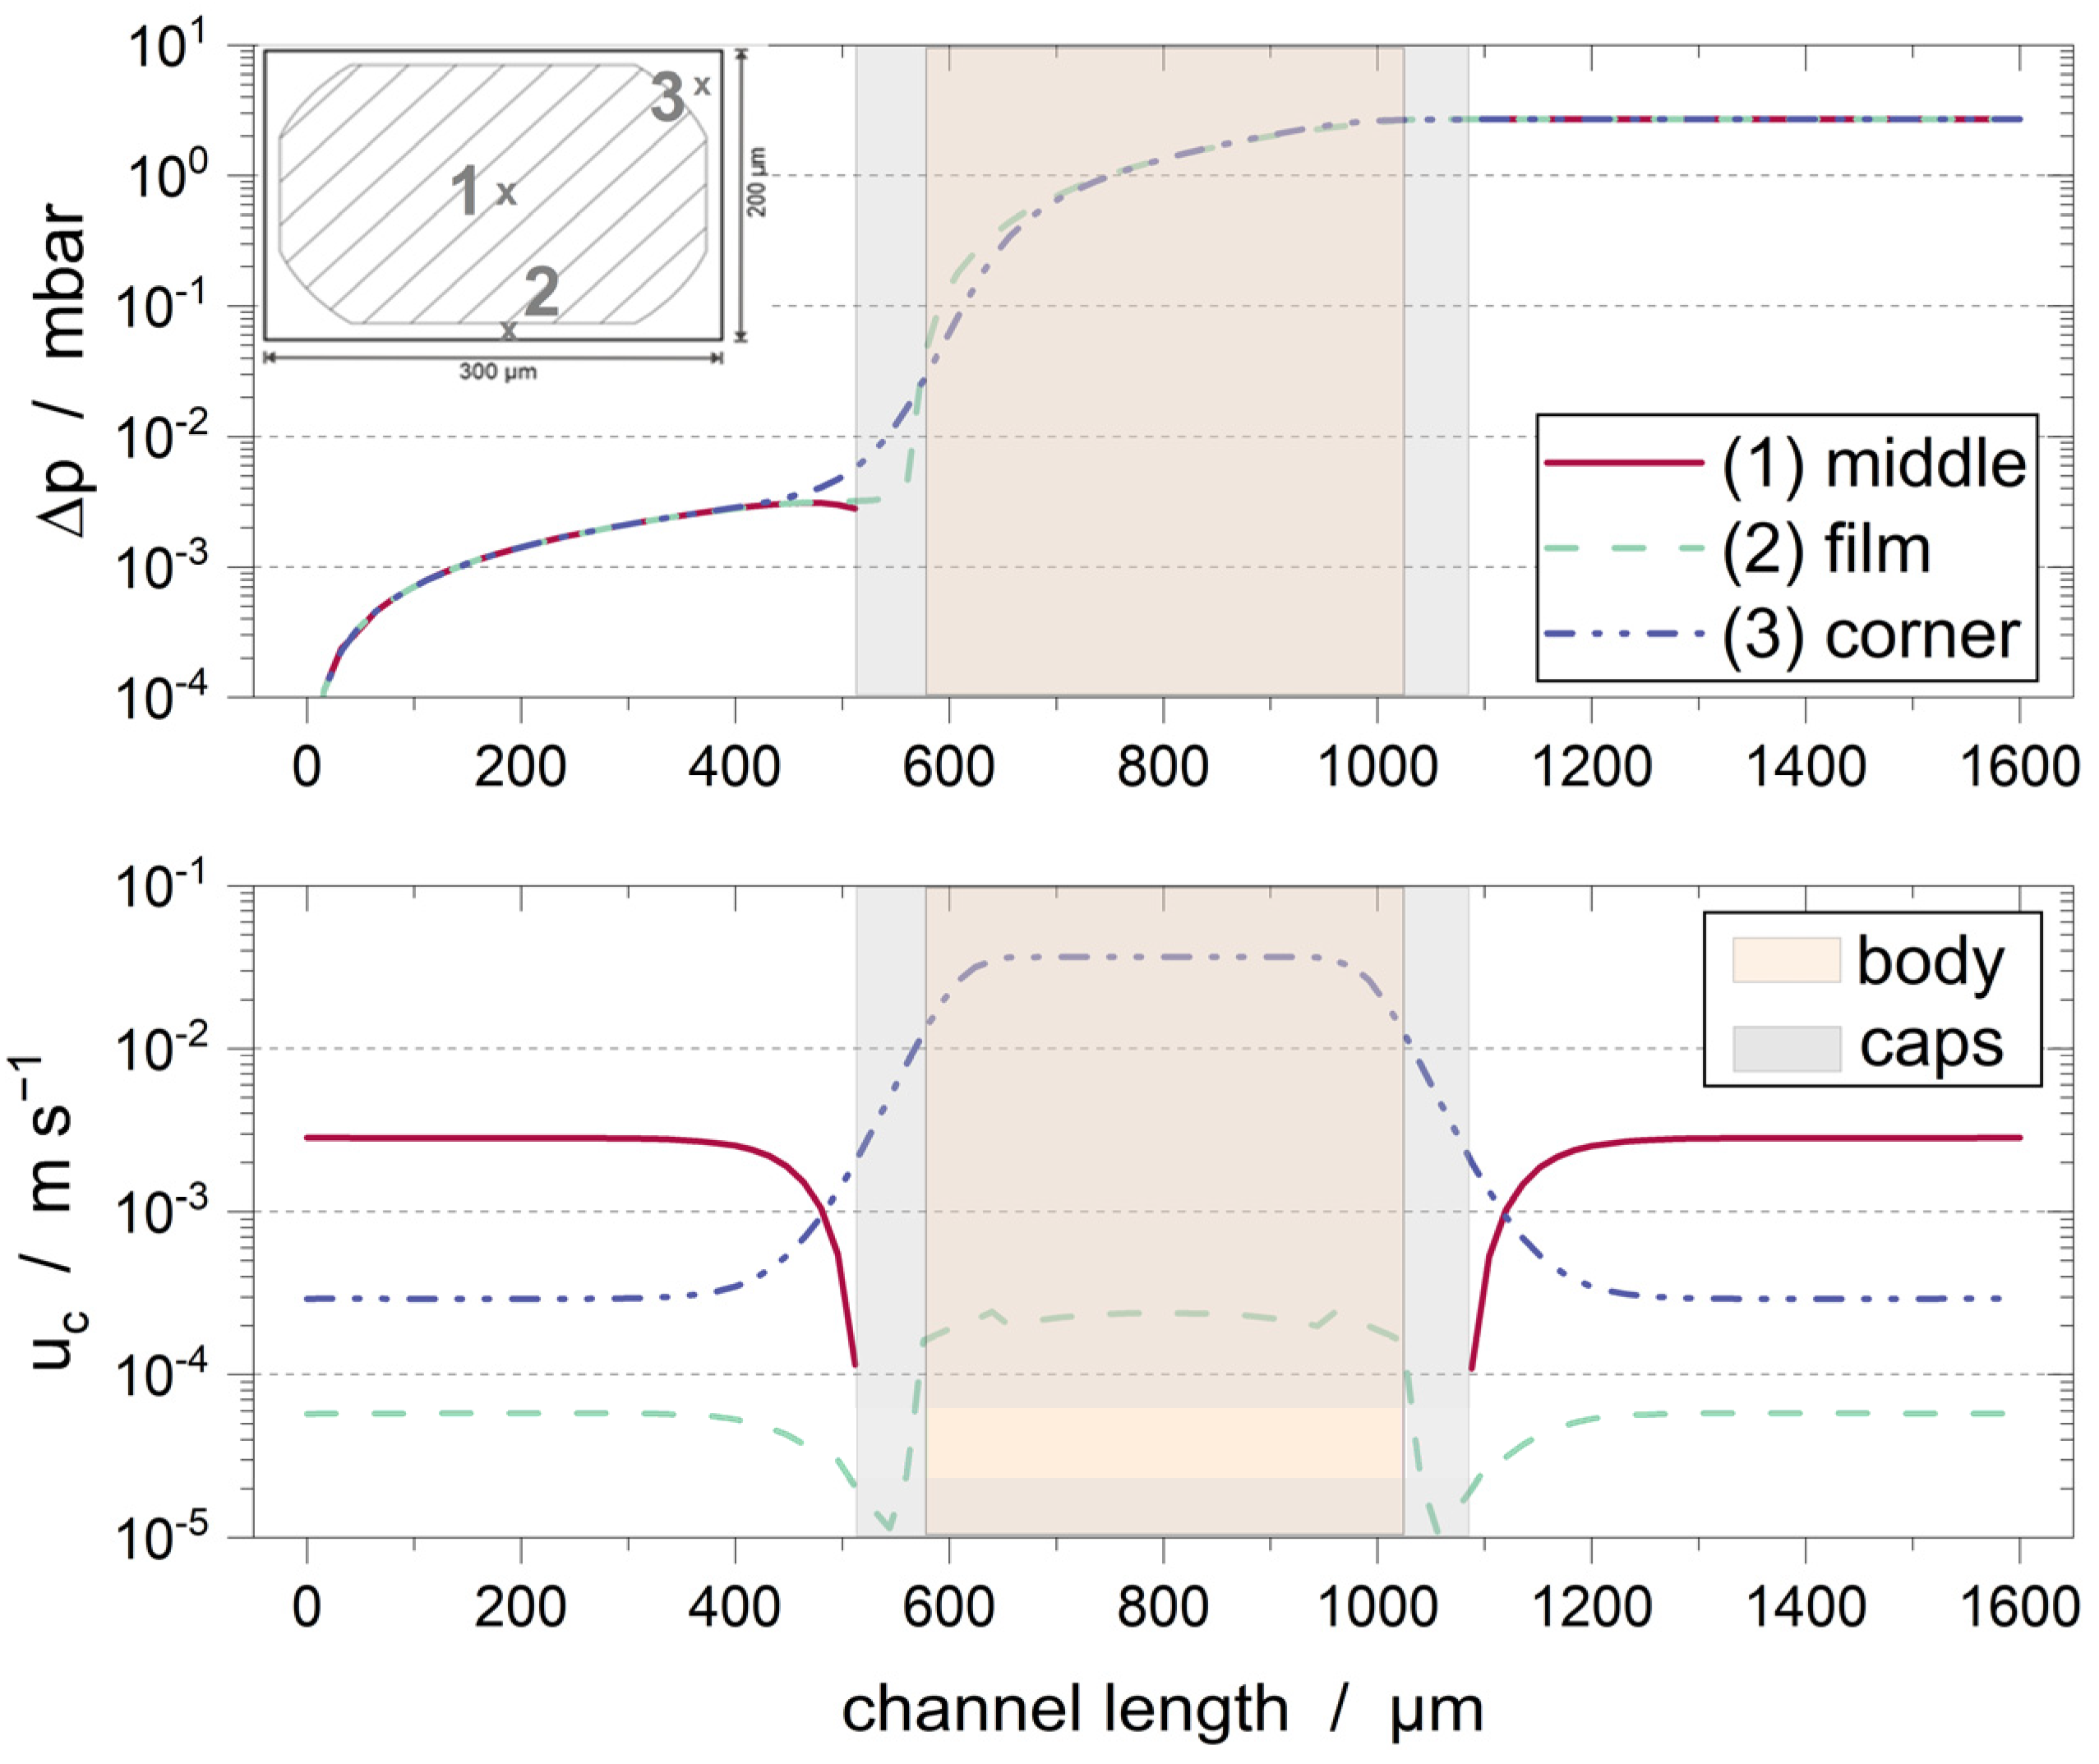
All simulations were carried out using the open-source simulation software OpenFOAM (Version 6) [31]. The geometry was generated using the computer-aided design and drafting tool Salome (Version 9.3.0) [32]. Three different parameters of the particle implemented were adjusted (Figure 4):
  • length of the particle body l b o d y ,
  • length of the caps of the particles l c a p , and
  • distance between the particle boundary and the channel wall, i.e., film thickness h f .
The particle was integrated into the center of the channel resulting in equal film thicknesses on all sides of the object. We ensured in preliminary tests that the length of the channel (1.6 mm) was sufficient to establish a fully developed flow. This was also checked after the integration of the particle whose length corresponded to 14–34% of the channel length. Therefore, the pressure drop could be divided into an empty channel contribution, which was extrapolated to the experimental channel length of 5 cm, and the contribution of the particle. The dimensions of the channel were 300 × 200 µm ( W × D ).
A grid convergence study was carried out to analyze the influence of the numerical mesh on the simulation results. The grid convergence index ( G C I ) proposed by Roache [33] was calculated to quantify the discretization errors. It is based on the Richardson extrapolation and dependent on the order of convergence. The base cell sizes tested were 15 µm, 11.6 µm, and 9 μm (Table 1).
The solver simpleFoam was used to solve the Navier-Stokes equations at an unknown pressure field, as an incompressible, steady-state flow of a Newtonian fluid was assumed. A tool available in the OpenFOAM software (SnappyHexMesh) was used to generate the mesh. The mesh was refined up to three times depending on the distance to the particle and the channel walls to adequately resolve gradients that form near the solid surfaces (Figure 5).
The mesh refinement is relative to the base grid. All cells whose centers had a distance of 40 µm from the channel wall and 50 µm away from the particle surface were refined by a factor of 2. Those cells whose centers were closer than 3 µm to the surface of the particle were refined 3 times.
A mapped boundary condition with varying average values was chosen as the boundary condition for the velocity at the inlet. This means that the velocity profile at the outlet was averaged across the outlet surface and then impressed at the inlet, where the new profile was calculated concerning the averaged value. The channel was long enough to form a fully developed flow field, therefore, the velocity gradient was set to 0 at the outlet. A fixed value of 0 was given at the wall of the channel and the wall of the particle. A gradient of zero was chosen for the inlet, the wall of the channel, and the particle for the pressure. The pressure at the outlet was set to a constant value.

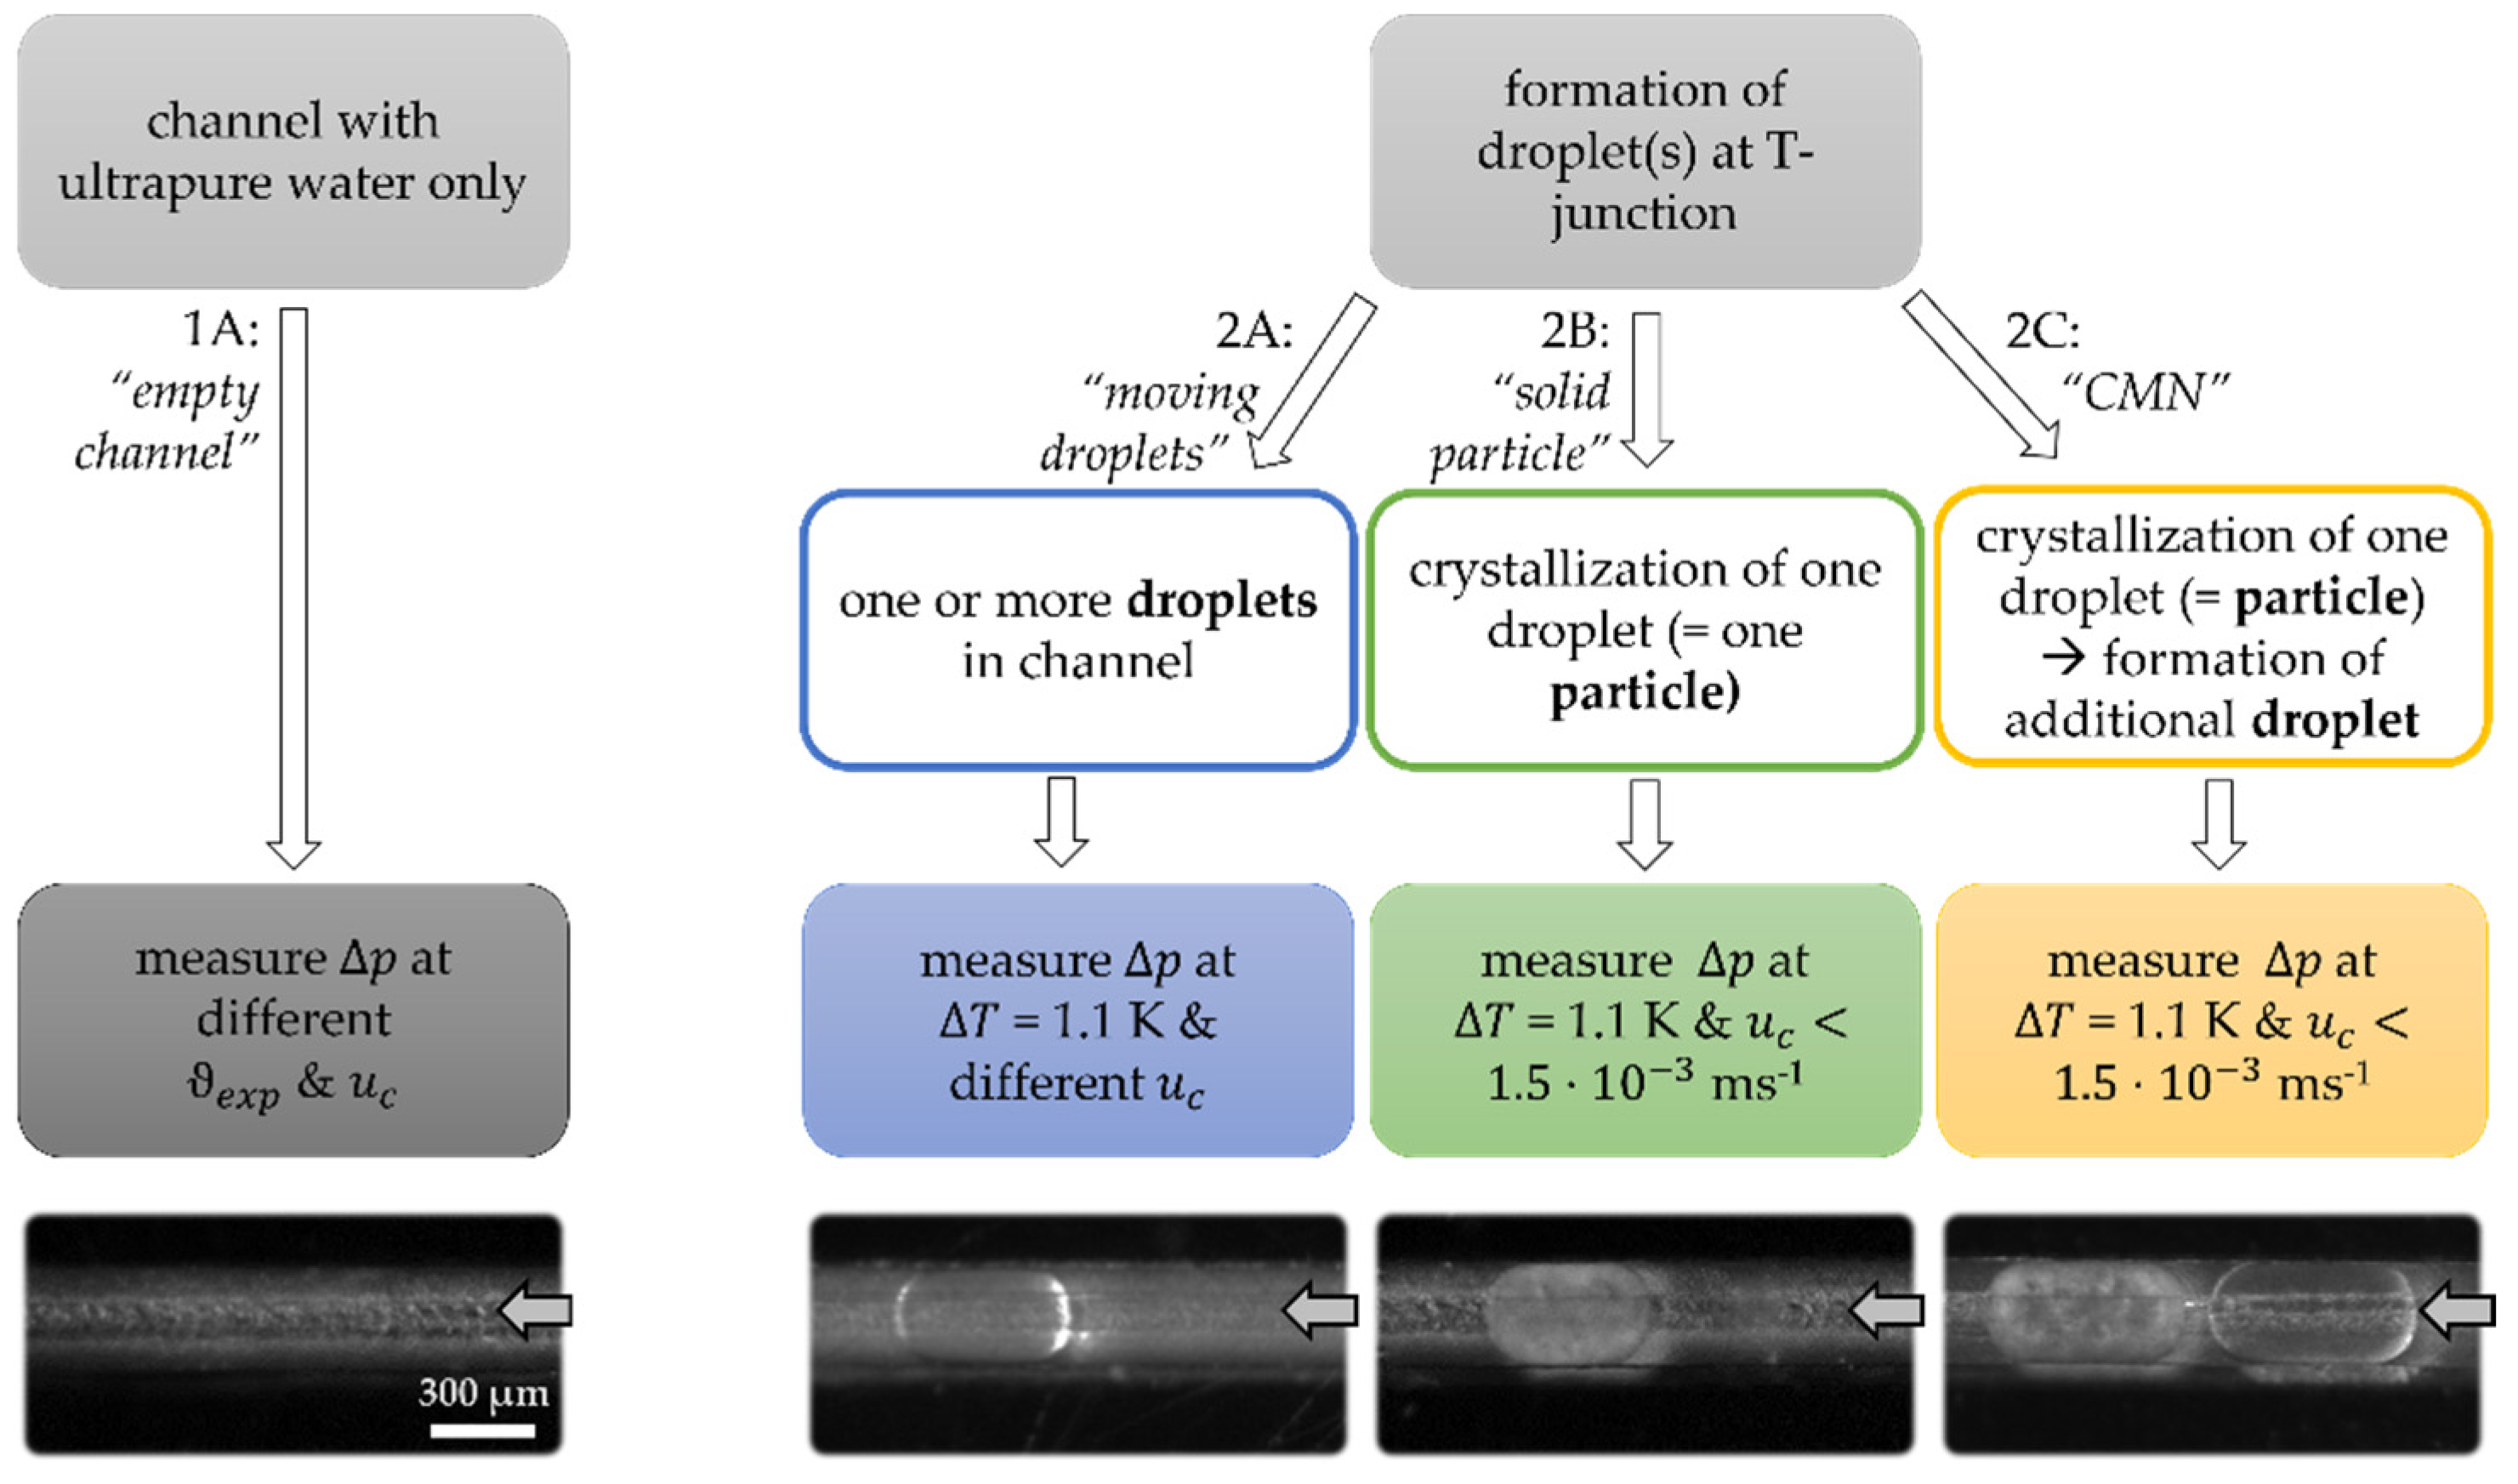
3. Results and Discussion
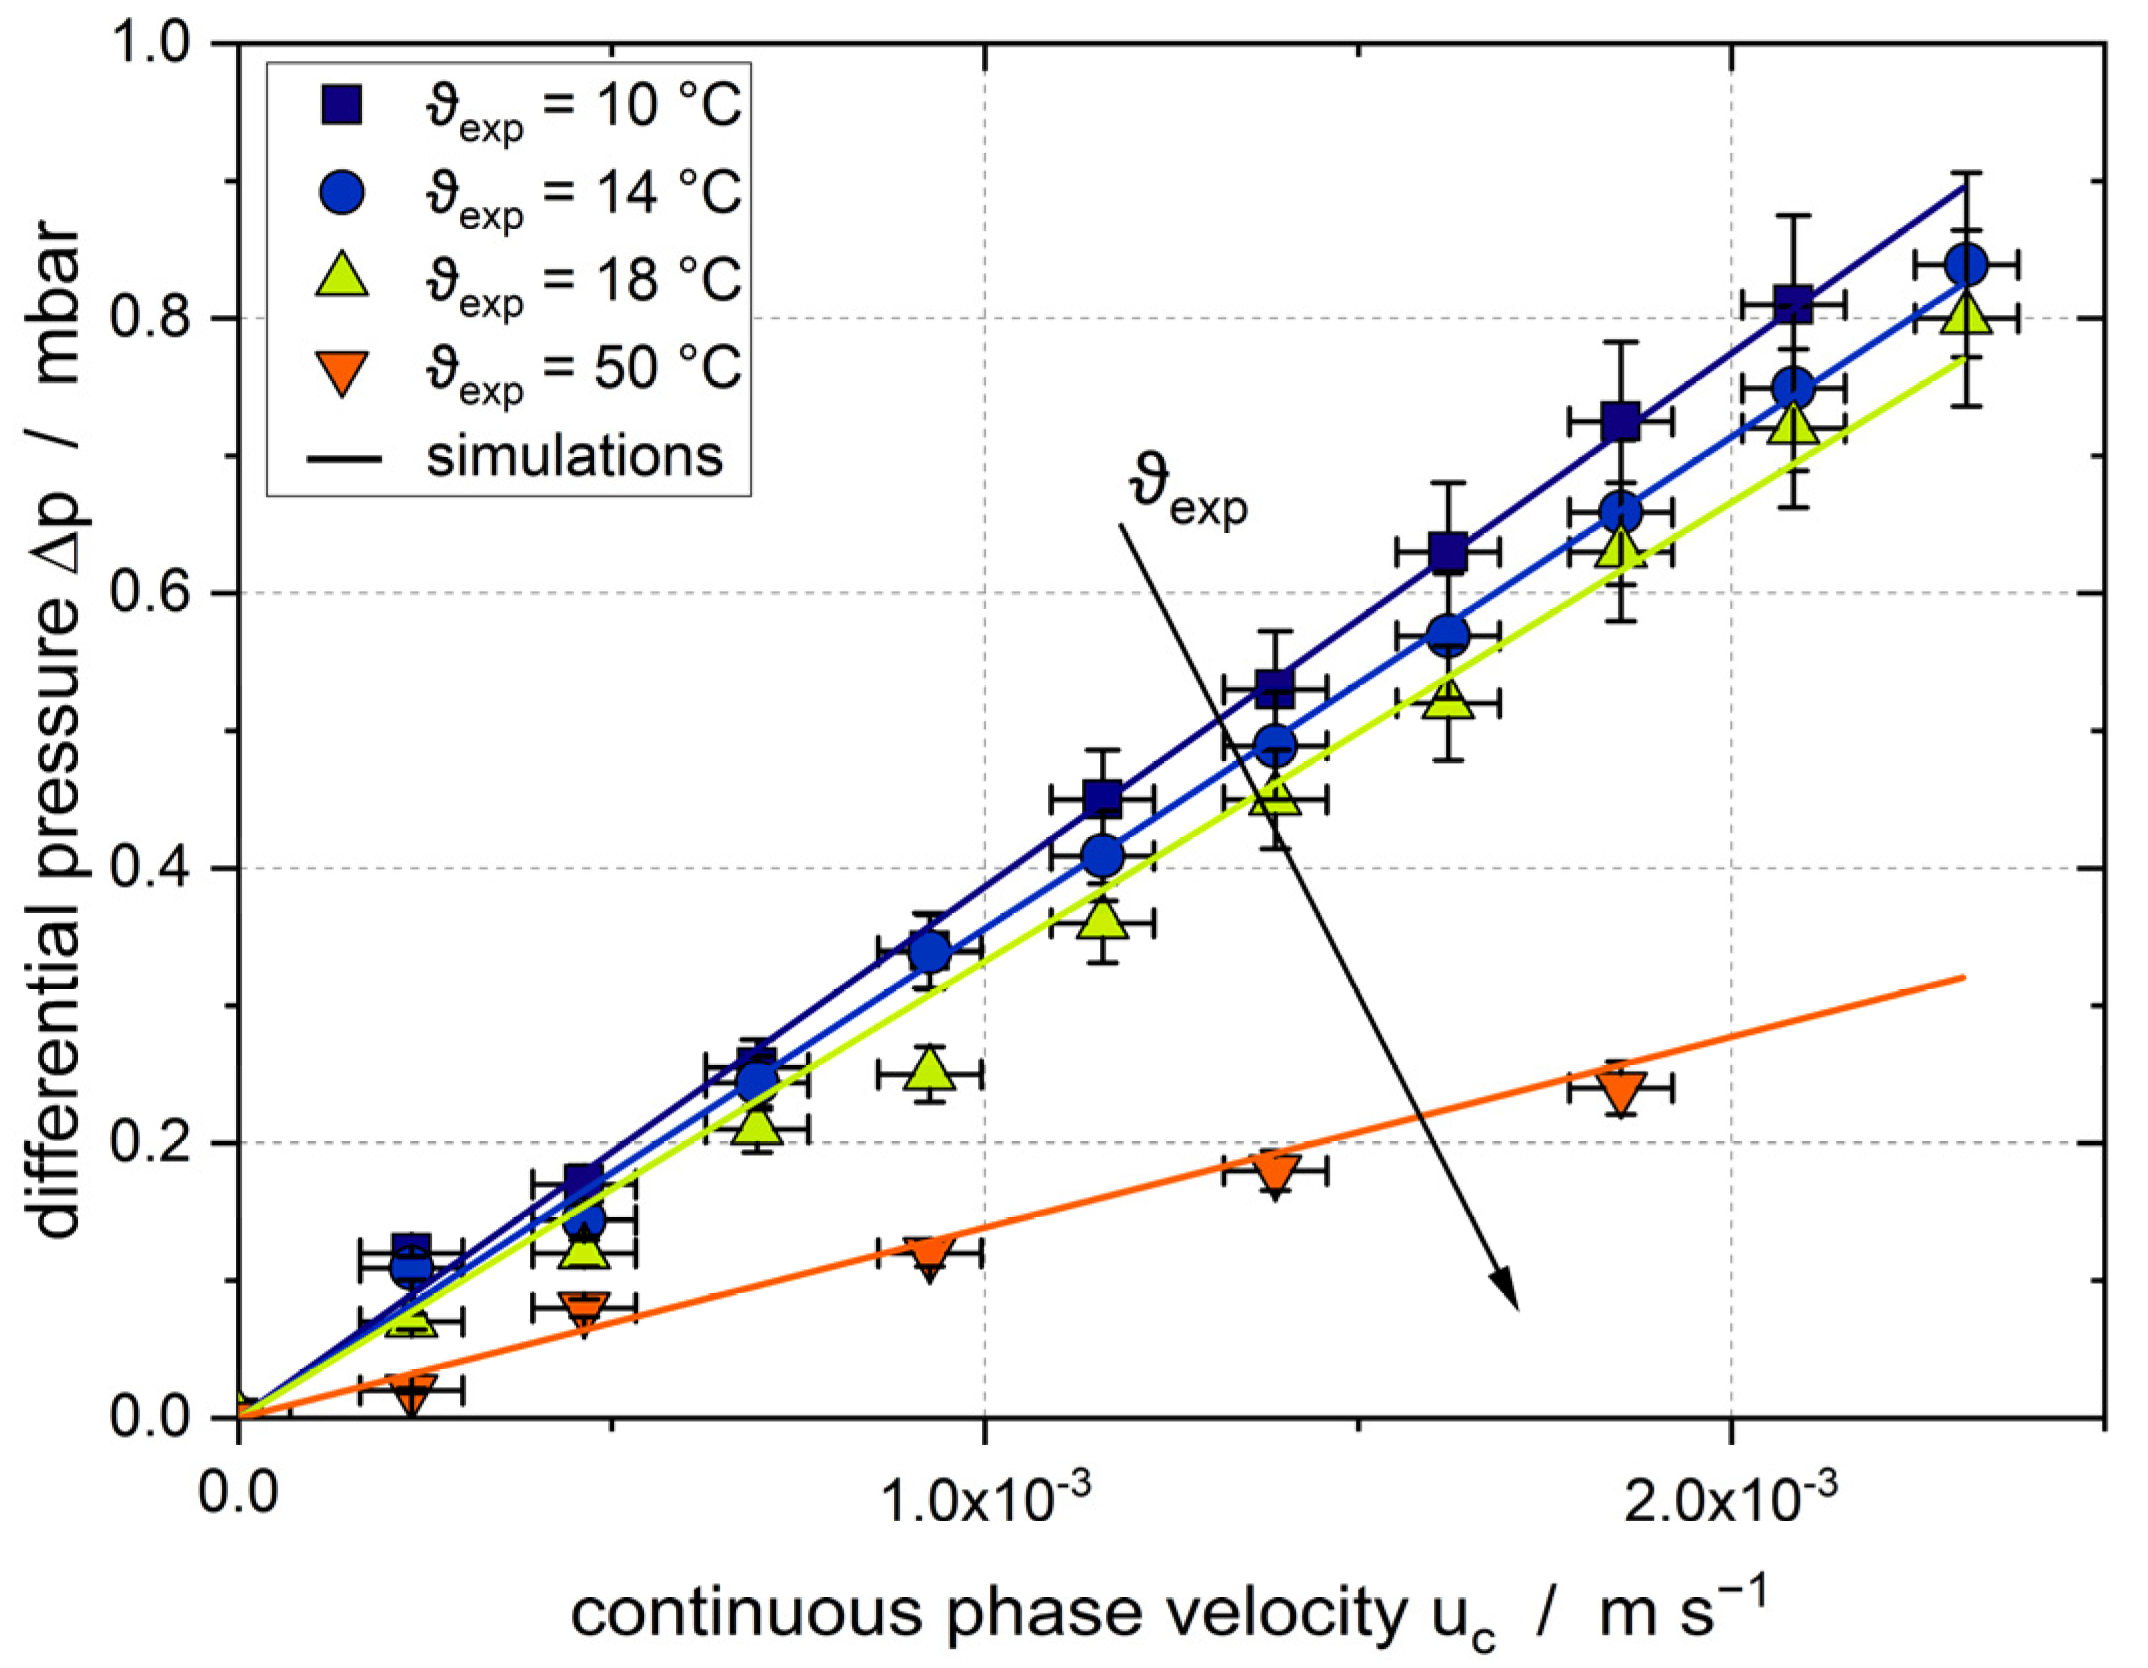
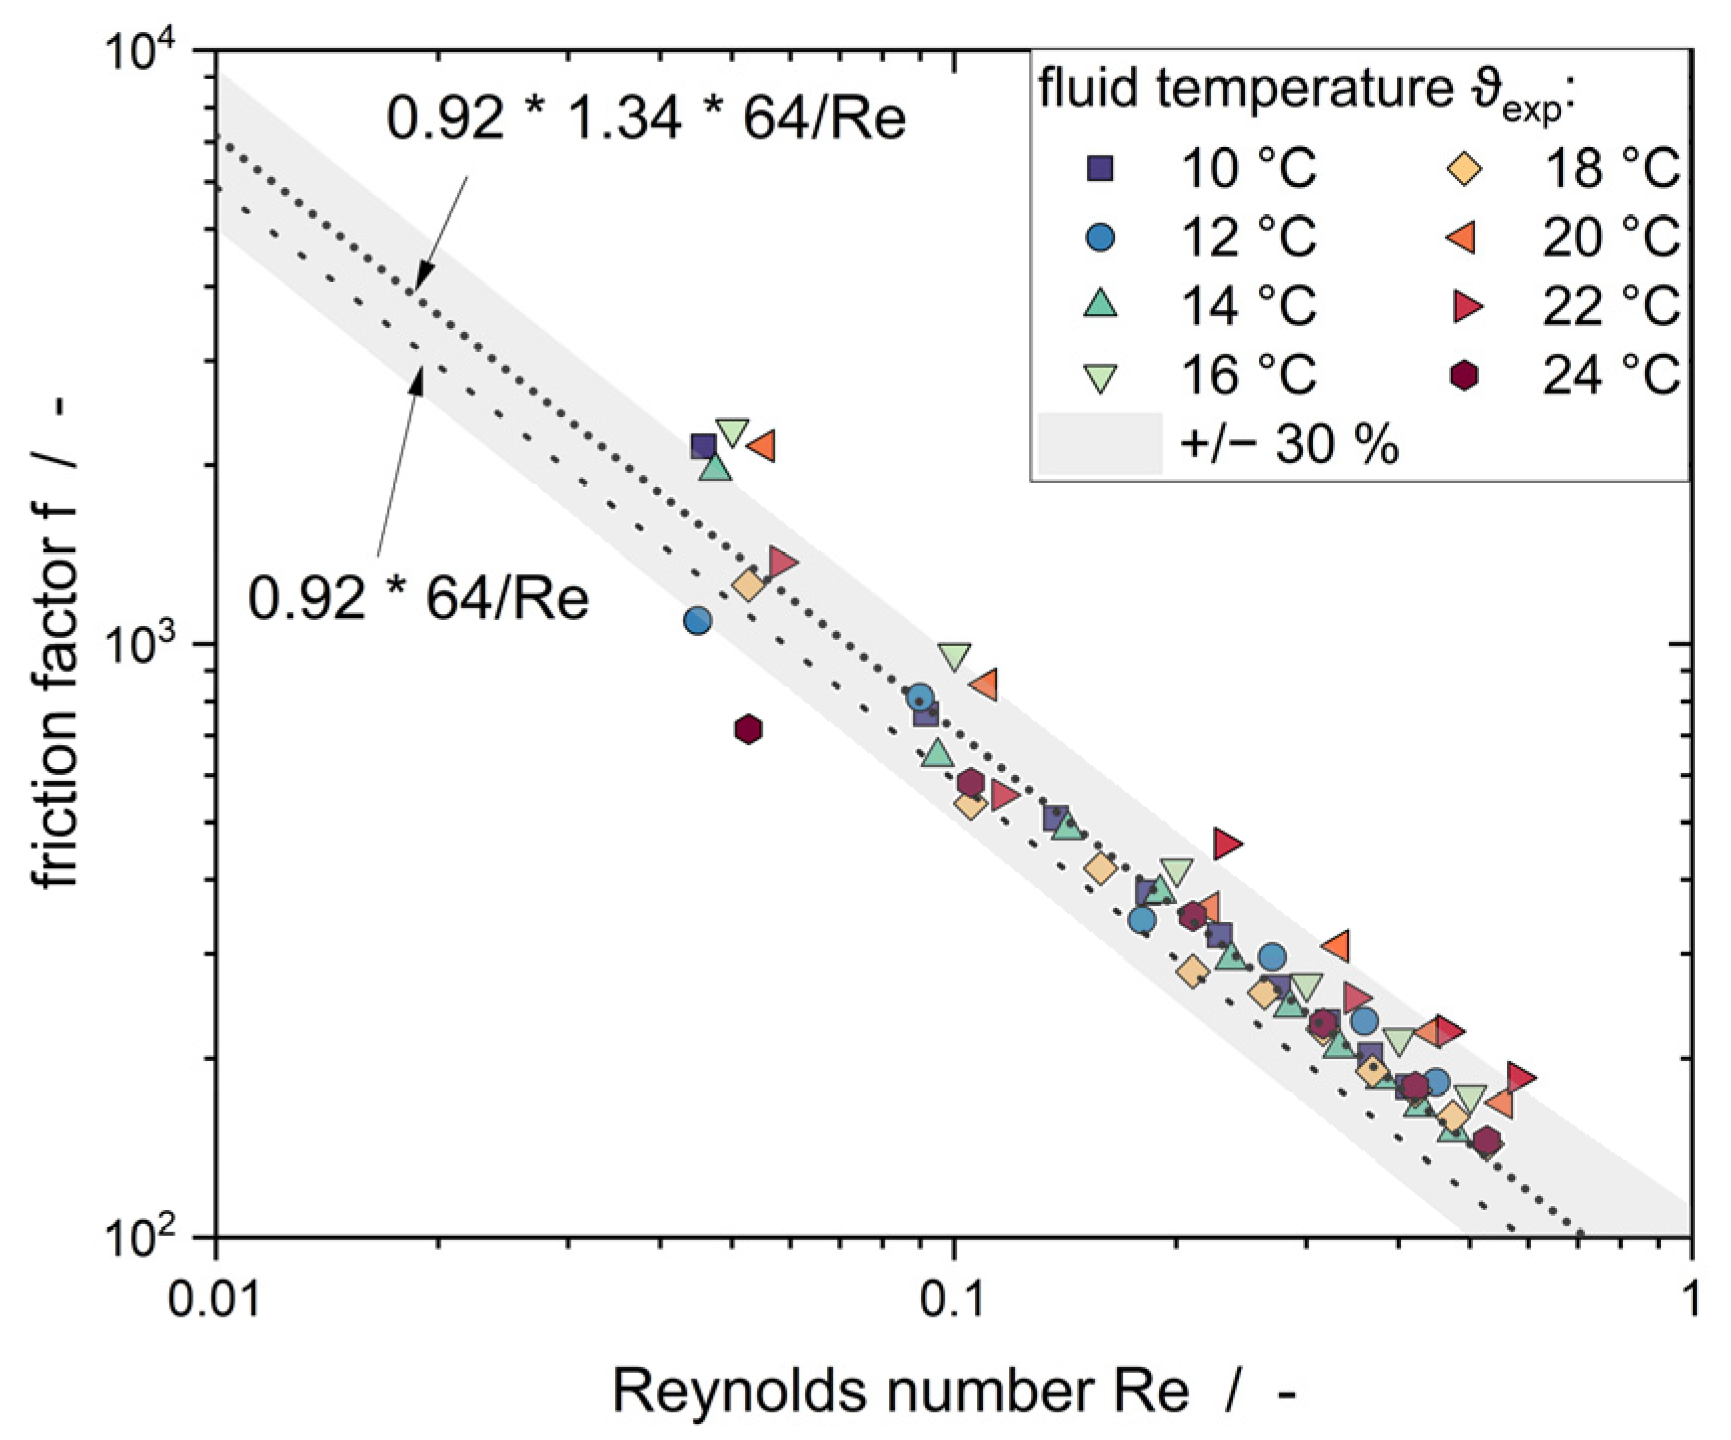
With this study, we aimed to investigate the minimal contact force F C M N , m i n needed for a successful CMN. This is of crucial importance to further understand the mechanisms behind CMN and how it might happen during the industrial production of melt emulsions. In analogy to [34], CMN is influenced by the external flow field [12,35], as the collision frequency and the contact force F in stirred systems are proportional to the apparent shear rate γ ˙ a p p , whereas the contact or interaction time t c is inversely proportional to γ ˙ a p p .
Microfluidic experiments are promising in gaining further insights into the induction times t i n d [7] and minimal forces for successful CMN F C M N , m i n (this study) needed to induce nucleation (Table 2).
This publication aims to verify or falsify the following hypothesis:
Theorem 1. 
The minimum contact force F C M N , m i n needed to induce nucleation due to the contact of a solid particle with a subcooled droplet increases with the increasing surfactant concentration as the disjoining pressure increases.
To investigate the stated hypothesis, firstly, the impact of the empty channel, moving liquid droplets and immobile solid particles in the channel geometry on the overall pressure drop was estimated.

3.1. Empty Channel

The flow of water through an empty rectangular channel was studied to validate the implementation of the differential pressure sensor by comparing the experimental measurements with the numeric simulations (Figure 6). The experimental data will also be compared to data presented in the literature to indicate their accuracy (Figure 7).
When the temperature was increased, the pressure drop through the channel decreased at all velocities of the continuous phase. There is a good agreement between the results of the experimental and the simulative works. Moreover, the data points are in good agreement with the theoretically calculated values (Figure 7).
Moody [36] described the friction factor as being independent of the relative roughness ϵ in the laminar flow regime for ϵ < 0.05. Therefore, the description of the laminar part should follow f = 64 / R e . Considering the different channel geometry (rectangular instead of round cross-section), f = 0.92 64 / R e [15] should describe the experimental data. Nonetheless, not only does the geometry of the channel play a major role for mini- and microchannels, but different authors described that increasing the relative roughness resulted in an increasing friction factor, even in laminar flow, due to a significant change of the free cross-sectional area of the channel (e.g., [23,36,37,38,39]). This could explain the shift of the experimental friction factor compared to the theoretical friction factor. Consequently, the experimental data points were fitted by introducing another correction parameter that indicates the deviation of the rough channel walls from smooth ones. The fit (Figure 7) led to f = 0.92 1.34 64 / R e . As the latter formula is able to describe the data with a coefficient of determination R 2 > 0.98, this indicates that inertial effects and the redirection of the flow due to the wall roughness can be neglected.
The results presented show that the experimental setup can generally be used to determine the pressure drop in the microfluidic channel. In the following step, a solid particle will be introduced into the channel. The simulations aim to determine the influence of the film thickness between the particle and the wall as well as in the channel corners (area of bypass flow) on the overall pressure drop.

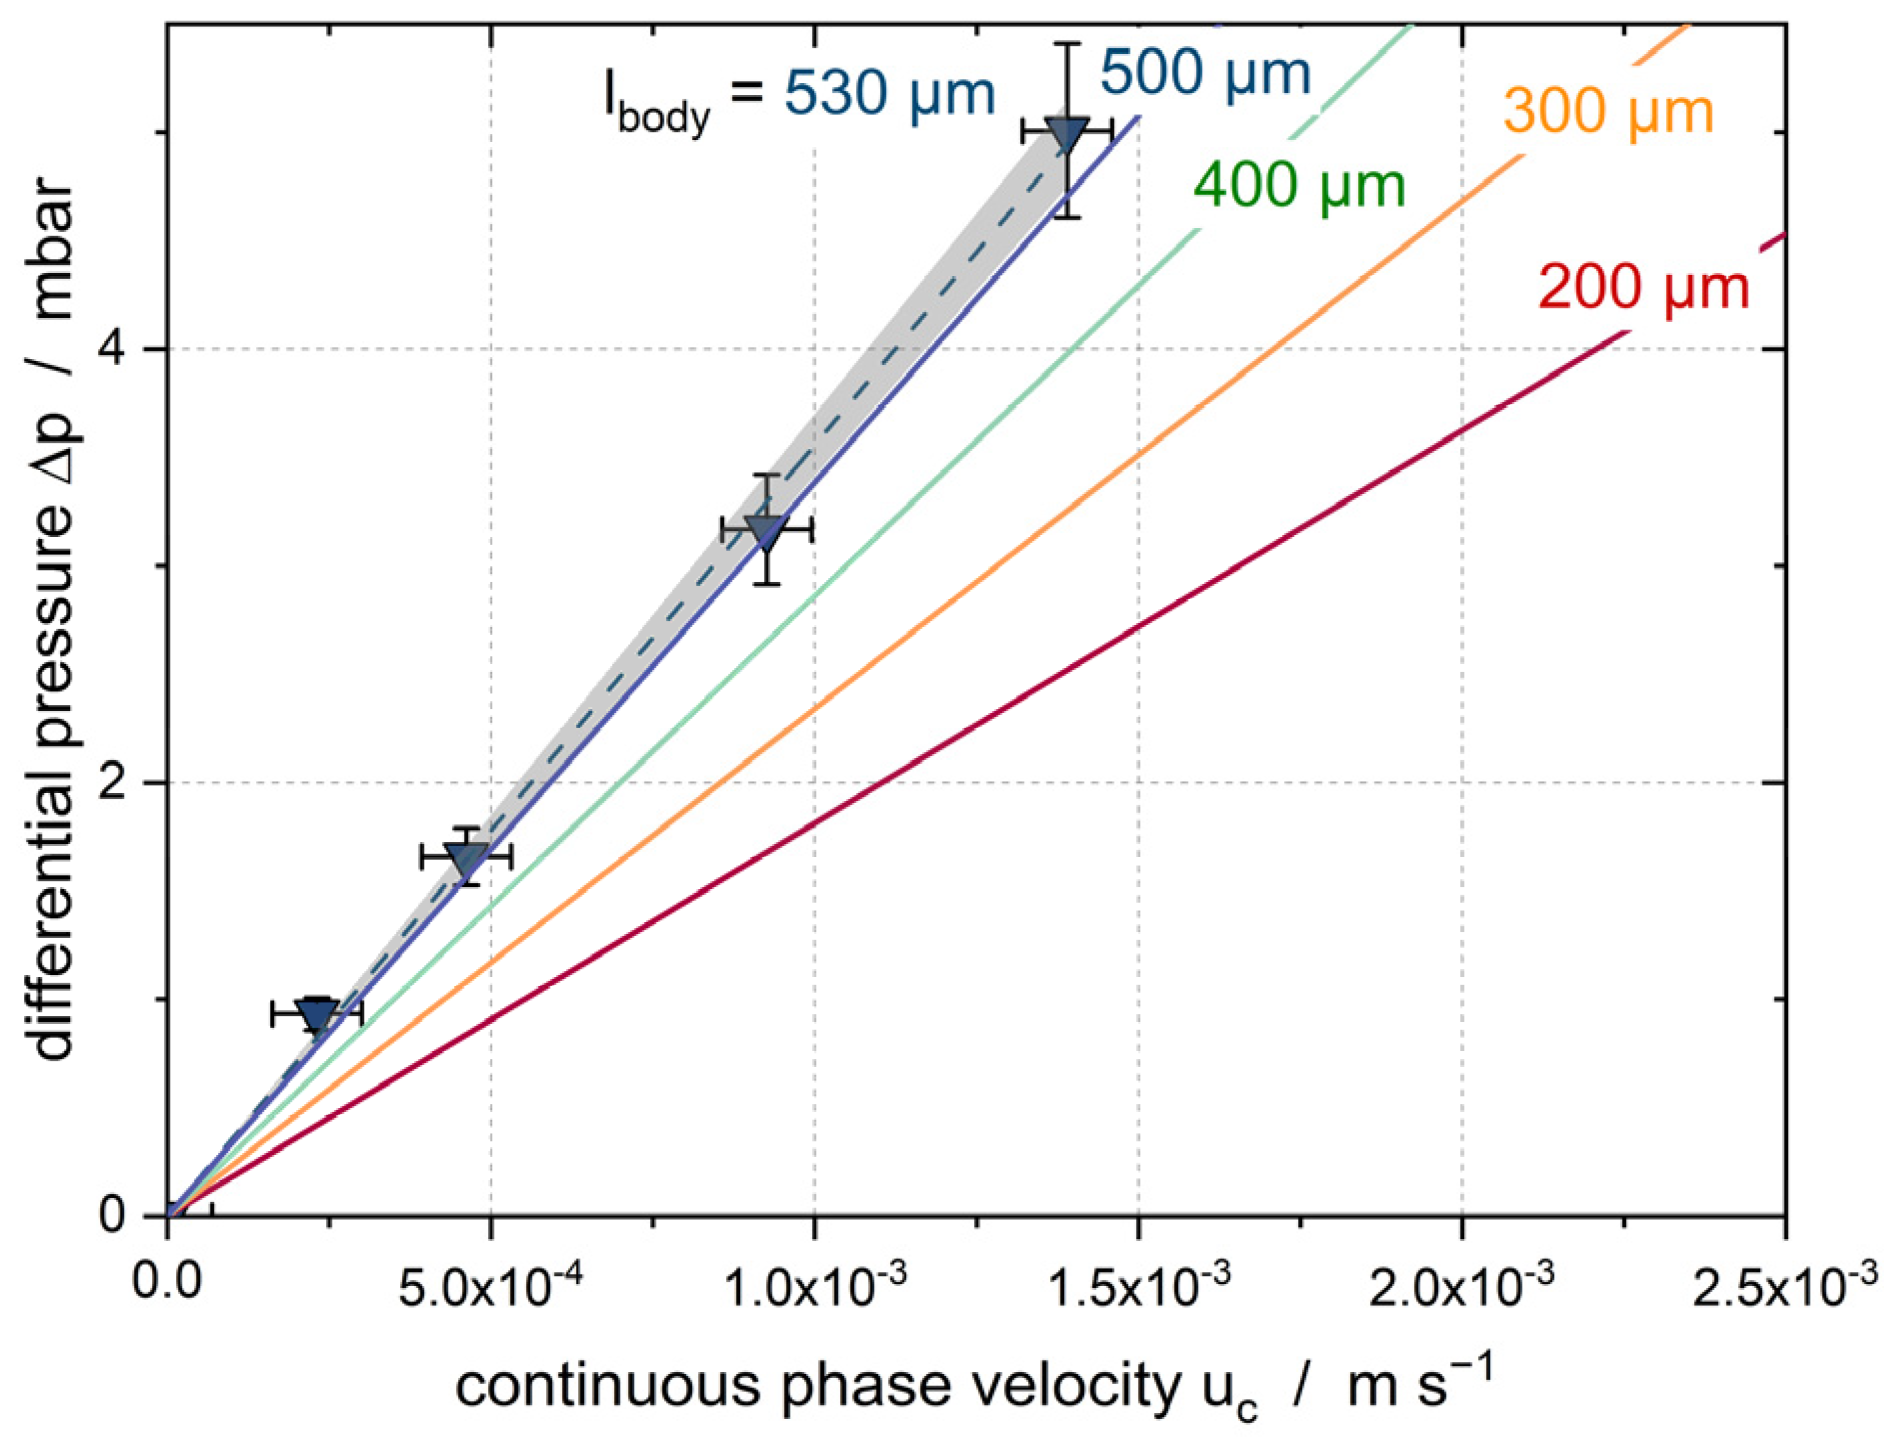
3.2. Solid Particle in Channel

Simulations were carried out for particles with different lengths to outline the impact of a solid particle in the microfluidic channel on Δ p (Figure 8). The cap of the particles used for these simulations was constructed following the images taken from the experiments. This resulted in a cap length of 45 µm. In the first approach, a film thickness of 2 µm was assumed. It is shown later that this assumption leads to comparable results for the numeric simulations and the experiments.
It can be seen that Δ p increases with an increasing flow velocity of the continuous phase u c and an increase in the particle length. The experimental validation of the simulative results has been successful. A simulative parameter study was performed to further understand the impacts of the particle dimensions ( h f , l b o d y , l c a p ) (Figure 9).
With increasing l b o d y and l c a p , Δ p increased along the microfluidic channel. For l b o d y and l c a p this increase can be explained by the reduction in porosity. The linear increase of Δ p with increasing l b o d y follows expectations. When the thickness of the liquid film between the particle and the channel wall h f was increased, Δ p along the channel decreased as A f l o w increased. With h f increasing from 0 µm to 5 µm, the relative deviation is only about 6%. As this is smaller than the accuracy of the experimental measurements and a good agreement between the experiments and the simulation was achieved with a thickness of 2 µm (compare Figure 8), the film thickness in the experiments should be between 0 µm and 5 µm.
The thickness of the film separating a moving droplet in a microchannel from the wall is mentioned to be about 1% to 5% of the half height of the channel for Capillary numbers of the droplet smaller than C a d < 0.01 [40,41,42] (compare Appendix A Table A2). In our work, the half-height is assumed to be half of d h , leading to a film thickness between 1.2 µm and 6 µm. This is in good agreement with the simulation of the particle in the flow field and the corresponding experimental validation, although the assumption was made for liquid droplets and not for solid particles. As the particle decreases in size due to the solidification, a slightly larger film thickness would be reasonable.
The simulative Δ p and u c were tracked along three lines in the minichannel to investigate the individual impact of the caps and the body on Δ p (Figure 10).
It becomes visible that the main fraction of Δ p decreases along the body of the particle, and the impact of the particle on the overall Δ p is larger than the Δ p along the empty channel. In addition, the pressure drop along the corners dominates the overall Δ p . This is in good agreement with the findings of [29]. The main pressure drop for liquid droplets without surfactant was found to be in the plugs, i.e., sections between the droplets, for inviscid droplets, and along the body for viscous droplets [43]. Fuerstman et al. [28] found that, by introducing an intermediate concentration of surfactant (1 to 2 orders of magnitude of c m c ), the pressure drop along a bubble is dominated by the loss along the body length. The pressure was found to drop most rapidly along the caps for no or a high concentration of surfactant. The two main differences between the data found in literature and our results are that we investigated a stationary solid particle instead of a movable liquid or gaseous droplet/bubble.

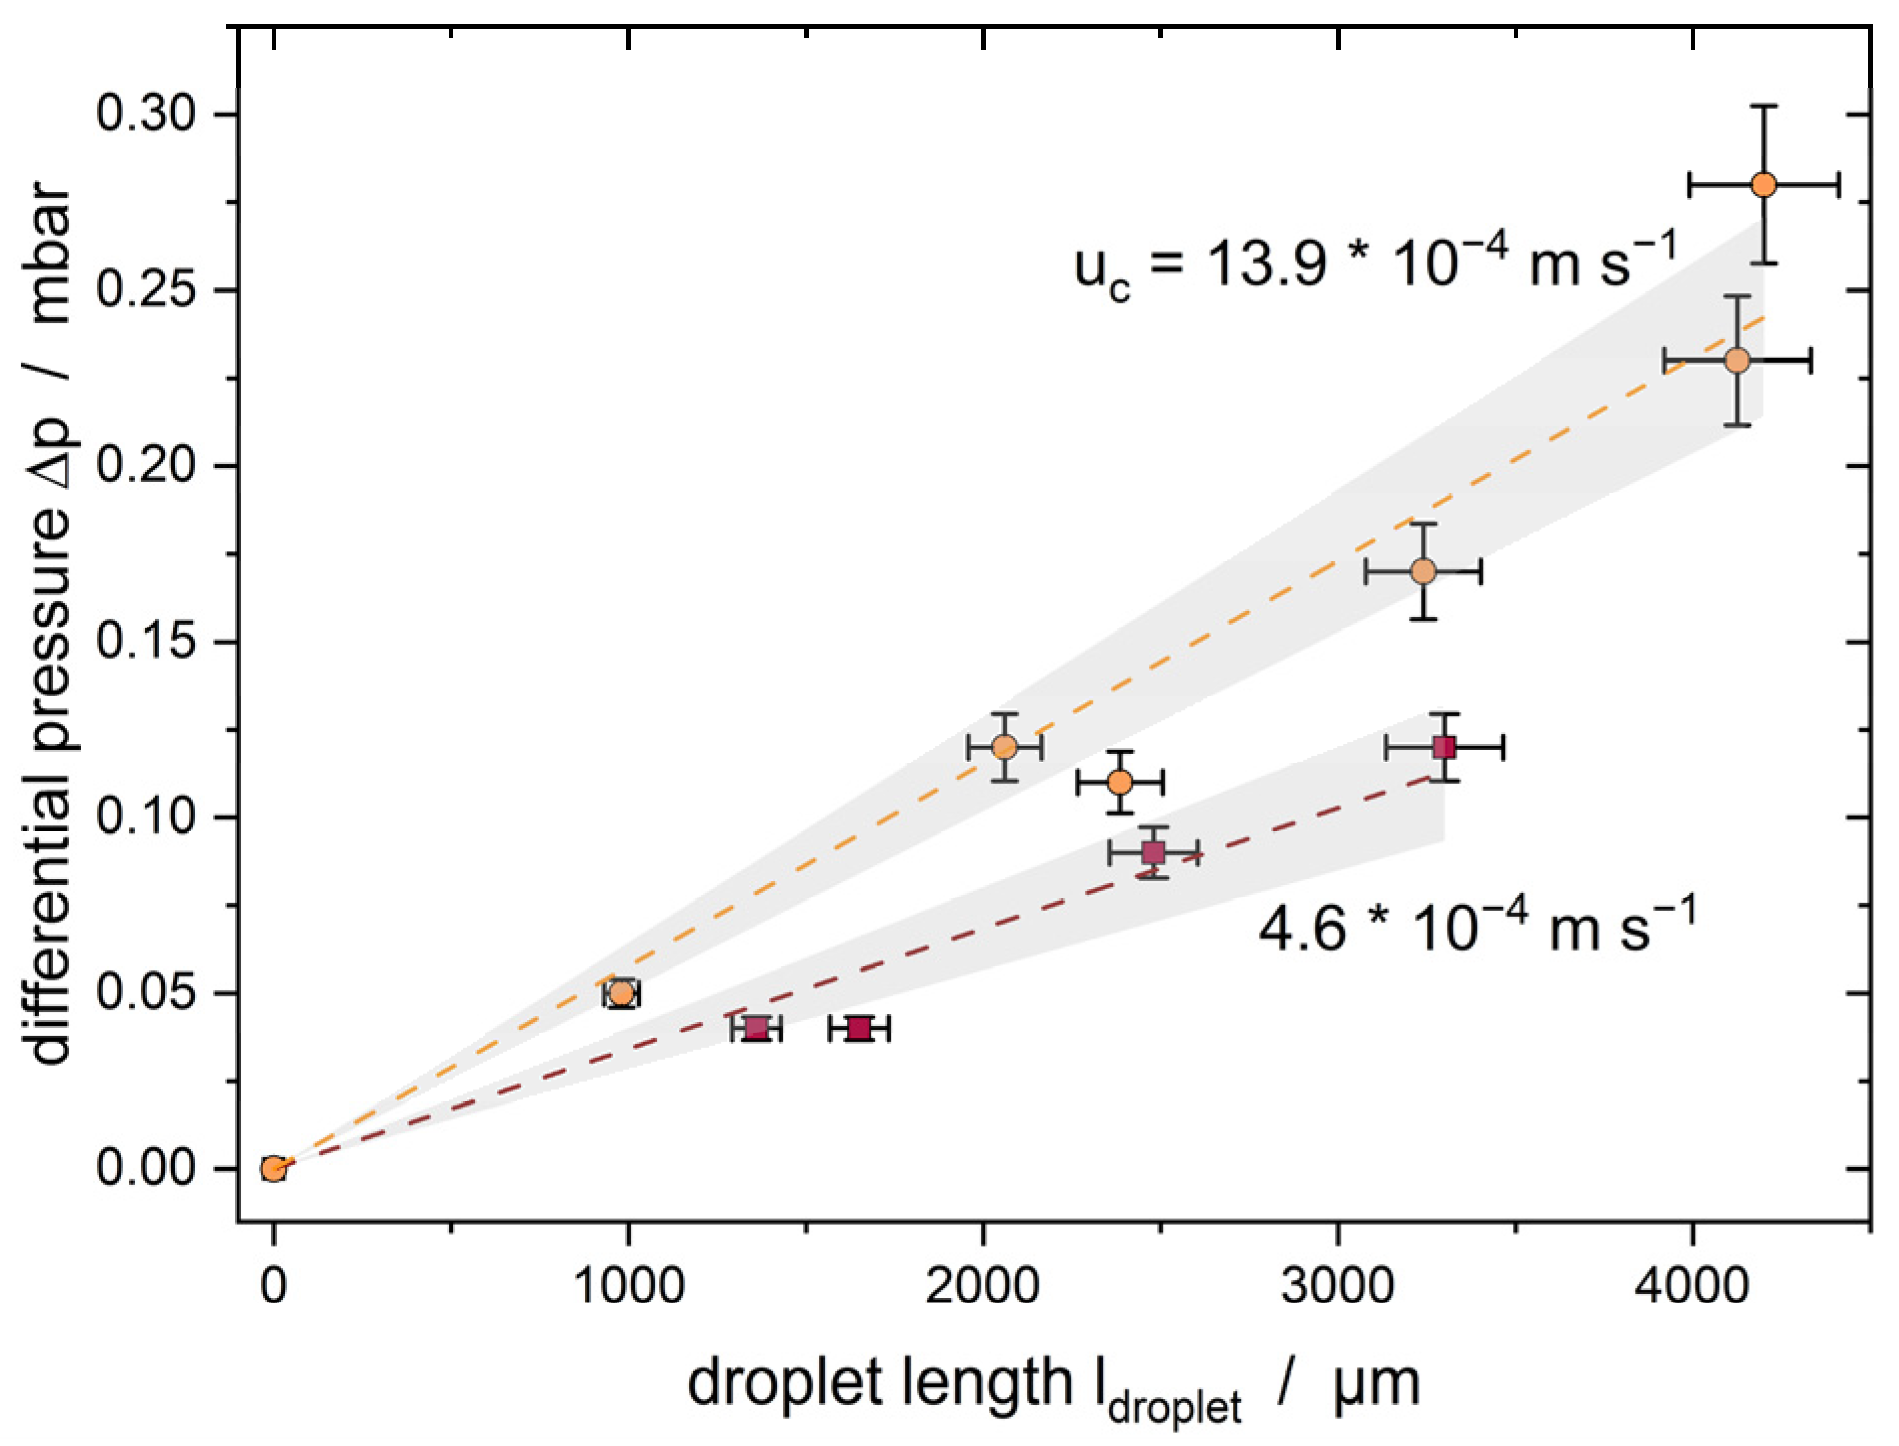
3.3. Moving Droplets

The last step before evaluating the contact force needed for inoculation is to investigate how liquid droplets that move through the channel impact Δ p (Figure 11). Various authors discuss the impact of moving droplets on Δ p and describe an increasing Δ p when introducing moving droplets into the microfluidic channel [43,44].
At a constant velocity of the continuous phase u c , Δ p increases linearly with the total length of the droplets inside the channel. This points out that the moving droplets also influence the overall pressure loss, which was also described in the literature previously [43,44]. This result can be explained by the observation that the liquid droplets moved slightly slower than the adjusted velocity of the continuous phase. According to [45], the difference between the velocity of the continuous phase and that of the droplet should be no larger than 6%. In our experiments, the droplets were 1–10% slower than the continuous phase, which is in good agreement with the literature [45]. Regarding the impact of a solid particle on Δ p , there is a difference in an order of magnitude (compare Figure 8). Nonetheless, the impact of moving droplets on the overall Δ p must be considered when finally evaluating the CMN and calculating the force needed to trigger crystallization.

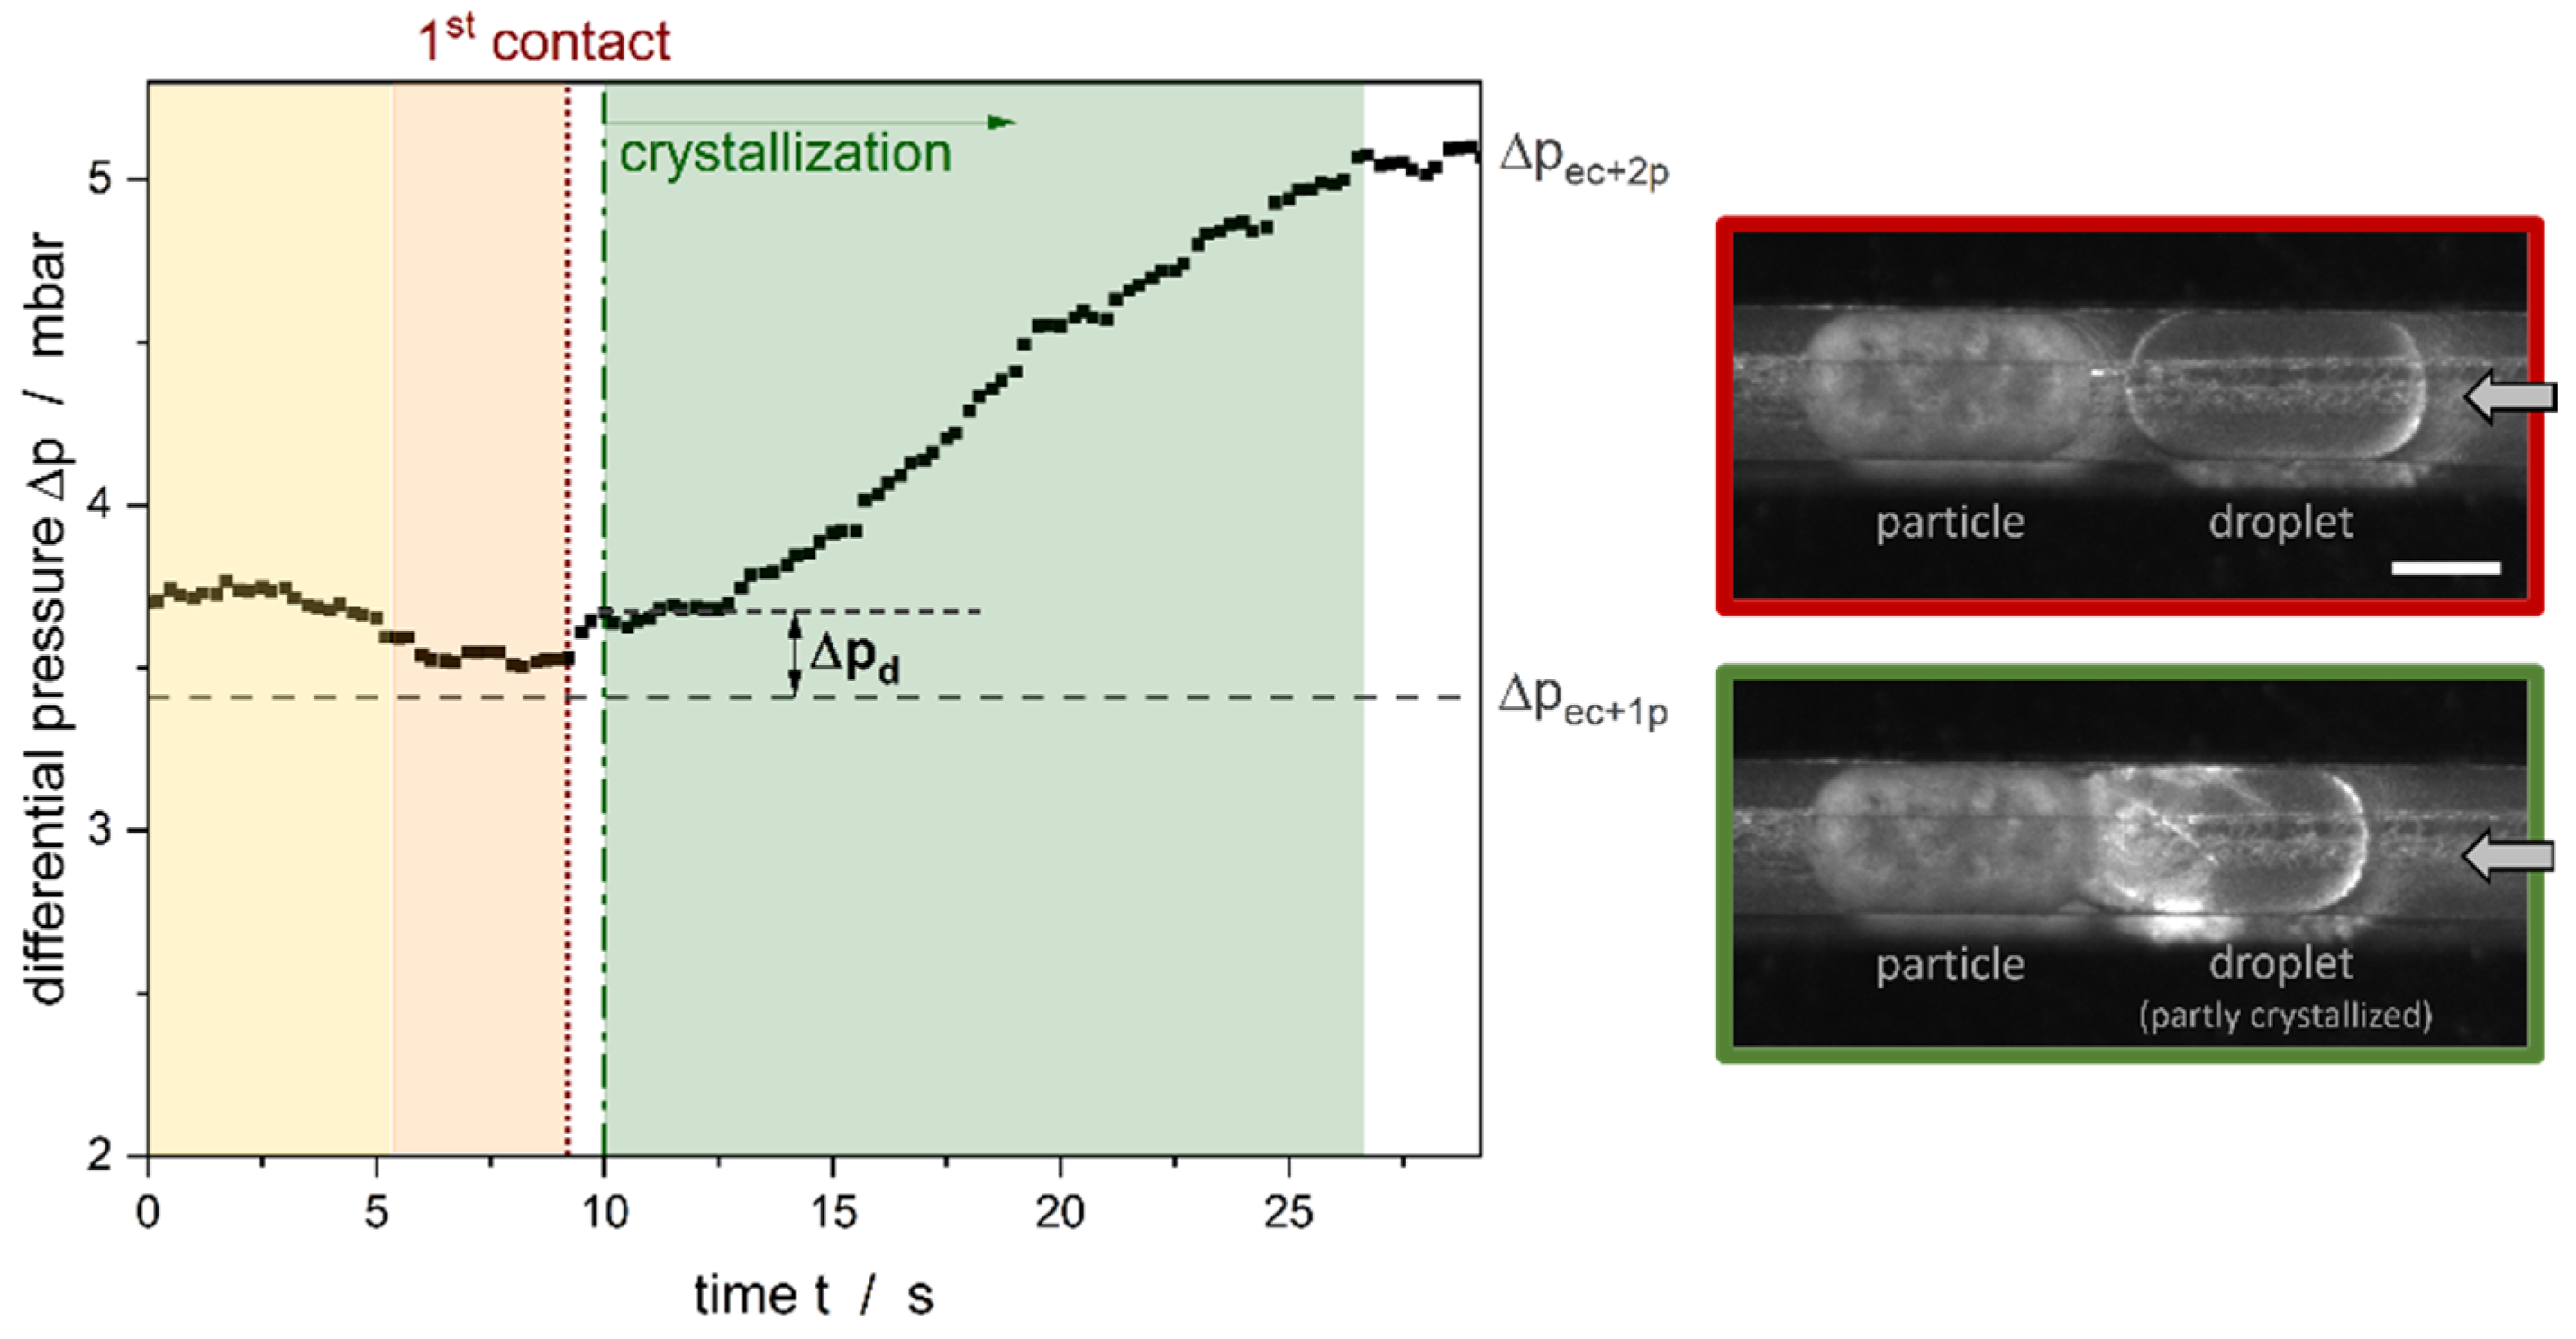
3.4. Differential Pressure during Crystallization

Having gained knowledge about the impacts of droplets and particles on the overall pressure loss, the results for the CMN can now be evaluated. Figure 12 shows an exemplary measurement of Δ p during an experimental performance of a CMN.
Different phases can be found for Δ p as a function of time t during the experimental investigation of the CMN:
  • t < 0: One solid particle can already be found in the channel. The corresponding Δ p e c + 1 p c is the sum of the pressure loss due to the fluid flow of the continuous phase around the particle and the empty channel.
  • Yellow region: In addition to the solid particle, one liquid droplet is formed at the T-junction of the channel and is inserted into the main channel.
  • Orange region: The formation of the liquid droplet is finished, and the droplet is moving towards the solid particle along the rectangular channel. As the previous results stated, the moving droplet resulted in an additional pressure loss. That is why Δ p > Δ p e c + 1 p c in this region. The first contact between the liquid and the solid particles happened at the end of this region.
  • The time between the first visible contact and the visible start of the crystallization is called the induction time and describes the time needed for the successful inoculation of the subcooled, liquid droplet. We were able to show in a previous work that the induction time is a function of the aqueous surfactant concentration and the relative velocity between the two collision partners [7]. Moreover, nucleation is possible because the solid particle seems to have a partial interfacial coverage with surfactant molecules compared to the fully covered interface of liquid droplets [46]. The surfactant molecules are moveable on the interface of the droplet, therefore, a molecular contact between these two partners can be given.
  • Green region: After the crystallization starts, the crystal strands grow through the subcooled droplet until the droplet is completely crystallized. The speed of growth strongly depends on the subcooling (here: Δ T ~ 1.1 K). The speed of growth increases as the temperature decreases. The increase of Δ p can be explained by the change in the elasticity of the droplet as the latter becomes solid and due to the deformation of the liquid part of the droplet as it is pushed to the particle.
  • As soon as the droplet is completely crystallized, Δ p becomes constant at the level indicated as Δ p e c + 2 p c (empty channel + two solid particles). As has been shown previously, the pressure loss due to the particle depends strongly on the size of the particle.
The pressure difference Δ p d between Δ p e c + 1 p c and the beginning of the crystallization can be used to estimate the force needed for successful inoculation after the contact F c :
F c = Δ p d A c h a n n e l .
A c h a n n e l hereby represents the cross-section of the channel, here A c h a n n e l = 6 10 8 m2. Δ p d needed for nucleation was investigated as a function of the surfactant concentration at different u c (Figure 13).
At a constant relative velocity of the droplet and the particle Δ u , Figure 13 shows that Δ p d increases with increasing surfactant concentration. The velocity of the continuous phase u c has a linear relationship to Δ u as the latter equals the velocity of the liquid droplet in this setup. For the two lower surfactant concentrations (w/o TW20 and 4 cmc), the induction time t i n d was <<1 s for u c > 4.6   10 4 m s−1 and, consequently, no Δ p d could be determined, but all collisions led to nucleation of the subcooled droplet.
In addition to F c , the force due to the impulse of the decelerating droplet F i must be considered to determine the overall contact force needed for successful CMN:
F i = m d d u d d t .  
The minimal and maximal droplet volumes were used to estimate the mass of the droplets m d = 1.2   10 8     3.4   10 8 kg. The time the droplet needed for deceleration was assumed to be 0.01 s as this was the highest possible resolution of the camera. Any possible deformation of the droplet was not considered. As the time the droplet needed for decelerating cannot be estimated properly, this points out the limitation of the estimation of F i . Nonetheless, higher droplet velocities must lead to an increase of F i (Figure 14).
Both forces presented must be added together to determine the overall minimum force needed for CMN F C M N , m i n :
F C M N , m i n = F c + F i .  
The increase of F C M N , m i n   with increasing surfactant concentration might be explained by an increase in the aqueous number of micelles. This is in good agreement with, for example, Dudek et al. [47] or Kaysan et al. [7], who found longer mean coalescence times or mean induction times for CMN when increasing c ˜ T W 20   in the aqueous phase. Both results lead to the conclusion that the aqueous number of micelles impacts the efficiency of CMN. For c ˜ T W 20   = 0.41 mol m−3 (8 c m c ), there was no crystallization detectable for u c < 4.6   10 4 m s−1, which also can be explained by the large number of micelles that hinder the contact between the two collision partners. Before the nucleation could happen, the droplet surrounded the particle and was finely emulsified into smaller droplets behind it.
Proof of Theorem 1. 
Measuring the differential pressure during the CMN in a microfluidic channel in combination with numeric simulations led to the verification of Theorem 1: Increasing minimum contact forces F C M N , m i n were determined with increasing surfactant concentrations. □
The calculation of F i is prone to errors due to experimental limitations, therefore, the comparison of different velocities with each other must be considered with caution. On the one hand, the decrease of F c with increasing Δ u (shown as an increase in u c ) might be a result of increasing F i and, consequently, only fewer additional forces are needed induce CMN. F C M N , m i n could further be reduced by the destruction and displacement of micelles at increasing velocities of the approaching subcooled droplet. The latter hypothesis is strengthened by Christov et al. [48], who found that TW20 micelles can be dissolved by the application of shear stress. Kinoshita et al. [49], for example, succeeded in demonstrating that internal flows are formed in droplets moving through a rectangular channel. The flow on the surface of the droplet is opposite to the flow direction. This could mean for an interface loaded with surfactant molecules that with higher droplet velocities, the surfactant molecules on the surface are also displaced more strongly and accumulate at the rear part of the droplets due to their low solubility in the oil phase. This would result in a decrease of F c and, consequently, F C M N , m i n because fewer surfactant molecules must be displaced.

4. Conclusions

This work investigated the pressure loss in a microfluidic channel. Experimental results have been compared with numerical values for a rectangular microfluidic channel that had water flowing through it. For the first time, the impact of a solid particle on the pressure loss was examined during a numerical parameter study and revealed that the film thickness between the particle and the wall should be up to 2% of the hydraulic diameter of the channel. The highest fluid velocities around the particle were found in the bypass or gusset flows in the corners of the rectangular channel. Moreover, the length of the bodies of the droplets had the largest impact on the pressure drop along the channel.
Regarding the CMN, the force needed for a successful inoculation during the CMN has been estimated for the first time. We were able to prove that the addition of surfactant increased the force needed or even hindered the CMN completely. Further investigations will now focus on the investigation of charged surfactants as they increase the disjoining pressure and, therefore, the contact force needed for CMN should increase at the same time.

Author Contributions

Conceptualization, G.K.; methodology, G.K. and K.D.; software, G.K. and K.D.; validation, G.K.; formal analysis, G.K.; investigation, G.K., T.H. and K.D.; resources, M.K.; data curation, G.K., T.H. and K.D.; writing—original draft preparation, G.K.; writing—review and editing, K.D., T.H. and M.K.; visualization, G.K.; supervision, M.K. All authors have read and agreed to the published version of the manuscript.

Funding

This research received no external funding.

Institutional Review Board Statement

Not applicable.

Informed Consent Statement

Not applicable.

Data Availability Statement

All important data are included in the paper. The raw data are available upon request.

Acknowledgments

The authors want to thank Max Renaud from the Institute of Thermal Process Engineering for the fabrication of the raw polycarbonate chip and for helping to integrate the differential pressure sensor. Furthermore, the help of Martin Kansy with the setup of the numeric parameter study is acknowledged. We acknowledge support by the KIT-Publication Fund of the Karlsruhe Institute of Technology.

Conflicts of Interest

The authors declare no conflict of interest.

Appendix A. Calculation of Dimensionless Numbers

  • Reynolds number Re
Re is meant to be the prominent example of dimensionless key figures in the field of fluid dynamics [13,50]. The inertia force for Re << 1 can be neglected, and the Navier-Stokes equation simplifies to a Stokes form.
  • Capillary number Ca
The ratio between viscous friction forces and surface forces can be described using C a :
C a = η u γ .  
Especially regarding the microfluidic system, C a is a relevant criterium to, for example, describe the droplet formation at the T-junction or the thickness of the liquid film [51].
Table A1. Fluid properties at ϑ e x p = 17.5 °C used for the calculations of the dimensionless numbers.
Fluid PropertiesSymbolValue
Density/kg m−3water ρ 998.7
n-hexadecane775.1
Dynamic
viscosity/mPa s
water η 1.07
n-hexadecane3.70 1
Interfacial tension/
N m−1
with TW20 γ 0.004 2
without TW200.047 3
1 Own measurements, for ϑ > ϑ m , h e x and linear approximation to ϑ e x p = 17.5 °C (< ϑ m , h e x ); 2 own measurements, in analogy to [7]; 3 [52].
Table A2. Important dimensionless numbers for the fluid velocities in the microfluidic channel. The fluid properties listed in Table A1 were used for the calculations.
Fluid   Velocity   u c / m   s 1 Droplet   Capillary   Number   C a d Reynolds   Number   R e
without TW20with TW20
2.3   10 4 1.8   10 5 2.1   10 4 5.2 10 2
4.6   10 4 3.6   10 5 4.3   10 4 1.0 10 1
9.3   10 4 7.3   10 5 8.6   10 4 2.1 10 1
1.4   10 3 1.1   10 4 1.3   10 3 3.1 10 1
1.9   10 3 1.5   10 4 1.7   10 3 4.2 10 1
2.3   10 3 1.8   10 4 2.1   10 3 5.2 10 1

References

  1. Bunjes, H.; Koch, M.H.J.; Westesen, K. Influence of emulsifiers on the crystallization of solid lipid nanoparticles. J. Pharm. Sci. 2003, 92, 1509–1520. [Google Scholar] [CrossRef] [PubMed]
  2. Kalnin, D.; Schafer, O.; Amenitsch, H.; Ollivon, M. Fat Crystallization in Emulsion: Influence of Emulsifier Concentration on Triacylglycerol Crystal Growth and Polymorphism. Cryst. Growth Des. 2004, 4, 1283–1293. [Google Scholar] [CrossRef]
  3. Maruyama, J.M.; Soares, F.A.S.D.M.; D’Agostinho, N.R.; Gonçalves, M.I.A.; Gioielli, L.A.; Da Silva, R.C. Effects of emulsifier addition on the crystallization and melting behavior of palm olein and coconut oil. J. Agric. Food Chem. 2014, 62, 2253–2263. [Google Scholar] [CrossRef] [PubMed]
  4. Miskandar, M.S.; Man, Y.C.; Rahman, R.A.; Aini, I.N.; Yusoff, M. Effects of Emulsifiers on Crystal Behavior of Palm Oil Blends On Slow Crystallization. J. Food Lipids 2007, 14, 1–18. [Google Scholar] [CrossRef]
  5. Kashchiev, D.; Clausse, D.; Jolivet-Dalmazzone, C. Crystallization and Critical Supercooling of Disperse Liquids. J. Colloid Interface Sci. 1994, 165, 148–153. [Google Scholar] [CrossRef]
  6. Mastai, Y. Advanced Topics in Crystallization; IntechOpen: London, UK, 2015; ISBN 9789535121251. [Google Scholar]
  7. Kaysan, G.; Rica, A.; Guthausen, G.; Kind, M. Contact-Mediated Nucleation of Subcooled Droplets in Melt Emulsions: A Microfluidic Approach. Crystals 2021, 11, 1471. [Google Scholar] [CrossRef]
  8. McClements, J.D.; Dickinson, E.; Povey, M. Crystallization in hydrocarbon-in-water emulsions containing a mixture of solid and liquid droplets. Chem. Phys. Lett. 1990, 172, 449–452. [Google Scholar] [CrossRef]
  9. Dickinson, E.; Kruizenga, F.-J.; Povey, M.J.; van der Molen, M. Crystallization in oil-in-water emulsions containing liquid and solid droplets. Colloids Surf. A Physicochem. Eng. Asp. 1993, 81, 273–279. [Google Scholar] [CrossRef]
  10. McClements, D.J.; Dungan, S.R. Effect of Colloidal Interactions on the Rate of Interdroplet Heterogeneous Nucleation in Oil-in-Water Emulsions. J. Colloid Interface Sci. 1997, 186, 17–28. [Google Scholar] [CrossRef]
  11. Povey, M.J.W.; Awad, T.S.; Huo, R.; Ding, Y. Quasi-isothermal crystallisation kinetics, non-classical nucleation and surfactant-dependent crystallisation of emulsions. Eur. J. Lipid Sci. Technol. 2009, 111, 236–242. [Google Scholar] [CrossRef]
  12. Kaysan, G.; Schork, N.; Herberger, S.; Guthausen, G.; Kind, M. Contact-mediated nucleation in melt emulsions investigated by rheo-nuclear magnetic resonance. Magn. Reason. Chem. 2022, 60, 615–627. [Google Scholar] [CrossRef] [PubMed]
  13. Reynolds, O. An experimental investigation of the circumstances which determine whether the motion of water shall be direct or sinuous, and of the law of resistance in parallel channels. Phil. Trans. R. Soc. 1883, 174, 935–982. [Google Scholar] [CrossRef]
  14. Kandlikar, S.G. Single-phase liquid flow in minichannels and microchannels. In Heat Transfer and Fluid Flow in Minichannels and Microchannels; Kandlikar, S.G., Garimella, S., Li, D., Colin, S., King, M., Eds.; Elsevier: London, UK, 2006; pp. 87–136. ISBN 9780080445274. [Google Scholar]
  15. Kast, W.; Gaddis, E.S.; Wirth, K.-E.; Stichlmair, J. L1 Pressure Drop in Single Phase Flow. In VDI Heat Atlas; VDI e.V., Ed.; Springer: Berlin/Heidelberg, Germany, 2010; pp. 1053–1116. ISBN 978-3-540-77876-9. [Google Scholar]
  16. Kandlikar, S.G.; Grande, W.J. Evolution of Microchannel Flow Passages--Thermohydraulic Performance and Fabrication Technology. Heat Transf. Eng. 2003, 24, 3–17. [Google Scholar] [CrossRef]
  17. Kockmann, N. Transport Phenomena in Micro Process Engineering; Springer: Berlin/Heidelberg, Germany, 2008; ISBN 978-3-540-74616-4. [Google Scholar]
  18. Chan, D.Y.C.; Horn, R.G. The drainage of thin liquid films between solid surfaces. J. Chem. Phys. 1985, 83, 5311–5324. [Google Scholar] [CrossRef]
  19. Qu, W.; Mudawar, I.; Lee, S.-Y.; Wereley, S.T. Experimental and Computational Investigation of Flow Development and Pressure Drop in a Rectangular Micro-channel. J. Electron. Packag. 2006, 128, 1–9. [Google Scholar] [CrossRef]
  20. Xu, B.; Ooti, K.T.; Wong, N.T.; Choi, W.K. Experimental investigation of flow friction for liquid flow in microchannels. Int. Commun. Heat Mass Transf. 2000, 27, 1165–1176. [Google Scholar] [CrossRef]
  21. Mohiuddin Mala, G.; Li, D. Flow characteristics of water in microtubes. Int. J. Heat Fluid Flow 1999, 20, 142–148. [Google Scholar] [CrossRef]
  22. Mirmanto, M. Prediction and Measurement of Pressure Drop of Water Flowing in a Rectangular Microchannel. DTM 2017, 3, 75–82. [Google Scholar] [CrossRef]
  23. Ghajar, A.J.; Tang, C.C.; Cook, W.L. Experimental Investigation of Friction Factor in the Transition Region for Water Flow in Minitubes and Microtubes. Heat Transf. Eng. 2010, 31, 646–657. [Google Scholar] [CrossRef]
  24. Steinke, M.E.; Kandlikar, S.G. Single-phase liquid friction factors in microchannels. Int. J. Therm. Sci. 2006, 45, 1073–1083. [Google Scholar] [CrossRef]
  25. Selzer, D.; Spiegel, B.; Kind, M. A Generic Polycarbonate Based Microfluidic Tool to Study Crystal Nucleation in Microdroplets. J. Cryst. Process Technol. 2018, 8, 1–17. [Google Scholar] [CrossRef]
  26. Xu, J.H.; Li, S.W.; Tan, J.; Wang, Y.J.; Luo, G.S. Preparation of highly monodisperse droplet in a T-junction microfluidic device. AIChE J. 2006, 52, 3005–3010. [Google Scholar] [CrossRef]
  27. Musterd, M.; van Steijn, V.; Kleijn, C.R.; Kreutzer, M.T. Calculating the volume of elongated bubbles and droplets in microchannels from a top view image. RSC Adv. 2015, 5, 16042–16049. [Google Scholar] [CrossRef]
  28. Fuerstman, M.J.; Lai, A.; Thurlow, M.E.; Shevkoplyas, S.S.; Stone, H.A.; Whitesides, G.M. The pressure drop along rectangular microchannels containing bubbles. Lab Chip 2007, 7, 1479–1489. [Google Scholar] [CrossRef] [PubMed]
  29. Ransohoff, T.; Radke, C. Laminar flow of a wetting liquid along the corners of a predominantly gas-occupied noncircular pore. J. Colloid Interface Sci. 1988, 121, 392–401. [Google Scholar] [CrossRef]
  30. Linke, D. Detergents. In Guide to Protein Purification, 2nd ed.; Burgess, R., Deutscher, M., Eds.; Elsevier: London, UK, 2009; pp. 603–617. ISBN 9780123745361. [Google Scholar]
  31. Weller, H.G.; Tabor, G.; Jasak, H.; Fureby, C. A tensorial approach to computational continuum mechanics using object-oriented techniques. Comput. Phys. 1998, 12, 620–631. [Google Scholar] [CrossRef]
  32. Salome, Version 9.3.0.; Open Cascade SA: Guyancourt, France, 2019.
  33. Roache, P.J. Perspective: A Method for Uniform Reporting of Grid Refinement Studies. J. Fluids Eng. 1994, 116, 405–413. [Google Scholar] [CrossRef]
  34. Chesters, A.A. The modelling of coalescence processes in fluid-liquid dispersions: A review of current understanding. Chem. Eng. Res. Des. 1991, 69, 259–270. [Google Scholar]
  35. Kaysan, G.; Spiegel, B.; Guthausen, G.; Kind, M. Influence of Shear Flow on the Crystallization of Organic Melt Emulsions—A Rheo-Nuclear Magnetic Resonance Investigation. Chem. Eng. Technol. 2020, 43, 1699–1705. [Google Scholar] [CrossRef]
  36. Moody, L.F. Friction Factors for Pipe Flow. Trans. Am. Soc. Mech. Eng. 1944, 66, 671–678. [Google Scholar] [CrossRef]
  37. Krishnamoorthy, C.; Ghajar, A.J. Single-Phase Friction Factor in Micro-Tubes: A Critical Review of Measurement, Instrumentation and Data Reduction Techniques From 1991–2006. In Proceedings of the ASME 2007 5th International Conference on Nanochannels, Microchannels, and Minichannels, Puebla, Mexico, 18–20 June 2007; pp. 813–825, ISBN 0-7918-4272-X. [Google Scholar]
  38. Tam, L.M.; Tam, H.K.; Ghajar, A.J.; Ng, W.S.; Wong, I.W.; Leong, K.F.; Wu, C.K. The Effect of Inner Surface Roughness and Heating on Friction Factor in Horizontal Micro-Tubes. In Proceedings of the ASME-JSME-KSME 2011 Joint Fluids Engineering Conference: Symposia—Parts A, B, C, and D, Hamamatsu, Japan, 24–29 July 2011; Volume 1, pp. 2971–2978, ISBN 978-0-7918-4440-3. [Google Scholar]
  39. Gloss, D.; Herwig, H. Microchannel Roughness Effects: A Close-Up View. Heat Transf. Eng. 2009, 30, 62–69. [Google Scholar] [CrossRef]
  40. Reinelt, D.A.; Saffman, P.G. The Penetration of a Finger into a Viscous Fluid in a Channel and Tube. SIAM J. Sci. Stat. Comput. 1985, 6, 542–561. [Google Scholar] [CrossRef]
  41. Hazel, A.L.; Heil, M. The steady propagation of a semi-infinite bubble into a tube of elliptical or rectangular cross-section. J. Fluid Mech. 2002, 470, 91–114. [Google Scholar] [CrossRef]
  42. Schwartz, L.W.; Princen, H.M.; Kiss, A.D. On the motion of bubbles in capillary tubes. J. Fluid Mech. 1986, 172, 259–275. [Google Scholar] [CrossRef]
  43. Baroud, C.N.; Gallaire, F.; Dangla, R. Dynamics of microfluidic droplets. Lab Chip 2010, 10, 2032–2045. [Google Scholar] [CrossRef] [PubMed]
  44. Adzima, B.J.; Velankar, S.S. Pressure drops for droplet flows in microfluidic channels. J. Micromech. Microeng. 2006, 16, 1504–1510. [Google Scholar] [CrossRef]
  45. Jousse, F.; Lian, G.; Janes, R.; Melrose, J. Compact model for multi-phase liquid-liquid flows in micro-fluidic devices. Lab Chip 2005, 5, 646–656. [Google Scholar] [CrossRef]
  46. Kaysan, G.; Kräling, R.; Meier, M.; Nirschl, H.; Guthausen, G.; Kind, M. Investigation of the surfactant distribution in oil-in-water emulsions during the crystallization of the dispersed phase via nuclear magnetic resonance relaxometry and diffusometry. Magn. Reson. Chem. 2022, 60, 1131–1147. [Google Scholar] [CrossRef]
  47. Dudek, M.; Fernandes, D.; Helno Herø, E.; Øye, G. Microfluidic method for determining drop-drop coalescence and contact times in flow. Colloids Surf. A Physicochem. Eng. Asp. 2020, 586, 124265. [Google Scholar] [CrossRef]
  48. Christov, N.C.; Danov, K.D.; Zeng, Y.; Kralchevsky, P.A.; von Klitzing, R. Oscillatory structural forces due to nonionic surfactant micelles: Data by colloidal-probe AFM vs theory. Langmuir 2010, 26, 915–923. [Google Scholar] [CrossRef]
  49. Kinoshita, H.; Kaneda, S.; Fujii, T.; Oshima, M. Three-dimensional measurement and visualization of internal flow of a moving droplet using confocal micro-PIV. Lab Chip 2007, 7, 338–346. [Google Scholar] [CrossRef] [PubMed]
  50. Rott, N. Note on the History of the Reynolds Number. Annu. Rev. Fluid Mech. 1990, 22, 1–12. [Google Scholar] [CrossRef]
  51. Bretherton, F.P. The motion of long bubbles in tubes. J. Fluid Mech. 1961, 10, 166–188. [Google Scholar] [CrossRef]
  52. van der Graaf, S.; Schroën, C.G.P.H.; van der Sman, R.G.M.; Boom, R.M. Influence of dynamic interfacial tension on droplet formation during membrane emulsification. J. Colloid Interface Sci. 2004, 277, 456–463. [Google Scholar] [CrossRef] [PubMed]
Figure 1. (a) Schematic drawing of the connection of the pressure sensor to the microfluidic chip. V ˙ d i s p and V ˙ c o n t i show where the dispersed and continuous phases were connected to the microfluidic chip. The channel where the dispersed phase ( V ˙ d i s p ) entered the system could be closed to increase the accuracy of the measurements of Δ p . The dispersed phase is forming droplets at the T-junction, where the two streams meet. (b) Experimental setup: (1) stereo microscope with polarization filter and high-speed camera, (2) microfluidic chip on top of the tempering unit, (3) in- and outlet of coolant, (4) syringe pump, and (5) differential pressure sensor.
Colloids 07 00012 g001
Figure 2. The experimental approach to measure the differential pressure Δ p for the different setups: Channel filled with continuous phase only (1A, Section 3.1), liquid droplet(s) in the channel (2A, Section 3.3), solid particle partly blocking the channel (2B, Section 3.2), and during the CMN (2C, Section 3.4). u c hereby represents the velocity of the continuous phase and Δ T the subcooling. The latter is calculated as Δ T = ϑ m , h e x ϑ e x p , with ϑ e x p representing the temperature of the experiment. The arrow in the pictures indicates the direction of the flow of the continuous phase.
Colloids 07 00012 g002
Figure 3. (a) Microscopic three-dimensional record of the microfluidic channel. (b) Roughness along the channel length (top) and width (bottom). ϵ indicates the relative roughness.
Colloids 07 00012 g003
Figure 4. (a) Two-dimensional schematic drawing of a particle used for the simulations. (b) Cross-sectional drawing across the microfluidic channel. It can be seen that the particle does not stay in contact with the channel walls (due to the ionization of the walls), resulting in bypass and wall flow. (c) Three-dimensional presentation of the particle that was cut from the channel to do all the simulations.
Colloids 07 00012 g004
Figure 5. Example of a mesh generated by SnappyHexMesh, which was used for the simulative parameter studies of the influence of the particle shape on the overall pressure drop. To achieve reliable data, the refinement differs depending on the relative location of the particle and the channel walls. In this case, the film thickness between the particle and the channel was 0.
Colloids 07 00012 g005
Figure 6. Experimental and simulated differential pressure values for the rectangular microfluidic channel with pure water at temperatures ϑ e x p between 10 °C and 50 °C flowing through it.
Colloids 07 00012 g006
Figure 7. The so-called Moody diagram shows the friction factor f as a function of the Reynolds number R e . The friction factor was calculated according to Equation (1), Re according to Equation (2). The grey region represents the range of ± 30% of the fitted data points ( f = 0.92 1.34 64 / R e ). 0.92 hereby represents the correction factor for using a rectangular channel instead of a round cross-section [15]. The additional correction factor of 1.34 is a result of the roughness of the channel walls.
Colloids 07 00012 g007
Figure 8. Experimental (data points) and simulations (lines) at ϑ e x p = 17.5 °C to outline the impact of the body length l b o d y . The experimental data points were fitted linearly and the grey region represent the 95% confidence interval of this fit.
Colloids 07 00012 g008
Figure 9. Influence of (a) body length l b o d y , (b) cap length l c a p and (c) film thickness h f on the pressure drop in the minichannel. The lines presented are guides for the eye.
Colloids 07 00012 g009
Figure 10. Differential pressure drop (top) and the velocity of the continuous phase u c (bottom) along different lines (top left corner) in the microfluidic channel at ϑ e x p = 20 °C and u c = 1.4   10 3 m s−1. The orange region represents the body of the particle ( l b o d y   = 580 µm) and the grey regions of the two caps ( l c a p = 45 µm). Please notice the different scales (logarithmic and linear) of the axis of ordinates.
Colloids 07 00012 g010
Figure 11. Experimental results of droplets moving along the microfluidic channel for two different velocities of the continuous phase u c . The grey areas represent the 95% confidence intervals of the linear fits.
Colloids 07 00012 g011
Figure 12. Exemplary measurement data for the pressure drop as a function of time during the formation of the droplet at the T-junction (yellow), the movement of the droplet along the channel (orange), the first contact of particle and droplet as well as the crystallization of the droplet (green). Δ p e c + 1 p and Δ p e c + 2 p   represent the differential pressures measured for the system when one or two solid particles were circulated by the continuous phase. The two microscopic images show the droplets moving toward the solid particle (red frame) and the crystallization of the droplet after contact with the solid particle (green frame). The white bar represents 200 µm. The arrows in the pictures indicate the flow direction of the continuous phase and, consequently, also of the subcooled droplet.
Colloids 07 00012 g012
Figure 13. Differential pressure Δ p d needed to inoculate the liquid droplet after it came into contact with the solid particle with ( 4   or   8   c m c ) and without (w/o) TW20 as the surfactant. Δ p d correlates linearly with the force needed for CMN due to the flow field (Equation (6)).
Colloids 07 00012 g013
Figure 14. Force F i acting on the droplet due to the impulse (Equation (7)), and the force due to the flow field after the contact F c (Equation (6)) for three different velocities of the continuous phase and three aqueous surfactant concentrations c ˜ T W 20 (without (w/o) TW20, 4   c m c   or   8   c m c ). A cross-sectional area of A c h a n n e l = 6 10 8 m2 was used for the calculations.
Colloids 07 00012 g014
Table 1. The results of the grid convergence study and corresponding grid convergence index ( G C I ) values. A base cell size of 11.6 µm was chosen as a compromise between the duration of the simulations and their accuracy.
Δ p / Pa G C I
15 µm11.6 µm9 µm G C I 15 , 11.6 G C I 11.6 , 9
empty channel (no particle)44.2144.6344.940.03290.0242
Table 2. Comparison of the parameters influencing the efficiency of contact-mediated nucleation (CMN) in stirred systems and the parameters that are investigated in the microfluidic system.
Parameters Influencing CMN in Stirred Systems 1Parameters Investigated in the Microfluidic ApproachCondition for Successful CMN in Stirred Systems
Collision frequency--
Contact force F minimum contact force for CMN F C M N , m i n F F C M N , m i n
Contact time t c induction time t i n d t c t i n d
1 Due to the external flow, in analogy to [34].
Disclaimer/Publisher’s Note: The statements, opinions and data contained in all publications are solely those of the individual author(s) and contributor(s) and not of MDPI and/or the editor(s). MDPI and/or the editor(s) disclaim responsibility for any injury to people or property resulting from any ideas, methods, instructions or products referred to in the content.

