
Human Action Recognition-Based IoT Services for Emergency Response Management


College of Computer Science and Engineering, Taibah University, Yanbu 966144, Saudi Arabia
Mach. Learn. Knowl. Extr. 2023, 5(1), 330-345; https://doi.org/10.3390/make5010020
Submission received: 6 February 2023
/
Revised: 2 March 2023
/
Accepted: 9 March 2023
/
Published: 13 March 2023
(This article belongs to the Special Issue Deep Learning in Image Analysis and Pattern Recognition)
Abstract
:Emergency incidents can appear anytime and any place, which makes it very challenging for emergency medical services practitioners to predict the location and the time of such emergencies. The dynamic nature of the appearance of emergency incidents can cause delays in emergency medical services, which can sometimes lead to vital injury complications or even death, in some cases. The delay of emergency medical services may occur as a result of a call that was made too late or because no one was present to make the call. With the emergence of smart cities and promising technologies, such as the Internet of Things (IoT) and computer vision techniques, such issues can be tackled. This article proposes a human action recognition-based IoT services architecture for emergency response management. In particular, the architecture exploits IoT devices (e.g., surveillance cameras) that are distributed in public areas to detect emergency incidents, make a request for the nearest emergency medical services, and send emergency location information. Moreover, this article proposes an emergency incidents detection model, based on human action recognition and object tracking, using image processing and classifying the collected images, based on action modeling. The primary notion of the proposed model is to classify human activity, whether it is an emergency incident or other daily activities, using a Convolutional Neural Network (CNN) and Support Vector Machine (SVM). To demonstrate the feasibility of the proposed emergency detection model, several experiments were conducted using the UR fall detection dataset, which consists of emergency and other daily activities footage. The results of the conducted experiments were promising, with the proposed model scoring 0.99, 0.97, 0.97, and 0.98 in terms of sensitivity, specificity, precision, and accuracy, respectively.
1. Introduction
The emergency medical services system is responsible for providing medical care for patients who need urgent medical care because of an emergency incident. The emergency medical services help many patients who suffer from severe illnesses or injuries, due to an emergency incident, and the system saves many lives. However, there are delays in emergency medical services due to late calls for help or no one being present to make the call, which can result in fatal or life-threatening injuries or complications. For example, 35% of patient mortality was connected to a delay in care by emergency medical services in the United Kingdom (UK) [1]. In addition, in Victoria, Australia, 30 death cases were recorded due to delays in calling emergency medical services [2]. Therefore, the use of proper solutions that involve intelligent technologies, such as the Internet of Things (IoT) and computer vision techniques, can help in tackling the issue of delayed emergency medical services [3,4,5].
The use of Internet of Things (IoT) services has inspired many researchers to enhance several domains, such as crowd management [3], emergency response management [5], intelligent homes [6], recommendation systems [7], and other domains [8,9]. In the emergency response management domain, IoT services can help in determining emergency cases and in collecting helpful information about the case, such as its location (i.e., the coordinates of the emergency case) and time. The collected information about emergency cases can help in determining the location in which to establish emergency medical services units, based on areas having emergency incidents more often. IoT services have provided different solutions for emergency response management in the following response scenarios: detecting flood emergencies [10], detecting crowd emergencies [3,4,5], detecting fire and terrorism emergencies [11,12], and detecting serious illness or injury emergencies (i.e., where a patient has fallen because of illness or injury) [13,14]. This work focuses on detecting severe illness or injury emergency response scenarios.
By utilizing computer vision techniques, severe illness or injury emergency incidents can be detected using surveillance cameras placed in public spaces (whether indoors or outdoors). In particular, the detection of severe illness or injury emergency incidents can be automatically conducted in the following steps; (i) acquisition of the input of video sequences (i.e., from footage acquired from surveillance cameras); (ii) image preprocessing, by removing the background using well-known techniques such as Gaussian Mixture Models (GMMs); (iii) feature extraction, to properly recognize the human action and multiple tracking objects, using well-known techniques such as the Gray Level Co-occurrence Matrix (GLCM); (iv) classification of the human action, whether an emergency incident or other daily activities, using well-known classifiers presented in the literature [15,16]. The literature provides several classifiers to classify human action, whether in an emergency incident or other daily activities, such as the following: Motion History Image (MHI), K-Nearest Neighbor (KNN), Hidden Markov Model (HMM), Multi-Layer Perceptron (MLP), Convolutional Neural Network (CNN), Artificial Neural Network (ANN), Recurrent Neural Network (RNN), Support Vector Machine (SVM), Long Short-Term Memory network (LSTM), and others [17,18,19].
The design and implementation of a human action recognition- based IoT services architecture for emergency response management is described in this article. The IoT services architecture can detect severe illness or injury emergency incidents, make a request for the nearest emergency medical services, and send the emergency location information. The contributions of this work are as follows:
- A real-time emergency response management-focused IoT services architecture based on human action recognition is presented. The architecture can automatically identify emergencies, summon the nearest emergency medical services, and report the location of the emergency.
- An emergency incident detection model, that exploits a Convolutional Neural Network (CNN) and Support Vector Machine (SVM) hybrid model to classify human actions, whether in an emergency incident or other daily activities, is proposed.
- Using a prototype implementation, experiments, and the UR fall detection dataset (which comprises 70 sequences of emergency and other daily activities), the proposed emergency incident detection model is validated.
The remainder of the article is organized as follows: the literature review is covered in Section 2, the IoT services architecture for emergency response management is depicted in Section 3, the emergency incident detection model is detailed in Section 4, and the implementation and experiments results of the proposed approach are described in Section 4.3.2. The conclusion and future work are discussed in Section 6.
2. Literature Review
Many researchers have recently become interested in the issue of emergency response management. Particular survey articles have intended to identify potential emergencies, such as crowd emergencies, floods, fires, and terrorist attacks [4,20]. For example, Fedele and Merenda [5] proposed a novel IoT system for crowd emergency management. In particular, the authors proposed three different algorithms: (i) spatiotemporal people distribution; (ii) sensor alarm identification; (iii) shortest and safest path definition, using data collected from Wireless Sensor Networks (WSNs) to deal with situations such as social distancing (e.g., COVID-19). To demonstrate their proposed algorithms, the authors used two different case studies, including social distancing and emergency management. Bosch et al. [10] focused on the issue of detecting flood emergencies. In particular, the authors proposed a novel framework for flood emergency management. The framework consists of several models for flood line identification, damage assessment of bridges and buildings using earth observational data, and semantic prediction using images taken before and after the flood incident. To validate their proposed framework, the authors conducted several experiments using the National Oceanic and Atmospheric Administration (NOAA) dataset. Maguluri et al. [12] focused on the issue of detecting fire emergencies. In particular, the authors presented an IoT-based fire emergency response system. The system consists of several sensors, including the following: (i) ESP32 microcontroller, (ii) MQ-2 sensor, (iii) MQ-5 sensor, (iv) Flame sensor and (v) GPS Module. The notion of the system is to detect fire emergencies in real-time and summon the nearest fire station by reporting the location of the fire emergency. The proposed system was demonstrated using a prototype where a fire emergency was detected. Han and Choi [11] focused on the issue of detecting fire and terrorism emergencies. In particular, the authors proposed a Long Short-Term Memory network (LSTM) model using human action recognition for fire and terrorism emergency detection. The model categorized the human actions during the fire and terrorism emergency into four categories: (i) stopping, (ii) walking, (iii) running, and (iv) running helter-skelter (i.e., running hurriedly and in a disorganized manner, which indicates an emergency incident). To evaluate their proposed model, the authors used a simulated dataset that represents terrorist attacks and compared their proposed model with the Neural Network (NN) model. Deak et al. [21] focused on the issue of detecting fire and terrorism emergencies. In particular, the authors proposed an IoT-based Device-free Passive Localization (DfPL) system for fire emergency detection. The proposed system uses moving average and variance for motion detection and the Naive Bayes (NB) Model with Gaussian distribution for human action classification. The proposed system was demonstrated using a prototype where an emergency was detected. Unlike previous research works that focus on the issue of detecting potential emergencies, such as crowd emergency, floods, fires, and terrorist attacks, this work focuses on detecting severe illness or injury emergency response scenarios. Moreover, unlike some previous research works that separate the use of IoT technologies and computer vision techniques, this work combines both technologies to enable the delivery of real-time IoT services for emergency response management (in other words, it offers the benefits of both worlds).
Other research works have focused on detecting serious illness or injury emergency response scenarios. Some survey articles aimed to pinpoint serious illness or injury emergency scenarios [22,23,24,25]. For example, Zheng and Liu [14] presented an algorithm for fall detection based on YOLOv4 network architecture. In particular, the algorithm leverages the AlphaPose optimization model and uses the TensorRt engine for optimization. The proposed algorithm was evaluated using a prototype system and UR fall detection dataset. Lee and Mihailidis [26] proposed a serious illness or injury emergency detection system, namely an Intelligent Emergency Response System (IERS). In particular, the authors proposed using background subtraction for image segmentation and the connective-component labeling technique to achieve the silhouette of the human action. Human actions during an emergency were categorized into five categories in this work: (i) fall-tucked, (ii) fall-stretched, (iii) inactivity zone, (iv) walking, and (v) stooping. To validate the proposed approach, the authors used a prototype system and a pilot study that included 21 persons performing 315 trials. Jeong et al. [27] presented a severe illness or injury emergency detection system that exploits a paramedic mobile robot, namely iRobiQ, to help in investigating the patient’s condition. In particular, the authors proposed using background subtraction for image segmentation and Motion History Images (MHIs) for human tracking. Moreover, the authors presented a navigation algorithm to help the paramedic mobile robot to reach the patient in the shortest time possible. Human actions during an emergency were categorized into four categories in this work: (i) walking, (ii) running, (iii) sitting, and (iv) falling. To demonstrate their proposed system, the authors used a prototype system and simulated data, which included four subjects performing forty activities. Zhu et al. [28] proposed a serious illness or injury emergency detection algorithm, namely the pose estimation algorithm, that utilizes a deep learning model for human action classification. In particular, the proposed algorithm uses a bone key points model for feature extraction and a Deep Neural Network (DNN) for human action classification. Human actions during an emergency were categorized into four categories in this work: (i) falling, (ii) squatting, (iii) standing, and (iv) walking. To validate their proposed algorithm, the authors used a prototype system to create their dataset, which consists of 3289 pictures that cover different human actions. Ma et al. [13] presented a severe illness or injury emergency detection method for embedded devices. In particular, the authors proposed using Gaussian distribution for image preprocessing and YOLOv3 for feature extraction. Human actions during an emergency were categorized into four categories in this work: (i) standing, (ii) squatting, (iii) lying down and falling, and (iv) side fall. To evaluate their proposed method, the authors used a prototype system to create their dataset, which consists of 3000 pictures that cover different human actions, including falling pictures. Chua et al. [29] proposed a severe illness or injury emergency detection technique. In particular, for image preprocessing, the authors employed background subtraction. For feature extraction, they used three centroids representing various body parts: (i) the head, (ii) the body, and (iii) the legs. Human actions during an emergency were categorized into three categories in this work: (i) standing, (ii) sitting, and (iii) falling down. To validate their proposed technique, the authors used a prototype system and simulated dataset, which consists of 51 video sequences that include emergency and other daily activity footage. Alhimale et al. [30] presented a severe illness or injury emergency detection system using a neural network. In particular, the authors proposed using a median filter in the RGB mode for image preprocessing, silhouette normalization for feature extraction, and a neural network for human action categorization. Human actions during an emergency were categorized into four categories in this work: (i) praying, (ii) sitting, (iii) falling, and (iv) lying down. The authors employed a prototype system and simulated dataset with twenty participants, ten of whom performed normal walking followed by falling activities, while the other ten performed abnormal walking (e.g., walking while losing balance), and, likewise, followed by falling activities, to evaluate their proposed system. Unlike previous research works that neglected the opportunity presented by utilizing the IoT technologies that contribute to real-time emergency response management, the proposed architecture combines IoT and computer vision technologies to enable the delivery of real-time IoT services for emergency response management. Additionally, this work proposes using a hybrid emergency incidents detection model that combines a Convolutional Neural Network (CNN) and a Support Vector Machine (SVM) to classify human activity as either an emergency incident or regular daily activity, wherein the results of the experiments are promising in terms of precision and accuracy.
3. IoT Services Architecture for Emergency Response Management
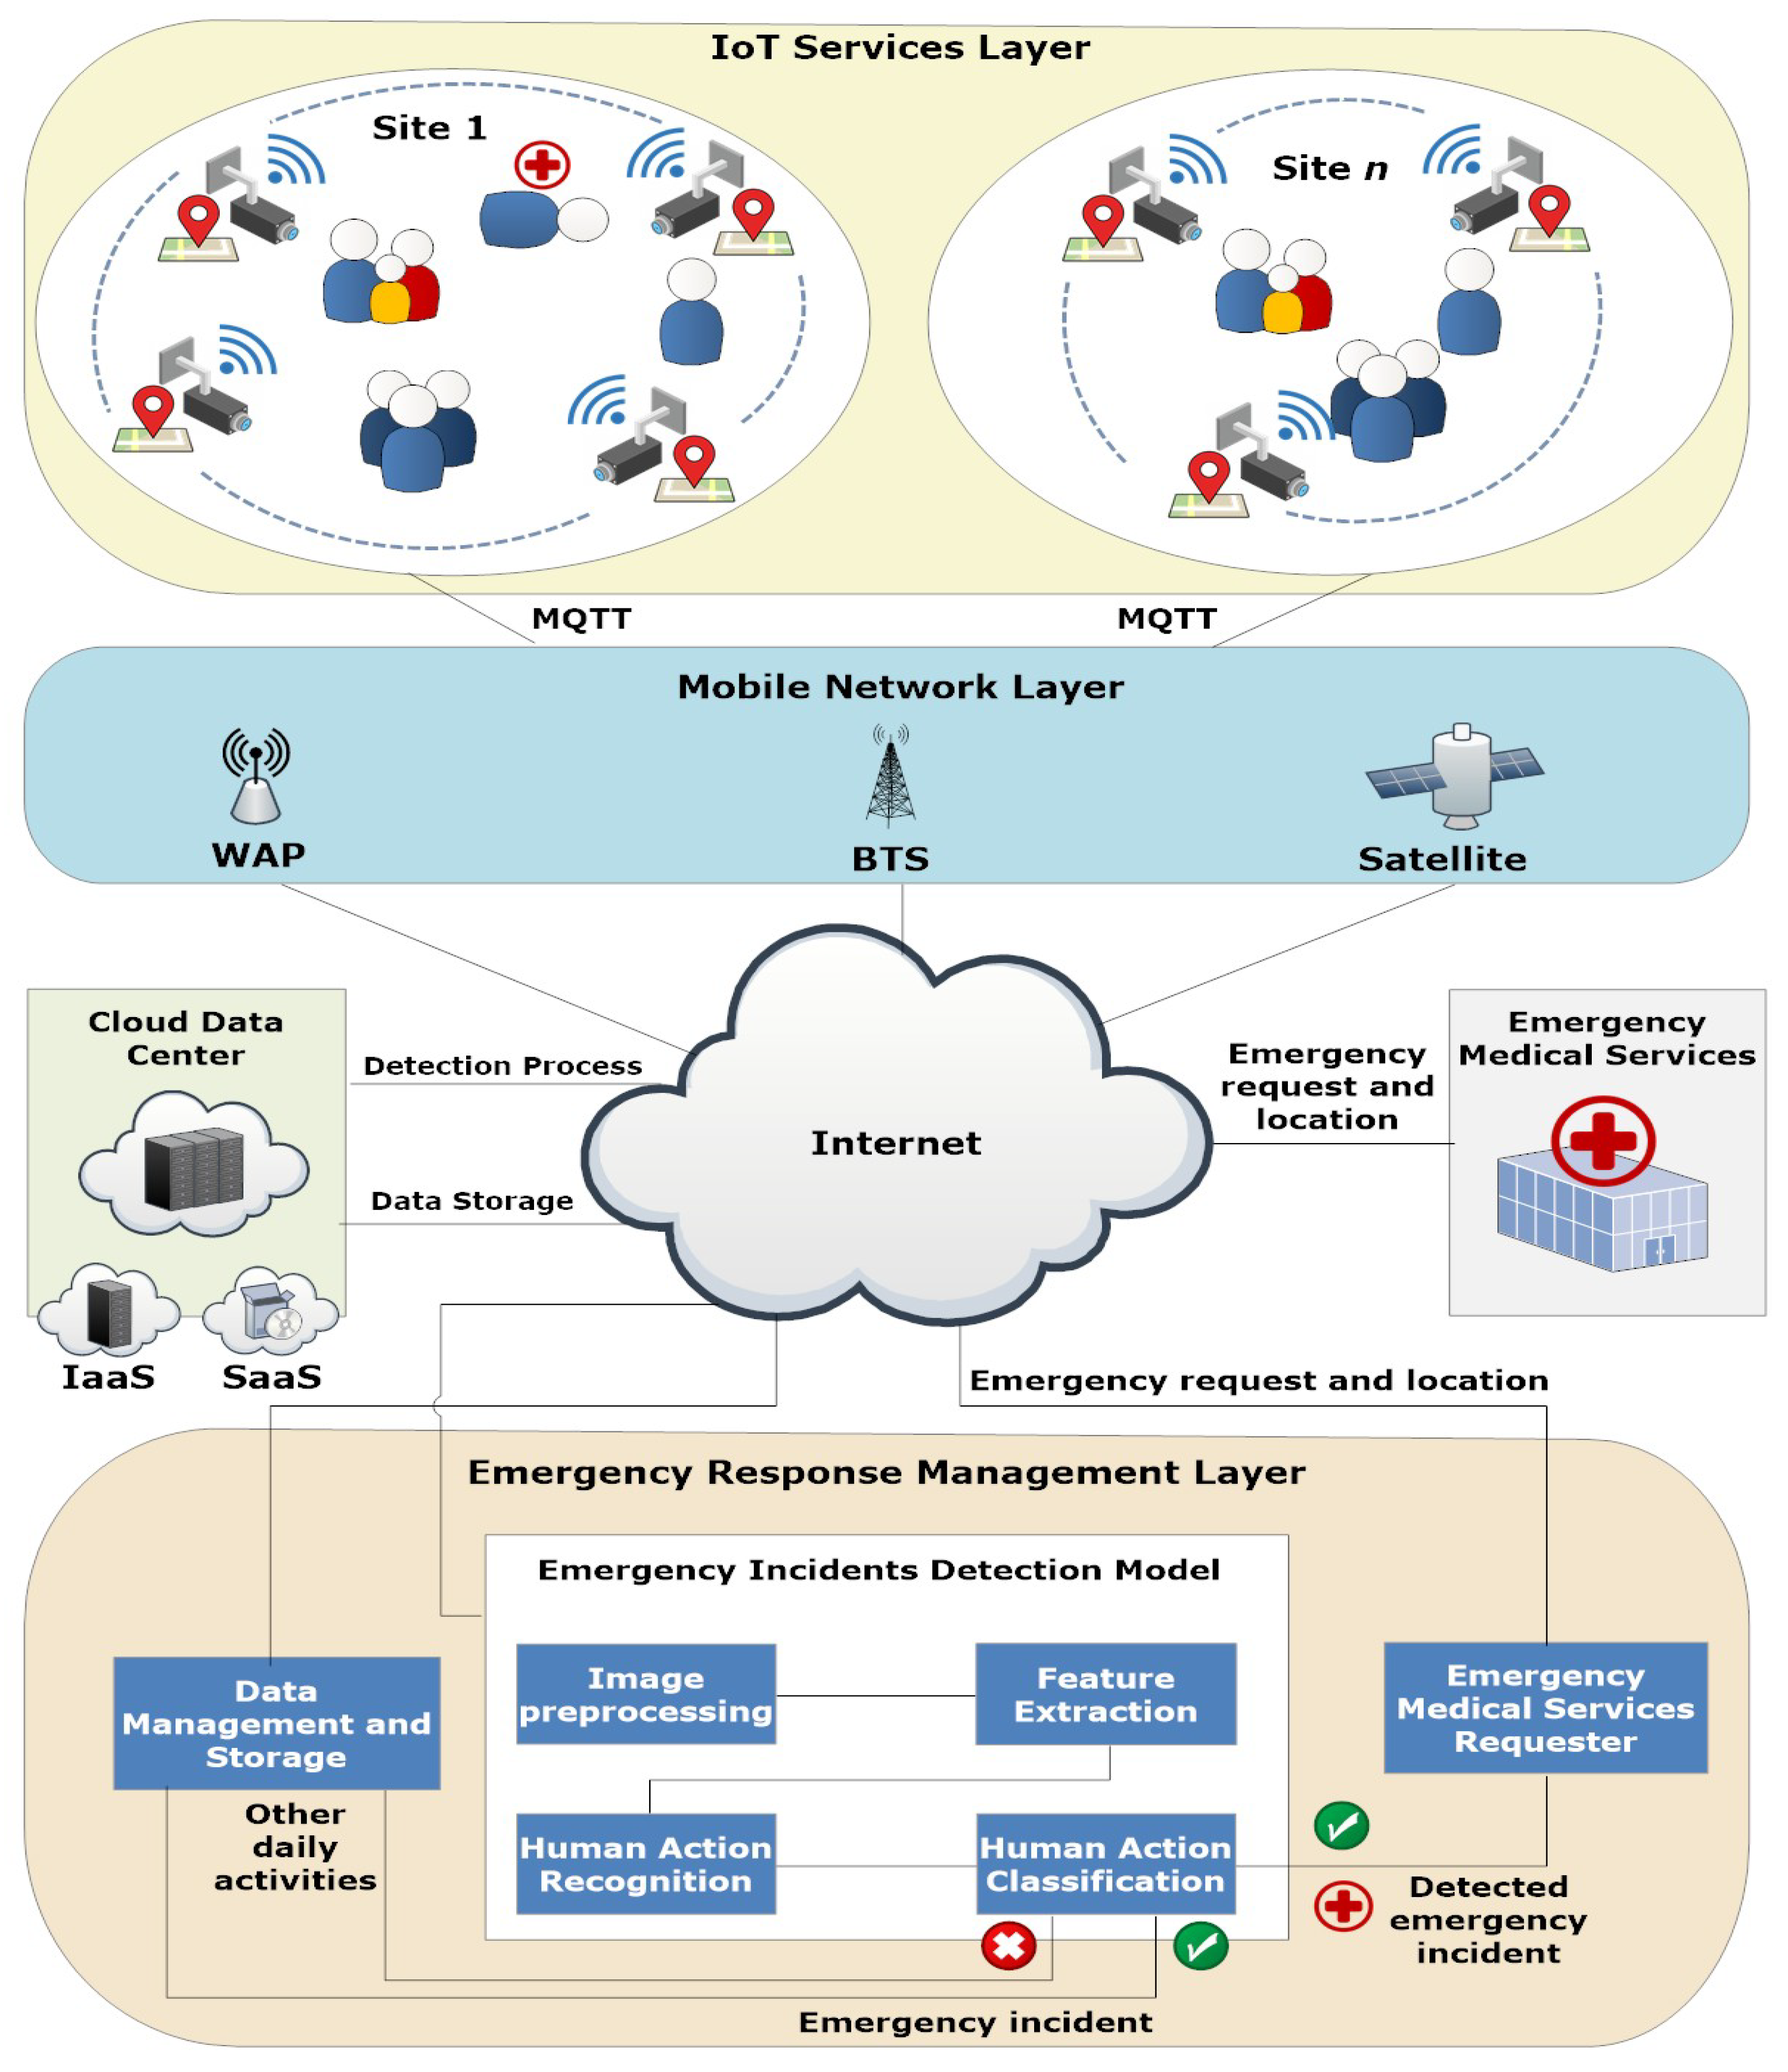
In this work, an architecture for managing emergency response that incorporates aspects of computer vision and the Internet of Things (IoT) technology is provided. The architecture is shown in Figure 1, and it consists of three layers: the IoT Services Layer, the Mobile Network Layer, and the Emergency Response Management Layer.
- The IoT Services Layer. This layer encompasses a number of sites n, each of which contains a group of people. Actions, such as routine everyday activities and emergency incidents, are recorded on video by widely accessible surveillance cameras that cover each site for monitoring purposes. Each camera has a Global Positioning System (GPS) module and an Arduino UNO WiFi REV2 module for IoT data transmission. Wireless connection between the nodes and the middleware, which applies a publish–subscribe messaging pattern on top of the Transmission Control Protocol/Internet Protocol (TCP/IP), is made possible by the IoT module using Message Queue Telemetry Transport (MQTT). The IoT devices data is a collection of the camera activity history records, represented by a tuple , where is the camera’s ID, is the video recorded by the camera, is the location of the camera (i.e., the coordinates that are captured from the attached GPS module), and is the timestamps when the camera recorded the video. The data from the IoT Services Layer is then transmitted via the Mobile Network Layer.
- The Mobile Network Layer. This layer serves as the link between the Emergency Response Management Layer and the IoT Services Layer. To facilitate communication, it consists explicitly of several Base Transceiver Stations (BTSs), satellites, and Wireless Access Points (WAPs). The communicated information contains the camera’s ID, the video it has captured and the timestamps at which it did so, and its location.
- The Emergency Response Management Layer. This layer consists of three different components: (i) Emergency Medical Services Requester, which is responsible for requesting emergency medical services if an emergency incident is detected by the Emergency Incident Detection Model. The emergency medical services request consists of the request ID, picture of the incident, its location, and the timestamps; (ii) Data Management and Storage component, which is in control of keeping the camera activity history records, providing access to the data using Infrastructure as a Service (IaaS) cloud service as storage in the cloud data center; (iii) Emergency Incident Detection Model, which is responsible for emergency incident detection. The model itself consists of four modules: (a) Image Preprocessing, which is responsible for background subtraction, (b) Feature Extraction, which is responsible for object identification and tracking, (c) Human Action Recognition, which is responsible for action identification; and (d) Human Action Classification, which is responsible for classifying the human activity as either an emergency incident or regular daily activity. More details on emergency incident detection can be found in Section 4), where, if an emergency incident is detected, a copy of the information is sent to the Emergency Medical Services Requester, and another copy to the Data Management and Storage component (i.e., as a record for the future), while a copy of other regular daily activities are also sent to the Data Management and Storage component for learning purposes.
4. Emergency Incidents Detection Model
This section goes into more detail about the suggested human action strategy. The following subsections provide a more detailed explanation of the main steps of this strategy (Figure 1).
4.1. Preprocessing
This stage introduces a technique for modeling the background that separates moving foregrounds from their moving counterparts in image sequences, by utilizing an adaptive Gaussian mixture with integrated input space of luminance-invariant color. These are described in brief below.
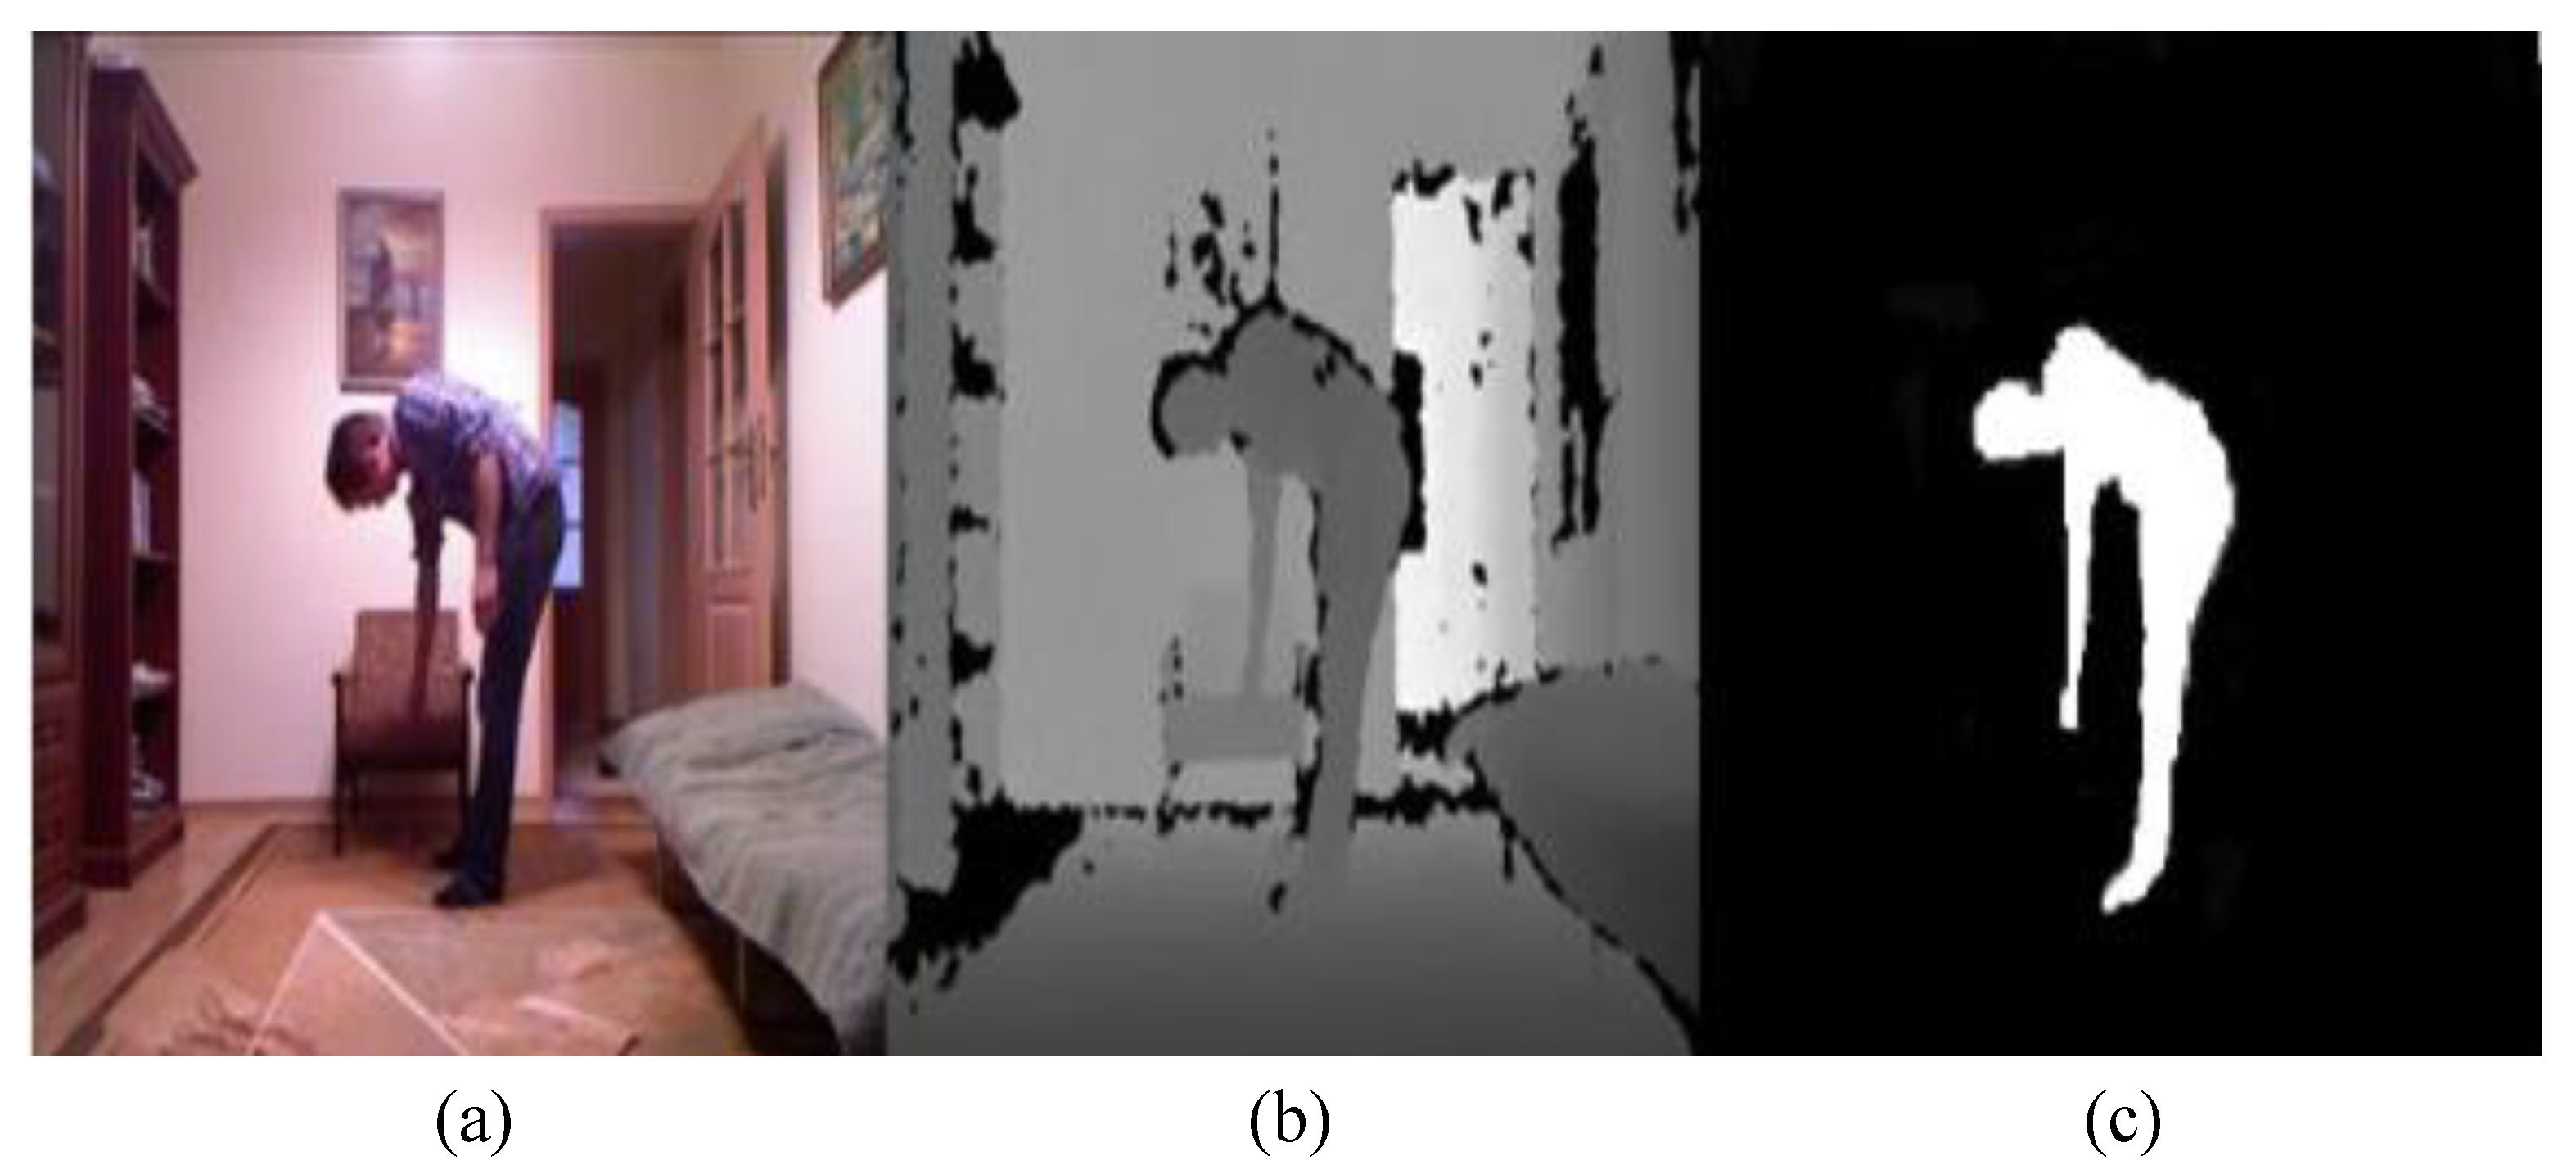
- Background SubtractionThe background subtraction technique is frequently used to identify unexpected movements in a scene. The purpose of using the subtraction technique is to build a model against the scene background by comparing each new image frame with the preceding one. Additionally, the Gaussian Mixture Model (GMM) is used for background subtraction, since it can handle the larger class of density models that include numerous additive functions [31]. Let us assume that K is the number of distributions and stands for a pixel in the current frame. To represent each pixel, a K Gaussian mixture can be used as follows:A method of observing the histogram of the dataset, and basing the selection of K on the number of peaks for this histogram, is used to determine the number of K components. Here, the number of components is automatically determined by a constructive algorithm that forces the process of maximizing a likelihood function [31]. The value is the component’s prior probability of the component in Equation (1). It is also known as the weighting function, and it is produced from the mixture’s constituent parts of the component i of the mixture. The value reflects the component’s Gaussian density model (Equation (2)).where the terms and denote, respectively, the component’s mean and covariance. The feature space is also referred to as f. The K components are chosen, and the mean, covariance, and prior probability for each component are estimated using the available dataset. These parameters are calculated using the algorithm [22], and re-estimates and optimizations are based on minimizing the error function E (Equation (3)).In this equation, N is the total number of data points . When a threshold of 0.5 is applied, the background distribution continues to be the dominant one with the lowest variance. For this reason, the foreground is the label applied to all pixels that do not match the components.There are still some isolated areas and noise. A small area near the foreground that does not belong there exists. Therefore, outliers like noise and spurious components are eliminated using morphological processes, like erosion and dilation. A desired picture processing effect is also produced by combining erosion and dilation operations. In this way the foreground regions are found. Additionally, using median filtering, regarding the size of the neighboring window, acquires the foreground items. They are localized using a blob analysis function after the captioned foreground image has been established. Figure 2 shows an illustration based on the outcomes of a background computation with .
4.2. Feature Extraction
The segmented silhouettes of moving object sections are described by a range of local and global features. Using invariant descriptors, like invariant Zernike moments and elliptic Fourier’s descriptors, the silhouette images, according to global (shape) properties, are characterized. Additionally, as local (motion) aspects of the foreground image sequence, the trajectory of the centroid motion object and optic flows are retrieved. The following equation can be applied to the feature matrix of human activity:
and , thus, stand for global and regional aspects, respectively. The frames and , are the starting () and ending () frames, respectively. The length of the action in the feature is represented by the difference between them. As a result, for every frame, the combined features of global and local are .
4.2.1. Global Feature
Zernike moments and elliptic Fourier descriptors, , are used for stating and characterizing the shape flow, which is considered to be the global flow of silhouettes. The subsections that follow provide more description of the global feature.
- Elliptic Fourier descriptorsIn this study, the action silhouettes are obtained using an elliptic Fourier descriptor following the shape curve . The trigonometric representation is made more axiomatic and simpler to use. Elliptic coefficients are determined using Equations (5) and (6).whereWith a value, denotes the fundamental frequency. The value T is a harmonic number and defines the function period. These coefficients, it should be noted, ensure that the yielding curve descriptor is rotation, translation, and scale invariant. Additionally, it is independent of the choice of the contour start point for the object. Readers who want more information might consult [31].
- Zernike MomentsThe orthogonal collection of rotation-invariant Zernike moments that they award can be used to confirm an object’s invariance for a silhouette image. Moment normalization can also be used to achieve translation and scale invariance [9]. The following is a brief discussion of a complicated Zernike moment () of repetition q and order p for the intensity function of a particular image:where, is a normalization factor, p denotes a positive integer, and , . Depending on how the constraint condition is met, q is either a positive or negative integer. The centroid of the silhouette image and a scale parameter a are used to normalize the function f, subject to translation and scale. The value is a redial polynomial. As a result of this, the geometric properties that shape scaling, translation, and rotation with notable similarities to invariant moments are achieved by; = . Experimentally, the feature invariant percentage error is less than 0.5 percent.
4.2.2. Local Feature
Here, the gravitational center of mass and the optic flow, denoted by = , are used to describe and state the local (flow) motion of foregrounds;
- Center of Silhouettes Motion (CM)The use of motion data persuaded us to fuse it with global features to approach the classification of SVM and CNN’s ultimate results. The extracted motion feature estimates the centroid , which forwards the motion centroid point. Furthermore, the feature , which describes the general motion distribution, is specified using Equation (9);According to the total number of moving pixels, are the spatial coordinates of . These characteristics have a significant impact not only on the motion rate and velocity, but also on the type of motion, such as oscillatory or transnational motion. With these characteristics, the model is able to distinguish between an action that occurred in a relatively big area (such as a running action) and an activity that occurred in a smaller area with the motion of a particular body part, such as a waving action with one or two hands.
4.3. Classification
In this subsection, the classifiers provided by the literature were explored to identify which one was the best, in terms of results, to employ for the proposed approach. In the following subsections, the SVM and several CNN architecture models, such as EfficientNetB0, MobileNetV2, ResNet50, and Xception, are thoroughly described.
4.3.1. Support Vector Machine (SVM)
The main objective of the SVM classifier is to find and separate a hyperplane that matches the most significant and possible margin among the points of different classes [34]. The optimum hyperplane for an SVM is the most significant margin between the two classes that optimizes the distance to the closest data point for both classes. The most comprehensive tile parallel to the hyperplane, with no interior data points, is a significant margin, which incorporates robustness into the decision-making process. The vector and bias , together constitute the hyperplane , separating the two classes, such that: . This is accomplished by means of a given set of data points , where each example is a point in p-dimensional space and is the matching class label.
It is necessary to solve the optimization issue subject to . An off-the-shelf Quadratic Programming (QP) solver can solve the problem, which involves maximizing a quadratic function subject to linear constraints. The classification time is independent of the number of support vectors, and the linear SVM can predict with p summations and multiplications.
4.3.2. Convolutional Neural Network (CNN)
CNN models, which are utilized in this study, are becoming more widely used as technology advances [35]. The architecture of the model consists of the following layers (Figure 3).
Input Layer: The input layer is the CNN’s beginning point, where the network receives the raw picture data. The geometry of the input layer is (None, 96, 96, 3), which indicates that the model may receive a batch of photos with a resolution of 96 × 96 pixels and 3 color channels (RGB).
Convolutional Layers: The model contains six convolutional layers (convolution 1 through convolution 6) that are meant to extract picture features. Each convolutional layer applies a collection of filters to the input image, resulting in a collection of feature maps. Each convolutional layer employs a variable number of filters and filter sizes to extract distinct sorts of characteristics from the input image. For instance, the first convolutional layer (convolution 1) employs 16 filters of size 3 × 3, but the second convolutional layer (convolution 2) also employs 16 filters of size 3 × 3.
Activation Functions: The output of each convolutional layer is processed via a non-linear CNN-typical activation function, called the rectified linear unit (ReLU). The activation function is designed to incorporate non-linearity into the model, helping it to learn more complicated visual information.
Max Pooling Layers: Following the convolutional layers come max pooling layers. These layers are utilized to minimize the spatial dimensions of the feature maps, while preserving the essential data. This is accomplished by employing a max pooling process over a specified window size and stride, where the window’s maximum value is selected. This minimizes the amount of network parameters and computations, and also makes the features more resilient to tiny input picture translations.
Flatten Layer: The output of the last pooling layer is then reshaped into a one-dimensional array by passing it through a flatten layer. This is done to prepare the output for the layers with complete connectivity.
Dense Layers: one dense layer (dense1) performs categorization in the model. This layer is comprised of 32 units with a ReLU activation function.
Output Layer: The output layer is the final layer of the CNN where predictions are made. There is one unit and no activation function on the output layer. This is presumably a binary classification problem, where the model predicts which of two classes an image belongs to.
The proposed model in this work uses one of the most well-known pre-trained architectures, these being EfficientNetB0, MobileNetV2, ResNet50, and Xception. EfficientNetB0 was the study’s first model. The Efficientnet model was developed by the GoogleBrain team to enhance SVM performance. The addition of extra layers above, or between, already existing deep convolutional models is what is meant by the term “depth”. As a result, since it requires more computational power, the depth increase may reversely affect the performance. Tan [36] claims that the depth, width, and resolution characteristics were all considered simultaneously when building the Efficientnet model.
The Mobilenet served as the study’s second model. In this model, features are extracted using the Depthwise Separable Convolutions method, rather than the traditional convolution method. When compared to a standard convolution procedure, this technique allows for the extraction of features with eight or nine times fewer parameters. Several improvements were made to the model in 2019 to make it speedier and more efficient [37]. Additionally, the size of feature maps has been reduced by using 1 × 1 convolutions. ResNet-50, an extremely sophisticated CNN architecture, employs residual learning to address the degradation problem. The ResNet-50 architecture was used to fit the training data without transfer learning because the starting weights were made using wholly different types of data and were, therefore, unlikely to be beneficial [38]. ResNet’s main characteristics are identity mapping and residual learning.
A deep convolution neural network architecture called Xception is built on depth-wise separable convolutions. The “extreme” version of an Inception module is known as Xception. Before the results are integrated, an Inception module applies many transformations to the same input, allowing the model control over which features to adopt and by how much. The computing performance is still subpar. These convolutions consequently become more profound and spatial with each additional filter. The Inception module researchers were able to combine numerous layer alterations thanks to this decrease, producing a CNN that was broad and deep [39].
5. Implementation and Experimental Results
This section describes the IoT services architecture for emergency response management for evaluating the emergency incidents detection model using the UR fall detection dataset. Second, the UR fall detection dataset is explained to evaluate the emergency incidents detection model. Finally, the results of the experiments are discussed to validate the performance of the emergency incidents detection model.
The implementation of the IoT services architecture for emergency response management was developed using PHP 8.2.3 for the web application’s Graphical User Interfaces (GUIs) and backend to enable emergency medical services to receive and assign emergency cases, based on the detected emergency incidents from IoT cameras. Anaconda-Python 3.9 is used for the emergency incidents detection model in the backend. MySQL8.0.32 is used for the development of the database.
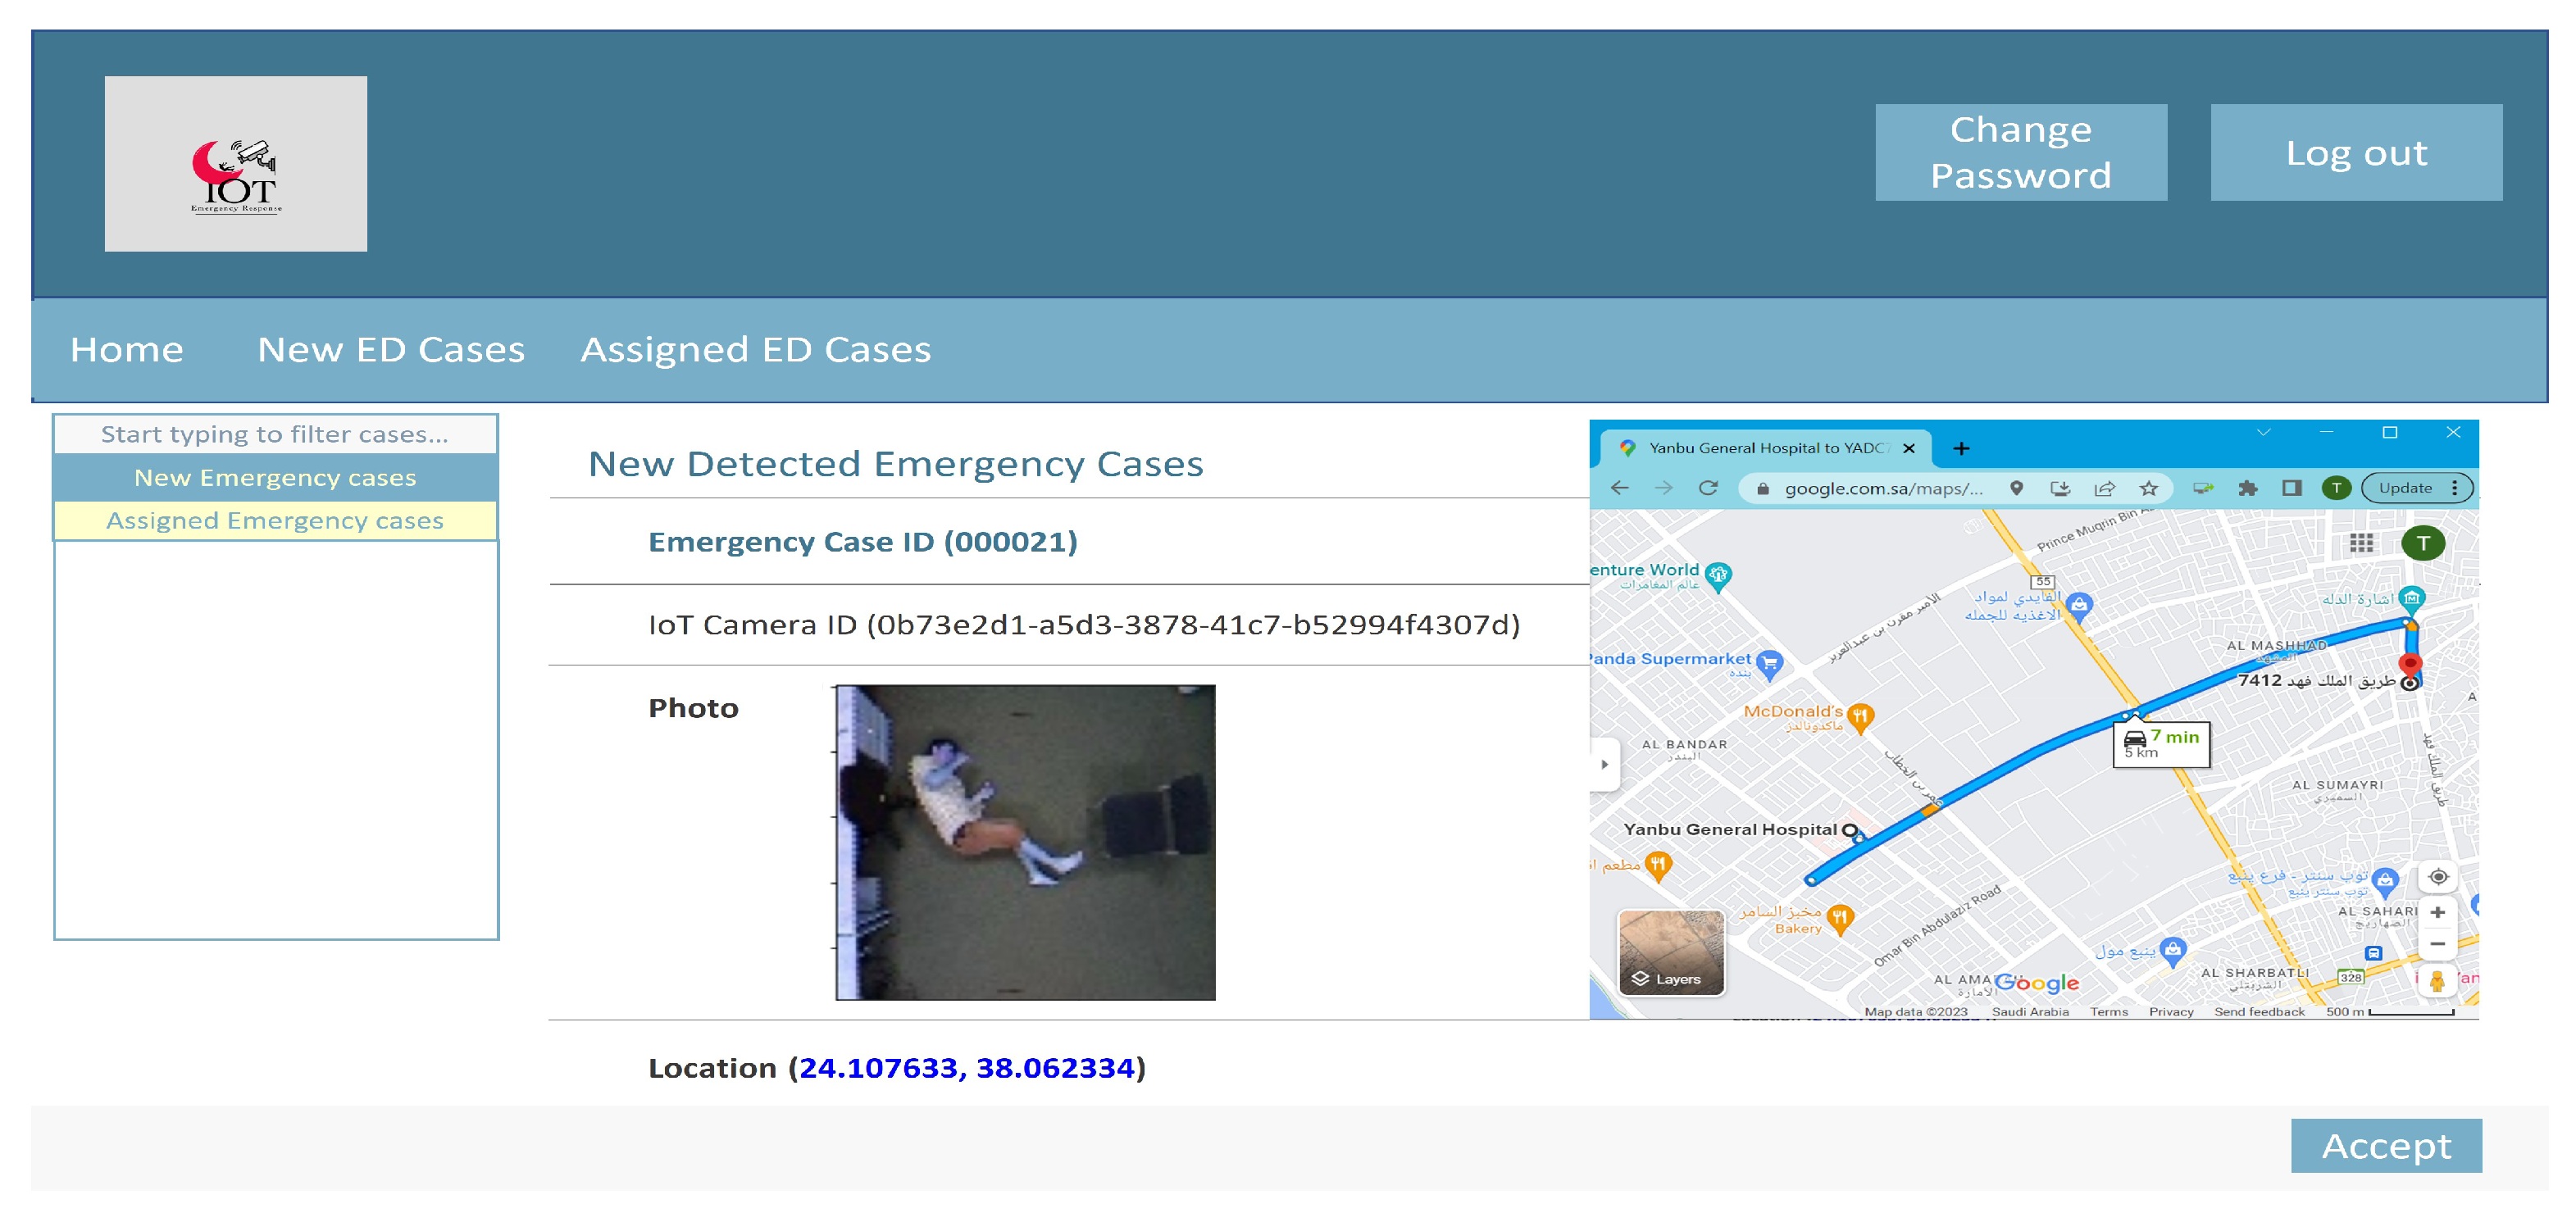
The proposed IoT services architecture for emergency response management uses several GUIs for the Administrative and emergency medical services practitioners (e.g., paramedics). For example, Figure 4 showcases the emergency medical services practitioner’s dashboard where he or she can receive and accept newly detected emergency cases. Each emergency case has a particular ID, IoT camera ID, photo of the detected emergency case, and the coordinates of the IoT camera. On clicking on the coordinates, Google maps are used to provide the directions and estimated time of arrival.
A dataset of images demonstrating normal daily activities, such as moving, sitting in a chair, kneeling, and being flat on the ground, was assembled to train the classifiers responsible for evaluating whether a person is flat on the ground, and to evaluate its detection rate. A total of 612 images were chosen from the UR Fall Detection Dataset (URFD) (http://fenix.univ.rzeszow.pl/mkepski/ds/uf.html, Web. 20 August 2022) and additional image sequences shot in common places like offices, classrooms, and so on [40]. The chosen image set contains 210 images of a person resting on the ground and 402 images of people performing common ADLs. A total of 30 image sequences with 30 falls make up the UR Fall Detection dataset. Five people executed two falls, one while standing and the other while seated in a chair. Figure 5 displays some images from the UR Fall Detection Dataset.
In this research work, two scenarios were solely considered: regular activity (i.e., non-fall) and fall activity. The SVM-based classifier was assessed, and it was compared with a CNN classifier. Tenfold cross-validation was used to evaluate the classifiers. Additionally, the SVM was built using the extracted feature indicated in Section 4.2, either for testing or training operations. Sensitivity, specificity, precision, and classification accuracy were determined to evaluate the classification performances.
The sensitivity is determined by dividing the total number of actual positive cases by the total number of false negative cases. If a fall has already occurred, it is the classifier that can correctly identify a circumstance determining the likelihood of a subsequent fall. Calculating the sensitivity is done by adding the True Positives (TPs) and False Negatives (FNs), then dividing those amounts by the number of confirmed positive cases. If a non-fall ADL occurred, the classifier’s determination of the likelihood of not falling demonstrates how well the classifier performs in preventing false calls from the IoT service to the nearest emergency medical service. The accuracy is calculated as either the sum of TPs and TNs, divided by the total population instances, or as the total number of accurate decisions divided by all cases. That is, the accuracy is the percentage of actual results, both actual positives and actual negatives, in the population. The accuracy, or positive predictive value, is calculated by dividing the number of true positives by the sum of all true positives and false positives (PPVs). It demonstrates how many of the falls with positive classification were pertinent.
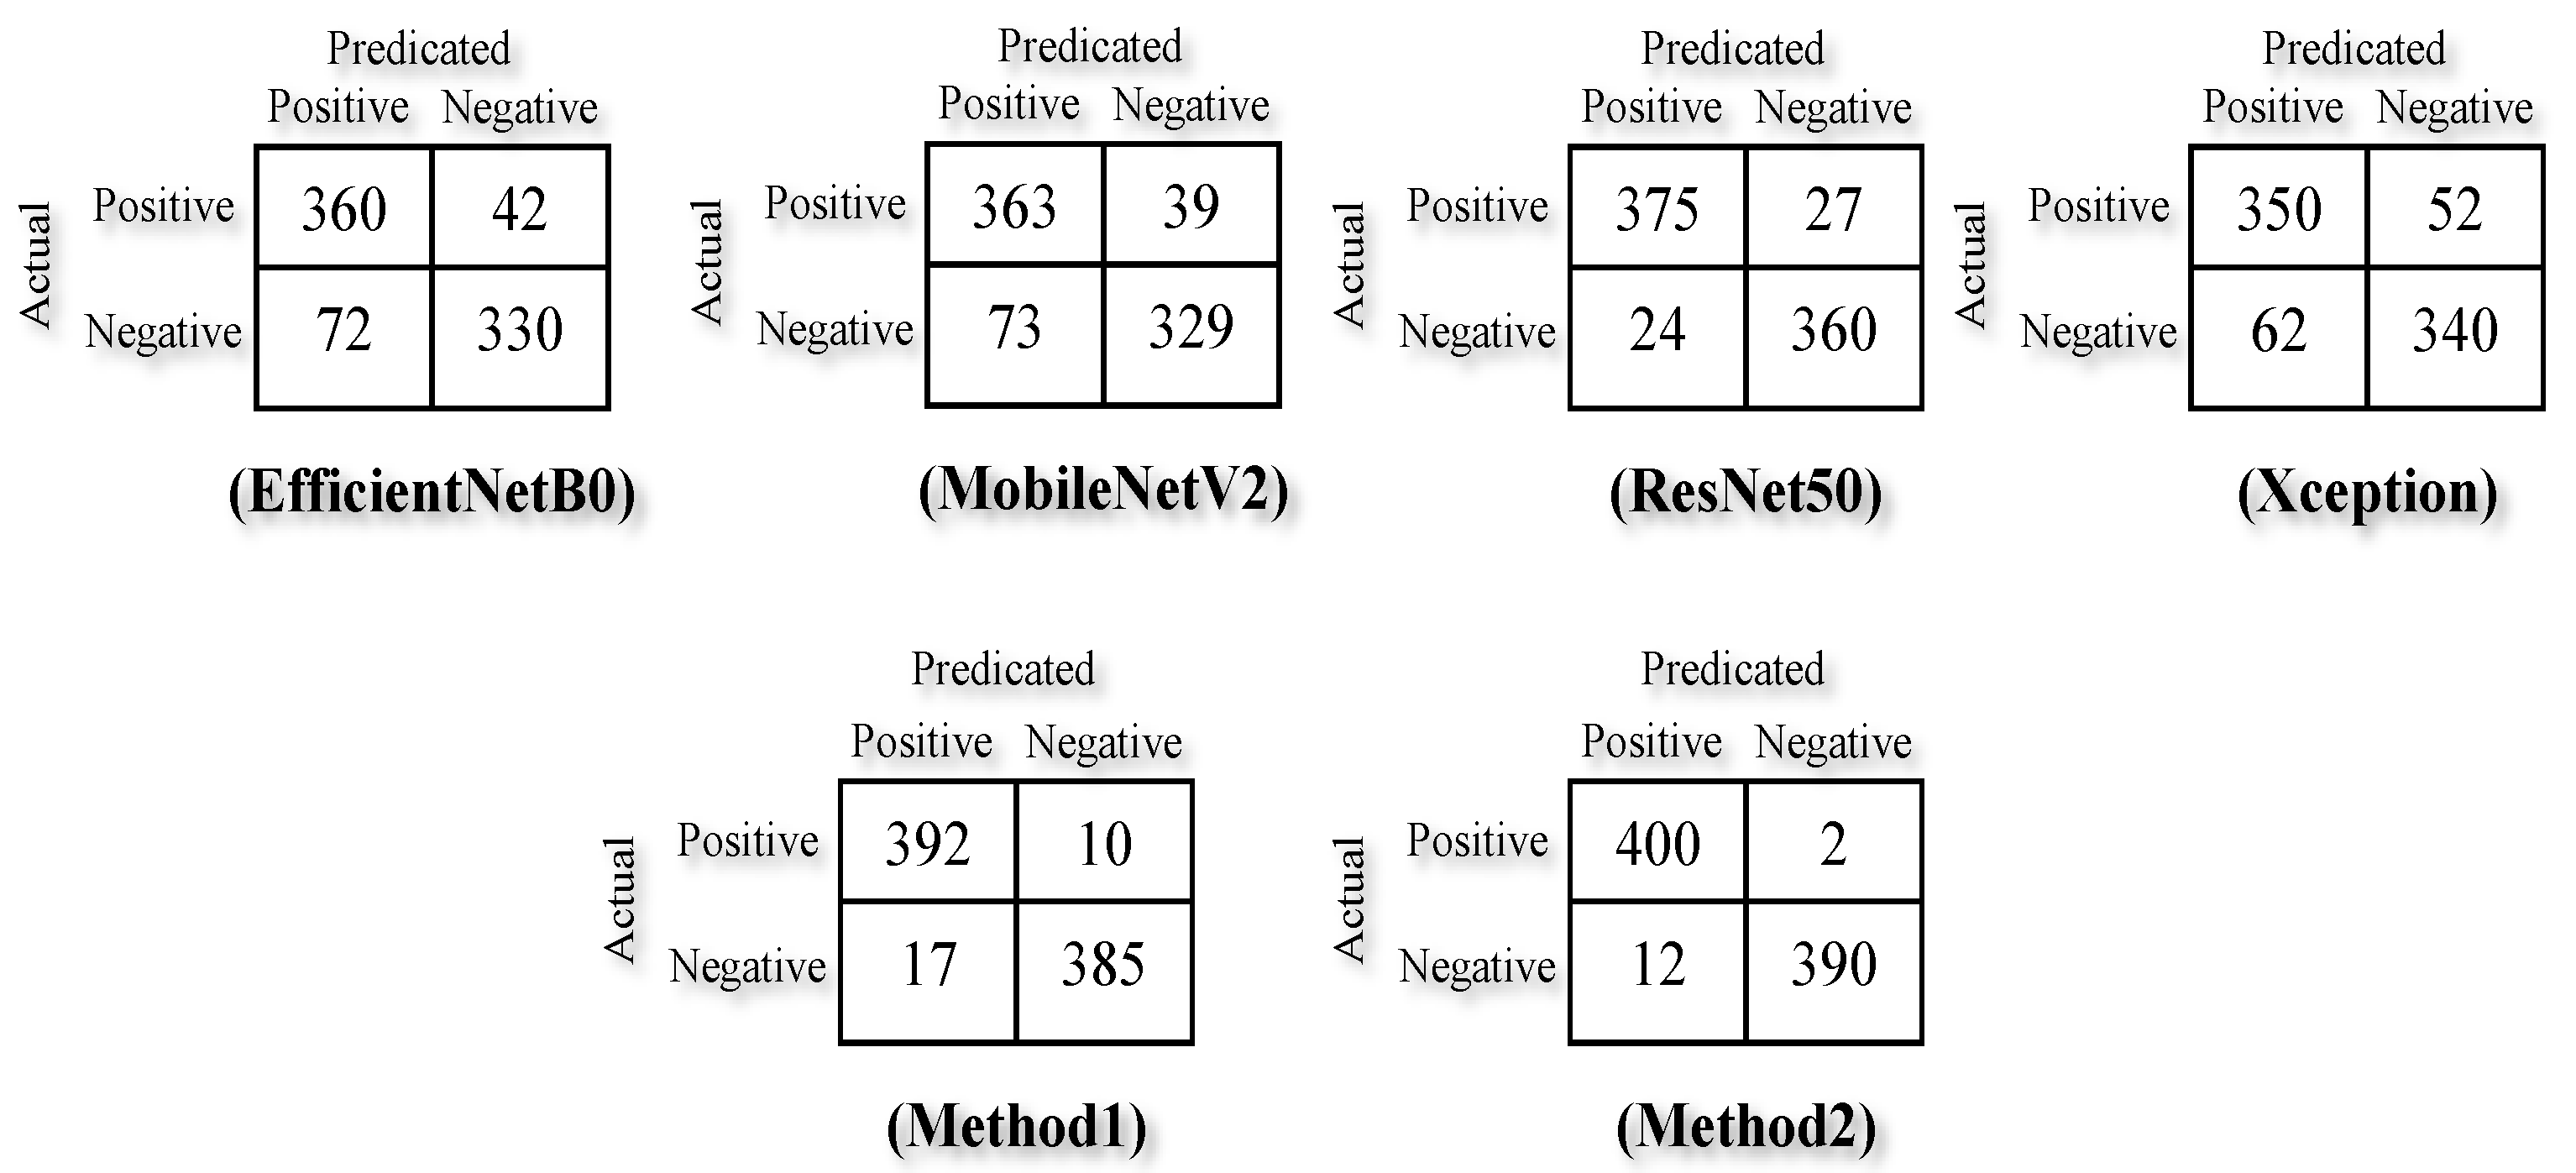
Confusion matrices were used to evaluate the effectiveness and performance of the models under investigation. Sensitivity, specificity, precision, and classification accuracy were all used to determine an image’s class using confusion matrices (Figure 6). The first round of implementation produced results using four previously trained CNN architectures. Two experiments were performed, where the feature extraction explored in Section 4.2 was employed for the SVM classifier. In contrast, in the second experiment, the integration among EfficientNetB0, MobileNetV2, ResNet50, and Xception (i.e., feature extraction) was used and the SVM classifier, concerning 402 images for non-fall and 210 images for fall activities, employed.
In Table 1, the EfficientNetB0 model had an average accuracy value of 86%. The EfficientNetB0 model achieved 0.90, 0.82, 0.82 for sensitivity, specificity and precision, respectively. The average accuracy of the MobileNetV2 model was 86%. For Sensitivity, Specificity, and Precision, this model obtained scores of 0.90, 0.82, and 0.83, respectively. The ResNet50 model had an average accuracy value of 91%. The sensitivity, specificity, and precision for this model scored 0.93, 0.90, and 0.90, respectively. In addition, an average accuracy rating of 87% was achieved by the Xception model. The sensitivity, specificity, and precision scores for the Xception model were 0.87, 0.87, and 0.87, respectively.
Then, the second stage of the investigation took place by applying the following: (i) extraction of both local and global characteristics, (ii) the Elliptic Fourier descriptors, (iii) Zernike moments, and (iv) center of silhouette motions. The SVM classifier received the characteristics gained in each architecture and combined them.
Following optimization, the SVM classifier was used to identify the features where the proposed models scored 97% in accuracy (i.e., method 1, as shown in Table 1). A sensitivity of 0.98, a specificity of 0.96, and a specificity of 96% were attained by this combined model.
After that, the third stage of the investigation was conducted where the four models, MobileNetV2, ResNet50, EfficientNetB0, and Xception, were utilized to extract features. The number of features extracted and concatenated by each architecture equals the number of images in the dataset. The SVM classifier receives the characteristics gained in each architecture and combines them. Following optimization, the SVM classifier was used to identify these features. The proposed models reached 98% in terms of accuracy (i.e., method 2, as presented in Table 1). A sensitivity of 0.99, a specificity of 0.97, and a specificity of 97% were attained by this combined model.
There are two stages of complexity: the testing stage and the training stage. A quadratic issue is solved to estimate the vector w and bias b for linear SVMs. The amount of training data present at test time does not affect detecting of emergency incidents, which is linear in the number of features. The training process establishes the number of support vectors (i.e., which can be constrained by training set size * training set error rate), and the number of features determines the test difficulty. The suggested method has an O (1500 × 0.001) temporal complexity due to the 1500 images in the training batch and a 0.009 error rate.
6. Conclusions
In this work, the design and implementation of an Internet of Things (IoT) services architecture for emergency response management, based on human action recognition, is presented. To enable the delivery of real-time IoT services for emergency response management, the architecture integrates IoT capabilities and computer vision technology. Additionally, a hybrid model for detecting emergency incidents, that combines a Convolutional Neural Network (CNN) and a Support Vector Machine (SVM), is proposed to categorize human activity as either an emergency incident or a daily regular activity. The UR Fall Detection Dataset (URFD) is used, where a total of 612 photos were selected, including emergencies (i.e., a falling person) and normal daily activities (e.g., resting, standing, and walking), to validate the viability and advantages of the proposed approach. Several experiments were conducted to classify the fall and everyday activities. In one of the experiments, an integration of EfficientNetB0, MobileNetV2, ResNet50, Xception (for feature extraction), and SVM classifier (for activity classification) were used, while in the other experiment, the feature extraction described in Section 4.2 was used. When applying the proposed hybrid emergency incidents detection model, the results of the experiments achieved 0.99, 0.97, 0.97, and 0.98 in terms of sensitivity, specificity, precision, and accuracy, respectively (combining CNN and SVM). These scores were the highest compared to other models described in the literature, such as EfficientNetB0, MobileNetV2, ResNet50, Xception and SVM classifier. For future work, gathering a real-world dataset from IoT camera devices is intended as part of ongoing work. This dataset can be used to compare the performance of the proposed hybrid emergency incidents detection model with other RGB video-based solutions. In addition, a dataset containing more challenging images, such as emergency incident images that contain crowds and other emergency incident images captured from long distances (e.g., images collected by drones or Unmanned Aerial Vehicles (UAVs)), is possible, and the current results could be compared with the more challenging ones. Another intended future work is measuring the latency of human action recognition, while using IoT devices, and improving it.
Funding
This research received no external funding.
Institutional Review Board Statement
Not applicable.
Informed Consent Statement
Not applicable.
Data Availability Statement
Not applicable.
Conflicts of Interest
The author declares no conflict of interest.
References
- GMB Union. 35% of Ambulance Workers Witnessed Deaths Due to Delays. 2022. Available online: https://www.gmb.org.uk/news/35-ambulance-workers-witnessed-deaths-due-delays (accessed on 15 November 2022).
- Shepherd, T. More than 30 Deaths Linked to Delays at Victoria’s Overloaded Triple-Zero Service. 2022. Available online: https://www.theguardian.com/australia-news/2022/sep/03/all (accessed on 17 November 2022).
- Noor, T.H. Behavior Analysis-Based IoT Services For Crowd Management. Comput. J. 2022, 65, bxac071. [Google Scholar] [CrossRef]
- Lopez-Fuentes, L.; van de Weijer, J.; González-Hidalgo, M.; Skinnemoen, H.; Bagdanov, A.D. Review on Computer Vision Techniques in Emergency Situations. Multimed. Tools Appl. 2018, 77, 17069–17107. [Google Scholar] [CrossRef] [Green Version]
- Fedele, R.; Merenda, M. An IoT System for Social Distancing and Emergency Management in Smart Cities Using Multi-sensor Data. Algorithms 2020, 13, 254. [Google Scholar] [CrossRef]
- Noor, T.H. A Gesture Recognition System for Gesture Control on Internet of Things Services. J. Theor. Appl. Inf. Technol. 2018, 96, 3886–3895. [Google Scholar]
- Yao, L.; Wang, X.; Sheng, Q.Z.; Dustdar, S.; Zhang, S. Recommendations on the Internet of Things: Requirements, Challenges, and Directions. IEEE Internet Comput. 2019, 23, 46–54. [Google Scholar] [CrossRef]
- Hamad, S.A.; Sheng, Q.Z.; Zhang, W.E.; Nepal, S. Realizing an Internet of Secure Things: A Survey on Issues and Enabling Technologies. IEEE Commun. Surv. Tutor. 2020, 22, 1372–1391. [Google Scholar] [CrossRef]
- Bello, O.; Zeadally, S. Toward Efficient Smartification of the Internet of Things (IoT) Services. Future Gener. Comput. Syst. 2019, 92, 663–673. [Google Scholar] [CrossRef]
- Bosch, M.; Conroy, C.; Ortiz, B.; Bogden, P. Improving Emergency Response During Hurricane Season Using Computer Vision. In Proceedings of the Earth Resources and Environmental Remote Sensing/GIS Applications XI Conference; SPIE: Bellingham, WA, USA, 2020; pp. 72–79. [Google Scholar]
- Han, Y.K.; Choi, Y.B. Detection of Emergency Disaster using Human Action Recognition based on LSTM Model. IEIE Trans. Smart Process. Comput. 2020, 9, 177–184. [Google Scholar] [CrossRef]
- Maguluri, L.P.; Srinivasarao, T.; Syamala, M.; Ragupathy, R.; Nalini, N. Efficient Smart Emergency Response System for Fire Hazards Using IoT. Int. J. Adv. Comput. Sci. Appl. 2018, 9, 314–320. [Google Scholar]
- Ma, X.; Wang, X.; Zhang, K. Fall Detection Method for Embedded Devices. J. Imaging Sci. Technol. 2022, 66, 040407-1–040407-11. [Google Scholar] [CrossRef]
- Zheng, H.; Liu, Y. Lightweight Fall Detection Algorithm based on AlphaPose Optimization Model and ST-GCN. Math. Probl. Eng. 2022, 2022, 9962666. [Google Scholar] [CrossRef]
- Elmezain, M.; Malki, Z.S.; Abdel-Rahman, E.O. Human Action Recognition: An Innovative Approach Using Dynamic Affine-Invariants and Spatio-Temporal Action Features. J. Comput. Theor. Nanosci. 2017, 14, 999–1008. [Google Scholar] [CrossRef]
- Elmezain, M.; Abdel-Rahman, E.O. Human Activity Recognition: Discriminative Models Using Statistical Chord-Length and Optical Flow Motion Features. Appl. Math. Inf. Sci. 2015, 9, 3063–3072. [Google Scholar]
- Sun, Z.; Ke, Q.; Rahmani, H.; Bennamoun, M.; Wang, G.; Liu, J. Human Action Recognition from Various Data Modalities: A Review. IEEE Trans. Pattern Anal. Mach. Intell. (TPAMI) 2023, 45, 3200–3225. [Google Scholar] [CrossRef] [PubMed]
- Saif, S.; Tehseen, S.; Kausar, S. A Survey of the Techniques for the Identification and Classification of Human Actions from Visual Data. Sensors 2018, 18, 3979. [Google Scholar] [CrossRef] [Green Version]
- Kong, Y.; Fu, Y. Human Action Recognition and Prediction: A Survey. Int. J. Comput. Vis. 2022, 130, 1366–1401. [Google Scholar] [CrossRef]
- Arshad, B.; Ogie, R.; Barthelemy, J.; Pradhan, B.; Verstaevel, N.; Perez, P. Computer Vision and IoT-based Sensors in Flood Monitoring and Mapping: A Systematic Review. Sensors 2019, 19, 5012. [Google Scholar] [CrossRef] [Green Version]
- Deak, G.; Curran, K.; Condell, J.; Asimakopoulou, E.; Bessis, N. IoTs (Internet of Things) and DfPL (Device-free Passive Localisation) in a Disaster Management Scenario. Simul. Model. Pract. Theory 2013, 35, 86–96. [Google Scholar] [CrossRef]
- Zhang, Z.; Conly, C.; Athitsos, V. A Survey on Vision-based Fall Detection. In Proceedings of the 8th ACM International Conference on PErvasive Technologies Related to Assistive Environments, Corfu, Greece, 1–3 July 2015; pp. 1–7. [Google Scholar]
- Nooruddin, S.; Islam, M.; Sharna, F.A.; Alhetari, H.; Kabir, M.N. Sensor-based Fall Detection Systems: A Review. J. Ambient Intell. Humaniz. Comput. 2022, 13, 2735–2751. [Google Scholar] [CrossRef]
- Gutiérrez, J.; Rodríguez, V.; Martin, S. Comprehensive Review of Vision-based Fall Detection Systems. Sensors 2021, 21, 947. [Google Scholar] [CrossRef]
- Usmani, S.; Saboor, A.; Haris, M.; Khan, M.A.; Park, H. Latest Research Trends in Fall Detection and Prevention Using Machine Learning: A Systematic Review. Sensors 2021, 21, 5134. [Google Scholar] [CrossRef] [PubMed]
- Lee, T.; Mihailidis, A. An Intelligent Emergency Response System: Preliminary Development and Testing of Automated Fall Detection. J. Telemed. Telecare 2005, 11, 194–198. [Google Scholar] [CrossRef] [PubMed]
- Jeong, I.W.; Choi, J.; Cho, K.; Seo, Y.H.; Yang, H.S. A Vision-based Emergency Response System with a Paramedic Mobile Robot. IEICE Trans. Inf. Syst. 2010, 93, 1745–1753. [Google Scholar] [CrossRef] [Green Version]
- Zhu, N.; Zhao, G.; Zhang, X.; Jin, Z. Falling Motion Detection Algorithm Based on Deep Learning. IET Image Process. 2022, 16, 2845–2853. [Google Scholar] [CrossRef]
- Chua, J.L.; Chang, Y.C.; Lim, W.K. A Simple Vision-Based Fall Detection Technique for Indoor Video Surveillance. Signal Image Video Process. 2015, 9, 623–633. [Google Scholar] [CrossRef]
- Alhimale, L.; Zedan, H.; Al-Bayatti, A. The Implementation of an Intelligent and Video-based Fall Detection System Using a Neural Network. Appl. Soft Comput. 2014, 18, 59–69. [Google Scholar] [CrossRef]
- Elmezain, M. Invariant Color Features-based Foreground Segmentation for Human-computer Interaction. Math. Methods Appl. Sci. 2018, 41, 5770–5779. [Google Scholar] [CrossRef]
- Elmezain, M.; Al-Hamadi, A. Vision-Based Human Activity Recognition Using LDCRFs. Int. Arab J. Inform. Technol. 2018, 15, 389–395. [Google Scholar]
- Hahm, G.J.; Cho, K. Event-based Sport Video Segmentation Using Multimodal Analysis. In Proceedings of the 2016 International Conference on Information and Communication Technology Convergence (ICTC), Jeju, Korea, 19–21 October 2016; pp. 1119–1121. [Google Scholar]
- Cortes, C.; Vapnik, V. Support-vector Networks. Mach. Learn. 1995, 20, 273–297. [Google Scholar] [CrossRef]
- Cengıl, E.; Çinar, A. Multiple Classification of Flower Images Using Transfer Learning. In Proceedings of the 2019 International Artificial Intelligence and Data Processing Symposium (IDAP), Malatya, Turkey, 21–22 September 2019; pp. 1–6. [Google Scholar]
- Tan, M.; Le, Q. Efficientnet: Rethinking Model Scaling for Convolutional Neural Networks. In Proceedings of the International Conference on Machine Learning, Long Beach, CA, USA, 9–15 June 2019; pp. 6105–6114. [Google Scholar]
- Sandler, M.; Howard, A.; Zhu, M.; Zhmoginov, A.; Chen, L.C. MobileNetV2: Inverted Residuals and Linear Bottlenecks. In Proceedings of the IEEE Conference on Computer Vision and Pattern Recognition (CVPR), Salt Lake City, UT, USA, 18–22 June 2018. [Google Scholar]
- Tripathi, K.; Gupta, A.K.; Vyas, R.G. Deep Residual Learning for Image Classification using Cross Validation. Int. J. Innov. Technol. Explor. Eng. (IJITEE) 2020, 9, 1526–1530. [Google Scholar] [CrossRef]
- Cleetus, L.; Sukumar, A.R.; Hemalatha, N. Computational Prediction of Disease Detection and Insect Identification Using Xception Model. bioRxiv 2021, 1–7. [Google Scholar] [CrossRef]
- Kwolek, B.; Kepski, M. Human Fall Detection on Embedded Platform Using Depth Maps and Wireless Accelerometer. Comput. Methods Programs Biomed. 2014, 117, 489–501. [Google Scholar] [CrossRef] [PubMed]
Figure 1.
IoT Services Architecture for Emergency Response Management.

Figure 2.
A series of persons moving in an indoor scenario. (a) Source input with the foreground. (b) Depth map for the source input foreground (c) Foreground detection utilizing the proposed background subtraction method.
Figure 2.
A series of persons moving in an indoor scenario. (a) Source input with the foreground. (b) Depth map for the source input foreground (c) Foreground detection utilizing the proposed background subtraction method.

Figure 3.
Architecture of CNN Model.

Figure 4.
The Emergency Medical Services Practitioner’s Dashboard.

Figure 5.
Some sample images, concerning their depth maps, form the URFD dataset.

Figure 6.
Confusion matrix for EfficientNetB0, MobileNetV2, ResNet50, Xception, method 1 and method 2.
Figure 6.
Confusion matrix for EfficientNetB0, MobileNetV2, ResNet50, Xception, method 1 and method 2.


Table 1.
Comparison with different classifiers on the URFD dataset.
| Sensitivity | Specificity | Precision | Accuracy | |
|---|---|---|---|---|
| EfficientNetB0 | 0.90 | 0.82 | 0.83 | 0.86 |
| MobileNetV2, | 0.90 | 0.82 | 0.83 | 0.86 |
| ResNet50 | 0.93 | 0.90 | 0.90 | 0.91 |
| Xception | 0.87 | 0.87 | 0.87 | 0.87 |
| Method 1 (SVM on extracted features) | 0.98 | 0.96 | 0.96 | 0.97 |
| Method 2 (CNN-SVM) | 0.99 | 0.97 | 0.97 | 0.98 |
Disclaimer/Publisher’s Note: The statements, opinions and data contained in all publications are solely those of the individual author(s) and contributor(s) and not of MDPI and/or the editor(s). MDPI and/or the editor(s) disclaim responsibility for any injury to people or property resulting from any ideas, methods, instructions or products referred to in the content. |
© 2023 by the author. Licensee MDPI, Basel, Switzerland. This article is an open access article distributed under the terms and conditions of the Creative Commons Attribution (CC BY) license (https://creativecommons.org/licenses/by/4.0/).
Share and Cite
MDPI and ACS Style
Noor, T.H. Human Action Recognition-Based IoT Services for Emergency Response Management. Mach. Learn. Knowl. Extr. 2023, 5, 330-345. https://doi.org/10.3390/make5010020
AMA Style
Noor TH. Human Action Recognition-Based IoT Services for Emergency Response Management. Machine Learning and Knowledge Extraction. 2023; 5(1):330-345. https://doi.org/10.3390/make5010020
Chicago/Turabian StyleNoor, Talal H. 2023. "Human Action Recognition-Based IoT Services for Emergency Response Management" Machine Learning and Knowledge Extraction 5, no. 1: 330-345. https://doi.org/10.3390/make5010020