Article

Structure and Properties of Polystyrene-Co-Acrylonitrile/Graphene Oxide Nanocomposites

by
Zaid G. Mohammadsalih
1,
Beverley J. Inkson
2 and
Biqiong Chen
3,*
1
Applied Science Research Unit, Applied Science Department, University of Technology, Baghdad 10066, Iraq
2
Department of Materials, University of Sheffield, Mappin Street, Sheffield S1 4NS, UK
3
School of Mechanical and Aerospace Engineering, Queen’s University Belfast, Stranmillis Road, Belfast BT9 5AH, UK
*
Author to whom correspondence should be addressed.
J. Compos. Sci. 2023, 7(6), 225; https://doi.org/10.3390/jcs7060225
Submission received: 12 March 2023 / Revised: 25 April 2023 / Accepted: 29 May 2023 / Published: 31 May 2023
(This article belongs to the Special Issue Multiscale Analysis of Polymer Nanocomposites)

Abstract

:
Polymer/graphene nanocomposites have attracted significant attention from the research community over the past two decades. In this work, nanocomposites of polystyrene-co-acrylonitrile (SAN) and graphene oxide (GO) were prepared using a solution blending method with tetrahydrofuran as the solvent. The GO loadings used were 0.1, 0.25, 0.5, and 1.0 wt.%. Fourier transform infrared spectroscopy, X-ray diffraction, and scanning electron microscopy were employed to characterize the structure and morphology of SAN/GO nanocomposites. Thermal analysis showed increases in the glass transition (Tg) and peak thermal degradation (Tdpeak) temperatures of SAN by the additions of GO, with Tg increasing by 3.6 °C and Tdpeak by 19 °C for 1.0 wt.% GO loading. Dynamic mechanical analysis revealed that the storage modulus of SAN was also enhanced with the incorporations of GO by up to 62% for 1.0 wt.% loading. These property enhancements may be attributed to a good dispersion of GO in the polymer matrix and their interfacial interactions.

1. Introduction

The field of polymer nanocomposites has attracted significant interest from researchers around the globe due to the important role played by nano-fillers in enhancing the performance of polymers and extending their applications. Nanocomposites can be defined as a combination of two or more distinct and physically separable phases with at least one of the phases in nanoscale, which show superior or distinctive properties compared to their individual constituents. Many factors influence the behavior of polymer nanocomposites such as the structure and properties of the polymer matrix and the nano-fillers, the dispersion of nano-fillers, and the interface in the nanocomposite [1]. The optimization of the aforementioned factors may lead to promising outcomes represented by, but not limited to, polymer nanocomposites of low density, good thermal stability, and unique mechanical performance. Furthermore, the optimization of processing parameters is another important factor to obtain polymer nanocomposites with targeted physical and mechanical performance [2].
Since the seminal work by Geim and co-workers in 2004 [3], graphene has drawn significant attention from researchers due to its outstanding mechanical, thermal, and electrical properties. Graphene is a two-dimensional material of monolayers of carbon packed in a hexagonal structure. The geometry of graphene, e.g., high surface area and high aspect ratio, plays a crucial role in making it an efficient reinforcing filler in polymer matrices at low loadings [4,5]. Graphene-based polymer nanocomposites have become widely researched during the last two decades attributable to their excellent physical and mechanical performance [6]. Similar to the cases with other polymer nanocomposites, the improvement in the physical and mechanical performance of graphene-based polymer nanocomposites is also intimately associated with substantial prerequisites represented by favorable interfacial adhesion between polymer matrices and graphene, as well as the effective dispersion of graphene sheets in these matrices. The achievement of a good dispersion of pristine graphene in polymer matrices is a challenging task due to the lack of functional groups on its surfaces for interacting with polymer matrices, the strong tendency of nano-sheets to stack together, etc. The production of GO has overcome these drawbacks and paved the way for the preparation of polymer/graphene nanocomposites with high performance [5].
Graphene oxide (GO) has oxygenated functional groups both in the periphery (carboxylic acid) and the basal plane (epoxy and hydroxyl) of graphene nano-sheets. These functional groups confer GO easy dispersion in water and some organic solvents, as well as strong interfacial interactions with many polymers. GO nano-sheets can be derived from low-cost natural or synthetic graphite through oxidation to form graphite oxide, which is subsequently exfoliated to become GO. This chemical approach allows for the production of GO on larger scales and so the preparation of bulk polymer/GO nanocomposites. Due to its surface functional groups, high modulus, high aspect ratio, and large specific surface area, GO is considered to be an efficient reinforcing nano-filler for many polymers. The resulting polymer/GO nanocomposites may be utilized in different kinds of applications such as automotive, energy, filtration, and biomedical products [7,8,9].
Styrene-co-acrylonitrile (SAN) copolymer is a transparent copolymer with attractive features including dimensional stability, high strength, rigidity, and high thermal stability. It also has good resistance to chemicals such as chlorinated and aliphatic hydrocarbons, fats, various oils, and household detergents. It has been widely used on its own, for example in oil hoses and lining materials, as well as capacitors and electromagnetic interference shielding when incorporated with nano-fillers to prepare SAN nanocomposites [10,11,12].
A range of loadings of carbon nanotubes (CNTs, 0.1–3.0 wt.%) were used to reinforce SAN using an in situ polymerization approach to prepare nanocomposites with enhanced tribological properties [13]. The results showed that highest wear resistance and lowest friction coefficient were achieved for SAN/CNT 1.0 wt.%, whilst the micro-hardness was significantly improved with a CNT content below 1.0 wt.%. Substantial improvement in fire retardance and thermal properties, along with a 20% increase in Young’s modulus, was achieved, when 3.0 wt.% montmorillonite clay was incorporated into the SAN matrix by using a water-assisted extrusion approach [14]. The effect of sulfanilic acid-reduced graphene oxide (SRGO) on the thermo-mechanical properties of SAN nanocomposites was investigated [12]. An increase of storage modulus by 46% was found with 4.0 wt.% SRGO, in comparison with the value for GO reinforcing SAN. The majority of studies published previously were focused on reinforcing SAN with different carbonaceous derivatives including CNTs and reduced graphene oxide [12,13,14]. The studies associated with reinforcing SAN with GO are quite limited. This work aims to investigate the structure and properties of SAN reinforced by different loadings of GO. The nanocomposite structures were characterized using Fourier transform infrared spectroscopy (FTIR), X-ray diffraction (XRD), and scanning electron microscopy (SEM), while the thermal and mechanical properties were measured using thermogravimetric analysis (TGA), differential scanning calorimetry (DSC), and dynamic mechanical analysis (DMA).

2. Materials and Methods

2.1. Materials

SAN pellets (Tyril 790), with an average molecular weight of 165,000 g mol−1, were obtained from Dow Chemicals. Graphite powder (≤20 µm), sulfuric acid (95–98%), potassium permanganate (97%), sodium nitrate (>99%), hydrochloric acid (36.5% in water), hydrogen peroxide (29–32% in water), and tetrahydrofuran (THF, >99.5%) were obtained from Sigma Aldrich. All the materials were used as received.

2.2. Preparation of Graphene Oxide

Graphite oxide was prepared according to a modified Hummers’ method [15], purified by centrifugation and dialysis, and then sonicated and dispersed in water to obtain an aqueous GO suspension, followed by freeze drying to produce GO powder, according to the method described in our earlier publication [16]. Specifically, a beaker was used to mix 6.0 g of graphite with 3.0 g of NaNO3 for 2 h under magnetic stirring. Next, 138 mL of H2SO4 was added to the beaker that was placed in an ice bath for controlling the exothermic reaction and minimizing the temperature. Afterwards, 36 g of another oxidizing agent, KmnO4, was added gradually over two days. All these reactions were carried out under continuous stirring at 200 rpm. Following the reactions, 15 mL of H2O2 was added to the beaker under stirring to remove the excess KmnO4. Then, 100 mL of HCl was diluted with 400 mL of distilled water, which was used to remove metal impurities.
Centrifuges (Eppendorf, Hamburg, Germany and Richmond Scientific Limited, Chorley, UK) were employed for washing graphite oxide with distilled water at a speed of 8000 rpm. After many cycles of centrifugation, the sediment in the centrifuging tubes was placed inside dialysis bags (D014, Fisher Scientific, Schwerte, Germany) that were immersed in a container of distilled water. A water pump was fitted inside the container to facilitate water circulation and speed up the purification process. The distilled water in the container was changed after 72 h. After 144 h of dialysis, a pH of 6~7 for the graphite oxide suspension was achieved. The resulting suspension of graphite oxide was sonicated for 1 h and centrifuged for 30 min, and the supernatant was collected, which was a GO suspension. This GO suspension was cast into a Teflon-coated metal tray and left to freeze in a freezer for 24 h at −40 °C. The frozen GO suspension was then placed inside the chamber of a freeze-drying machine (Bradley Refrigeration, Sheffield, UK) for 48 h under a pressure of around 10−1 bar. Finally, GO loose powder was obtained and stored for further use.

2.3. Preparation of SAN/GO Nanocomposites

SAN/GO nanocomposites were prepared using THF as the solvent. An amount of 10 g of SAN pellets was dissolved in 100 mL of THF by magnetic stirring for 2.0 h at 600 rpm. Separately, 200 mg of GO was dispersed in 200 mL of THF, which was stirred for 2 h at 600 rpm and sonicated for 30 min using a sonication bath (Fisher Brand Elma, Germany). The obtained suspension of GO/THF was stable due to the relatively high surface energy of both GO and THF (62 and 26.4 mN m−1, respectively), according to our previous work [16]. A pre-determined amount of GO/THF suspension was added to the SAN/THF solution to prepare SAN/GO nanocomposites containing 0.1, 0.25, 0.5, and 1.0 wt.% GO. These loadings were selected based on our previous work on polystyrene and a few other polymers [17]. The mixture was stirred for 1.5 h, followed by bath sonication for 0.5 h and shear mixing for 1 h at 1600 rpm/Amp 0.3 (Silverson, Chesham, UK), according to the procedure established in our previous work [16]. The resulting suspension of SAN/GO was poured into glass covered Petri dishes to ensure a slow evaporation of the solvent, which lasted for 24 h to obtain smooth nanocomposite films without surface corrugation.
A smooth film of the neat polymer was also prepared as the control sample. All samples were left in a fume cupboard for a couple of weeks and then in a vacuum oven (VT6025, Thermofisher, Waltham, MA, USA) for 24 h at 50 °C under a pressure of 10−2 mbar in order to obtain solvent-free samples. The thickness of the resulted neat polymer films was 0.3 mm, whereas the thickness of the GO-loaded films was ~0.5 mm.

2.4. Characterization

FTIR (Spectrum 100 Perkin Elmer, Waltham, MA, USA) was carried out with attenuated total reflectance in the wavenumber range of 400–4000 cm−1 at a resolution of 4 cm−1, for characterizing GO, SAN, and SAN/GO nanocomposites. XRD (D2 Phaser, Billerica, MA, Bruker) was employed, with a Ni filter and Cu target, to characterize GO, SAN, and SAN/GO nanocomposites. The slit size was 1.0 mm, the operating current was 10 mA, the operating voltage was 30 kV, and the scanning range was 2θ 5–80° at a step size of 0.02° and a scanning speed 0.32 s per step. SEM (Inspect F, Gliwice, Poland) was used to characterize the surface morphology for the samples using an accelerating voltage of 5.0 kV. Cryogenic fracture surfaces of the SAN and SAN/GO nanocomposite samples were obtained via snapping samples in liquid nitrogen. Samples were mounted on aluminum stubs, followed by manually coating with silver dag and then with gold with a thickness of approximately 50 nm using a sputter coater (Emscope SC500, Oxford, UK) to reduce charge build-up. No coating was carried out for the GO powder.
DSC (DSC 6, Perkin Elmer, Waltham, MA, USA) was used to determine the glass transition temperature, Tg, of the SAN and SAN/GO nanocomposites under the flow of nitrogen gas at a rate of 50 mL.min−1 and a sample mass of 5.0 mg. A heating–cooling–heating cycle was conducted in the temperature range of 25–240 °C, at a heating or cooling rate of 10 °C.min−1. The second heating curve was used for analysis to remove the thermal history of the samples. TGA (Pyris 1, Perkin Elmer, Waltham, MA, USA) was used to characterize the thermal degradation behavior of the GO, SAN, and SAN/GO nanocomposites. The weight of each sample was 5.0 mg, and the atmosphere of the analysis was N2 (at a flow rate of 50 mL.min−1). The range of temperature used was from 28 to 700 °C, and the heating rate was 10 °C.min−1. DMA (DMA 8000, Perkin Elmer, Waltham, MA, USA) was used to evaluate the viscoelastic properties of the neat polymer and nanocomposites, where the strain was 0.5%, the range of temperature was 30–130 °C, the heating rate was 3.0 °C.min−1, and the oscillatory frequency was 1.0 Hz. A single cantilever bending mode was used for the tests. Rectangular samples with dimensions of 10 mm length and 5.0 mm width were used.

3. Results and Discussion
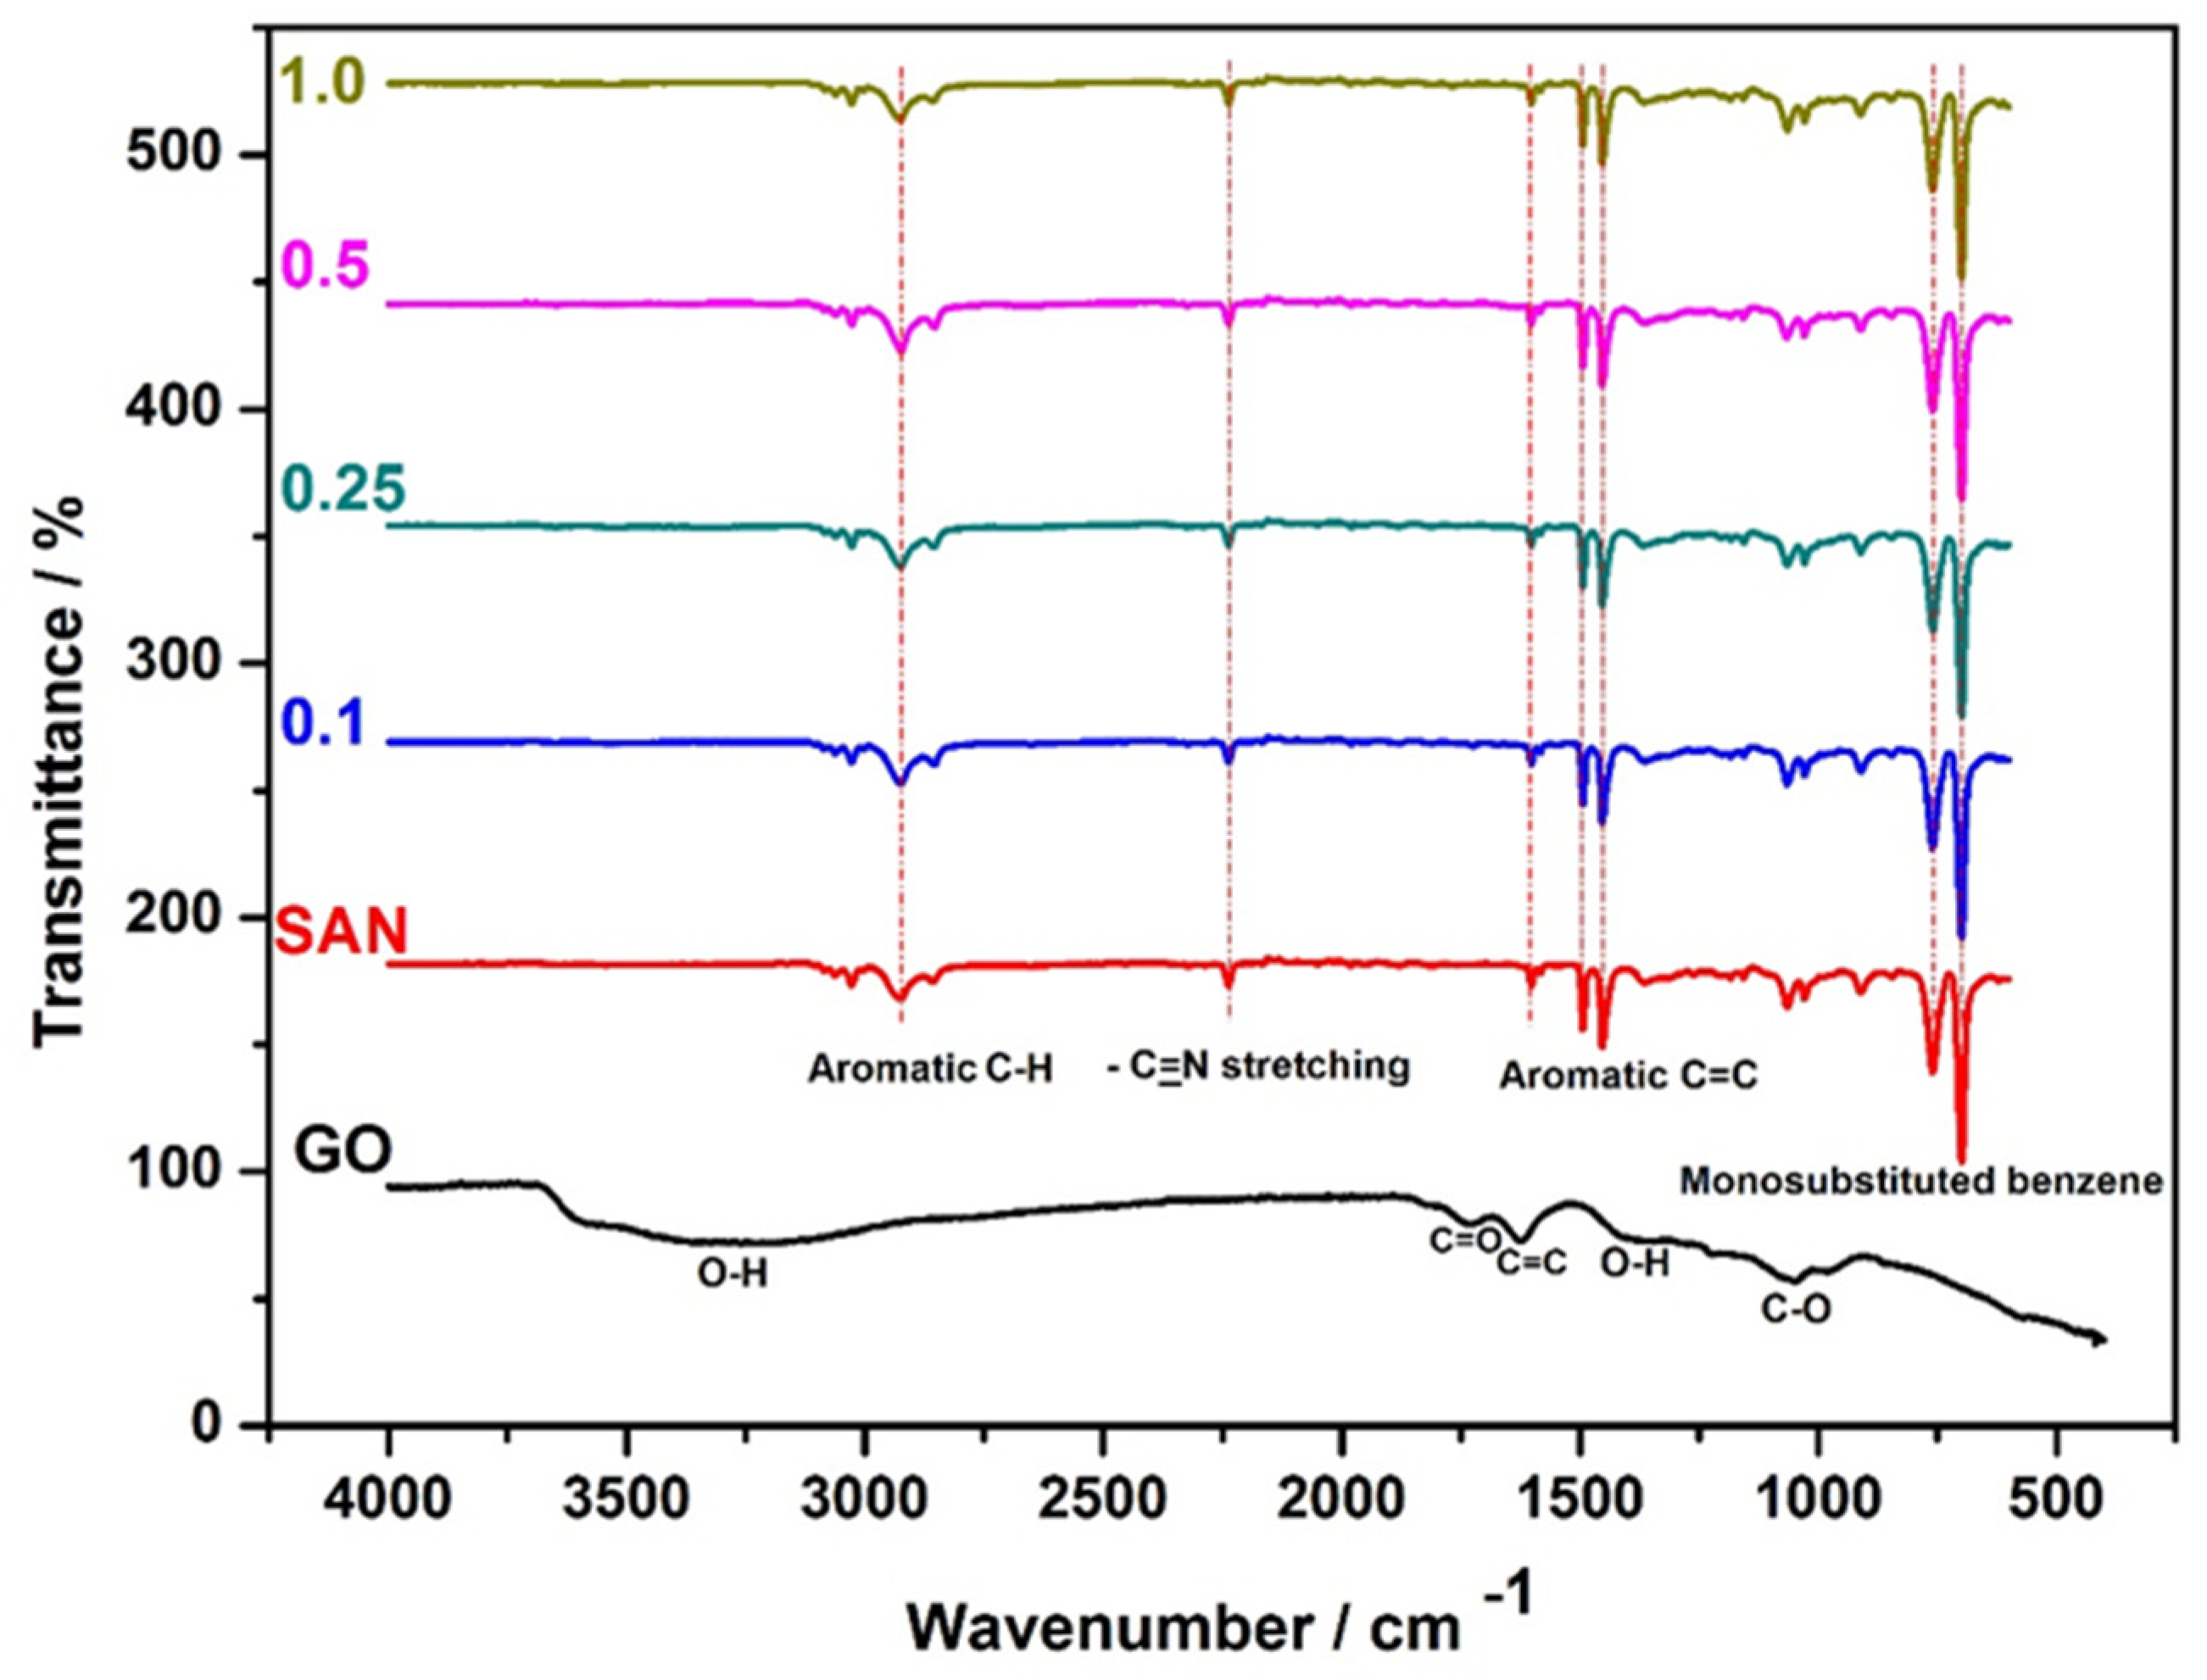
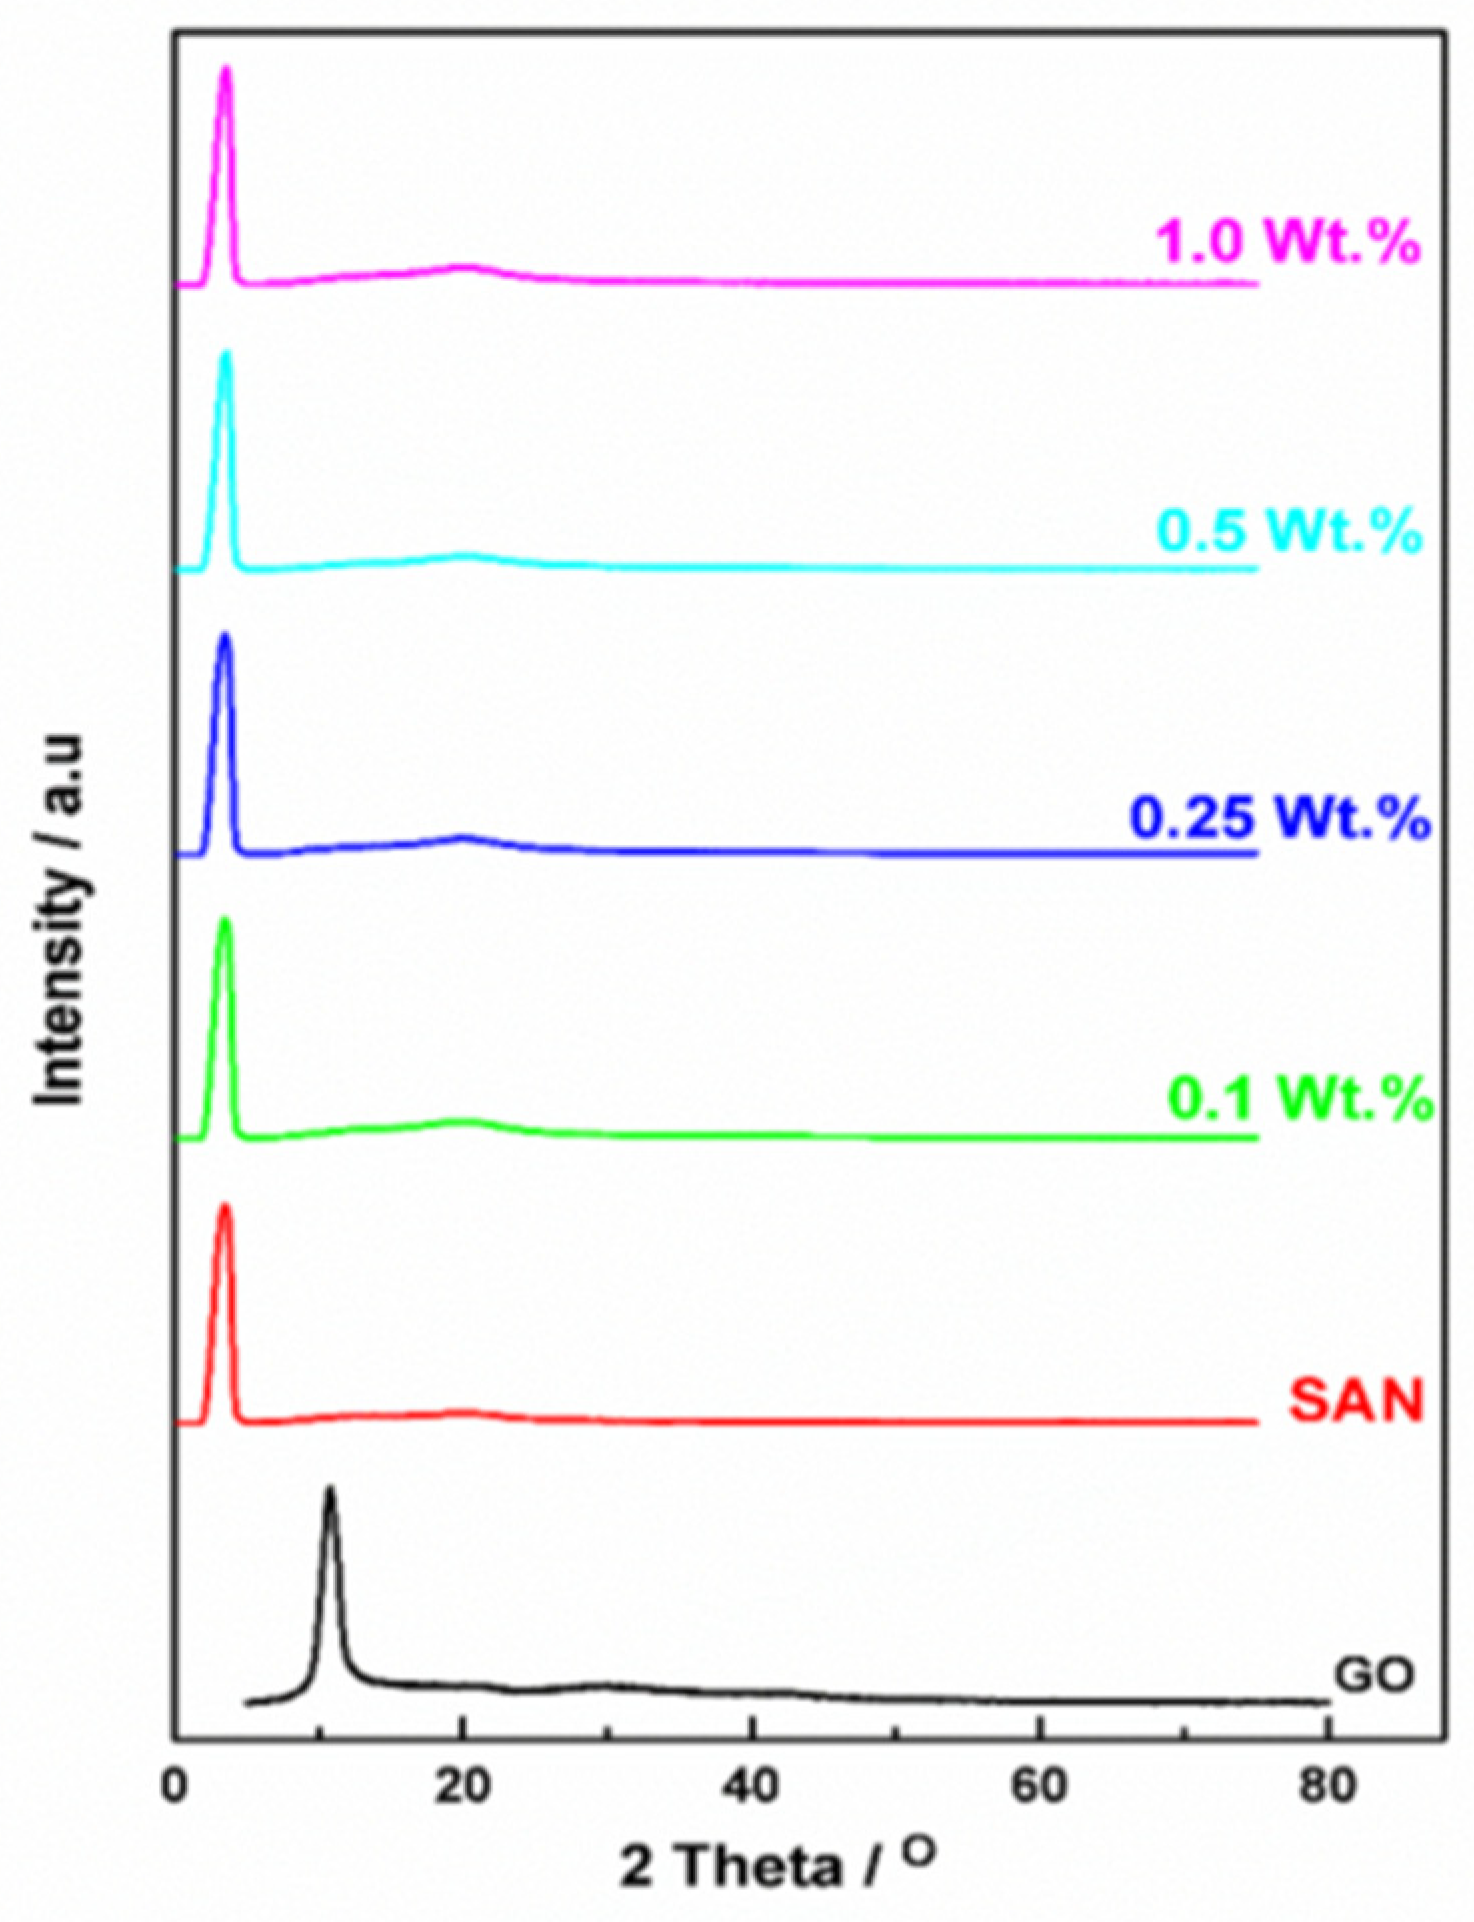
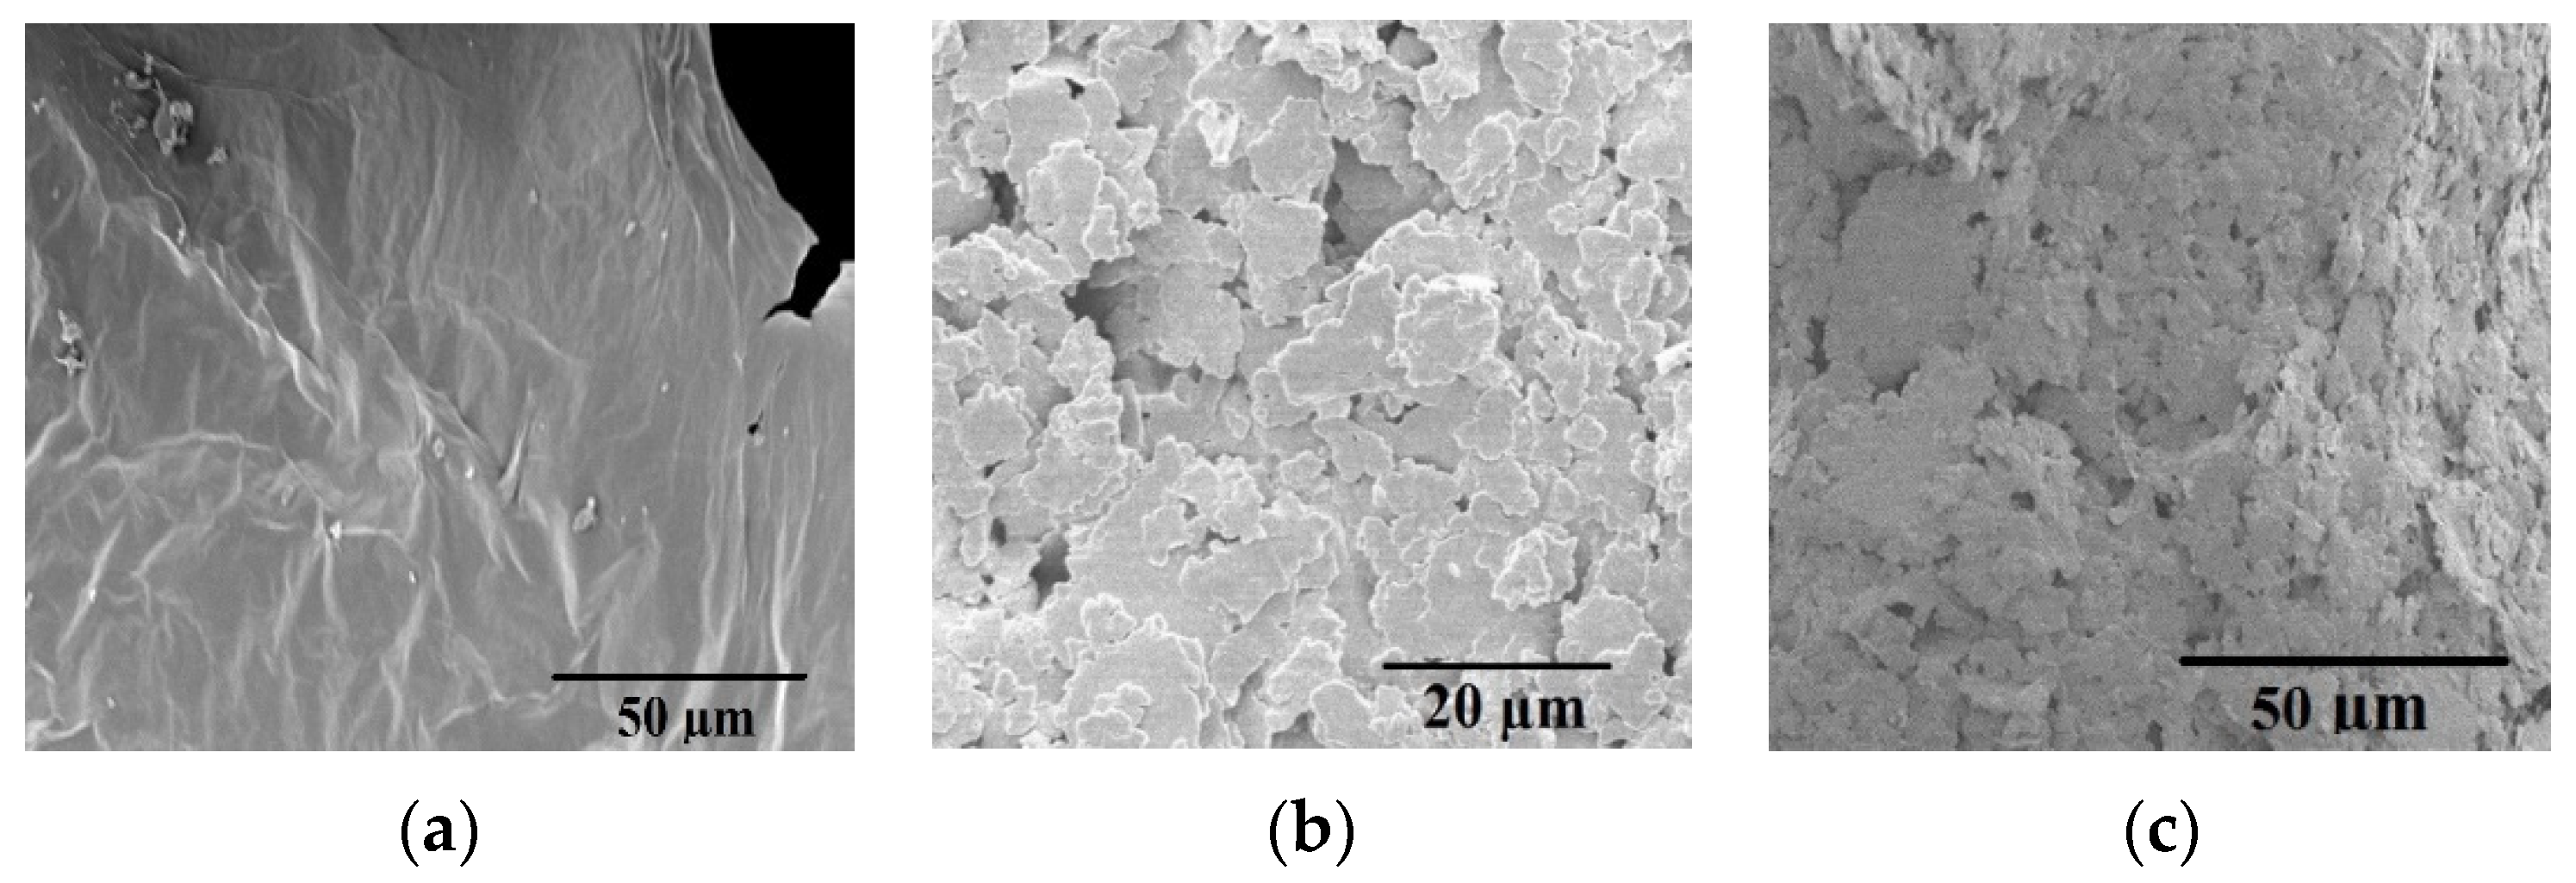
3.1. Structure

The chemical structure of GO, neat SAN, as well as the potential interfacial interactions in the SAN/GO nanocomposites containing different loadings of GO, was investigated by FTIR, and the relevant spectra are shown in Figure 1. For the GO spectrum, C=O stretching vibration is centered at 1730 cm−1, the C-O group at 1040 cm−1, and a broad band of hydroxyl centered at about 3300 cm−1. A peak related to O-H deformation exists at around 1400 cm−1. All of these oxygenated functional groups confirm the successful oxidation of graphite [10,12,18,19,20,21]. Moreover, the in-plane stretching vibration of C=C can be seen at around 1625 cm−1, which is attributed to the skeletal vibration of unoxidized graphitic domains. For neat SAN, the mono-substituted benzene peaks can be seen at 700 and 750 cm−1. The aromatic C=C group results in a range of peaks at 1450, 1500, and 1600 cm−1. The –C≡N stretching from acrylonitrile is observed at 2240 cm−1, and the aromatic C-H is located at 2924 cm−1 [22]. After incorporating GO, the intensity of the peaks of SAN remained similar due to the low contents of GO. This is similar to the finding reported in the literature [23], when 5.0 wt.% clay was used as a 2D nano-filler. This finding is, however, different to another finding [24] that showed the presence of 2.0 wt.% graphite sheets reduced the peak intensity of SAN. Possible interactions between SAN and GO such as π–π interactions [25] could not be detected in the spectra because of the low contents of GO.
In Figure 2, the XRD patterns for GO, SAN, and their nanocomposites containing different loadings of GO are presented to investigate their crystalline structure. The (001) peak for GO can be seen at 10.7°, corresponding to an interlayer spacing of 0.82 nm, which is the same or very similar to the values reported in the literature [26,27]. For SAN and its nanocomposites, the main diffraction peak of SAN was located at 2Ɵ = 3.47°. This peak remained at the same 2Ɵ in the traces of the nanocomposites. However, the (001) peak of GO was not observed in the traces of the nanocomposites, possibly due to the good dispersion of GO nano-sheets in the SAN and/or their low contents.
Figure 3 shows the morphology of GO, as well as the cryogenically fractured surfaces of the neat SAN and SAN/GO 1.0 wt.% nanocomposite (containing the highest loading of GO among the nanocomposites studied) from SEM to explore the nature of GO nano-sheets distribution within the polymer matrix. Figure 3a shows the wrinkled morphology of GO, as previously reported in the literature [7]. The GO has an average length of 1.0 µm and thickness of 0.9 nm, according to atomic force microscopy reported in our previous publication [27]. It can be seen in Figure 3b that the neat SAN has a rough fracture surface, similar to previous findings [11,24]. A SAN/GO nanocomposite of 1.0 wt.% shows a different surface morphology (Figure 3c), with the appearance of a flaky structure due to the presence of GO nano-sheets. Similar flaky surface morphology was also observed in acrylonitrile butadiene styrene/GO 1.0 wt.% nanocomposite [18]. Some micro-pores can be seen in both images, probably because of the procedure used in solvent removal during the film preparation [28]. These micro-pores may be removed if films are prepared by hot pressing under an elevated temperature and pressure.

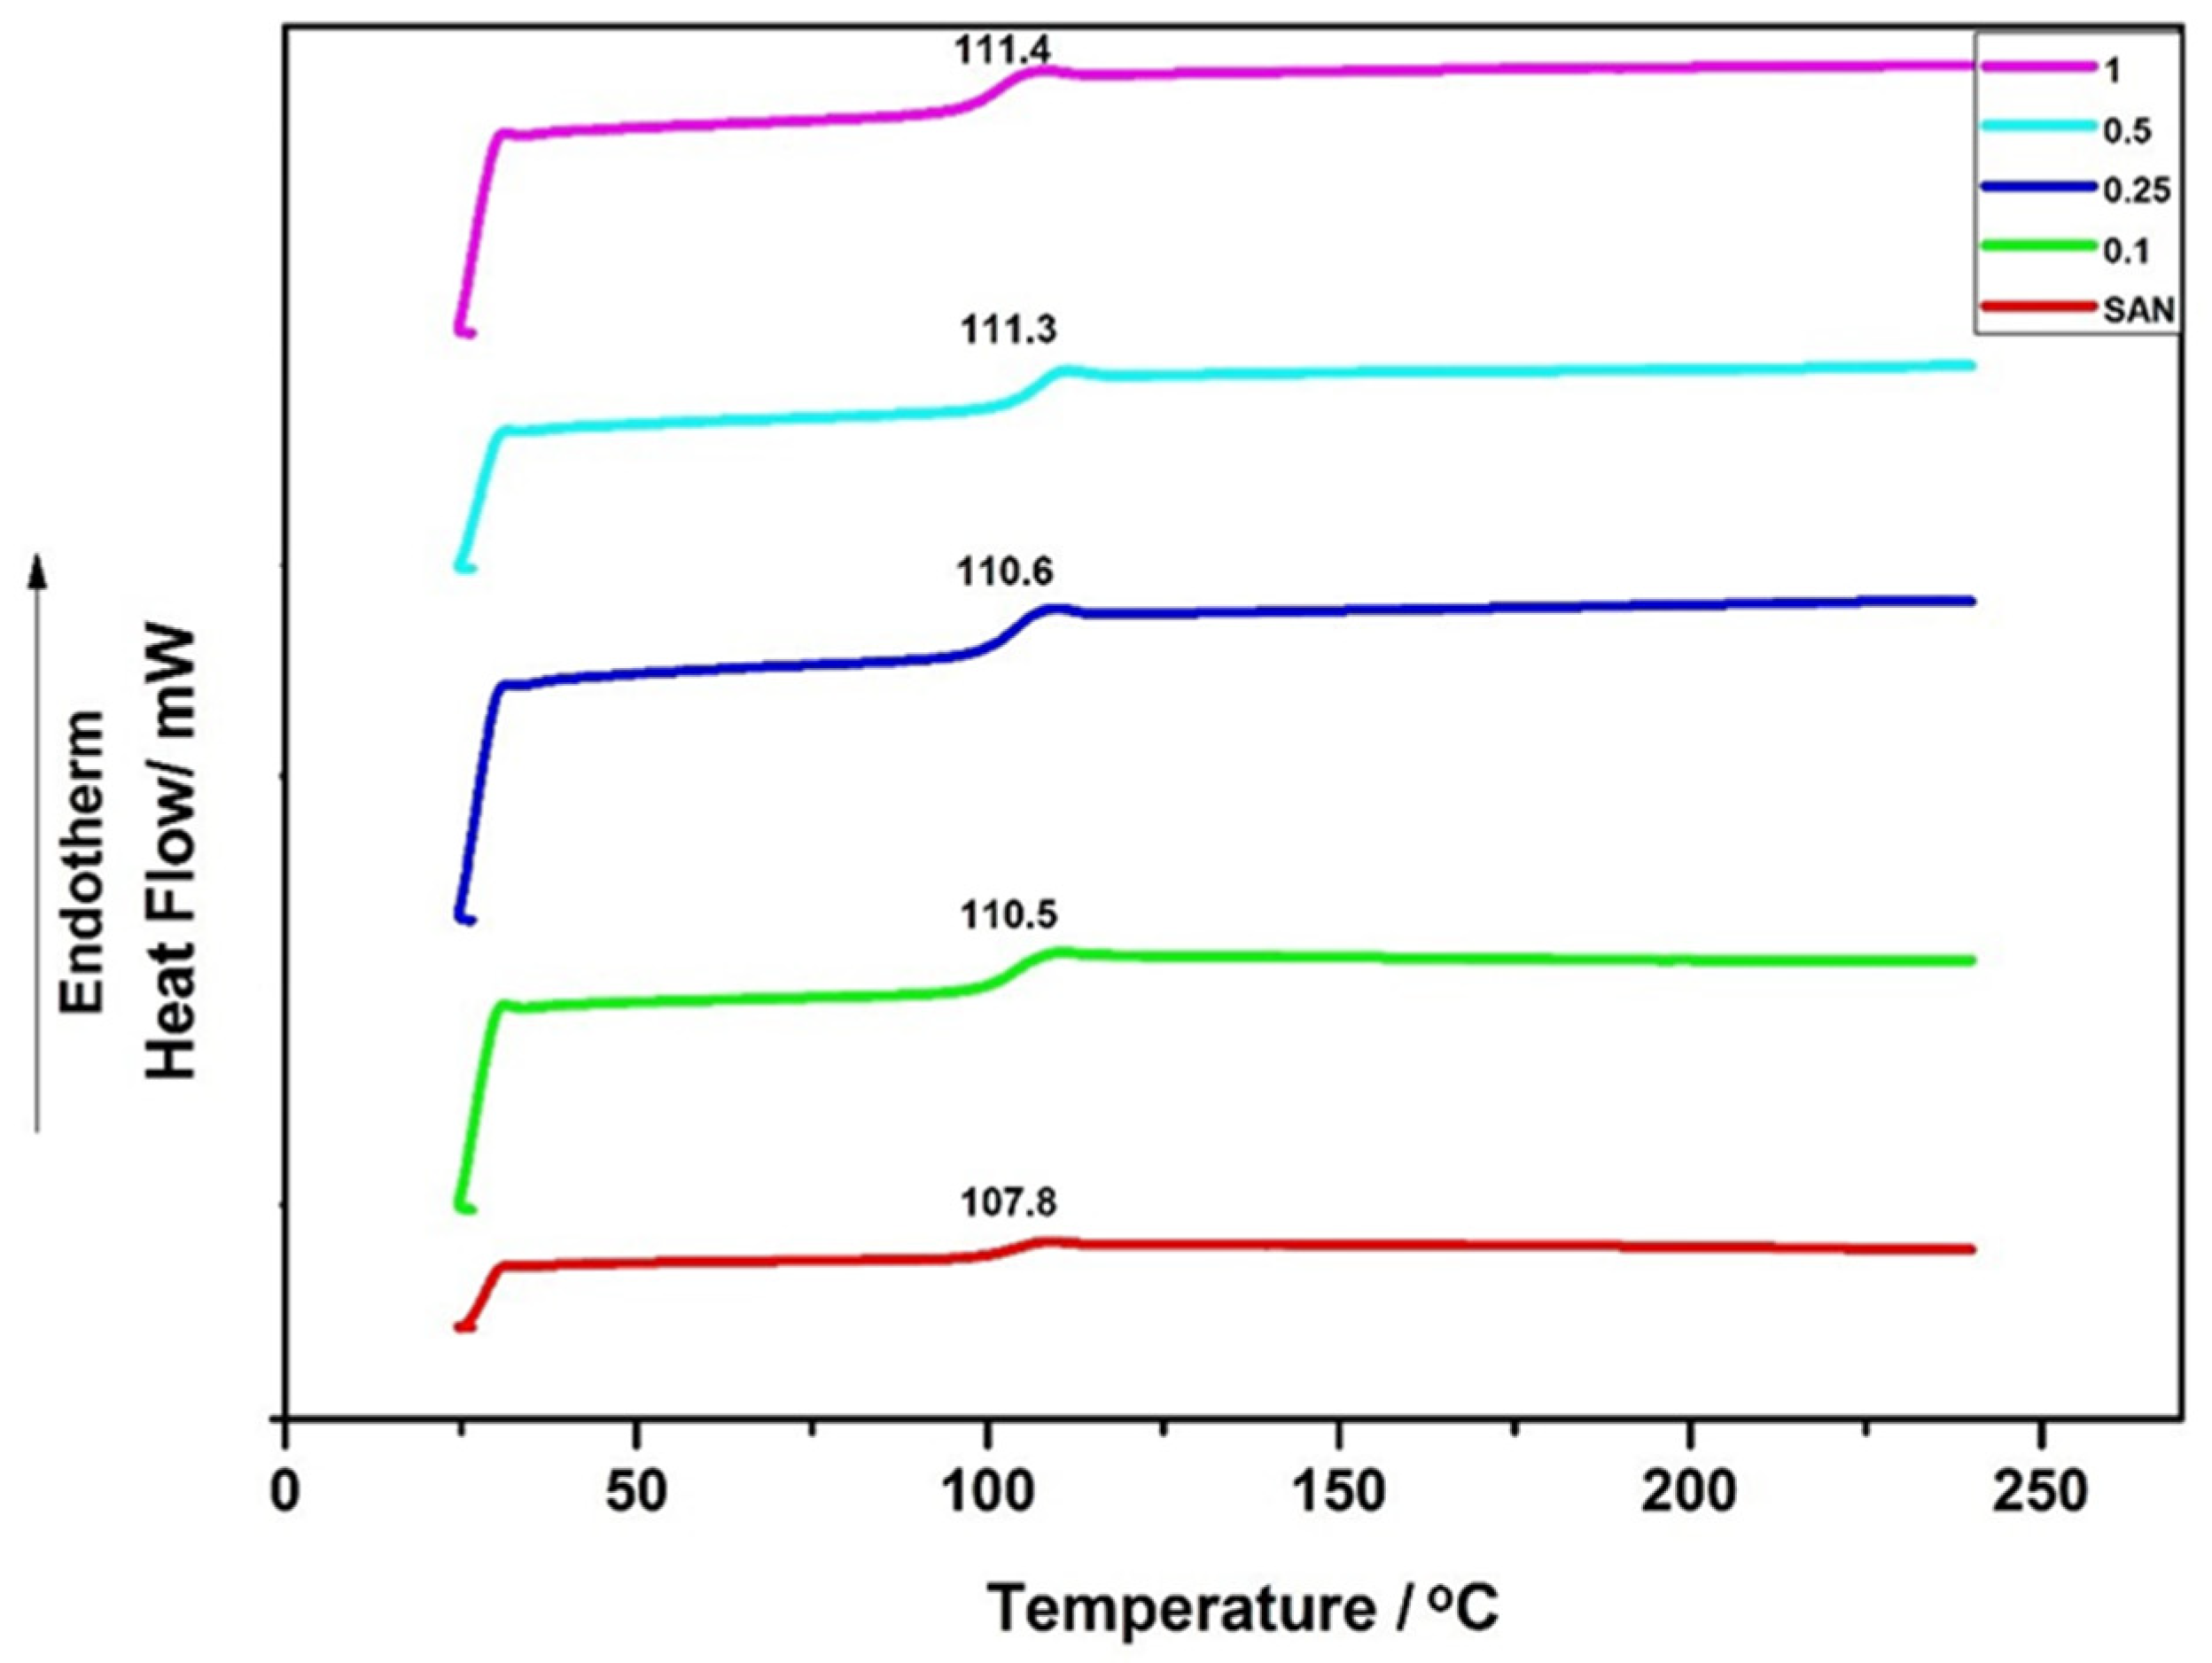
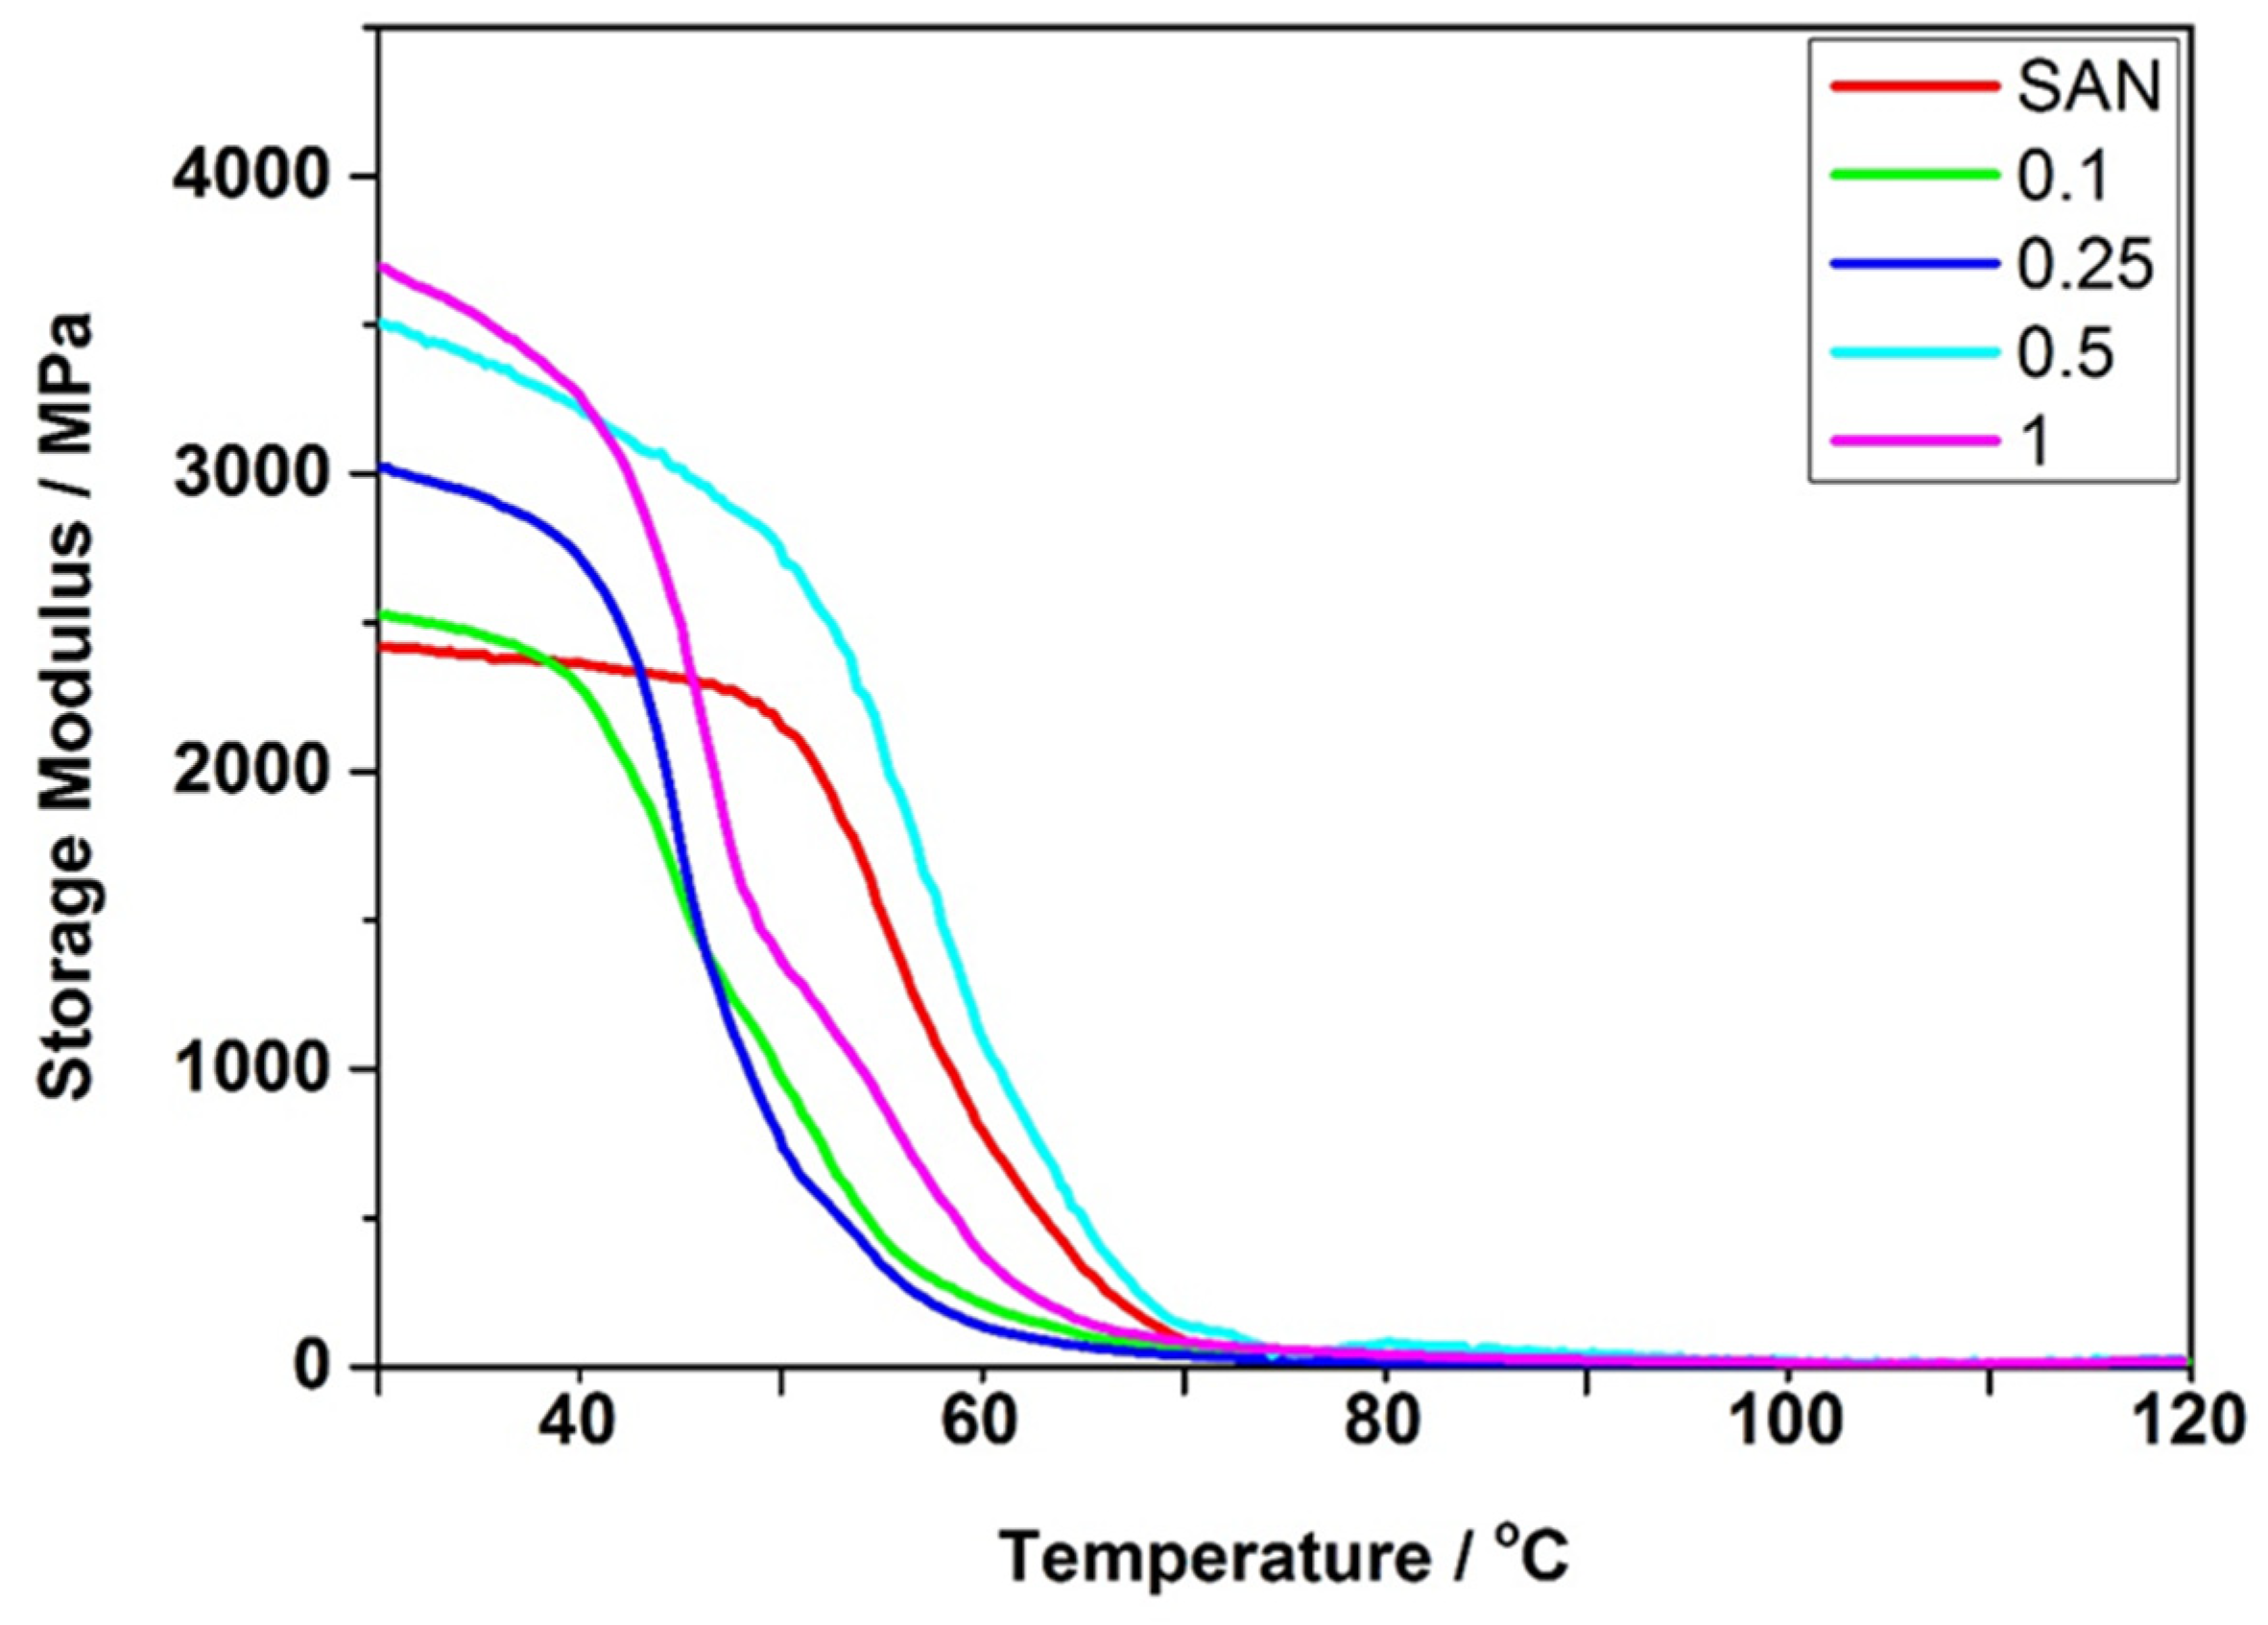
3.2. Thermo-Mechanical Properties

Figure 4 shows the Tg of SAN and its nanocomposites with different loadings of GO, which were obtained by DSC, and was determined from the midpoint of the step change in the specific heat of each sample. The Tg for neat SAN was 107.8 °C. A similar Tg of 107.6 °C of neat SAN was reported previously in the literature [29]. The Tg for SAN as a copolymer was found to be higher than that of homopolymer polystyrene due to interchain attraction, chain stiffness, and the presence of polar groups of nitriles [30].
The Tg of SAN became higher with an increasing weight fraction of GO, with Tg = 111.4 °C for the nanocomposite of 1.0 wt.% GO. This is similar to the finding reported in the literature [20] that showed that Tg was higher as the weight fraction of clay nanoparticles increased compared with the value of neat SAN, and this was attributed to the restricted movement of the confined polymer chains in the clay gallery. Here, the increased Tg of the SAN/GO nanocomposites implies that the motion of polymer segments was effectively limited by the GO nano-sheets, which is likely due to a good dispersion of GO in the polymer matrix and their strong interactions.
Figure 5 shows the TGA curves of GO, SAN, and their nanocomposites with different loadings of GO to investigate their thermal degradation temperatures and weight losses during heating. For the GO curve, it shows 4.0–5.0% weight loss at room temperature (25 °C), which is ascribed to the effect of buoyancy as the setting of the experiment included 5 minutes’ isotherm for purging gas purposes before starting the gradual increment of the temperature. A weight loss can be noticed below 100 °C, which is ascribed to the removal of adsorbed water. The emission of CO and CO2 gases can be observed at around 225 °C due to the removal of the main oxygenated functional groups from GO, which is approximately 30% of the dry GO weight. The subsequent weight loss up to 700 °C can be attributed to the further removal of oxygenated functional groups from the GO nano-sheets [19,30]. This behavior is in line with what was reported by other researchers [31].
The thermal degradation of neat SAN occurred in the range of approximately 350–500 °C due to the main chain pyrolysis and emission of acrylonitrile [12]. The onset thermal degradation temperature (Tdonset) of the neat SAN was 375 °C. The thermal degradation temperature at the maximum degradation rate, Tdmax, for the neat SAN was 413 °C (according to the inset of Figure 5), which compares well with the result reported in the literature [32].
For SAN/GO nanocomposites, it can be seen that there are several stages of weight loss that correspond to the degradation of the reinforcing agent GO followed by structural degradation of the polymer matrix [22,33]. Here, the addition of GO nano-sheets to SAN actually led to a significant improvement in thermal stability. The Tdonset of SAN increased to 396, 398, 400, and 405 °C for the 0.1, 0.25, 0.5, and 1.0 wt.% nanocomposites, respectively. Similarly, the Tdmax of SAN also shifted to a higher temperature in the nanocomposite with an increasing GO content in general. The higher values of thermal degradation temperatures for the nanocomposites compared with the virgin polymer again suggest a good dispersion and strong interfacial interaction of GO nano-sheets with the matrix.
At the end of TGA, the char residue is another indication of the thermal performance or flame retardance of the nanocomposites [32]. It is noted that the char residue for the nanocomposites was slightly higher than the value for the neat polymer after heating to 700 °C, and it increased with increasing GO content. A possible explanation is that the presence of GO in the polymer matrix promotes carbonization on the surface of the polymer. In addition, the unburned filler and the high heat resistance exerted by the filler itself may have also contributed to the higher residue [25]. Table 1 summarizes the Tdonset, Tdmax, and char yield from TGA, along with Tg values from DSC.
Figure 6 shows the storage modulus versus temperature curves for SAN and SAN with 0.1–1.0 wt.% GO nanocomposites from DMA. With increasing temperature, the materials show glassy glass-rubber transition and rubbery states. The storage module indicates the ability of the material to store energy elastically. The storage modulus for SAN at 30 °C (in the glassy state) was 2.44 GPa, which is close to that reported in the literature [11].
The storage modulus for SAN/GO nanocomposites at 30 °C was significantly increased compared with the neat polymer, being 2.58, 3.13, 3.65, and 3.90 GPa for 0.1, 0.25, 0.5, and 1.0 wt.% GO, respectively (Table 1). This is attributable to the high modulus, the high aspect ratio, and the large specific surface area of GO nano-sheets. Considerable improvements in the storage modulus were also reported for the SAN reinforced with SRGO, increasing from 2.6 GPa for the neat polymer to 3.4 and 3.6 GPa for the nanocomposites with 0.5 and 1.0 wt.% SRGO, respectively [12]. An improvement of 44% in the storage modulus was found for the SAN reinforced with 5.0 wt.% clay nano-sheets at 30 °C compared to the neat SAN (from 1.4 GPa to 3.3 GPa) due to the incomplete relaxation caused by the physical networks of clay [32]. The improvements obtained by adding GO to SAN in this work are more significant than those achieved from the above two previous studies. This was achieved presumably due to the higher compatibility [34] of SAN with GO, due to its oxygenated functional groups when compared to SRGO, and higher modulus when compared to clay.

4. Conclusions

The aim of the present work was to investigate the effect of different loadings of GO (0.1, 0.25, 0.5, and 1.0 wt.%) on the structure, thermal, and thermo-mechanical properties of SAN/GO nanocomposites compared to the neat SAN. The FTIR findings confirmed the presence of various oxygenated functional groups in the structure of GO nano-sheets and the main characteristic peaks of SAN in both SAN and SAN/GO nanocomposites. The GO peaks were absent in the XRD traces, due to either low contents or a good dispersion of the GO nano-sheets in the polymer matrix. Improvements were achieved in the thermal and thermo-mechanical properties, namely, Tg, Td, and storage modulus, for the nanocomposites compared to the neat polymer. Tg, Tdonset, and Tdmax of the SAN were found to enhance by up to 3.6, 30, and 19 °C, respectively, for 1.0 wt.% GO nanocomposite, while its storage modulus increased by up to 62%. The results may be attributed to possible interfacial interactions between SAN and GO, as well as a good dispersion of the GO nano-sheets in the polymer matrix. It is expected that these SAN/GO nanocomposites could find potential applications such as sporting goods, as well as hoses for irrigation and fire extinguishing.

Author Contributions

Z.G.M.: conceptualization, methodology, conducting experiments, obtaining and analyzing data, writing the original draft of the manuscript, and editing; B.C.: conceptualization, methodology, supervision, resources, writing, reviewing, and editing; B.J.I.: supervision, reviewing, and editing. All authors have read and agreed to the published version of the manuscript.

Funding

This research was funded by the Iraqi Cultural Attaché, London, which is the official representative of Ministry of Higher Education and Scientific Research MOHESR in Iraq.

Data Availability Statement

The data supporting reported results are available from the corresponding author upon reasonable request.

Acknowledgments

Z.G.M. would like to acknowledge his employer in Iraq “Ministry of Higher Education and Scientific Research” as well as his institution the “University of Technology-Iraq” for facilitating the mission associated with the accomplishment of this work.

Conflicts of Interest

The authors declare no conflict of interest.

References

  1. Ishida, H.; Campbell, S.; Blackwell, J. General Approach to Nanocomposite Preparation. Chem. Mater. 2000, 12, 1260–1267. [Google Scholar] [CrossRef]
  2. Suherman, H.; Dweiri, R.; Sulong, A.B.; Zakaria, M.Y.; Mahyoedin, Y. Improvement of the Electrical-Mechanical Performance of Epoxy/Graphite Composites Based on the Effects of Particle Size and Curing Conditions. Polymers 2022, 14, 502. [Google Scholar] [CrossRef] [PubMed]
  3. Geim, A.K.; Novoselov, K.S. The rise of graphene. Nat. Mater. 2007, 6, 183–191. [Google Scholar] [CrossRef] [PubMed]
  4. Gao, C.; Zhang, S.; Wang, F.; Wen, B.; Han, C.; Ding, Y.; Yang, M. Graphene networks with low percolation threshold in ABS nanocomposites: Selective localization and electrical and rheological properties. ACS Appl. Mater. Interfaces 2014, 6, 12252–12260. [Google Scholar] [CrossRef]
  5. Hsia, T.; Wan, J.; Fan, B.; Thang, S.H. Bifunctional RAFT Agent Directed Preparation of Polymer/Graphene Oxide Composites. Macromol. Rapid Commun. 2021, 42, 2100460. [Google Scholar] [CrossRef]
  6. Tabasi, A.; Noorbakhsh, A.; Sharifi, E. Reduced graphene oxide-chitosan-aptamer interface as new platform for ultrasensitive detection of human epidermal growth factor receptor 2. Biosens. Bioelectron. 2017, 95, 117–123. [Google Scholar] [CrossRef]
  7. Maheshkumar, K.V.; Krishnamurthy, K.; Sathishkumar, P.; Sahoo, S.; Uddin, E.; Pal, S.K.; Rajasekar, R. Research updates on Graphene oxide based polymeric nanocomposites. Polym. Compos. 2014, 35, 2297–2310. [Google Scholar] [CrossRef]
  8. Wen, P.; Chen, Y.; Hu, X.; Cheng, B.; Liu, D.; Zhang, Y.; Nair, S. Polyamide thin film composite Nano filtration membrane modified with acyl chlorided graphene oxide. J. Membr. Sci. 2017, 535, 208–220. [Google Scholar] [CrossRef]
  9. Cao, N.; Lyu, Q.; Li, J.; Wang, Y.; Yang, B.; Szunerits, S.; Boukherroub, R. Facile synthesis of fluorinated polydopamine/chitosan/reduced graphene oxide composite aerogel for efficient oil/water separation. Chem. Eng. J. 2017, 326, 17–28. [Google Scholar] [CrossRef]
  10. Panwar, V.; Gill, F.S.; Rathi, V.; Tewari, V.K.; Mehra, R.M.; Park, J.; Park, S. Fabrication of conducting composite sheets using cost-effective graphite flakes and amorphous styrene acrylonitrile for enhanced thermistor, dielectric, and electromagnetic interference shielding properties. Mater. Chem. Phys. 2017, 193, 329–338. [Google Scholar] [CrossRef]
  11. Singh, R.; Barman, P.B.; Sharma, D. Enhanced thermal properties of highly monodispersed ZnO nanoparticle/poly(styrene-co-acrylonitrile) nanocomposite. J. Polym. Sci. B 2016, 58, 439–448. [Google Scholar] [CrossRef]
  12. Vu, T.; Pham, V.H.; Hur, S.H.; Chung, J.S. Effect of reduced graphene oxide functionalization by sulfanilic acid on the mechanical properties of poly(styrene-co-acrylonitrile)/reduced graphene oxide composites. Polym. Compos. 2016, 37, 44–50. [Google Scholar] [CrossRef]
  13. Wang, C.; Xue, T.; Dong, B.; Wang, Z.; Li, H. Polystyrene-acrylonitrile-CNTs nanocomposites preparations and tribological behavior research. Wear 2008, 265, 1923–1926. [Google Scholar] [CrossRef]
  14. Mainil, M.; Urbanczyk, L.; Calberg, C.; Germain, A.; Jerome, C.; Bourbigot, S.; Devaux, J.; Sclavons, M. Morphology and properties of SAN-clay nanocomposites prepared principally by water-assisted extrusion. Polym. Eng. Sci. 2010, 50, 10–21. [Google Scholar] [CrossRef]
  15. Marcano, D.C.; Kosynkin, D.V.; Berlin, J.M.; Sinitskii, A.; Sun, Z.; Slesarev, A.; Alemany, L.B.; Lu, W.; Tour, J.M. Improved Synthesis of Graphene Oxide. ACS Nano 2010, 4, 4806–4814. [Google Scholar] [CrossRef]
  16. Mohammadsalih, Z.G.; Inkson, B.J.; Chen, B. The effect of dispersion condition on the structure and properties of polystyrene/graphene oxide nanocomposites. Polym. Compos. 2021, 42, 320–328. [Google Scholar] [CrossRef]
  17. Wan, C.; Chen, B. Reinforcement and interface of polymer/graphene oxide nanocomposites. J. Mater. Chem. 2012, 22, 3637–3647. [Google Scholar] [CrossRef]
  18. Heo, C.; Moon, H.; Yoon, C.S.; Chang, J. ABS nanocomposite films based on functionalized graphene sheets. J. Appl. Polym. Sci. 2012, 124, 4663–4670. [Google Scholar] [CrossRef]
  19. Liu, Y.; Zhang, Y.; Duan, L.; Zhang, W.; Su, M.; Sun, Z.; He, P. Polystyrene/graphene oxide nanocomposites synthesized via Pickering polymerization. Prog. Org. Coat. 2016, 99, 23–31. [Google Scholar] [CrossRef]
  20. Qiu, F.; Hao, Y.; Li, X.; Wang, B.; Wang, M. Functionalized graphene sheets filled isotactic polypropylene nanocomposites. Compos. Part B 2015, 71, 175–183. [Google Scholar] [CrossRef]
  21. Sanchez, J.; Maties, G.; Arellano, C.; Pascual, A. Synthesis and characterization of graphene oxide derivatives via functionalization reaction with hexamethylene diisocyanate. Nanomaterials 2019, 8, 870. [Google Scholar] [CrossRef] [PubMed]
  22. Wang, H.; Chang, K.; Chu, H. Effect of clay on the properties of poly (styrene-co-acrylonitrile)-clay nanocomposites. Polym. Int. 2005, 54, 114–119. [Google Scholar] [CrossRef]
  23. Jang, B.N.; Wilkie, C.A. The effects of clay on the thermal degradation behavior of poly (styrene-co-acrylonitrile). Polymer 2005, 46, 9702–9713. [Google Scholar] [CrossRef]
  24. Panwar, V.; Mehra, R.M. Study of electrical and dielectric properties of styrene-acrylonitrile/graphite sheets composites. Eur. Polym. J. 2008, 44, 2367–2375. [Google Scholar] [CrossRef]
  25. Han, Y.; Wu, Y.; Shen, M.; Huang, X.; Zhu, J.; Zhang, X. Preparation and properties of polystyrene nanocomposites with graphite oxide and graphene as flame retardants. J. Mater. Sci. 2013, 48, 4214–4222. [Google Scholar] [CrossRef]
  26. Malas, A.; Das, C.K. Effect of graphene oxide on the physical, mechanical, and thermo-mechanical properties of neoprene and chlorosulfonated polyethylene vulcanizates. Compos. Part B 2015, 79, 639–648. [Google Scholar] [CrossRef]
  27. Mohammadsalih, Z.G.; Sadeq, N.S. Structure and properties of polystyrene graphene oxide nanocomposites. Fuller. Nanotub. Carbon Nanostruct. 2022, 30, 373–384. [Google Scholar] [CrossRef]
  28. Arsac, A.; Zerroukhi, A.; Ainser, A.; Carrot, C. Rheological characterization of styrene acrylonitrile copolymers. J. Appl. Polym. Sci. 2000, 77, 1316–1321. [Google Scholar] [CrossRef]
  29. Hamta, A.; Ashtiani, F.Z.; Karimi, M.; Moayedfard, S. Asymmetric block copolymer membrane fabrication mechanism through self-assembly and non-solvent induced phase separation (SNIPS) process. Sci. Rep. 2022, 12, 771. [Google Scholar] [CrossRef]
  30. Tang, Z.; Zhang, L.; Zeng, C.; Lina, T.; Guo, B. General route to graphene with liquid-like behavior by non-covalent modification. Soft Matter 2012, 8, 9214–9220. [Google Scholar] [CrossRef]
  31. Ko, E.B.; Lee, D.-E.; Yoon, K.-B. Electrically Conductive Nanocomposites Composed of Styrene–Acrylonitrile Copolymer and rGO via Free-Radical Polymerization. Polymers 2020, 12, 1221. [Google Scholar] [CrossRef]
  32. Cai, Y.; Hu, Y.; Xuan, S.; Zhang, Y.; Deng, H.; Gong, X.; Chen, Z.; Fan, W. Preparation and characterization of poly (styrene-acrylonitrile) (SAN)/clay Nanocomposites by melt intercalation. J. Mater. Sci. 2007, 42, 5524–5533. [Google Scholar] [CrossRef]
  33. Chu, L.; Anderson, S.K.; Harris, J.D.; Beach, M.W.; Morgan, A.B. Styrene-acrylonitrile (SAN) layered silicate nanocomposites prepared by melt compounding. Polymer 2004, 45, 4051–4061. [Google Scholar] [CrossRef]
  34. Jeddi, J.; Yousefzade, O.; Babaei, A.; Ghanbar, S.; Rostami, A. Morphology, microstructure and rheological properties of SAN (Styrene-acrylonitrile)/EPDM (ethylene-propylene-diene monomer) nanocomposites: Investigating the role of organoclay type and order of mixing. J. Mater. Chem. Phys. 2017, 187, 191–202. [Google Scholar] [CrossRef]
Figure 1. FTIR spectra of GO, SAN, and nanocomposites with 0.1–1.0 wt.% GO. The red dashed lines mark the main peaks of SAN.
Jcs 07 00225 g001
Figure 2. XRD patterns of GO, SAN, and SAN reinforced with 0.1–1.0 wt.% GO nanocomposites.
Jcs 07 00225 g002
Figure 3. SEM images of GO and cryogenically fractured surfaces of the neat polymer and nanocomposite: (a) GO, (b) SAN, and (c) SAN/GO 1.0 wt.%.
Jcs 07 00225 g003
Figure 4. Tg values obtained by DSC for SAN and SAN with 0.1–1.0 wt.% GO nanocomposites. The curves were shifted vertically for clarity.
Jcs 07 00225 g004
Figure 5. TGA and derivative thermogravimetric (inset) curves for GO, SAN, and SAN with 0.1–1.0 wt.% GO nanocomposites.
Jcs 07 00225 g005
Figure 6. Storage modulus of SAN and SAN with 0.1–1.0 wt.% GO nanocomposites as a function of temperature measured by DMA.
Jcs 07 00225 g006
Table 1. Thermal properties and storage modulus of GO, SAN, and their nanocomposites.
SampleTg/°CTdonset/°CTdmax/°CChar at 700 °C/wt.%Storage Modulus at 30 °C/GPa
GO-20422540-
SAN107.83754130.322.44
SAN/GO 0.1 wt.%110.53964260.602.58
SAN/GO 0.25 wt.%110.63984280.693.13
SAN/GO 0.5 wt.%111.34004251.173.65
SAN/GO 1.0 wt.%111.44054311.193.90
Disclaimer/Publisher’s Note: The statements, opinions and data contained in all publications are solely those of the individual author(s) and contributor(s) and not of MDPI and/or the editor(s). MDPI and/or the editor(s) disclaim responsibility for any injury to people or property resulting from any ideas, methods, instructions or products referred to in the content.

