
Flexural Behaviour of Foam Cored Sandwich Structures with Through-Thickness Reinforcements


Abstract
:1. Introduction
2. Materials and Methods
2.1. Materials
2.2. Test Methods
3. Finite Element Analysis
4. Results and Discussion
4.1. Experimental Results
4.2. Comparison with FEA
5. Conclusions
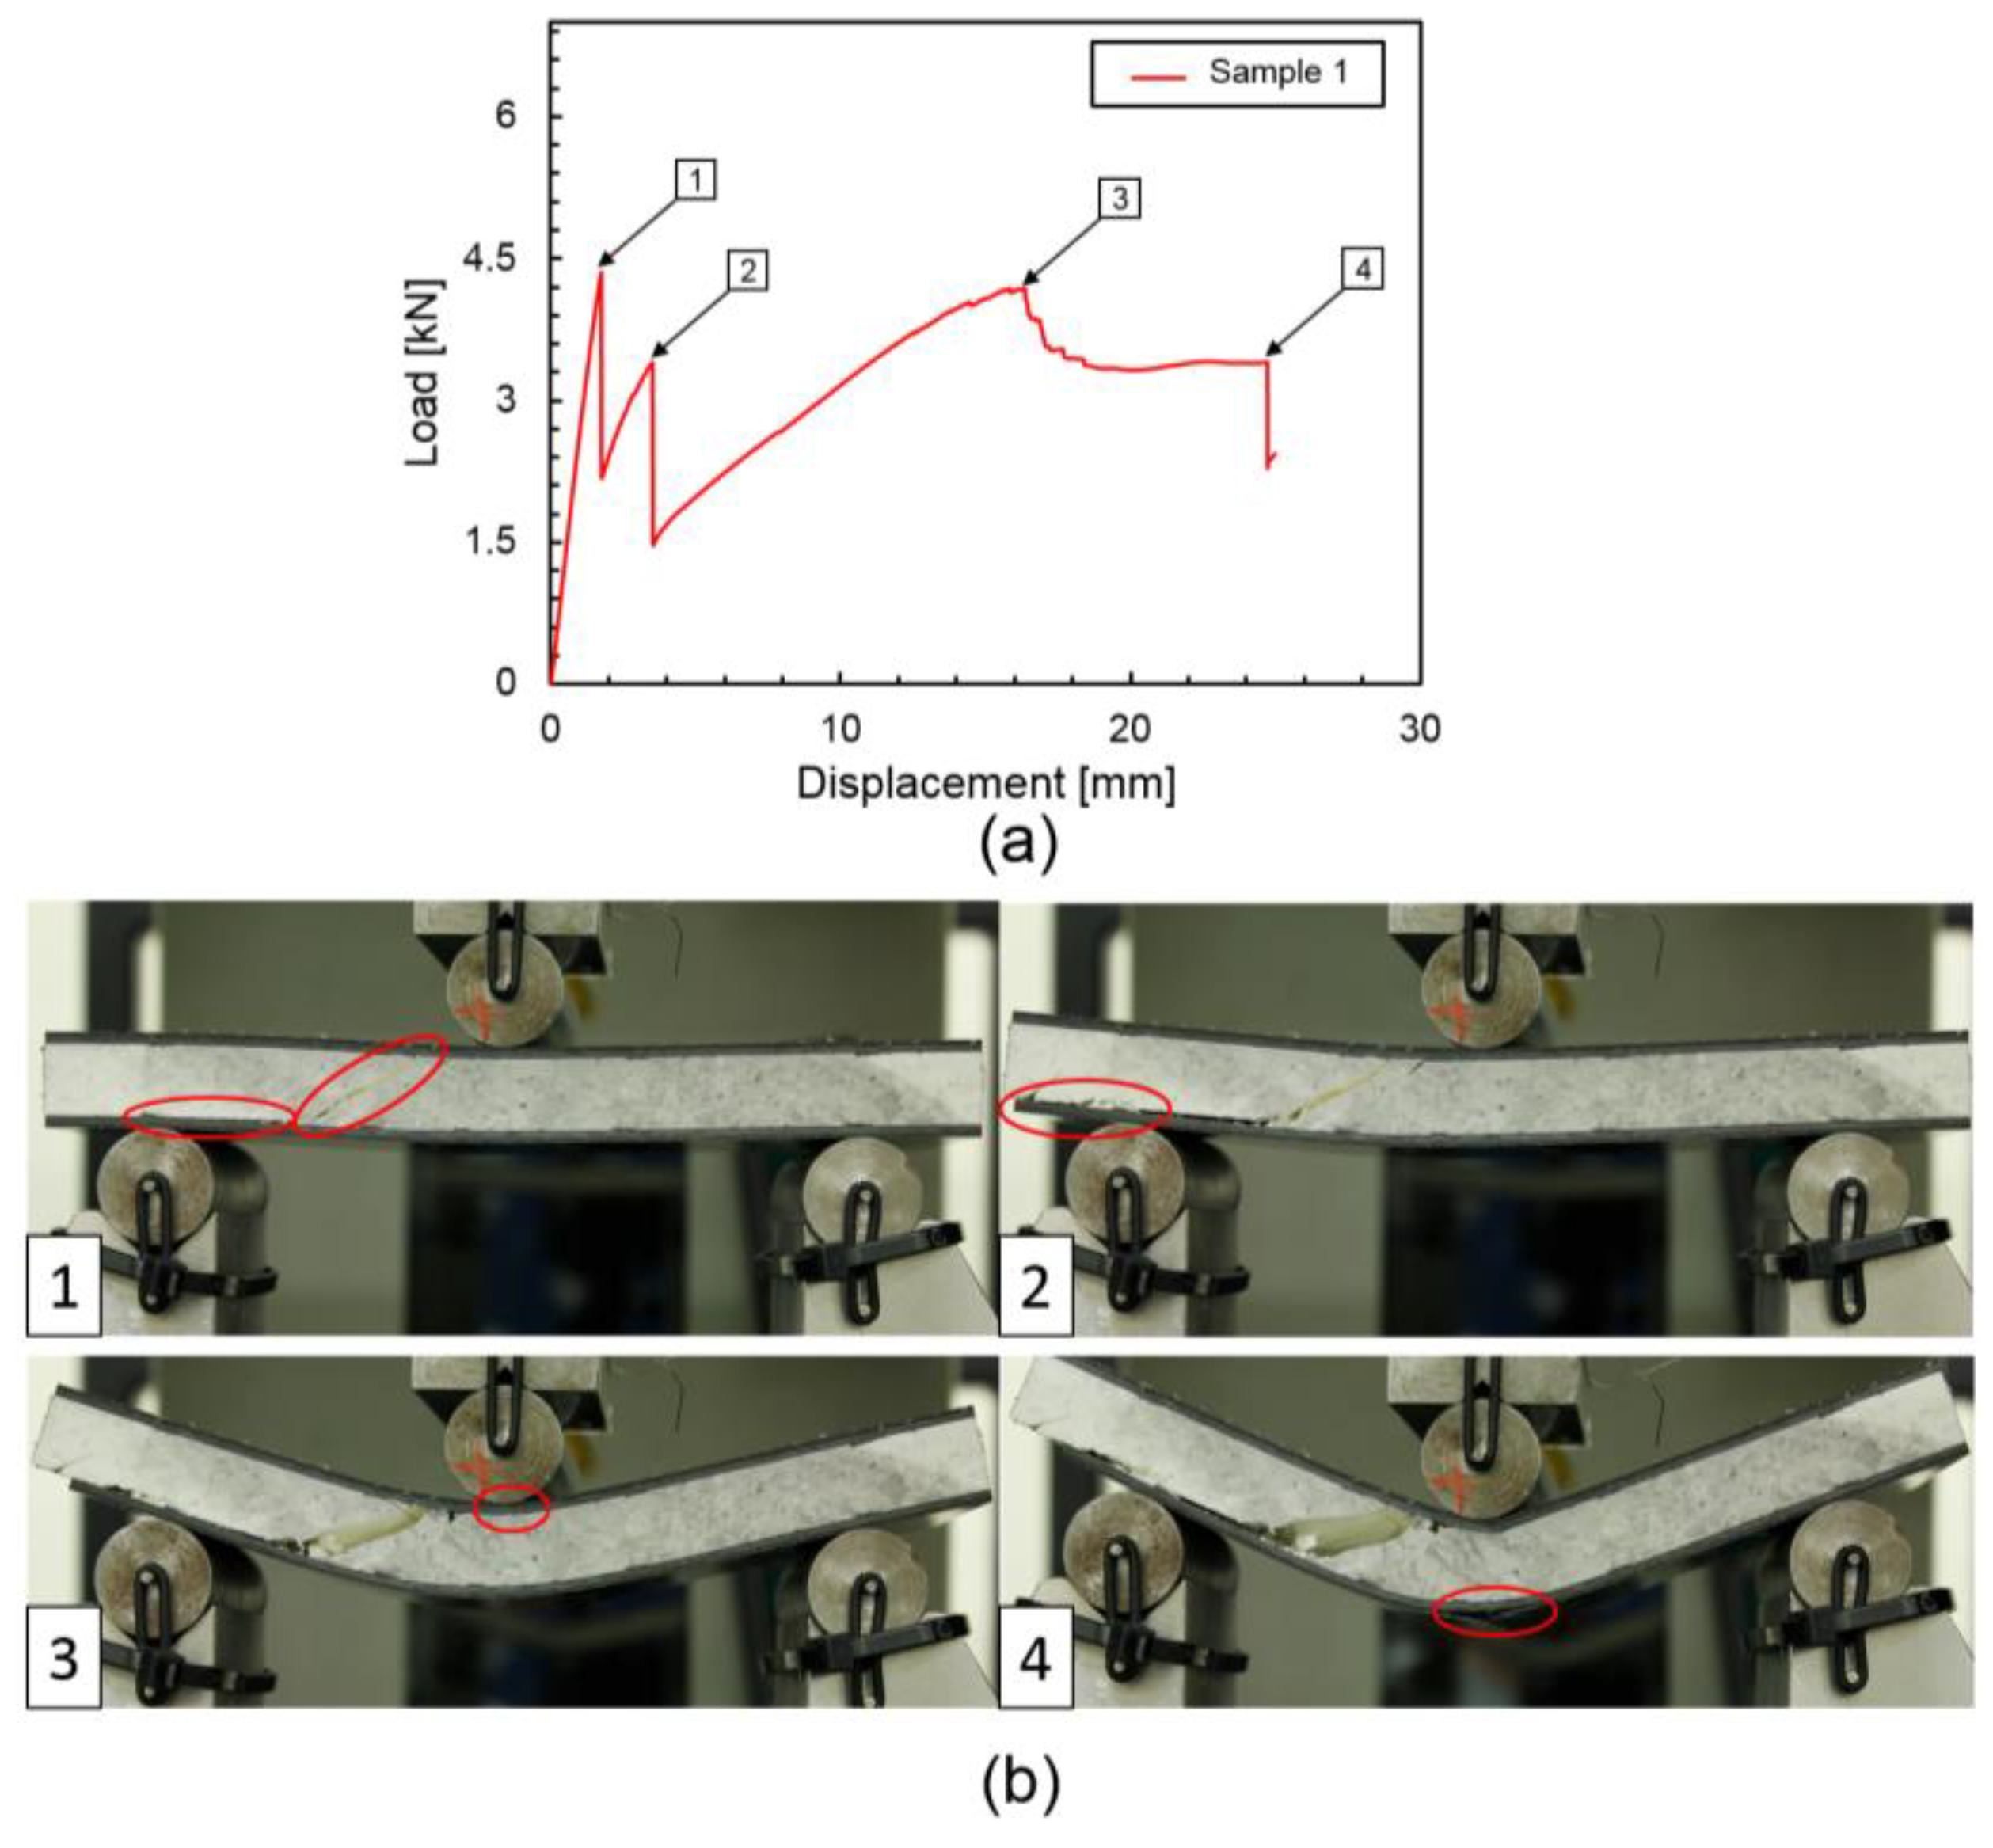
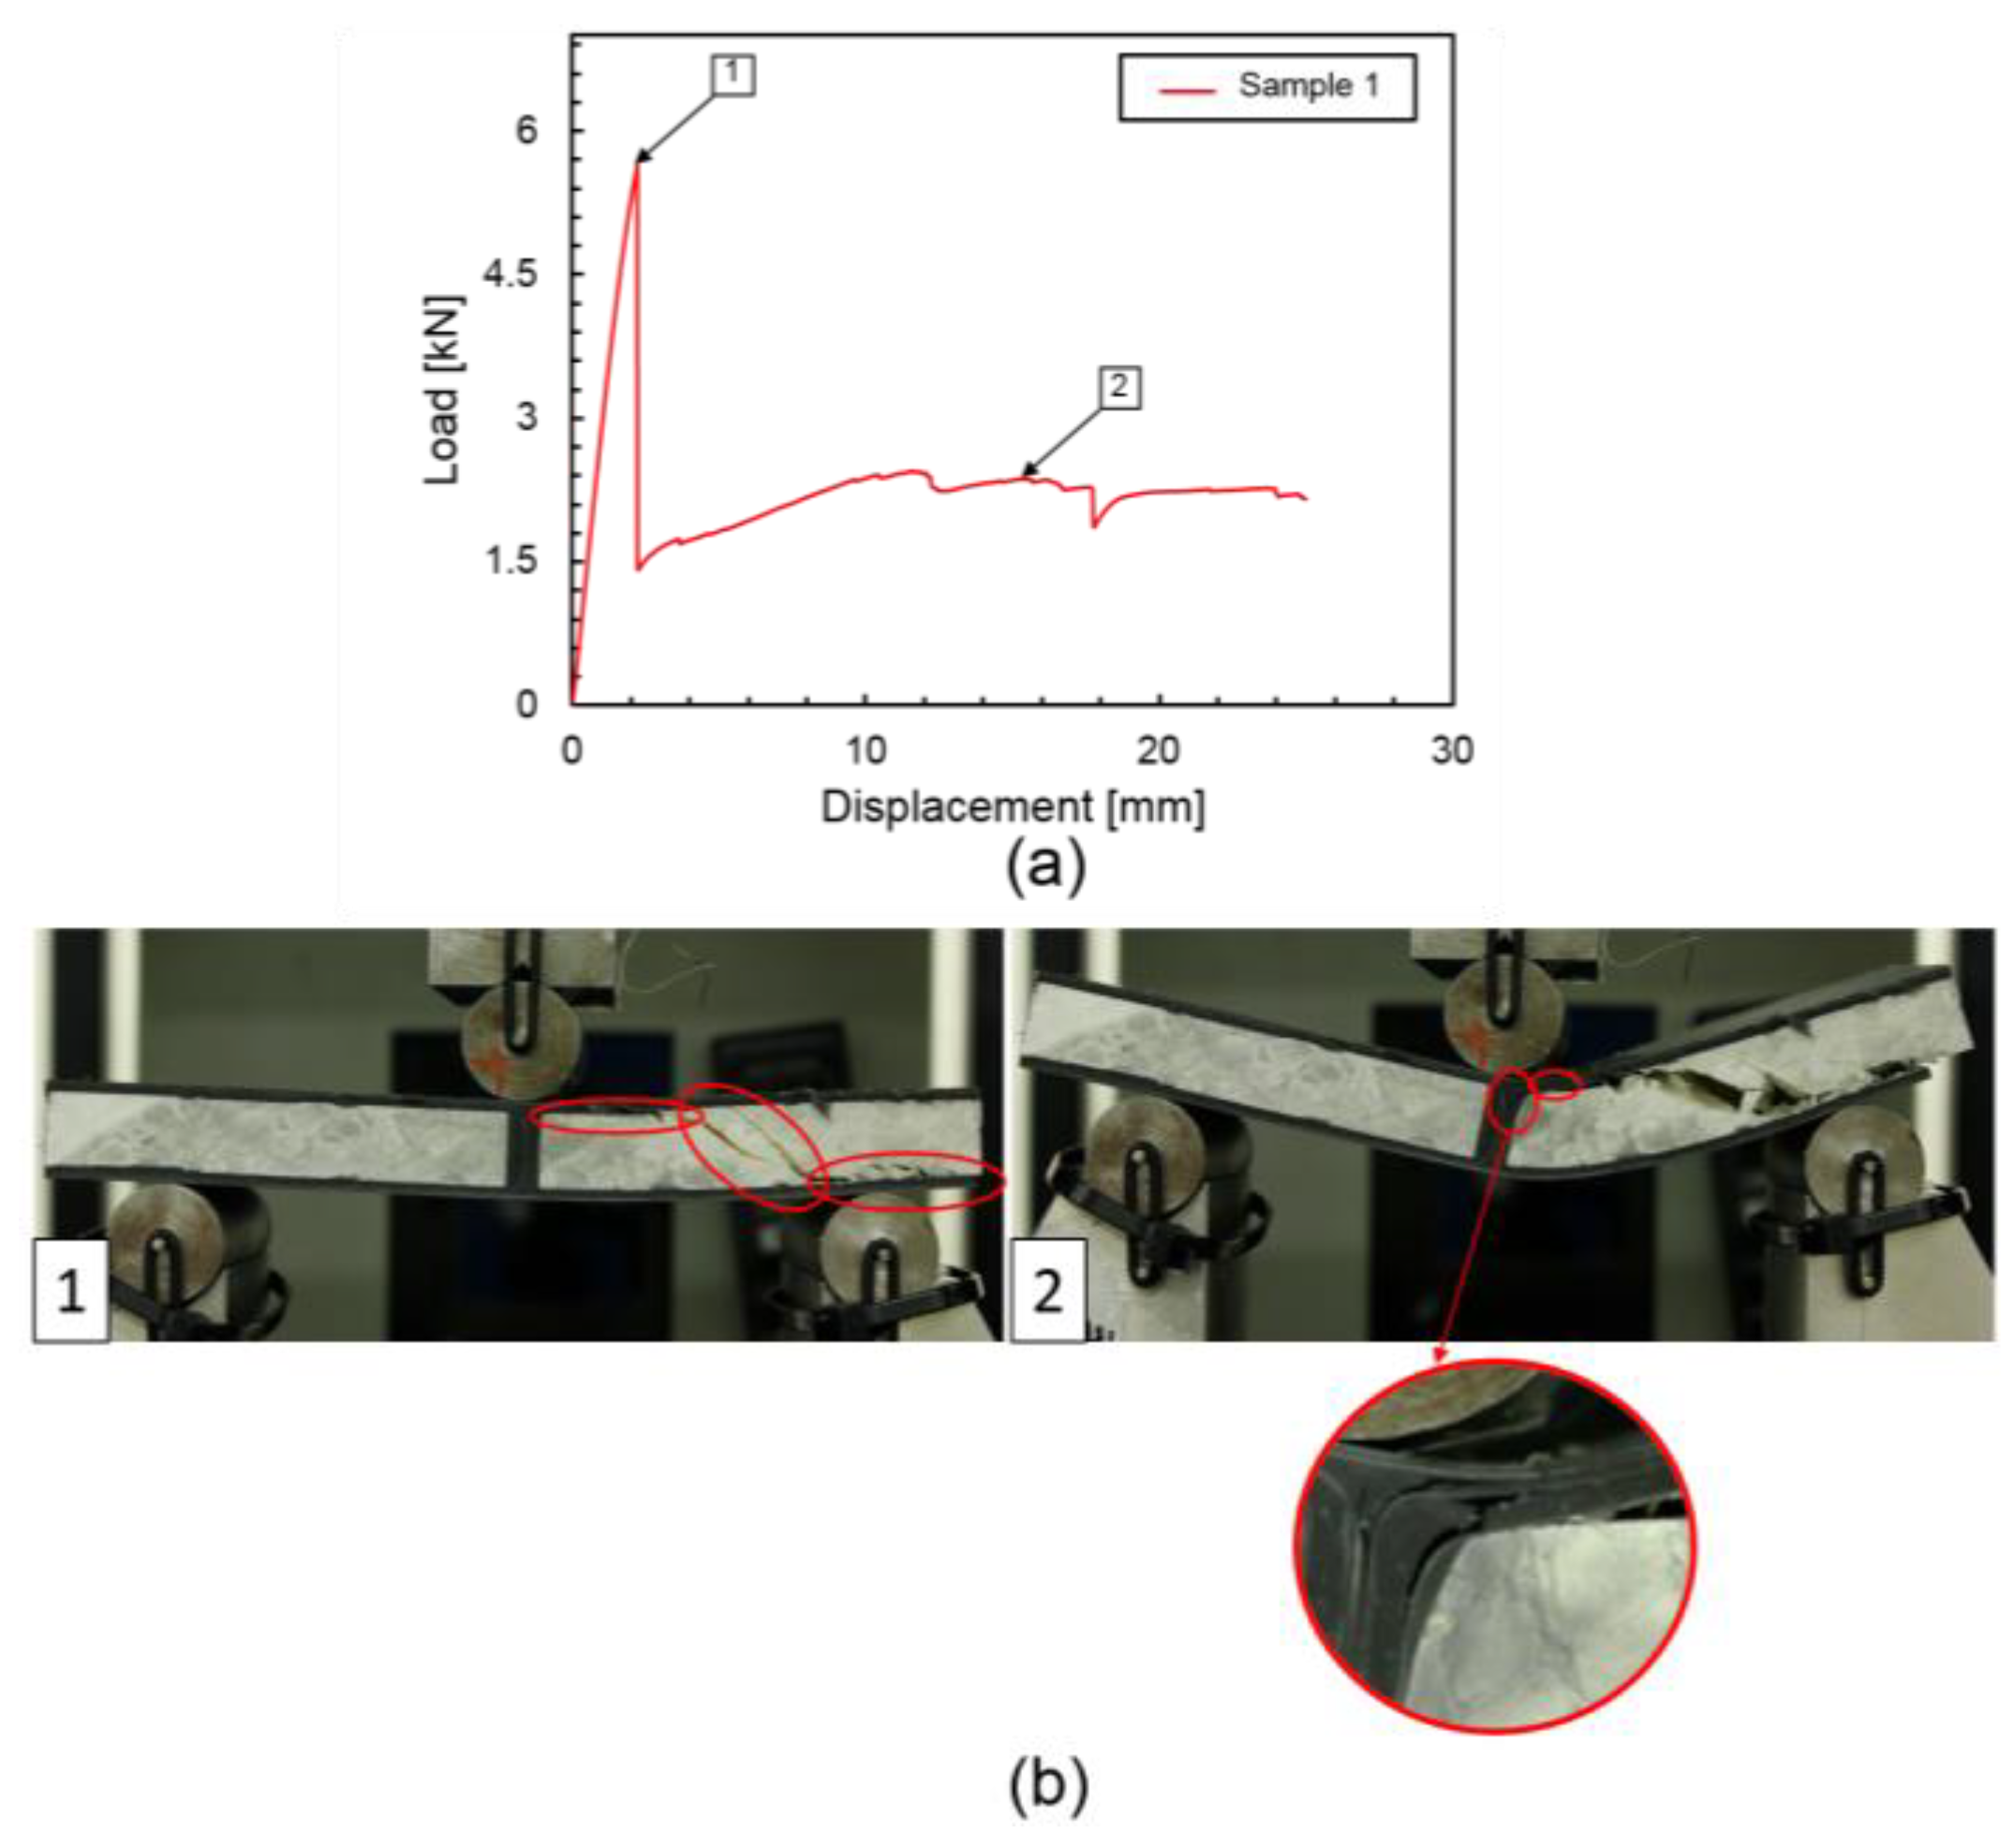
- Through-thickness rib-reinforcements can be a quick and easy solution for significant improvements to the sandwich structure response to load, readily implemented during the manufacturing of sandwich structures. If appropriately tailored, the through-thickness reinforcements have the ability to maximise the panel flexural performance, as well as stabilise and control the foam failure and skin–core debonding.
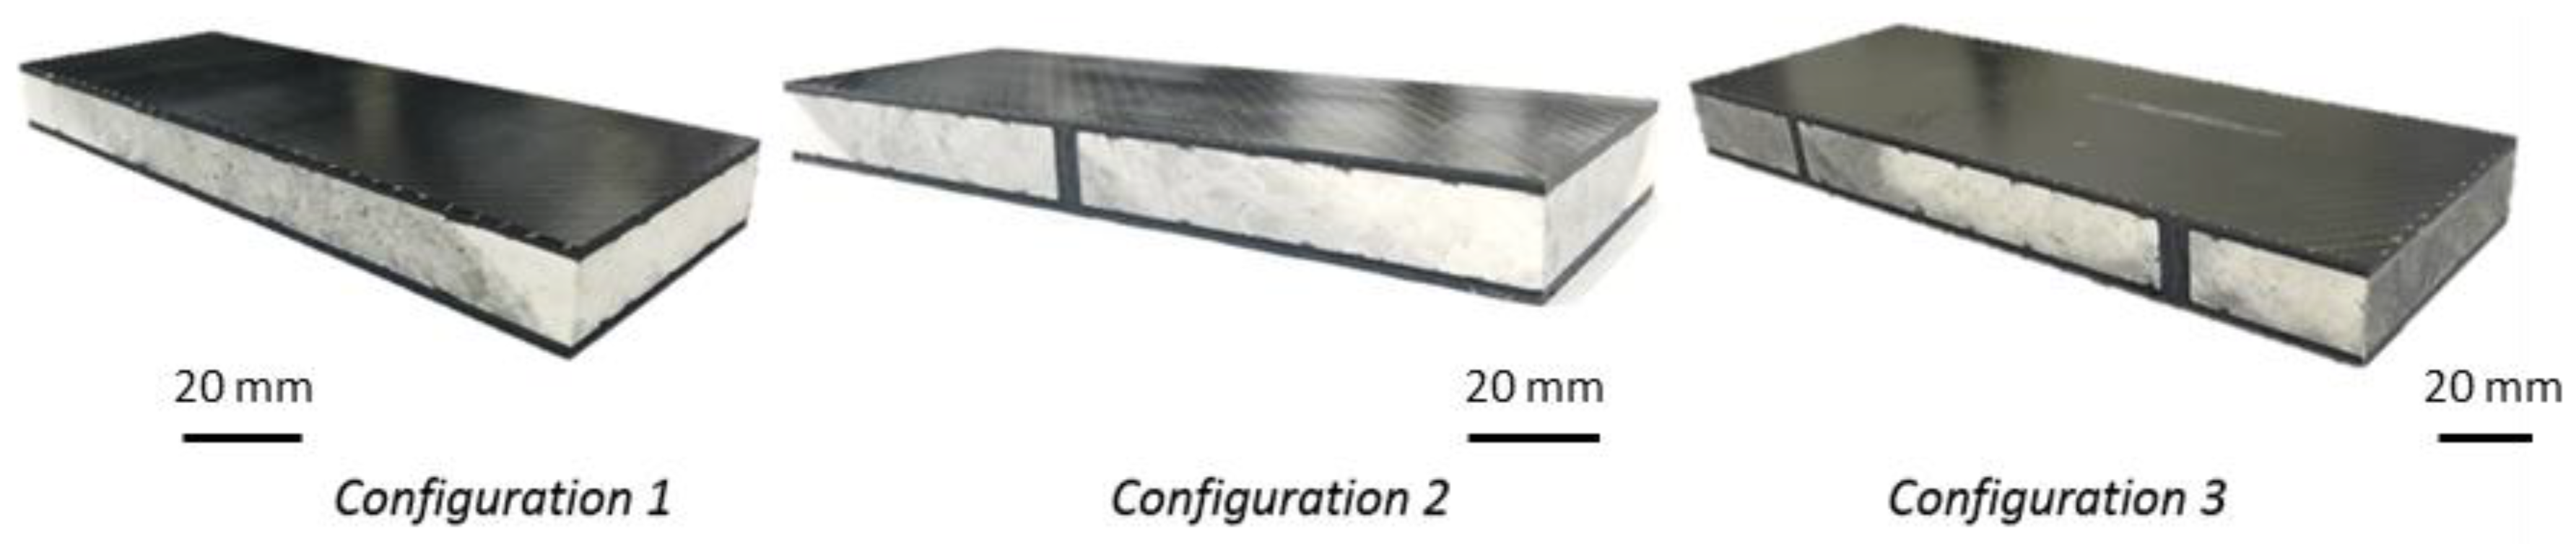
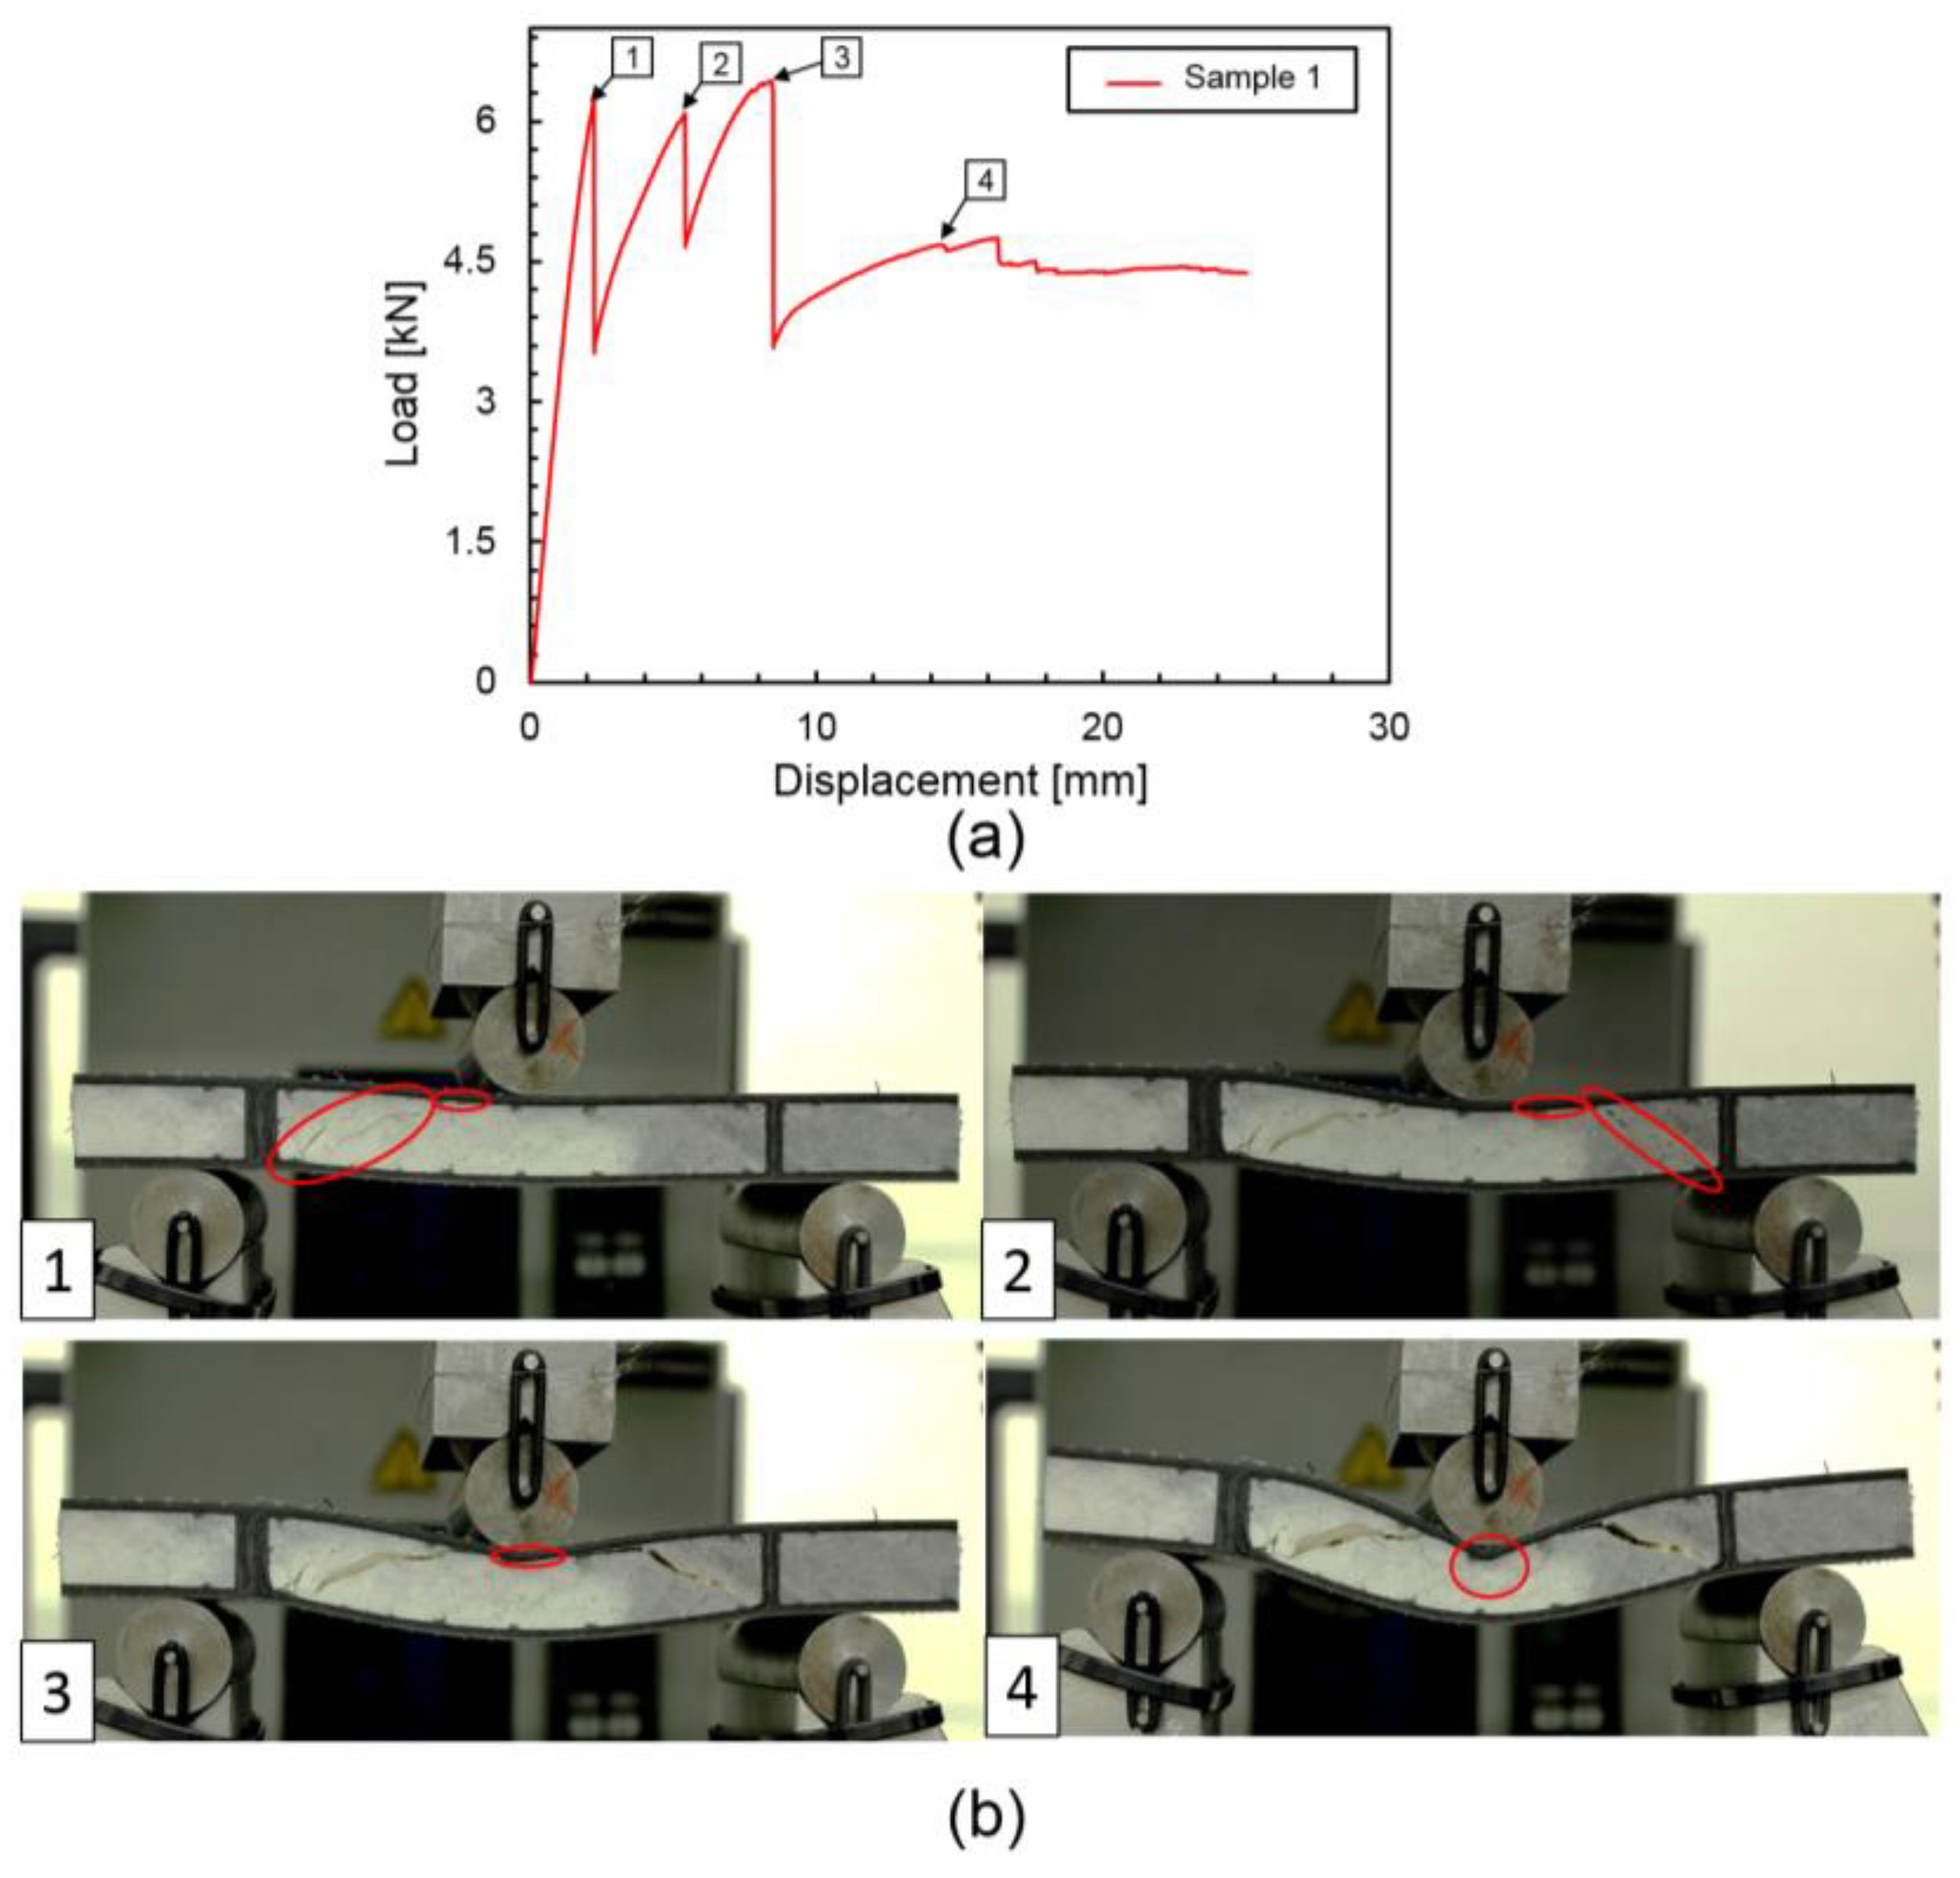
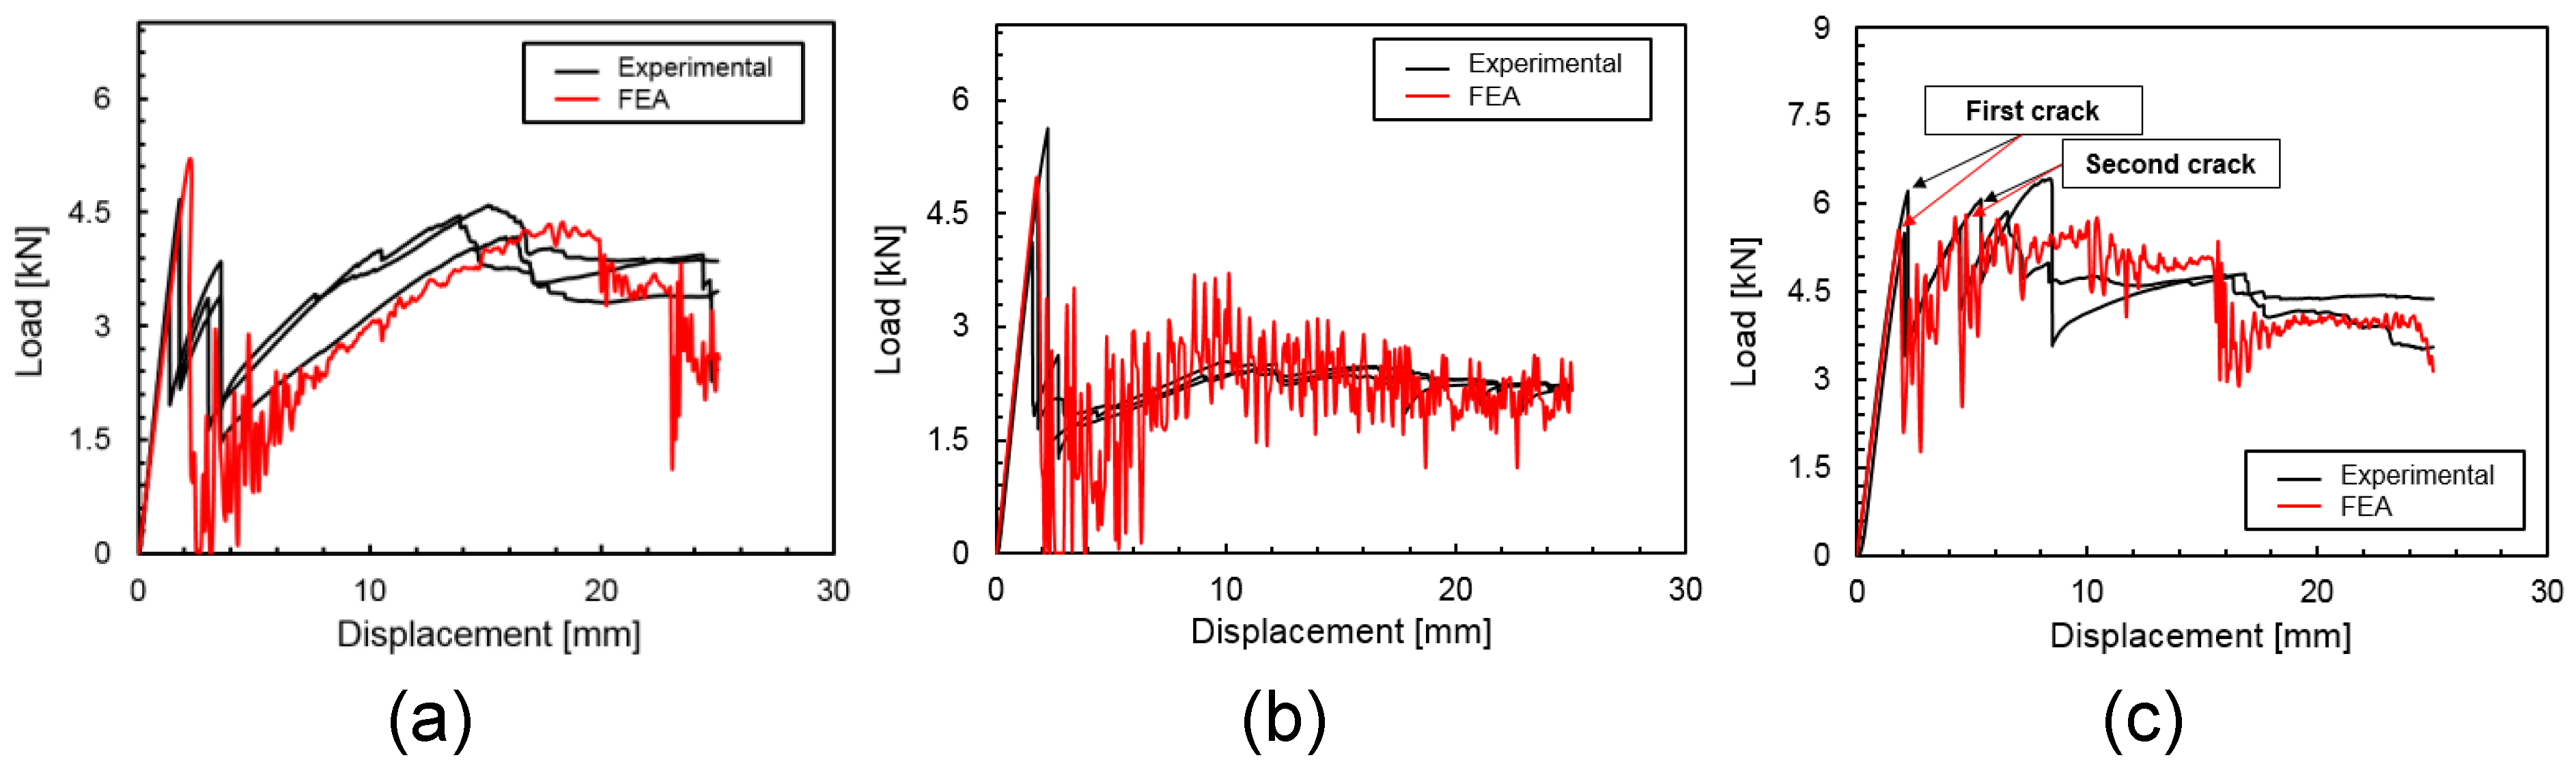
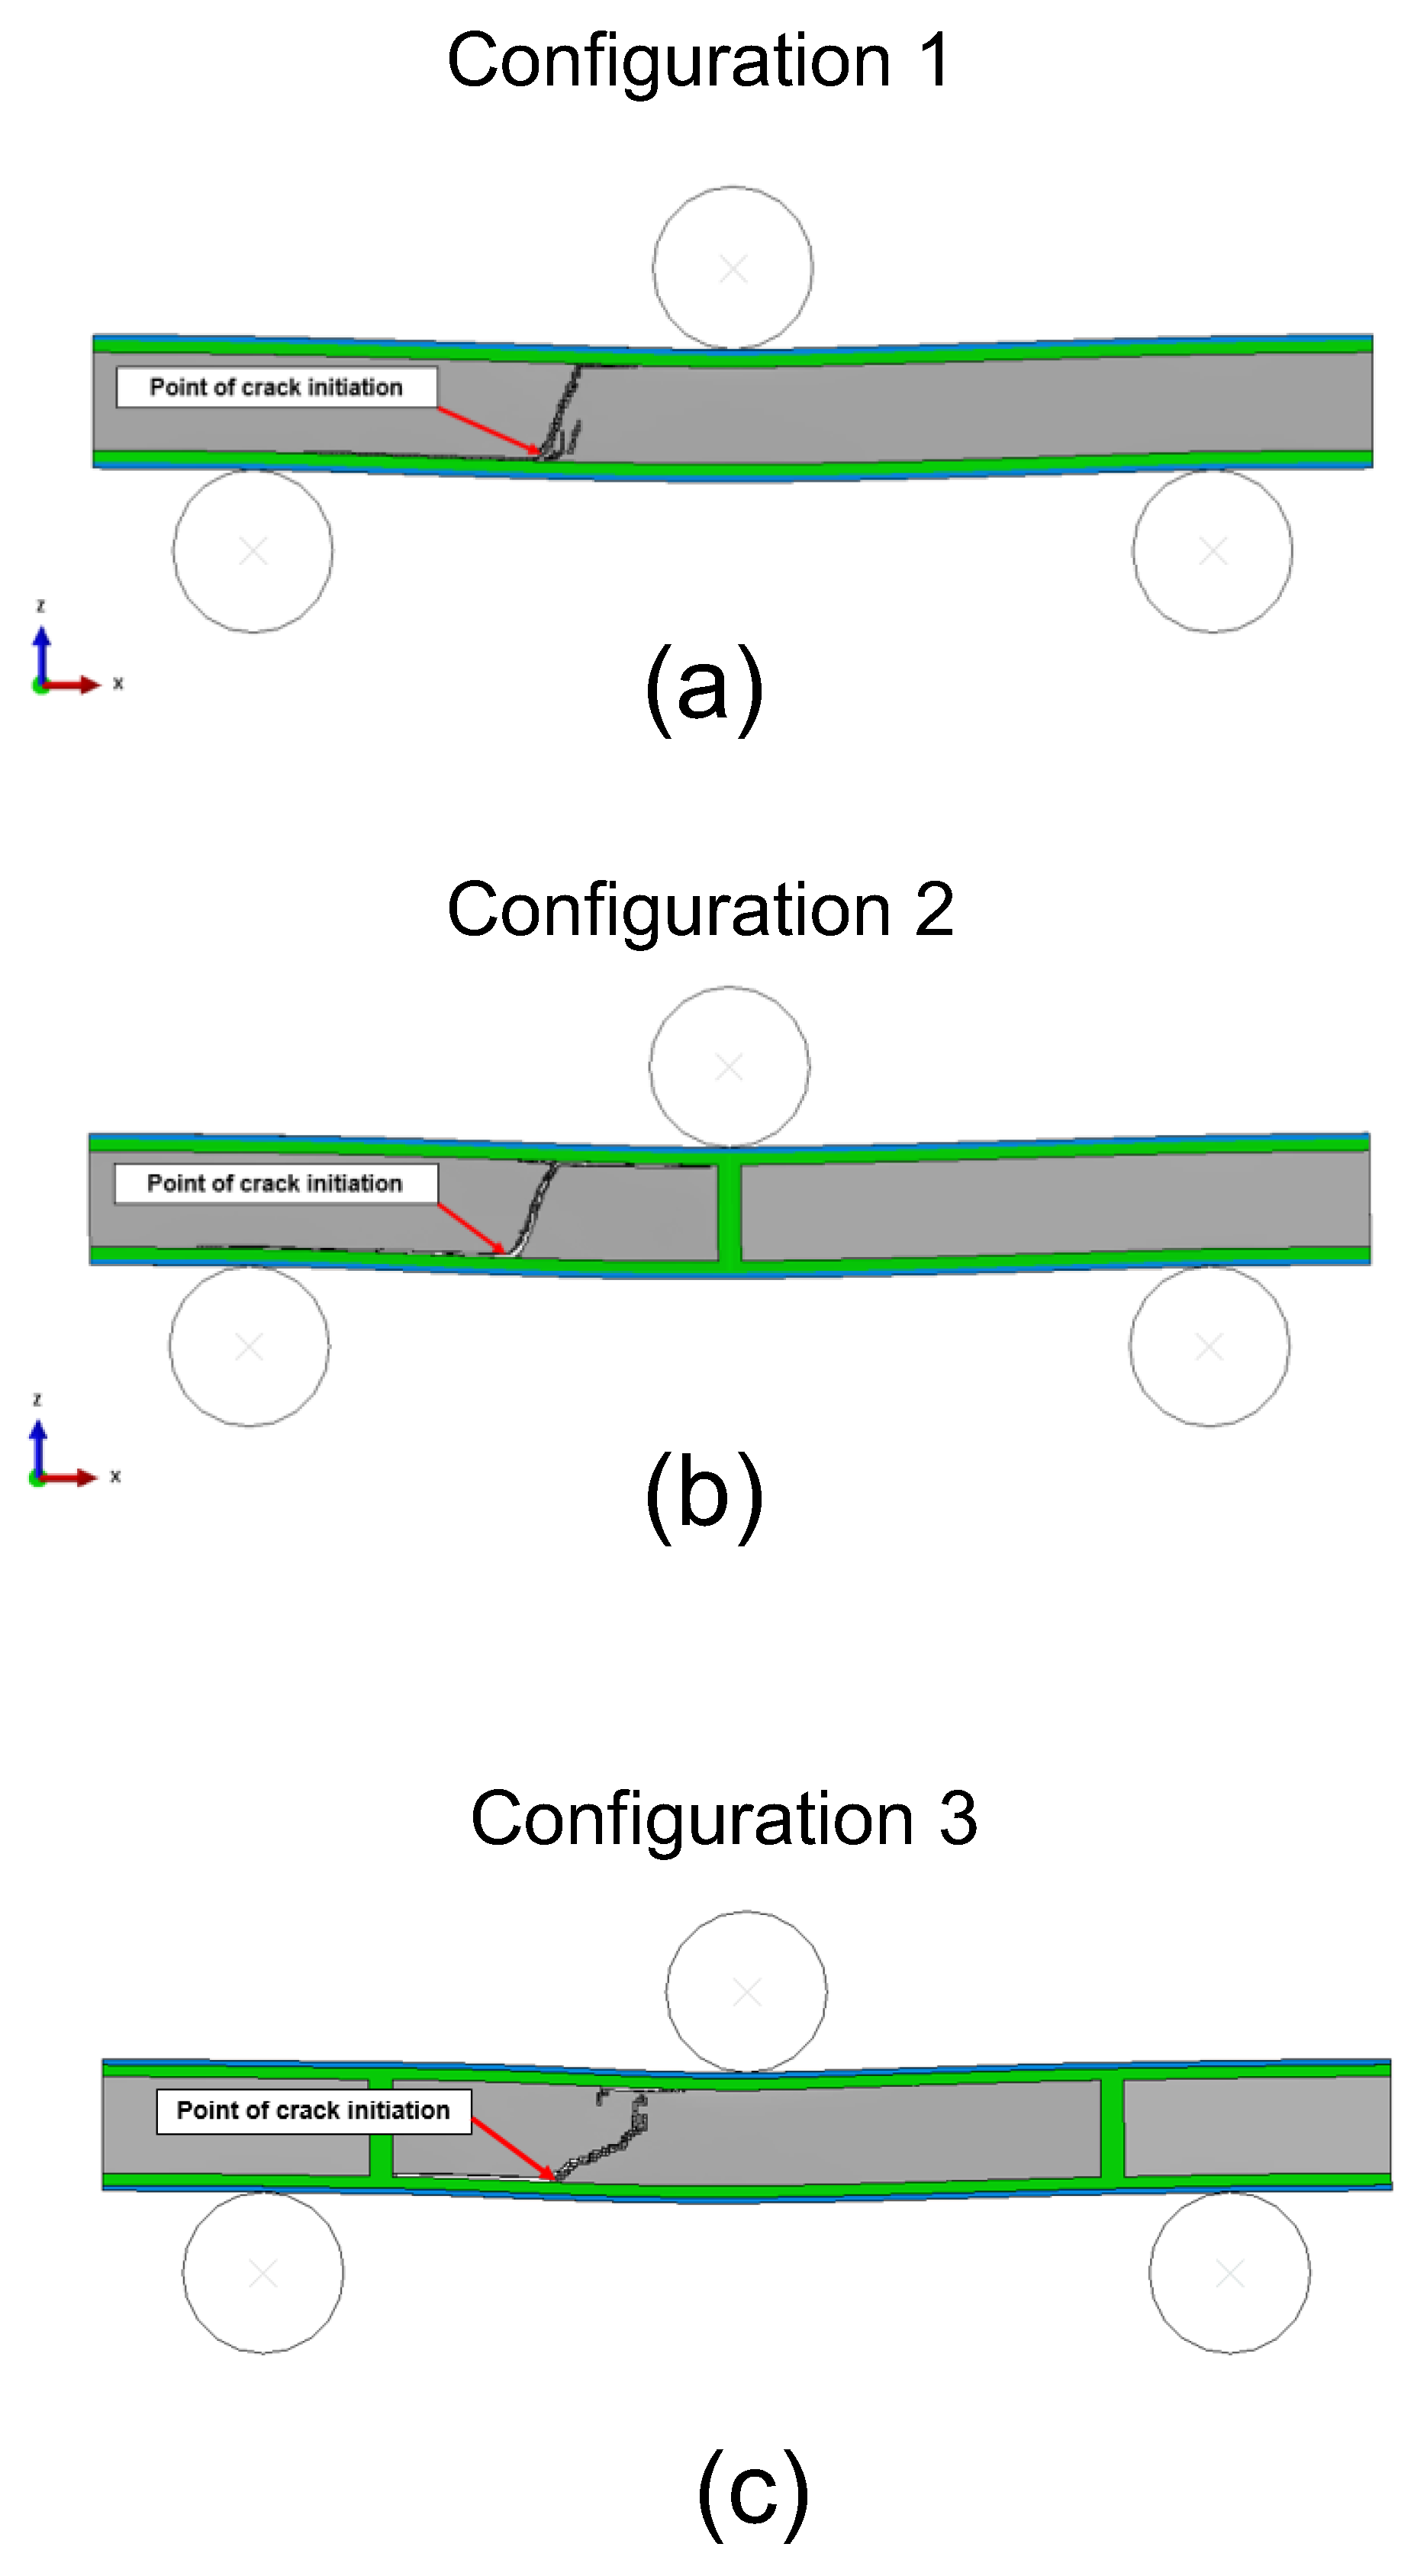
- Higher critical loads at failure, and a more controlled failure process, which resulted in a higher load bearing capacity post-initial failure stage, were observed in specimens with two through-thickness ribs placed on both sides of the loading roller in a three-point bending loading configuration. This specimen configuration enabled part of the shear stresses to be transferred to the CFRP ribs, postponing core failure. In addition, this arrangement of the ribs also restricted crack propagation, skin–core debonding, and the overall panel damage in the central portion of the specimen between the two ribs.
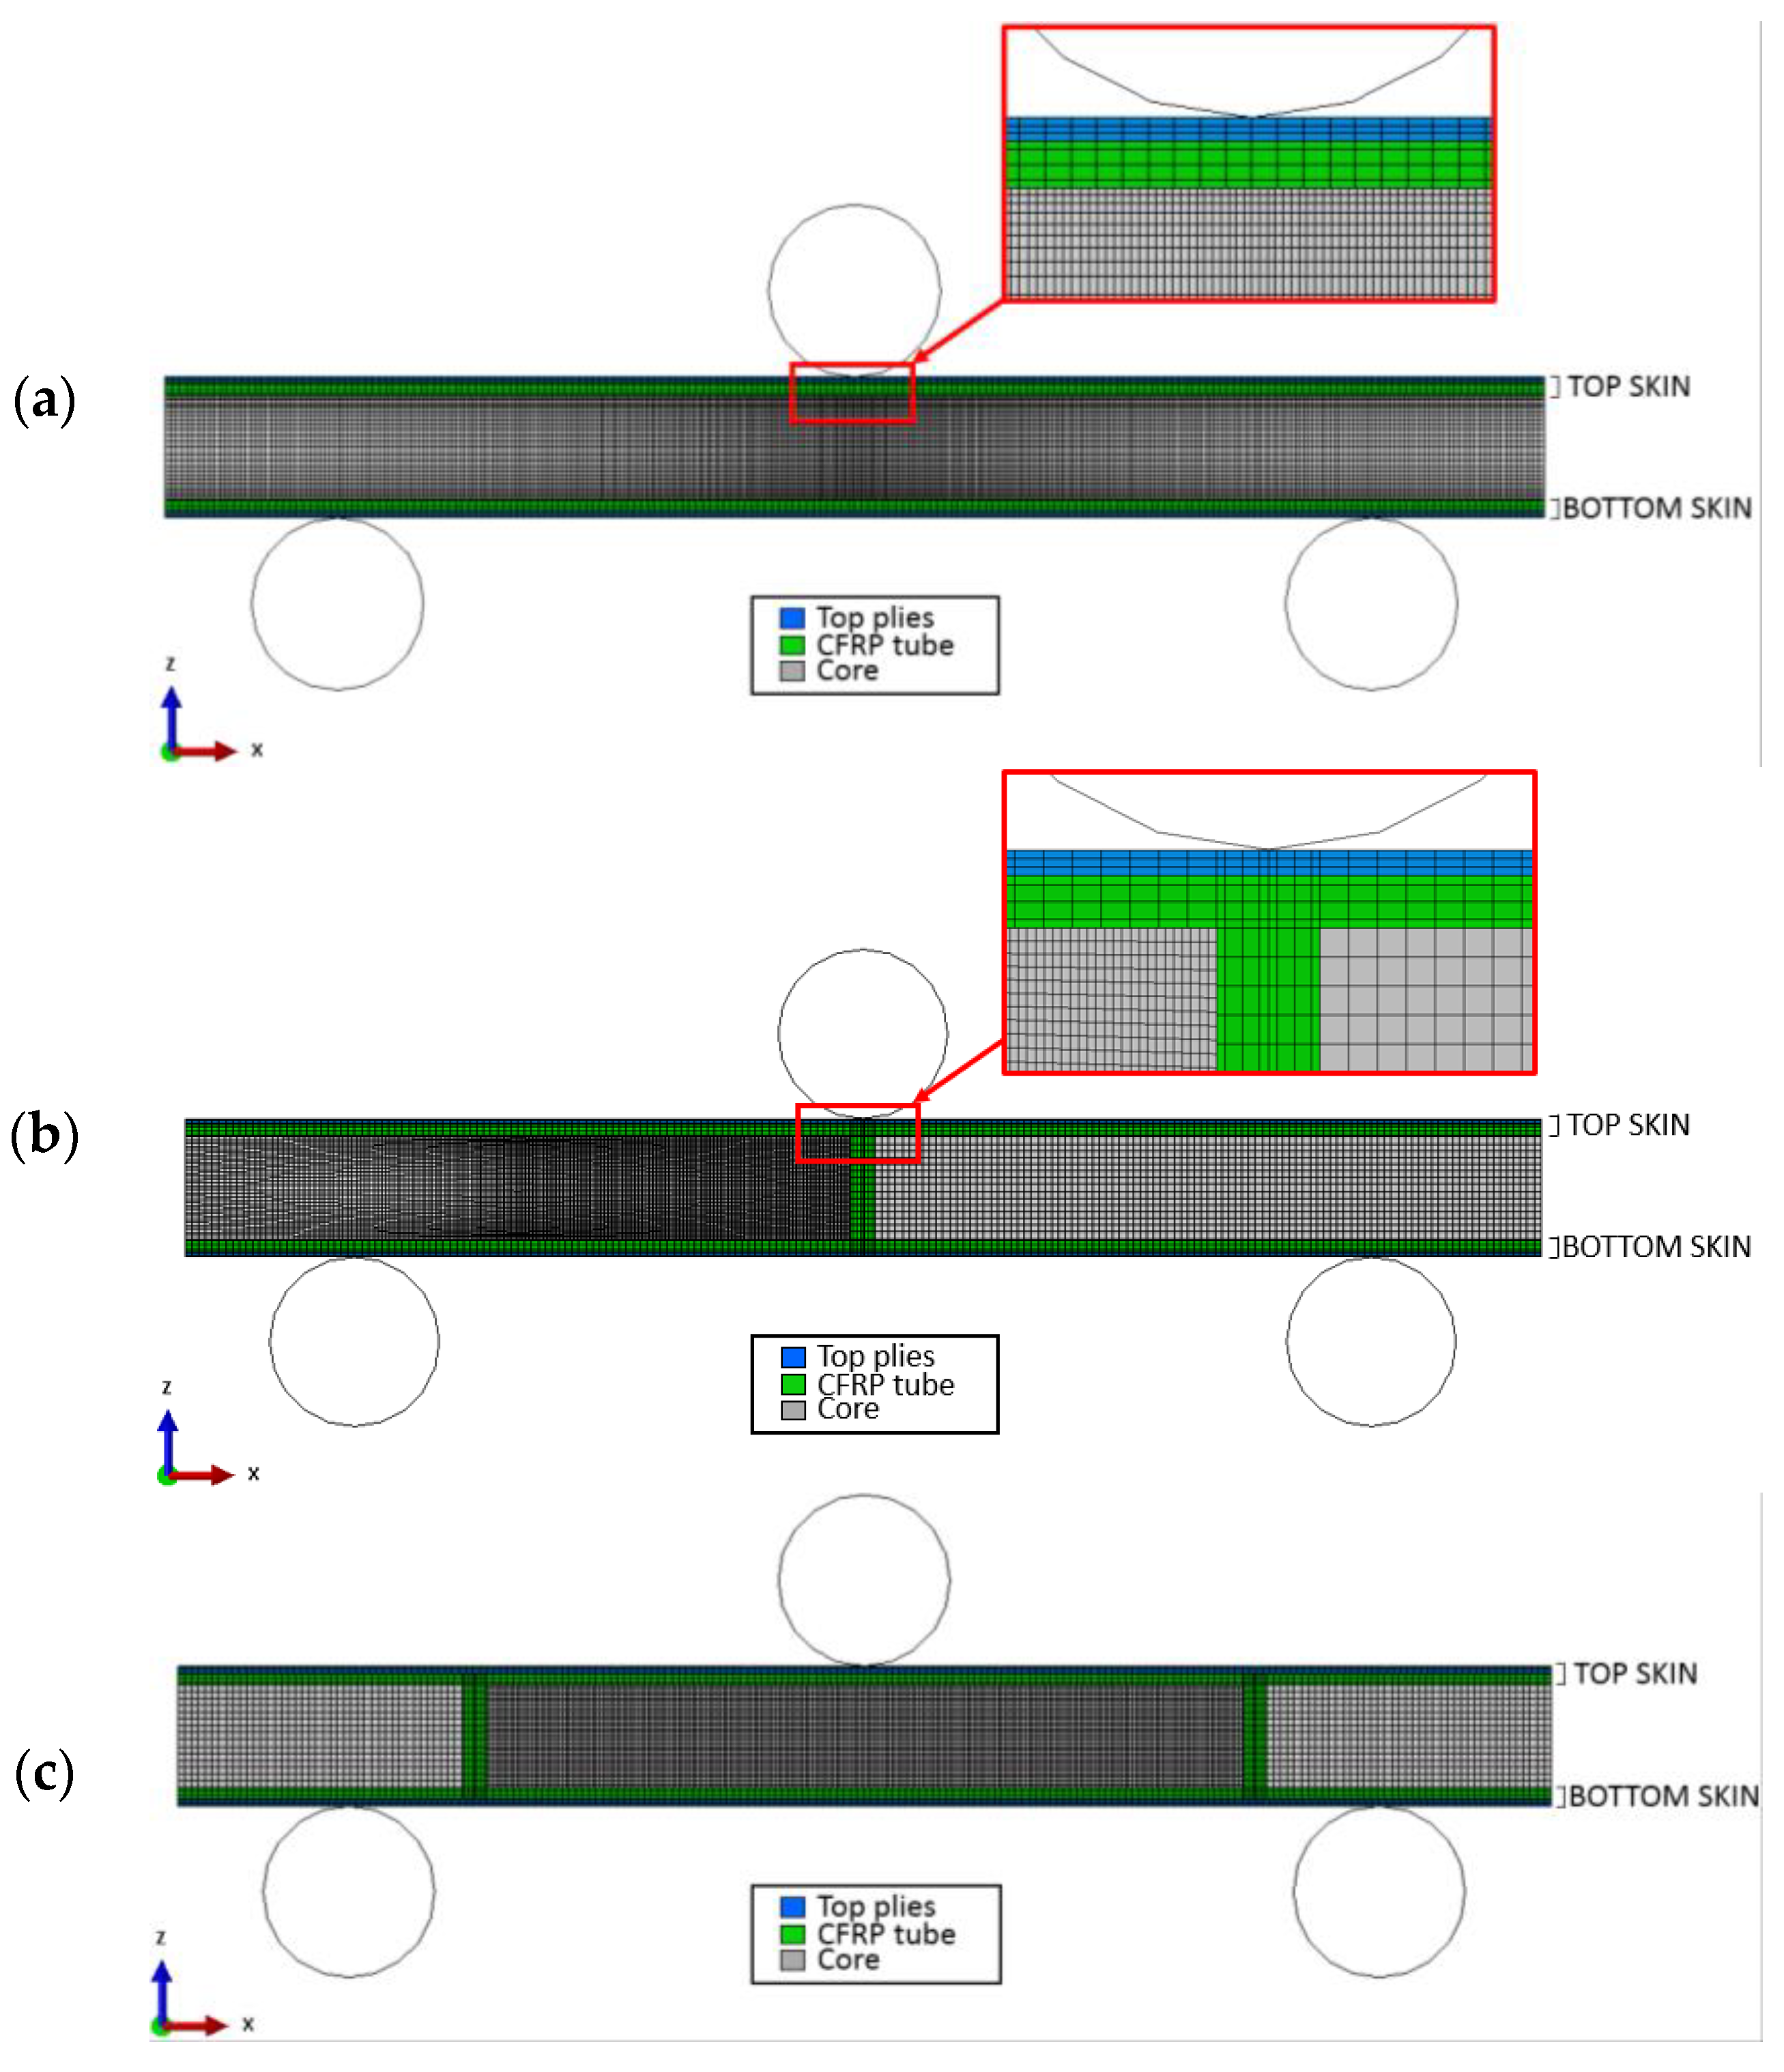
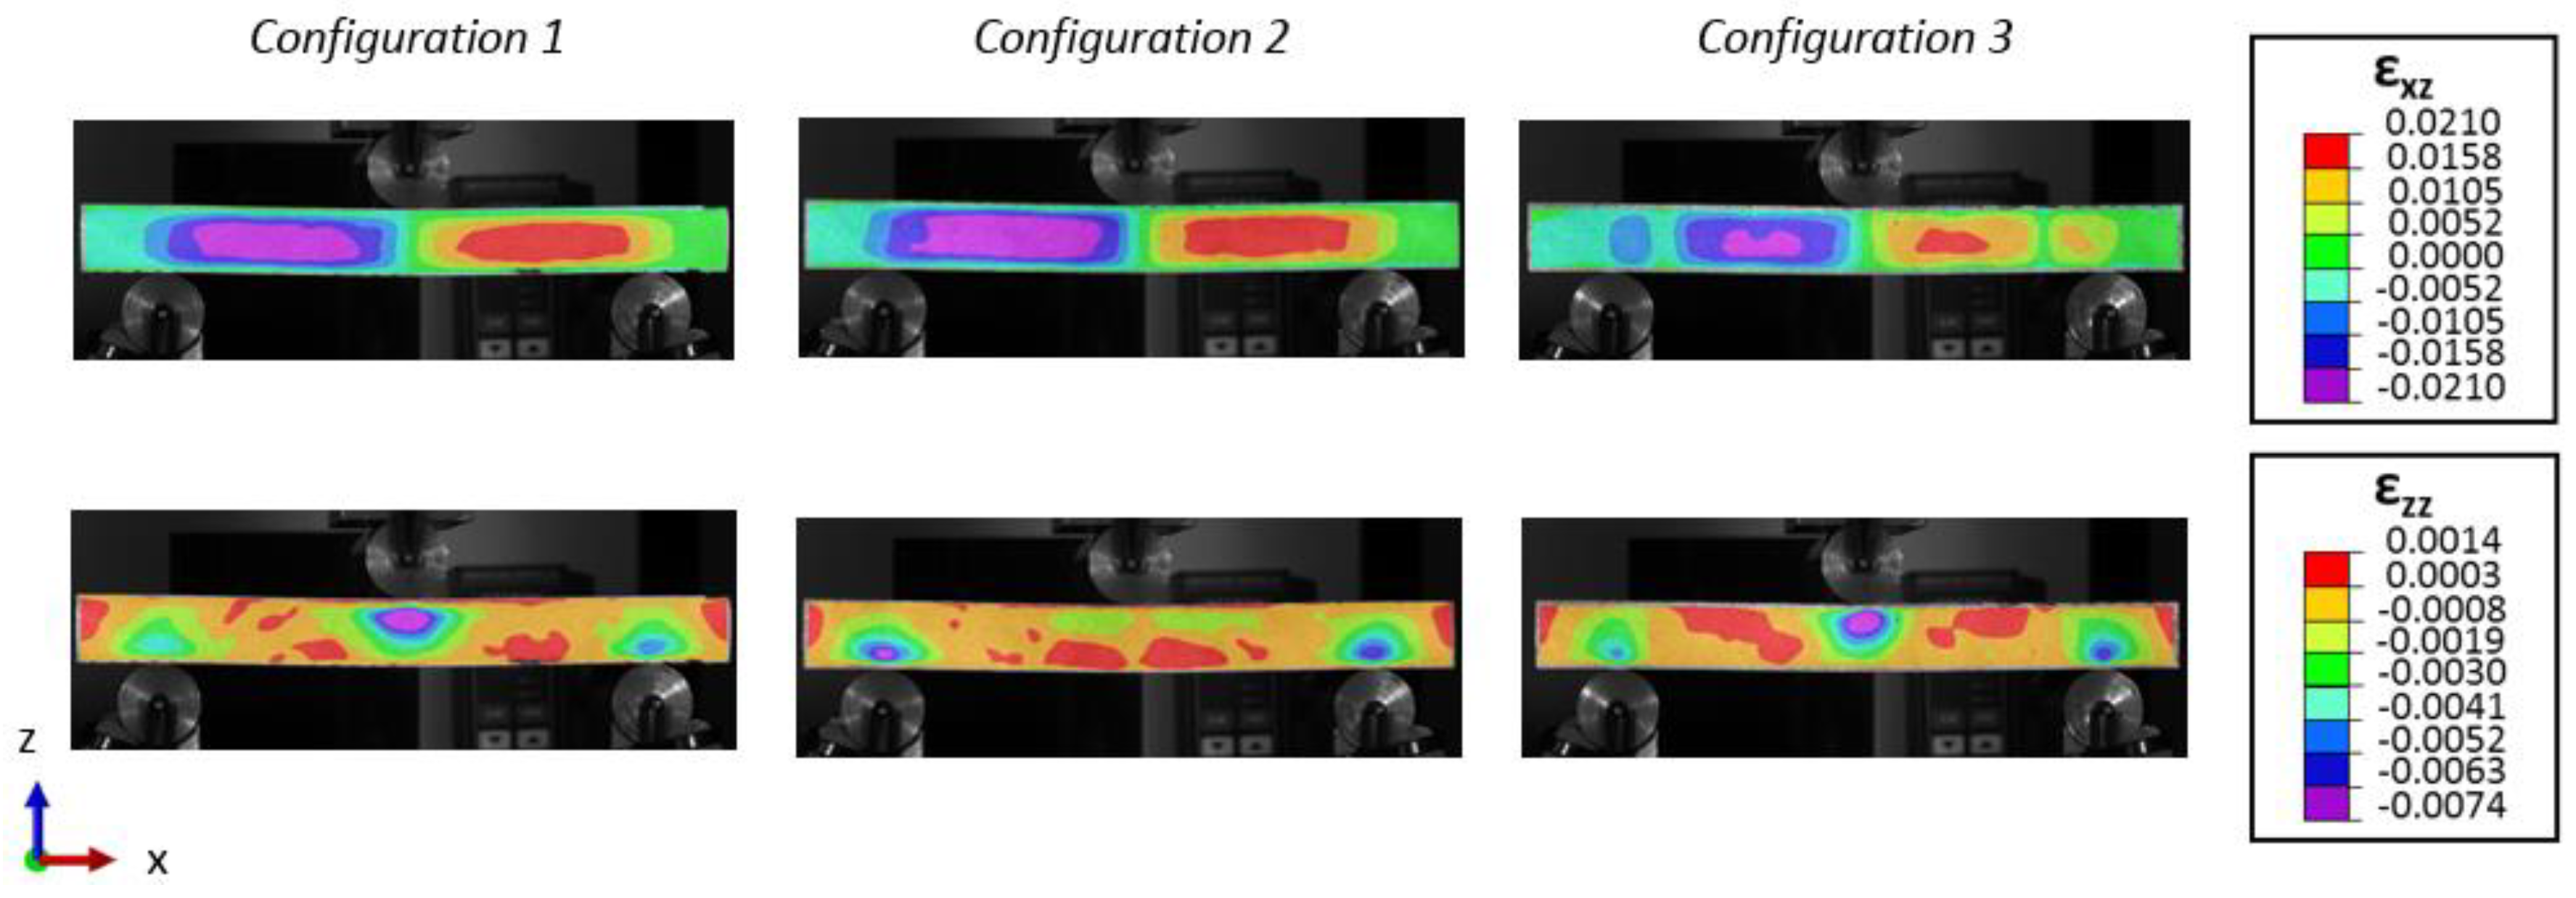
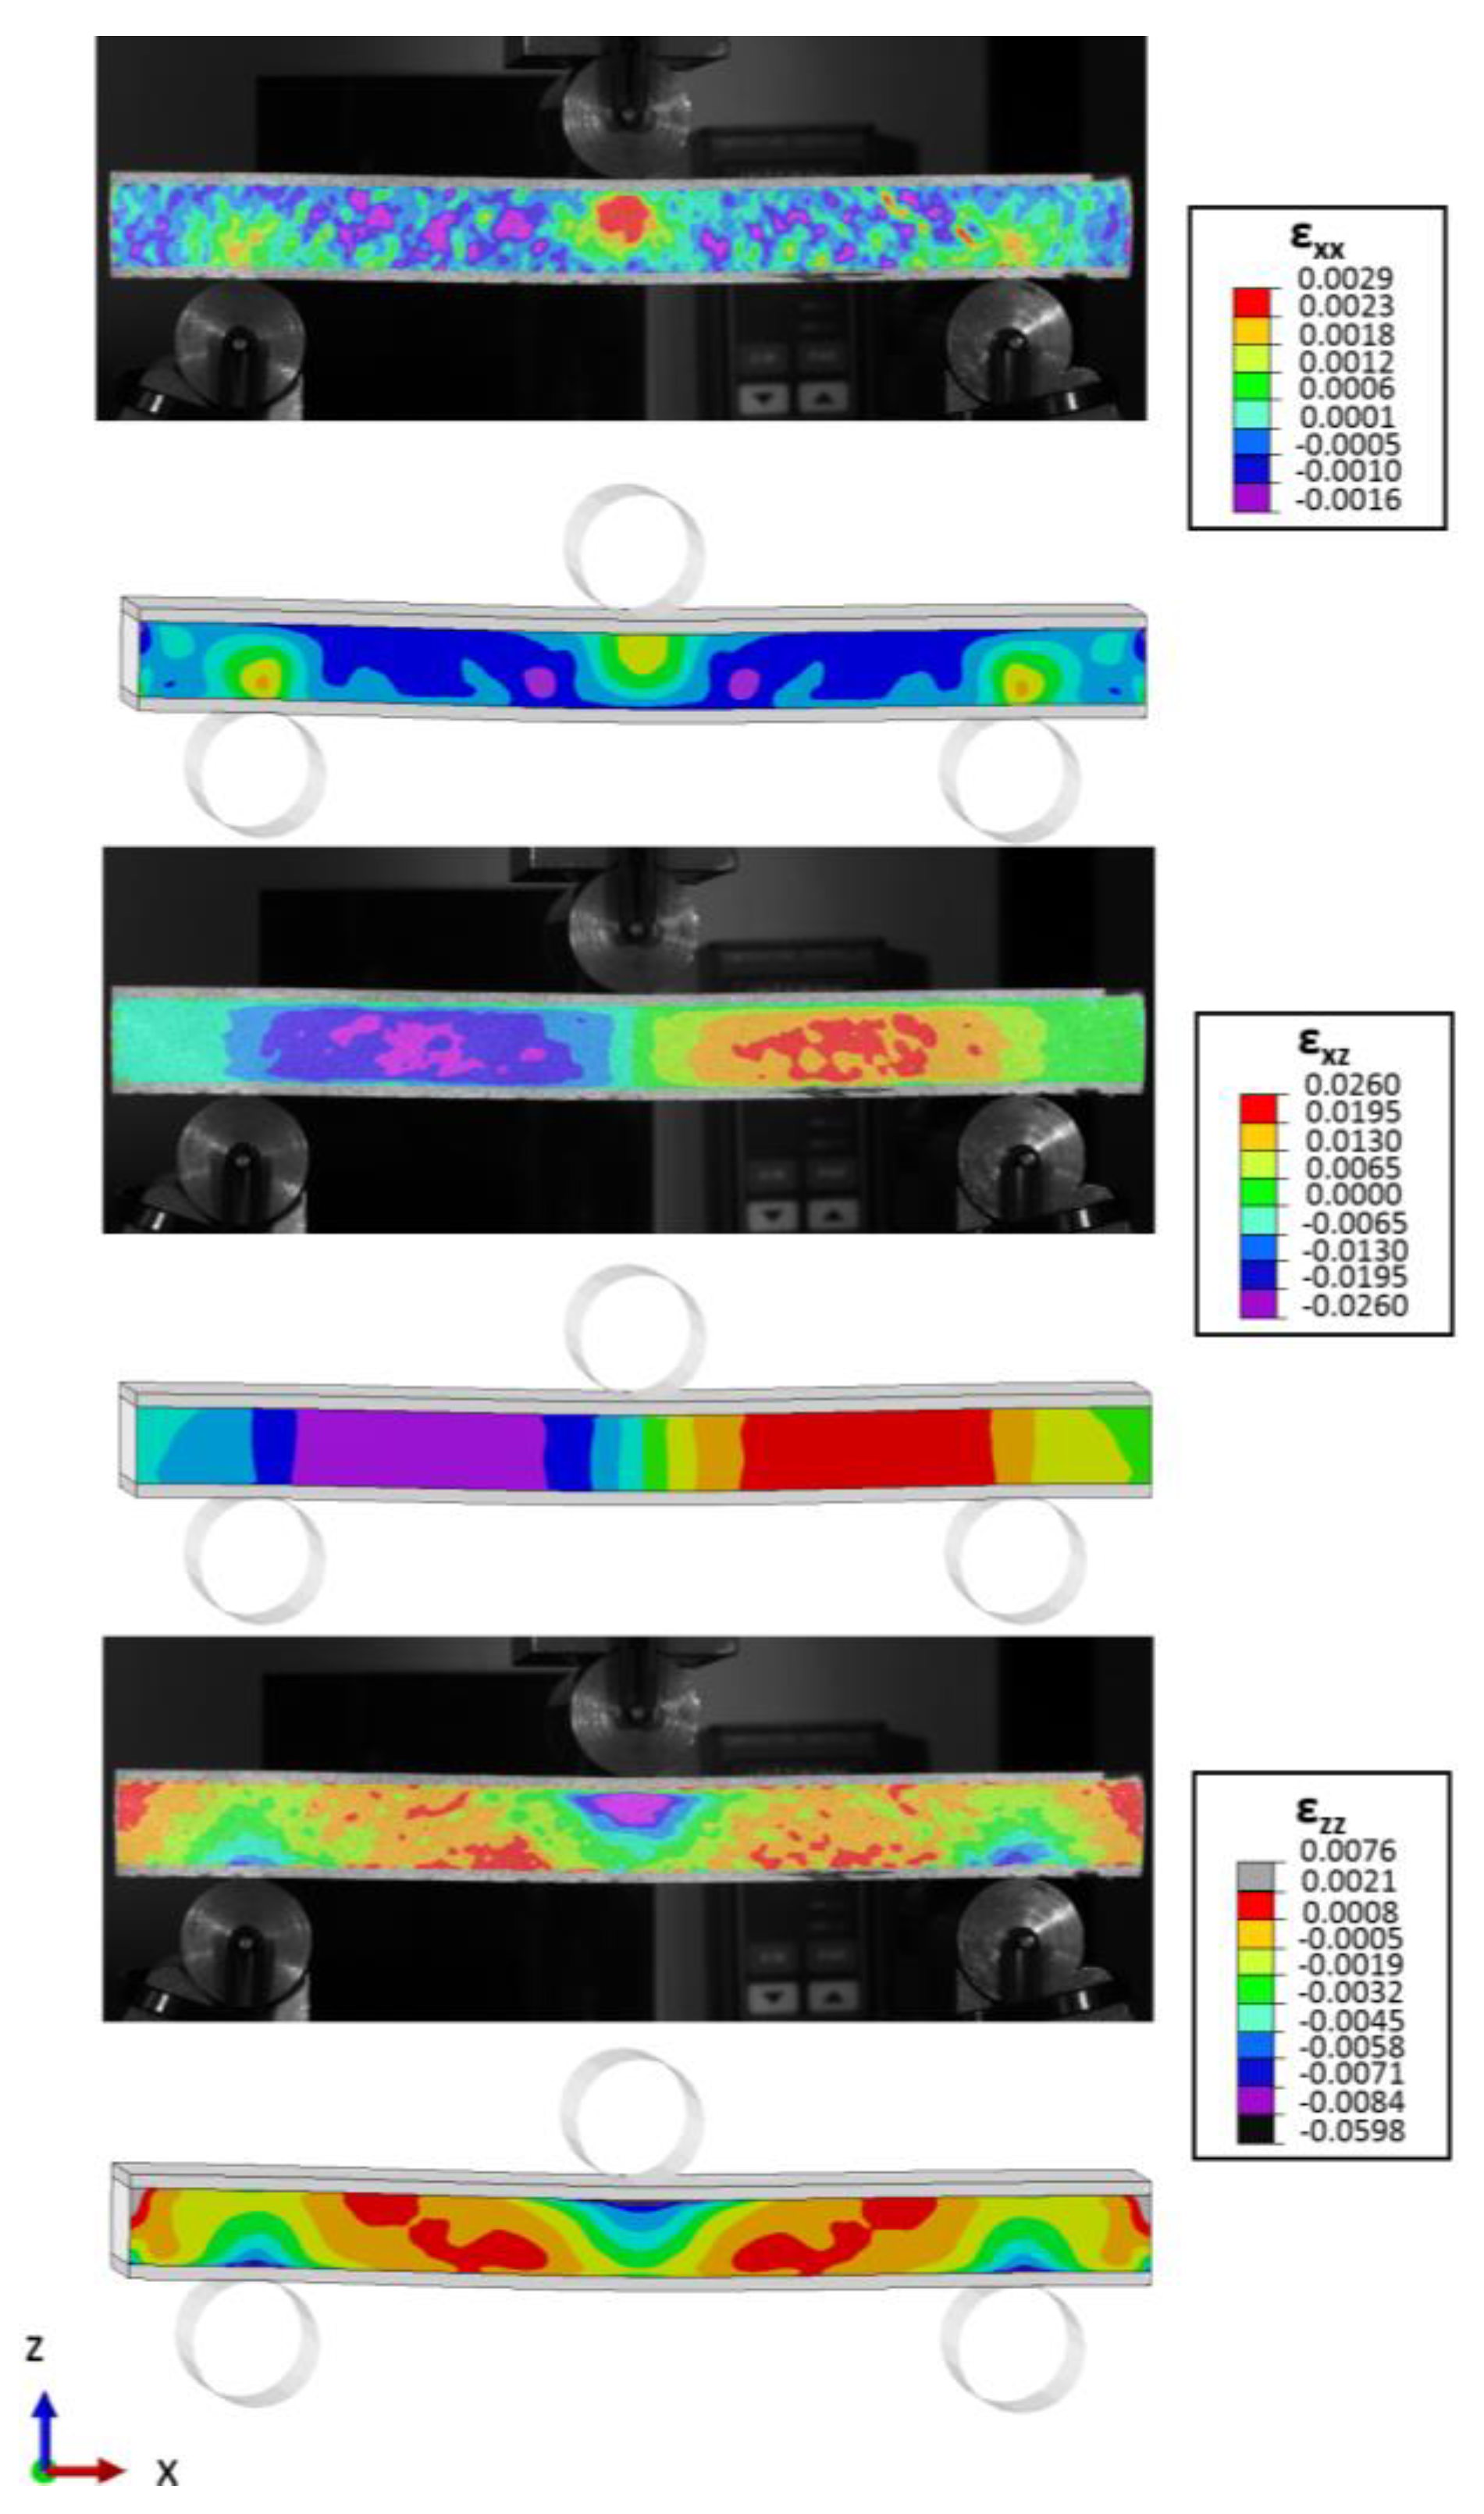
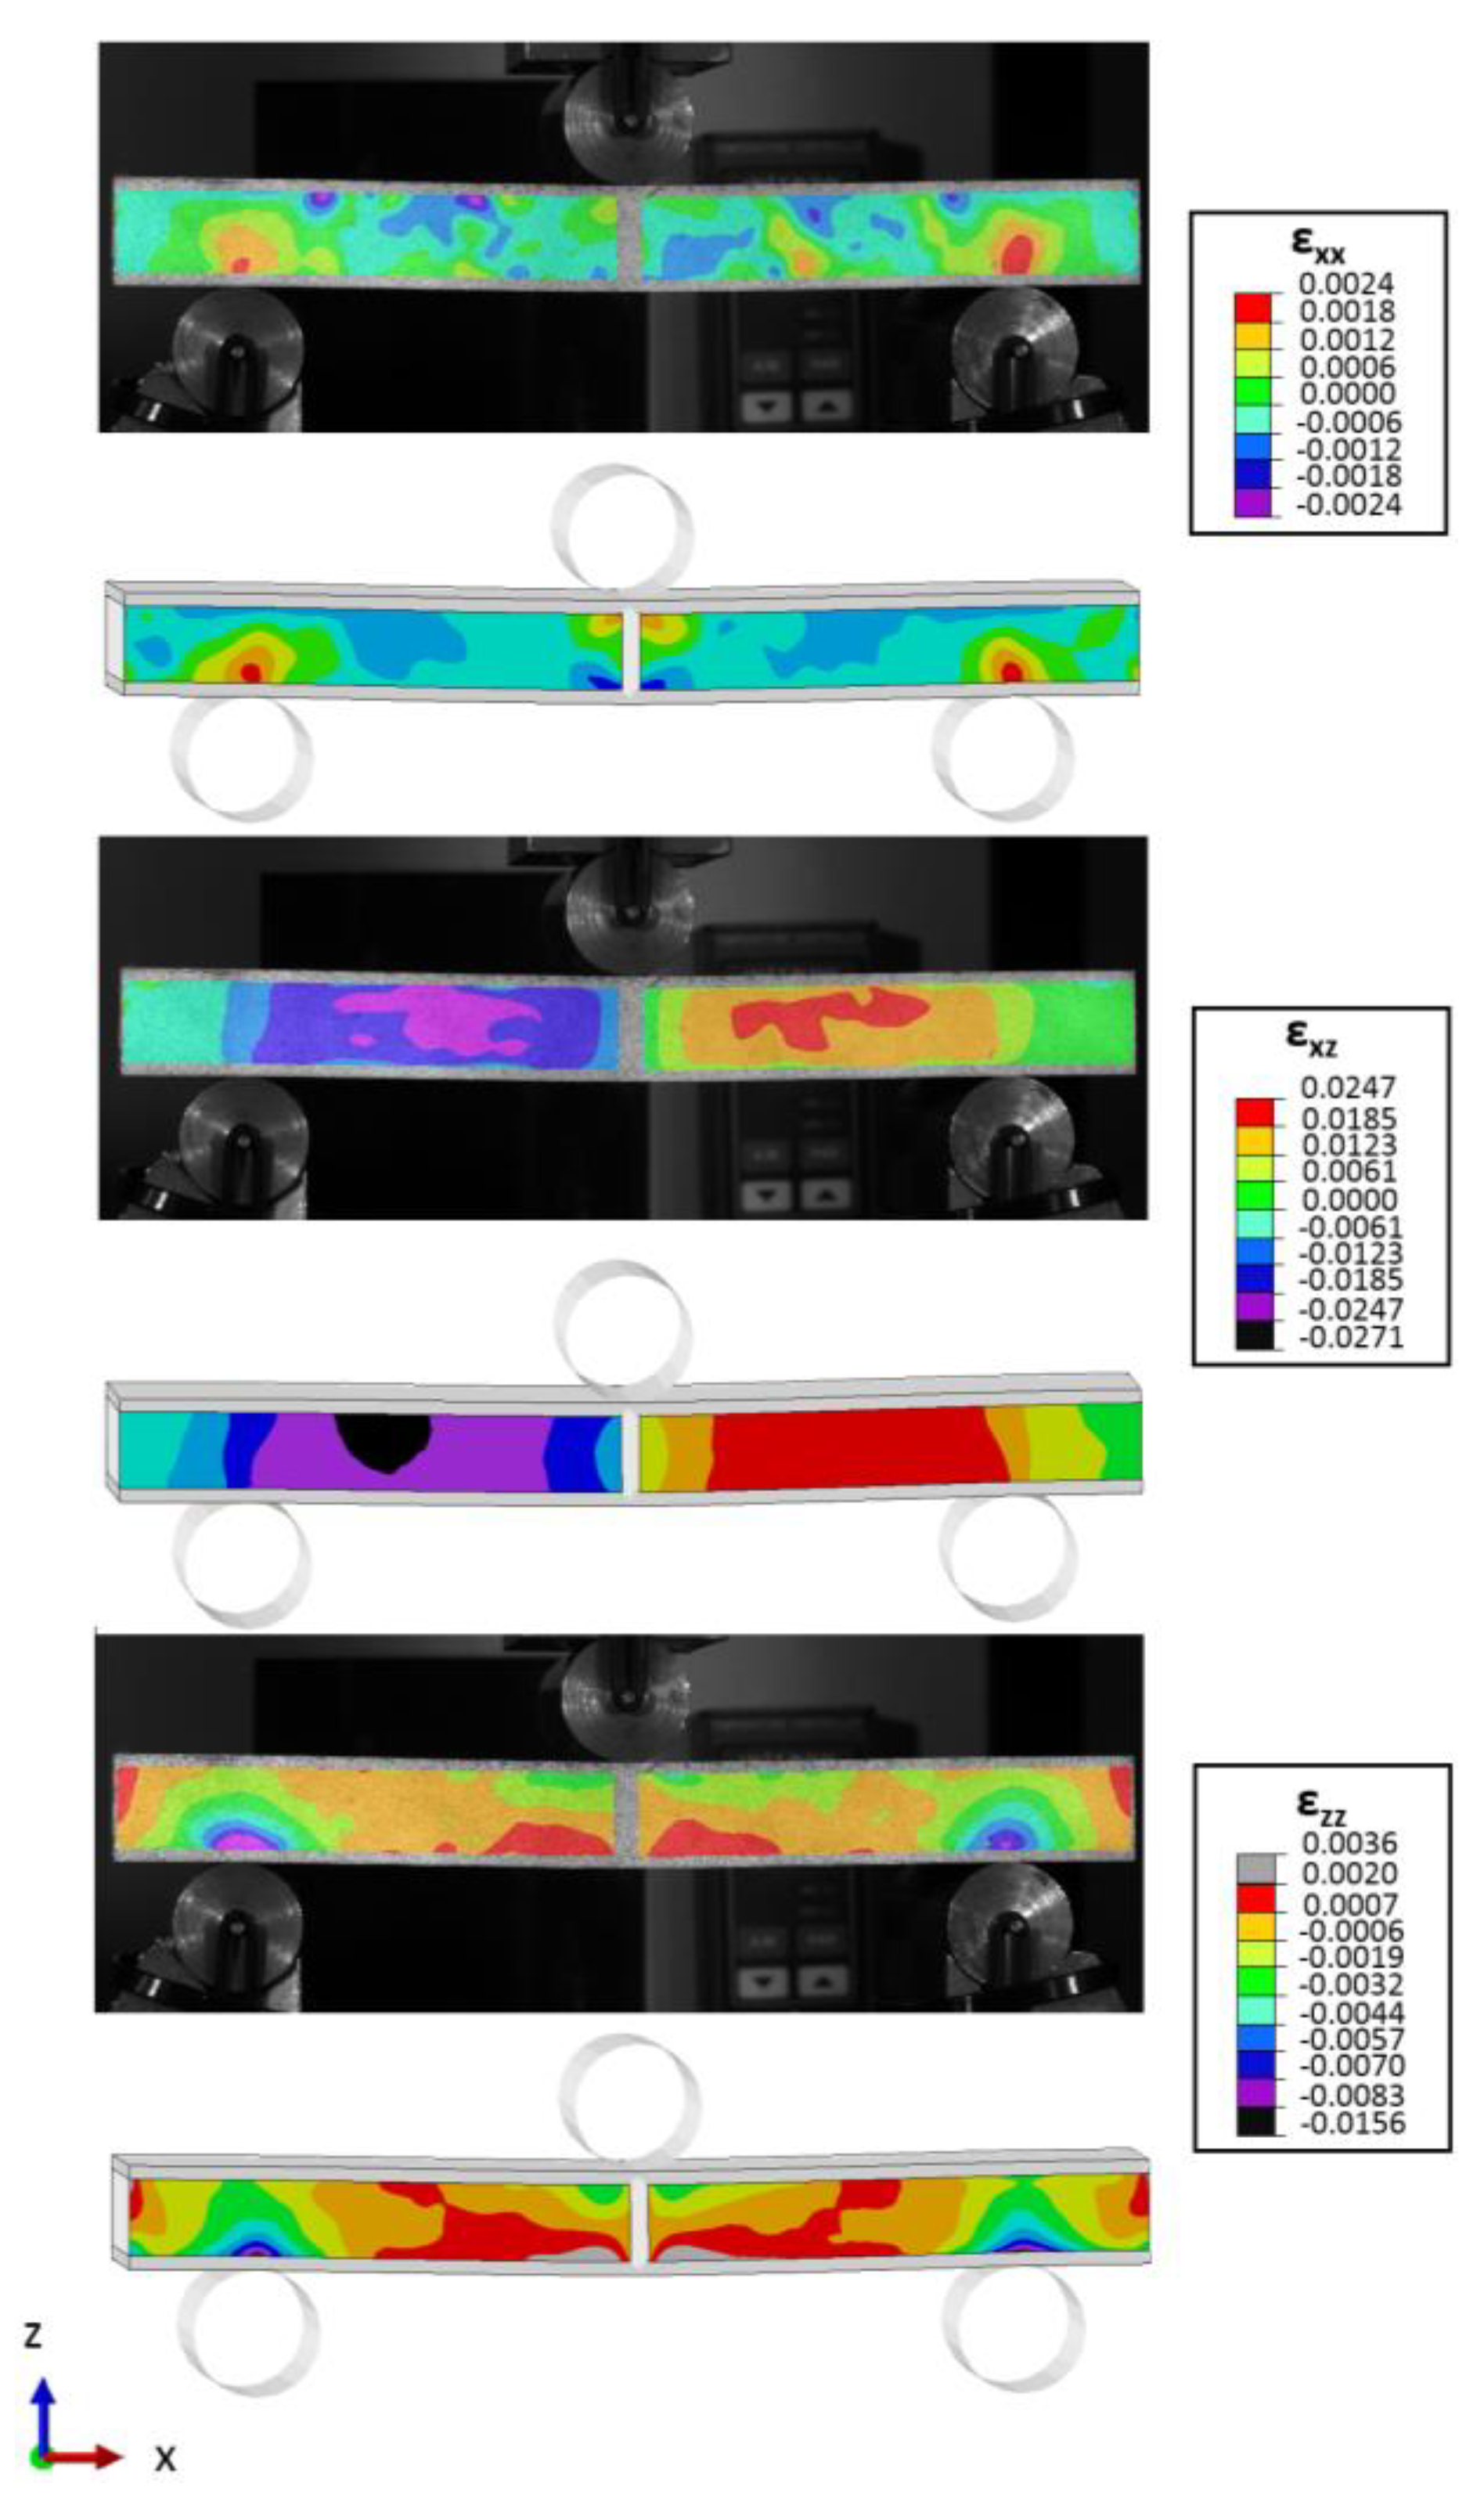
- The developed FEA model shows good agreement with the experimental results and was successful in capturing the details of the failure process in all three configurations.
- The FEA approach used is proven to be an effective modelling approach for capturing the details of the debonding process in the composite foam structures, without the need for complex and computationally expensive interface modelling. This has a particular importance in an industrial context, as it allows larger structures to be modelled with less computational resources being required.
Author Contributions
Funding
Data Availability Statement
Acknowledgments
Conflicts of Interest
References
- Carruthers, J.J.; Kettle, A.P.; Robinson, A.M. Energy absorption capability and crashworthiness of composite material structures: A review. Appl. Mech. Rev. 1998, 51, 635–649. [Google Scholar] [CrossRef]
- Mamalis, A.G.; Manolakos, D.E.; Ioannidis, M.B.; Papapostolou, D.P. On the crushing response of composite sandwich panels subjected to edgewise compression: Experimental. Compos. Struct. 2005, 71, 246–257. [Google Scholar] [CrossRef]
- Pfund, B. Core Installation. Prof. Boat Build. 2005, 94, 48–69. [Google Scholar]
- Hamada, H.; Ramakrishna, S.; Nakamura, M.; Maekawa, Z.; Hull, D. Progressive crushing behaviour of glass/epoxy composite tubes with different surface treatment. Compos. Interfaces 1994, 2, 127–142. [Google Scholar] [CrossRef]
- Bragagnolo, G.; Crocombe, A.D.; Ogin, S.L.; Mohagheghian, I.; Sordon, A.; Meeks, G.; Santoni, C. Investigation of skin-core debonding in sandwich structures with foam cores. Mater. Des. 2020, 186, 108312. [Google Scholar] [CrossRef]
- Saeid, A.A.; Donaldson, S.L. Experimental and finite element evaluations of debonding in composite sandwich structure with core thickness variations. Adv. Mech. Eng. 2016, 8, 1–18. [Google Scholar] [CrossRef]
- Warrior, N.A.; Turner, T.A.; Robitaille, F.; Rudd, C.D. The effect of interlaminar toughening strategies on the energy absorption of composite tubes. Compos. Part A Appl. Sci. Manuf. 2004, 35, 431–437. [Google Scholar] [CrossRef]
- Saha, M.C.; Kabir, E.; Jeelani, S. Core/skin debond fracture toughness of S2-glass/epoxy sandwich composites with nanophased polyurethane core. In Proceedings of the 2006 SEM Annual Conference and Exposition on Experimental and Applied Mechanics 2006, Saint Louis, MO, USA, 4–7 June 2006. [Google Scholar]
- Mamalis, A.G.; Manolakos, D.E.; Ioannidis, M.B.; Kostazos, P.K. Axial collapse of hybrid square sandwich composite tubular components with corrugated core: Experimental. Int. J. Crashworthiness 2000, 5, 315–332. [Google Scholar] [CrossRef]
- Mamalis, A.G.; Manolakos, D.E.; Ioannidis, M.B.; Papapostolou, D.P.; Kostazos, P.K.; Konstantinidis, D.G. On the compression of hybrid sandwich composite panels reinforced with internal tube inserts: Experimental. Compos. Struct. 2002, 56, 191–199. [Google Scholar] [CrossRef]
- Henao, A.; Carrera, M.; Miravete, A.; Castejón, L. Mechanical performance of through-thickness tufted sandwich structures. Compos. Struct. 2010, 92, 2052–2059. [Google Scholar] [CrossRef] [Green Version]
- Jishi, H.Z.; Umer, R.; Cantwell, W.J. Skin-Core Debonding in Resin-Infused Sandwich Structures. Polym. Compos. 2016, 37, 2974–2981. [Google Scholar] [CrossRef]
- Blok, L.G.; Kratz, J.; Lukaszewicz, D.; Hesse, S.; Ward, C.; Kassapoglou, C. Improvement of the in-plane crushing response of CFRP sandwich panels by through-thickness reinforcements. Compos. Struct. 2017, 161, 15–22. [Google Scholar] [CrossRef] [Green Version]
- Glaessgen, E.H.; Reeder, J.R.; Sleight, D.W.; Wang, J.T.; Raju, I.S.; Harris, C.E. Debonding failure of sandwich-composite cryogenic fuel tank with internal core pressure. J. Spacecr. Rockets 2005, 42, 613–627. [Google Scholar] [CrossRef]
- Toygar, M.E.; Tee, K.F.; Maleki, F.K.; Balaban, A.C. Experimental, analytical and numerical study of mechanical properties and fracture energy for composite sandwich beams. J. Sandw. Struct. Mater. 2019, 21, 1167–1189. [Google Scholar] [CrossRef]
- Balaban, A.C.; Tee, K.F. Strain energy release rate of sandwich composite beams for different densities and geometry parameters. Theor. Appl. Fract. Mech. 2019, 101, 191–199. [Google Scholar] [CrossRef]
- Xie, H.; Shen, C.; Fang, H.; Han, J.; Cai, W. Flexural property evaluation of web reinforced GFRP-PET foam sandwich panel: Experimental study and numerical simulation. Compos. Part B Eng. 2022, 234, 109725. [Google Scholar] [CrossRef]
- Chen, J.; Cheng, L.; Sun, H.; Yao, X.; Fu, C.; Jiang, J. The influence of pin on the low-velocity impact performance of foam sandwich structure. Int. J. Mech. Sci. 2023, 244, 108057. [Google Scholar] [CrossRef]
- Ghimire, S.; Chen, J. An extended cohesive damage model study of geometrical ratio effects on failure mechanisms of functionally graded sandwiches with multi-layered cores. Compos. Struct. 2019, 224, 110999. [Google Scholar] [CrossRef]
- ASTM D3039/D3039M-17. Standard Test Method for Tensile Properties of Polymer Matrix Composite Materials. ASTM International: West Conshohocken, PA, USA, 2017; pp. 1–13.
- ASTM D3410/D3410M-16. Standard Test Method for Compressive Properties of Polymer Matrix Composite Materials with Unsupported Gage Section by Shear. ASTM International: West Conshohocken, PA, USA, 2016; Volume 3, pp. 1–16.
- ASTM D3518/D3518M-18. Standard Test Method for In-Plane Shear Response of Polymer Matrix Composite Materials by Tensile Test of a 45° Laminate. ASTM International: West Conshohocken, PA, USA, 2018; pp. 1–8.
- Carranza, I.; Crocombe, A.D.; Mohagheghian, I. Characterising and modelling the mechanical behaviour of polymeric foams under complex loading. J. Mater. Sci. 2019, 54, 11328–11344. [Google Scholar] [CrossRef] [Green Version]
- ASTM C393/C 393 M-06. Standard Test Method for Core Shear Properties of Sandwich Constructions by Beam. ASTM International: West Conshohocken, PA, USA, 2009; pp. 1–8.
- Simulia, D.S. Abaqus 2017 Documentation; Dassault Systemes: Waltham, MA, USA, 2017. [Google Scholar]
- Kraatz, H.A. Anwendung der Invariantentheorie zur Berechnung des dreidimensionalen Versagens- und Kriechverhaltens von geschlossenzelligen Schaumstoffen unter Einbeziehung der Mikrostruktur. Ph.D. Thesis, Martin-Luther-Universitat Halle-Wittenberg, Halle, Germany, 2007. [Google Scholar]
- Schneider, W.; Bardenheier, R. Versagenskriterien fur Kunststoffe. J. Mater. Technol. 1975, 6, 269–280. [Google Scholar] [CrossRef]
- Martins, R.; Reis, L.; Marat-mendes, R. Finite element prediction of stress-strain fields on sandwich composites. Procedia Struct. Integr. 2016, 1, 66–73. [Google Scholar] [CrossRef] [Green Version]


| Young’s Modulus | Poisson’s Ratio | Density | Shear Modulus | Compressive Strength | Tensile Strength | Shear Strength | ||||
|---|---|---|---|---|---|---|---|---|---|---|
| E11 [GPa] | E22 [GPa] | ν12 | ρ [kg/m3] | G12 = G13 = G23 [GPa] | X11 [MPa] | X22 [MPa] | Xt11 [MPa] | Xt22 [MPa] | S [MPa] | |
| UD | 127 | 8 | 0.3 | 1500 | 6.1 | 656 | 169 | 1926 | 29 | 34 |
| BIAX | 65 | 66 | 0.03 | 1500 | 2.4 | 585 | 585 | 1005 | 1005 | 22 |
| Tensile Elastic Modulus | Compressive Elastic Modulus | Density | Tensile Strength | Compressive Yield Strength | Shear Yield Strength | |
|---|---|---|---|---|---|---|
| ET [MPa] | EC [MPa] | ρ [kg/m3] | XT [MPa] | XC [MPa] | XS [MPa] | |
| FOAM CORE | 143 | 123 | 110 | 2 | 1.9 | 1.5 |
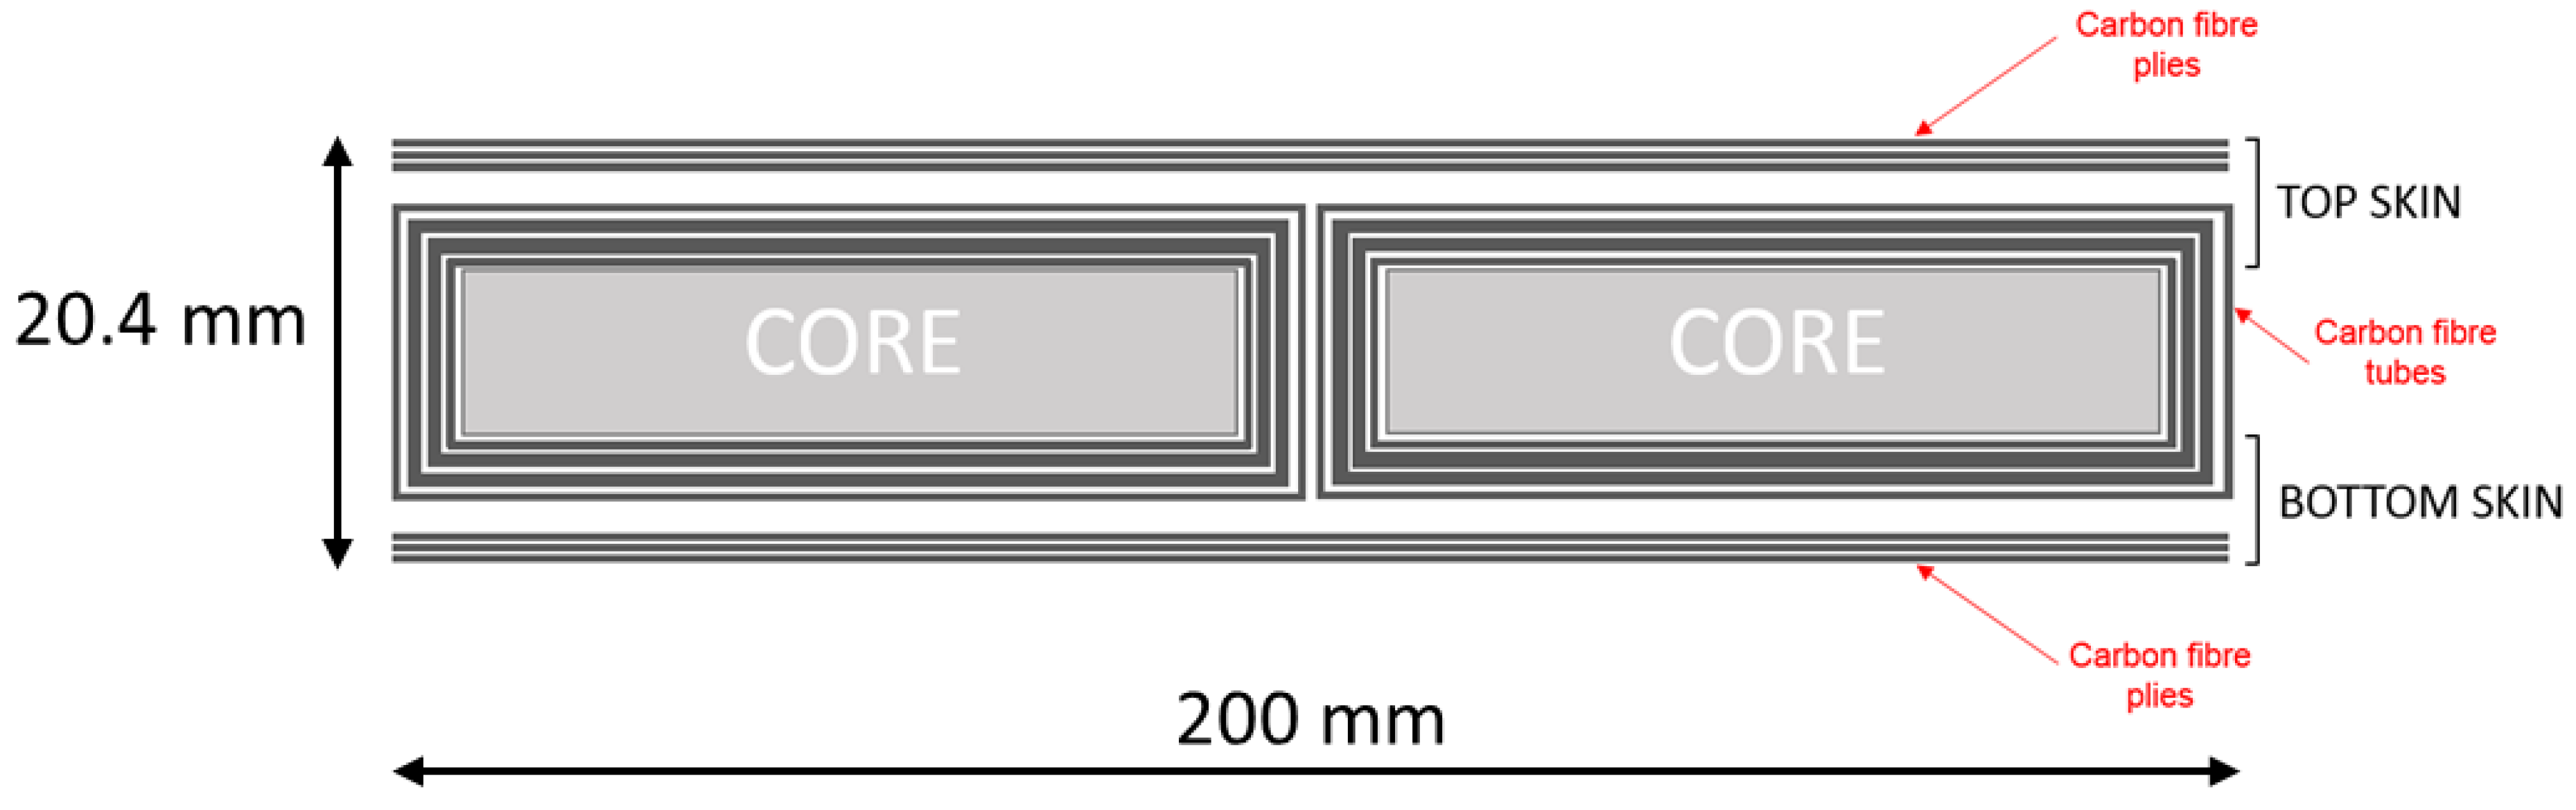
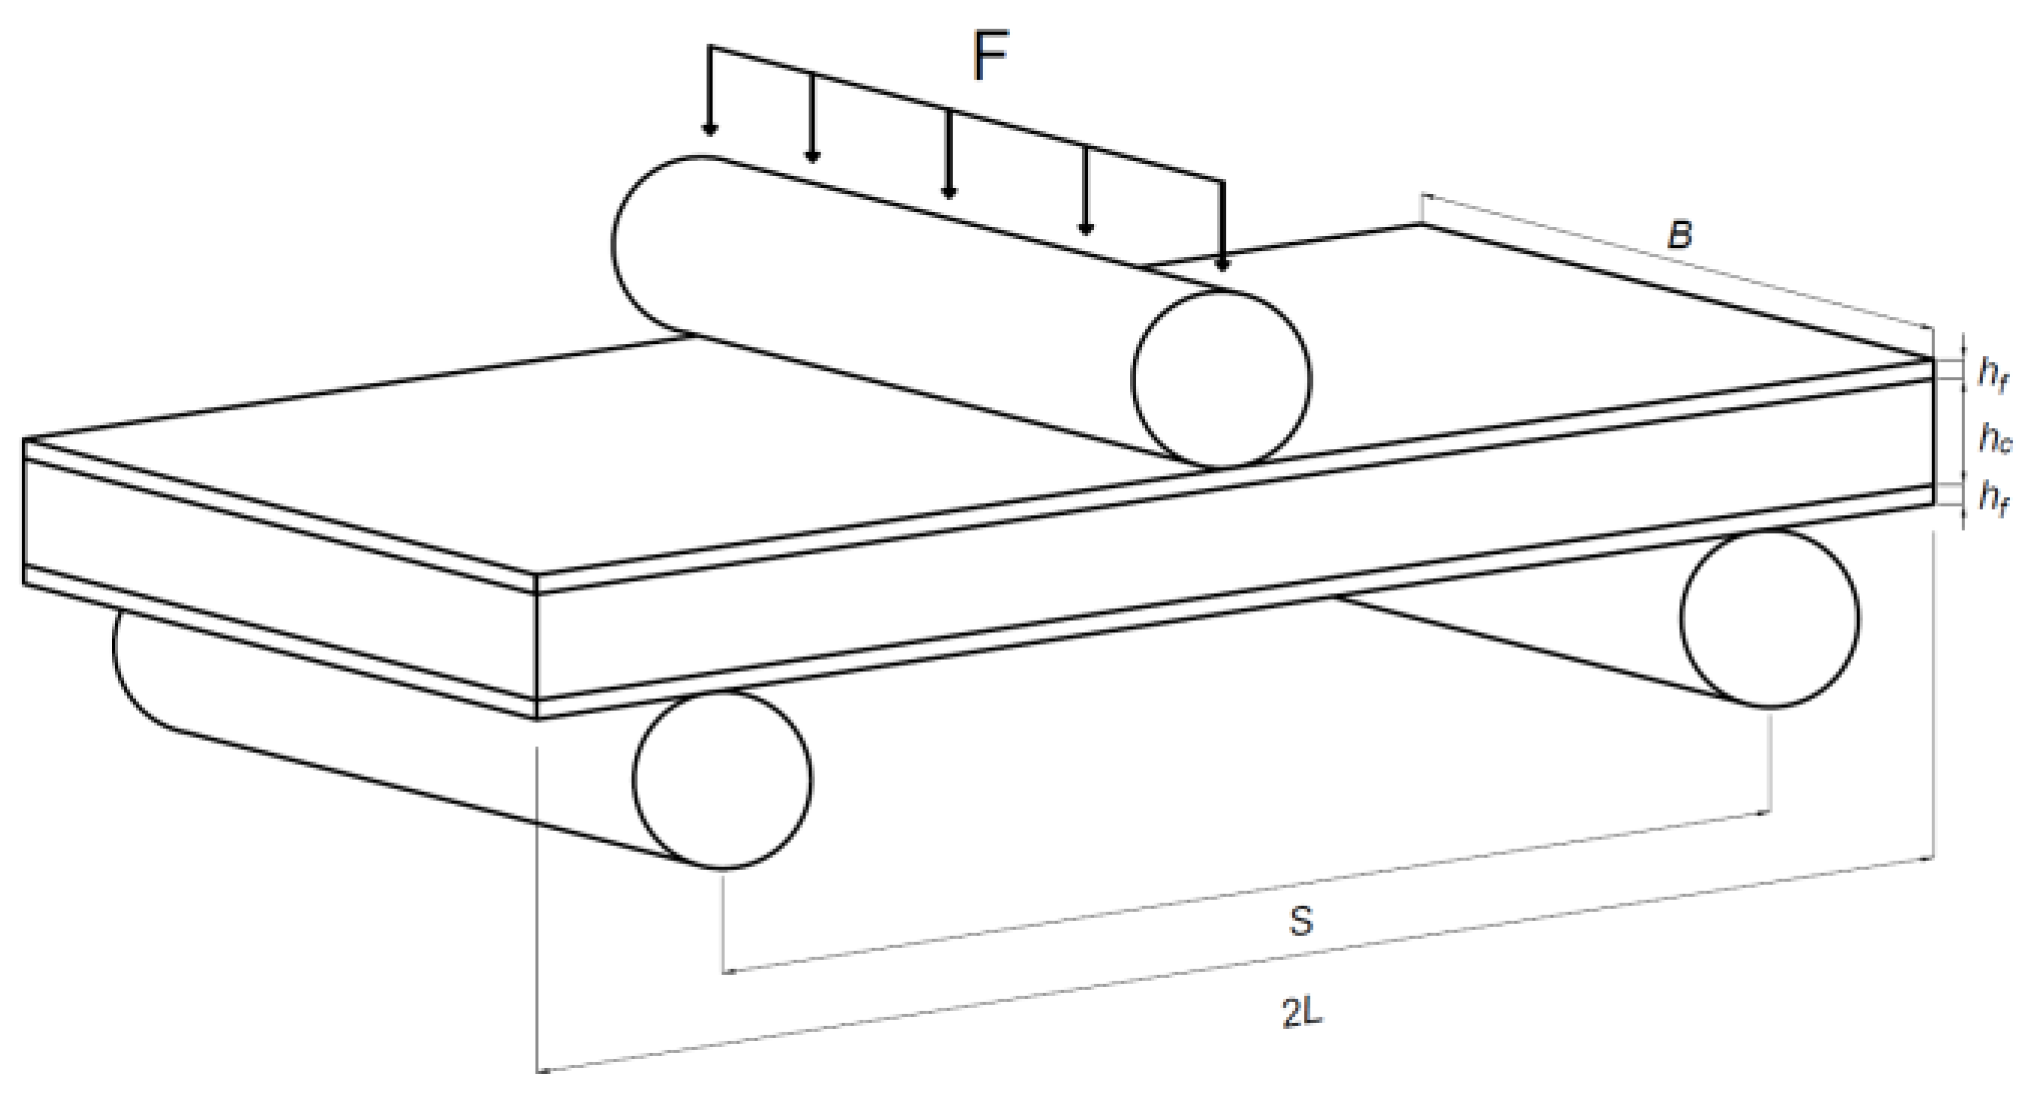
| 2L [mm] | S [mm] | B [mm] | hc [mm] | hf [mm] |
|---|---|---|---|---|
| 200 | 150 | 75 | 15 | 2.7 |
Disclaimer/Publisher’s Note: The statements, opinions and data contained in all publications are solely those of the individual author(s) and contributor(s) and not of MDPI and/or the editor(s). MDPI and/or the editor(s) disclaim responsibility for any injury to people or property resulting from any ideas, methods, instructions or products referred to in the content. |
© 2023 by the authors. Licensee MDPI, Basel, Switzerland. This article is an open access article distributed under the terms and conditions of the Creative Commons Attribution (CC BY) license (https://creativecommons.org/licenses/by/4.0/).
Share and Cite
Bragagnolo, G.; Crocombe, A.D.; Ogin, S.L.; Sordon, A.; Mohagheghian, I. Flexural Behaviour of Foam Cored Sandwich Structures with Through-Thickness Reinforcements. J. Compos. Sci. 2023, 7, 125. https://doi.org/10.3390/jcs7030125
Bragagnolo G, Crocombe AD, Ogin SL, Sordon A, Mohagheghian I. Flexural Behaviour of Foam Cored Sandwich Structures with Through-Thickness Reinforcements. Journal of Composites Science. 2023; 7(3):125. https://doi.org/10.3390/jcs7030125
Chicago/Turabian StyleBragagnolo, Ghilané, Andrew D. Crocombe, Stephen L. Ogin, Alessandro Sordon, and Iman Mohagheghian. 2023. "Flexural Behaviour of Foam Cored Sandwich Structures with Through-Thickness Reinforcements" Journal of Composites Science 7, no. 3: 125. https://doi.org/10.3390/jcs7030125