Article

Fabrication and Experimental Analysis of Bricks Using Recycled Plastics and Bitumen

by
Naveen Kumar Koppula
*,
Jens Schuster
and
Yousuf Pasha Shaik
Institute for Polymer Technology West-Palatinate, University of Applied Sciences Kaiserslautern, 66953 Pirmasens, Germany
*
Author to whom correspondence should be addressed.
J. Compos. Sci. 2023, 7(3), 111; https://doi.org/10.3390/jcs7030111
Submission received: 13 February 2023 / Revised: 5 March 2023 / Accepted: 8 March 2023 / Published: 10 March 2023
(This article belongs to the Special Issue Sustainable Composite Construction Materials)

Abstract

:
Plastic is being used increasingly in daily life. Most of it is not recyclable, and the remaining plastic cannot be used or decomposed. This causes increased plastic waste, contributing to global warming due to thermal recycling. The major objective of this research was to utilise the maximum plastic waste possible to manufacture bricks that compete with the properties of conventional bricks without affecting the environment and the ecological balance. A balanced mixture of high-density polyethylene (HDPE), quartz sand, and some additive materials, such as bitumen, was used to produce these bricks. Various tests were performed to assess the bricks’ quality, such as compression, water absorption, and efflorescence tests. These bricks had a compression strength of 37.5 MPa, which is exceptionally strong compared to conventional bricks. The efflorescence and water absorption tests showed that the bricks were nearly devoid of alkalis and absorbed almost no water. The obtained bricks were light in weight and cost-effective compared to conventional bricks.

1. Introduction

Plastic, a synthetic material made from various organic compounds with a high molecular mass, was first introduced in 1907 by Leo Baekeland [1]. Since then, it has changed numerous industries. During World War II, there was rapid growth in the plastic industry, as manufacturers could use plastic to replace products previously manufactured using natural resources. The best example was nylon, which replaced silk and was used for parachutes, helmets, and body armour; another was plexiglass, used as a substitute for glass in aircraft [2].
Over time, plastics replaced the use of traditional materials. It has become one of the essential materials in day-to-day life. Properties such as high strength, corrosion resistance, easily mouldability, waterproofness, and its ductile nature make it fit a wide range of applications. It is used in almost every sector, such as in electrical and electronic applications, packaging, logistics, and industrial machinery. More than 50% of plastic was produced after the year 2000. Most plastic is used for packaging [3].
Its production involves the polymerisation or polycondensation of natural materials, such as cellulose, coal, natural gas, salt, crude oil, minerals, and plants. It can be moulded into various shapes, sizes, and forms. It also possesses remarkable properties, such as lightness, durability, flexibility, and affordability, and is thus a popular choice over traditional materials, such as wood, natural fibres, rubber, and paper [4].
Despite having advantages, such as cheaper cost and ease of production, it affects the environment if not utilised properly. According to EEA, plastics have many other effects, including contributions to climatic change, and the report says that there is no control over the production and consumption of plastics [5]. There is a great need to develop a circular trend by inventing various recycling techniques. However, according to the Ellen MacArthur Foundation, only 14% of the plastic produced is recycled [6]. Every year, countries worldwide discard millions of tons of plastic waste. Less than 20% of waste plastic is recycled to make new plastics, while the remaining plastics are either disposed of in landfills or burnt or dumped [7]. The only way to minimise its impact is to stop using it; however, in the modern world, this is impossible due to excessive reliance on plastic items. Thus, one of the valuable solutions is to convert the available waste plastic into raw material for various new plastic goods, speeding up the recycling process.
Technically, all polymers are recyclable and can be used once or more to create an identical product [8]. However, it must be carried out in controlled conditions and requires high-end machinery and technology. This is not a feasible solution, because it harms the environment and makes industries unprofitable. Therefore, it is best to sort waste plastic according to its categorisation and qualities to extract recyclable plastic and use it to produce plastic products in the future. Because of the process-induced breakdown of the polymer chain, the properties of such recycled materials may differ from those of the original. These properties can be regained by adding the appropriate additives and strength-enhancing materials [9].
Researchers conducted experiments to investigate the optimal combination of raw materials, plastic, and sand to achieve maximum brick strength. These experiments involved varying proportions of the raw materials. One specific experiment conducted by Wahid et al. [10] utilised a mixture of sand, sand dust, and cement in a ratio of [9:9:4]. The mixture was then mixed with plastic waste in weights of 0%, 5%, 10%, and 15%. The highest compression strength observed was 12.4 N/mm2 when 0% plastic was used, and the strength decreased as the percentage of plastic increased. The reduction in strength was attributed to poor adhesion between the plastic waste and cement. Additionally, a longer curing time was required due to the significant volume of cement and sand. These findings suggest that plastic waste in brick production may not necessarily improve the strength of bricks, and further research is needed to optimise the proportions of the raw materials and curing process.
In an extension of the research of Wahid et al. [10], another researcher, Agyeman et al. [11], mixed plastic: quarry dust: sand ratios of 1:1:2 and 2:1:2 by weight. The resulting samples were then cured for seven days by being sprinkled with water. The bricks produced from these mixtures were tested for their compressive strengths and water absorption rates. It was found that the bricks produced from the 1:1:2 mixture had a compressive strength of 6.07 N/mm2 and a water absorption rate of 4.9%, while the bricks produced from the 2:1:2 mixture had a higher compressive strength of 8.53 N/mm2 and a lower water absorption rate of 0.5%.
As per Circular Action Hub (CAH) [12], mixing recyclable plastics with sawdust, concrete, mud, or sand can replace conventional building materials. High-density polyethylene is one of those recyclable plastics. Typically, HDPE produces storage containers for milk, shampoo, oil, and chemicals. It is comparatively more stable and emits fewer hazardous gases, and is thus acceptable for recycling under certain controlled circumstances. Globally, about 40 million tonnes of HDPE waste are generated [13].
High mechanical strength, transparency, non-toxicity, no effect on taste, and permeability that may be disregarded for carbon dioxide are all characteristics of HDPE plastic. In addition to being transparent, processable, colourable, and thermally stable, HDPE plastic is chemically resistant, tensile, and impact-resistant [14].
The polyethylene grade with the most stiffness and least flexibility is HDPE. It works well for various uses, such as garbage cans and everyday home items, including miniature bottles and clothespins. This non-toxic, lightweight material can replace less eco-friendly materials because it is readily recyclable [15].
An analysis conducted by Sahani et al. [16] found that recycling plastic waste in manufacturing bricks and tiles is an effective way to reduce waste. The study suggested that when plastic and sand are combined in the proper ratio, the resulting bricks have a higher compression strength than traditional clay bricks. The highest compression strength was achieved with a plastic-to-sand ratio of 1:4, valued at 12.28 N/mm2. However, as the amount of plastic in the mixture decreased, the compression strength also decreased.
The research of Kulkarni et al. [17] shows that HDPE plastics have a higher compression strength of 14.6% than conventional bricks, with a brick wall’s ultimate load-carrying capacity being 197.5 KN. This means they can be used to build structures supporting higher loads. According to Maneeth et al. [18], bitumen acts as a binder and enhances the strength of the bricks because of its stability and density. However, as the bitumen percentage increases, the compression strength declines from 10 N/mm2 to 2.04 N/mm2, with the ideal bitumen percentage being 2%. According to Benny T.K. et al. [19], bitumen-added bricks have a hydrophobic property that prevents water from infiltrating them. They also have a higher compression strength than standard bricks, with a compression loading of 120 KN. In this way, large amounts of waste can be used without affecting the environment and reducing the cost of construction.
This publication aims to manufacture plastic sand bricks using bitumen and find the optimum percentages of plastic and sand for producing bricks with higher compression strength and a lower water absorption rate than conventional bricks.

2. Materials and Methods

2.1. Materials Used

2.1.1. HDPE Plastics

High-density polyethylene (HDPE) is usually derived from petroleum. HDPE is a low-cost thermoplastic material that performs well for low- and medium-technical applications. It is used to produce various products, such as pipelines, milk jars, cutting boards, and plastic bottles. HDPE does not crack under stress due to its very ductile behaviour. Table 1 shows the properties of HDPE.

2.1.2. Sand

High-quality, naturally occurring quartz stone that has been carefully chosen and finely processed is used to make the high-purity quartz sand (SiO2 ≥ 99.5–99.9%, Fe2O3 ≤ 0.001%). High-purity quartz sand produces glass, refractories, ferrosilicon flux, ceramics, grinding materials, and casting-moulding quartz sand. It has significant anti-acid medium-erosion properties for making concrete that is resistant to acid [21].
The particle size range of 0.1–0.3 mm was selected for the experiment. Quartz sand chemically resistant, and because it has a higher melting temperature than metals, it is used as a foundry sand and can be used for manufacturing bricks. Table 2 shows the properties of quartz sand. Quartz sand was purchased from OBI Markt, Kaiserslautern, Germany.

2.1.3. Bitumen

Bitumen is mainly used for construction because of its higher binding characteristics; it is less costly compared to other binding materials. Bituminous materials have adhesive properties, are soluble in carbon disulphide, and are mostly made of high-molecular-weight hydrocarbons produced by distilling petroleum or asphalt [23]. Bitumen is also known for its binding properties. In this experiment, different percentages of bitumen (1%, 2%, and 3%) were considered. Table 3 shows the properties of bitumen. Bitumen was purchased from BAUHAUS, Ludwigshafen, Germany.

2.2. Methodology

2.2.1. Mould Design

A rectangular aluminium mould with (230 × 120 × 150) mm dimensions was manufactured. There were four side plates, a base plate, and a top plate on the brick mould. Figure 1 illustrates the cutting of four plates with a thickness of 10 mm and dimensions of 230 mm × 150 mm. Since it was positioned on a flat surface, the base plate’s thickness was reduced to 5 mm, significantly reducing the possibility of deflection. In order to make it simple to apply pressure to the molten mixture and facilitate the easy removal of the brick, the top plate was fastened with a knob-shaped component. An Allen key of 8 mm was used to assemble the plates after they were drilled with 8 mm holes.

2.2.2. Plastics Collection

Initially, used HDPE containers/bottles were collected and cleaned with warm water. Next, the HDPE waste was dried to enable further processing without any moisture content. These plastics were then broken down into smaller pieces using a shredding machine containing a series of rotating blades that cut the plastic containers/bottles into small pieces. The sizes of these pieces ranges from 1 mm to 5 mm. To produce the desired brick, these plastics were then melted with sand.

2.2.3. Quartz Sand and Bitumen

A small quantity of bitumen was added as a binding agent to increase the strength of the brick, induce better bonding of granules and cover any voids. Different amounts of bitumen were added to the sample to determine the maximum strength (0%, 1%, 2%, and 3%). The mixing ratios of plastic and sand were varied (3:1, 3:2, 1:1, 2:3, and 1:3). The mixture was then heated using a kneader to firmly bond the plastic and sand.

2.2.4. Shredding and Mixing

The mixture was heated in the kneader until the plastic melted and firmly bonded with the sand. The kneader was operated at a temperature of 180 °C and a rotational speed of 40 rpm. The resulting lump immediately solidified and hardened, making melting in a hot press difficult. These lumps were subsequently granulated into tiny particles using a grinder. The mixture was then poured into a mould of the appropriate size and set in the hot press. It was left for about an hour at a temperature of 300 °C, which was higher than the melting point of the plastic. As the plastic granules began to melt, pressure was applied (about 15 bar) to the top plate of the brick to obtain the desired shape and thickness. The specimens were subjected to a compressed force of 1 kN to make the material more compact and reduce the number of voids. The pressure was applied during the cooling down of the press tool to ambient temperature. As a result of the rapid cooling, the bending of the brick could be observed after demoulding.

2.3. Test Equipment and Test Parameters

2.3.1. Compression Tests

The compression strength of the plastic bricks was tested using the DIN EN ISO 604. Twenty bricks were tested in total. Because of their ductile nature, the bricks were cut into 10 mm × 10 mm × 10 mm pieces and tested on a compression machine. The load was applied until the brick broke or showed deformation. The test was performed on a Universal Testing Machine with a maximum force of 100 kN at a speed of 1 mm/min. The ultimate stress at which the brick deformed or broke was noted, and the compressive strength was calculated using the formula shown in Equation (1).
Compression   strength = P A
with
P as the maximum load [kN] and
A representing the area of the specimen [mm2].

2.3.2. Water Absorption Tests

The test was used to determine the amount of water absorbed by the brick. The quality of the brick was determined by its water absorption rate, with a lower water absorption rate considered the best. The bricks were heated to remove any moisture content. The weight of the dry brick was noted as W1. The brick was then fully immersed in water and undisturbed for 24 h. After 24 h, the brick was removed from the water and gently wiped with a cloth. The weight of the wet brick was noted as W2. The percentage of water absorbed was calculated using the formula shown in Equation (2).
Water   absorption = W   W 1 W 1 100 %   ,
with
W being the weight of the dry brick [kg]
W1 being the weight of the wet brick [kg]

2.3.3. Efflorescence Test

The test was used to determine the presence of hazardous alkalis in bricks. A circular vessel was used, and enough water was added for testing. The immersion depth was 25 mm. The bricks were then soaked in distilled water for 24 h. After 24 h, the bricks were removed from the vessel and dried for the same period. A high-quality brick should not possess any alkalis on the bricks and should be free of soluble salts. If alkalis were present on the bricks, efflorescence might occur, resulting in a layer forming. Table 4 shows the percentage of alkali presence.

2.3.4. Test to Determine the Relative Rise in Temperature

The test aimed to determine how much the temperature would increase on one side of a brick when the other side was in direct contact with a heat source. A simple setup was created, with the brick as a dividing wall. An electric induction plate was used and heated to a temperature of 410 °C. One side of the brick was placed next to the plate, while the other was exposed to room temperature. The brick was heated for three minutes, resulting in an increase in the temperature. After three minutes, the temperature on both sides of the brick was measured, and the relative rise in temperature was calculated.

3. Results

3.1. Compression Test

The test was carried out at a speed of 1 mm/min using a Universal Testing Machine (UTM). A total of five brick samples were taken, consisting of 20 bricks in total. The following results were obtained. The stress values were recorded when the strain value was 0.2, which is acceptable in most applications.

3.1.1. Brick Sample 1 (Plastic:Sand—3:1)

Figure 2a shows that the bricks with more plastic (i.e., a plastic-to-sand ratio of 3:1) had higher compression strengths. When 0% bitumen was added, the strength of the brick was 22.08 MPa; when bitumen was added, the values varied between 26.6 MPa and 33.46 MPa, with 2% (9 g bitumen) being the optimal amount; and as bitumen was removed, the value fell to 31.8 MPa. The highest strength was attained at an optimal bitumen percentage of 2% (i.e., 9 g bitumen).

3.1.2. Brick Sample 2 (Plastic:Sand—3:2)

The bricks with a plastic-to-sand ratio of 3:2 produced the best results among all other bricks, with each brick having a compression strength that was almost higher than that of other bricks, as seen in Figure 3a. The value of the compression strength was 22.7 MPa if no bitumen was applied, and it grew further when bitumen was deposited, rising to 28.7 MPa and reaching a maximum of 37.5 MPa, before decreasing to 33.9 MPa as additional bitumen was added, with the optimum being 2% (i.e., 9 g bitumen).

3.1.3. Brick Sample 3 (Plastic:Sand—1:1)

The bricks with the same percentage of plastics and sand showed average results compared to those with more plastics. Figure 4a indicates that the brick without bitumen had a compression strength of 19.39 MPa. Adding bitumen by 4.5 g and 9 g increased the value to 24.28 MPa and 29.18 MPa. The strength again dropped to 27.82 MPa as the bitumen content was increased to 13.5 g.

3.1.4. Brick Sample 4 (Plastic:Sand—2:3)

From Figure 5a, the results of the bricks with a lower plastic percentage (i.e., plastic: sand—2:3) showed less strength compared to the bricks with an equal plastic–sand ratio and the bricks with more plastic, with the highest strength being 26.49 MPa for 9 g bitumen and decreased to 25.6 MPa when the bitumen was increased again to 13.5 g.

3.1.5. Brick Sample 5 (Plastic: Sand—1:3)

Out of all the bricks, the bricks with the lowest percentage of plastic (i.e., 25%) exhibited very low compression strength even when bitumen was added, which had a strength of 25.36 MPa for 9 g bitumen and the lowest being 16.8 MPa with no bitumen, as seen in Figure 6a. Even in this case, the strength declined as bitumen content increased.
Compression strength was found to be greater in samples with 60 percent plastic, so the mean stress of these samples was calculated. The bricks were initially tested for compression, and five observations were recorded. The stress values were added and divided by the number of observations to determine the mean stress. The standard deviation was also calculated to understand the range and distribution of compression stress values. Table 5 shows the mean value of compression stress. Figure 7 shows the standard deviation values.

3.2. Water Absorption Test

The test was carried out by the weighing of all 20 bricks in their dry state. The weights were measured, and the bricks were submerged in water for 24 h, as shown in Figure 8a. The weights of all 20 bricks were noted after 24 h, as shown in Figure 8b. The water absorption was calculated using Formula (2). It was evident from the graph that plastic bricks had a lower water-absorption rate. Bricks with more plastics (i.e., a ratio of 3:1 plastic to sand) tend to absorb less water than bricks with fewer plastics (i.e., a ratio of 1:3). When the plastic content was higher in the bricks; there was less chance of water molecules filling the voids in the plastic–sand mixture. All plastic bricks had an overall water absorption rate of less than 1%. Figure 9 shows the water absorption rate on different composition of plastic bricks.

3.3. Efflorescence Test

The efflorescence test showed impressive results on plastic bricks with zero presence of alkalis on almost all of the bricks. Bricks with a lower percentage of plastics had fewer alkalis, whereas bricks with a higher percentage had no significant alkalis. For bricks made of 1:3 plastic and sand, all of the bricks exhibited a small number of alkalis. However, bricks made of 3:1 and 3:2 plastic showed excellent results, with no alkalis or other white particles. Table 6 shows the severity of the alkali presence on the bricks.

3.4. Test to Determine the Relative Rise in Temperature

This test was used to determine the relative rise in temperature by placing the bricks on a heat source. The temperature differential between the two faces of the bricks with different plastic compositions was depicted in the table. The temperature difference increased as the amount of plastic increased, indicating that heat conduction decreased. This was a result of plastics having a lower heat conductivity than sand. The study involved testing samples that did not contain bitumen to measure the temperature that rose on one side of the brick when the other side was exposed to heat. This test aimed to evaluate the thermal conductivity of the brick material. The bitumen in plastic sand bricks can make them soft and malleable at elevated temperatures. However, this was not a factor in this test, since the samples being tested did not contain bitumen. Additionally, the bitumen used in these plastic sand bricks was typically relatively small (i.e., 1%, 2%, 3%) and did not significantly contribute to temperature rise. The test was conducted over a relatively short period (i.e., 3 min). As a result, the temperature difference observed between the various samples was comparatively small. If the testing time is prolonged, the brick will eventually melt, leading to an uneven surface area at the source. This can result in inaccurate temperature measurements on the other side of the brick.

4. Discussion

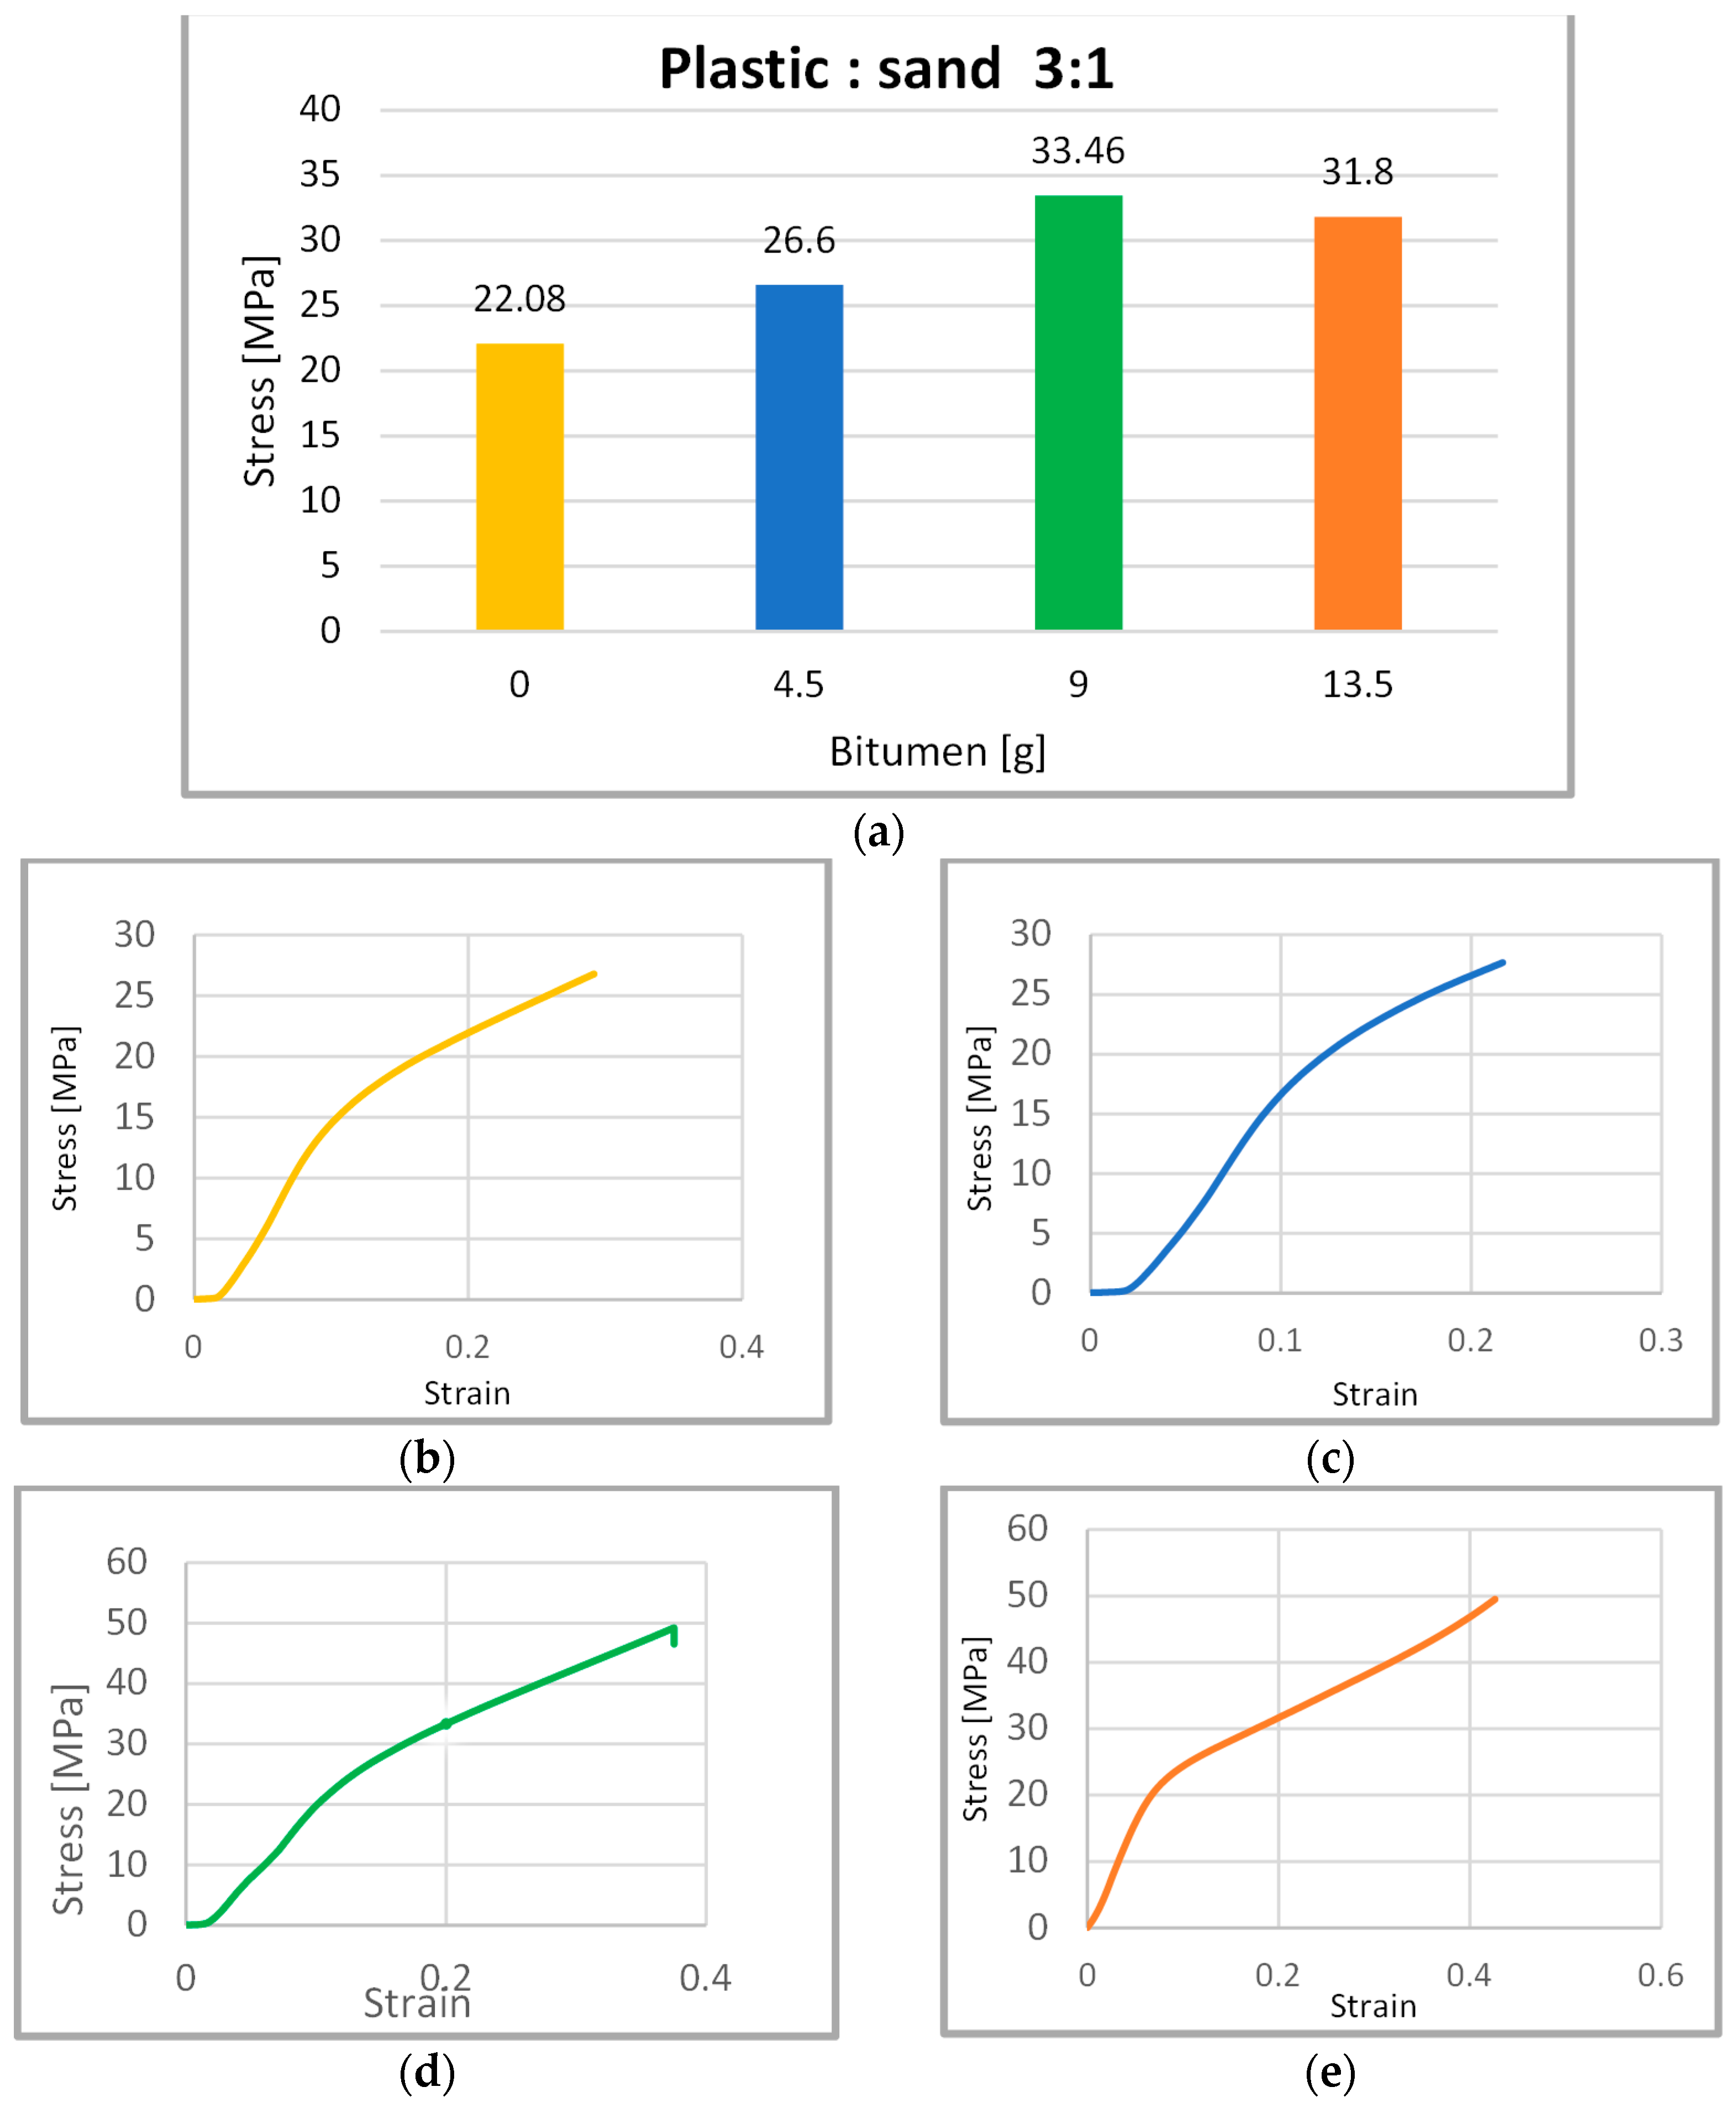
The idea of using HDPE bricks instead of standard bricks was to turn waste plastic into a usable product. Using a novel manufacturing process, the primary goal of the study was to determine the ideal plastic-to-sand ratio. Brick samples can be prepared by varying the proportion of plastic in the mixture. The proportions considered were 75%, 60%, 50%, 40%, and 25% by weight. In samples where 75% plastic was used, bitumen was added in proportions of 1%, 2%, and 3% by weight. It was observed that the compression stress of the bricks increased gradually as the amount of bitumen was increased until it reached a maximum stress of 33.46 MPa. However, if the amount of bitumen added exceeded 2%, the bricks became softer. This can be observed in Figure 2a, where the stress value is decreased to 31.8 MPa. Due to its good adhesive property, bitumen was used to increase the strength of the bricks, even though the plastic in the mixture was sufficient to bind the sand. However, excessive amounts of bitumen had a negative impact on the quality of the bricks.
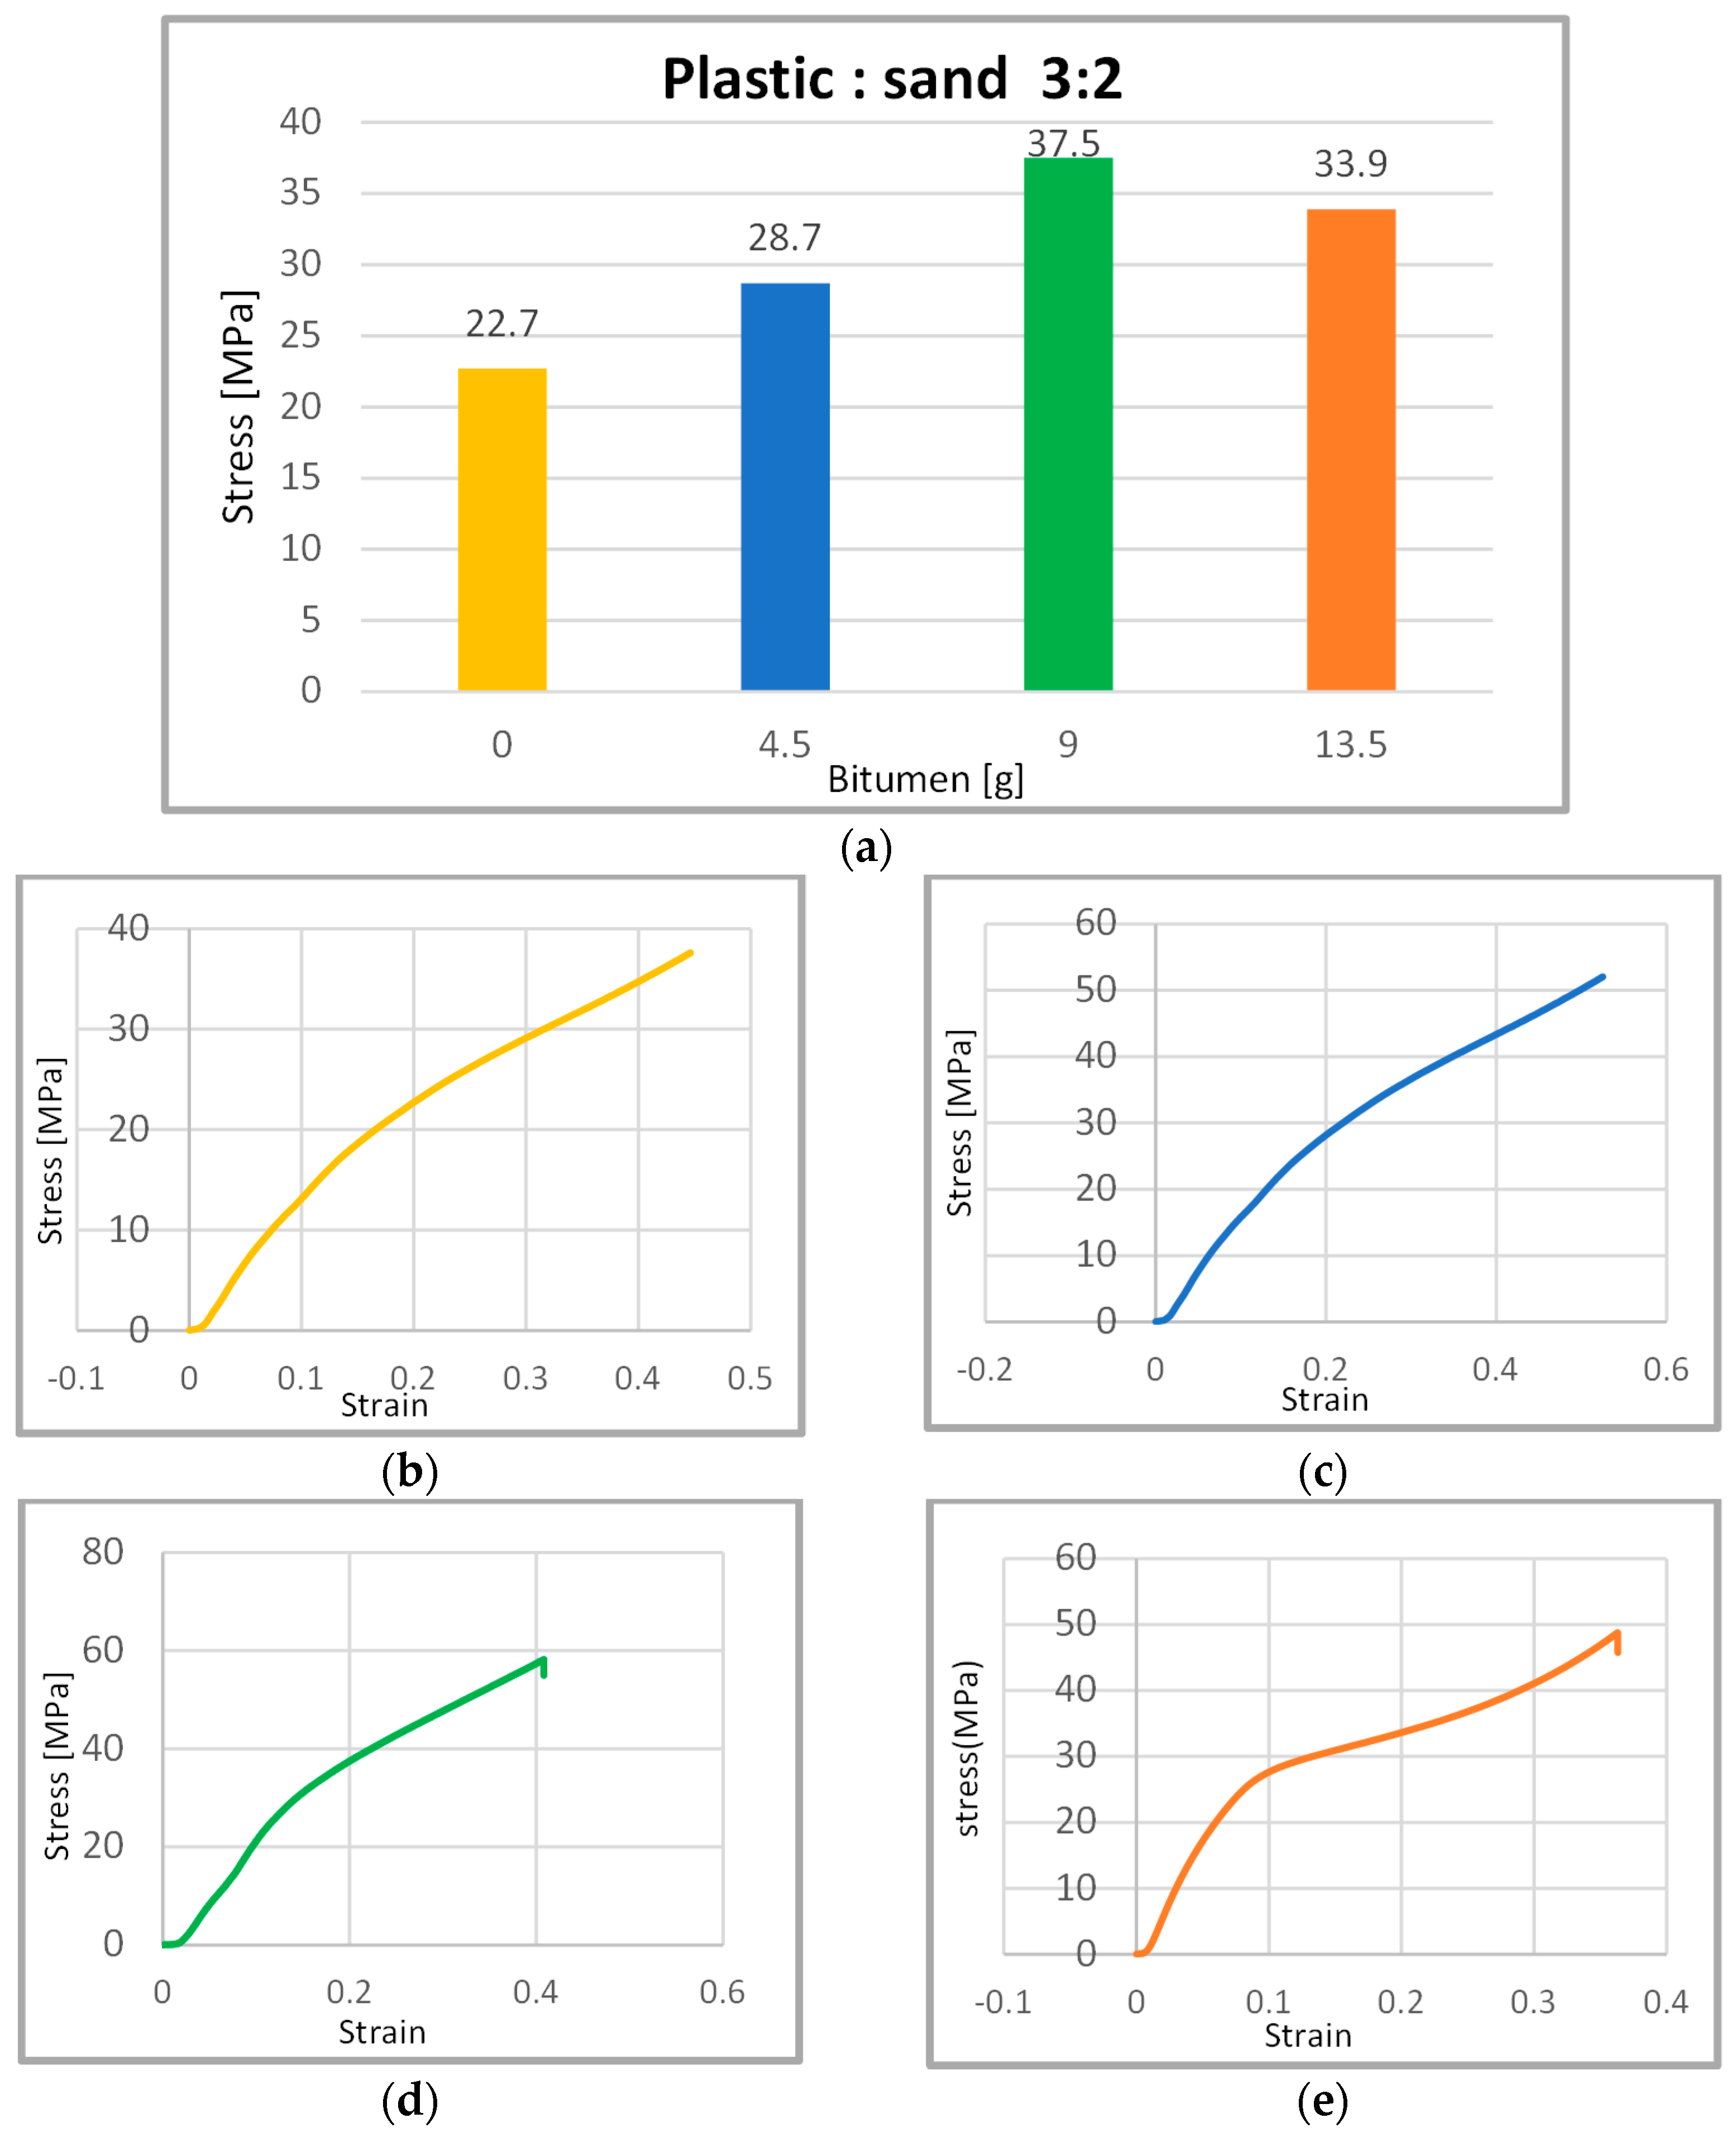
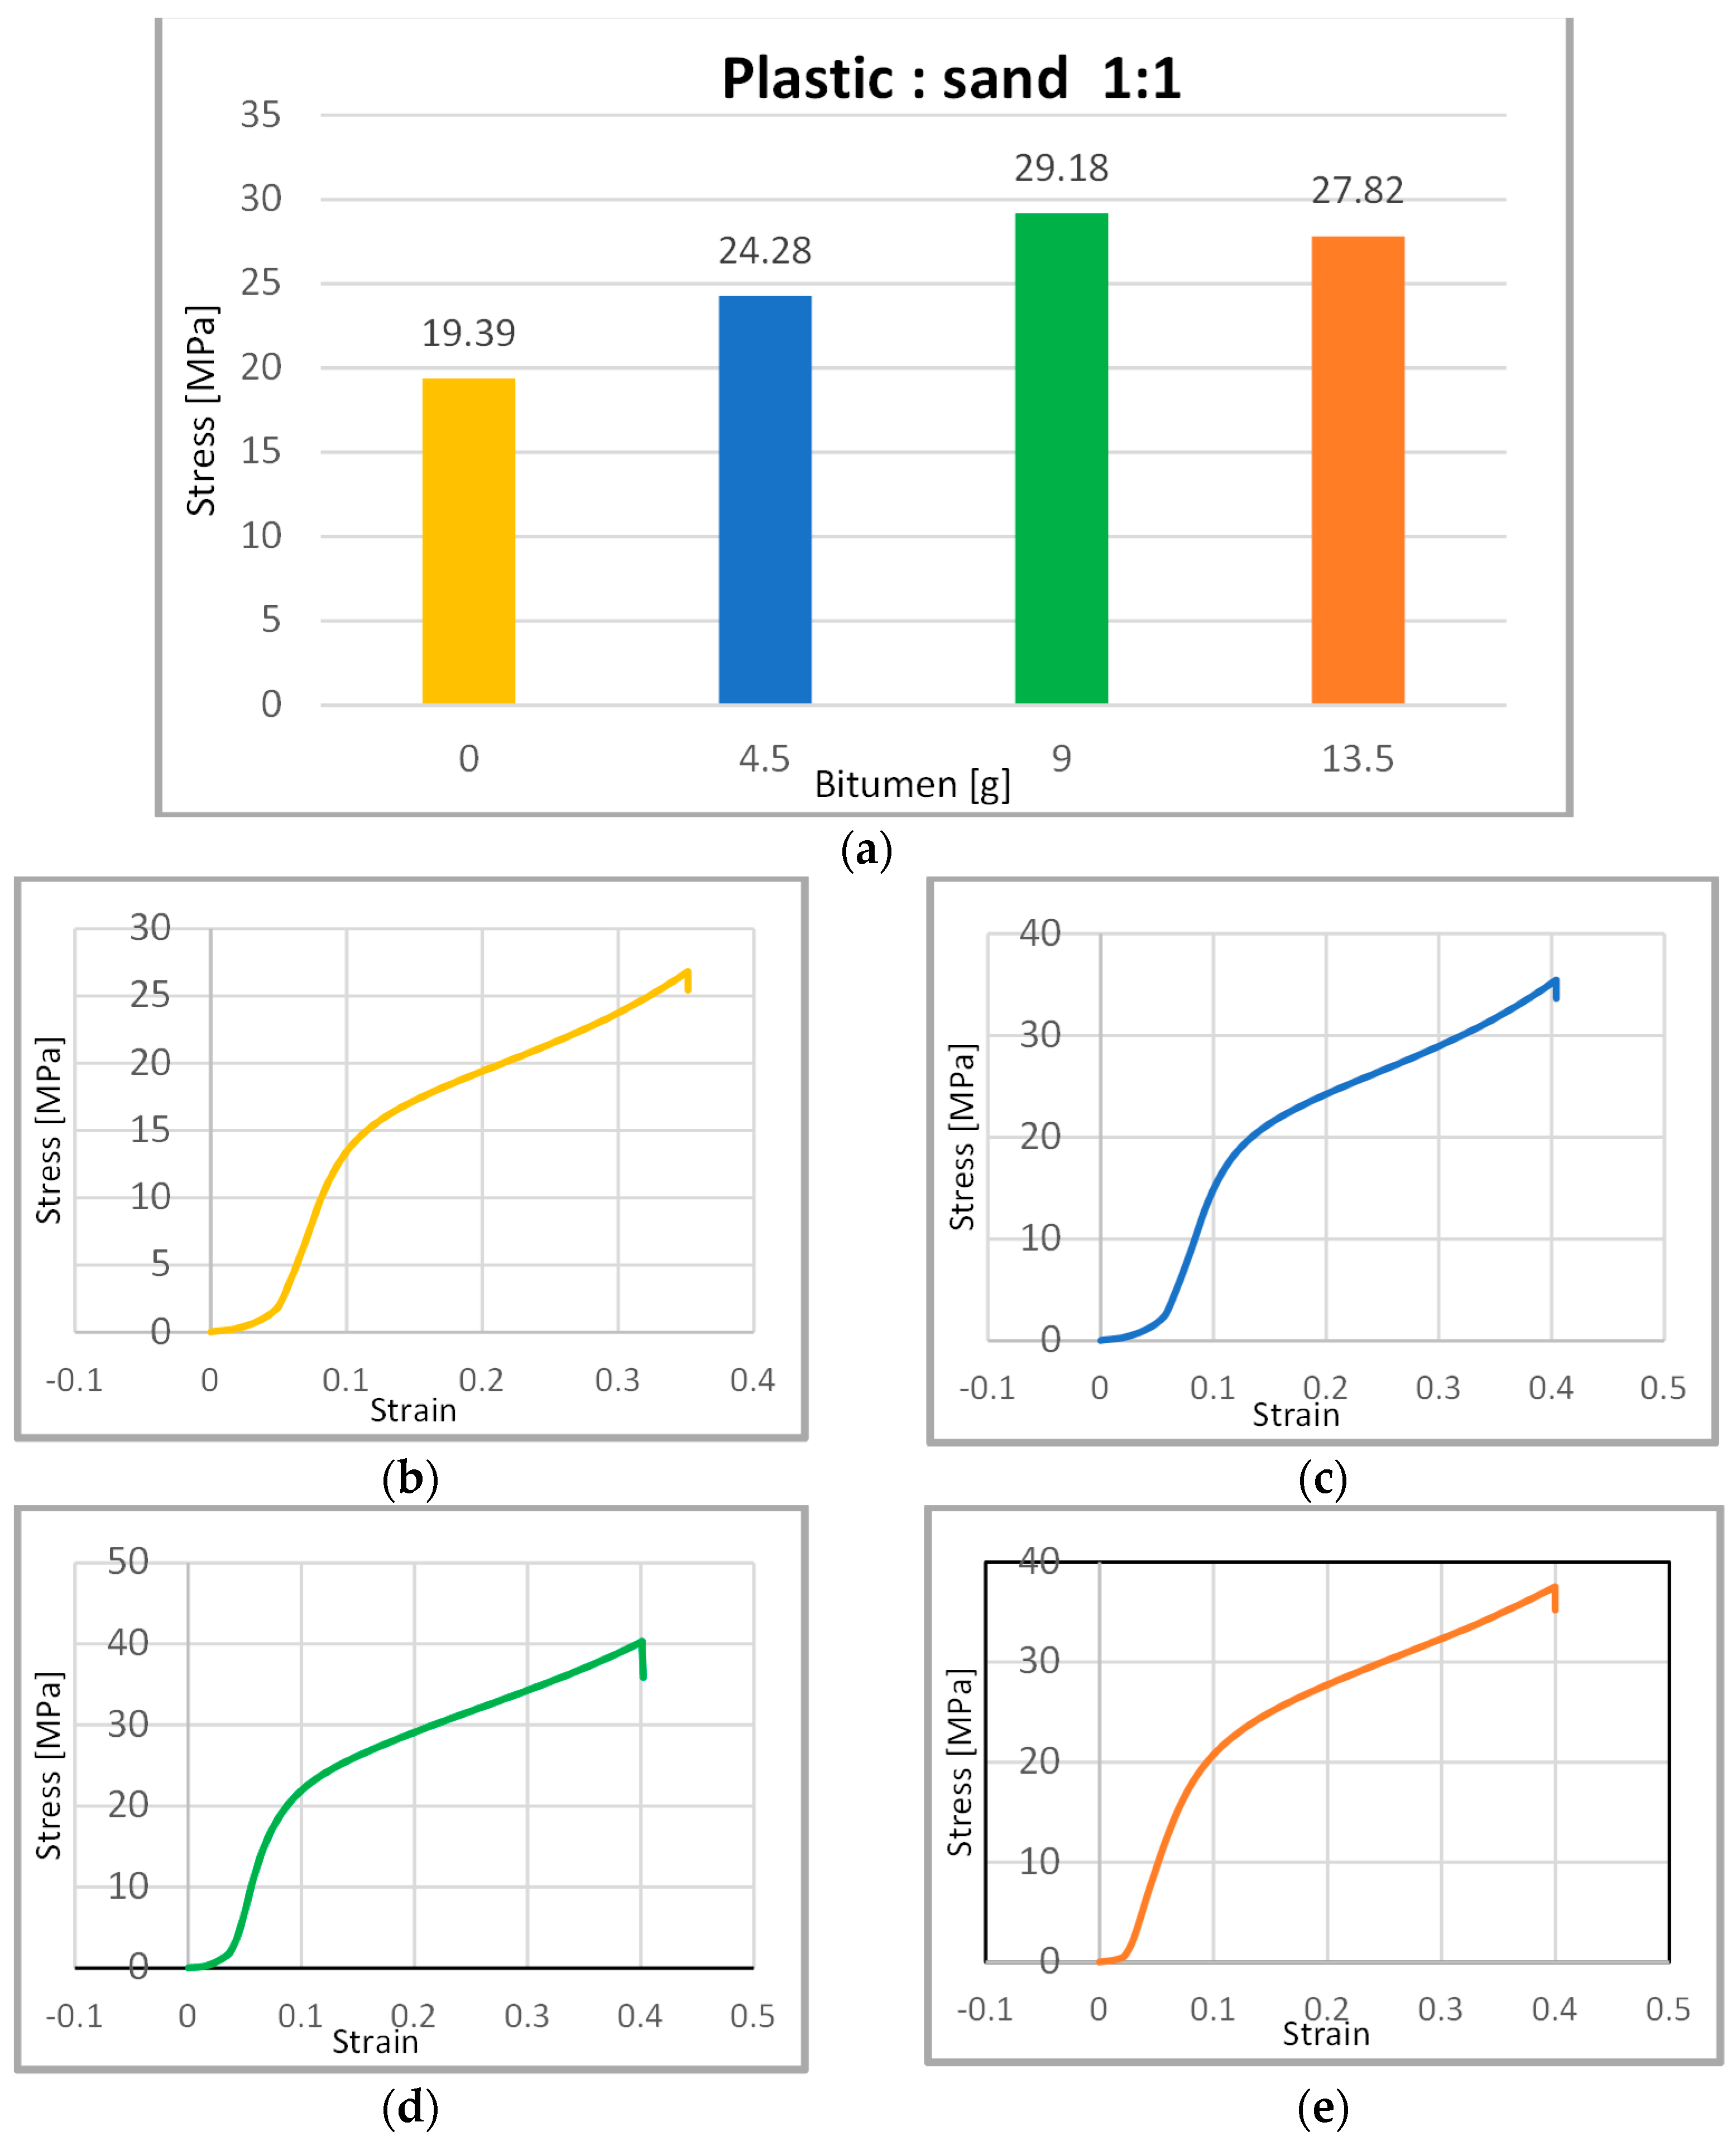
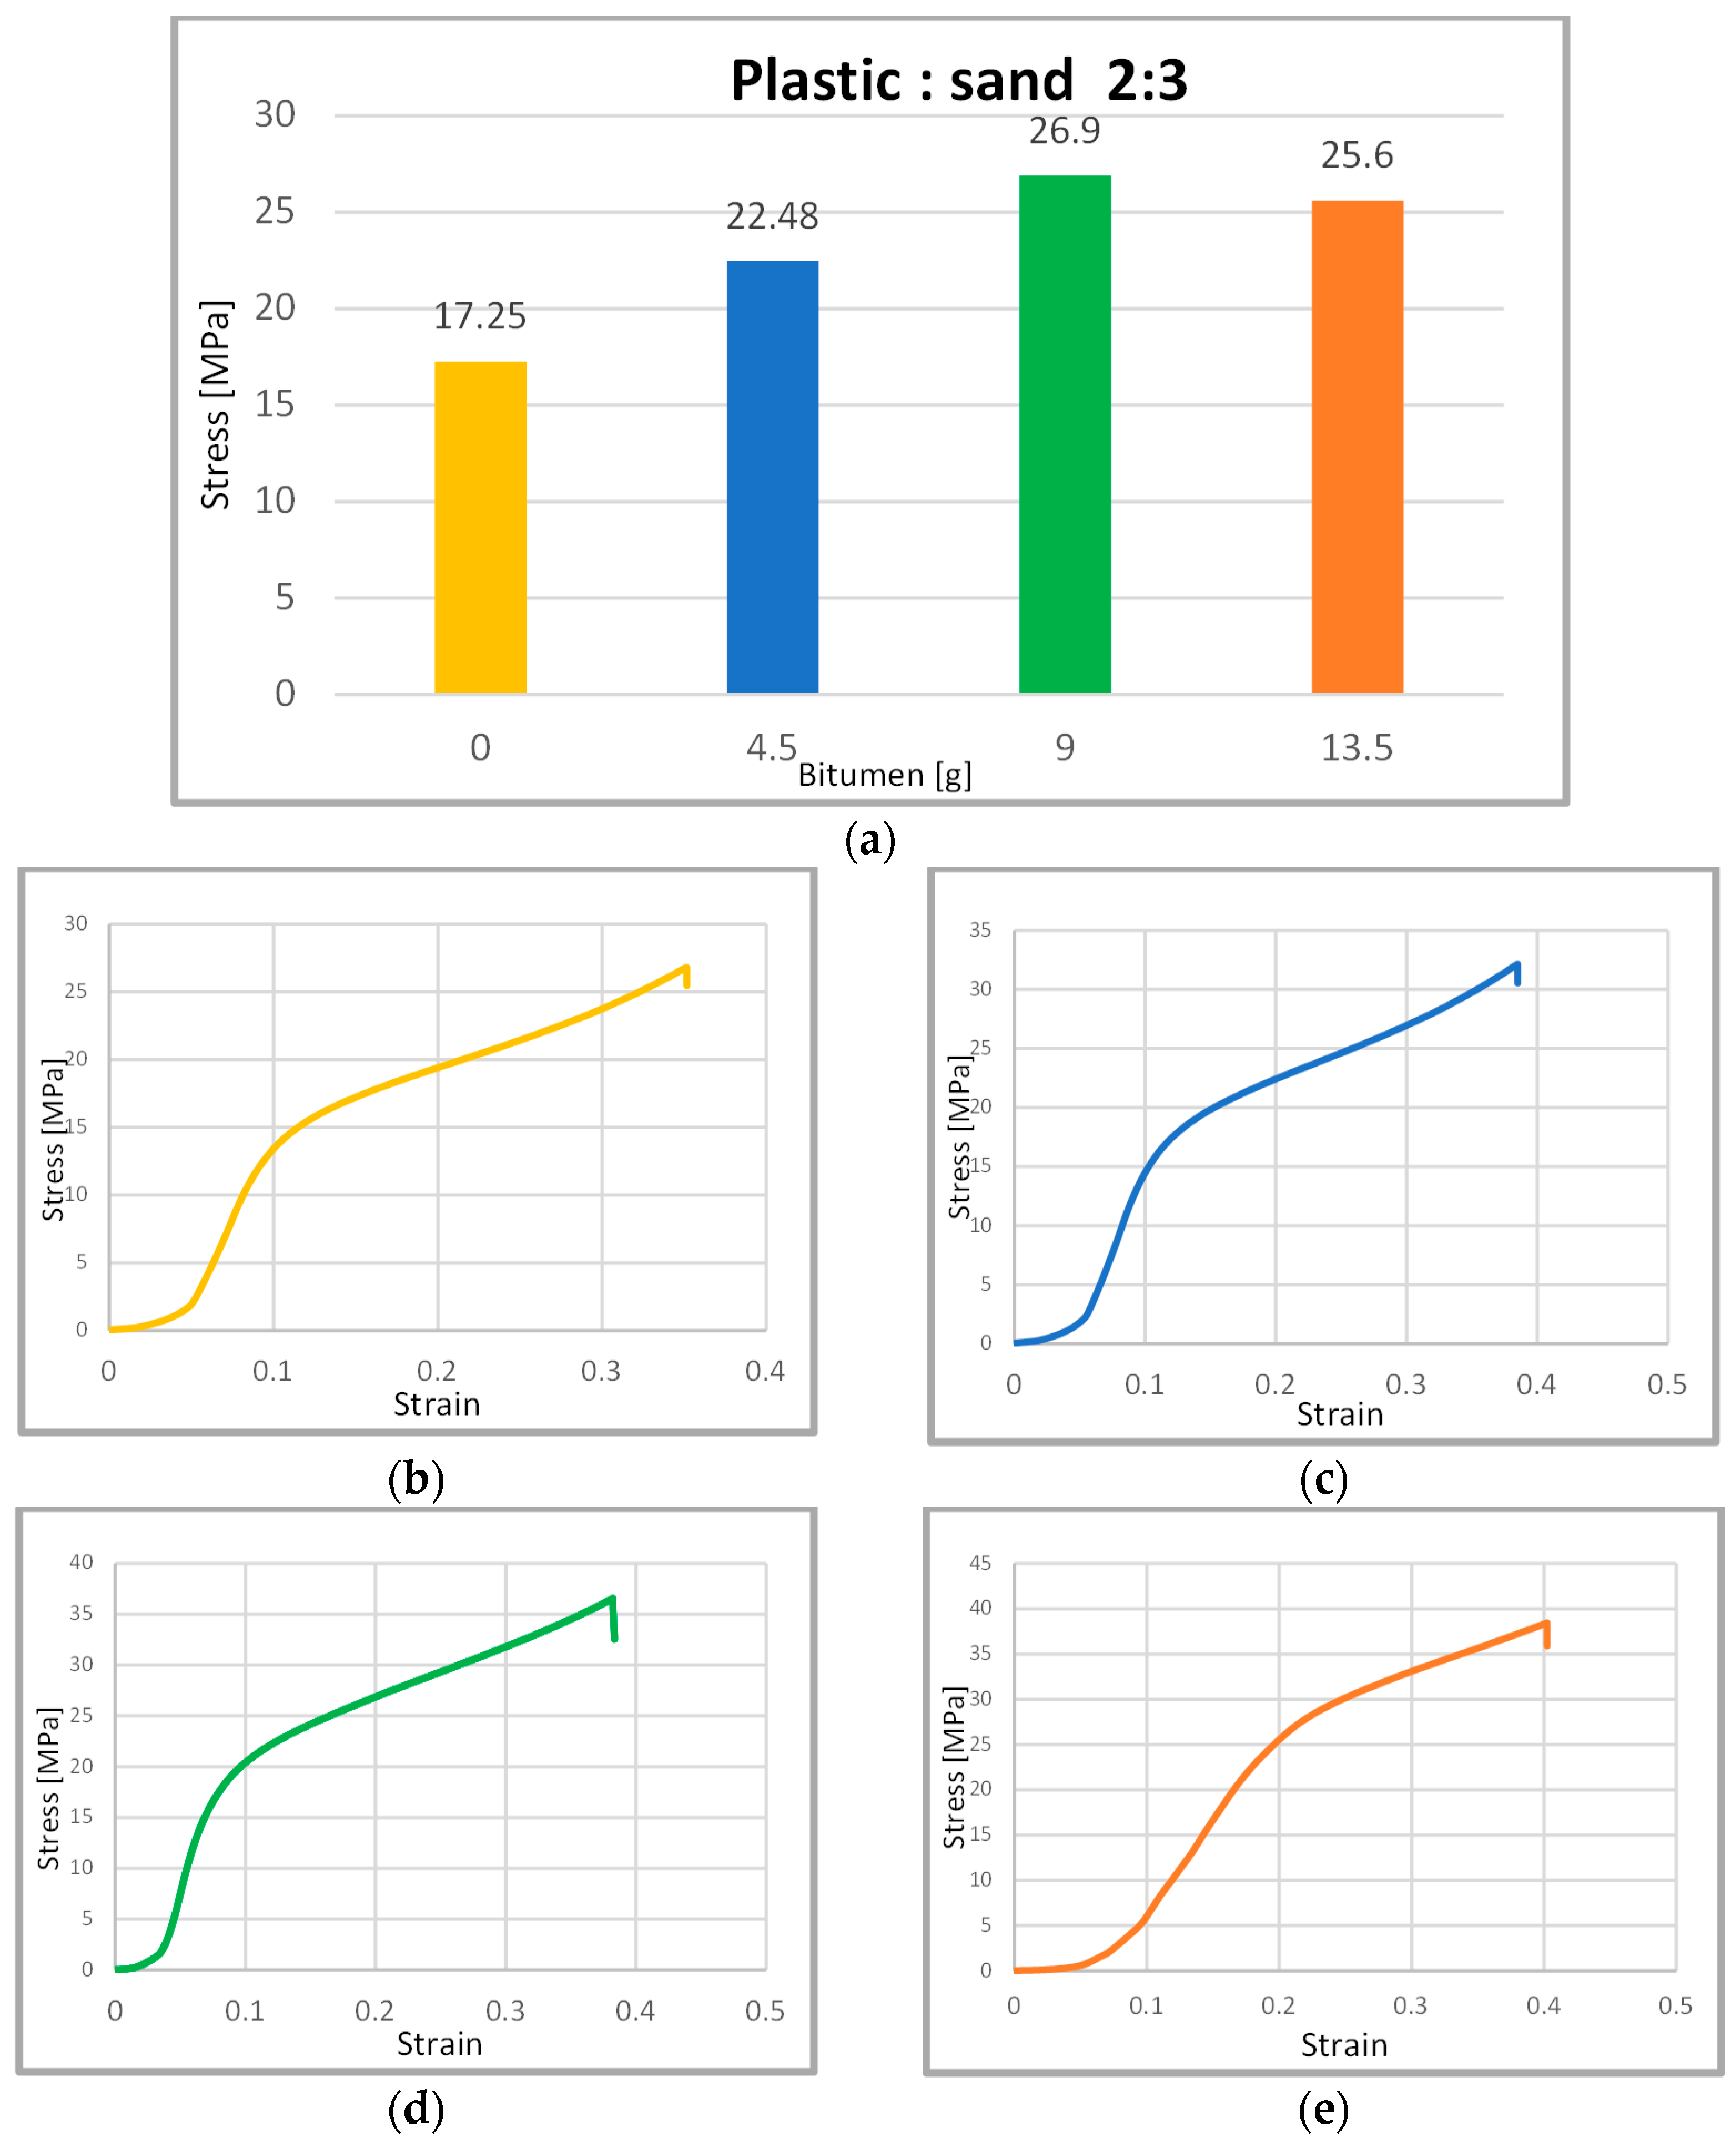
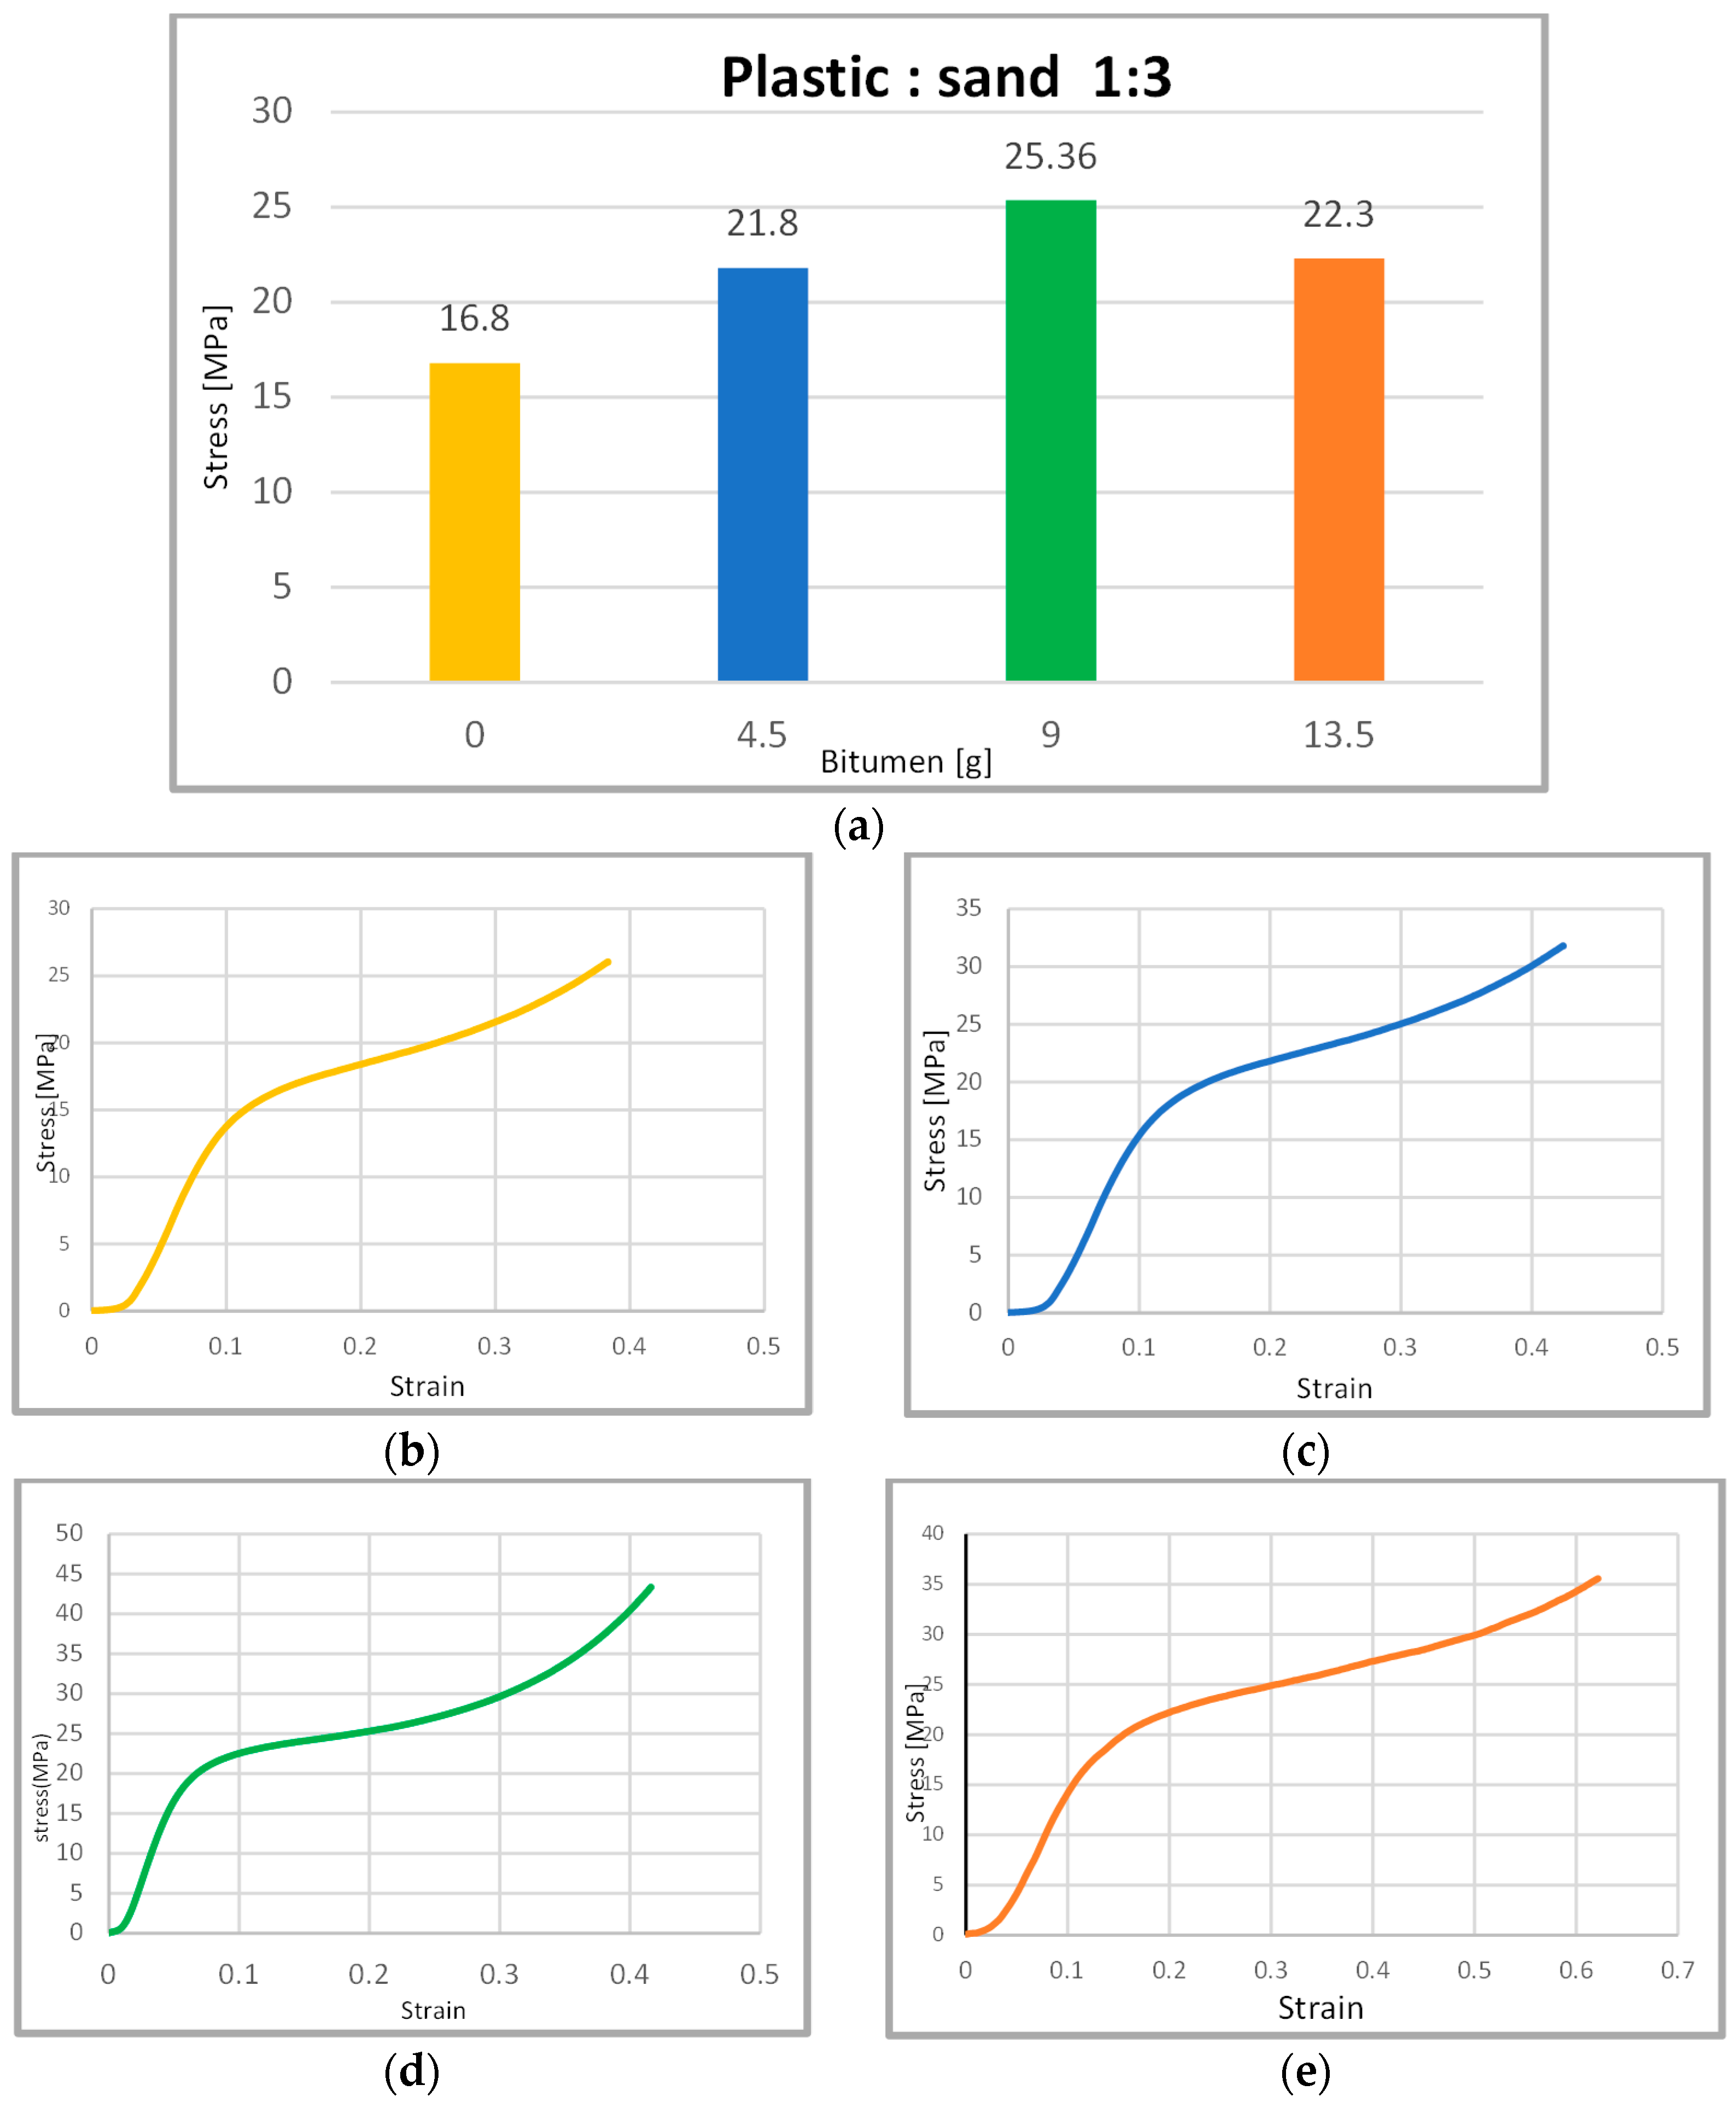
It was observed that the strength of bricks could be improved by varying the proportion of plastic used in the mixture. Specifically, when the amount of plastic was reduced by 15%, the stress values increased from 21.2 MPa to 22.6 MPa. The stress values decreased to 16.25 MPa when the amount of plastic was further reduced to 25%. Moreover, when 9 g of bitumen was added to a sample containing 60% plastic, the stress values reached a maximum of 37.5 MPa.
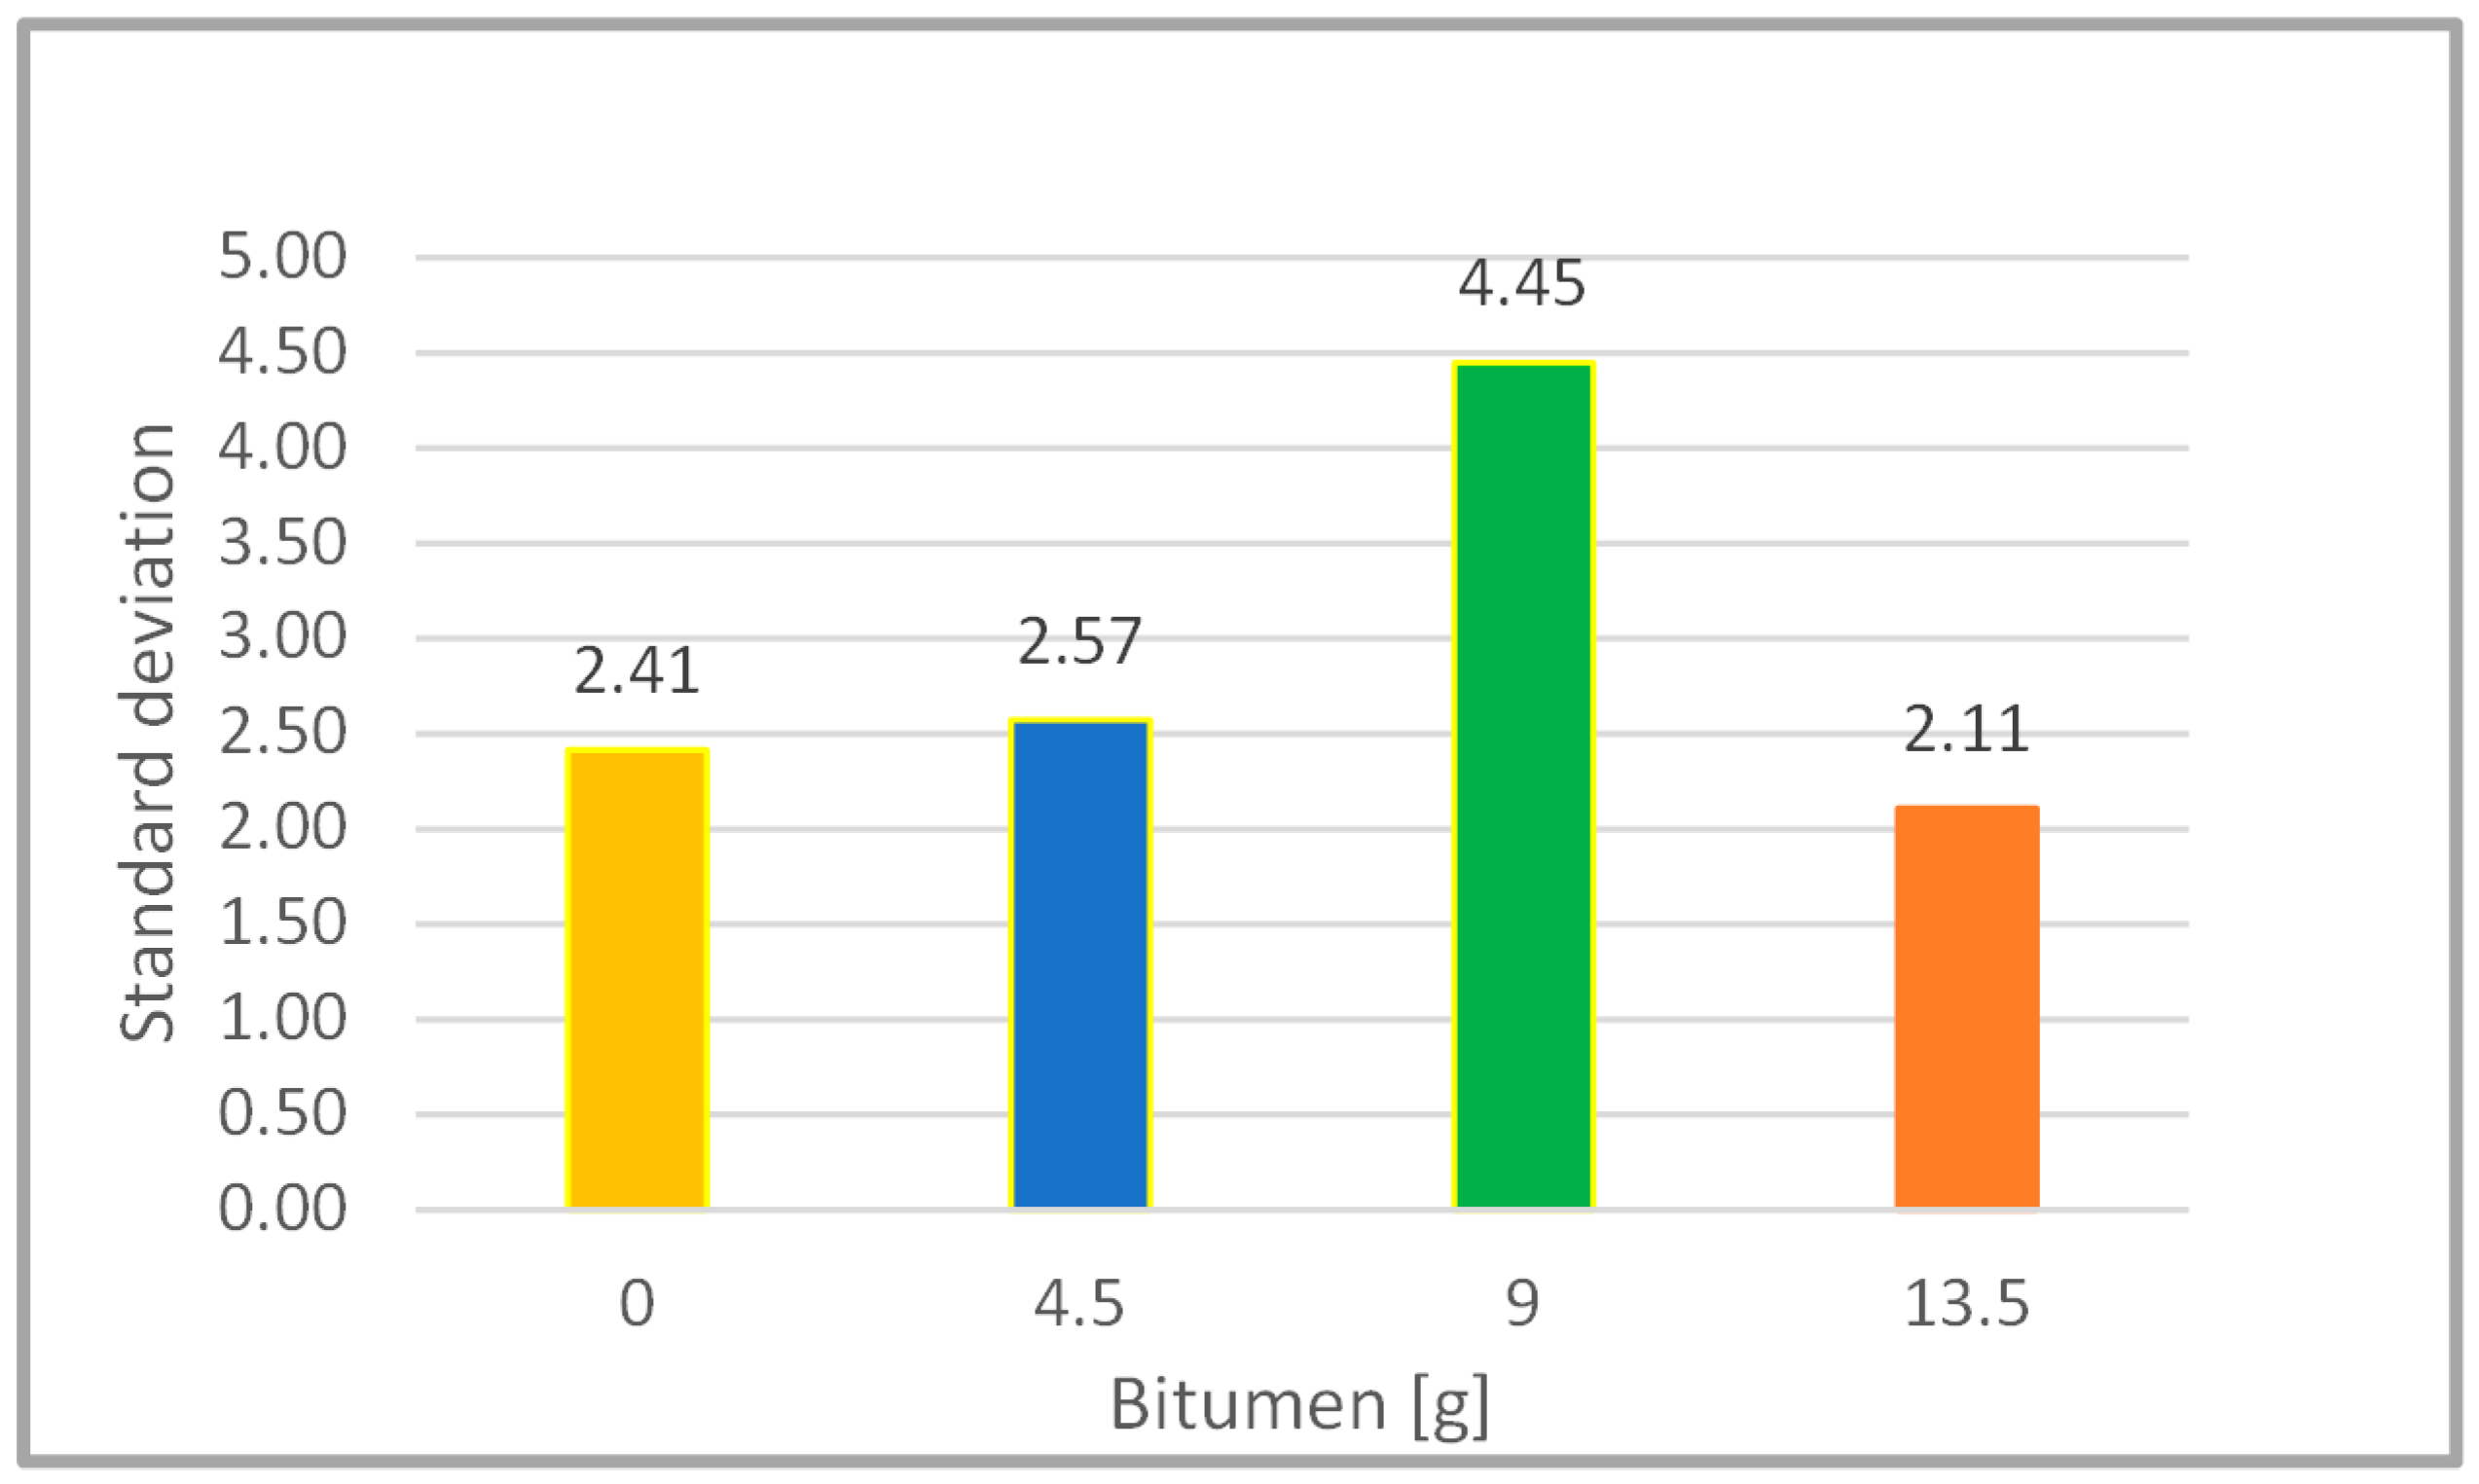
The increase in stress values with a reduction in the amount of plastic or the addition of bitumen was likely due to the changes in the physical properties of the brick. With a reduction in the amount of plastic or adding bitumen, the interlocking of the sand particles can be improved, leading to increased strength and stress values. However, adding too much bitumen may have adverse effects, as it can make the bricks softer and weaker. The mixture of 60% plastic and 9 g bitumen in sand produced the strongest results. The average stress of all the samples was found to be 25 MPa, and it was noted that the majority of stress readings deviated by an average of 2.54 MPa from the average stress. In order to find the average compression stress, a set of five observations of compression stress values were taken and mean stress was calculated. Additionally, the standard deviation was calculated to find the spread or variation in the compression values. This helped in the assessment of risk and of how much the stress values differed from the mean stress.
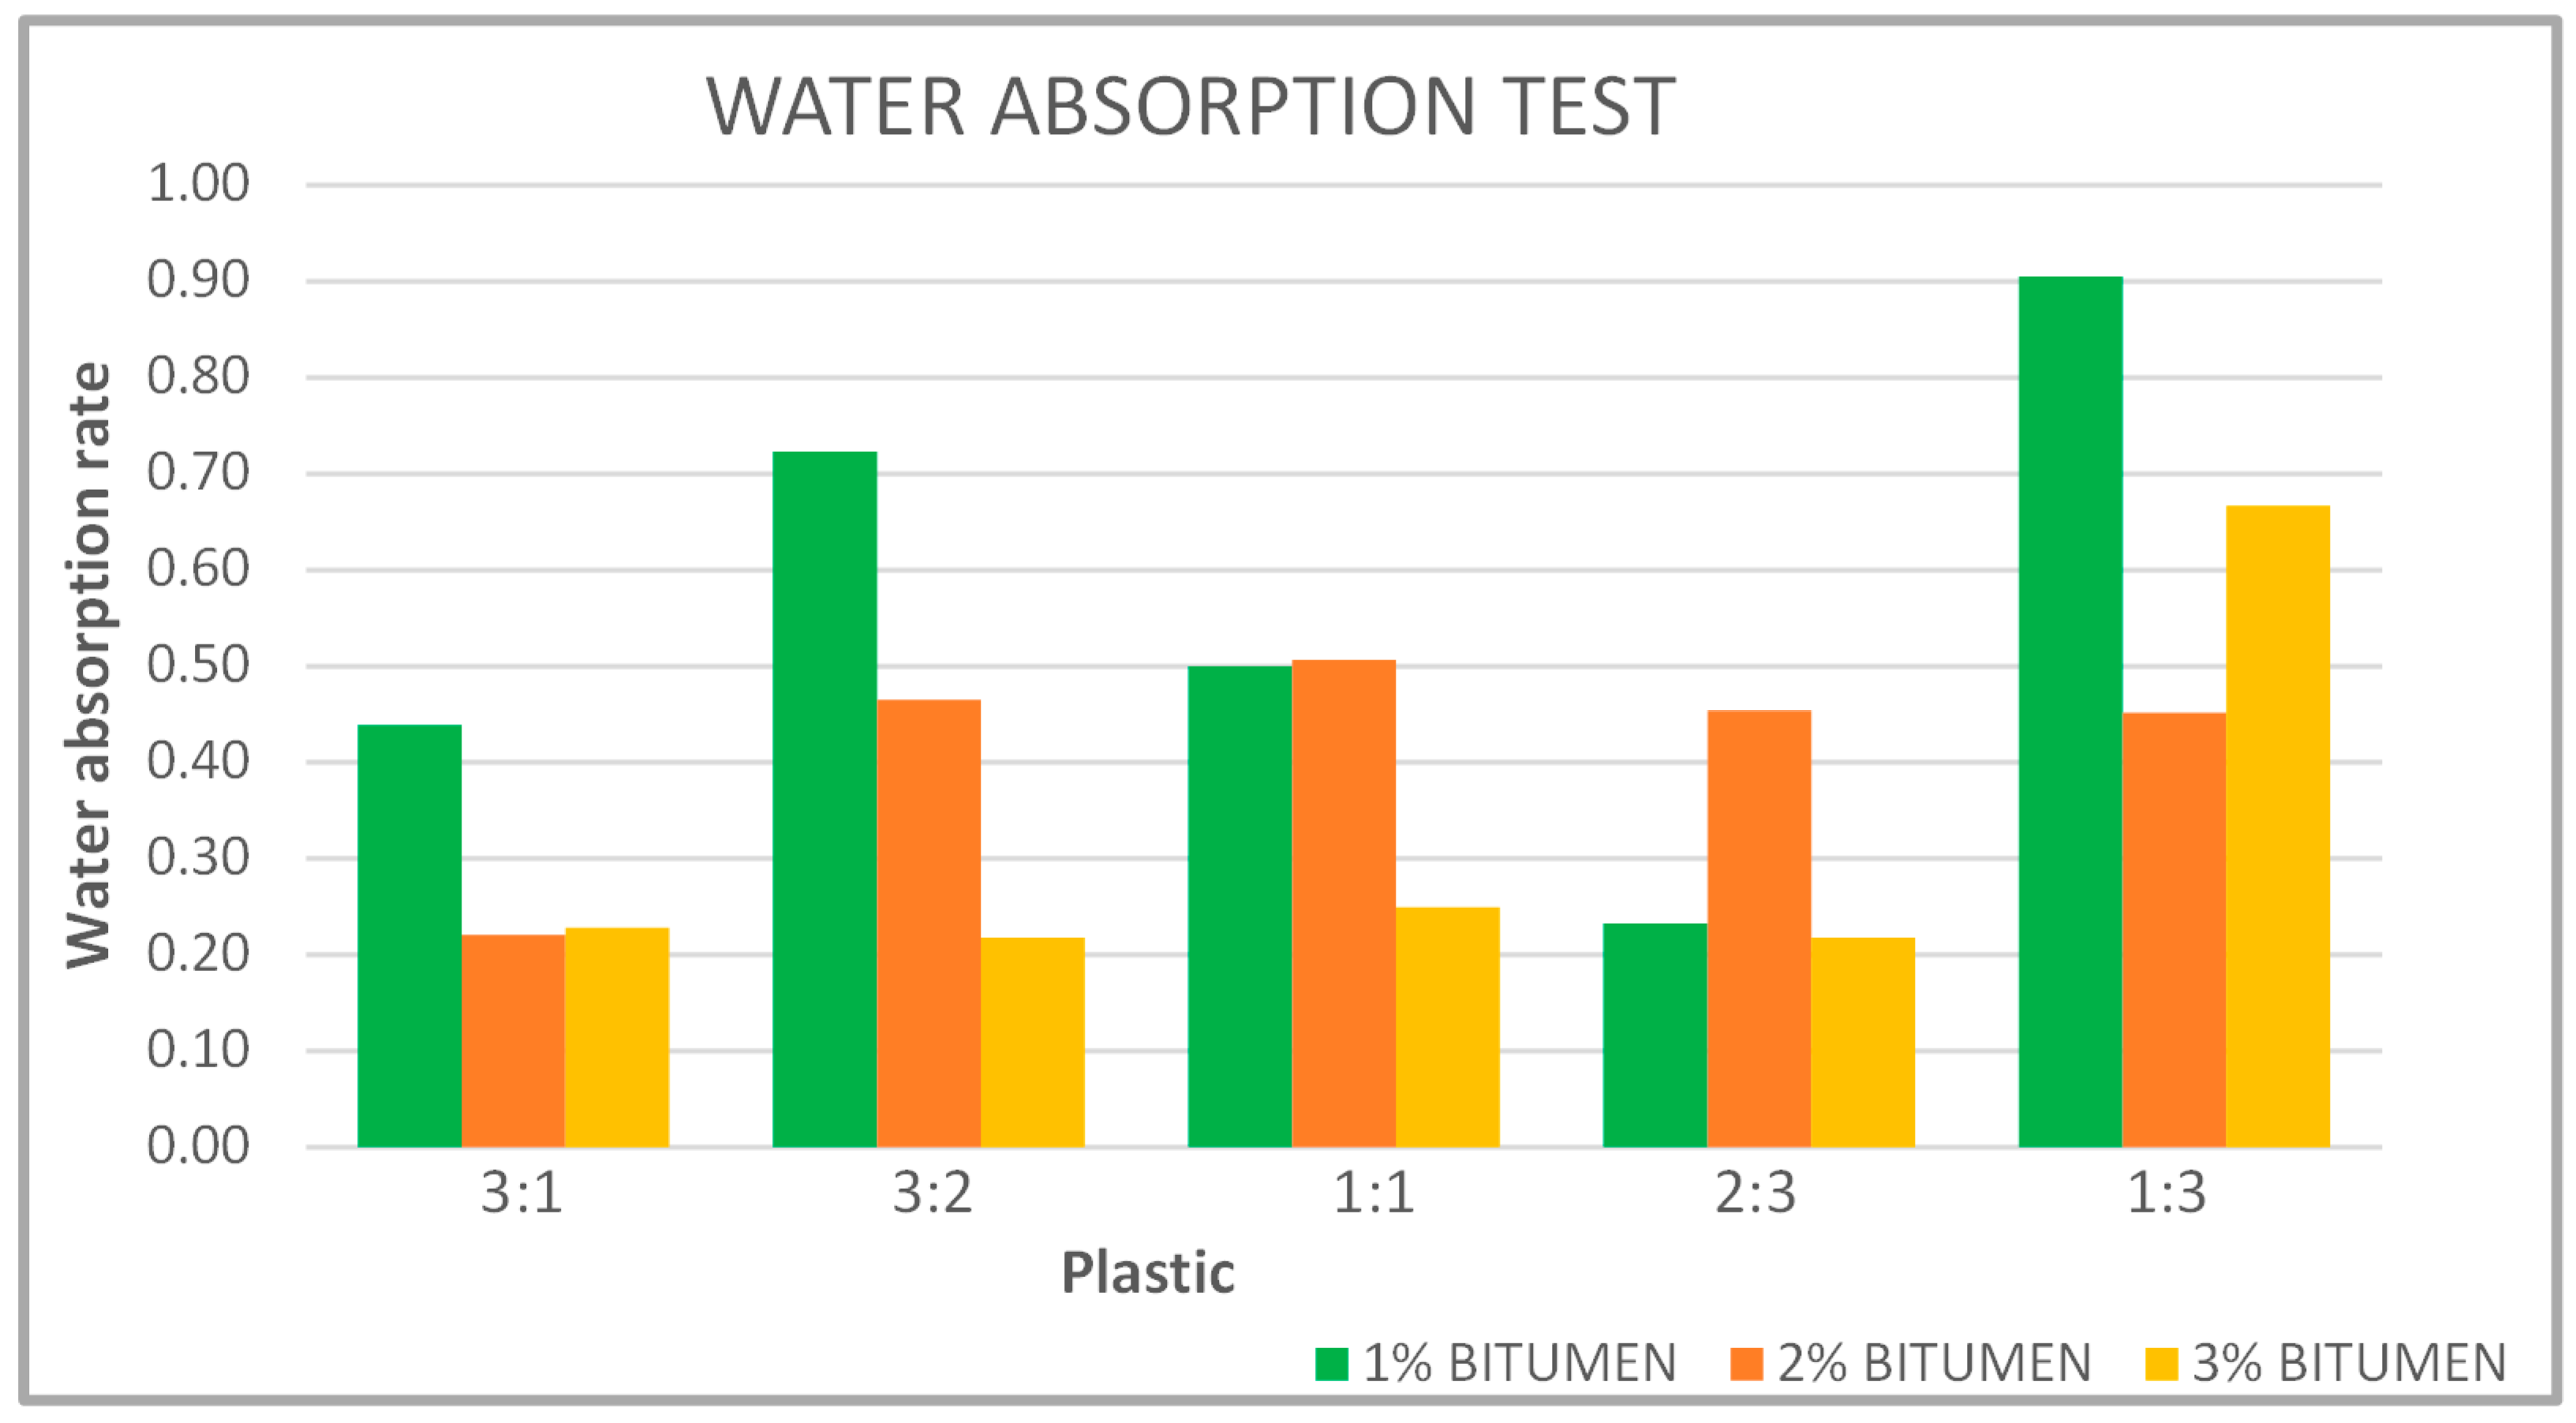
Bricks should absorb the least amount of water possible. As seen in 
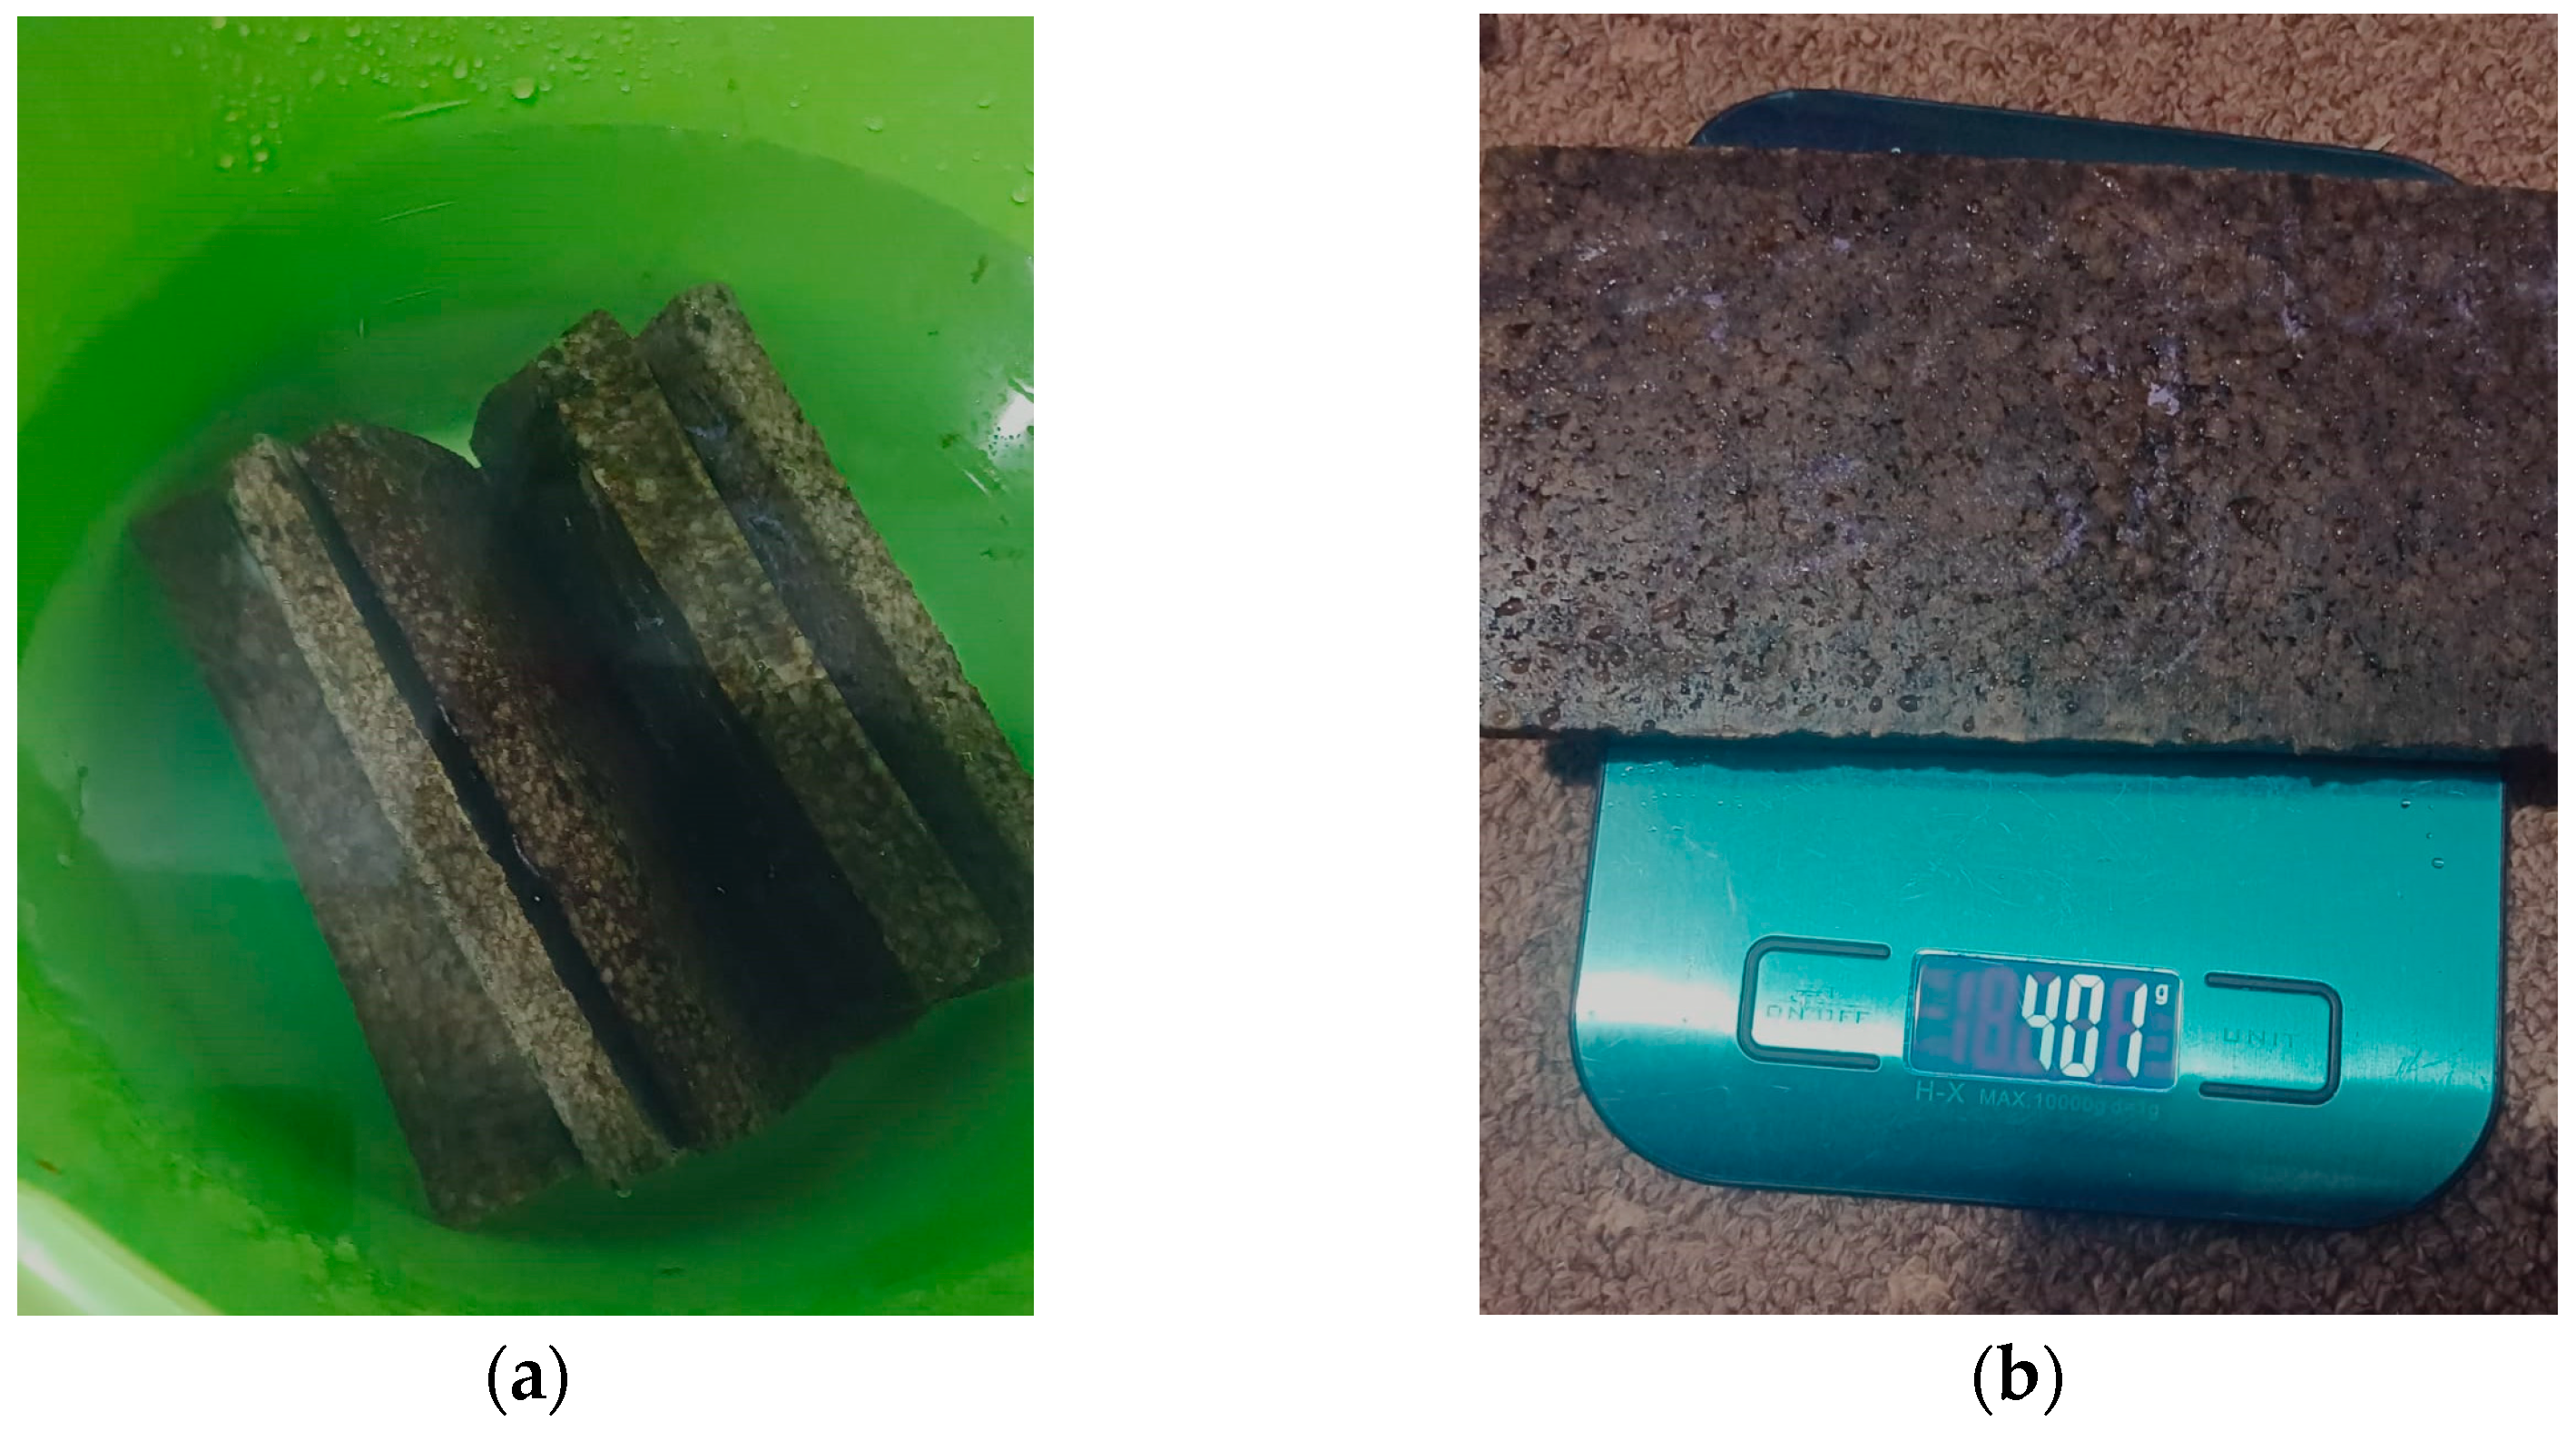
Figure 9, the water absorption test demonstrated that no bricks absorbed more water than 1% after being soaked for 24 h. This is especially helpful in the construction sector, because when bricks absorb more water, damage to the building arose. This test is also valuable in areas where water leakage is a primary concern. The bricks with the highest water absorption percentage were 0.9%. The decrease in plastic content in bricks increased their water absorption rate, with most bricks having a water absorption rate of around 0.2%. However, as plastic content decreased, the water absorption rate increased, potentially reaching a rate of 0.9%. The permissible range was 1% to 2%, while zero was the best value for a brick. The 0.9% water content was caused by the tiny gaps between the granules and the quick cooling of the bricks in the hot press.
The efflorescence test (Table 6) demonstrated that there were no soluble salts or alkalis present on the bricks with higher plastic–sand ratio (i.e., 3:1, 3:2, and 1:1), but the bricks with less plastic (i.e., 2:3) showed a slight alkali presence. When bitumen percentage increased, the alkalis were reduced, and for the ratio of 1:3, all bricks showed alkalis, which demonstrated that with more plastics, the presence of alkalis decreased. The relative temperature rise shown in Table 7 demonstrated that the temperature difference was greatest for bricks that contained the most plastic and bitumen. As a result, the temperature transfer from one side of the brick to the other took longer, which could be advantageous in a fire accident. The results showed that the initial temperatures of the bricks were all around 19.2 °C. When the samples were placed on a heat source maintained at 400 °C, the temperatures at the left and right faces of the bricks after 3 min ranged from 325 °C to 338 °C and 42 °C to 62 °C, respectively. It was observed that the temperature difference increased as the amount of plastic in the bricks increased, indicating that heat conduction was decreasing.
As in Kulkarni’s [17] study, bitumen was added after the HDPE and quartz sand were ground into granules. This caused the bitumen to be distributed equally, which strengthened bonds. It was discovered through several tests, including the efflorescence, water absorption, and compression tests, that HDPE bricks performed better than conventional bricks. The combination of high-density polyethylene, sand, and bitumen in this study increased the strength of the brick. The bricks’ compression strength gradually improved for the plastic sand ratio, rising from 22.08 MPa with 0% bitumen to a peak of 33.46 Mpa with 2% bitumen and falling just short of 32 MPa for 3% bitumen. These results suggested that bitumen aided in fusing sand and plastic, increasing the strength of the brick. During the initial point of the compression test, no stress was observed, indicating that the specimen may have been able to undergo further compression and that a more compact specimen could be made with less thickness.

5. Conclusions

This research work inferred that recycling plastic waste for building projects was the way of the future, as it would help reduce plastic waste and the price of bricks in the construction industry. HDPE, quartz sand, and bitumen were used in this research work to make bricks, and it was found that this combination led to an improvement in the strength of the bricks while reducing their weight. Additionally, the cost of these bricks was almost 50% less than conventional bricks. The cost of one conventional brick is around 0.20 to 0.50 euros. However, the cost of one plastic sand brick is around 0.092 euros, including the raw materials cost (i.e., for 1 kg of plastics, it costs 0.33 euros; for 1 kg of quartz sand, it costs 0.248 euros; and for 2% bitumen by weight (9 g), it costs 0.057 euros). HDPE and bitumen made the bricks more water-resistant by reducing their permeability, and quartz sand improved the binding between the plastics due to its strong binding properties.
This research indicates that adding bitumen to bricks can significantly enhance their tensile strength, with a maximum value of 37.5 MPa observed. However, it is important to note that an increase in the proportion of bitumen led to a decrease in the strength of the bricks. Therefore, it is recommended to use bitumen in moderation (i.e., around 9 g to 13.5 g) to achieve optimal results. Additionally, the combination of HDPE and quartz sand ensured that the bricks were void-free and free of alkalis, making them a suitable choice for the construction industry.
Overall, bricks with a bitumen content of 2% (i.e., 9 g of bitumen) and a plastic–sand ratio of 3:2 showed better properties than other bricks. Every brick had a compression strength that was better than typical clay bricks. For use in building, homes, and pallets, bricks with a higher percentage of plastics were preferable to those with a lower percentage of plastic (i.e., 2:3 and 1:3) since the bricks with fewer plastics possessed a significantly lower compression strength and a higher presence of alkalis. Plastic bricks are the best option for construction, parking chairs, and pathway pallets since they are very light, have a good load bearing capacity, have less water absorption, are inexpensive, and can gradually reduce plastic waste.
Although this is a useful method for recycling used plastic, plastic has the potential to emit greenhouse gases when used in excessively high temperatures. Conducting this experiment in a vacuum is always advised so that the carbon atoms released during heating cannot produce carbon dioxide and carbon monoxide, which affects the environment.
Further, this formula can be developed into high-strength tiles and hallow interlocking bricks that could replace the current materials without compromising strength. It was also found that the surfaces of the bricks were smoother. Hence, this process can be used to manufacture parts that need surface lubrication to reduce friction.

Author Contributions

N.K.K. contributed with the original manuscript draft writing, data synthesis, and data gathering. J.S. aided with the report’s review and research progress. The methodology was devised by Y.P.S. and N.K.K. Reviewing the report was aided by the supervision of Y.P.S. All authors have read and agreed to the published version of the manuscript.

Funding

The APC was sponsored by Hochschule Kaiserslautern, whereas no external funding was provided for this research.

Institutional Review Board Statement

Not applicable.

Data Availability Statement

Not applicable.

Acknowledgments

I thank Hochschule Kaiserslautern Pirmasens campus for financially supporting this research. I would also like to thank Hochschule Kaiserslautern, Kammgarn campus, for providing me with the resources for testing my bricks.

Conflicts of Interest

The authors declare no conflict of interest.

References

  1. Gottlieb, H.M. Filling the Gaps in the Global Governance of Marine Plastic Pollution. Nat. Resour. Environ. 2021, 35, 1–5. [Google Scholar]
  2. Nayeema, M. Prospects of Biodegradable Polymer (Polyhydroxyalkanoate) Production with Wastewater. Ph.D. Thesis, Brac University, Dhaka, Bangladesh, 2019. [Google Scholar]
  3. Plastic Soup Foundation. Available online: https://www.plasticsoupfoundation.org/en/plastic-facts-andfigures/#:~:text=The%20amount%20of%20plastic%20that,production%20is%20a%20lot%20higher (accessed on 6 February 2023).
  4. Andrady, A.L. Plastics and Environmental Sustainability; John Wiley & Sons: Hoboken, NJ, USA, 2015. [Google Scholar]
  5. European Environment Agency. Available online: https://www.eea.europa.eu/highlights/plastics-environmental-concern (accessed on 6 February 2023).
  6. Ellen Macarthur Foundation. Available online: https://ellenmacarthurfoundation.org/the-new-plastics-economy-catalysing-action (accessed on 6 February 2023).
  7. Future Planet BBC. Available online: https://www.bbc.com/future/article/20210510-how-to-recycle-any-plastic (accessed on 6 February 2023).
  8. Alliance to End Plastic Waste. Available online: https://endplasticwaste.org/en/our-stories/all-plastics-are-technically-recyclable-so-whats-holding-us-back (accessed on 6 February 2023).
  9. Sulyman, M.; Haponiuk, J.; Formela, K. Utilization of recycled polyethylene terephthalate (PET) in engineering materials: A review. Int. J. Environ. Sci. Dev. 2016, 7, 100. [Google Scholar] [CrossRef] [Green Version]
  10. Wahid, S.A.; Rawi, S.M.; Desa, N.M. Utilization of plastic bottle waste in sand bricks. J. Basic Appl. Sci. Res. 2015, 5, 35–44. [Google Scholar]
  11. Agyeman, S.; Obeng-Ahenkora, N.K.; Assiamah, S.; Twumasi, G. Exploiting recycled plastic waste as an alternative binder for paving blocks production. Case Stud. Constr. Mater. 2019, 11, e00246. [Google Scholar] [CrossRef]
  12. Circular Action Hub. Available online: https://www.circularactionhub.org/plastics-could-help-build-a-sustainable-future-heres-how/?lang=id (accessed on 5 January 2023).
  13. Plastic Waste. Our World in Data. Available online: https://ourworldindata.org/grapher/plastic-waste-polymer (accessed on 6 February 2023).
  14. Silviyati, I.; Zubaidah, N.; Amin, J.M.; Supraptiah, E.; Utami, R.D.; Ramadhan, I. The Effect of Addition of High-Density Polyethylene (HDPE) as Binder on Hebel Light Brick (celcon). J. Phys. Conf. Ser. 2020, 1500, 012083. [Google Scholar] [CrossRef]
  15. Wani, T.; Pasha, S.A.Q.; Poddar, S.; Balaji, H.V. A Review on the use of High Density Polyethylene (HDPE) in Concrete Mixture. Int. J. Eng. Res. Technol. 2022, 9, 861–864. [Google Scholar]
  16. Sahani, K.; Joshi, B.R.; Khatri, K.; Magar, A.T.; Chapagain, S.; Karmacharya, N. Mechanical Properties of Plastic Sand Brick Containing Plastic Waste. Adv. Civ. Eng. 2022, 2022, 8305670. [Google Scholar] [CrossRef]
  17. Kulkarni, P.; Ravekar, V.; Rao, P.R.; Waigokar, S.; Hingankar, S. Recycling of waste HDPE and PP plastic in preparation of plastic brick and its mechanical properties. Clean. Mater. 2022, 5, 100113. [Google Scholar] [CrossRef]
  18. Maneeth, P.D.; Pramod, K.; Kumar, K.; Shetty, S. Utilization of waste plastic in manufacturing of plastic-soil bricks. Int. J. Eng. Res. Technol. 2014, 3, 530–536. [Google Scholar]
  19. Benny, T.K.; Wilson, A.J.; Krishn, B.D.; Nair, A.M.; Rasheed, J.K.J. Asphalt Plasto A Brick from Waste Plastic. Int. J. Eng. Res. Technol. (IJERT) 2019, 8, 222–227. [Google Scholar]
  20. Favaro, S.L.; Pereira, A.G.B.; Fernandes, J.R.; Baron, O.; da Silva, C.T.P.; Moisés, M.P.; Radovanovic, E. Outstanding impact resistance of post-consumer HDPE/Multilayer packaging composites. Mater. Sci. Appl. 2016, 8, 15–25. [Google Scholar] [CrossRef] [Green Version]
  21. Beidoou. Available online: https://www.beidoou.com/materials/what-is-quartz-sand.html (accessed on 6 February 2023).
  22. Soumya, G.; Karthiga, S. Study on mechanical properties of concrete using silica fume and quartz sand as replacements. Int. J. Pure Appl. Math. 2018, 119, 151–157. [Google Scholar]
  23. Civil Work Study. Available online: https://www.civilworkstudy.com/2020/05/bitumen-properties-and-its-detail-why.html (accessed on 6 February 2023).
  24. Sarkar, D.; Pal, M. A laboratory study involving use of brick aggregate along with plastic modified bitumen in preparation of bituminous concrete for the roads of Tripura. ARPN J. Eng. Appl. Sci. 2016, 11, 570–576. [Google Scholar]
Figure 1. Mould design.
Jcs 07 00111 g001
Figure 2. Results of brick sample 1. (a) Compression strength values of brick plastic to sand 3:1. (b) Stress-strain curve with 0 g bitumen. (c) Stress-strain curve with 4.5 g bitumen. (d) Stress-strain curve with 9 g bitumen. (e) Stress-strain curve with 13.5 g bitumen.
Jcs 07 00111 g002
Figure 3. Results of brick sample 2. (a) Compression strength values of brick plastic to sand 3:2. (b) Stress-strain curve with 0 g bitumen. (c) Stress-strain curve with 4.5 g bitumen. (d) Stress-strain curve with 9 g bitumen. (e) Stress-strain curve with 13.5 g bitumen.
Jcs 07 00111 g003
Figure 4. Results of brick sample 3. (a) Compression strength values of brick plastic to sand 1:1. (b) Stress-strain curve with 0 g bitumen. (c) Stress-strain curve with 4.5 g bitumen. (d) Stress-strain curve with 9 g bitumen. (e) Stress-strain curve with 13.5 g bitumen.
Jcs 07 00111 g004
Figure 5. Results of brick sample 4. (a) Compression strength values of brick plastic-to-sand 2:3. (b) Stress-strain curve with 0 g bitumen. (c) Stress-strain curve with 4.5 g bitumen. (d) Stress-strain curve with 9 g bitumen. (e) Stress-strain curve with 13.5 g bitumen.
Jcs 07 00111 g005
Figure 6. Results of brick sample 5. (a) Compression strength values of brick plastic-to-sand 1:3. (b) Stress-strain curve with 0 g bitumen. (c) Stress-strain curve with 4.5 g bitumen. (d) Stress-strain curve with 9 g bitumen. (e) Stress-strain curve with 13.5 g bitumen.
Jcs 07 00111 g006
Figure 7. Standard deviation value of compression stress.
Jcs 07 00111 g007
Figure 8. Performing the water absorption test. (a) Bricks immersed in water. (b) Weight check after 24 h.
Jcs 07 00111 g008
Figure 9. Water absorption rate on different composition of plastic bricks.
Jcs 07 00111 g009
Table 1. Properties of HDPE [20].
PropertyUnitsHDPE
Yield stressMPa18
Youngs modulusMPa960–1000
DensityKg/m3941–967
Melting point°C130–133
Coefficient of thermal elongation%20–100
Impact resistance J/m27–160
Table 2. Properties of quartz sand [22].
PropertyUnitsValue
Specific gravity-2.45
Water absorption%1.9
Fineness modulus-2.2
Table 3. Properties of bitumen [24].
PropertyUnitsValue
Specific gravity-22.4
Softening point°C35–70
Ductilitym0.0264
Table 4. Percentage of alkali presence after efflorescence test.
Efflorescence TestExtent of Deposits
Nil0%
Low≤10%
Medium10% to 50%
HeavyMore than 50% without powdered flakes
SeriousMore than 50% with powdered flakes
Table 5. Mean value of compression stress.
Plastic%Units0 g Bitumen4.5 g Bitumen9 g Bitumen13.5 g Bitumen
60MPa19.64424.77230.4828.284
Table 6. Efflorescence test on different composition of plastic bricks.
Plastic: SandBitumen
0 g4.5 g9 g13.5 g
3:1NilNilNilNil
3:2NilNilNilNil
1:1NilNilNilNil
2:3SlightSlightNilNil
1:3SlightSlightSlightSlight
Table 7. Temperature difference of different bricks.
Plastic %Initial Temperature [°C]After 3 min, Temperature at Left Face [°C]After 3 min, Temperature at Right Face [°C]Temperature Difference [°C]
7519.232542283
6019.232848280
5019.232751276
4019.233056274
2519.233862276
Disclaimer/Publisher’s Note: The statements, opinions and data contained in all publications are solely those of the individual author(s) and contributor(s) and not of MDPI and/or the editor(s). MDPI and/or the editor(s) disclaim responsibility for any injury to people or property resulting from any ideas, methods, instructions or products referred to in the content.

