
A Mathematical Approach for Sound Insulation Characteristics and Cost Optimization of Double-Layer Composite Structures

1
Institute of Intelligent Manufacturing, Guangdong Academy of Sciences, Guangzhou 510070, China
2
Guangdong Key Laboratory of Modern Control Technology, Guangzhou 510070, China
*
Authors to whom correspondence should be addressed.
J. Compos. Sci. 2023, 7(3), 110; https://doi.org/10.3390/jcs7030110
Submission received: 17 January 2023
/
Revised: 15 February 2023
/
Accepted: 7 March 2023
/
Published: 9 March 2023
(This article belongs to the Special Issue Characterization and Modelling of Composites, Volume III)
Abstract
:The compressor is the primary source of noise in a refrigeration system. Most compressors are wrapped with multi-layer sound insulation cotton for noise reduction and sound insulation. We explore the sound insulation law of different polyvinyl chloride thicknesses and non-woven fibers. Polyvinyl chloride with varying thicknesses and non-woven fibers are then combined by bonding to study the sound insulation characteristics of a two-layer composite structure. A sound insulation prediction model is established using the multi-parameter nonlinear regression method. An optimal cost mathematical model is established based on experimental and mathematical methods that can quickly determine the optimal cost scheme for different designs with the same effect.
1. Introduction
Effective sound insulation measures can reduce noise radiation, and sound insulation devices are widely employed in industrial equipment [1,2]. Double-layer composites have excellent sound insulation performances due to the discontinuous impedance boundary between their structures, in which an elastic wave has a large energy loss at the interface [3,4].
The main sources of noise in refrigeration systems include the compressor, fan, pipeline flow, etc. In most cases, the compressor is the main source of noise [5]. At present, sound insulation structures are mostly used to wrap the compressor to achieve noise reduction and sound insulation [6]. Sound insulation structures are usually composed of sound-absorbing and sound-insulating materials [7].
The most commonly used sound-absorbing materials are porous sound-absorbing materials. Generally, there are numerous tiny pores in the interior of porous materials, and the adjacent pores are connected with each other. They are connected to the outside through the surface of the material. When the sound wave is incident on the surface of the porous material, some of the sound energy is directly reflected on the surface of the material, while the other part of the energy enters the material and propagates forward. When the sound wave propagates inside the porous material, it will cause air movement in the pores inside the material and, thus, friction with the solid structure that forms the hole wall. Due to the viscosity and heat conduction effect of the air, the sound energy will be converted into heat energy and consumed. In addition, the heat exchange between the air in the pore and the pore wall and fiber will cause the loss of heat energy, which will lead to the attenuation of sound energy. Through the theoretical mechanism of porous sound absorption, it can be found that the acoustic frequency and the vibration velocity of air particles in the pores of porous materials directly affect the heat exchange velocity between the air and the hole wall. Therefore, porous materials have good sound absorption performance in high-frequency noise. Common sound-absorbing materials include non-woven materials [8,9], fibrous materials [10], needle felt, polyurethane, etc. [11,12].
According to the law of sound insulation mass, as far as the sound insulation material itself is concerned, increasing the surface density can improve the sound insulation amount of the material. From low to high frequency, sound insulation is controlled by the stiffness of the material at the beginning, and sound insulation gradually decreases with the increase in frequency. As the frequency increases, it will enter the damping control area. At some fixed frequencies, the material will produce resonance, which will lead to a sound insulation trough. At the corresponding frequencies, the material will produce resonance; thus, the sound insulation amount will appear to be minimal. The sound insulation amount in this area is mainly determined by the damping of the material. As the frequency continues to increase, it will enter the mass control area. The main control role of this area is the mass of materials The sound insulation will increase with the increase in frequency, which is consistent with the aforementioned mass law. When the frequency is further increased, the sound insulation will be greatly reduced near a certain frequency. This is because the frequency of the incident sound wave coincides with the frequency of the bending wave of the material itself, resulting in a large part of the sound wave being transmitted and forming a low sound insulation valley. According to the classical sound insulation theory, the sound insulation performance of a material is determined by its surface density, stiffness, and damping. Common sound insulation materials include polyvinyl chloride [13], neoprene, nitrile rubber, ethylene propylene diene monomer, etc.
In the field of noise reduction, in order to improve the comprehensive performance of acoustic structures, sound absorption and sound insulation materials are often combined to form composite products for application. Such products can have sound absorption, sound insulation, and other functions at the same time; thus, they achieve a better noise reduction effect. In addition, because different acoustic materials have different noise reduction frequency characteristics, the combination of two or more materials can increase the effective noise reduction frequency range of the materials.
The most common design method employs the experience of engineers and experimental results to determine a sound insulation scheme [14]. Thus, many companies rely on the experience of engineers for multiple production scheme trials in the process of verification, improvement, and re-trials to obtain an improved scheme [15]. If the structure is changed in the process of product scheme switching, the performance of the existing sound insulation structure on the product may be affected, and the sound insulation scheme must be rematched and verified by experiments. The composite sound insulation quality of single-layer sound insulation materials can be calculated by referring to relevant manuals [16]. However, it remains difficult to rapidly and accurately calculate the performance of sound insulation structures composed of different materials [17,18]. Therefore, it is necessary to study the sound insulation performance of double-layer composite sound insulation structures in an air conditioning compressor system and establish a rapid calculation model [19,20,21].
Mathematical methods have become a research hotspot as they can establish complex multi-dimensional variable relationships in the data space and reveal deeper mechanisms and laws that are difficult to obtain by traditional research methods [22,23,24]. Some researchers use impedance tubes to test the normal incidence sound transmission loss [25,26,27].
Mathematical methods employing machine learning have gradually emerged in the intelligent design of complex structures in recent years [28,29,30]. For example, supervised machine learning using labeled data was employed to train a black-box model that could characterize the implicit relationship between data and labels, which was successfully used in the reverse design of acoustic [31] and optical [32] artificial materials. In the absence of sufficient prior knowledge, unsupervised machine learning was used to cluster data without class information and employed to automatically classify material microstructure features and for the dimension reduction and compression of material topological features [33]. The reinforcement learning algorithm continuously updates the algorithm strategy through the interaction between an agent and the environment to realize global optimization or specific objectives. This method was applied to optimize the structural design of one-dimensional acoustic artificial materials [34]. Based on deep learning methods, a framework for solving vibration problems was established, and the vibration of a honeycomb core and a panel-reinforced viscoelastic sandwich disk was studied [35]. In view of the successful application of machine learning in the above cases, we apply this method to determine the correlation between sound transmission loss and the cost of double-layer sound insulation structures.
The correlation between sound transmission loss and structure costs is studied in this work using experimental and mathematical methods. The sound insulation law of polyvinyl chloride and non-woven fibers with different thicknesses is first determined. The sound insulation characteristics of a two-layer composite structure are then studied by combining polyvinyl chloride and non-woven fibers of different thicknesses. A sound insulation prediction model is established using the multi-parameter nonlinear regression method, and the effectiveness of the model is verified by a numerical test. Finally, an optimal cost mathematical model is established. Based on the experimental and mathematical methods, different schemes with the same effect can be realized to quickly determine the optimal cost scheme.
2. Sound Insulation Mechanism and Test Method of a Sound Insulation Structure
Sound insulation is the process of separating or isolating a noise source from a receiver to block the transmission of airborne sound to achieve noise reduction. The use of a sound insulation package for noise reduction can effectively reduce the energy radiated by the sound source and reduce the overall noise level of a product. For example, the motor sound insulation cover on a vacuum cleaner and the sound insulation structure of a compressor use the sound insulation principle to reduce noise. The sound insulation capacity of insulation components can be expressed by the transmission coefficient. As it is inconvenient to express the sound insulation performance of components in practical engineering due to the small value of the transmission coefficient, sound transmission loss (TL) is used to describe the sound insulation performance of double-layer sound insulation structures.
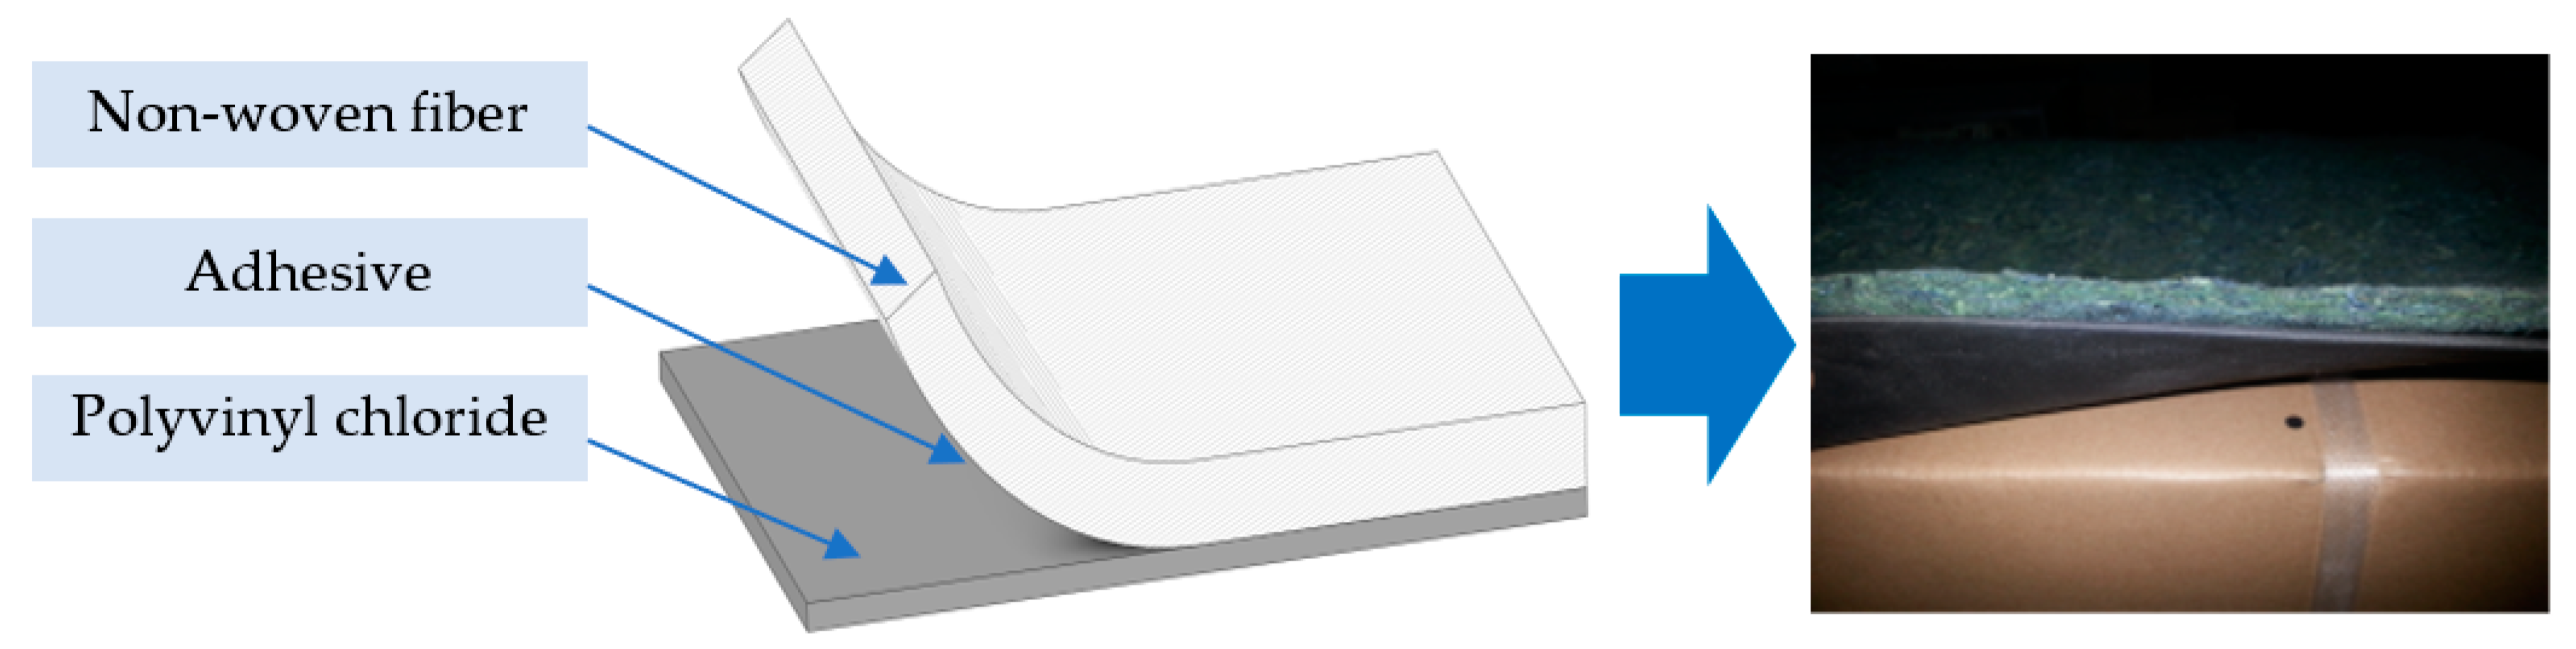
The non-woven fiber of double-layer sound insulation structures is firmly glued to polyvinyl chloride, and there is no separation under normal conditions, as shown in Figure 1.
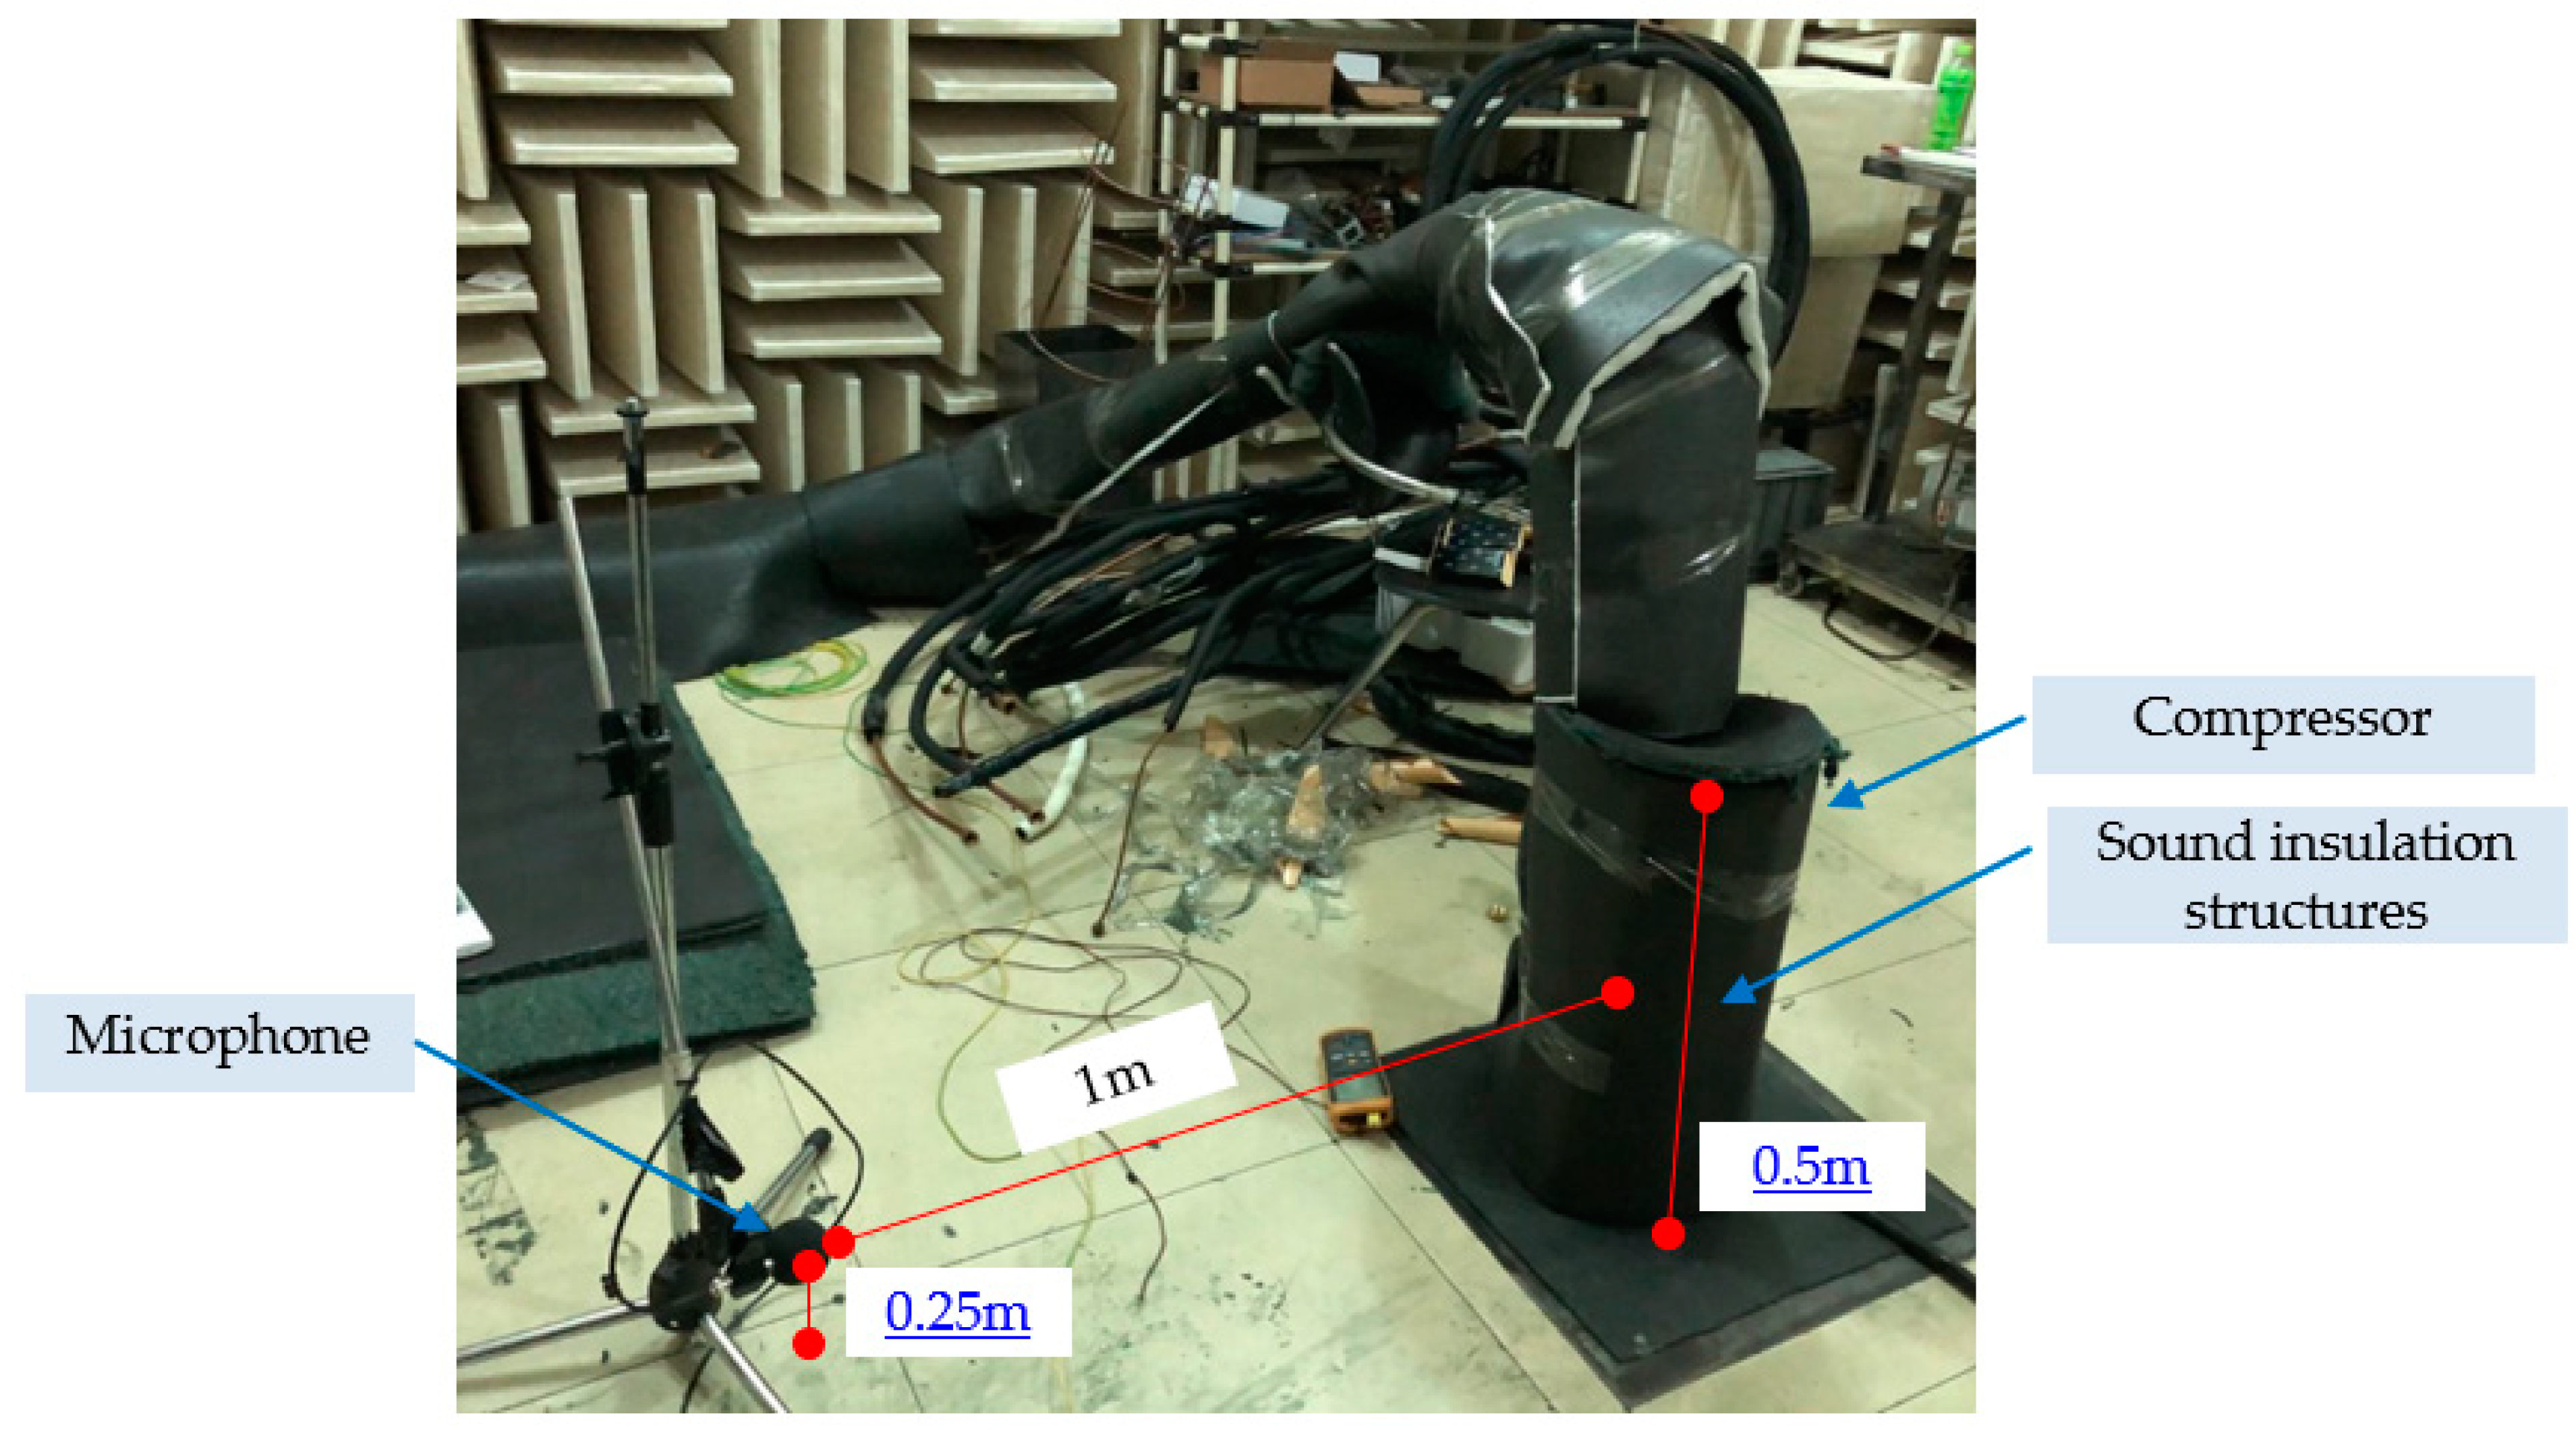
Figure 2 shows the sound insulation test method for a sound insulation structure. The displacement of the compressor is 60 cm3/rev, the height is 0.5 m, and the test microphone is placed 1 m away from the compressor and 0.25 m above the ground. To eliminate the influence of the connecting pipe on the compressor noise test, the connecting pipe is wrapped with a three-layer sound insulation structure to ensure that the noise of the microphone test is transmitted from the compressor body, as shown in Figure 2.
The test environment is a semi-anechoic room, and the laboratory floor is a reflective surface to simulate a room in a semi-free space. It is designed based on the principle that the total reflection ground is used as a mirror to double the effective size. In semi-anechoic rooms, as long as the sound source is placed on the reflecting ground, that is, when the radiation surface of the sound source is in a plane with the ground, the sound transmission is the same as that in conventional anechoic rooms. The main function of a semi-anechoic room is to provide a semi-free field space for acoustic testing. There is a specific physical definition for the propagation of sound waves in the semi-free field space, which is as follows: the sound pressure of a point source decays with distance, which is the inverse square law of sound energy, and the sound pressure level is equal to the sound intensity level at a normal temperature and pressure. This is the theoretical basis for measuring sound power in an anechoic chamber.
The principle of noise acquisition is shown in Figure 3. The front end uses a BK microphone sensor to collect the signal, which is modulated by an adaptive amplifier. The signal is then converted into an analog electrical signal, which is processed by the data acquisition system. Finally, the signal is converted into a digital electrical signal and analyzed by the computer.
The computer was used to open the LMS Test.Lab Signature software module. The data acquisition card was connected through an USB cable, and the microphone and vibration sensor were plugged into the acquisition card to collect and analyze the sound and vibration signals.
This paper largely focuses on the influence of different thicknesses of polyvinyl chloride and non-woven fibers, which are combined into a sound insulation structure to enhance the noise and sound insulation performance of a compressor. The experimental scheme design is provided in Table 1, in which scheme a is the reference value for calculating the sound insulation value of other schemes (b–i). The above experiments are carried out in a semi-anechoic room. The size of the semi-anechoic room is 5 m × 5 m × 6.5 m, and the background noise of the semi-anechoic room is 14.5 dB (A).
3. Influence of Different Schemes on Sound Insulation Structure Performance
The main noise components of a scroll compressor include mechanical noise, air noise, liquid noise, and electromagnetic noise. Among them, mechanical noise is caused by unbalance, mechanical collision, and mechanical friction between the scroll rotor and the scroll stator. Electromagnetic noise is mainly caused by space volume vibrations caused by alternating changes in the electromagnetic field. Air noise is caused by gas gap leakage, gas flow, and the over- or under-compression of exhaust due to changes in the operating conditions. The liquid noise is mainly caused by the lubricating oil jet and the cooling liquid cavitation bubble. All of the above noises are finally transmitted to the outside through a shell. Additionally, when the working frequency of the compressor increases, the noise value will also increase.
The experiment to analyze the influence of different sound insulation structure thickness combinations on sound transmission loss is based mainly on the maximum rated working frequency (115 Hz) of a certain type of air conditioner. The test is carried out according to the experimental scheme detailed in the previous section, and the results are shown in Table 2.
From the experimental results, it can be seen that with the increase in polyvinyl chloride’s thickness, the noise reduction in the sound insulation structure also increases. When the thickness of the non-woven fiber increases, the noise reduction in the sound insulation structure also increases. This is consistent with our experience in practical engineering. However, how to accurately express the influence of each component’s thickness on the total sound insulation is of great significance to the forward design of the scheme.
4. Mathematical Model for Fast Calculation of Sound Transmission Loss of a Double-Layer Sound Insulation Structure and Accuracy Verification
4.1. Mathematical Model for the Rapid Calculation of Sound Insulation
The sound transmission loss is not linear with the thickness of polyvinyl chloride and non-woven fiber. Considering the calculation equation of the sound transmission loss of single-component materials, it is assumed that the sound transmission loss of a double-layer sound insulation structure has the following form:
where represents the thickness of polyvinyl chloride (mm), represents the thickness of non-woven fiber (mm), and represent the undetermined coefficient.
Based on the experimental data in Table 2 (b–i), the undetermined coefficient in the above equation is estimated by the least square method, and the mathematical model for the rapid calculation of the sound transmission loss of the double-layer sound insulation structure is obtained using Python programming calculation.
4.2. Test of the Rapid Calculation Mathematical Model
We establish a sound insulation prediction model using the multi-parameter nonlinear regression method, and the determination coefficient statistic is used to evaluate the accuracy of the model.
The determination coefficient represents the ratio of the sum of regression squares to the sum of total deviation squares, indicating the proportion in the sum of total deviation squares that can be explained by the sum of regression squares. The larger the proportion, the more accurate the model is, and the more significant the regression effect is. The rating is between 0 and 1; the closer it is to 1, the better the fit of the regression. A goodness of fit of more than 0.8 is typically considered acceptable [36,37].
In multiple regression analyses, the is expressed as follows:
where SST is the sum of squares of the total, and SSE is the sum of squares of the error.
The coefficient of determination is related to the number of independent variables. To correctly determine the accuracy of the model, it is necessary to consider the degrees of freedom and make adjustments to the expression according to the size of the equation [38,39].
where is the adjusted coefficient of determination, is the total number of experiments, and is the number of variables. The adjusted coefficient of determination reflects more accurately the degree of fit between the model and the experimental data.
In this paper, , the determination coefficient of the adjustment of the digital model is , and the coincidence degree of the model reaches 99.891%. The results illustrate that the model can accurately predict the experimental results, which proves the effectiveness of the mathematical model for the rapid calculation of sound insulation of double-layer sound insulation structures.
The straight line represents the best straight fit of the experimental and regression model data. The blue points represent a pair of an experimental data point and the results of the regression model for that specific point. If the point falls on the straight line, it means that the predicted value is equal to the experimental value. If the point deviates a lot from the straight line, it means that the predicted value is significantly different from the experimental value. As illustrated in Figure 4, the predicted value is in good agreement with the experimental value. For more combination schemes of polyvinyl chloride and non-woven fiber with different thicknesses, the predicted value can be calculated according to the fast calculation model proposed in this paper. The mathematical model for the rapid calculation of the sound transmission loss of double-layer sound insulation structures can guide the rapid design of sound insulation structure combinations.
5. Optimal Cost Numerical Model of Double-Layer Sound Insulation Structures
5.1. Cost Calculation of Double-Layer Sound Insulation Structures
Equation (2) demonstrates that the sound transmission loss has a nonlinear relationship with the thickness of polyvinyl chloride and non-woven fiber, while the total cost per unit area has a linear relationship with the thickness of polyvinyl chloride and non-woven fiber.
It is assumed that the total cost of a double-layer sound insulation structure has the following form:
where represents the unit price per unit area of polyvinyl chloride (RMB/mm), and represents the unit price per unit area of non-woven fiber (RMB/mm). The cost of polyvinyl chloride and non-woven fiber are shown in Table 3.
5.2. Optimal Cost Calculation Model of Double-Layer Sound Insulation Structures
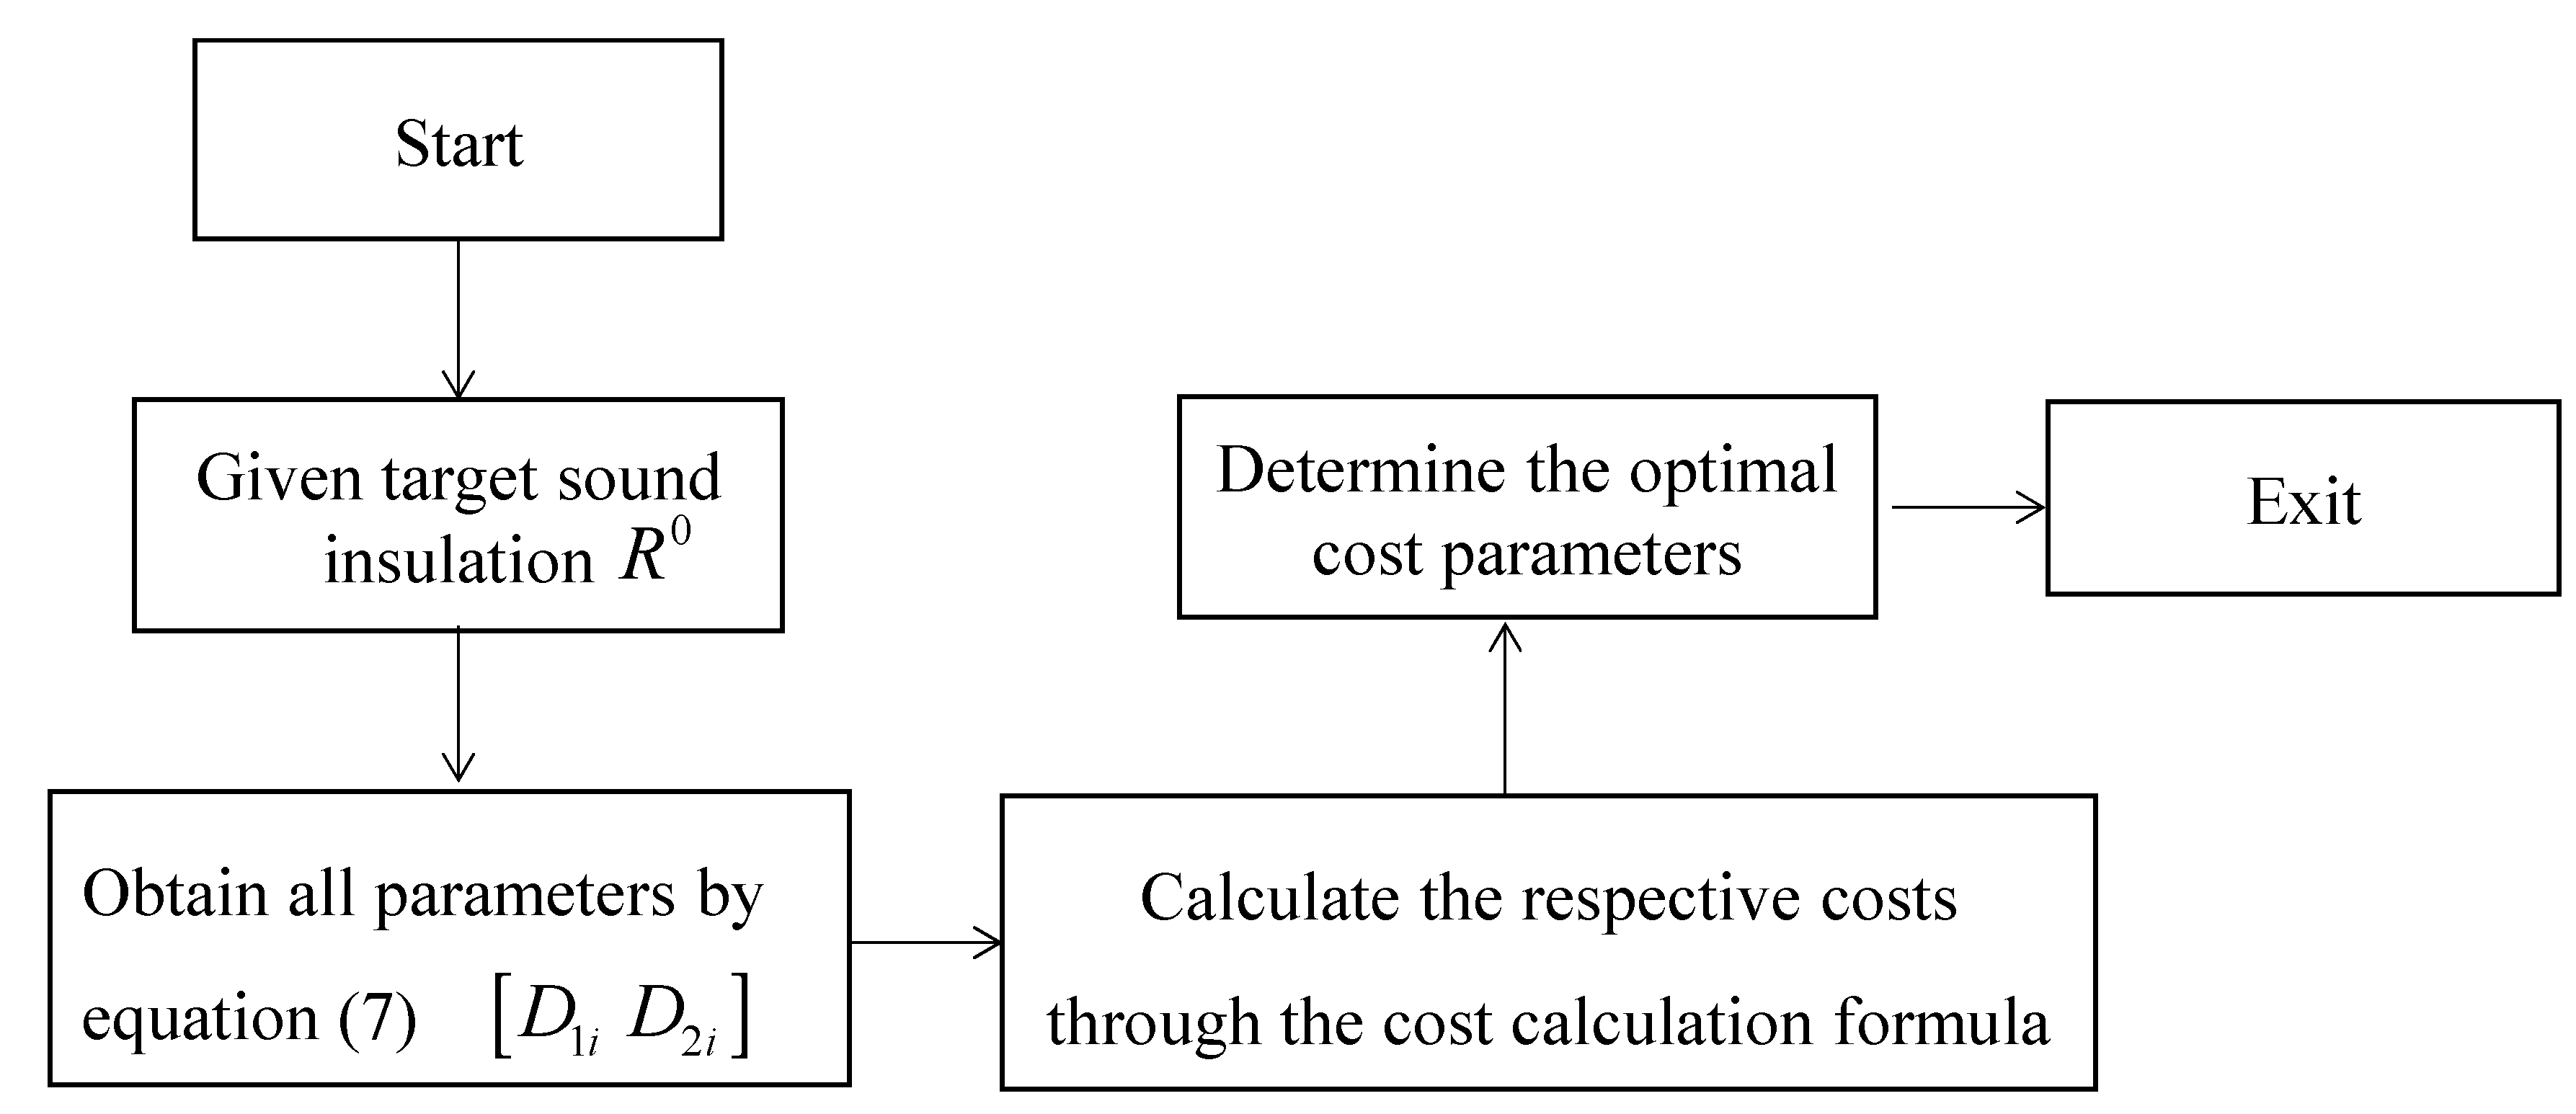
In practical engineering, the same sound insulation may correspond to a variety of combinations of polyvinyl chloride and non-woven fibers with different thicknesses. The total cost of different combinations is also different. The calculation framework of the model to determine the best cost scheme is as shown in Figure 5.
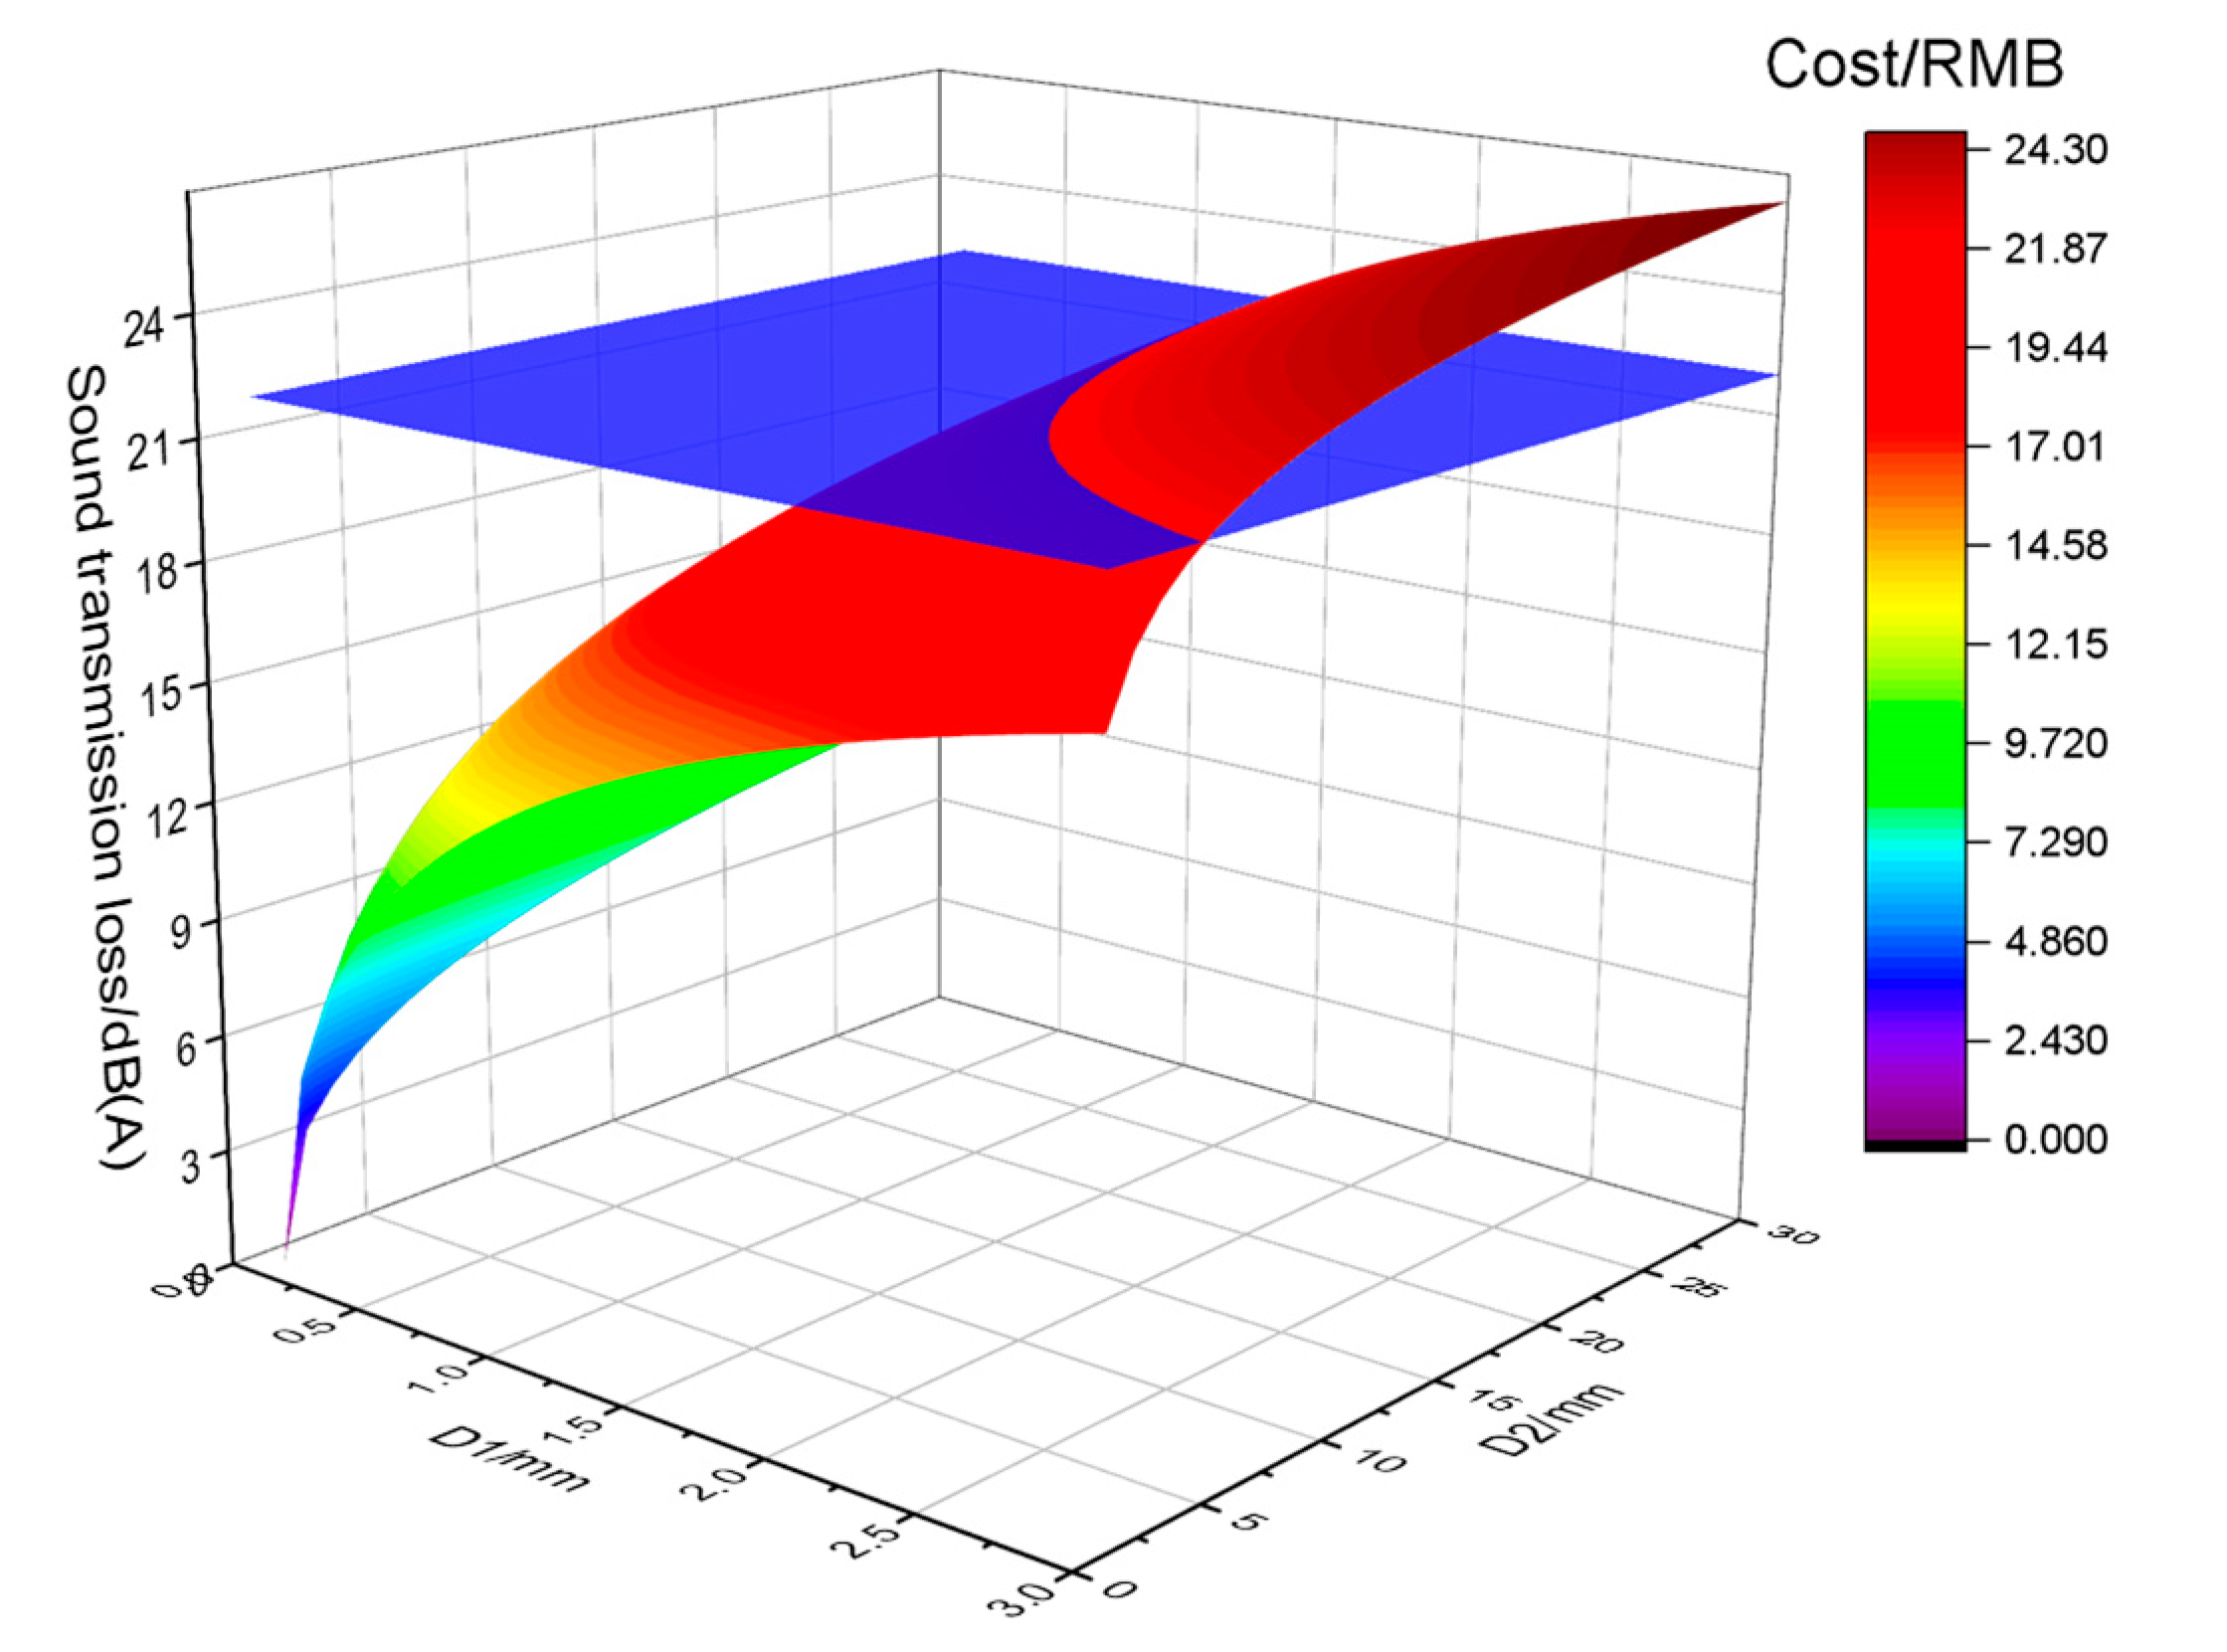
According to the demand of a project, the sound transmission loss is required to reach 22 dB (A). Equation (2) in Section 4.1 indicates that there are many combinations that meet the condition. As shown in Figure 6, the sound transmission loss of 22 dB (A) can be regarded as a blue plane. The sound transmission loss calculated using Equation (2) is on a curved surface. The intersection of these two surfaces denotes all the points that meet the conditions, and the detail points data are shown in Appendix A. These points correspond to the parameters of polyvinyl chloride and non-woven fibers with different thicknesses, respectively.
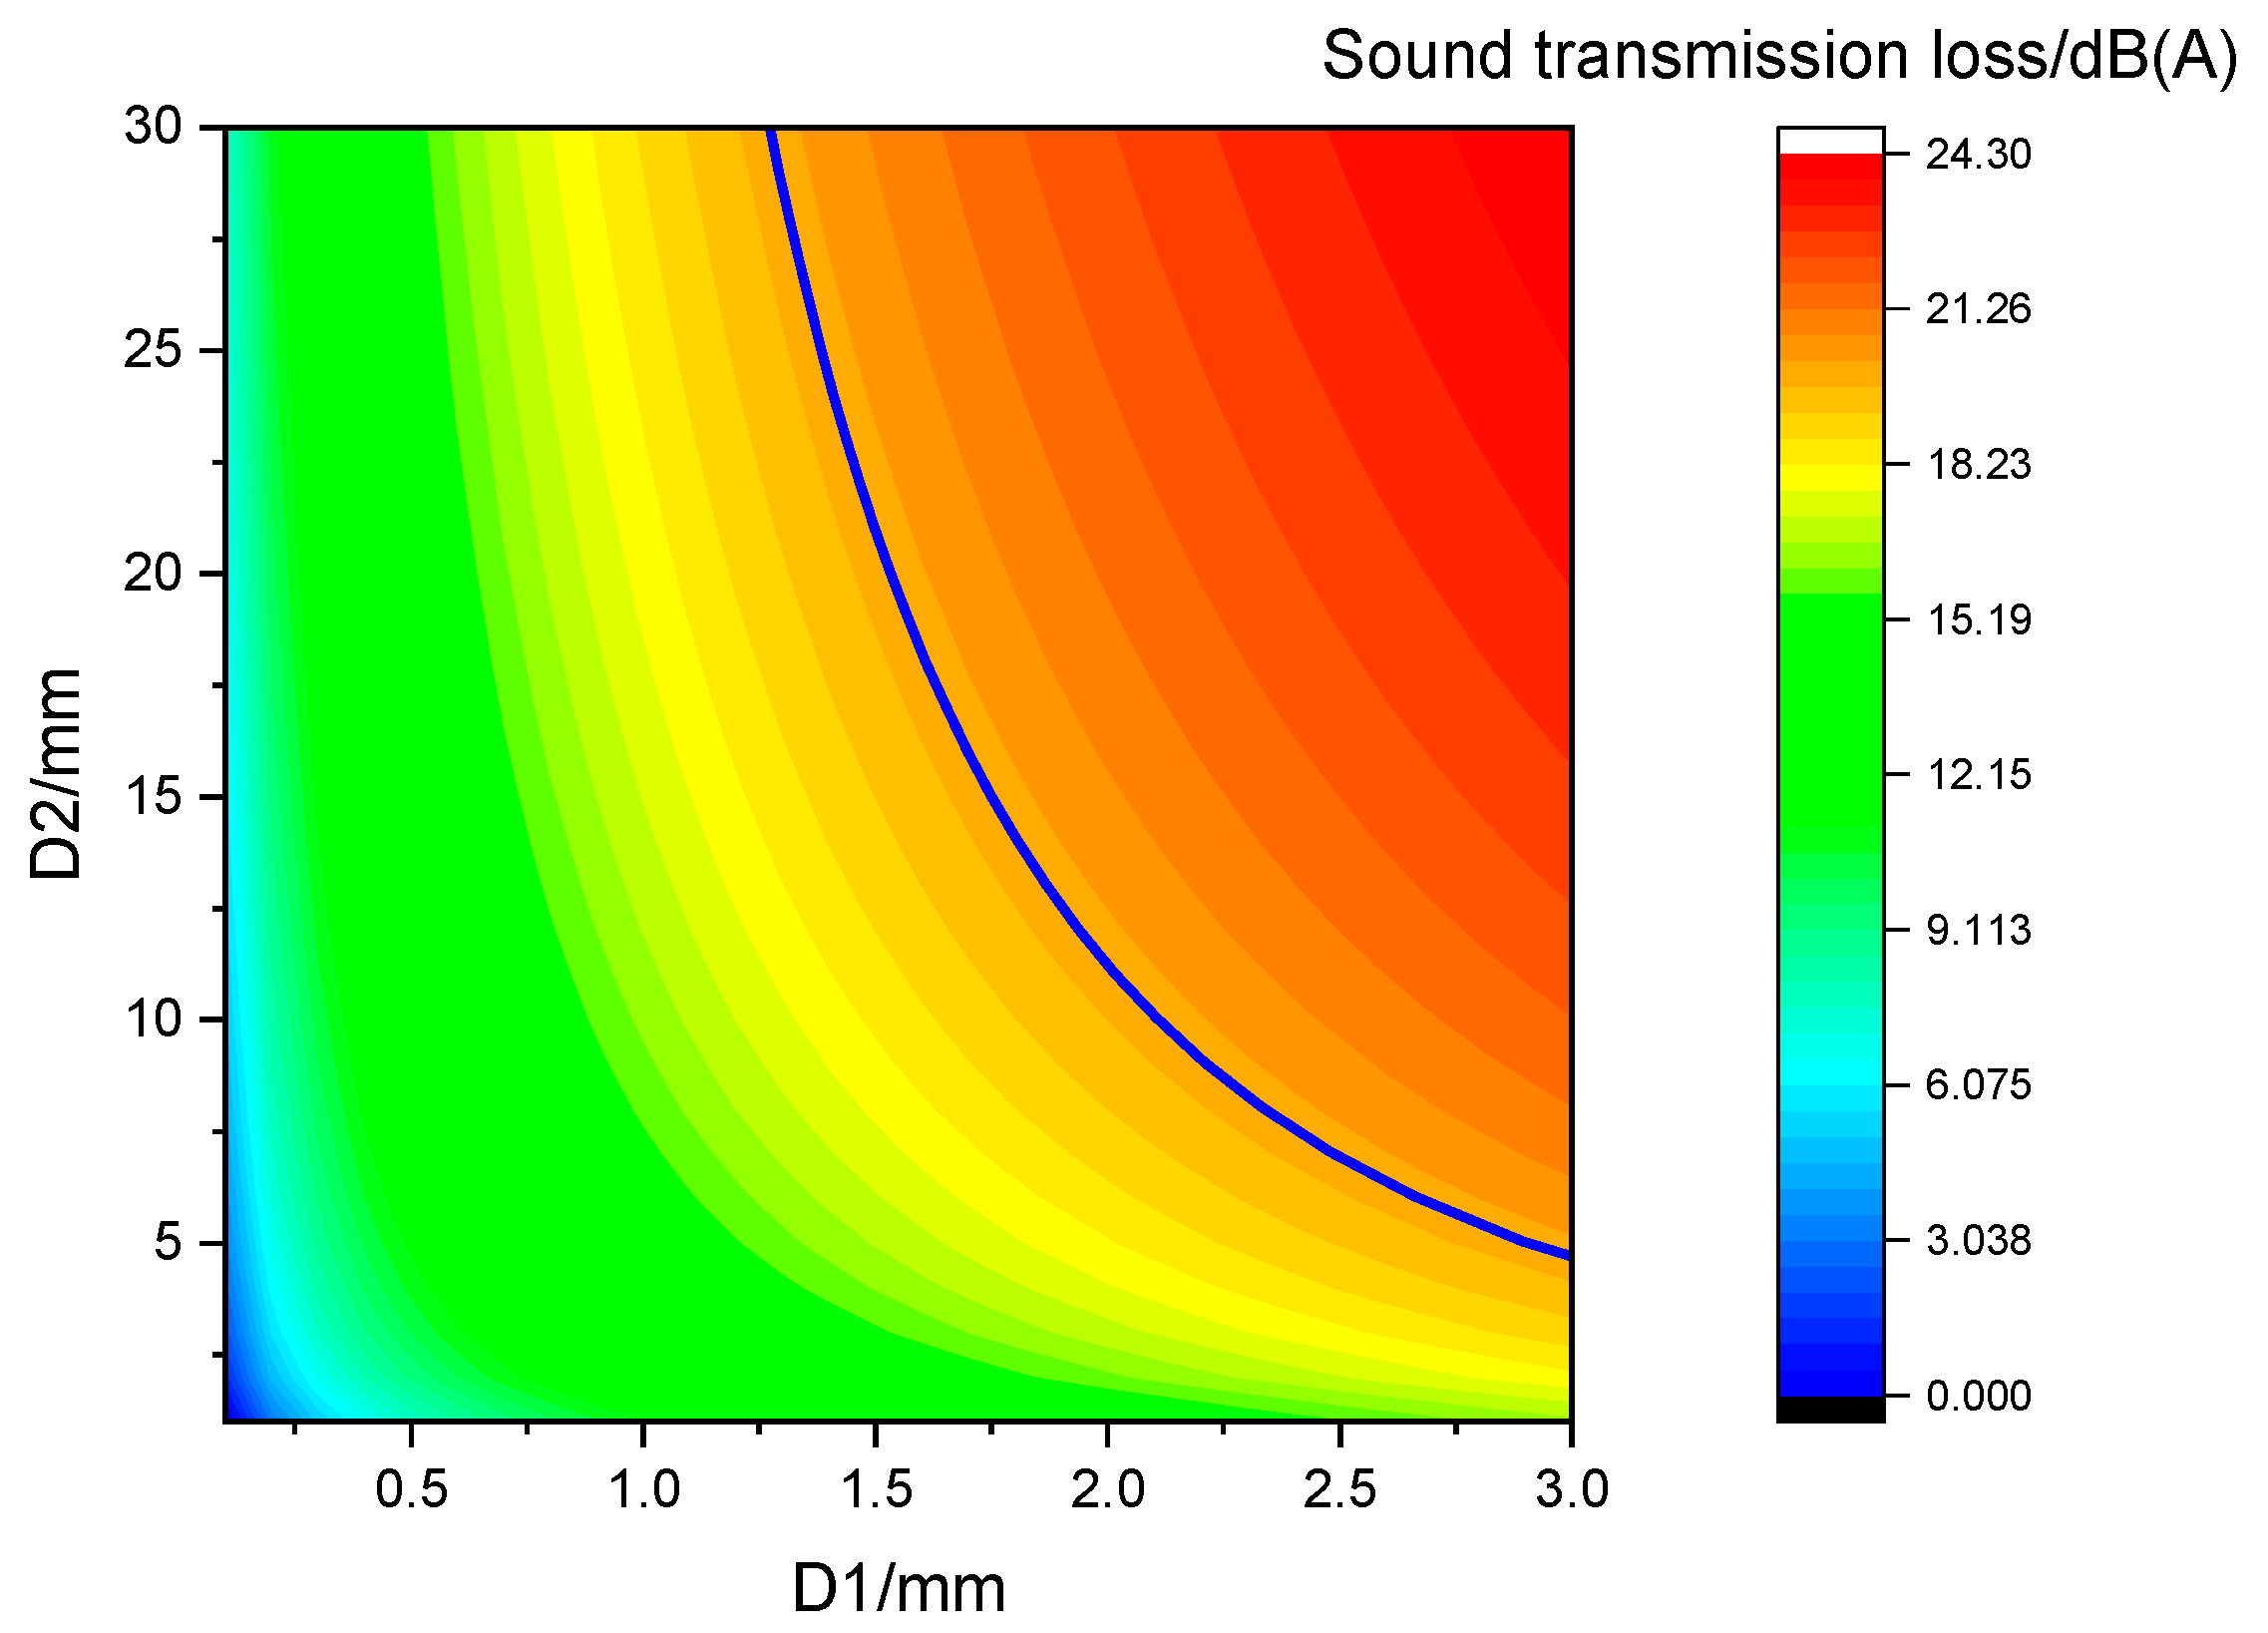
From Figure 7, we can see more clearly that the sound transmission loss expressed by the blue solid line is 22 dB (A), and the parameter combination located in the upper right area of the blue solid line represents that the sound transmission loss is greater than 22 dB (A). According to the engineering requirements, we can continue to draw on several areas to facilitate the rapid search for engineering applications.
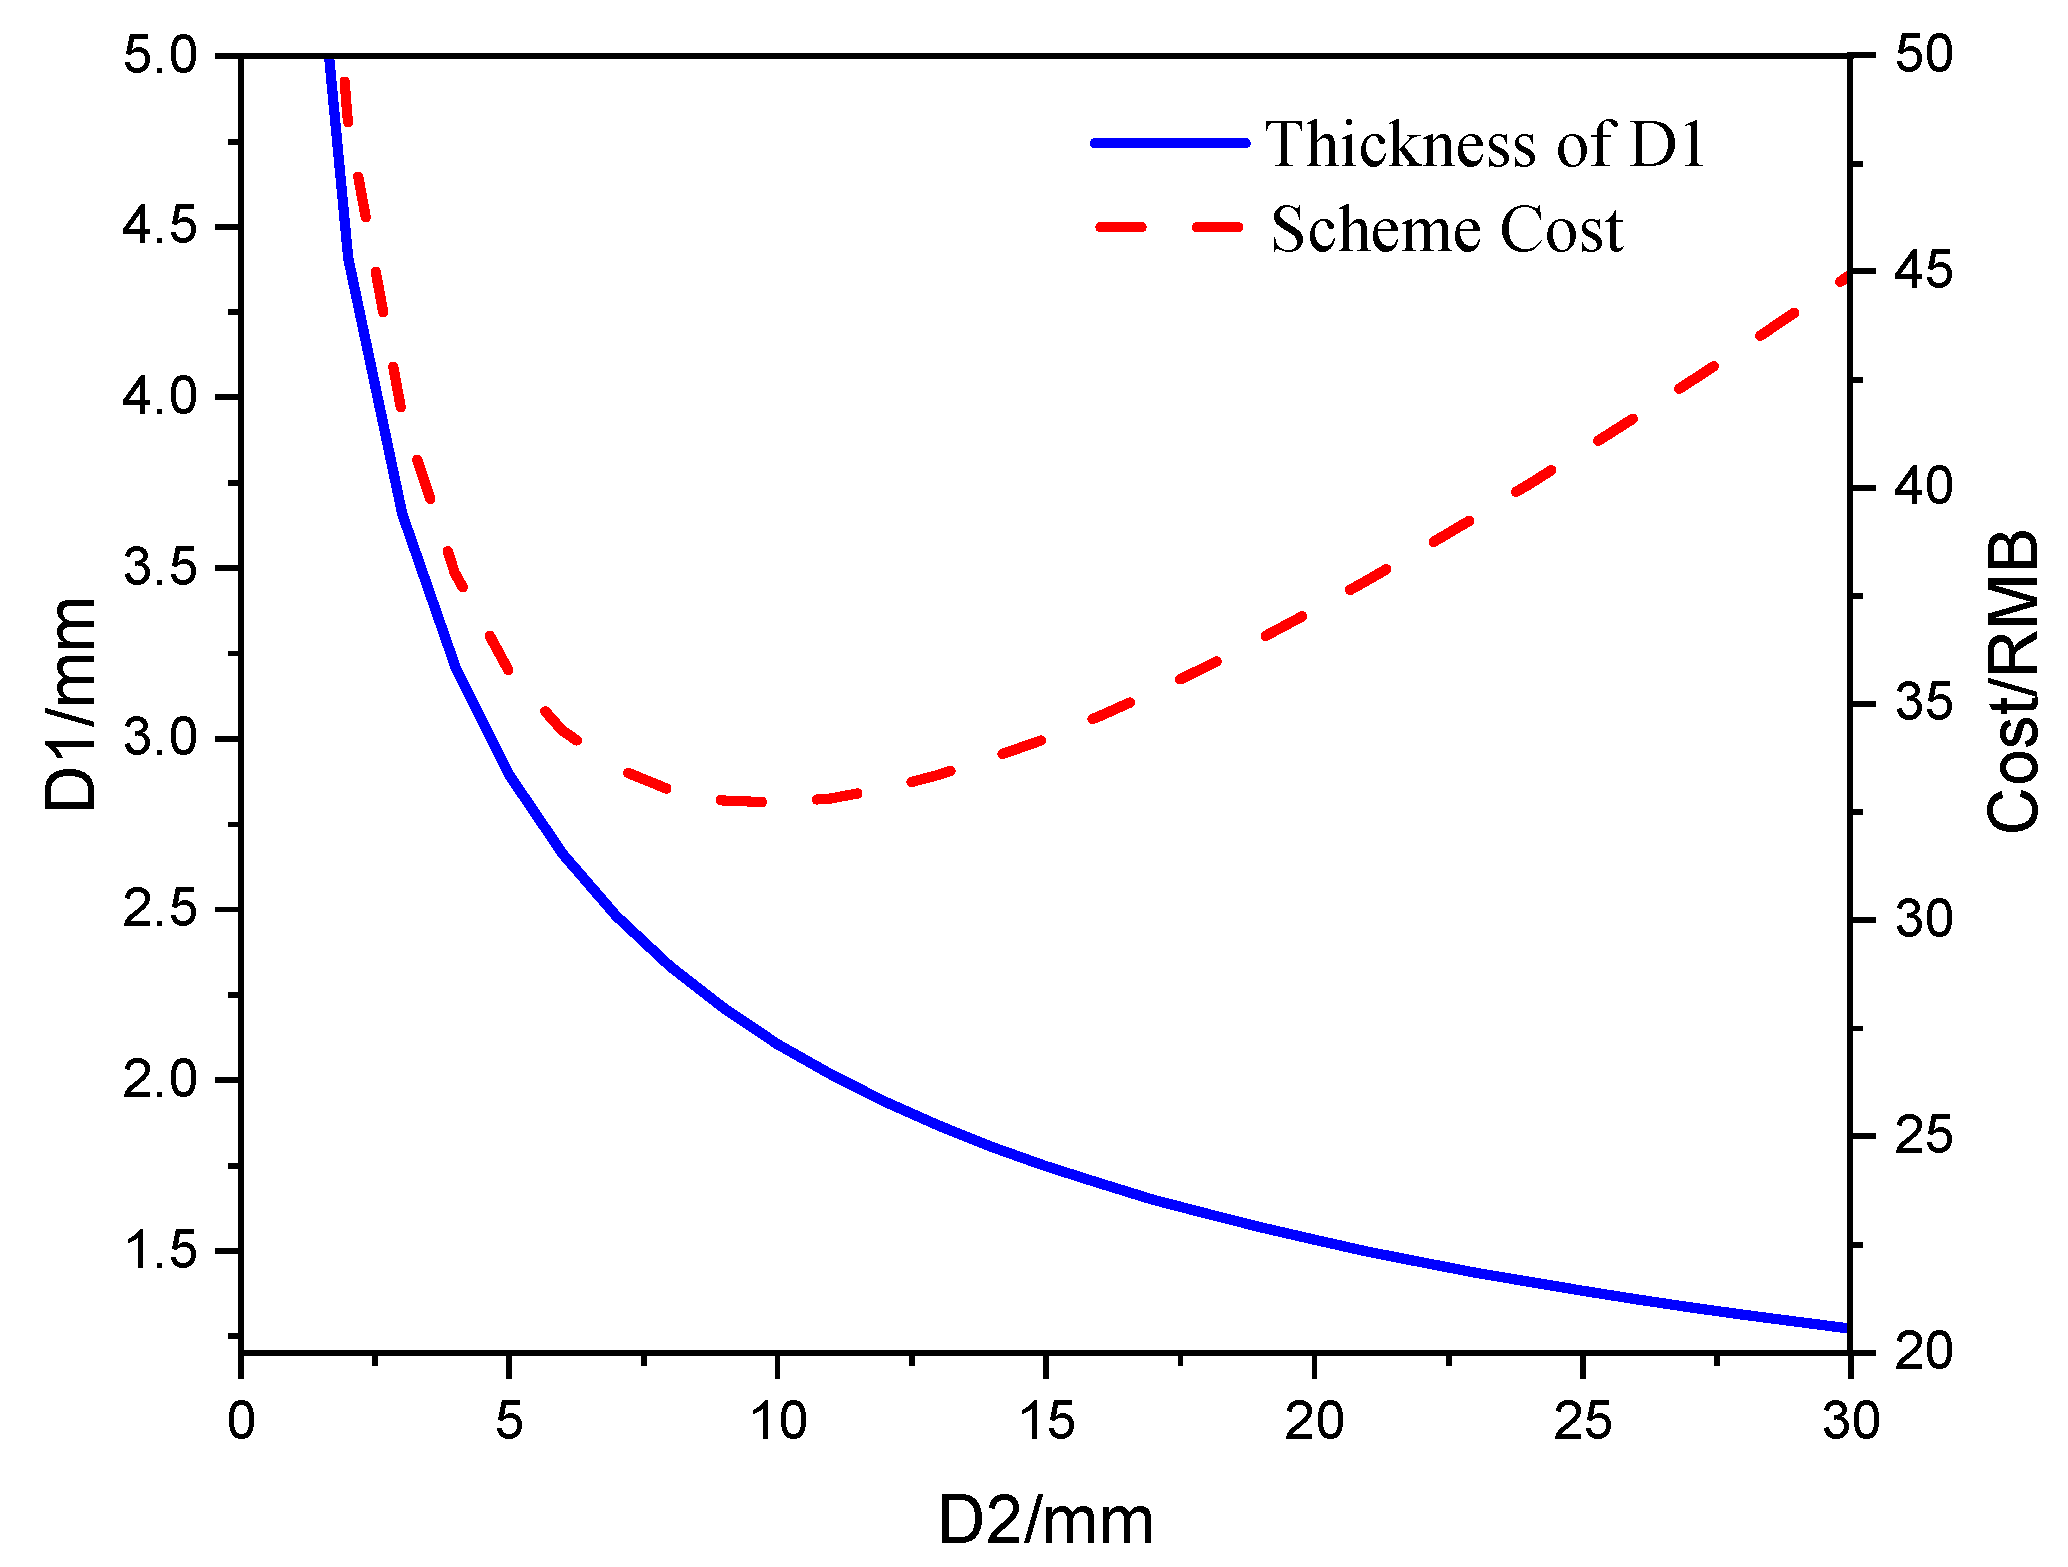
A numerical calculation program based on Python is compiled to calculate the combination of parameters that meet the conditions in Figure 6. As shown by the solid blue line in Figure 7, with the increase in D1 (polyvinyl chloride’s thickness), D2 (non-woven fiber’s thickness) decreases, which indicates that the sound transmission loss used by both the non-woven fiber and polyvinyl chloride materials is consistent with the actual physical meaning. In Figure 8, the red dotted line indicates the cost under the corresponding combination scheme of non-woven fiber and polyvinyl chloride’s thickness. With the increase in D1 (polyvinyl chloride’s thickness) and the decrease in D2 (non-woven fiber’s thickness), the total cost of the scheme first decreases and then increases, and there is a minimum. The corresponding thickness of non-woven fiber and polyvinyl chloride is the most cost-effective combination.
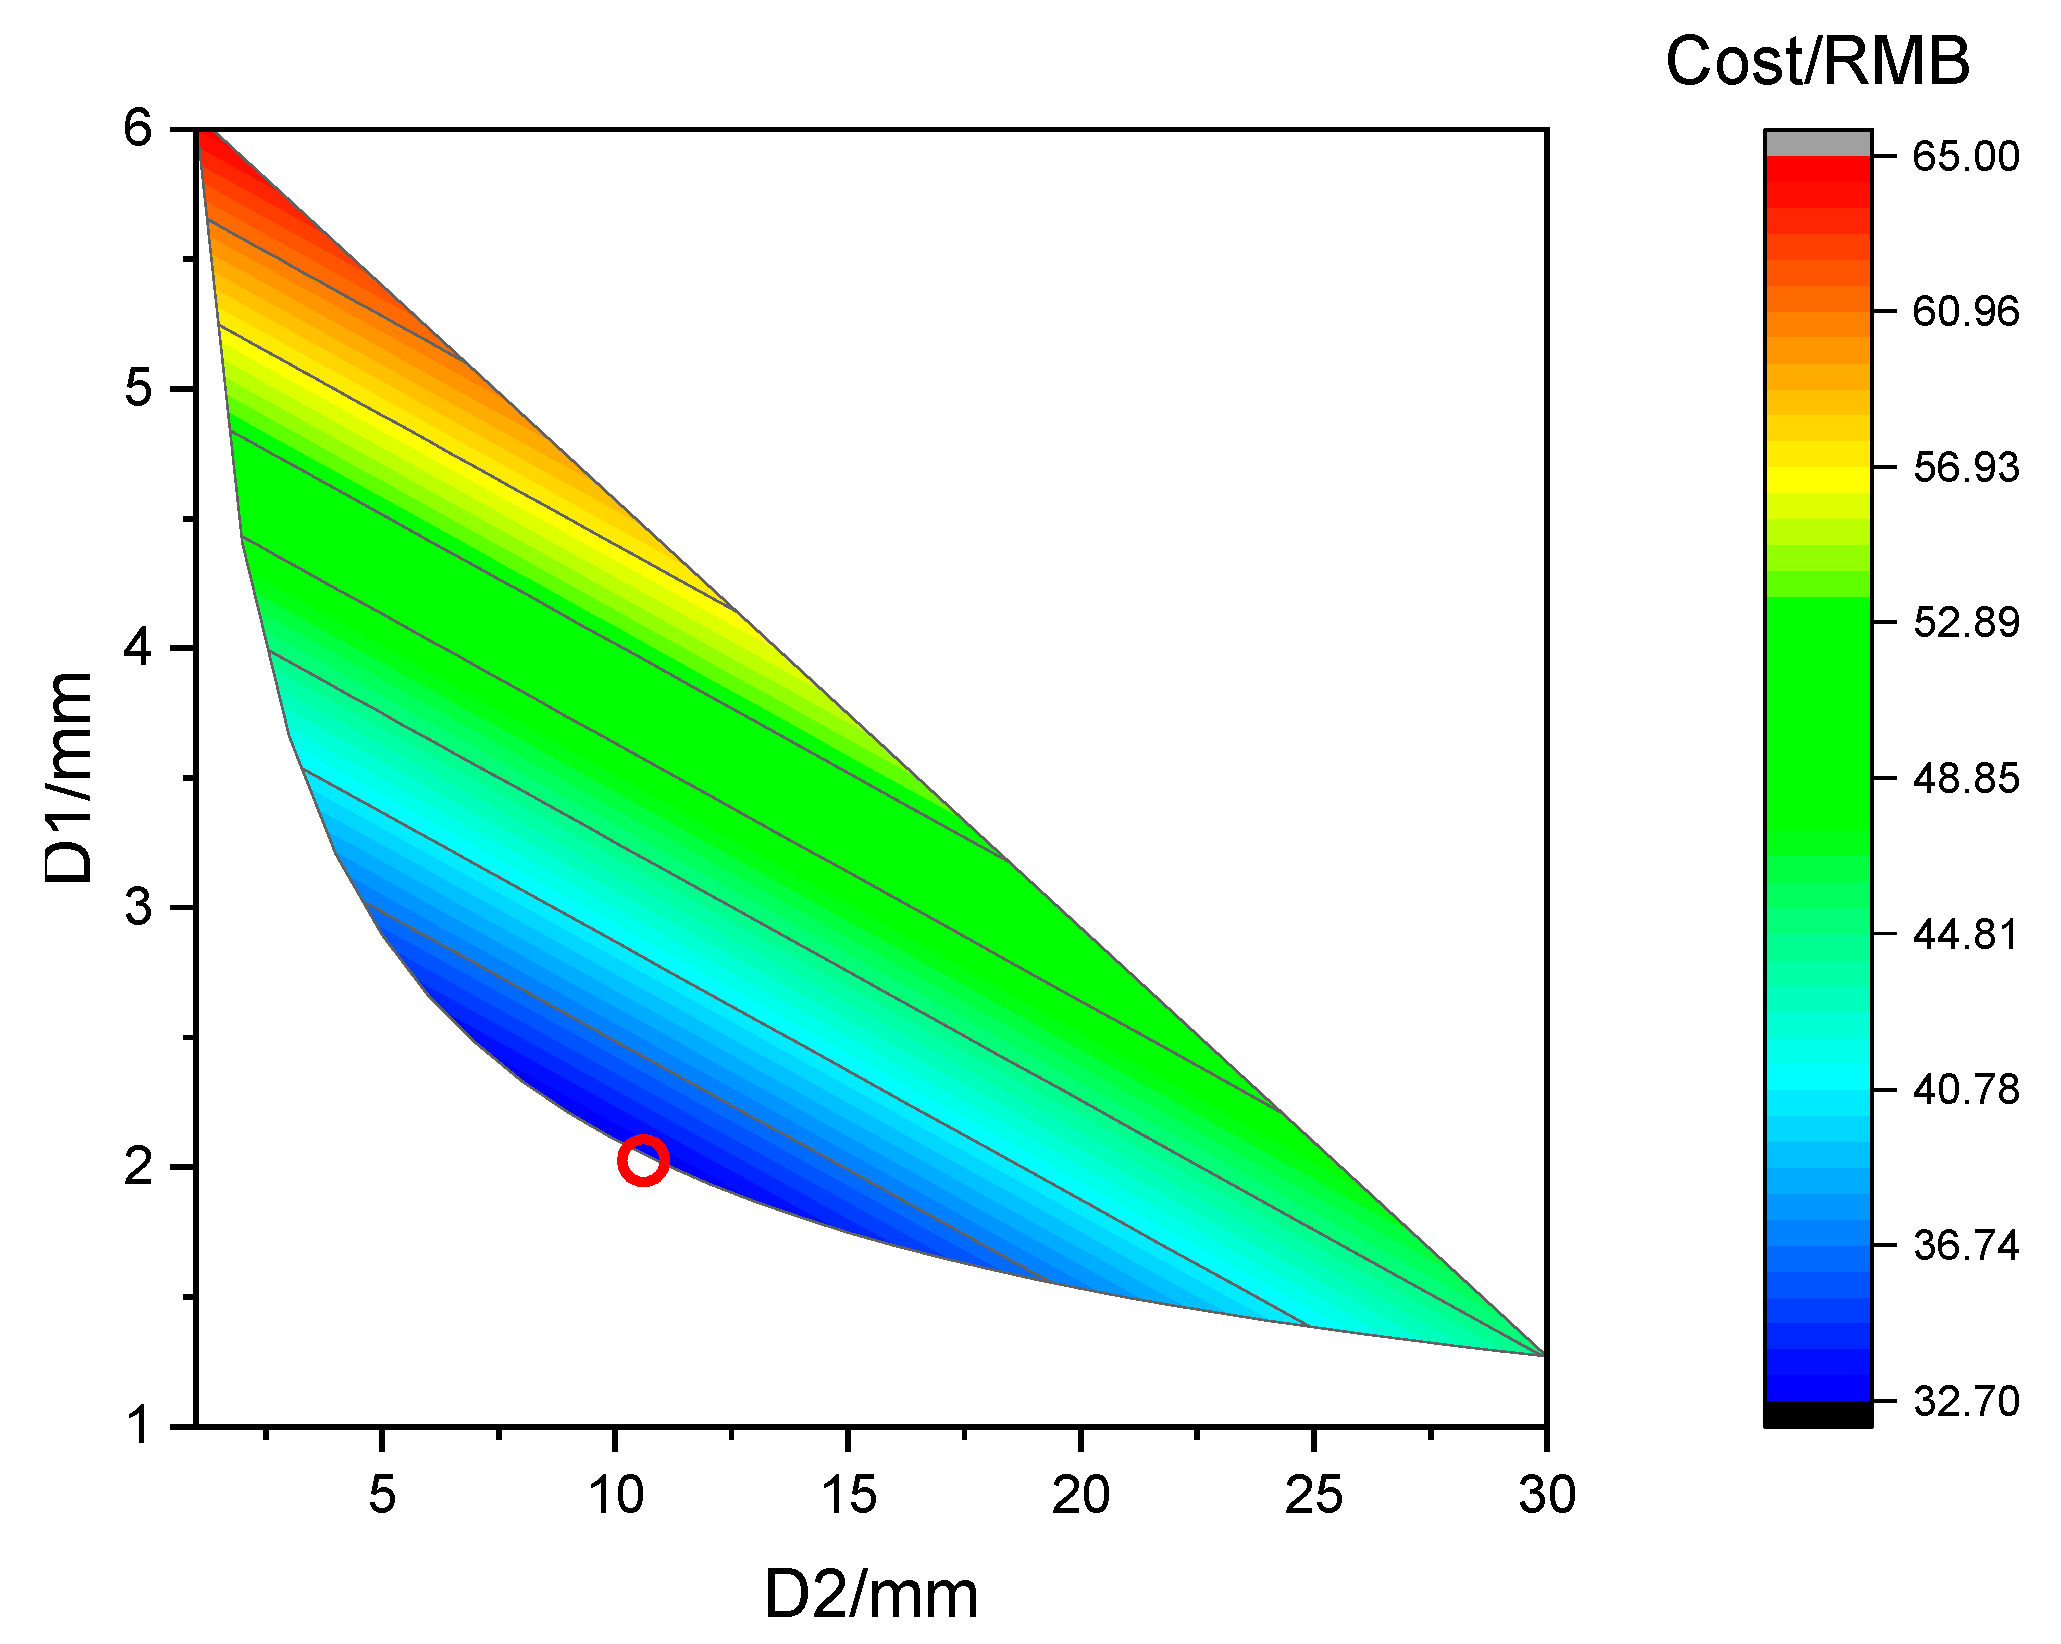
As shown in Figure 9, there are many parameters that meet the sound transmission loss of 22 dB. The solid lines in the Figure 9 correspond to different costs, respectively, and the lowest cost is located at the bottom red circle. According to the optimization purpose of the lowest cost in this paper, the detailed parameters can be obtained, as shown in Table 4.
6. Conclusions
The sound insulation performance of a double-layer composite sound insulation structure of a compressor system was studied, and a corresponding numerical model for the rapid calculation of the sound transmission loss of the double-layer sound insulation structure was established. The conclusions are as follows:
- The sound transmission loss of the sound insulation structure composed of polyvinyl chloride and non-woven fibers with different thicknesses was obtained via the experimental method. The results showed that the noise reduction in the sound insulation structure increased with the increase in the polyvinyl chloride’s thickness; when the thickness of the non-woven fiber increased from 5 to 20 mm, the noise reduction in the sound insulation structure also increased.
- The undetermined coefficient in the calculation formula of the sound transmission loss of the double-layer sound insulation structure was calculated by the least square method, and the numerical model for the rapid calculation of the sound transmission loss of the double-layer sound insulation structure was obtained.
- The accuracy of the model was evaluated by the statistical determination coefficient, and the degree of coincidence of the model was 99.891%. The results proved the effectiveness of the numerical model for the rapid calculation of the sound transmission loss of the double-layer sound insulation structure obtained in this paper.
- Based on the experimental and mathematical methods, an optimal cost numerical model was established to quickly determine the optimal cost design for different schemes with the same effect.
Author Contributions
L.Z. put forward the overall idea, contributed to the theoretical and experimental analyses, and wrote the manuscript. H.Z. contributed to the optimization algorithm. Q.C. contributed to the result discussion. D.L. contributed to the theoretical analysis. All authors have read and agreed to the published version of the manuscript.
Funding
This work is supported by the Guangdong Province Key Areas R&D Program (Grant No. 2019B090917004, 2020B0101320002), the International Science and Technology Cooperation Project of Huangpu (2021GH13), and the GDAS’ Project of Science and Technology Development (2022GDASZH-2022010108).
Data Availability Statement
The data used to support the findings of this study are available from the corresponding author upon request.
Conflicts of Interest
The authors declare no conflict of interest.
Appendix A

Table A1.
Parameter Combinations and Cost Calculations Meeting the 22 dB (A) Sound Isolation.
| D1/mm | D2/mm | Cost/RMB |
|---|---|---|
| 6.059 | 1 | 64.970 |
| 4.408 | 2 | 48.605 |
| 3.660 | 3 | 41.759 |
| 3.207 | 4 | 38.034 |
| 2.895 | 5 | 35.791 |
| 2.662 | 6 | 34.389 |
| 2.481 | 7 | 33.521 |
| 2.333 | 8 | 33.015 |
| 2.210 | 9 | 32.770 |
| 2.106 | 10 | 32.719 |
| 2.016 | 11 | 32.818 |
| 1.937 | 12 | 33.036 |
| 1.867 | 13 | 33.349 |
| 1.805 | 14 | 33.740 |
| 1.749 | 15 | 34.197 |
| 1.697 | 16 | 34.709 |
| 1.651 | 17 | 35.267 |
| 1.608 | 18 | 35.866 |
| 1.569 | 19 | 36.501 |
| 1.532 | 20 | 37.165 |
| 1.498 | 21 | 37.857 |
| 1.467 | 22 | 38.574 |
| 1.437 | 23 | 39.311 |
| 1.409 | 24 | 40.068 |
| 1.383 | 25 | 40.842 |
| 1.358 | 26 | 41.632 |
| 1.335 | 27 | 42.436 |
| 1.313 | 28 | 43.253 |
| 1.292 | 29 | 44.081 |
| 1.272 | 30 | 44.921 |
References
- Zouani, A.; Hanim, S. Overview of noise and vibration in automotive engines. Int. J. Veh. Noise Vib. 2016, 12, 162–181. [Google Scholar] [CrossRef]
- Amares, S.; Sujatmika, E.; Hong, T.W.; Durairaj, R.; Hamid, H.S.H.B. A Review: Characteristics of Noise Absorption Material. J. Phys. Conf. Ser. 2017, 908, 012005. [Google Scholar] [CrossRef] [Green Version]
- Zhang, L.; Shi, H.-M.; Zeng, X.-H.; Zhuang, Z. Theoretical and Experimental Study on the Transmission Loss of a Side Outlet Muffler. Shock. Vib. 2020, 2020, 6927574. [Google Scholar] [CrossRef]
- Wyrwal, J.; Pawelczyk, M.; Liu, L.; Rao, Z. Double-panel active noise reducing casing with noise source enclosed inside—Modelling and simulation study. Mech. Syst. Signal Process. 2020, 152, 107371. [Google Scholar] [CrossRef]
- He, Z.; Han, Y.; Chen, W.; Zhou, M.; Xing, Z. Noise control of a two-stage screw refrigeration compressor. Appl. Acoust. 2020, 167, 107383. [Google Scholar] [CrossRef]
- Dąbrowski, Z.; Dziurdź, J. Simultaneous Analysis of Noise and Vibration of Machines in Vibroacoustic Diagnostics. Arch. Acoust. 2016, 41, 783–789. [Google Scholar] [CrossRef] [Green Version]
- Berardi, U.; Iannace, G. Acoustic characterization of natural fibers for sound absorption applications. Build. Environ. 2015, 94, 840–852. [Google Scholar] [CrossRef]
- Yang, T.; Xiong, X.; Mishra, R.; Novák, J.; Militký, J. Sound absorption and compression properties of perpendicular-laid nonwovens. Text. Res. J. 2018, 89, 612–624. [Google Scholar] [CrossRef]
- Segura-Alcaraz, P.; Segura-Alcaraz, J.; Montava, I.; Bonet-Aracil, M. The effect of the combination of multiple woven fabric and nonwoven on acoustic absorption. J. Ind. Text. 2019, 50, 1262–1280. [Google Scholar] [CrossRef]
- Yang, T.; Hu, L.; Xiong, X.; Petrů, M.; Noman, M.T.; Mishra, R.; Militký, J. Sound Absorption Properties of Natural Fibers: A Review. Sustainability 2020, 12, 8477. [Google Scholar] [CrossRef]
- Rwawiire, S.; Tomkova, B.; Militky, J.; Hes, L.; Kale, B.M. Acoustic and thermal properties of a cellulose nonwoven natural fabric (barkcloth). Appl. Acoust. 2017, 116, 177–183. [Google Scholar] [CrossRef]
- Taban, E.; Tajpoor, A.; Faridan, M.; Samaei, S.E.; Beheshti, M.H. Acoustic Absorption Characterization and Prediction of Natural Coir Fibers. Acoust. Aust. 2019, 47, 67–77. [Google Scholar] [CrossRef]
- Soltani, P.; Norouzi, M. Prediction of the sound absorption behavior of nonwoven fabrics: Computational study and experimental validation. J. Sound Vib. 2020, 485, 115607. [Google Scholar] [CrossRef]
- Gokulkumar, S.; Thyla, P.; Prabhu, L.; Sathish, S. Measuring Methods of Acoustic Properties and Influence of Physical Parameters on Natural Fibers: A Review. J. Nat. Fibers 2019, 17, 1719–1738. [Google Scholar] [CrossRef]
- Zhang, L. Wave propagation characteristics and absorbed energy capability of the electrically doubly curved system rein-forced by nanocomposite on viscoelastic substrate. Mech. Based Des. Struct. Mach. 2021. [Google Scholar] [CrossRef]
- Sun, C.; Li, R.; Chen, Z.; Mei, Y.; Wang, X.; Li, C.; Liu, Y. Research on Vibration Suppression Method Based on Coaxial Stacking Measurement. Mathematics 2021, 9, 1438. [Google Scholar] [CrossRef]
- Gao, N.; Hou, H. Low frequency acoustic properties of a honeycomb-silicone rubber acoustic metamaterial. Mod. Phys. Lett. B 2017, 31, 1750118. [Google Scholar] [CrossRef]
- Gao, N.; Hou, H.; Mu, Y. Low frequency acoustic properties of bilayer membrane acoustic metamaterial with magnetic oscillator. Theor. Appl. Mech. Lett. 2017, 7, 252–257. [Google Scholar] [CrossRef]
- Zarastvand, M.R.; Asadijafari, M.H.; Talebitooti, R. Acoustic wave transmission characteristics of stiffened composite shell systems with double curvature. Compos. Struct. 2022, 292, 115688. [Google Scholar] [CrossRef]
- Seilsepour, H.; Zarastvand, M.; Talebitooti, R. Acoustic insulation characteristics of sandwich composite shell systems with double curvature: The effect of nature of viscoelastic core. J. Vib. Control. 2022, 29, 1076–1090. [Google Scholar] [CrossRef]
- Asadijafari, M.H.; Zarastvand, M.R.; Talebitooti, R. The effect of considering Pasternak elastic foundation on acoustic insulation of the finite doubly curved composite structures. Compos. Struct. 2021, 256, 113064. [Google Scholar] [CrossRef]
- Pollice, R.; Gomes, G.D.P.; Aldeghi, M.; Hickman, R.J.; Krenn, M.; Lavigne, C.; Lindner-D’Addario, M.; Nigam, A.; Ser, C.T.; Yao, Z.; et al. Data-Driven Strategies for Accelerated Materials Design. Acc. Chem. Res. 2021, 54, 849–860. [Google Scholar] [CrossRef]
- Carrara, P.; De Lorenzis, L.; Stainier, L.; Ortiz, M. Data-driven fracture mechanics. Comput. Methods Appl. Mech. Eng. 2020, 372, 113390. [Google Scholar] [CrossRef]
- Karapiperis, K.; Stainier, L.; Ortiz, M.; Andrade, J.E. Data-driven multiscale modeling in mechanics. J. Mech. Phys. Solids 2021, 147, 104239. [Google Scholar] [CrossRef]
- Salissou, Y.; Panneton, R. A general wave decomposition formula for the measurement of normal incidence sound transmission loss in impedance tube. J. Acoust. Soc. Am. 2009, 125, 2083–2090. [Google Scholar] [CrossRef]
- Su, J.; Zheng, L.; Deng, Z. Study on acoustic properties at normal incidence of three-multilayer composite made of glass wool, glue and polyurethane foam. Appl. Acoust. 2019, 156, 319–326. [Google Scholar] [CrossRef]
- Li, Z.; Chen, S.; Wu, Z.; Yang, L. An improved approach for normal-incidence sound transmission loss measurement using a four-microphone impedance tube. J. Vib. Control. 2020, 27, 332–342. [Google Scholar] [CrossRef]
- Kirchdoerfer, T.; Ortiz, M. Data-driven computing in dynamics. Int. J. Numer. Methods Eng. 2018, 113, 1697–1710. [Google Scholar] [CrossRef] [Green Version]
- Arridge, S.; Maass, P.; Öktem, O.; Schönlieb, C.B. Solving inverse problems using data-driven models. Acta Numer. 2019, 28, 1–174. [Google Scholar] [CrossRef] [Green Version]
- Li, X.; Yan, Z.; Liu, Z.; Zhuo, Z. Advanced structural material design based on simulation and data-driven method. Adv. Mech. 2021, 51, 82–105. [Google Scholar]
- Li, X.; Ning, S.; Liu, Z.; Yan, Z.; Luo, C.; Zhuang, Z. Designing phononic crystal with anticipated band gap through a deep learning based data-driven method. Comput. Methods Appl. Mech. Eng. 2019, 361, 112737. [Google Scholar] [CrossRef]
- Malkiel, I.; Mrejen, M.; Nagler, A.; Arieli, U.; Wolf, L.; Suchowski, H. Deep learning for the design of nano-photonic structures. In Proceedings of the 2018 IEEE International Conference on Computational Photography (ICCP), Pittsburgh, PA, USA, 4–6 May 2018; IEEE: New York, NY, USA, 2018; pp. 1–14. [Google Scholar]
- Li, X.; Liu, Z.; Cui, S.; Luo, C.; Li, C.; Zhuang, Z. Predicting the effective mechanical property of heterogeneous materials by image based modeling and deep learning. Comput. Methods Appl. Mech. Eng. 2019, 347, 735–753. [Google Scholar] [CrossRef] [Green Version]
- Luo, C.; Ning, S.; Liu, Z.; Zhuang, Z. Interactive inverse design of layered phononic crystals based on reinforcement learning. Extrem. Mech. Lett. 2020, 36, 100651. [Google Scholar] [CrossRef]
- Wang, X.; Zhang, L. Physics-informed neural networks: A deep learning framework for solving the vibrational problems. Adv. Nano Res. 2021, 11, 495–519. [Google Scholar]
- Zeng, X.; Zhang, L.; Yu, Y.; Shi, M.; Zhou, J. The stiffness and damping characteristics of a dual-chamber air spring device applied to motion suppression of marine structures. Appl. Sci. 2016, 6, 74. [Google Scholar] [CrossRef] [Green Version]
- Zeng, X.; Zhang, L.; Yu, F.; Zhou, J. The effect of an orifice plate with different orifice numbers and shapes on the damping characteristics of a dual-chamber air spring. J. Vibroengineering 2017, 19, 2375–2389. [Google Scholar] [CrossRef] [Green Version]
- Renaud, O.; Victoria-Feser, M.P. A robust coefficient of determination for regression. J. Stat. Plan. Inference 2010, 140, 1852–1862. [Google Scholar] [CrossRef] [Green Version]
- Dougherty, E.R.; Kim, S.; Chen, Y. Coefficient of determination in nonlinear signal processing. Signal Process. 2000, 80, 2219–2235. [Google Scholar] [CrossRef]
Figure 1.
Schematic diagram of double-layer sound insulation structures.

Figure 2.
Schematic diagram of the sound insulation test for the sound insulation structure.

Figure 3.
Schematic diagram of noise and vibration acquisition.

Figure 4.
Comparison between the predicted and experimental values of the mathematical model for the rapid calculation of sound insulation.
Figure 4.
Comparison between the predicted and experimental values of the mathematical model for the rapid calculation of sound insulation.

Figure 5.
Optimal cost calculation model diagram.

Figure 6.
Parameter combinations meeting the sound insulation conditions (3D plot).

Figure 7.
Parameter combinations meeting the sound insulation conditions (2D plot).

Figure 8.
Cost corresponding to the parameter combination scheme.

Figure 9.
Cost diagram meeting the parameters of 22 dB (A) sound insulation.

Table 1.
Experimental scheme design and number of sound insulation structures.
| Polyvinyl Chloride Thickness/mm | Non-Woven Fiber Thickness/mm | ||||
|---|---|---|---|---|---|
| 0 | 5 | 10 | 15 | 20 | |
| 0 | a | ||||
| 1.5 | b | ||||
| 2 | c | e | g | ||
| 3 | d | f | h | i | |
Table 2.
Experimental results of the sound insulation structure scheme.
| Scheme No. | Noise Value/dB (A) | Sound Insulation/dB (A) |
|---|---|---|
| a | 73.75 | 0 |
| b | 55.03 | 18.72 |
| c | 53.65 | 20.1 |
| d | 51.58 | 22.17 |
| e | 51.88 | 21.87 |
| f | 49.9 | 23.85 |
| g | 51.1 | 22.65 |
| h | 49.12 | 24.63 |
| i | 48.49 | 25.26 |
Table 3.
Cost per unit area of polyvinyl chloride and non-woven fiber.
| No. | Name | Price |
|---|---|---|
| 1 | Polyvinyl Chloride | 10.55 |
| 2 | Non-Woven Fiber | 1.05 |
Table 4.
Optimal parameter combination of polyvinyl chloride and non-woven fiber (sound transmission loss of 22 dB (A)).
Table 4.
Optimal parameter combination of polyvinyl chloride and non-woven fiber (sound transmission loss of 22 dB (A)).
| D1/mm | D2/mm | Cost/RMB |
|---|---|---|
| 2.106 | 10 | 32.719 |
Disclaimer/Publisher’s Note: The statements, opinions and data contained in all publications are solely those of the individual author(s) and contributor(s) and not of MDPI and/or the editor(s). MDPI and/or the editor(s) disclaim responsibility for any injury to people or property resulting from any ideas, methods, instructions or products referred to in the content. |
© 2023 by the authors. Licensee MDPI, Basel, Switzerland. This article is an open access article distributed under the terms and conditions of the Creative Commons Attribution (CC BY) license (https://creativecommons.org/licenses/by/4.0/).
Share and Cite
MDPI and ACS Style
Zhang, L.; Zhang, H.; Chen, Q.; Long, D. A Mathematical Approach for Sound Insulation Characteristics and Cost Optimization of Double-Layer Composite Structures. J. Compos. Sci. 2023, 7, 110. https://doi.org/10.3390/jcs7030110
AMA Style
Zhang L, Zhang H, Chen Q, Long D. A Mathematical Approach for Sound Insulation Characteristics and Cost Optimization of Double-Layer Composite Structures. Journal of Composites Science. 2023; 7(3):110. https://doi.org/10.3390/jcs7030110
Chicago/Turabian StyleZhang, Liang, Huawei Zhang, Qiyu Chen, and Danfeng Long. 2023. "A Mathematical Approach for Sound Insulation Characteristics and Cost Optimization of Double-Layer Composite Structures" Journal of Composites Science 7, no. 3: 110. https://doi.org/10.3390/jcs7030110