Article

Significance of Sandwich Panel’s Core and Design on Its Impact Resistance under Blast Load

Engineering Systems Management, Department of Industrial Engineering, American University of Sharjah, Sharjah P.O. Box 26666, United Arab Emirates
*
Author to whom correspondence should be addressed.
J. Compos. Sci. 2023, 7(2), 44; https://doi.org/10.3390/jcs7020044
Submission received: 12 November 2022 / Revised: 29 December 2022 / Accepted: 6 January 2023 / Published: 17 January 2023
(This article belongs to the Topic Composites in Aerospace and Mechanical Engineering)

Abstract

:
Extensive research is conducted on enhancing the blast mitigation performance of the sandwich panels by examining different design parameters, and core geometries. Nevertheless, there is no direct comparison between those alternatives to evaluate their contribution to maximizing energy absorption. In this research, three core designs honeycomb, mushroom, and tubular were compared to determine the influence of core shape on the panel’s impact resistance against blast load. In addition to varying core shapes, the effect of plate thickness and the spacing between the core shapes are also examined. Finite element analysis was used to evaluate the performance of these designs. Twenty-seven numerical experiments were performed and then analyzed using regression analysis. Results reveal that the tubular sandwich panel exhibited minimum deformation, and least damage and contributed to the highest kinetic energy dissipation. On the other hand, honeycomb core structures recorded the highest internal energy dissipation, largest deformation, and damage. Despite those differences, core shape and core spacing were not as influential in resisting blast load compared to plate thickness. Facade plate thickness was the most significant factor. Results suggest that more research needs to be targeted toward enhancing façade plate stiffness for better mitigation of blast load.

1. Introduction

Sandwich panels are used in various applications including structural, transportation, aerospace, and marine [1,2]. Due to their capability to dissipate impact energy by plastic deformation of the core structure and the faceplates, sandwich panels can be used as sacrificial cladding against impact or blast load [3]. However, they are highly vulnerable to damage [4,5,6], which reduces the sandwich panel’s load-carrying ability, compromising the intended functionality of the sandwich structure, and shortening its service life [7,8,9]. Researchers investigated the enhancement of sandwich panel properties under impact load by varying the sandwich panel design and materials. Chi et al. [2] and Alberdi et al. [3] explored the effect of varying the core and the plate thicknesses [2] and [3]. Chi et al. [2] experimentally investigated the effect of changing the dimensions of the sandwich panel, by varying the plate and core thickness, on the blast loading resistance of a honeycomb sandwich panel. They performed 41 experiments on specimens with different core heights (i.e., 29 and 150 mm) and plate thicknesses (i.e., 1 and 1.6 mm). All specimens were sandwich panels with a core consisting of a circular core with a 106 mm diameter and an outer hexagonal shape. The honeycomb core was made of AA3003 aluminum alloy with different wall thicknesses of 0.07, 0.08, and 0.11 mm. The blast load was generated using a 34 mm cylindrical disc of PE4 placed at the opening end of the blast tube. Chi et al. [2] concluded that the core provided support to the front plate and adjusted the rate of stress impacting the backplate. Increasing core thickness resulted in densifying the core upon impact resulting in lower core crushing ratios. In addition, plates with small thicknesses impacted with lower impulses resulted in higher loads transferred to the backplates causing them to tear. Others like Gu et al. [10], Sun et al. [11], and Huo et al. [12] researched the effect of varying the material like carbon fiber, steel, and aluminum alloy. Gu et al. [10] numerically and experimentally investigated the structural response of the carbon fiber sandwich panels under blast load. The sandwich panels consisted of a core of Rohacell 71 IG polyurethane rigid foam sandwiched between two six-ply unidirectional carbon fiber prepreg tape face sheets. The blast source was generated from rupturing different stacks of 0.025 mm thick Mylar membrane plies. Experimental results revealed that the reflected maximum impulse was higher than the incident impulse. Higher levels of blast intensity resulted in increasing the incident peak overpressure and maximum pulse, increasing the face-sheet deformation, and decreasing the oscillation frequency. In addition, Gu et al. [10] concluded from the numerical models’ responses that a high deflection effect on the back face-sheet occurred due to high peak overpressure. Additionally, the deformation profiles showed sinusoidal damping behaviors where the front face-sheets behavior opposed the back face-sheets behavior. In addition, the sandwich panels showed better blast performance with thicker face sheets and core structure. Sun et al. [11] and Huo et al. [12] investigated the blast mitigation performance of sandwich panels with different face sheet materials. The materials used varied between aluminum alloy, steel, glass fiber-reinforced plastic (GFRP), and carbon fiber-reinforced plastic (CFRP). The results revealed that aluminum provided a good blast resistance, especially when used as a front face sheet, compared to steel, carbon fiber reinforced plastic, and glass fiber reinforced plastic. Sun et al. [11] concluded that the sandwich panel with an aluminum front face sheet and steel back sheet showed better blast resistance compared to a sandwich panel with a steel front face sheet and aluminum back sheet. In comparison, Huo et al. [12] indicated that sandwich panels with aluminum face sheets showed a good energy absorption capability. In addition to investigating the effect of different face sheet materials, Sun et al. [11] examined the effect of aluminum foam core with uniform density and four graded densities and concluded that increasing the core gradients enhances the blast resistance of the sandwich panel.
The effect of varying the core structure was also investigated. Cheng et al. [13] and Yuen et al. [14] examined different sandwich panels’ core structures by investigating the blast mitigation performance of cladding sandwich panels with tubular cores. Yuen et al. [14] performed different sets of experiments by varying the charge mass, the number of tubes, the spacing between tubes, and the core fillers. While Cheng et al. [13] performed different numerical blast experiments using ANSYS AutoDYN 15.0 software to study the effect of the number of the core tubes, spacing gaps between the tubes, and the material of the tubular core on changing the front plate displacement relative to the back plate. The numerical model was used to investigate the energy absorption capability of the sandwich panel by changing the tubular core’s wall thickness. Cheng et al. [13] and Yuen et al. [14] concluded that the blast load transfer from the top plate to the backplate was reduced by the plastic deformation of the tubular core. The interaction among the tubular cores was negatively correlated to the deflection of the top plate. Likewise, Chen et al. [15] experimentally and numerically investigated the blast mitigation performance of sacrificial cladding with square honeycomb and square dome-shape kirigami (SDK) fold core sandwich structure and cladding with aluminum foam core. The laboratory experiments were performed on unfixed four cells of SDK using a quasi-static compression test with a loading rate of 1 mm/min. The SDK structure was made of a 0.26 mm thick aluminum sheet and had a dimension of 80 × 80 × 20 mm for the length of the top edge, length of the bottom edge, and height of the core, respectively. The blast loads were simulated using 1, 2, 4, and 6 kg of TNT placed at a standoff distance of 1500 mm from the center of the top plate of the claddings. Chen et al. [15] concluded that under the same blast load, the SDK fold core showed lower initial peak crushing stress and higher crushing resistance compared to the square honeycomb. The SDK fold core had a collapsing resistance similar to the aluminum foam core but a higher average crushing force.
The effect of varying sandwich panel plate thickness as well as novel sandwich panel core designs was also studied. Alberdi et al. [3] numerically studied and compared the performance of sandwich panels with different core shapes, including hexagonal honeycomb, square honeycomb, triangular honeycomb, diamond folded, triangular folded, Y-Frame folded, and three orthotropic core shapes, against blast loading. Alberdi et al. [3] concluded that diamond-folded core shapes outperformed in mitigating the blast impact with a blast load source of 0.5 kg of TNT. However, with a blast load of 4 kg of TNT, the hexagonal and the square honeycomb outperformed the folded core shapes in blast mitigation performance. In addition, the orthogonal folded core shapes resulted in the least backplate deflection, which was the best in mitigating blast loads, including large blast loads. Similarly, Adaba and Ibrahim [16] explored a novel and a new sandwich panel core shape, namely ribbon core sandwich panels (RCSPs). They investigated the effect of plate thickness on plate deformations and energy dissipation and the effect of the core thickness on the blast mitigation performance. Two sandwich panel core designs were proposed based on the existing designs of trapezoidal and triangular corrugated sandwich panels. The core consisted of two perpendicular folded strips shaping a ribbon pattern. The two examined RCSPs were trapezoidal corrugated ribbon core and triangular corrugated ribbon core sandwich panels. The new proposed designs were numerically experimented against blast load using the hydro-code program (AUTODYN) and the finite element assembly software (ANSYS), and the 55 g of TNT explosive were modeled at different standoff distances of 50, 100, and 150 mm. Adaba and Ibrahim [16] concluded that RCSPs showed better blast mitigation performance compared to ordinary corrugated core sandwich panels. The numerical results showed that increasing the front plate thickness caused an increase in the plate stiffness, resulting in a decrease in the backplate deformation. While the increase in the backplate thickness led to a decrease in the backplate deflection. In addition, the energy dissipation was increased with the decrease in the thickness of the front plate; however, the thin front plate encountered tearing damage with a large blast loading impact. In addition, the increase in the core thickness reduced the blast mitigation performance of the sandwich panel.
Despite the literature showing an abundance of research investigating different methods and mechanisms to enhance the blast mitigation performance of sandwich panels by studying the effect of the structure thickness or design, there is relatively little work comparing and defining the significance of those structural designs and core shape changes. The work done due to the external forces from the blast load is converted into kinetic energy, recoverable elastic strain energy, and inelastic dissipated energy (plastic/damage). Inelastic deformation of the core structure plays a major role in absorbing impact energy, decreasing the impact forces and their duration. In this research, the influence of varying the core structure will be examined and compared using numerical models to determine the role each factor plays in terms of energy dissipation. The numerical models are developed using Abaqus/CAE 2021 Finite elements analysis (FEA) software. The numerical model was validated by comparing façade plate deformation to experimental results obtained from Kumar and Patel [17].

2. Methodology

Numerical methods are used to study the behavior of the sandwich panels with different design attributes under impact load. To properly plan the experiments to be conducted a 3-level full factorial design is used. The results are then studied and analyzed using regression analysis. Figure 1 shows a schematic of the problem analyzed. The sandwich panel under study consists of two 650 × 650 mm faceplates and a core structure in between. Both the faceplates and core are assumed to be made of the same material which is AISI 4340 low-carbon steel. The panel is subjected to an air blast load created from 3 kg of TNT explosives placed at a standoff distance of 100 mm from the center of the top plate, as illustrated in Figure 1. The core thickness was kept fixed at 50 mm. Three design variables are examined, i.e., plate thicknesses, core shapes, and spacing between the center of the core shapes.
The three different core structures examined are illustrated in Figure 2. The core structure shapes are selected to compare some of the most impact-resilient structures adapted in the literature. The tubular shape is selected to examine a similar sandwich panel to that of Cheng et al. [13], where they concluded that the plastic deformation of the tubular core shapes performed as an effective blast mitigator. In addition, the mushroom shape was selected based on in situ experiments conducted by Bornstein et al. [18], where the authors concluded that the mushroom-shaped water container was the best novel shape for mitigating the blast load. While the honeycomb core was selected as it is the most common sandwich panel core, which is widely available and easily manufactured from corrugated shapes.

2.1. Design of Experiments (DOE)

Experimental design is used to plan the experiments that need to be conducted to study the effect of the three design factors on the blast mitigation performance of the sandwich structure. A full factorial design of 3 levels with 27 runs (33) is planned, as illustrated in Table 1. Three levels of each factor were considered to capture any non-linearity in the response and the interaction between the variables. The plate thickness is varied between 5 and 10 mm, and the spacing between core shape centers is varied between 75 and 150 for each of the three cores shapes, i.e., honeycomb, mushroom, and tubular. Twenty-seven numerical experiments are performed by varying the panel geometry and cores shape based on the planned DOE. The structural mass was calculated for each assembly. As can be observed, the major factor affecting the structural mass is the plate thickness. The variation in the mass due to core–core distance is minimal with maximum difference of 2.53 g for a specific plate thickness. Similarly, the variation in mass due to the core structure was also minimal with a maximum difference of 2.25 g for a specific plate thickness. Four responses will be examined to compare the different structures, i.e., maximum vertical displacement of the composite panel u3, work done due to external forces, elastic strain energy, and the kinetic energy over composite panel volume given by Equations (1)–(3), respectively [19]. Response values are computed at the time instance when the work of external forces is stable, and the kinetic energy is at its maximum amplitude.
E ˙ W = S v . t l d S + V f . v d V
E S = 0 t V 1 d σ u : ε ˙ e l d V d τ
E K = v 1 2 ρ v . v d V
where E ˙ W is the rate of external work done, f is the body force vector, E S is the elastic strain energy, d is the continuum damage parameter, E K is the kinetic energy, σ u is the undamaged stress, v is the velocity field vector, ε ˙ e l is the elastic strain rates, t l is the surface distributed load, and ρ is the current mass density.

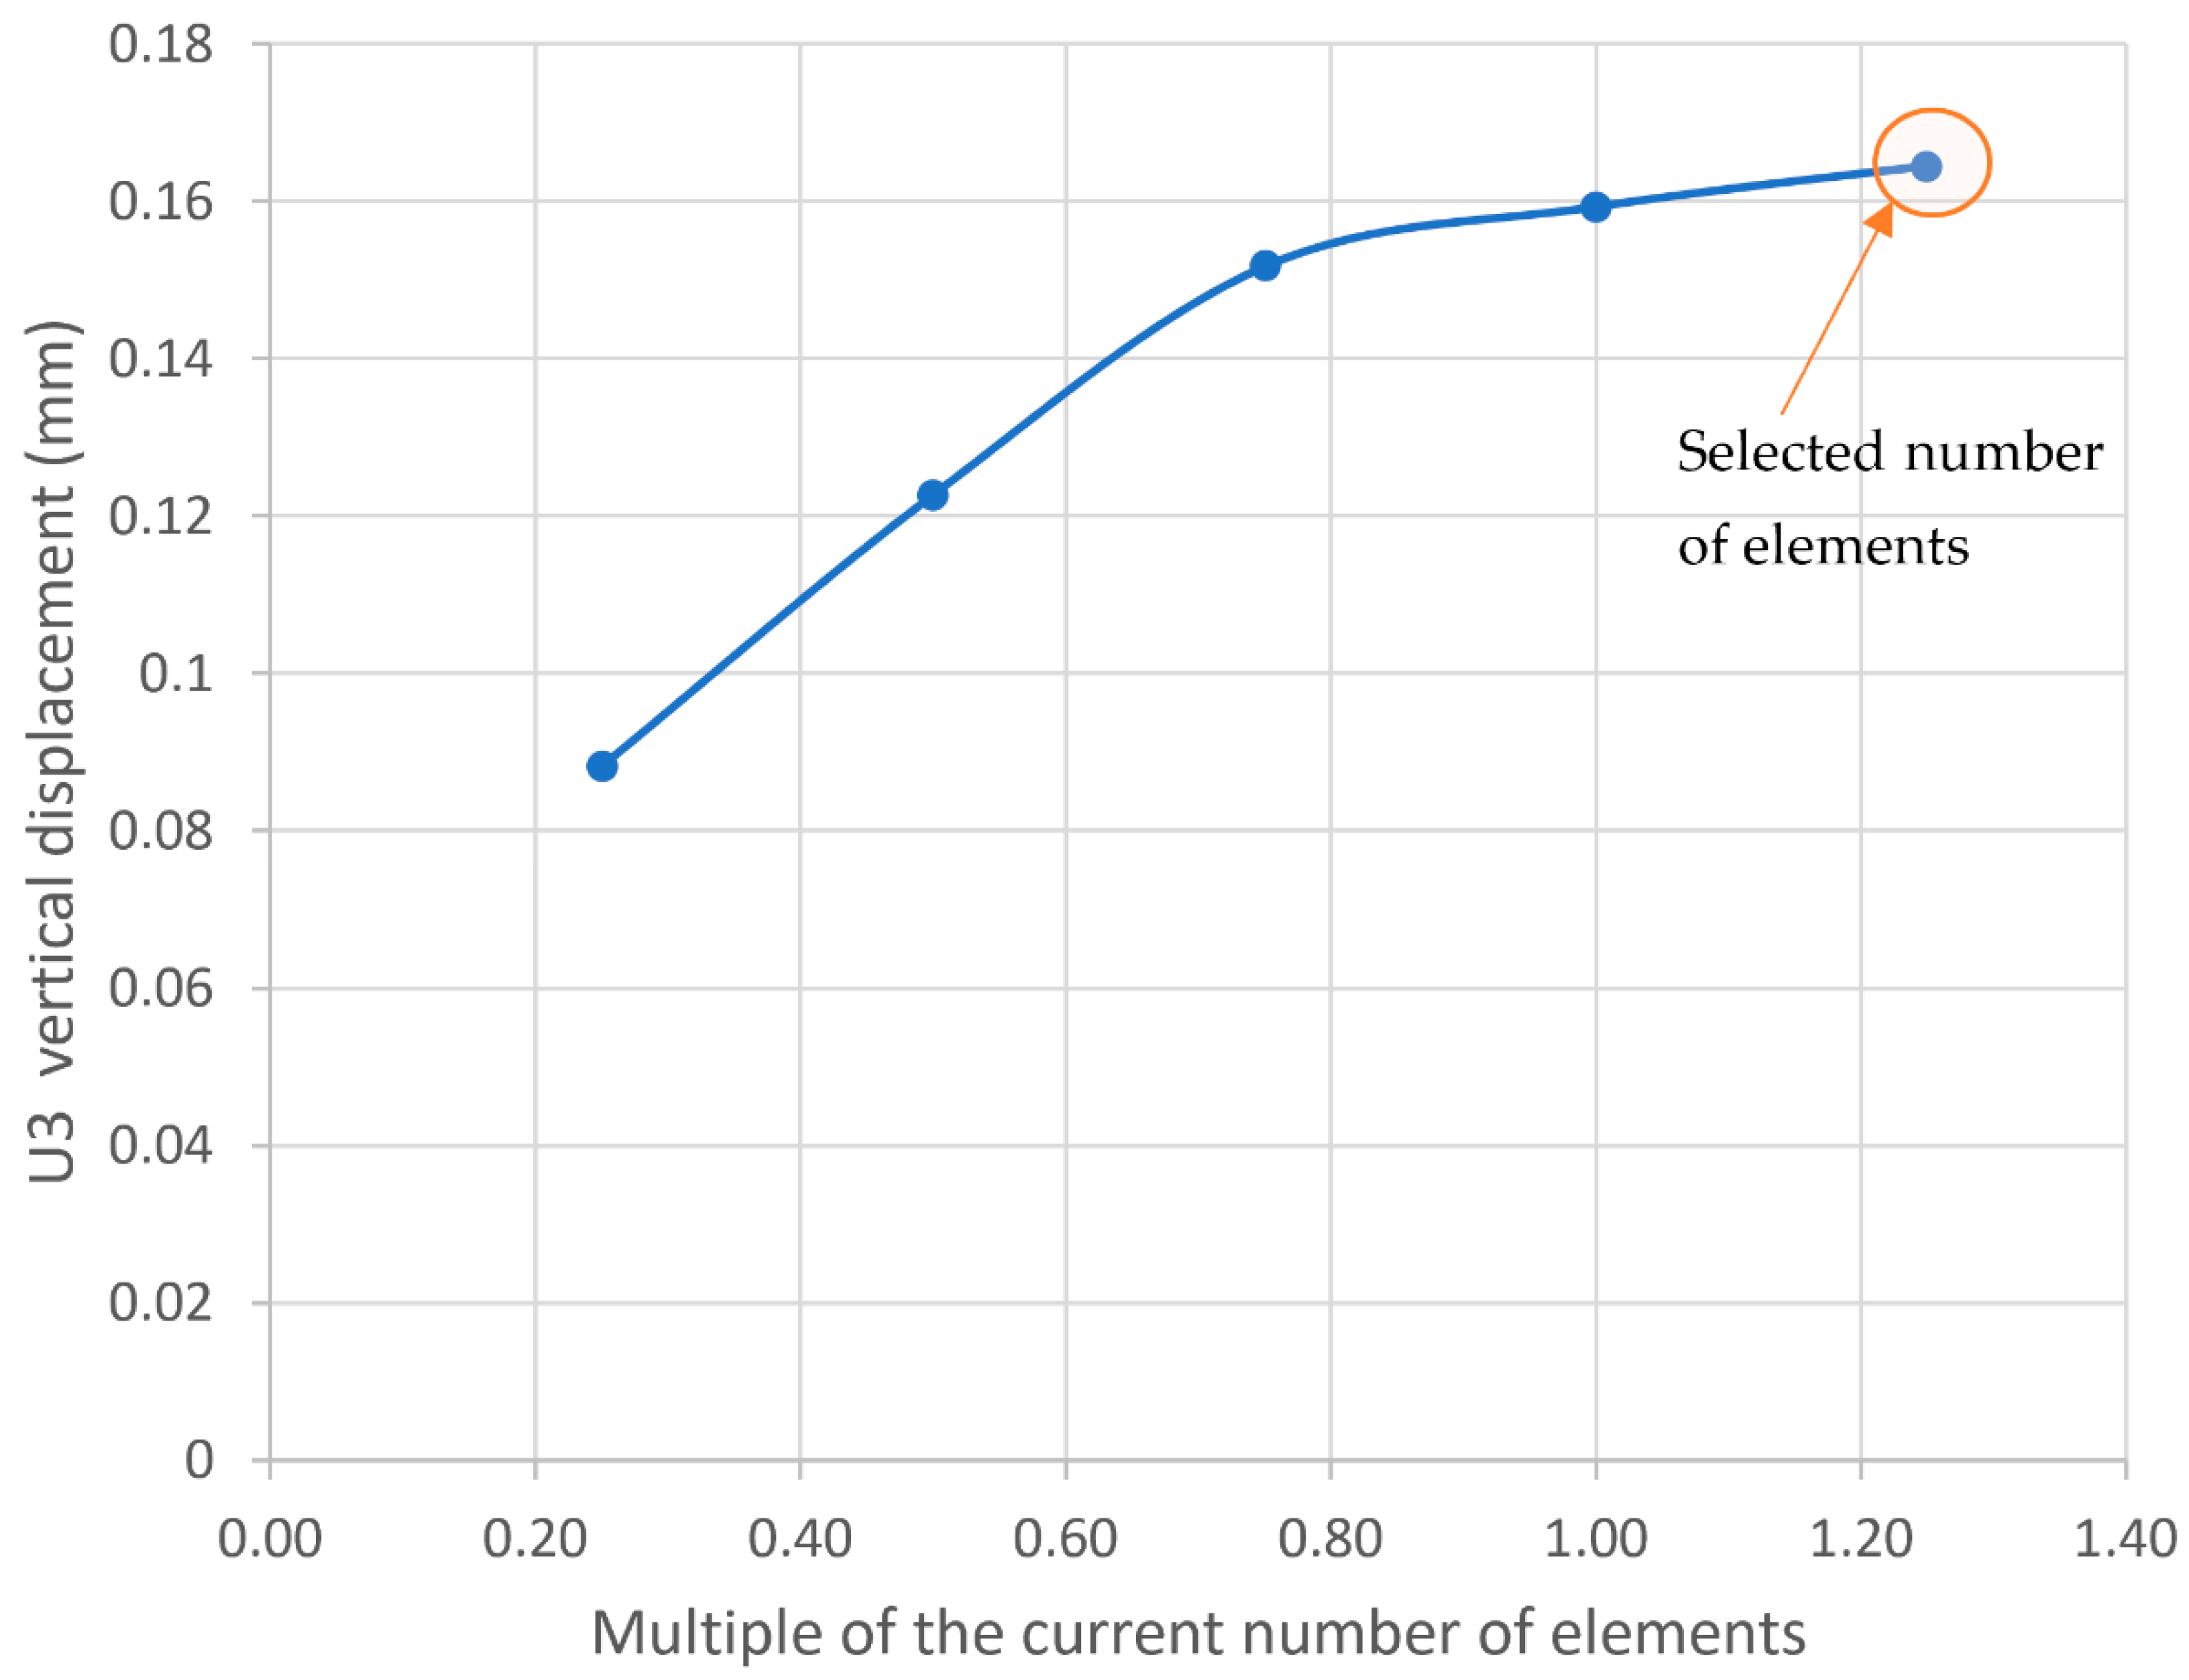
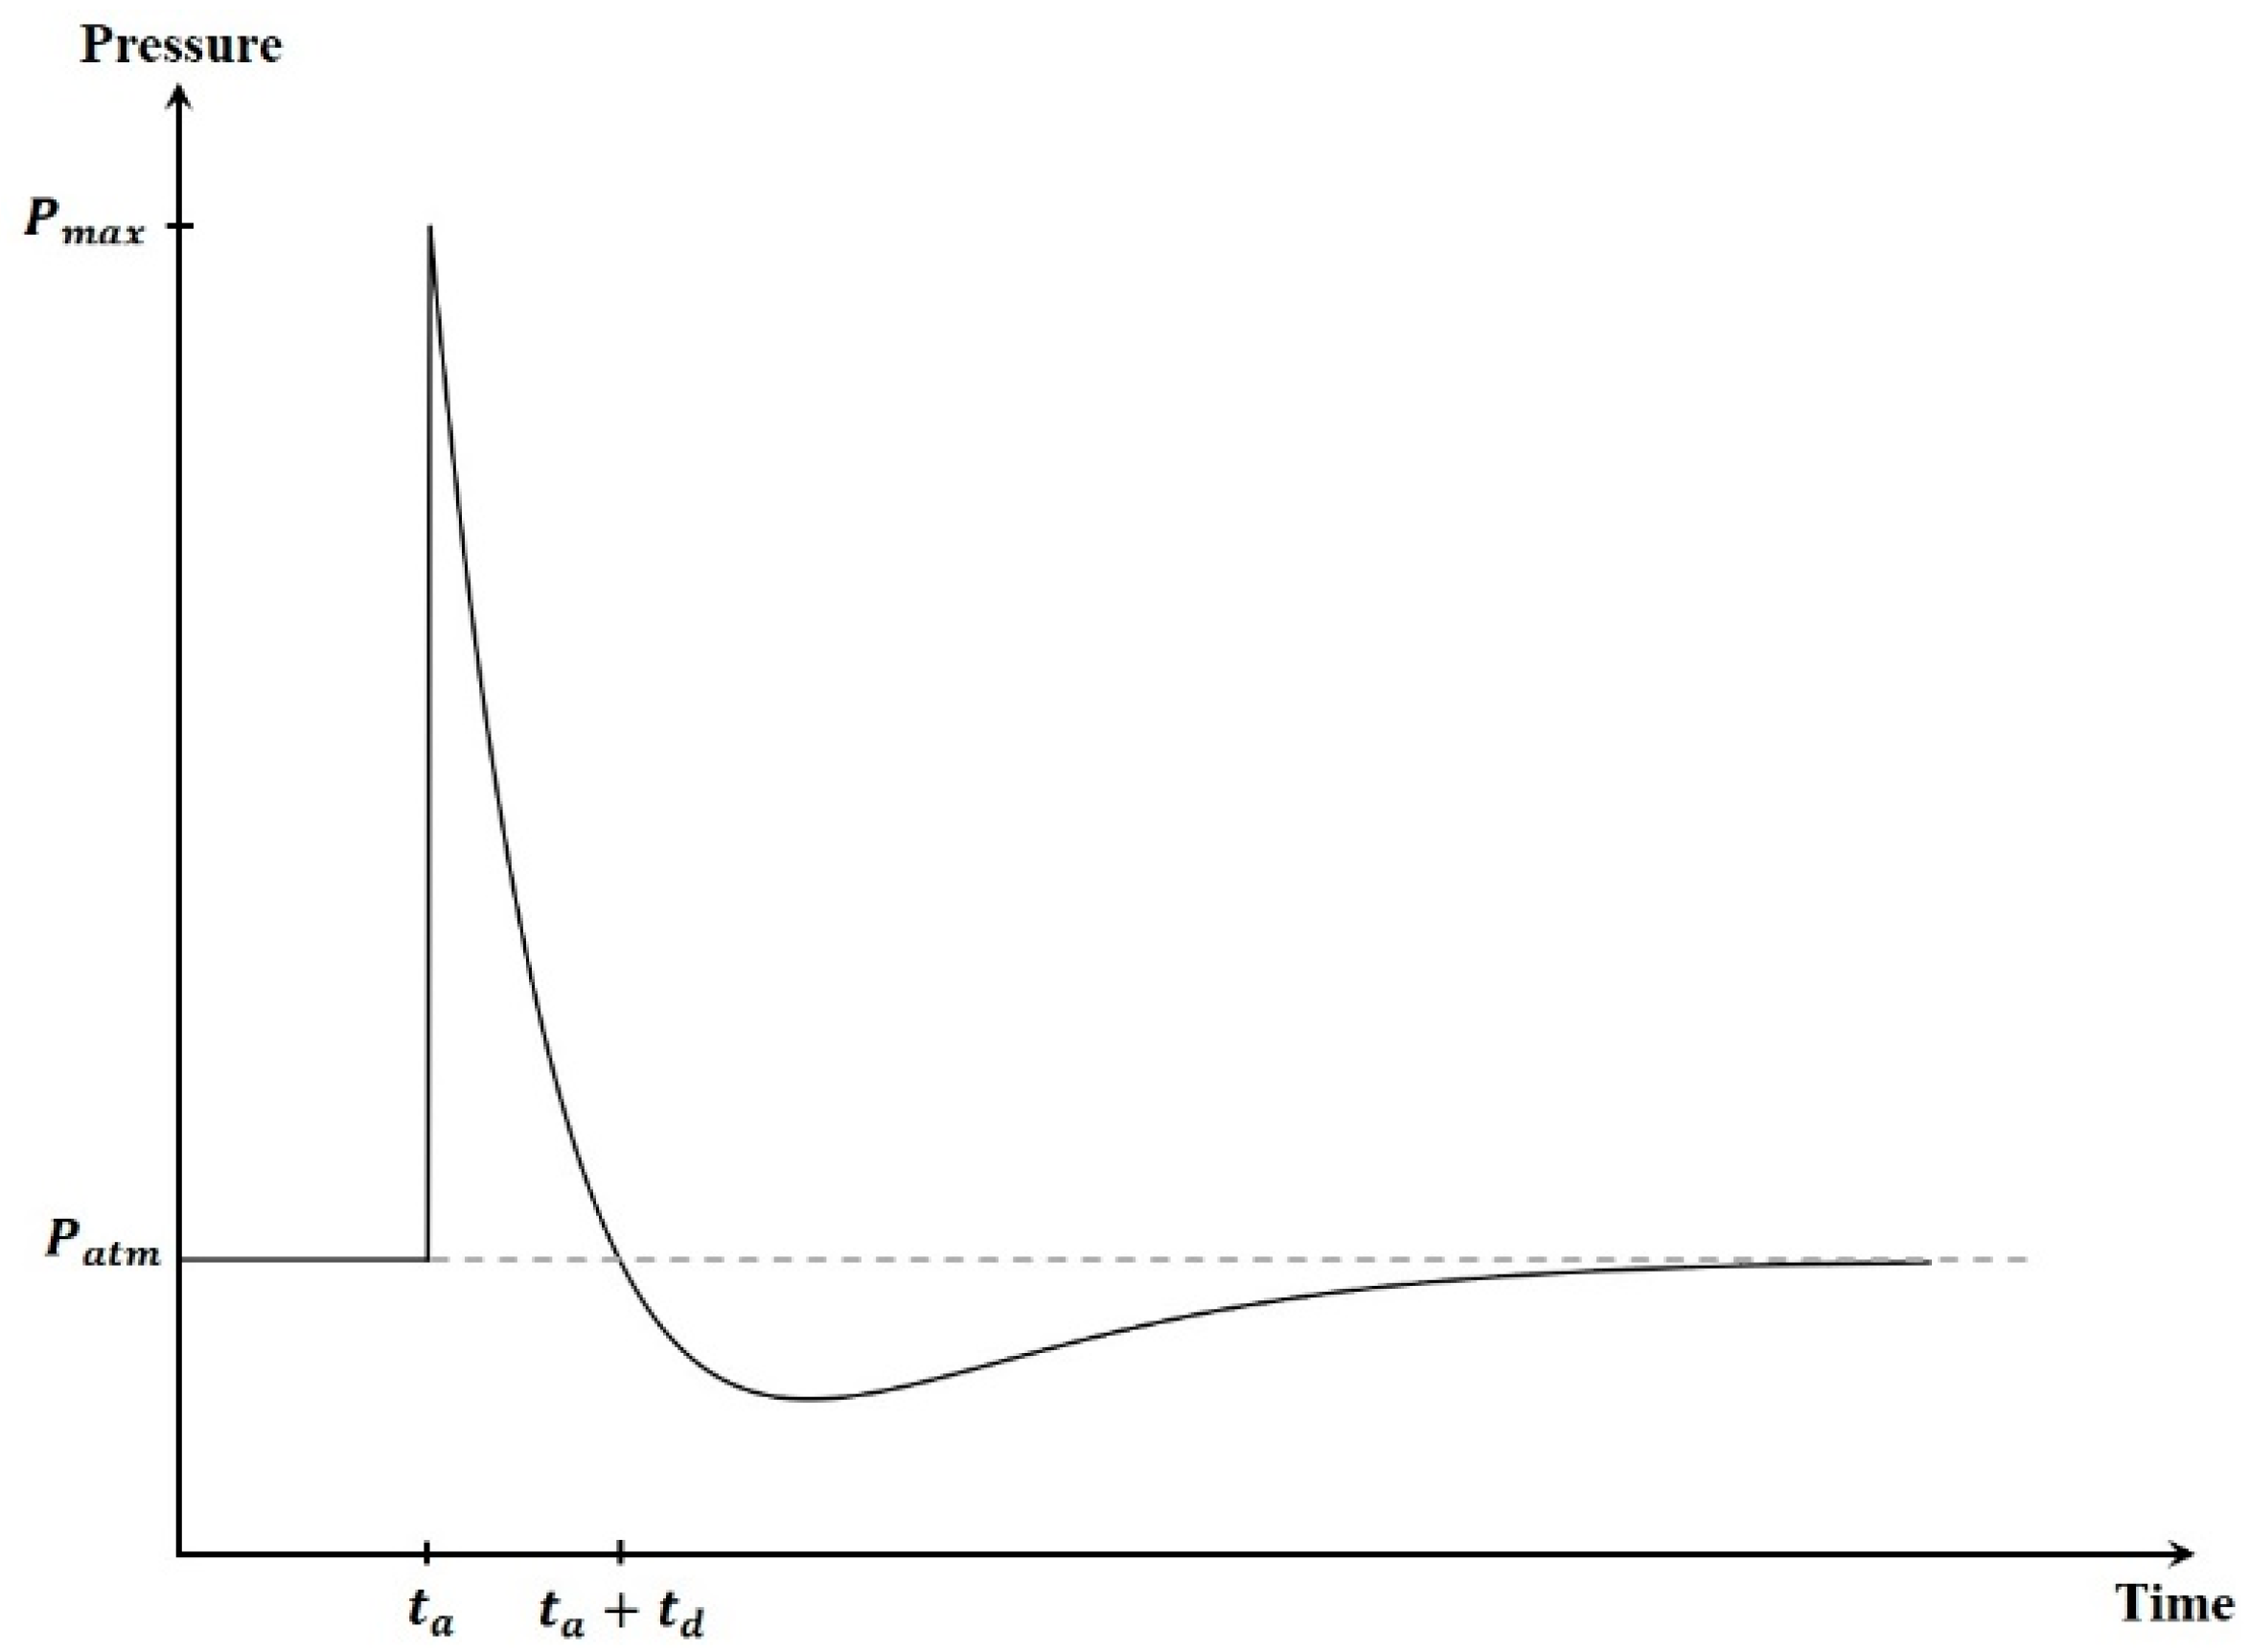
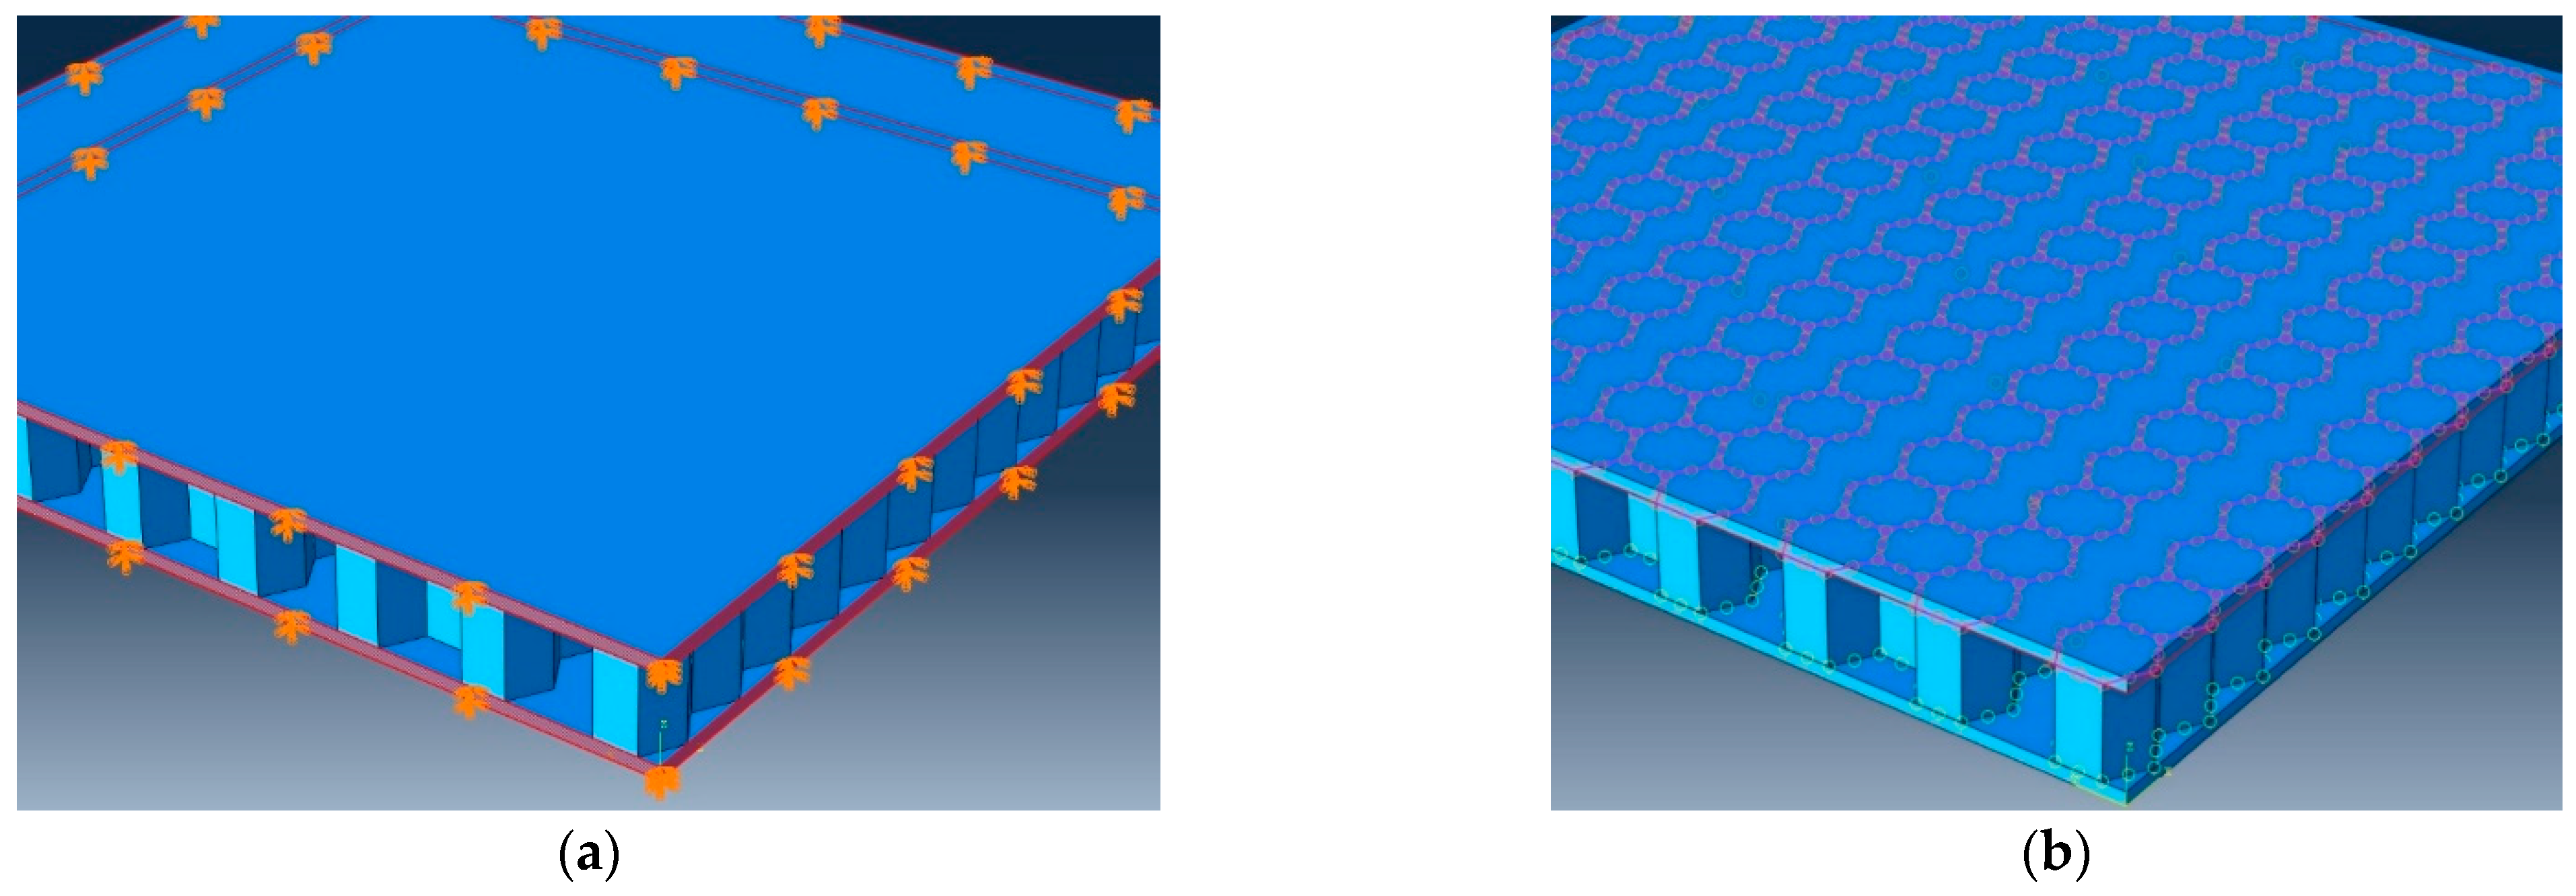
2.2. Numerical Experiments

The sandwich panels are modeled using Abaqus/CAE with a square panel dimension of 650 × 650 mm, a fixed core height of 50 mm, and a core–shell thickness of 0.76 mm. Both the top and bottom plates of the sandwich panels, shown in Figure 3a, are modeled as solid plates and meshed with 65 × 65 × 5 C3D8R solid elements resulting in a total number of elements of 21,125 for each plate. Quadrilateral S4R and triangular S3 elements were used for the tubular core shapes, as shown in Figure 3b, and for the honeycomb core structure, as illustrated in Figure 3c, with an approximate global size of 0.0017. The mushroom core shapes were meshed using the same element types as shown in Figure 3d, but with an approximate global size equal to 0.003. Depending on the core-to-core distances, the total number of elements ranged between 80,531 to 131,928, 65,930 to 108,122, and 19,650 to 33,360 for the honeycomb, mushroom, and tubular core shapes, respectively.
Although a fine mesh size was selected, in order to ensure the convergence of the results, the number of elements were varied by multiplier and the results were plotted to examine the effect. As seen from Figure 4 for a tubular core structure, the results converge at the selected number of elements with an error of less than 2.5% upon increasing the number of elements by 25% more than the current one. This was repeated for each type of core structure and a similar result was obtained.
The sandwich panel plate and core are modeled to be of the same material, low alloy steel AISI-4340. The material properties of AISI-4340 used are listed in Table 2 and obtained from Guo and Yen [20], and Arriaga and Waisman [21]. To model the material plasticity and damage evolution behavior in the composite panel Johnson-Cook model exhibited in Equations (4) and (5) [22,23] were used. The Johnson–Cook damage is a widely used ductile damage criterion model as it considers both the kinematic strengthening and adiabatic heating of the material, the model predicts the onset of damage by assuming the function of stress triaxiality and strain rate to be equivalent to plastic strain [24,25].
σ = ( A + B ε n ) ( 1 + C ln ε ˙ ) ( 1 T m )
where σ is the yield stress, A is the yield stress of the material under reference condition, B is the strain hardening constant, C is the strengthening coefficient of strain rate, n is the strain hardening coefficient, m is the thermal softening coefficient, ε is the reference strain, and ε ˙ is the dimensionless strain rate.
ε ¯ D p l = d 1 + d 2 e x p d 3 η 1 + d 4 l n ε ¯ ˙ p l ε ˙ 0 1 + d 5 θ ^
where d1 to d5 are failure parameters.
The detonation of TNT explosives is modeled as an air blast load. The detonation of the TNT explosive creates a rapid expansion in the surrounding gaseous resulting in compressing and moving the air away with high velocity, which creates a shock wave [26]. The shock wave rapidly increases the pressure from atmospheric pressure P a t m to a maximum pressure P m a x , which decreases exponentially to reach negative pressure before it stabilizes [17,26]. The source load is assumed to be 3 kg of TNT placed at a standoff distance of 100 mm from the center of the top plate of the sandwich panel. Blast load is simulated with a time period of 1.5 msec in Abaqus/CAE as a CONWEB charge with Incident Wave Interaction Property as in [17,26,27]. A similar pressure loading modeling to Kumar and Patel [17] is used, and the profile is shown in Figure 5 which is illustrated by the modified Friedlander Equation (6).
P t = P m a x P a t m 1 t t a t d e t t a θ
where P t is the pressure at (t) time, P m a x is the maximum pressure, P a t m is the atmospheric pressure, θ is the time decay, t a is the maximum shock wave time, and t d is the positive pressure time.
In addition to the applied load, top and bottom plates are fixed from all four sides, as illustrated in Figure 6a, by setting nodal points’ displacements and rotations to be equal to zero. To ensure that the core structure and the sandwich panel plates are welded together, they are modeled to have tie constraints, as shown in Figure 6b.

3. Results and Discussion

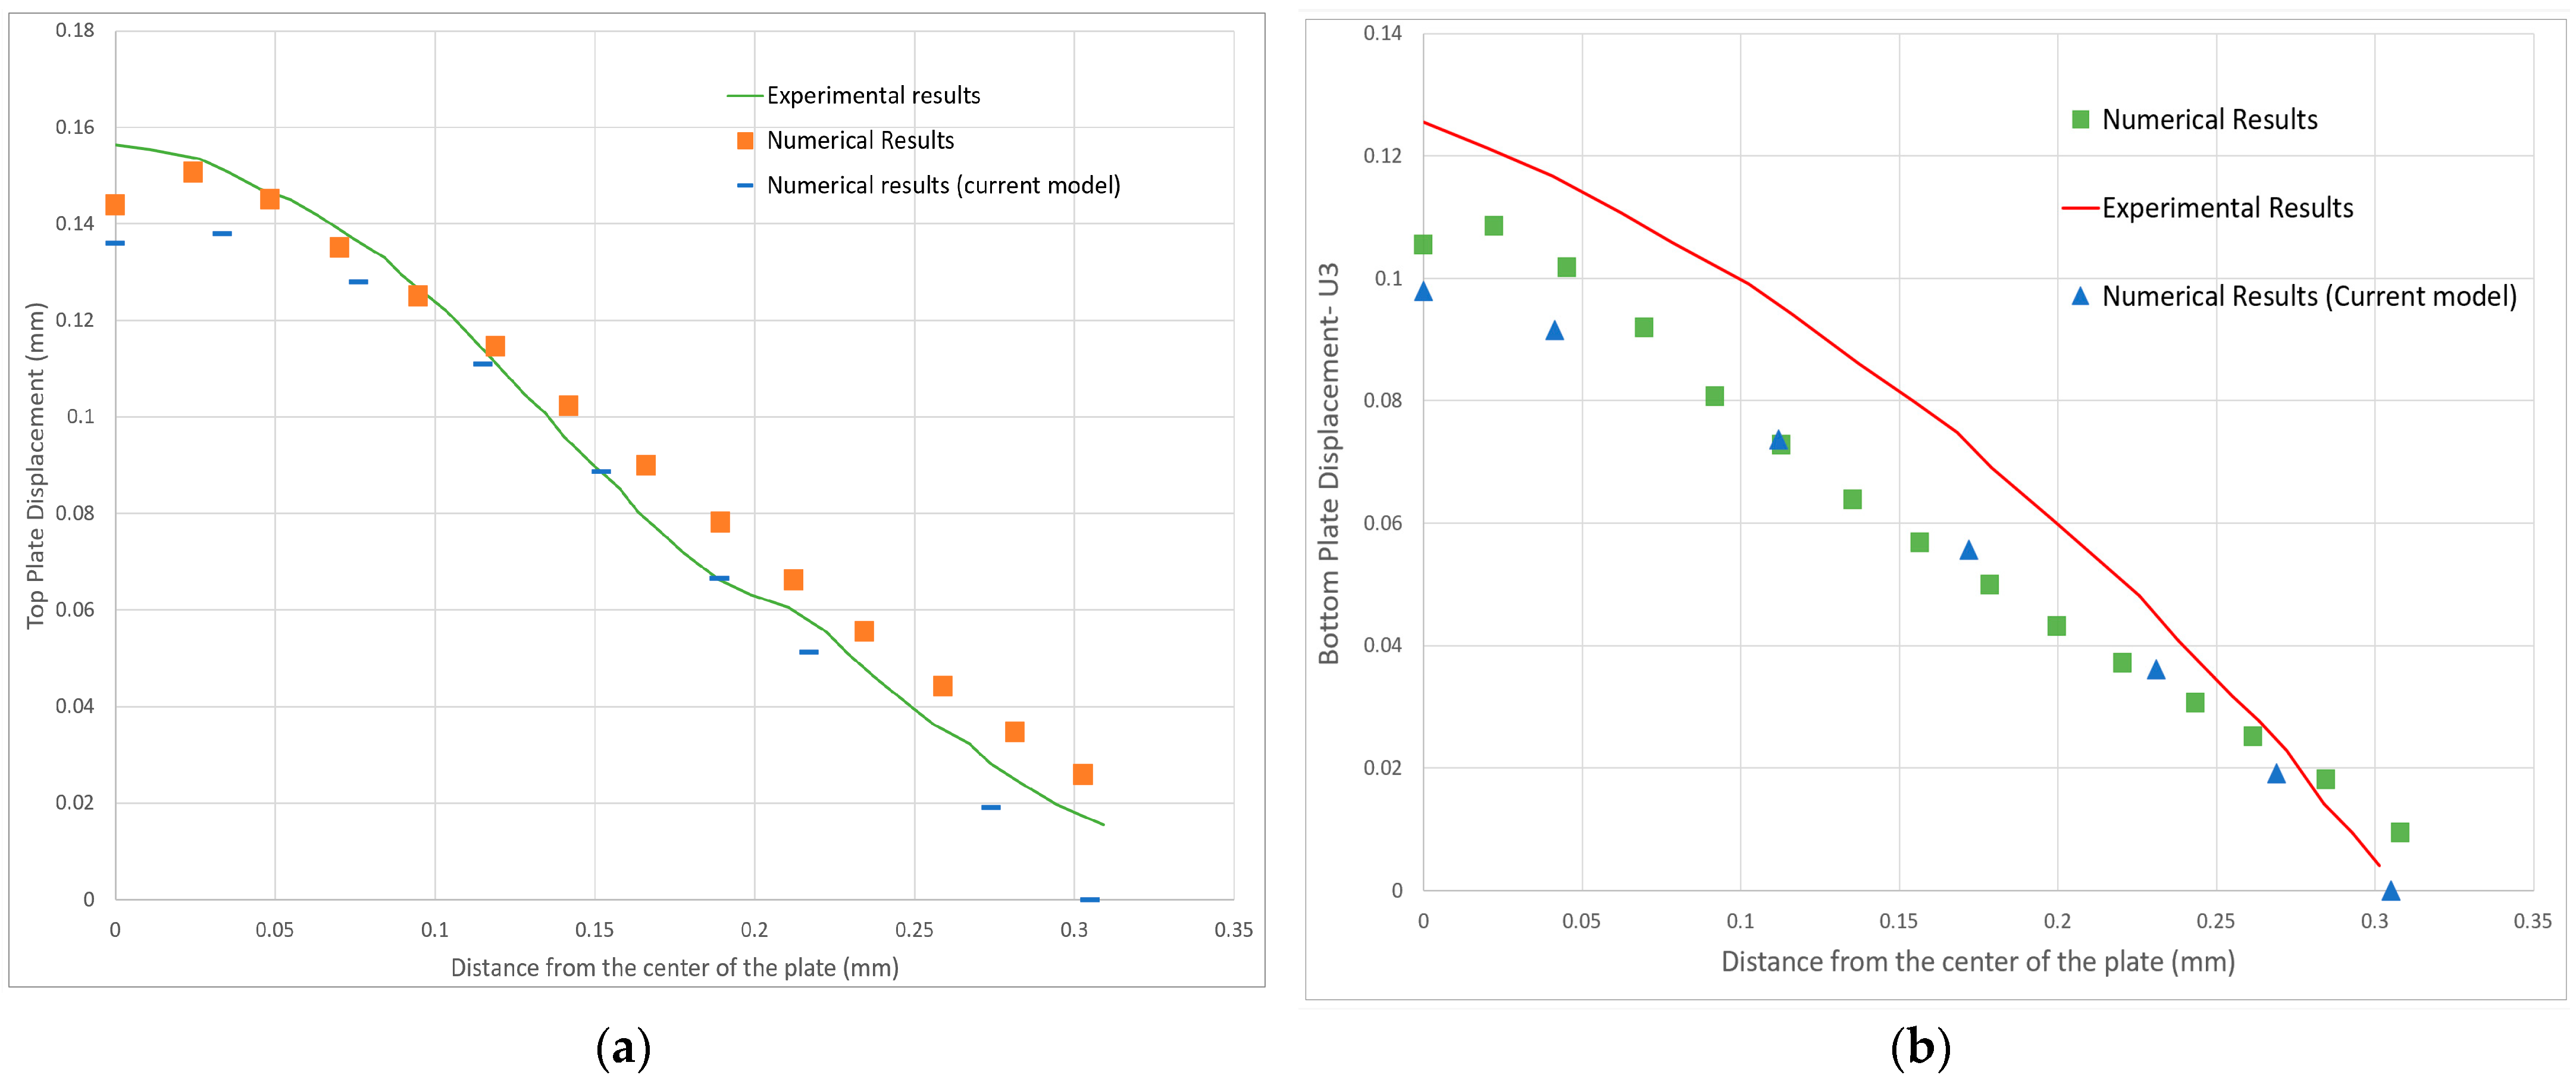
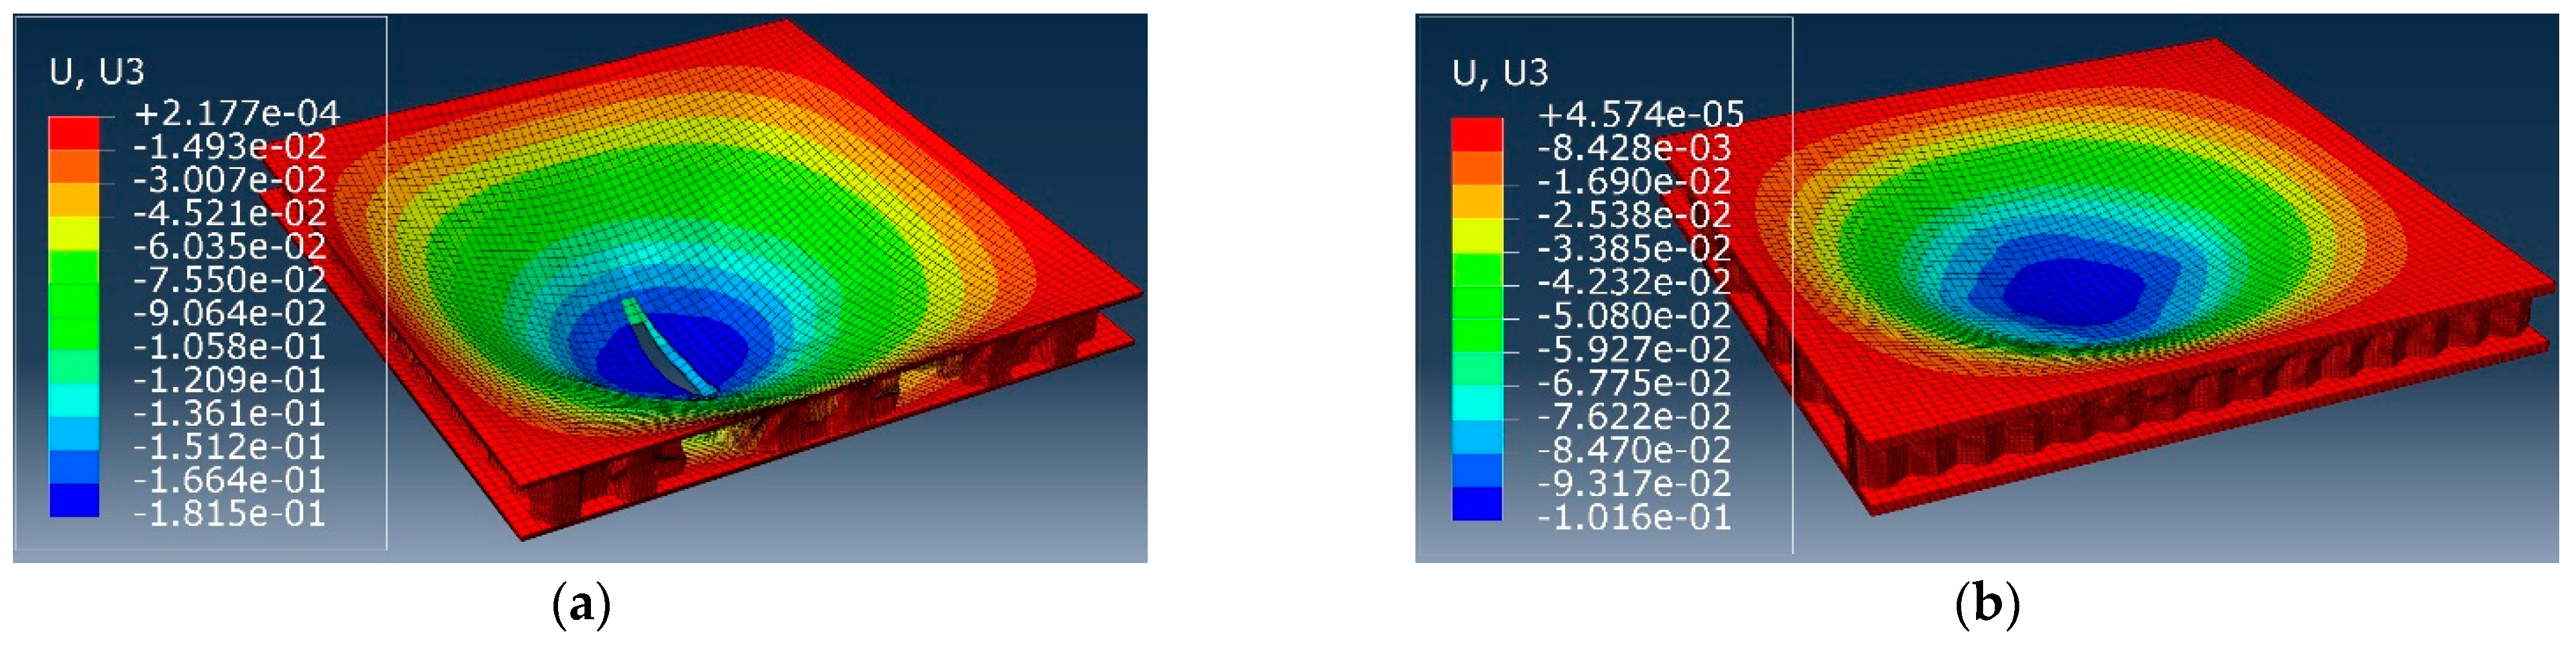
3.1. Validation of the Model

The numerical model was validated by comparing it with the results obtained from Kumar and Patel [17]. The numerical responses used for the validation were for the numerical model of 3 kg of TNT cylindrical explosives impacting a square honeycomb sandwich panel at a standoff distance of 100 mm from the center of the top plate. Figure 7 shows that the behavior of the developed numerical model is similar to the numerical model and the field experiment discussed by [17]. Moreover, the deformation shape of this research model shown in Figure 8 was compared with the model of Kumar and Patel [17] numerical results, which showed a similar deformation behavior at the center of the sandwich panel with an accuracy of around 93% for the bottom plate displacement and around 94% for the top plate displacement and an error of 13% and 17% when compared to experimental results. The difference between numerical and experimental results can be attributed to the clamping of the plate. In the numerical analysis, the plate was fixed from all sides and did not displace. As seen from the displacement profile of the experimental results for the bottom plate in Figure 7b, the whole plate was displaced vertically up from the sides. The model showed higher accuracy throughout the body of the sandwich panel, especially between 0.075 mm and 0.25 mm from the center of the sandwich panel.

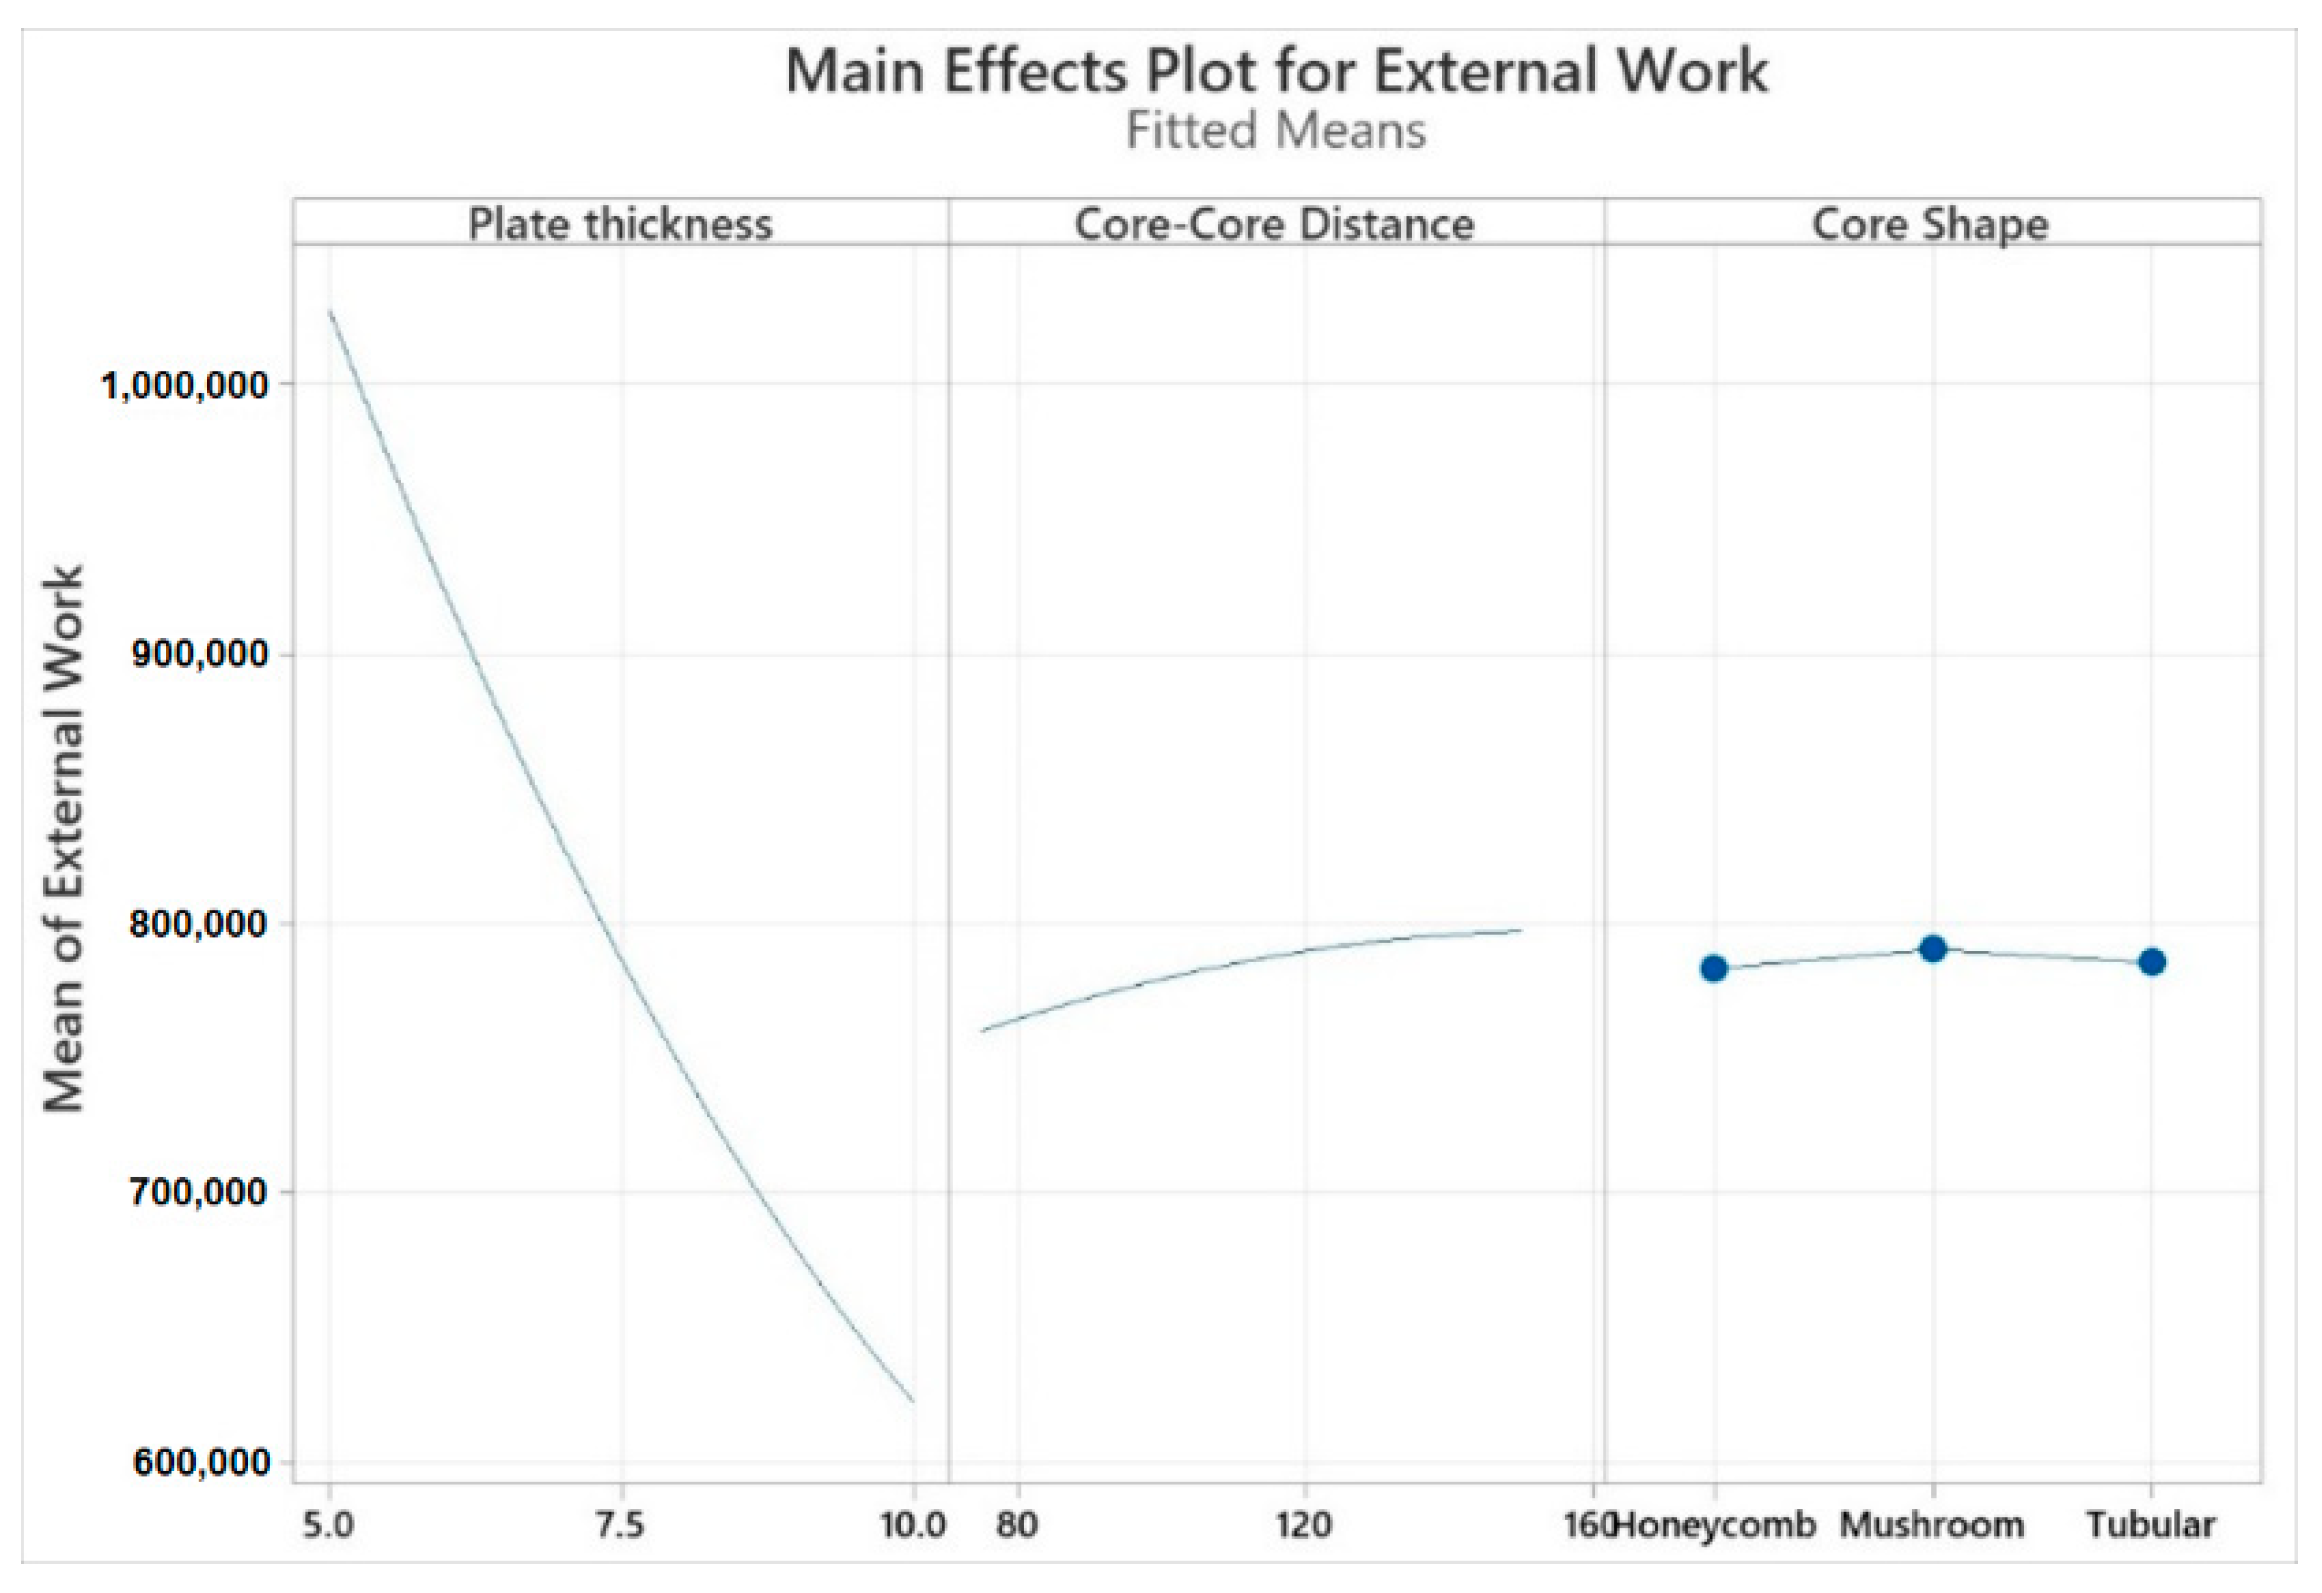
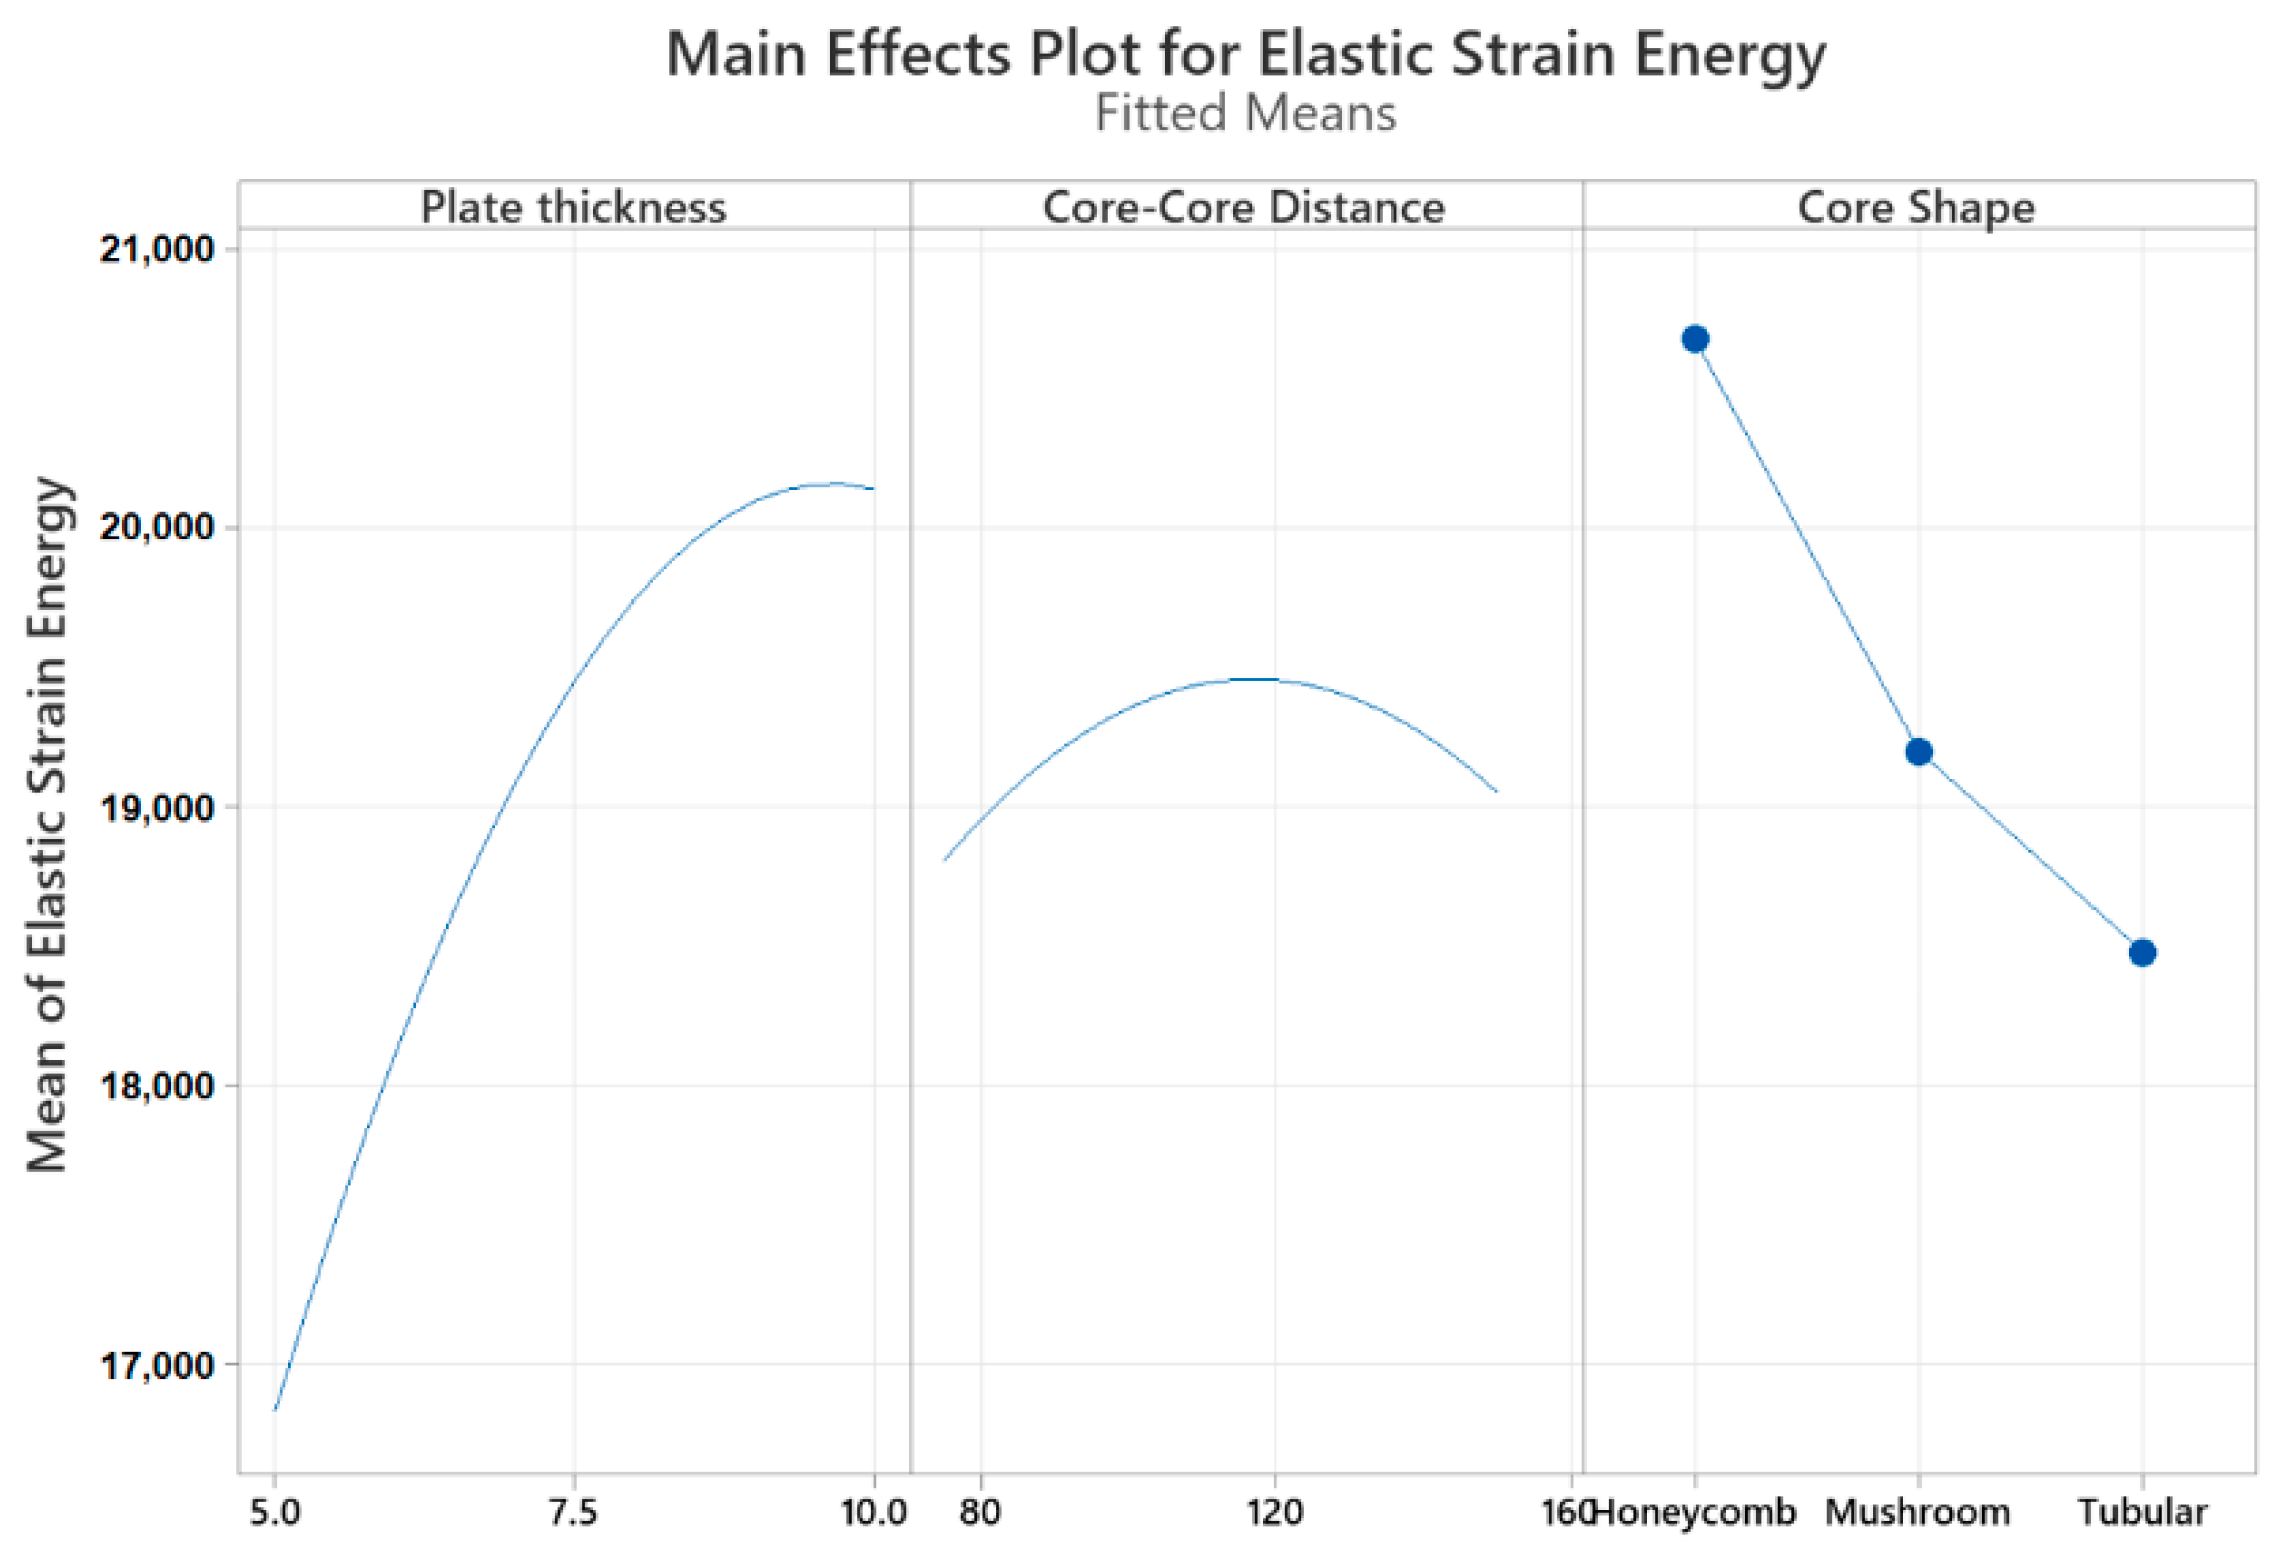
3.2. Effect of Design Variables

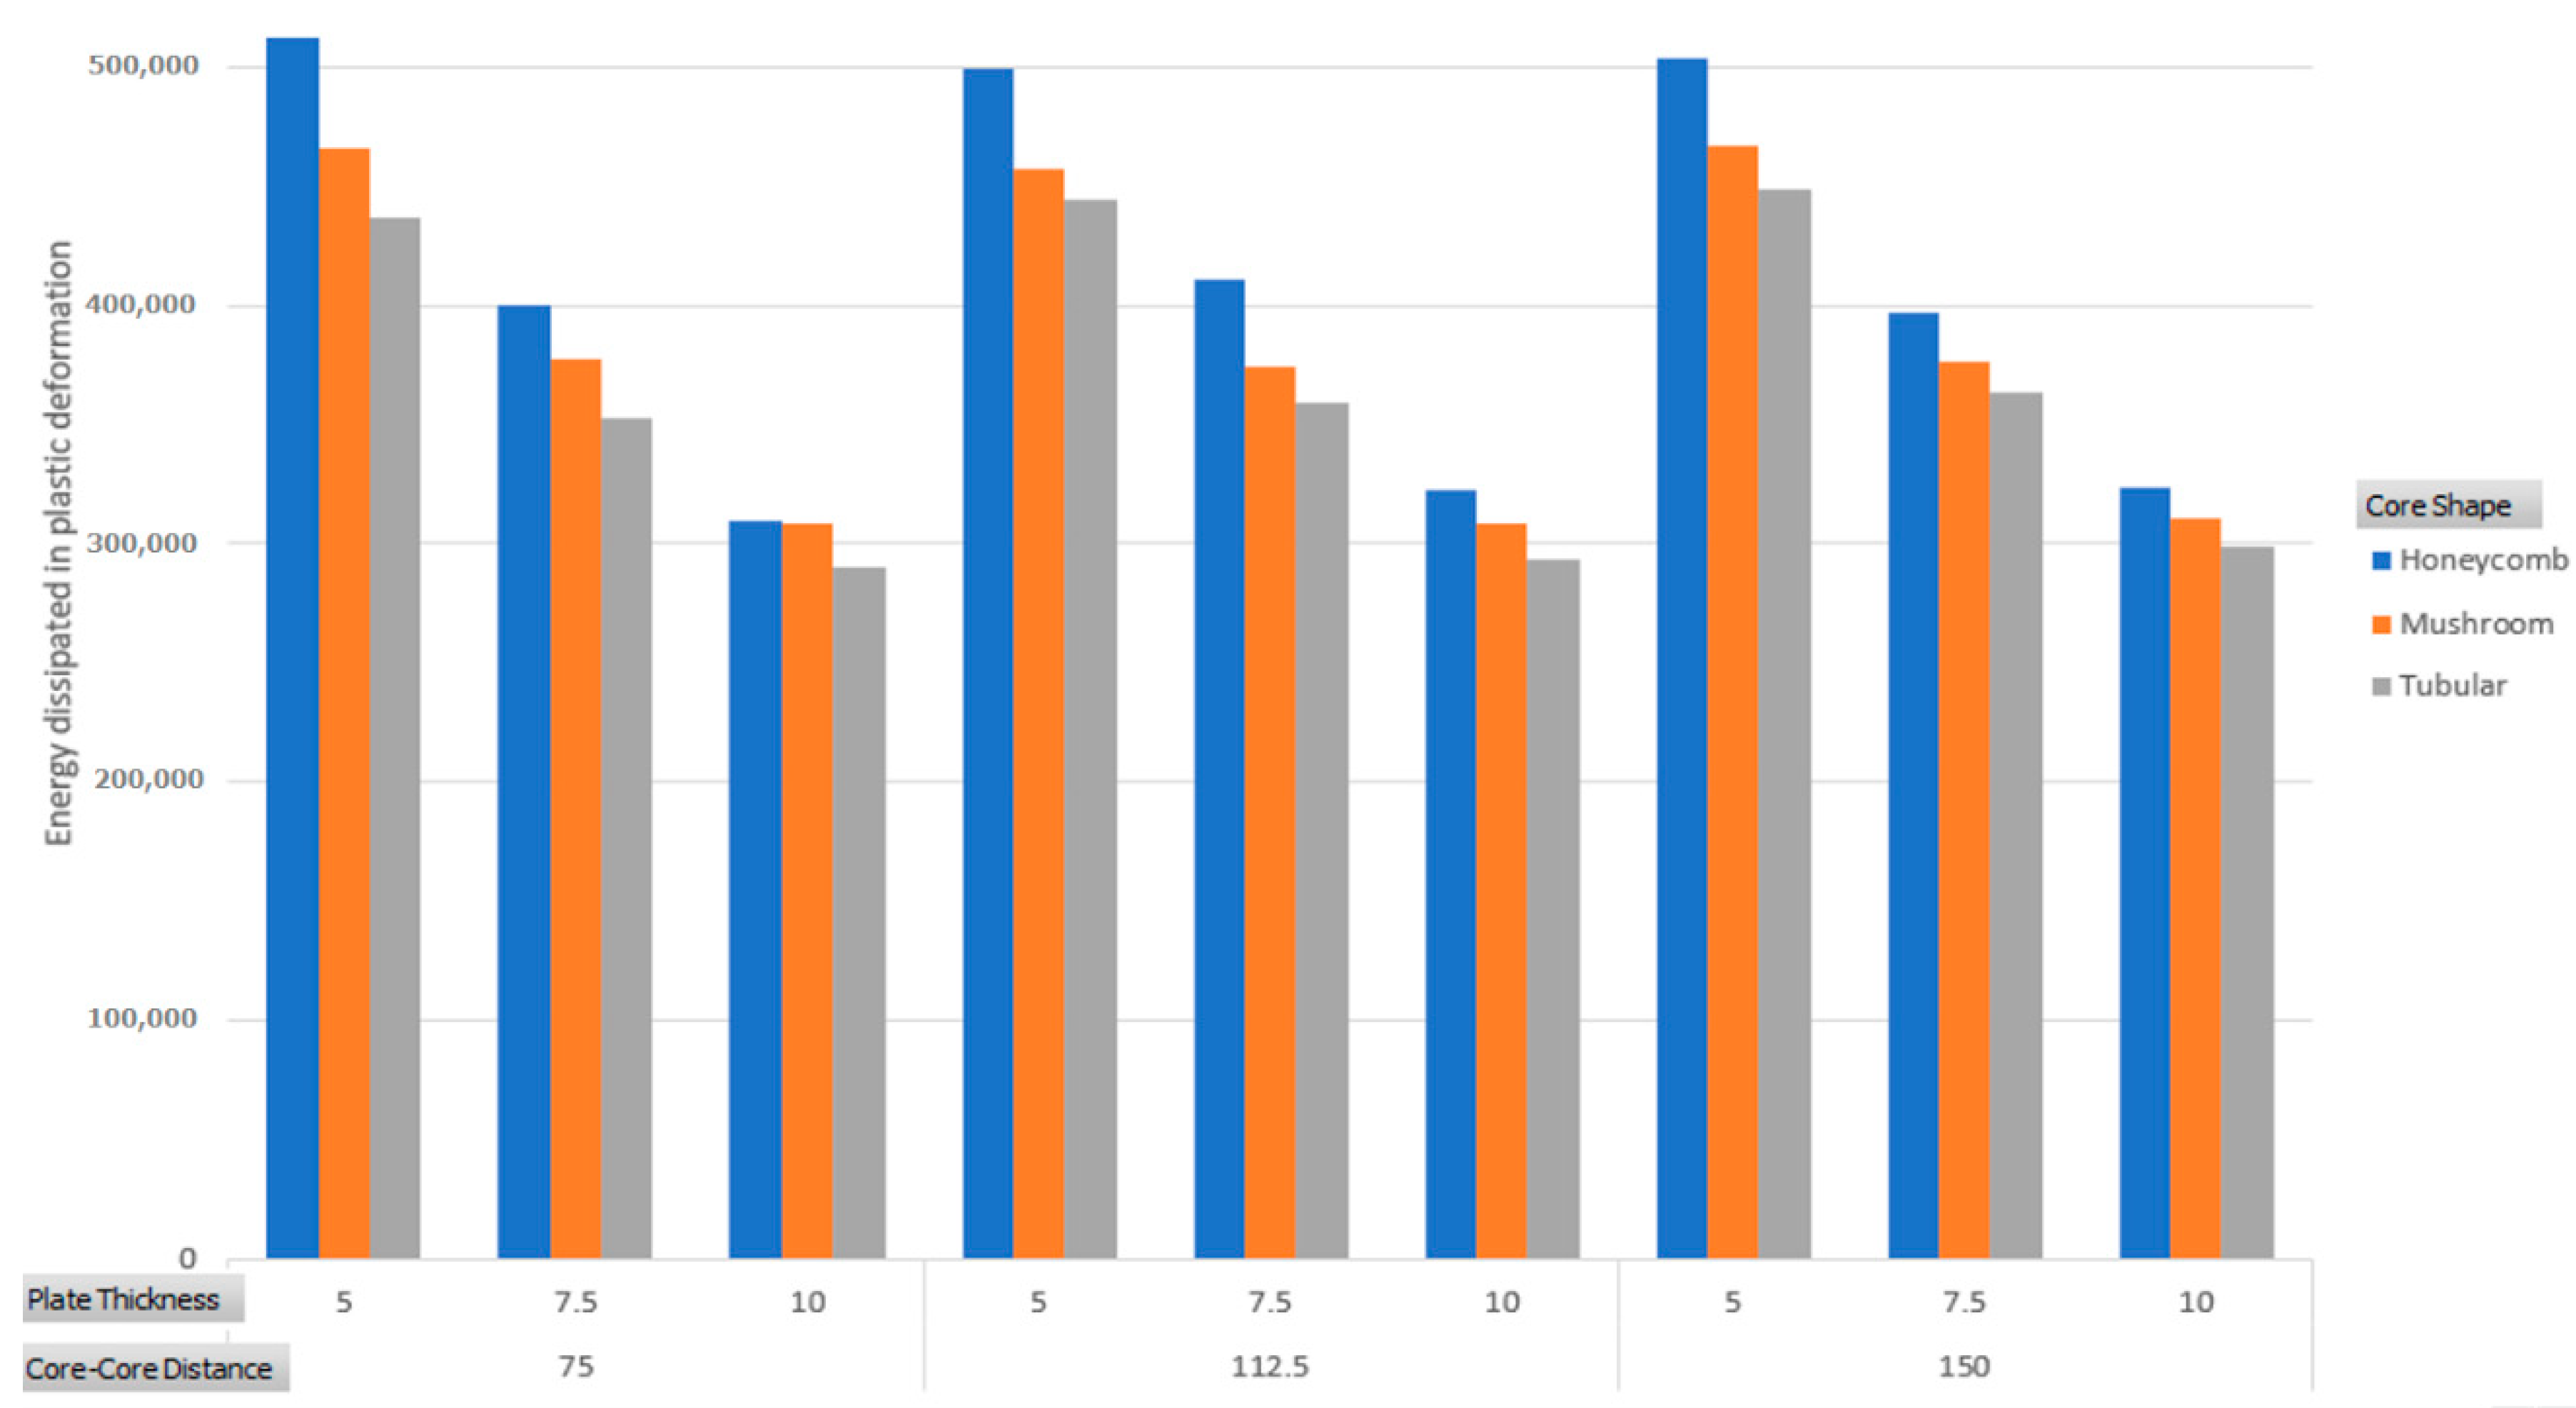
3.2.1. Core Structure

Three sandwich panels with similar plate thickness and core-to-core spacing distance values of 5 mm and 112.5 mm, respectively, were analyzed to investigate the effect of the core structure shape (i.e., honeycomb, mushroom, and tubular) on the blast mitigation performance of the sandwich panel. As shown in Figure 9, the top and bottom plate tearing occurred to the honeycomb and mushroom sandwich panels, while the tubular sandwich panel experienced a minor fracture on its top and bottom plates revealing that the tubular core sandwich panels exhibited better stiffness and higher impact resistance.
The honeycomb sandwich panel exhibited the highest elastic strain energy compared to mushroom and tubular cores as illustrated in Figure 10. The honeycomb sandwich panel with a plate thickness of 7.5 mm and core-to-core spacing distance of 112.5 had the highest strain energy value of 23,198.1 J. The strain energy decreased by around 20% for the mushroom sandwich panel with similar dimensions, and it decreased by about 24% for the tubular sandwich panel. The variation due to the core–core distance spacing will be explained in more detail in Section 3.2.3, as there is an interaction between the spacing and where the core is located with respect to the applied load. A larger spacing does not necessarily mean less stiffness as seen in Figure 11. If the spacing results in the core structure being located toward the center, where the load is applied, this will provide more support. In the case of 112.5 mm of core–core spacing distance, the center of the applied load does not coincide with the location of a core, resulting in a higher value of elastic strain energy. Moreover, the lowest strain energy value was 15,342 J for a tubular sandwich panel with 5 mm plate thickness and 150 mm spacing gaps between the core shapes. The strain energy value was increased by around 17% with honeycomb core shapes and 7% with mushroom core shapes. The tubular sandwich panel structure is stiffer than the mushroom and the honeycomb sandwich panels, which causes the strain energy of the tubular sandwich panel to be lower than the mushroom and the honeycomb sandwich panels. As seen in Figure 9, the tubular core exhibited the lowest deformation revealing that it is stiffer and more rigid than the rest of the core structures. Cheng et al. [13] concluded that the rigid core structure would not work as an energy absorber. As illustrated in Figure 12, the work done by external force applied on the sandwich panel is mainly reduced as the façade plate thickness increases. As seen the effect of the core shape has a minimal effect compared to that of the plate thickness.
The displacement of the sandwich panel results showed that the largest displacement value was 190.6 mm recorded for the honeycomb sandwich panel with a plate thickness of 5 mm and core-to-core spacing distance of 150 mm. It is observed as seen in Figure 13 that façade plate thickness is the most significant factor in terms of resisting plastic deformation followed by core shapes but on a much lower scale. The core shape of the sandwich panel affected the maximum displacement values recorded as the tubular sandwich panels recorded the lowest displacement values, followed by mushroom sandwich panels and then the honeycomb sandwich panels. For the tubular core, more energy is dissipated as kinetic energy through inelastic dissipation as seen in Figure 14. The deformation and crushing of the core structure are exhibited in Figure 15 similar crushing behavior can be seen for the different core structures.

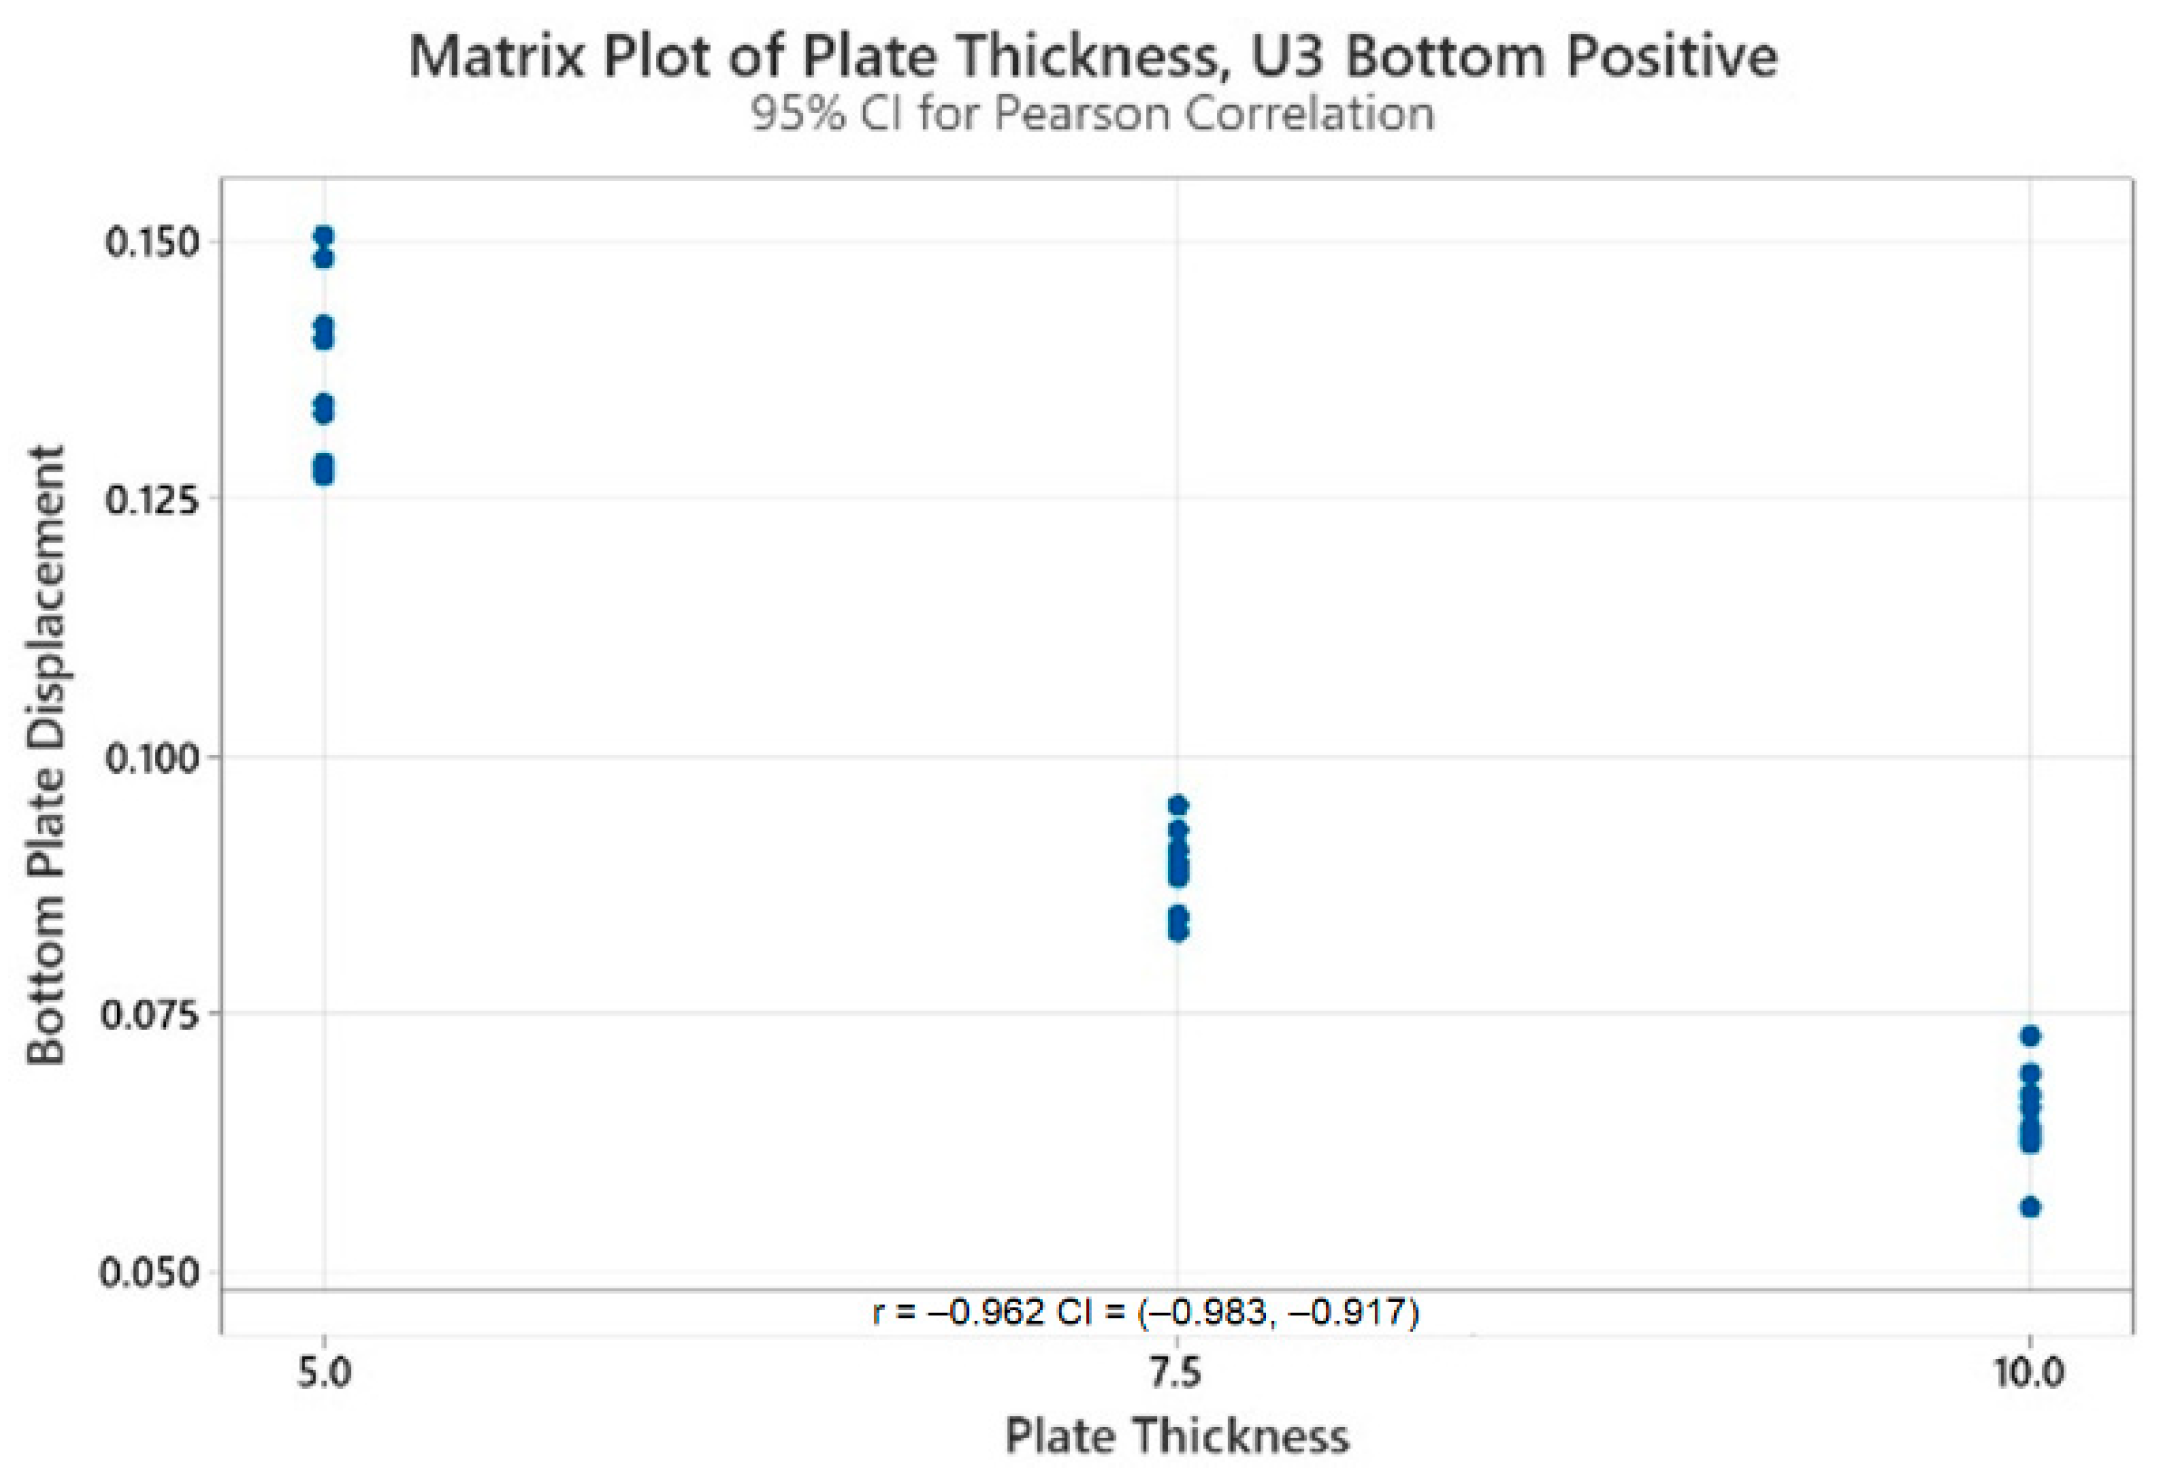
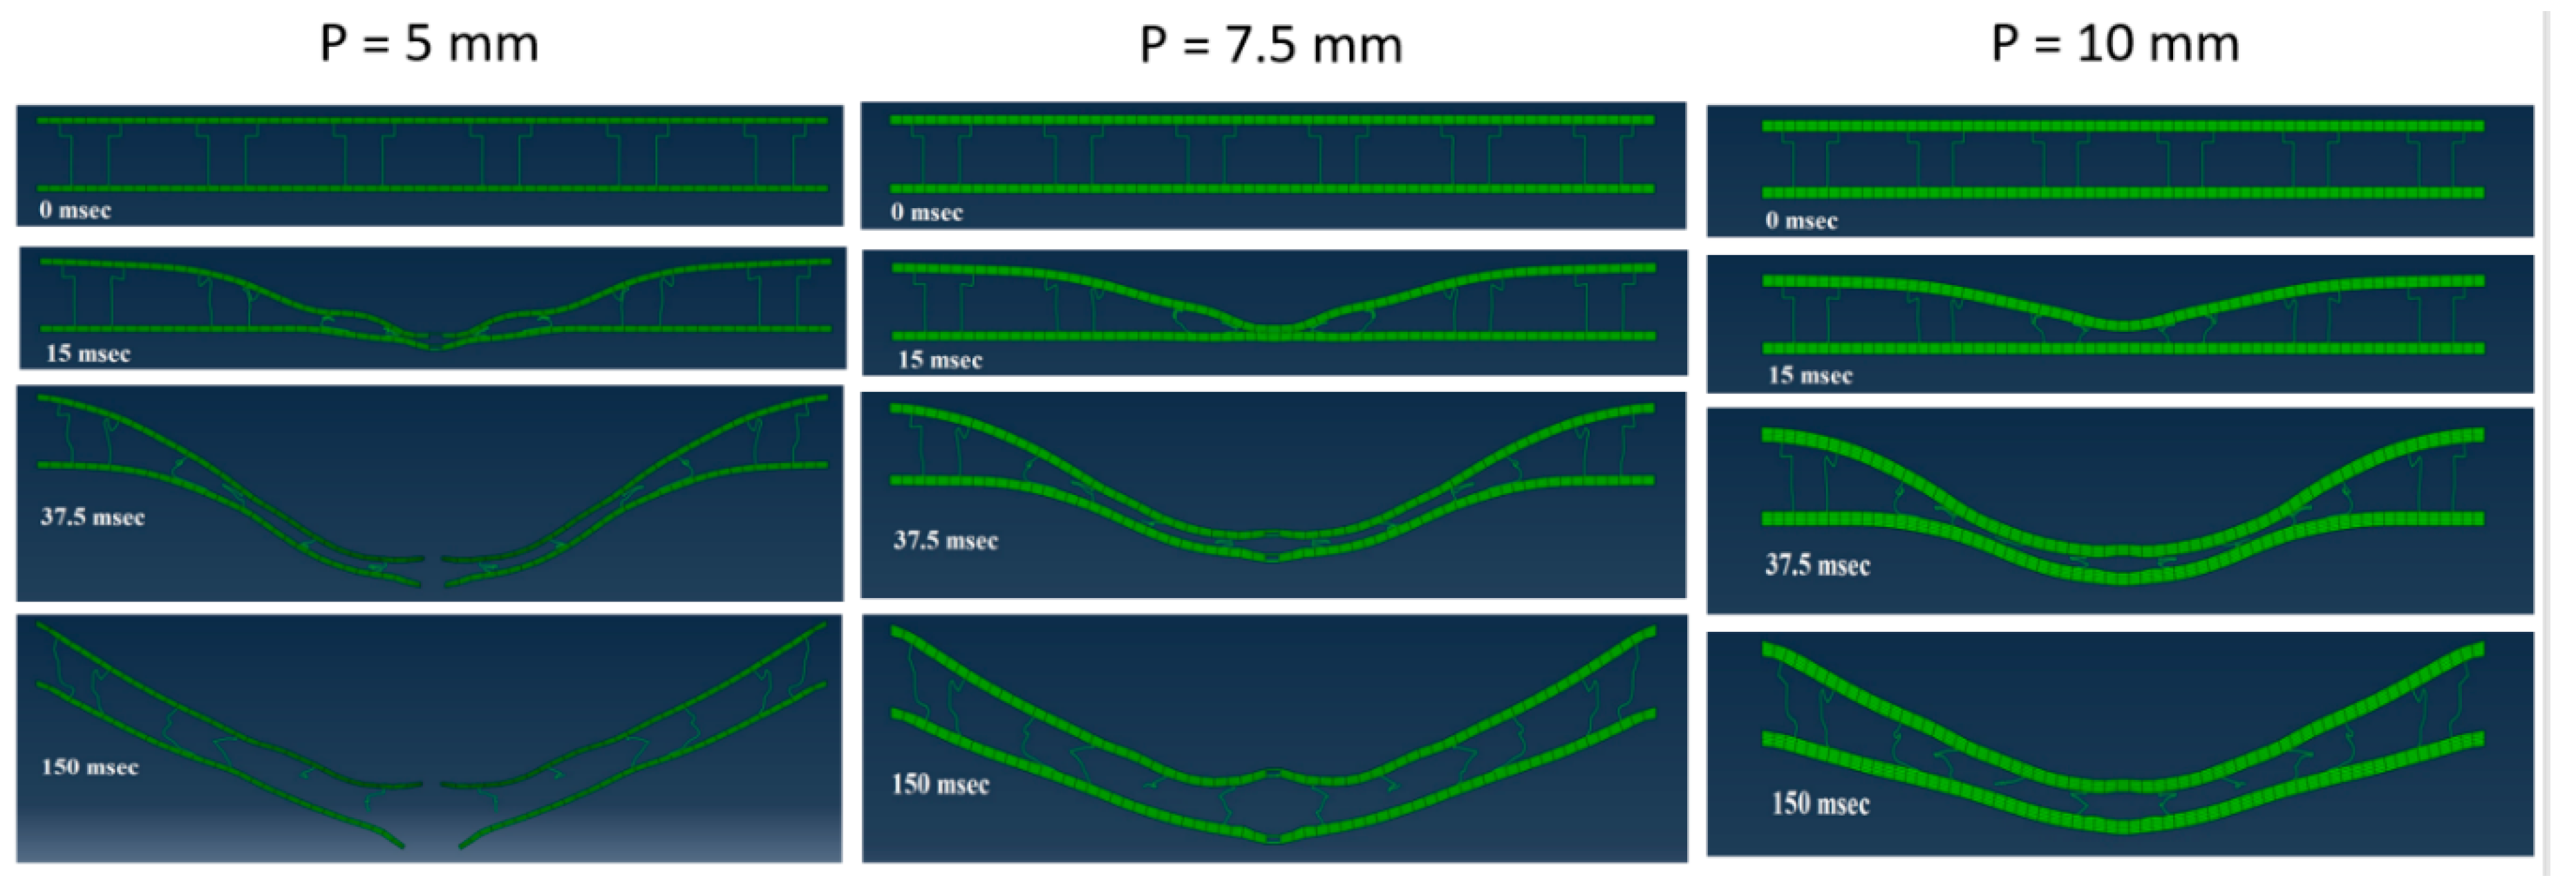
3.2.2. Plate Thickness

Figure 16 shows two honeycomb sandwich panels with a plate thickness of 5 and 10 mm, and a core-to-core spacing distance of 112.5 mm. The results revealed that the sandwich panel with a plate thickness of 5 mm encountered a large tearing opening in both the top and bottom plates, a maximum sandwich panel displacement value of 181.5 mm, and a maximum bottom plate displacement value of 148.2 mm. In comparison to the sandwich panel with a 5 mm plate thickness, the sandwich panel with a plate thickness of 10 mm had a maximum sandwich panel displacement value of 101.6 mm, which is around 44% reduction, and no tearing fracture to its plates. Moreover, the bottom plate displacement was reduced by 58% to record a value of 62.5 mm. The results confirmed that lower structure stiffness is achieved with thin sandwich panel plates yielding ductile failure and tearing of the plate when the structure is impacted by ballistic loading. In addition, the statistical analysis revealed that there is a very strong negative correlation between the plate thickness and the sandwich panel displacement with a Pearson correlation coefficient of −0.938 and a very strong negative correlation with a Pearson correlation coefficient of −0.962 between the plate thickness and the bottom plate displacement, as shown in Figure 17 and Figure 18, respectively.
Furthermore, the correlation test showed a very weak correlation with a Pearson correlation coefficient of −0.110 between the plate thickness and the elastic strain energy. However, it was observed from Figure 11 that the elastic strain energy in most cases decreased with the decrease in the plate thickness. Moreover, the statistical results showed that there is a strong negative correlation with a Pearson correlation coefficient of −0.905 between the plate thickness and the work done by external forces. Adaba and Ibrahim [16] concluded that increasing the thickness of the front sheet results in decreasing the deformation of the back sheet. Increasing the plate thickness increases the sandwich panel’s stiffness, making the sandwich panel more resistant to deformation and external work caused by impact loading. This is also exhibited in Figure 19. In addition to the reduction in displacement, similar behavior is also exhibited for damage development and illustrated in Figure 18. Although other researchers revealed that the tubular core mitigated the impulse load effectively by plastic deformation of the core tubes [13], less energy was dissipated in plastic deformation of the tubular core compared to other core shapes as seen in Figure 20.

3.2.3. Core-to-Core Spacing

The results revealed that most of the tearing of the faceplate occurred to the sandwich panel with a core-to-core spacing distance of 112.5 mm, while no fracture failure to the faceplate occurred for the sandwich panels with core spacing gaps of 75 mm. As illustrated in Figure 21, the reason could be the support provided by the core structure at the center of the sandwich panel, which dissipates the impact energy [28]. In addition, one test run of a honeycomb sandwich panel with a core spacing gap of 150 mm recorded a tearing to the faceplate. This could be explained as the tearing occurred due to the large spacing gaps causing less support to the faceplate. This is also revealed by the damage development seen in Figure 22.
Furthermore, the correlation test showed a very weak correlation between the spacing gaps between the core shapes and all of the strain energy, the external work done, and the sandwich panel displacement with a Pearson correlation coefficient of −0.159, 0.181, and 0.103, respectively. However, the results in Figure 12 showed that the amplitude of the external work done slightly increased with the increase in the spacing gaps between the core shapes. The reason for the increase in the external work might be the decrease in the sandwich panel stiffness caused by having more core structures providing support to the plates. Similarly, as shown in Figure 13, the sandwich panel displacement increased with the increase in the spacing gaps between the core shapes for the honeycomb and mushroom sandwich panels. While the displacement increased with the increase in the spacing distance for tubular sandwich panels with only plate thicknesses of 5 mm.

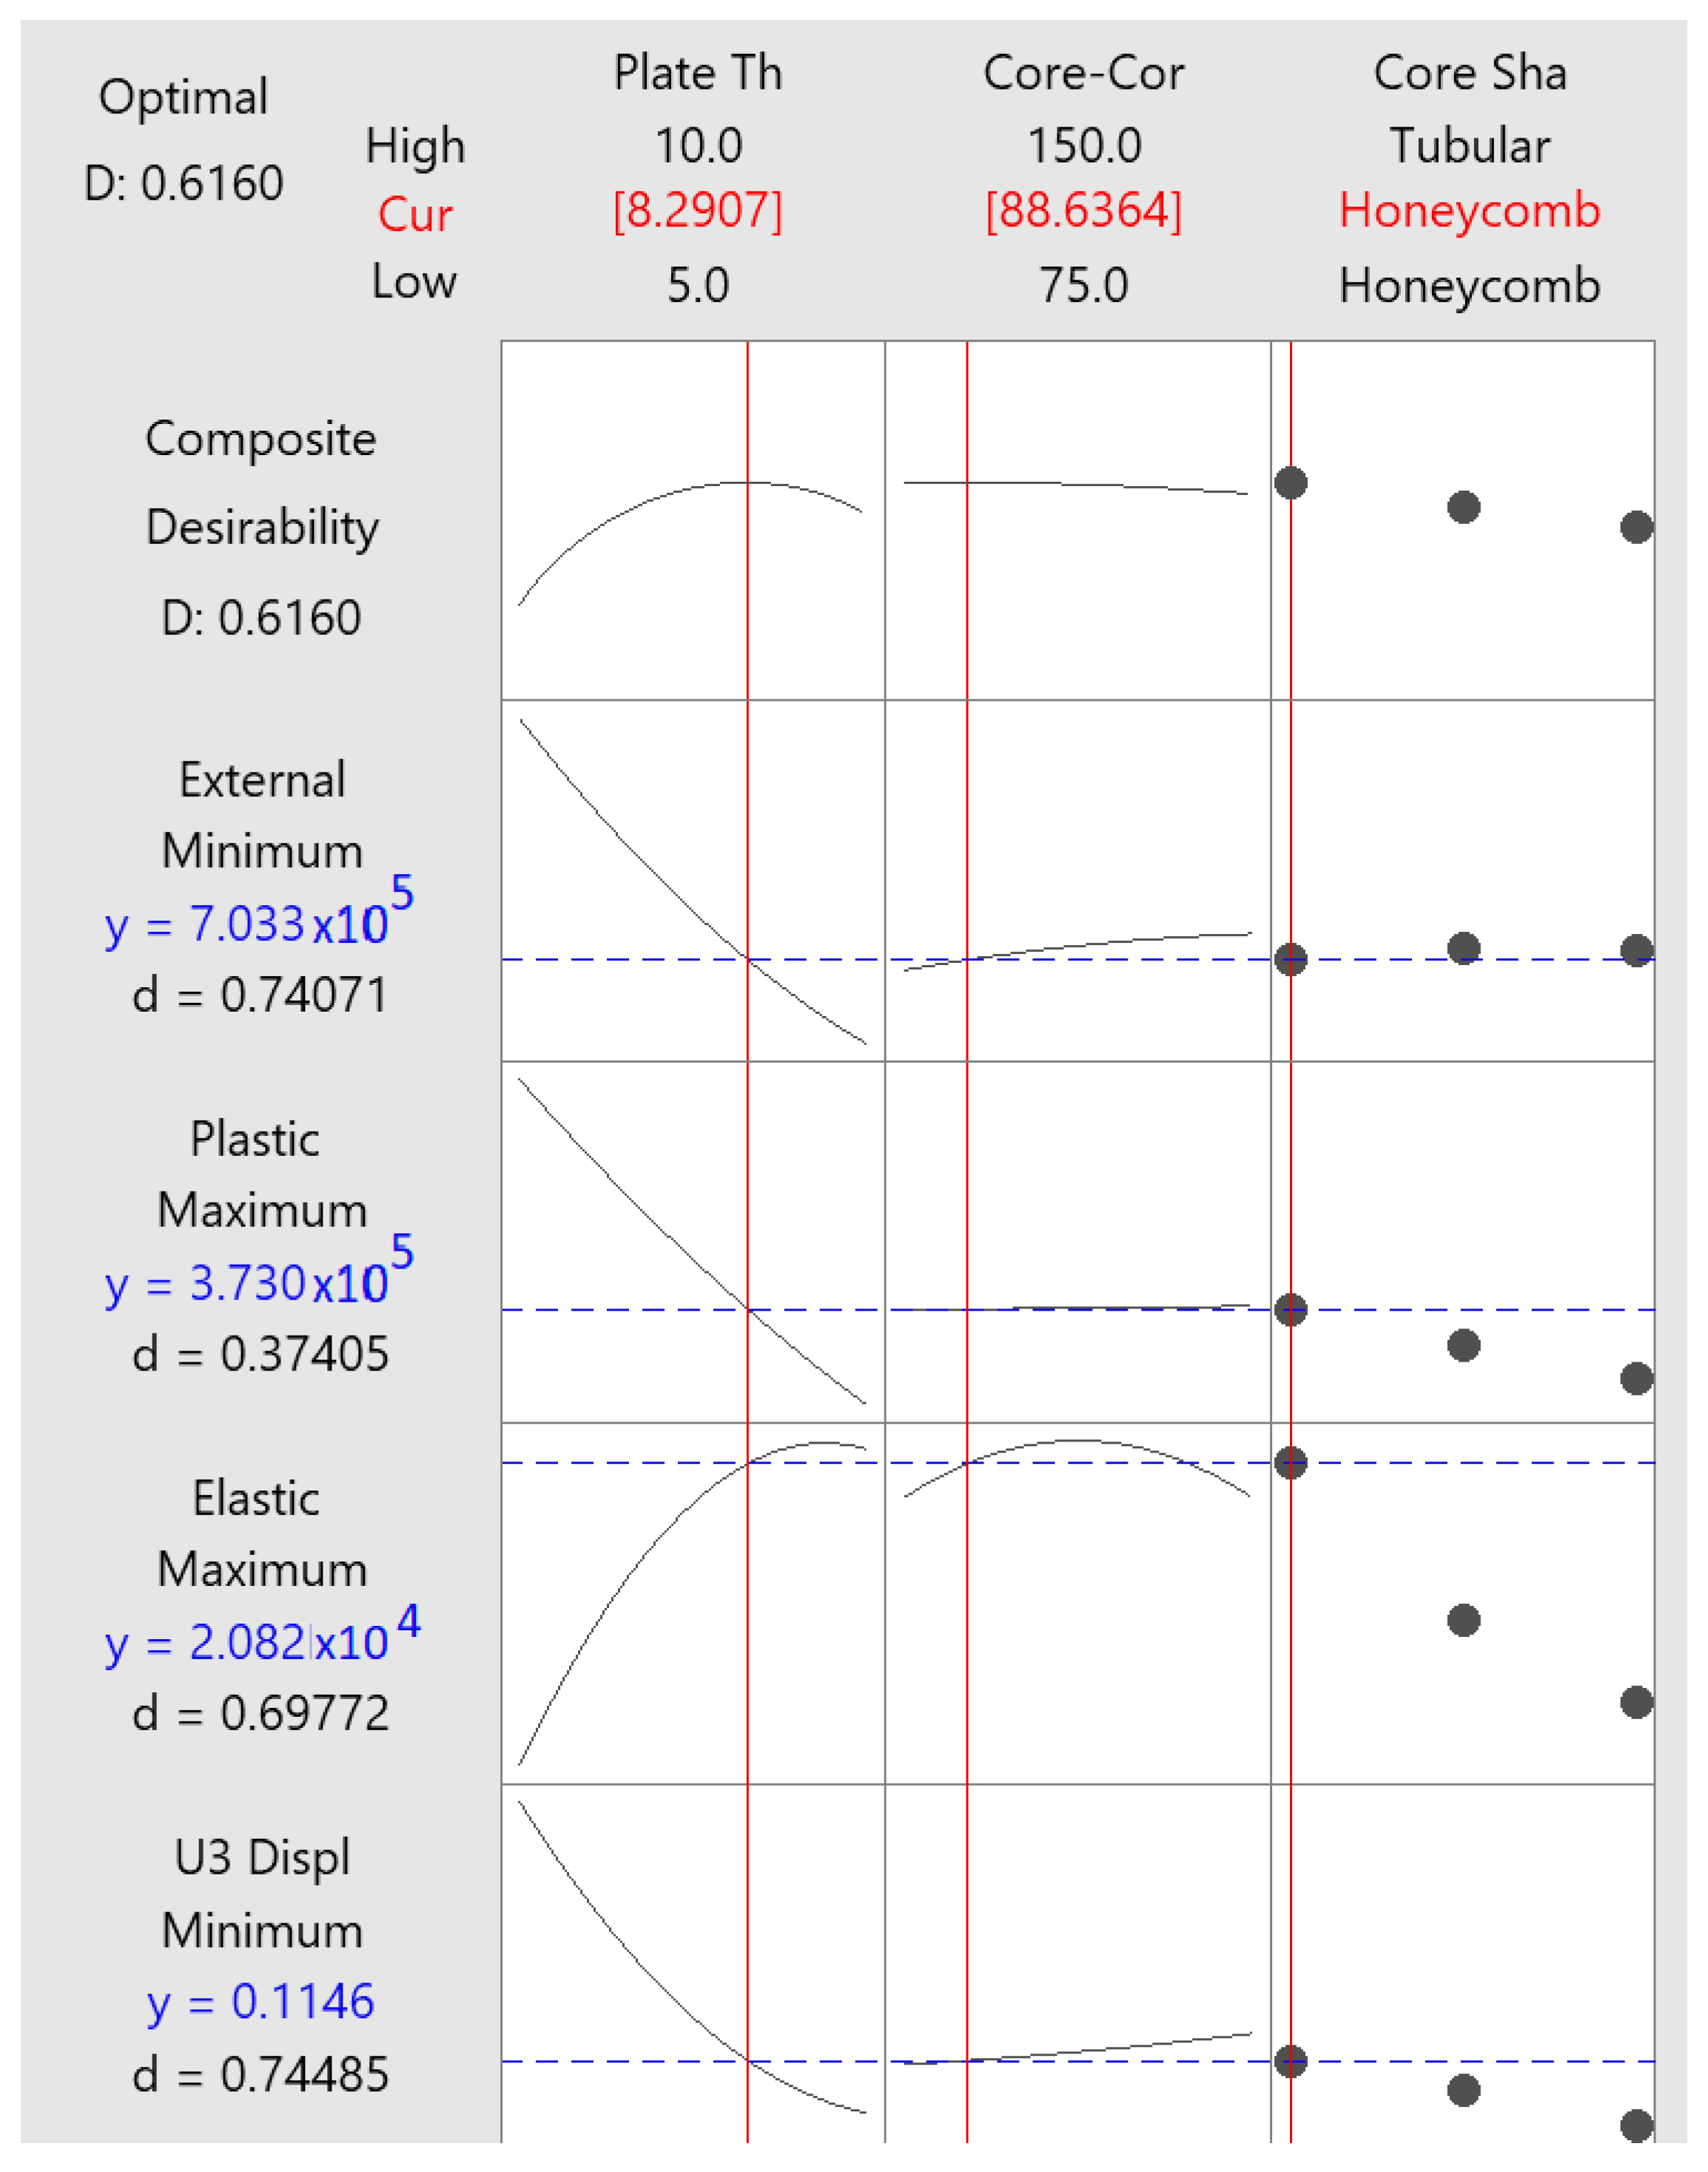
3.3. Regression Analysis

The numerical models’ responses were statistically studied using the response surface design available in Minitab® 20.2. The response surface methodology uses mathematical and statistical techniques to create and refine models that provide a better understanding of the responses and the level of change caused by varying the input variables. The response surface utilizes quadratic terms, which cover the non-linearity in the responses [29]. Regression equations were created for the three responses under study and are provided in Equations (7)–(15). The regression model for the sandwich panel displacement had an R-Squared value of 98.80% and an R-Squared adjusted value of 97.92%, indicating that the regression model is strong. Similarly, the regression model of the external work done was strong as it has an R-Squared value of 99.98% and an R-Squared adjusted value of 99.97%. Additionally, the created regression model for the elastic strain energy was a strong model with an R-Squared value of 89.13% and an R-Squared adjusted value of 81.15%.
U H o n e y c o m b = 0.3471 0.04800   P + 0.000243   D + 0.002362   P 2 + 0.000000   D 2 0.000030   P   D
U M u s h r o o m = 0.3358 0.04703   P + 0.000198   D + 0.002362   P 2 + 0.000000   D 2 0.000030   P   D
U T u b u l a r = 0.3336 0.04725   P + 0.000143   D + 0.002362   P 2 + 0.000000   D 2 0.000030   P   D
S H o n e y c o m b = 2344 + 2967   P + 89.3   D 154.7   P 2 0.373   D 2 0.64   P   D
S M u s h r o o m = 661 + 3114   P + 93.1   D 154.7   P 2 0.373   D 2 0.64   P   D
S T u b u l a r = 1210 + 3081   P + 93.7   D 154.7   P 2 0.373   D 2 0.64   P   D
W H o n e y c o m b = 1,593,429 173,113   P + 2090   D + 6185   P 2 5.509   D 2 29.48   P   D
W M u s h r o o m = 1,590,112 169,512   P + 1942   D + 6185   P 2 5.509   D     D 29.48   P     D
W T u b u l a r = 1,593,751 169,001   P + 1832   D + 6185   P 2 5.509   D     D 29.48   P     D
where U is the sandwich panel displacement, S is the elastic strain energy, W is the work done by external forces, P is the plate thickness, and D is the spacing distance between the center of the core shapes.
The main effect plots will be used to determine the relative impact of each of the inputs on the response variable by plotting the mean of each response value at each level of design parameter. This will allow us to examine the difference between the level means for one or more factors. The main effect plot in Figure 23 and the simulation results in Figure 24 shows that the sandwich panel displacement increases with the increase in the spacing gaps between the core shapes and increases with the decrease in the plate thickness. More gaps between the core shapes result in reducing the support and the energy dissipation by the core structure [28]. However, the effect of the spacing gaps between the core shapes and core shapes is not as significant as the plate thickness. Increasing the plate thickness results in increasing the stiffness of the sandwich panel, which makes it more resistant to deformation. The thicker the front sheet, the lower the deformation of the back sheet [16]. In addition, the core structure shape affects the sandwich panel displacement, where the lowest displacements are achieved by sandwich panels with tubular core shapes followed by mushroom and honeycomb core shapes, respectively.
Moreover, the main effect plot for the work done by external forces is shown in Figure 25. The plot showed that the plate thickness significantly affected the external work done. The external work done significantly decreased with the increase in the plate thickness. The reason might be the increase in the stiffness caused by the increase in the plate thickness. In addition, increasing the spacing distances between the core shapes increased slightly the external work done. In contrast, the core shapes have a minor effect on the external work done.
Furthermore, the elastic strain energy was significantly affected by the plate thickness and the core structure shape. Cheng et al. [13] stated that having a rigid and stiff core structure results in having a lower energy absorption core. As shown in Figure 26, the increase in the plate thickness significantly increased the strain energy. In addition, the strain energy significantly increased with the honeycomb core shape compared to the mushroom and tubular core shapes. Moreover, the main effect plot in Figure 26 showed that the highest strain energy values are achieved with the core spacing distances of 112.5 mm.
The regression model given by Equations (7)–(15) was optimized with respect to the various response variables. As seen from Figure 27, the optimal process parameters when minimizing the displacement are represented by a plate thickness of 10 mm, core–core spacing of 150 mm and a tubular core shape. In case of minimizing the external work, the optimal process parameters are represented by a plate thickness of 10 mm, core–core spacing of 75 mm and a hexagonal core shape. The plastic dissipation is maximized through the same combination, but a thinner plate thickness of 5 mm and elastic strain energy is maximized at a plate thickness of 9.34 mm, core–core spacing of 111 and a honeycomb core shape.
In case of a multi-criteria optimization is used, the optimal setting is a plate thickness of 8.3 mm, core–core spacing of 88.6 mm, and a honeycomb structure (Figure 28).

4. Conclusions

This paper numerically investigated the performance of different sandwich panel design parameters in mitigating the blast loading impact. Based on the surveyed literature, three designs were proposed for the sandwich panel core shapes: hexagonal honeycomb, mushroom, and tubular. Results showed that the sandwich panels with tubular core shapes outperformed the mushroom and the honeycomb core shapes reducing plastic deformation and recording no major ductile failure and tearing. Most of the energy was dissipated as kinetic energy. In addition, the honeycomb sandwich panels showed internal energy dissipated as elastic, plastic, and damage compared to the mushroom and tubular core shapes. This could be explained by the tubular sandwich panels being stiffer than the other two core shapes reducing deformation and dissipating more energy as kinetic energy. In addition, the statistical results revealed a strong negative correlation between the plate thickness and both the sandwich panel displacement, and the external work done, which might be explained by the increase in the sandwich panel stiffness caused by the increase in the plate thickness. Moreover, the spacing between the core shapes has a minor effect on the sandwich panel displacement and the external work done compared to the effect caused by varying the sandwich panel’s plate thickness. The results showed that increasing the spacing in the core results in minorly increasing the sandwich panel displacement and the external work done by the impact load on the sandwich panel, which is explained by the decrease in the support provided by core shapes to the sandwich panel plates.
The regression analysis was applied to the numerical responses, and the results revealed that the plate thickness is the most influential factor that decreases the sandwich panel displacement and the external work done and increases the elastic strain energy. In addition, the core structure shape affects the internal energy but is not as significant as plate thickness and has a mild and a low effect on the sandwich panel displacement and the external work done, respectively. Moreover, the regression analysis showed that the spacing gaps between the core shapes factor have a minor effect on the sandwich panel displacement and the external work done. Additionally, the spacing gaps factor has a mild effect on the elastic strain energy, especially when it has a value of 112.5 mm. Results reveal that plate thickness is the main contributor to achieving the best blast mitigation results; however, this would negatively affect the weight of the sandwich structure. Despite the extensive research investigating new core shapes, results reveal that the contribution of varying shapes compared to other factors is minimal. Research should be focused on other means for enhancing blast resistance without determining the advantages of the sandwich panel from being lightweight and cost-effective.

Author Contributions

Conceptualization, Y.S.A., N.M.H. and Z.B.; methodology, Y.S.A., N.M.H. and Z.B.; software, Y.S.A., N.M.H.; validation, Y.S.A., N.M.H. and Z.B.; formal analysis Y.S.A., N.M.H. and Z.B.; investigation, Y.S.A., N.M.H. and Z.B.; resources, Y.S.A., N.M.H. and Z.B.; data curation, Y.S.A., N.M.H.; writing—original draft preparation, Y.S.A.; writing—review and editing, Y.S.A., N.M.H. and Z.B.; visualization, Y.S.A., N.M.H. and Z.B.; supervision, Y.S.A., N.M.H. and Z.B.; project administration, Y.S.A., N.M.H. and Z.B.; funding acquisition, Y.S.A., N.M.H. and Z.B. All authors have read and agreed to the published version of the manuscript.

Funding

The authors acknowledge the support of the American University of Sharjah under the Open Access Program. This paper represents the opinions of the authors and does not mean to represent the position or opinions of the American University of Sharjah.

Data Availability Statement

All data generated or analyzed during this study are included in this published article.

Conflicts of Interest

The authors declare no conflict of interest.

References

  1. Tran-Ngoc, H.; Khatir, S.; Ho-Khac, H.; De Roeck, G.; Bui-Tien, T.; Wahab, M.A. Efficient Artificial neural networks based on a hybrid metaheuristic optimization algorithm for damage detection in laminated composite structures. Compos. Struct. 2020, 262, 113339. [Google Scholar] [CrossRef]
  2. Chi, Y.; Langdon, G.; Nurick, G. The influence of core height and face plate thickness on the response of honeycomb sandwich panels subjected to blast loading. Mater. Des. 2010, 31, 1887–1899. [Google Scholar] [CrossRef]
  3. Alberdi, R.; Przywara, J.; Khandelwal, K. Performance evaluation of sandwich panel systems for blast mitigation. Eng. Struct. 2013, 56, 2119–2130. [Google Scholar] [CrossRef]
  4. Zonghong, X.; Vizzini, A.J.; Qingru, T. On residual compressive strength prediction of composite sandwich panels after low-velocity impact damage. Acta Mech. Solida Sin. 2006, 19, 9–17. [Google Scholar]
  5. Feng, D.; Aymerich, F. Damage prediction in composite sandwich panels subjected to low-velocity impact. Compos. Part A Appl. Sci. Manuf. 2013, 52, 12–22. [Google Scholar] [CrossRef]
  6. Schubel, P.M.; Luo, J.-J.; Daniel, I.M. Impact and post impact behavior of composite sandwich panels. Compos. Part A Appl. Sci. Manuf. 2007, 38, 1051–1057. [Google Scholar] [CrossRef]
  7. Rizov, V.; Shipsha, A.; Zenkert, D. Indentation study of foam core sandwich composite panels. Compos. Struct. 2005, 69, 95–102. [Google Scholar] [CrossRef]
  8. Tariq, F.; Uzair, M.; Shifa, M. Residual compressive strength of aluminum alloy honeycomb sandwich panel in the presence of multiple impact dents. J. Sandw. Struct. Mater. 2022, 24, 1189–1205. [Google Scholar] [CrossRef]
  9. Zhou, X.; Ma, Z.; Liu, X. Impact Damage Characteristics of Quartz Fiber and NOMEX Paper Honeycomb Sandwich Panel composite materials. J. Phys. Conf. Ser. 2022, 2194, 012013. [Google Scholar] [CrossRef]
  10. Hua, Y.; Akula, P.K.; Gu, L. Experimental and numerical investigation of carbon fiber sandwich panels subjected to blast loading. Compos. Part B Eng. 2014, 56, 456–463. [Google Scholar] [CrossRef] [Green Version]
  11. Sun, G.; Wang, E.; Zhang, J.; Li, S.; Zhang, Y.; Li, Q. Experimental study on the dynamic responses of foam sandwich panels with different facesheets and core gradients subjected to blast impulse. Int. J. Impact Eng. 2019, 135, 103327. [Google Scholar] [CrossRef]
  12. Huo, X.; Sun, G.; Zhang, H.; Lv, X.; Li, Q. Experimental study on low-velocity impact responses and residual properties of composite sandwiches with metallic foam core. Compos. Struct. 2019, 223, 110835. [Google Scholar] [CrossRef]
  13. Cheng, W.; Bin, X.; Yuen, S.C.K. Numerical analysis of cladding sandwich panels with tubular cores subjected to uniform blast load. Int. J. Impact Eng. 2019, 133, 103345. [Google Scholar]
  14. Yuen, S.C.K.; Cunliffe, G.; du Plessis, M. Blast response of cladding sandwich panels with tubular cores. Int. J. Impact Eng. 2017, 110, 266–278. [Google Scholar] [CrossRef]
  15. Li, Z.; Chen, W.; Hao, H. Blast mitigation performance of cladding using square dome-shape kirigami folded structure as core. Int. J. Mech. Sci. 2018, 145, 83–95. [Google Scholar] [CrossRef]
  16. Abada, M.; Ibrahim, A.A. Metallic Ribbon-Core Sandwich Panels Subjected to Air Blast Loading. Appl. Sci. 2020, 10, 4500. [Google Scholar] [CrossRef]
  17. Kumar, R.; Patel, S. Failure analysis on octagonal honeycomb sandwich panel under air blast loading. Mater. Today Proc. 2021, 46, 9667–9672. [Google Scholar] [CrossRef]
  18. Bornstein, H.; Ryan, S.; Mouritz, A.P. Evaluation of blast protection using novel-shaped water-filled containers: Experiments and simulations. Int. J. Impact Eng. 2019, 127, 41–61. [Google Scholar] [CrossRef]
  19. Smith, M. ABAQUS User’s Manual: Energy Balance; Dassault Systèmes Simulia Corp: Johnston, RI, USA, 2021. [Google Scholar]
  20. Guo, Y.; Yen, D.W. A FEM study on mechanisms of discontinuous chip formation in hard machining. J. Mater. Process. Technol. 2004, 155–156, 1350–1356. [Google Scholar] [CrossRef]
  21. Arriaga, M.; Waisman, H. Multidimensional stability analysis of the phase-field method for fracture with a general degradation function and energy split. Comput. Mech. 2018, 61, 181–205. [Google Scholar] [CrossRef]
  22. Murugesan, M.; Jung, D. Johnson Cook Material and Failure Model Parameters Estimation of AISI-1045 Medium Carbon Steel for Metal Forming Applications. Materials 2019, 12, 609. [Google Scholar] [CrossRef] [PubMed] [Green Version]
  23. Smith, M. ABAQUS User’s Manual: Damage Initiation for Ductile Metals; Dassault Systèmes Simulia Corp: Johnston, RI, USA, 2021. [Google Scholar]
  24. Sobolev, A.; Radchenko, M. Use of Johnson–Cook plasticity model for numerical simulations of the SNF shipping cask drop tests. Nucl. Energy Technol. 2016, 2, 272–276. [Google Scholar] [CrossRef]
  25. Smith, M. ABAQUS User’s Manual: Johnson-Cook Damage; Dassault Systèmes Simulia Corp: Johnston, RI, USA, 2021. [Google Scholar]
  26. Dharmasena, K.P.; Wadley, H.N.; Xue, Z.; Hutchinson, J.W. Mechanical response of metallic honeycomb sandwich panel structures to high-intensity dynamic loading. Int. J. Impact Eng. 2008, 35, 1063–1074. [Google Scholar] [CrossRef]
  27. Smith, M. ABAQUS User’s Manual: Deformation of a Sandwich Plate under CONWEP Blast Loading; Dassault Systèmes Simulia Corp: Johnston, RI, USA, 2021. [Google Scholar]
  28. Lu, J.; Wang, Y.; Zhai, X.; Zhi, X.; Zhou, H. Impact behavior of a cladding sandwich panel with aluminum foam-filled tubular cores. Thin Walled Struct. 2021, 169, 108459. [Google Scholar] [CrossRef]
  29. Minitab Statistical Software. MINITAB User’s Guide: What Are Response Surface Designs, Central Composite Designs, and Box-Behnken Designs? Minitab: Sydney, Australia, 2021. [Google Scholar]
Figure 1. Schematic drawing of blast loading and boundary conditions.
Jcs 07 00044 g001
Figure 2. Proposed conceptual designs core shapes (a) tubular (b) mushroom (c) honeycomb.
Jcs 07 00044 g002
Figure 3. (a) Face plate, (b) tubular core (c) honeycomb core (d) mushroom core.
Jcs 07 00044 g003
Figure 4. Convergence of the vertical displacement with the variation of the number of elements.
Jcs 07 00044 g004
Figure 5. Air blast pressure–time response.
Jcs 07 00044 g005
Figure 6. (a) Boundary conditions (b) core and top plate tie constraint.
Jcs 07 00044 g006
Figure 7. Displacement of (a) top plate, (b) bottom plate.
Jcs 07 00044 g007
Figure 8. Square honeycomb panel (a) full model view (b) slice cut view.
Jcs 07 00044 g008
Figure 9. Deformation profile for sandwich panel with a façade plate thickness of 5 mm, core–core spacing of 112.5 mm, and (a) honeycomb (b) mushroom (c) tubular core shape.
Jcs 07 00044 g009
Figure 10. Elastic strain energy categorized by core shape, plate thickness, and core–core spacing.
Jcs 07 00044 g010
Figure 11. Blast load location for the honeycomb shape—top view (a) D = 75 mm (b) D = 112.5 mm (c) D = 150 mm.
Jcs 07 00044 g011aJcs 07 00044 g011b
Figure 12. Work of external forces categorized by core shape, plate thickness, and core–core spacing.
Jcs 07 00044 g012
Figure 13. Maximum U3 displacement categorized by core shape, plate thickness, and core–core spacing.
Jcs 07 00044 g013
Figure 14. Kinetic energy categorized by core shape, plate thickness, and core–core spacing.
Jcs 07 00044 g014
Figure 15. Damage development for different core shapes: honeycomb, mushroom, and tubular core with a façade plate thickness of 5 mm and core–core spacing of 112.5 mm.
Jcs 07 00044 g015
Figure 16. Honeycomb sandwich panel with D = 112.5 (a) P = 5 (b) P = 10.
Jcs 07 00044 g016
Figure 17. Plate thickness and sandwich panel displacement correlation.
Jcs 07 00044 g017
Figure 18. Plate thickness and the bottom plate displacement correlation.
Jcs 07 00044 g018
Figure 19. Damage development for mushroom shape with different façade plate thickness: 5 mm, 7.5 mm, and 10 mm with core–core spacing of 112.5 mm.
Jcs 07 00044 g019
Figure 20. Energy dissipated by plastic deformation categorized by core shape, plate thickness, and core–core spacing.
Jcs 07 00044 g020
Figure 21. Blast load location of the tubular shape—top view (a) D = 75 mm (b) D = 112.5 mm (c) D = 150 mm.
Jcs 07 00044 g021
Figure 22. Damage development for tubular shape with façade plate thickness of 5 mm and core–core spacing of: 75 mm, 112.5 mm, and 150 mm.
Jcs 07 00044 g022
Figure 23. Main effects plot for sandwich panel displacement.
Jcs 07 00044 g023
Figure 24. The simulation results of the mean of the sandwich panel displacement.
Jcs 07 00044 g024
Figure 25. Main effects plot for work done by external force.
Jcs 07 00044 g025
Figure 26. Main effects plot for elastic strain energy.
Jcs 07 00044 g026
Figure 27. Optimal process parameters.
Jcs 07 00044 g027
Figure 28. Multi-criteria optimal process parameters.
Jcs 07 00044 g028
Table 1. Design of experiment (DOE) and numerical model responses.
Run #Plate ThicknessCore–Core DistanceCore ShapeStructure MassU3 DisplacementKinetic EnergyElastic Strain EnergyPlastic Dissipated EnergyExternal Work
1575Honeycomb37.870.17233.69 × 10517,5255.12 × 1059.98 × 105
25112.5Honeycomb36.380.18153.80 × 10517,5355.00 × 1051.03 × 106
35150Honeycomb36.010.19063.84 × 10517,9505.04 × 1051.05 × 106
47.575Honeycomb54.410.12992.86 × 10519,7284.00 × 1057.54 × 105
57.5112.5Honeycomb52.920.13033.03 × 10523,1984.10 × 1057.85 × 105
67.5150Honeycomb52.550.13393.07 × 10519,6003.97 × 1058.00 × 105
71075Honeycomb70.950.098662.26 × 10520,4163.10 × 1055.82 × 105
810112.5Honeycomb69.460.10162.41 × 10520,9693.23 × 1056.11 × 105
910150Honeycomb69.090.10452.50 × 10520,2443.24 × 1056.28 × 105
10575Mushroom38.540.16463.65 × 10515,7844.66 × 1059.99 × 105
115112.5Mushroom36.910.1713.75 × 10516,2604.57 × 1051.03 × 106
125150Mushroom36.420.17443.81 × 10516,4004.66 × 1051.04 × 106
137.575Mushroom55.080.12062.89 × 10518,4753.78 × 1057.67 × 105
147.5112.5Mushroom53.450.12013.03 × 10518,6553.75 × 1057.90 × 105
157.5150Mushroom52.960.12693.09 × 10519,0113.76 × 1058.02 × 105
161075Mushroom71.620.094772.38 × 10519,7873.09 × 1056.09 × 105
1710112.5Mushroom69.990.09352.52 × 10519,8863.08 × 1056.26 × 105
1810150Mushroom69.50.09672.58 × 10519,6013.10 × 1056.36 × 105
19575Tubular38.520.15933.71 × 10515,4334.37 × 1059.98 × 105
205112.5Tubular36.820.16373.82 × 10516,1084.44 × 1051.03 × 106
215150Tubular36.270.17233.89 × 10515,3424.48 × 1051.03 × 106
227.575Tubular55.060.10572.98 × 10517,5543.52 × 1057.60 × 105
237.5112.5Tubular53.360.10393.11 × 10517,5393.59 × 1057.85 × 105
247.5150Tubular52.810.0993.16 × 10518,1693.63 × 1057.89 × 105
251075Tubular71.60.089222.47 × 10518,7482.90 × 1056.09 × 105
2610112.5Tubular69.90.089192.58 × 10519,1282.94 × 1056.25 × 105
2710150Tubular69.350.08852.64 × 10519,3402.99 × 1056.30 × 105
Table 2. Material properties of AISI-4340 [].
A (MPa)792n0.26 d 3 2.12Density ( K g / m 3 )7830
B (MPa)510 ε ˙ 0 1 d 4 0.002Young’s modulus (GPa)208
C0.014 d 1 0.05 d 5 0.61Poisson ratio0.3
m1.03 d 2 3.44 T m e l t (°C)1520Critical fracture energy (kJ / m 2 )12.5
Disclaimer/Publisher’s Note: The statements, opinions and data contained in all publications are solely those of the individual author(s) and contributor(s) and not of MDPI and/or the editor(s). MDPI and/or the editor(s) disclaim responsibility for any injury to people or property resulting from any ideas, methods, instructions or products referred to in the content.

