Article

Study of the Agreement of the Apnea–Hypopnea Index Measured Simultaneously by Pressure Transducer via Respiratory Polygraphy and by Thermistor via Polysomnography in Real Time with the Same Individuals

1
Faculty of Medicine, University of Medicine and Pharmacy at Ho Chi Minh City, Ho Chi Minh City 8428, Vietnam
2
Clinical Research Unit, Lam Dong Medical College, Dalat 84263, Vietnam
3
Consultation Department, Pham Ngoc Thach Medical University, Ho Chi Minh City 8428, Vietnam
4
Division of Pulmonary, Allergy and Critical Care Medicine, Hershey Medical Center, Penn State Medical College, Hershey, PA 17033, USA
*
Author to whom correspondence should be addressed.
J. Otorhinolaryngol. Hear. Balance Med. 2022, 3(2), 4; https://doi.org/10.3390/ohbm3020004
Submission received: 29 October 2021 / Revised: 10 April 2022 / Accepted: 28 April 2022 / Published: 1 May 2022

Abstract

:
Background: Obstructive sleep apnea (OSA) is a common disorder and can lead to many severe complications; however, the majority of patients remain undiagnosed. Although polysomnography (PSG) remains the gold standard of diagnosis, it is usually uncomfortable and costly for patients. Purpose: The study aims to assess the agreement of the AHI measured by polygraphy (PG) (Philips Alice NightOne) with that of polysomnography (Philips Alice PDx) simultaneously recorded in-lab. Methods: A total of 11 voluntary participants over 18 years old underwent one night of simultaneous PSG and PG recording in sleep laboratories. Studied parameters (AHI, OAI, CAI, MAI, and minSpO2) were analyzed and reported by the Philips Sleepware G3 software. PSG and PG results were scored by qualified staff. Results: In terms of AHI, the mean AHI derived from PG was different from that of PSG—7.78 and 2.37 events/h, respectively. A Bland–Altman analysis of the AHI on PSG versus PG showed a mean difference of 5.41; limits of agreement (equal to ±2 standard deviations) were from −6.74 to 17.56. The Bland–Altman analysis showed a slight difference between the two methods, with a mean difference of −0.12 events/h in CAI, 1.35 events/h in OAI, and 0.42 events/h in MAI. Conclusions: In the population with a low suspicion of OSA, the PG showed a low agreement with the simultaneous PSG in the sleep lab. Therefore, PG should only be used as a screening method. Further studies with sufficient sensors in the expanded populations of OSA are needed.

1. Introduction

Obstructive sleep apnea (OSA) is a disorder characterized by repetitive episodes of nocturnal breathing cessation due to upper airway collapse [1]. One-seventh of the world’s adult population, or approximately one billion people, are estimated to have OSA [2]. In Vietnam, 8.5% of the adult population had OSA with an AHI > 5 in 2018 [3].
Obstructive sleep apnea has severe consequences such as metabolic dysfunction, cardiovascular disease, behavior disorders, and adverse clinical associations, including excessive daytime sleepiness and impaired quality of life. In addition, subjects with severe OSA may have more risks from traffic accidents and depression in comparison to those without OSA [4,5]. Furthermore, coronary artery calcification (CAC) presents twice more often in OSA patients than in non-OSA ones [6]. A previous study showed that OSA had been associated with the occurrence of diabetes, with an unadjusted pooled relative risk of 1.62 (95% confidence interval 1.45–1.80) and an adjusted pooled relative risk of 1.35 (95% confidence interval 1.24, 1.47) [7]. In terms of health economics, according to AASM, the estimated economic cost of undiagnosed obstructive sleep apnea in the U.S. was nearly USD 150 billion in 2015 [8].
Therefore, there is a significant cost associated with evaluating all patients suspected of having OSA with PSG (currently considered as the gold standard diagnostic test). Each of the diagnostic modalities has its advantages and disadvantages. PSG may also provide additional valuable information to clinicians such as the percentage of time spent in each of the sleep stages, the presence of sleep fragmentation, or periodic leg movements; however, the cost of PSG is higher than that of PG, and it requires more resources, takes much longer to score, and requires appropriately trained staff who also need to score a certain number of studies annually to maintain their skills. Therefore, in the current economic climate, there is a trend towards exploring the use of home respiratory polygraphy in place of hospital PSG in the diagnosis of OSA [9].
The purpose of this study is to investigate the agreement of polygraphy (PG) results in the diagnosis of obstructive sleep apnea (OSA) with those of polysomnography (PSG), simultaneously recorded in sleep laboratories.

2. Methods

2.1. Participants

A total of 11 voluntary participants were recruited to join the study. The study subjects were volunteers over 18 years old who had never undergone tests such as respiratory polygraph, sleep polygraph, and prior OSA treatment. Exclusion criteria were past diagnosis of sleep apnea, obesity hypoventilation syndrome, narcolepsy, COPD, heart failure, shiftwork, jet lag, irregular work schedule in the past 3 months, history of oxygen therapy, having a clinically unstable condition, and having newly diagnosed conditions within the previous 2 months as well as other comorbidities. Table 1 presents participants’ demographic characteristics. All participants were informed of the purpose of the study, and all activities in the study followed the principles outlined in the Declaration of Helsinki.

2.2. PSG Device

The Alice PDx (Philips Respironics, Murrysville, PA, USA) is a type I or portable Type II device with a weight of approximately 230 g (not including batteries) and dimensions of 5 L × 3 W × 2 H (12.70 cm × 7.62 cm × 5.08 cm). The basic channel set measures the oral–nasal airflow, snore and pressure via the cannula and thermistor, respiratory effort via the abdominal and chest belts, and arterial oxygen saturation level via the pulse oximeter (%SpO2 and pulse rate). The device also detects body position (supine or non-supine). In addition to the basic channel set indicators, the Alice PDx contains sensors for the recording of cardiac electrical activity (ECG/EKG), electroencephalogram (EEG), electrooculogram (EOG), and electromyogram (EMG). Airflow pressure was not utilized for this study, but the nasal–oral airflow thermistor was used to detect the apnea–hypopnea index and snoring.

2.3. PG Device

The Alice NightOne (Philips Respironics, Murrysville, PA, USA) is a portable type III device with approximately 84 g (not including sensors or batteries) and dimensions of 4.07 L × 0.99 W × 2.67 H (10.34 cm × 2.51 cm × 6.78 cm). The device uses the same sensors recommended by the AASM for in-lab studies. The device has 3 sensors (effort belt, cannula, and oximeter) and a built-in body position sensor that provides seven channels of data (body position, pressure flow, snore, respiratory effort, SpO2, plethysmography, and pulse rate).

2.4. Procedure

Each volunteer underwent a one-night, in-lab PSG recording at the Sleep Medicine laboratory of the Vietnam Society of Sleep Medicine. Participants were instructed to sleep in whatever positions they were comfortable with, except in prone positions, and were allowed to take their regular medications. Within 4–6 h before testing, the participants were not allowed to use psychotropic substances such as alcohol, tobacco, coffee, and narcotic pain relievers. All their parameters were simultaneously collected through both Alice PDx and Alice Nightone. The PSG and PG results were scored by qualified staffs.

2.4.1. Alice PDx

Electrode application included five leads for EEG (sub-ear, one forehead, one frontal, one parietal, two eyes), two chin and four leg leads for EMG, and five chest leads for ECG. Respiratory effort was recorded using chest and abdominal RIP (Respiratory inductance plethysmography; the gold standard technology for the evaluation of respiratory effort [10]) and oronasal thermal excursion. Airflow was measured via nasal–oral thermistor; the nasal pressure transducer airflow (PTAF) was not utilized for this study. Oxygen saturation was collected via finger pulse oximetry (SpO2).

2.4.2. Alice NightOne

This has three components (Nasal pressure transducer, Pulse oximeter, Recording unit with chest belt) and has the same principle as Alice PDx.
When the participants woke up, two devices were removed and disinfected, then all parameters were analyzed and reported by Sleepware G3 software. In this study, we assessed the accuracy of two devices based on five indexes, namely the apnea–hypopnea index (AHI), obstructive apnea index (OAI), central apnea index (CAI), mixed apnea index (MAI), and minimum SpO2 (minSpO2).

2.5. PSG Data Score

Events were scored as apneas if there was a reduction of ≥90% thermal excursion for at least 10 s. Events were scored as hypopnea if the oral airflow thermistor was reduced by ≥50% for at least 10 s or ≥30% for at least 10 s and were associated with a drop of SpO2 ≥ 3% as defined by the standard device. Apneas were classified as obstructive, central, or mixed if respiratory efforts were present, absent, or partially present during the period of reduced airflow, respectively. Central sleep apnea was defined by a lack of respiratory effort during cessations of airflow, in contrast to obstructive sleep apnea (OSA), in which ongoing respiratory efforts were observed [11].
The apnea–hypopnea index (AHI) was calculated by averaging the number of apneas and hypopneas per hour of sleep. More specifically, in this study, we concentrated on AHI because it is a crucial index for diagnosing OSA, according to the American Academy of Sleep Medicine Task Force (AASM), and it is used to classify and follow-up the efficiency of treatment. An apnea–hypopnea index (AHI) greater than 5 per hour of sleep was considered abnormal and was indicative of mild (5 ≥ AHI < 15), moderate (15 ≥ AHI < 30), or severe OSA (AHI ≥ 30) according to Epstein et al. [12].
The obstructive apnea index (OAI) and central apnea index (CAI) were the mean number of obstructive apnea and central apnea events per hour, respectively. Classification of sleep apnea as obstructive or central depends on the type of predominant event. Therefore, OSA was predominantly diagnosed when >50% of the respiratory events were of the obstructive type [13].
Mixed apnea is an apnea that begins as a central apnea and ends as an obstructive apnea, which is without respiratory effort at the beginning of the event and is followed by increasing respiratory effort during the second half. Mixed apnea index (MAI) is the mean number of these events per hour.

2.6. PG Data Score

Records were also scored using the same criteria as PSG, except on apneas calculated by ≥90% pressure reduction for at least 10 s. The Alice NightOne AHI was measured as the mean number of apneas and hypopneas per hour of recording time.

2.7. Data Analysis

Continuous measurements were summarized in means and SD, and categorical variables using counts and percentages. For each of the metrics, we used a paired t-test to evaluate the difference between the measurements collected by each device. Then, we tested the significance of the differences using statistical methods represented by Bland and Altman plots. More specifically, subject-specific differences and subject-specific averages were calculated, and their correlations were analyzed using both statistic and graphic illustrations. The recorded data were analyzed using JASP 0.14.1 provided by the University of Amsterdam.

3. Results

3.1. Characteristics of Study Subjects

Table 1 shows the sample characteristics of the study. Study subjects were mostly young (22.7 ± 0.6 years of age) and mostly male (63.6% compared to 36.4% female). BMI was at a normal level (21.8 ± 2.2 kg/m2). They did not have any recognized sleep disorders (Table 1). The mean of the AHI was 2.4 ± 2.3 events/h measured by PSG (PDx) vs. 7.8 ± 7.7 events/h measured by PG (NightOne). The mean of CAI (central apnea index), OAI (obstructive apnea index), and MAI (mixed apnea index) measured by PSG (PDx device) are presented in Table 1 (0.7 ± 1.1, 0.5 ± 0.4, and 0.3 ± 0.2 events/h; respectively). The mean of CAI, OAI, and MAI measured by PG (NightOne device) are also presented in Table 1 (0.6 ± 0.7, 1.9 ± 2.9, and 0.7 ± 1.1 events/h; respectively). The mean of HI (hypopnea index) measured by PSG (PDx) and PG (NightOne device) were 4.9 ± 10.9 and 4.7 ± 3.7 events/h, respectively (Table 1). The mean of SpO2 measured by PSG and PG were 94.2 ± 1.0 and 94.0 ± 1.0%, respectively (Table 1).

3.2. Comparison of Respiratory Events between PSG and PG

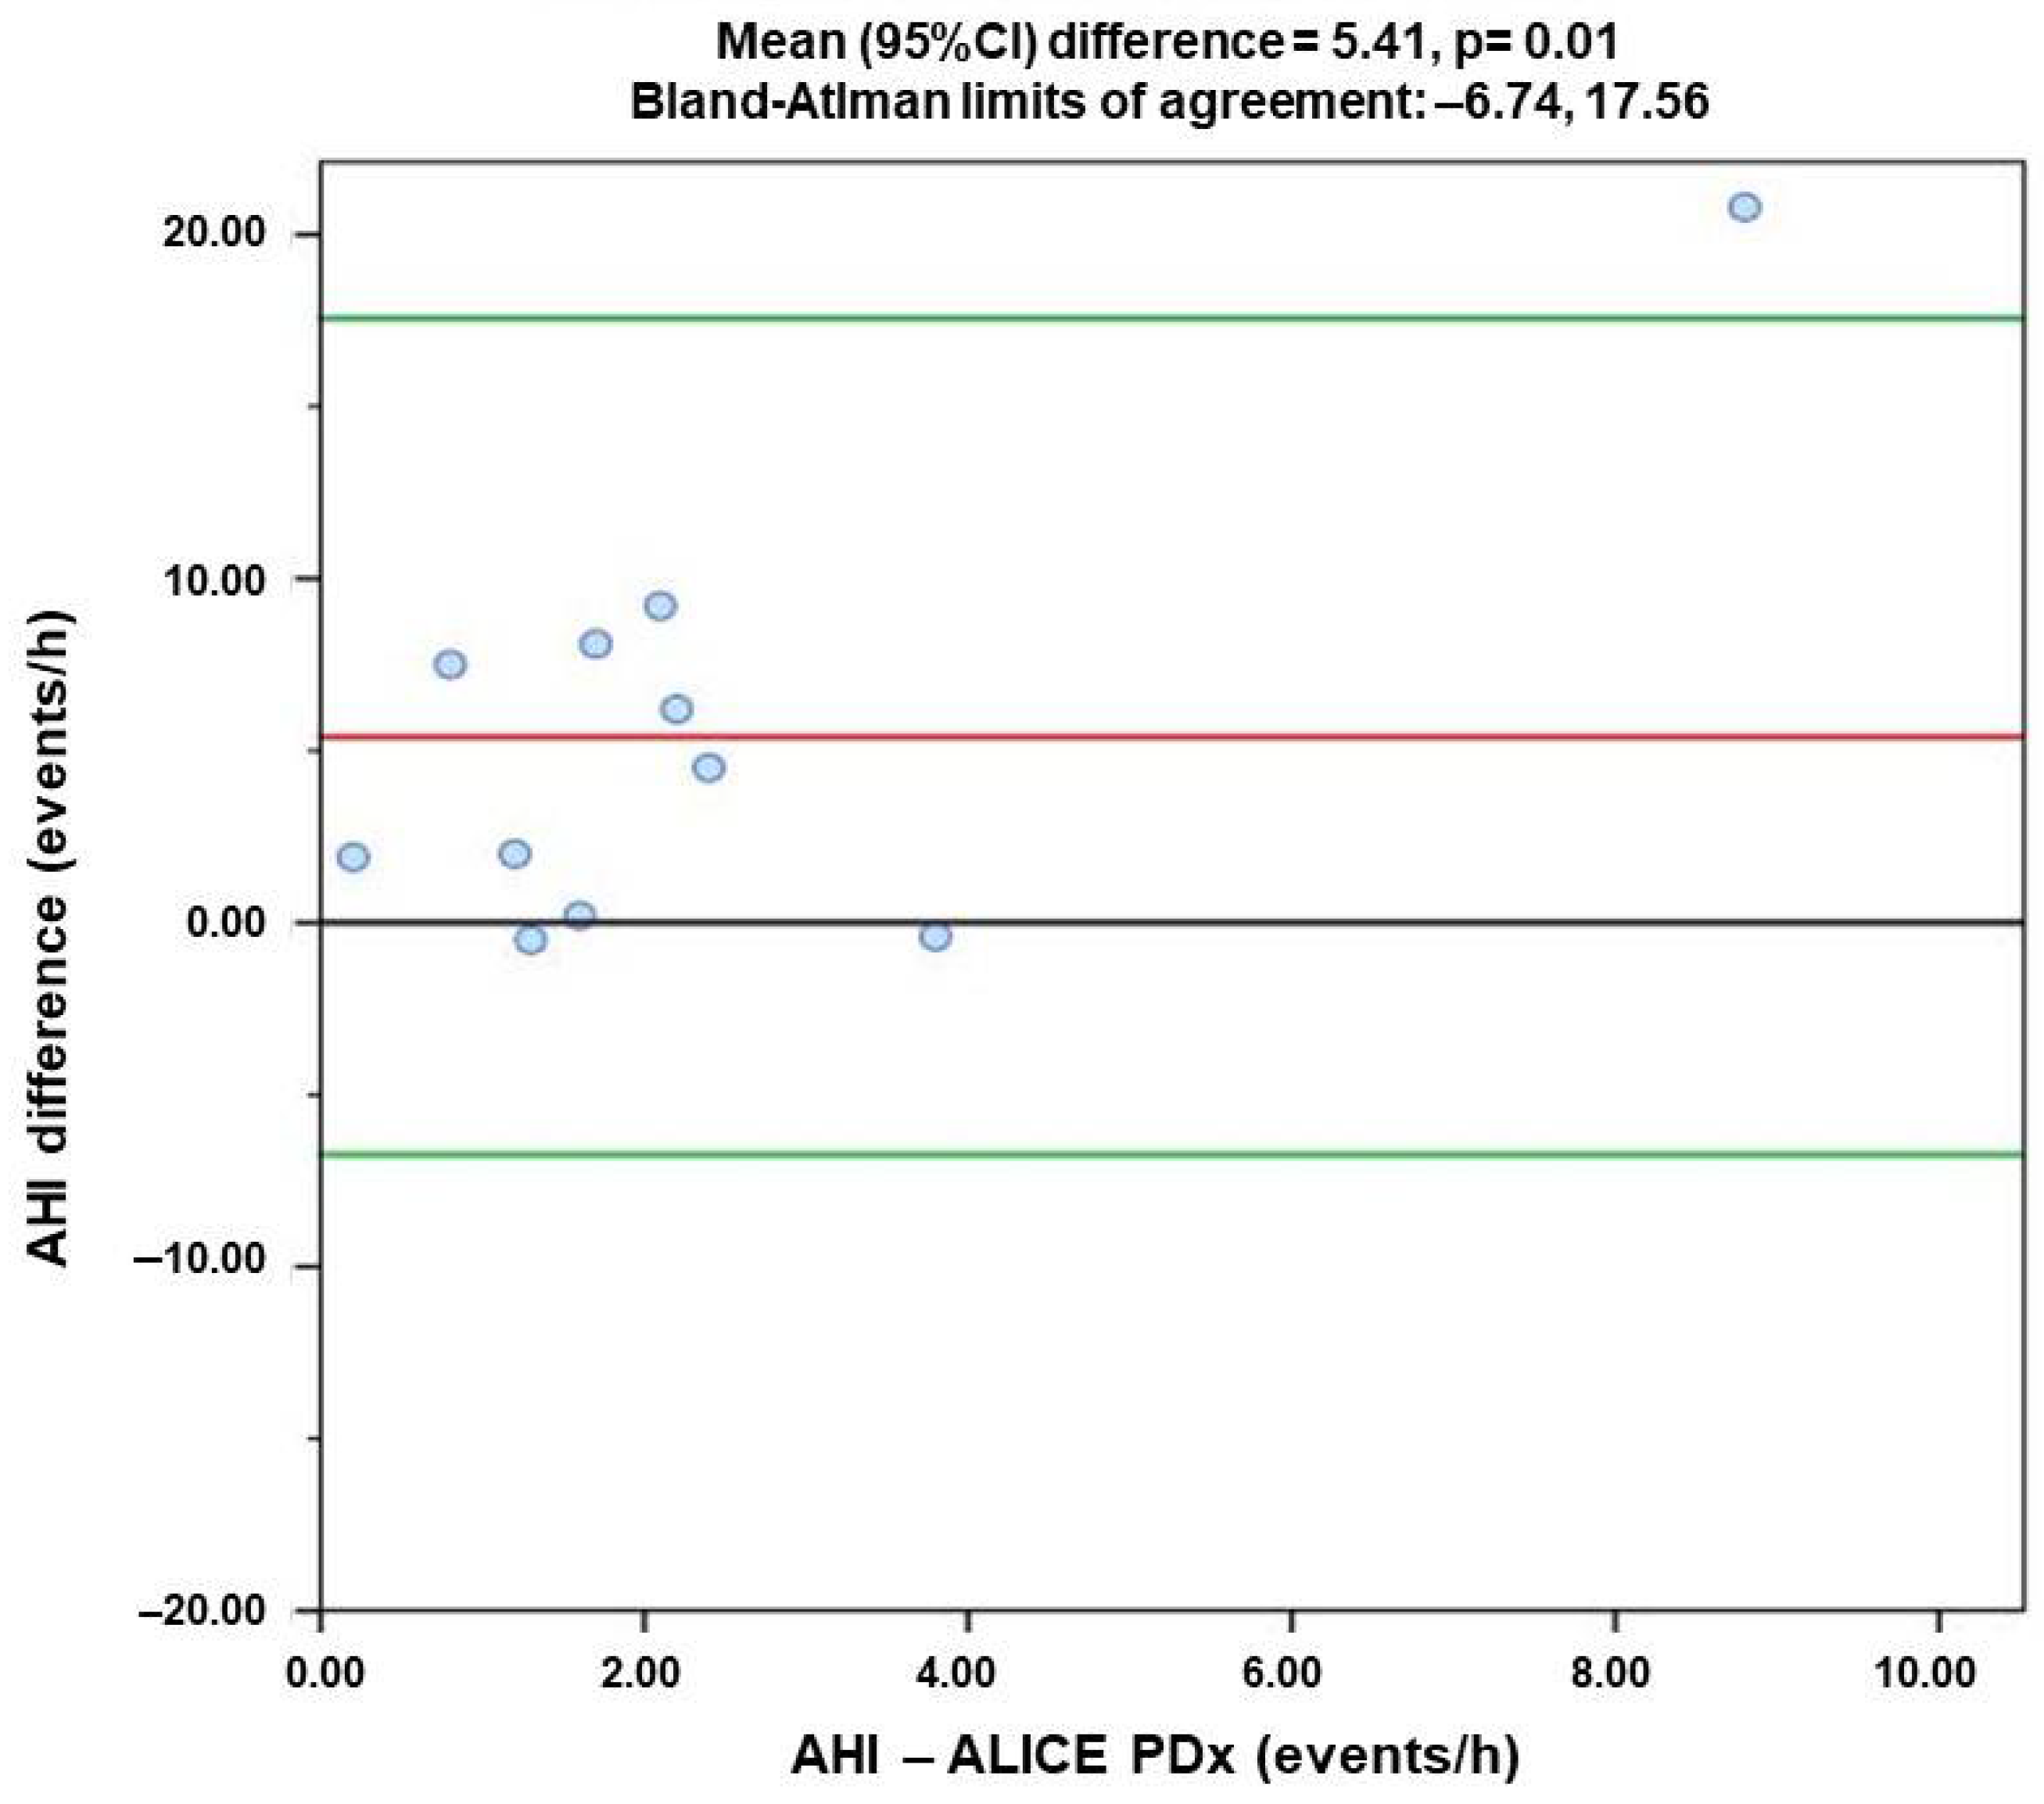
  • Apnea–Hypopnea Index (AHI)
Figure 1 illustrates the Bland–Altman analysis of AHI between the two devices. The horizontal axis represents the AHI collected by PSG via Alice PDx, while the vertical axis shows the subject-specific difference (Figure 1). There are significant differences between the two methods (t-test p = 0.01, CI 95% from 1.05 to 10.15 events/h). Our analysis also suggests a magnitude-dependent bias, with linear regression model p = 0.01. The mean difference is 5.41 events/h, and limits of agreement were from −6.74 to 17.56 (Figure 1), which is considerable and suggest that Alice NightOne may overestimate the AHI and may produce false-positive results of OSA in asymptomatic patients.
b.
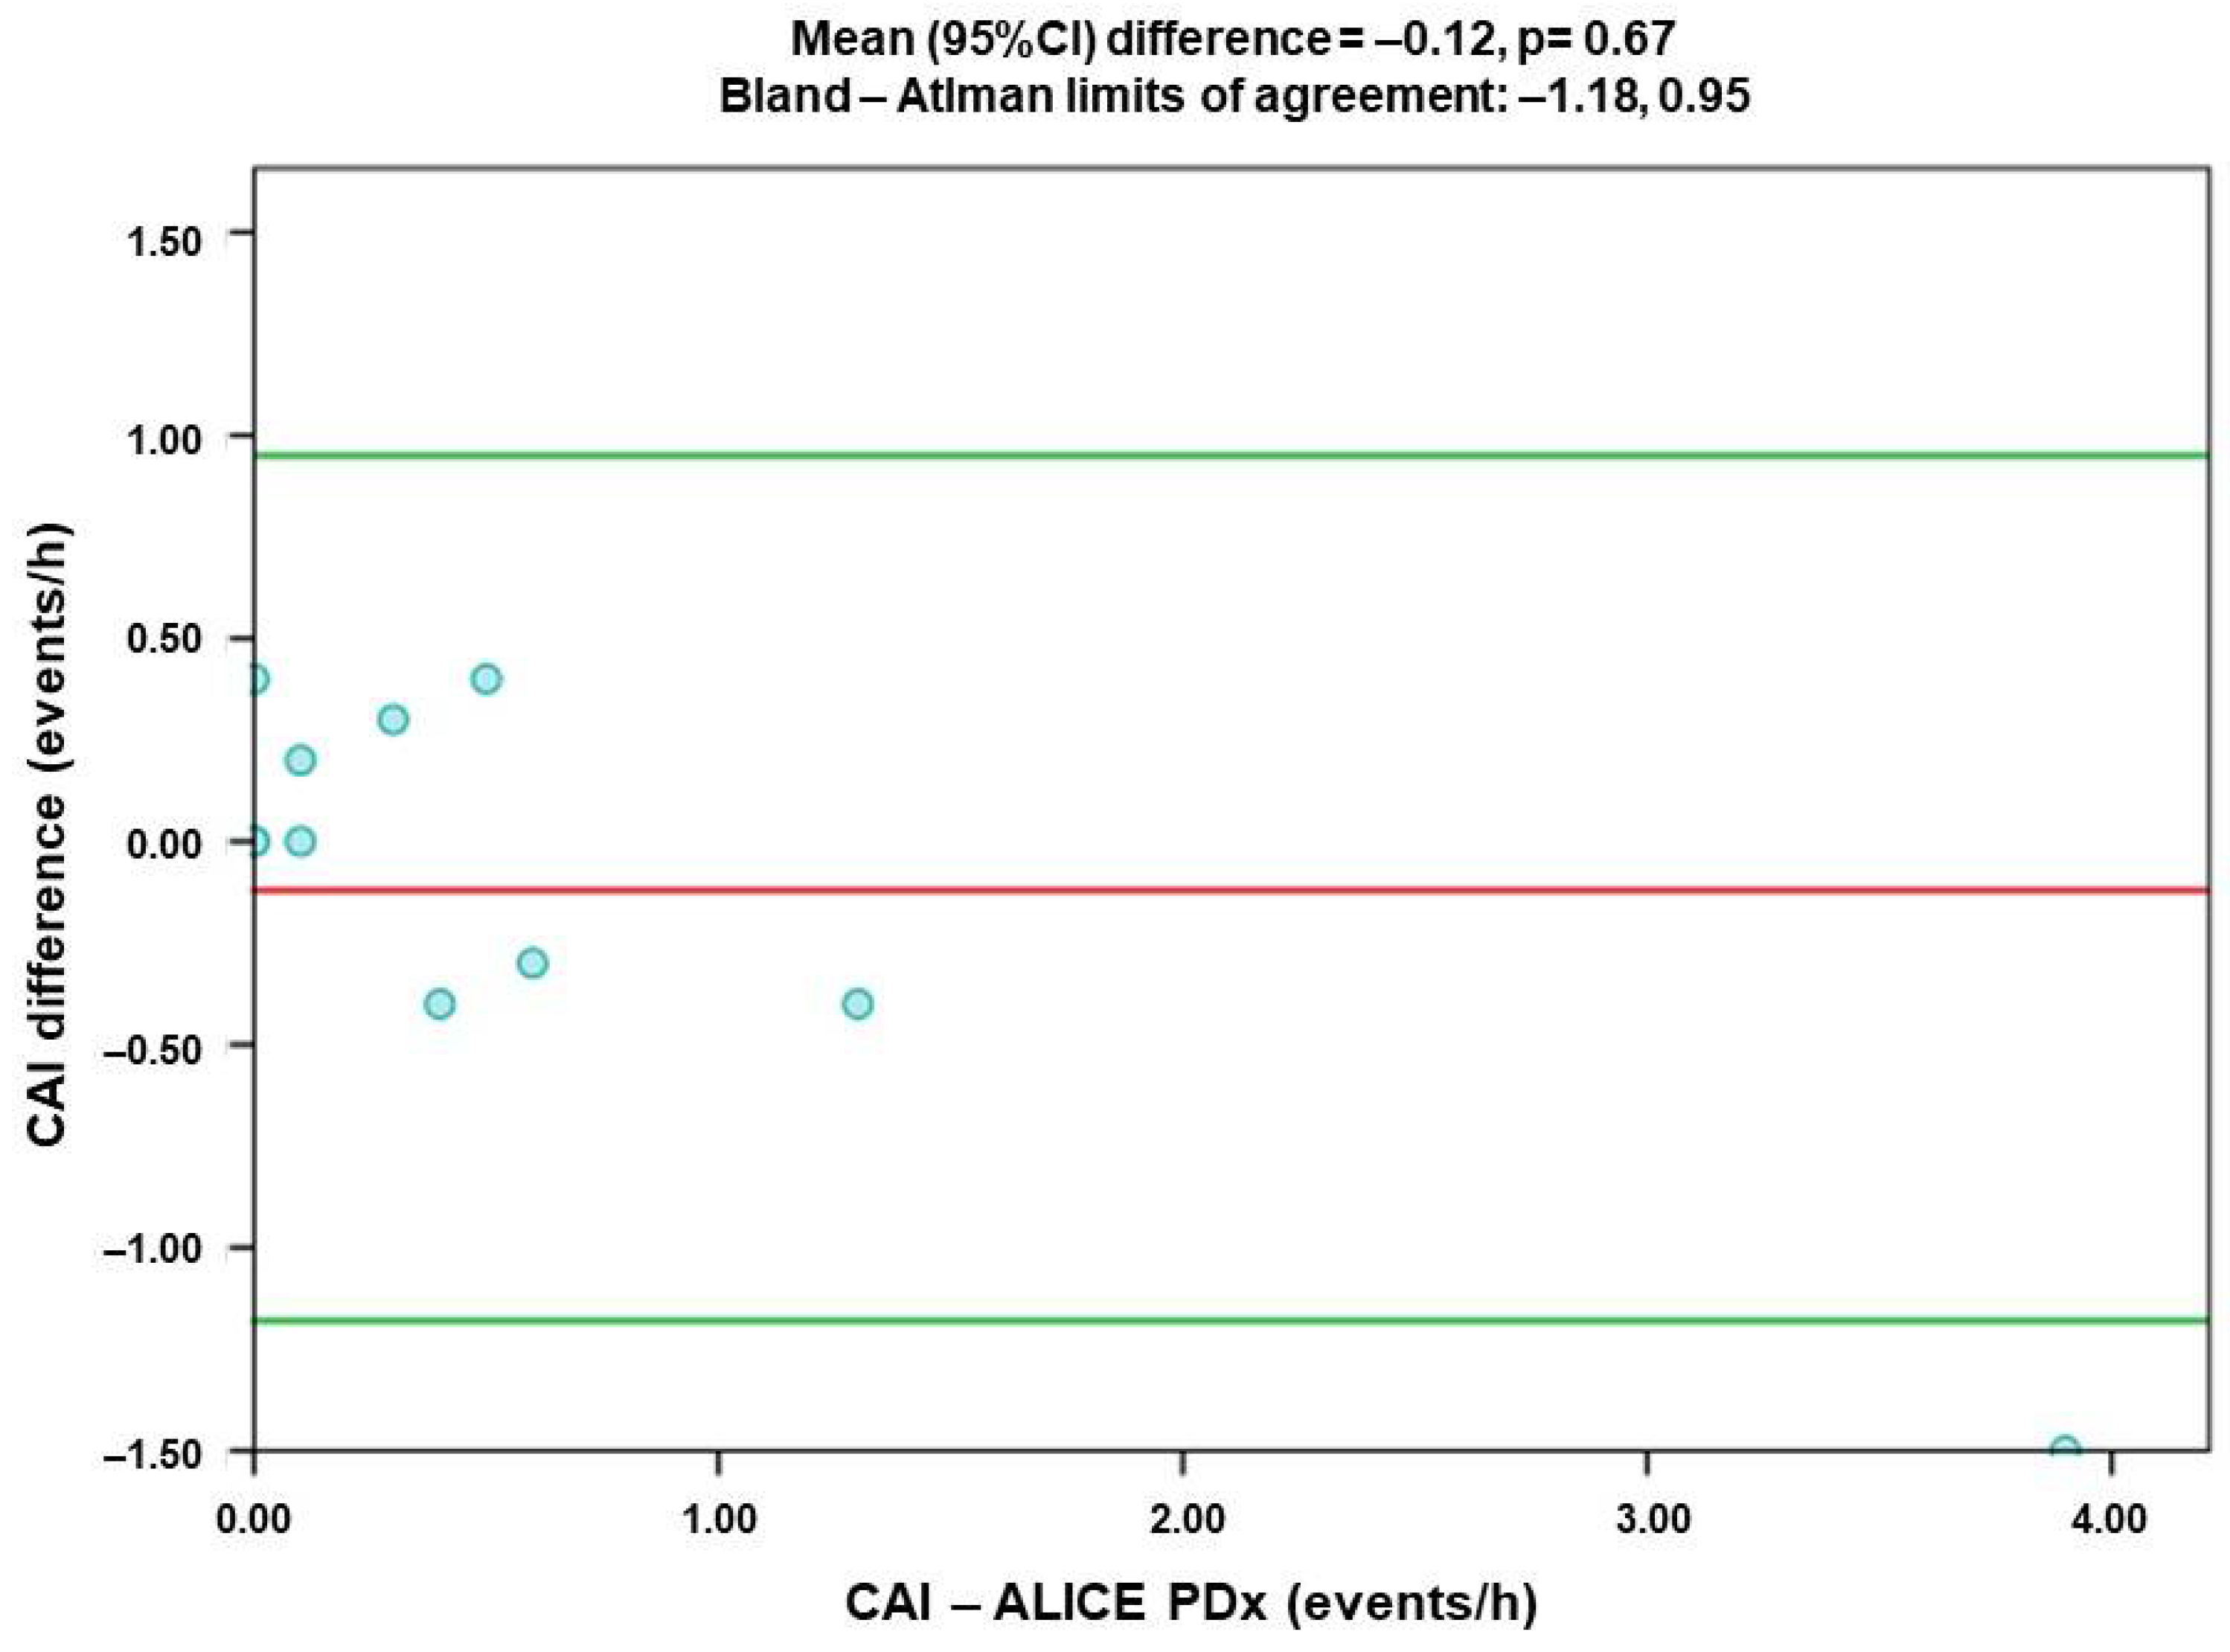
Central Apnea Index (CAI)
There is little agreement in the CAI results (Spearman’s rho = 0.67; and p = 0.02). The difference between the two devices is small (CI 95% from 0.9 to 0.35), and t-test p = 0.67. The Bland–Altman analysis shows little difference between the two methods, with a mean difference of −0.12. The difference is estimated to be magnitude-dependent, with the linear regression model p < 0.01, and the limits of agreement range from −1.18 to 0.95 (Figure 2).
In CAI, the agreement between the two devices could not be confirmed since the sample size is limited, and different ranges of AHI should be examined in order to test the dependence on different CAI results.
c.
Obstructive Apnea Index (OAI)
Two devices show a correlation in the OAI results, with small subject-specific differences. The difference is not statistically significant (t-test p = 0.2). The Bland-Altman analysis shows a bias of 1.35, which is randomly distributed and not magnitude-dependent. The limits of agreement were from −4.76 to 7.64, mostly stemming from outliners (Figure 3).
d.
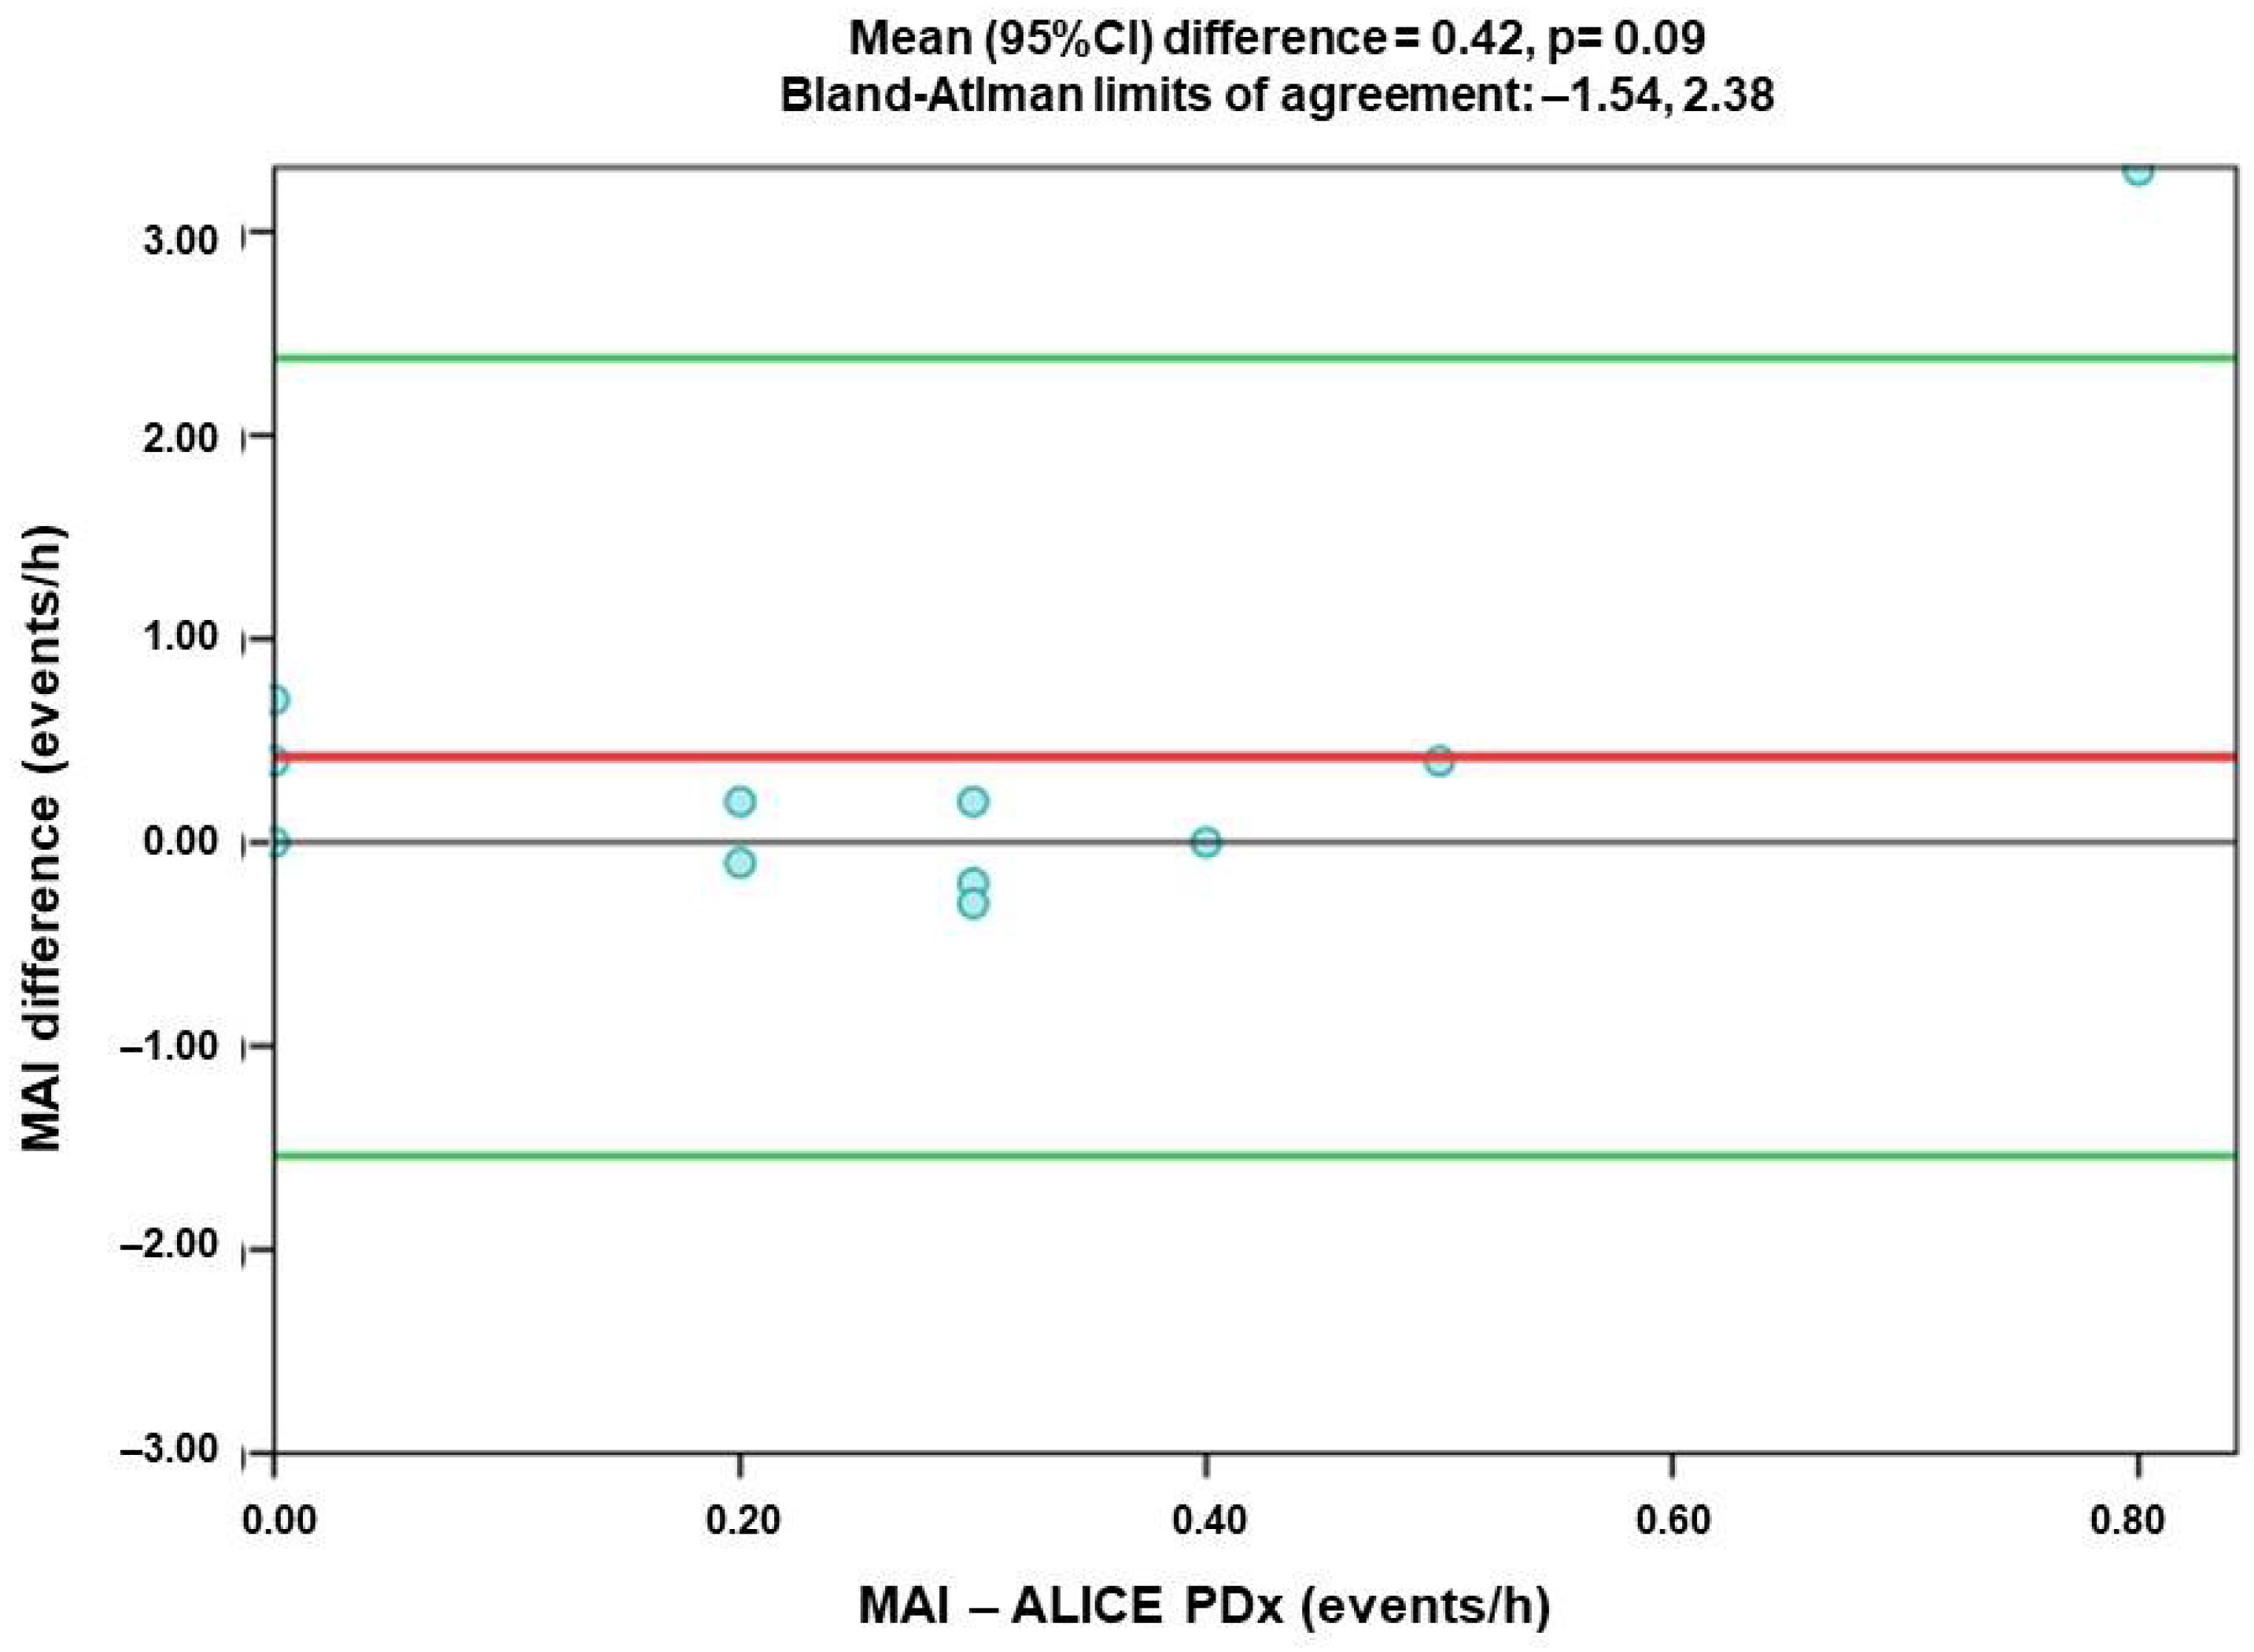
Mixed Apnea Index (MAI)
The subject difference in most cases was less than 0.5 events/h (95% CI from −0.1 to 1.75 events/h), resulting in a mean bias of 0.42 events/h. The limits of agreement were from −1.54 to 2.38 due to outliners in a small sample (Figure 4).
e.
Hypopnea Index (HI)
Similarly, HI results show considerable differences between the two methods. The bias is 0.54 events/h, with huge limits of agreement of −23.22 and 24.29, mostly caused by outlines (Figure 5). More data should be examined on HI with different HI ranges.
f.
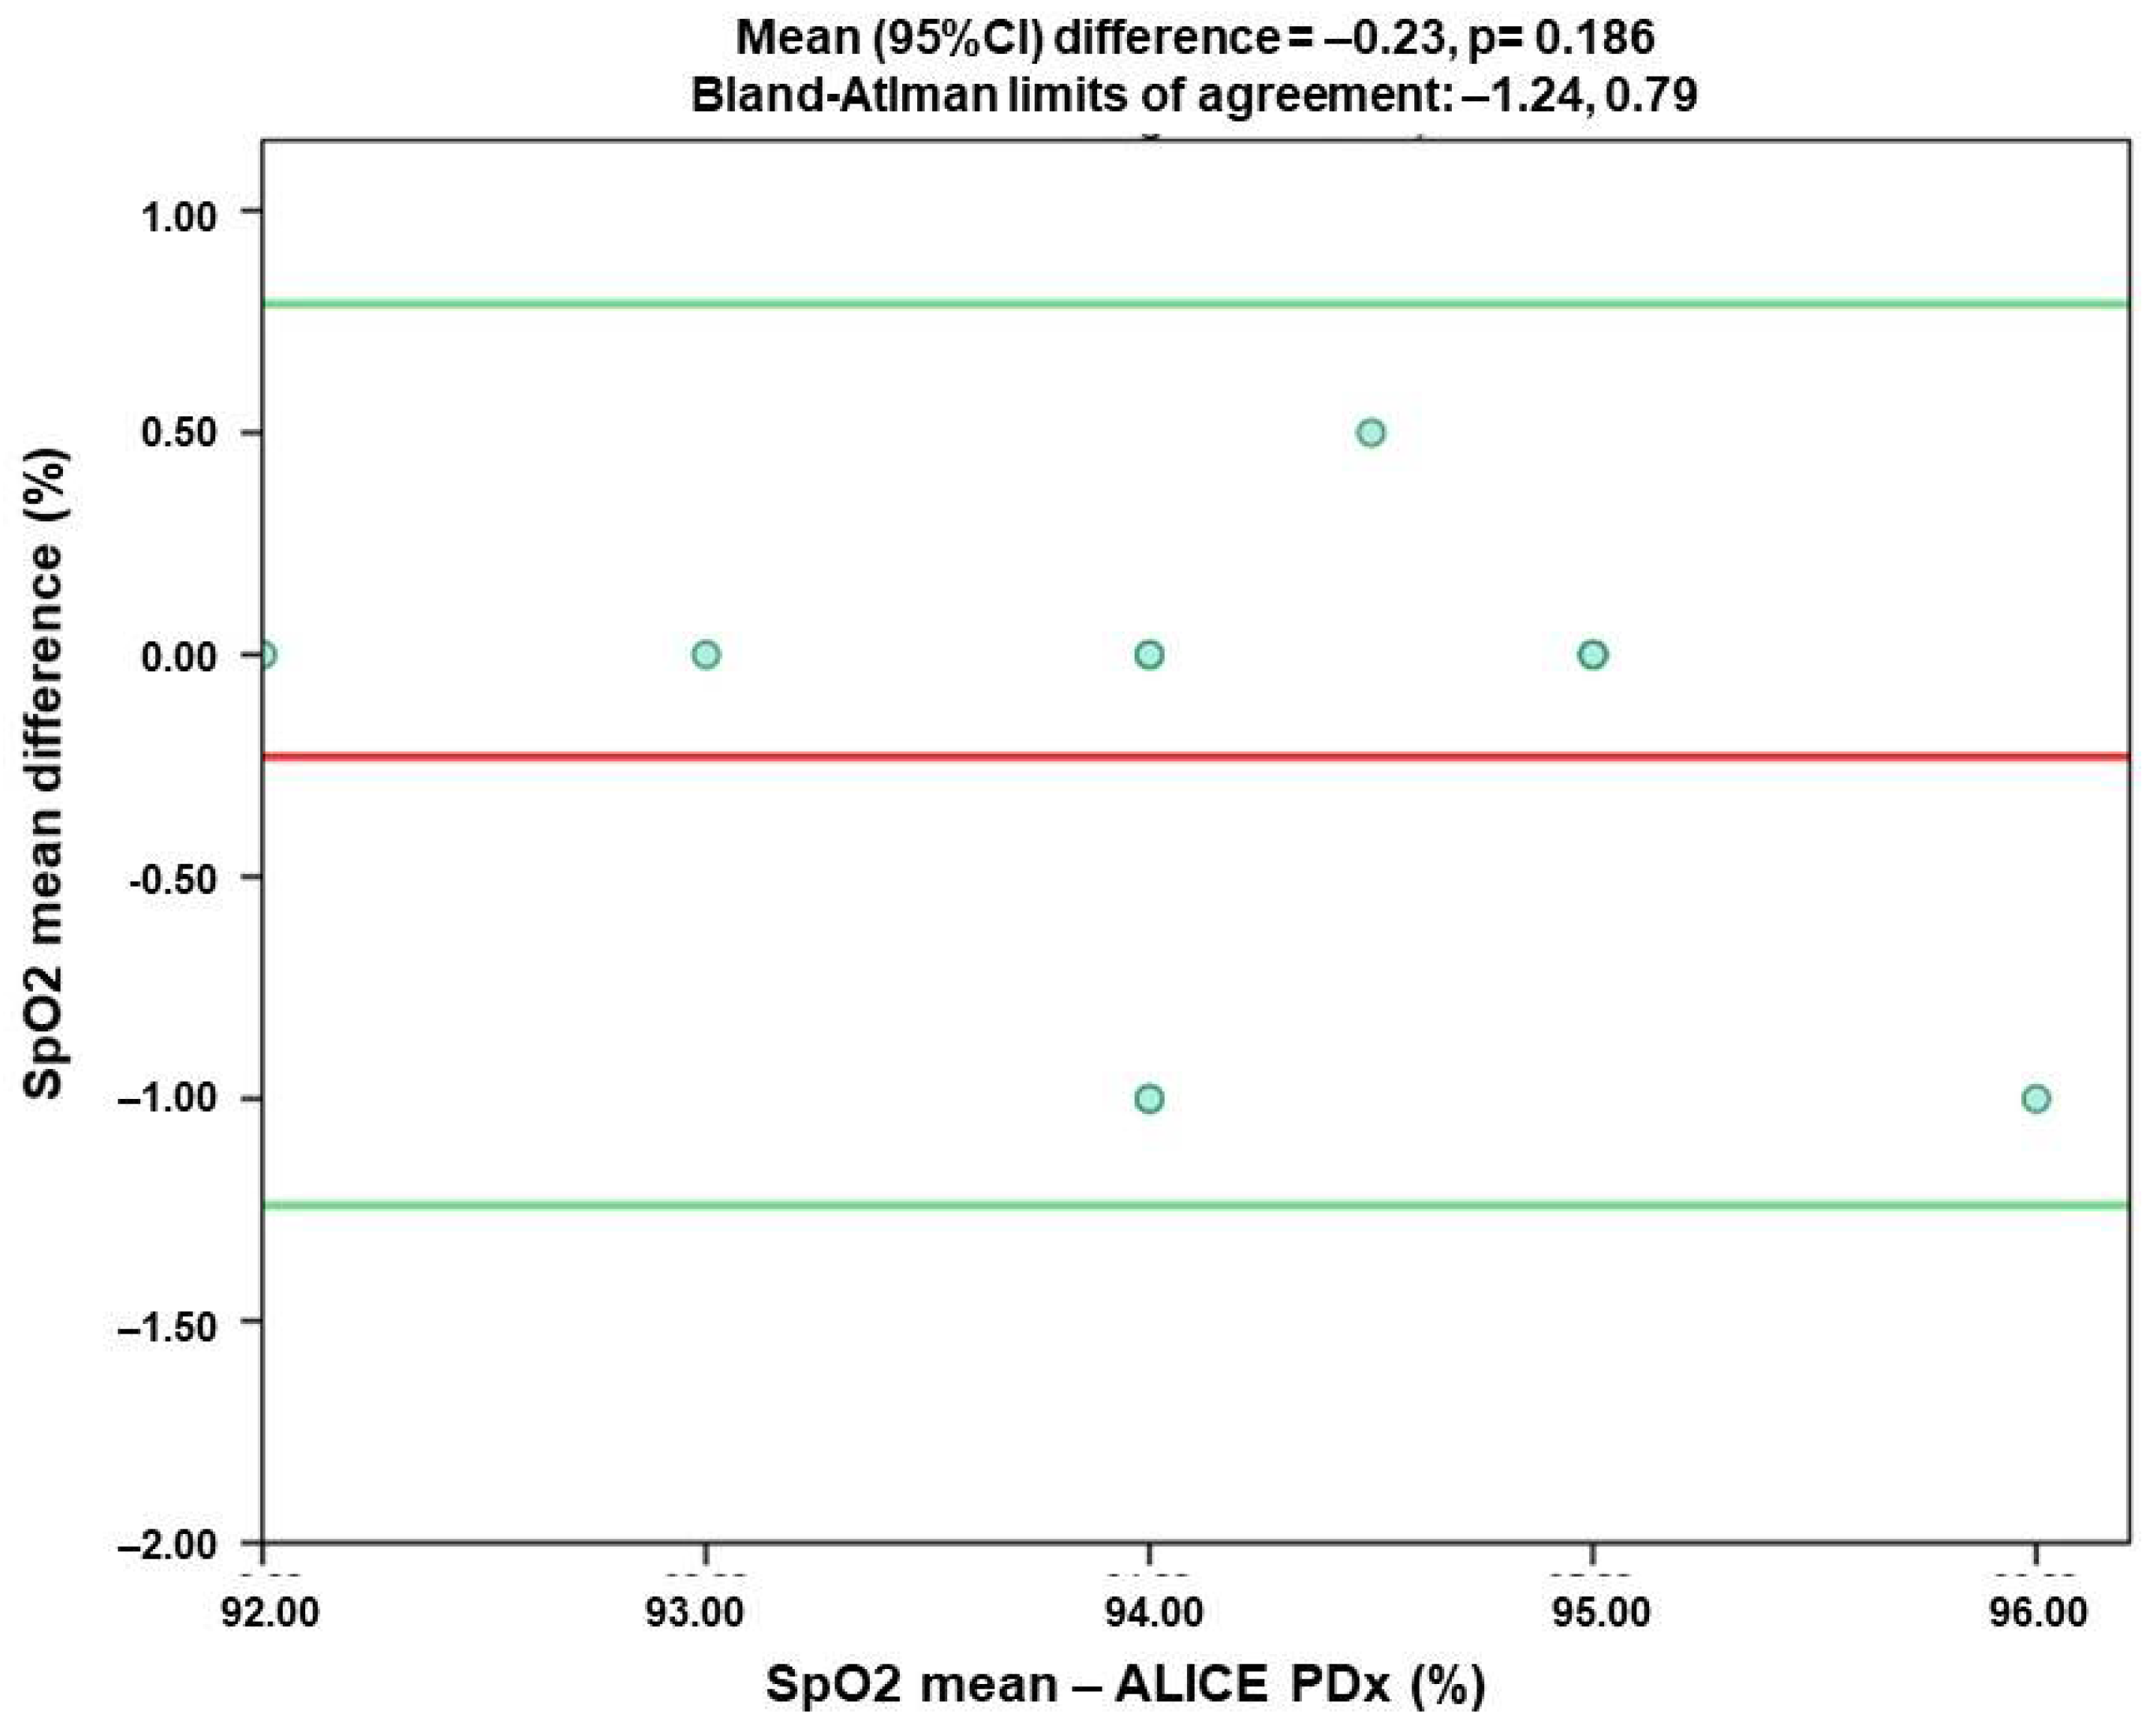
Oxygen Saturation (SpO2)
The agreement in SpO2 measurement is high. Most subjects showed no subject-specific SpO2 difference. The mean difference is −0.23, with limits of agreements being −1.24 and 0.97, which ensure the agreement between the two devices (Figure 6).

3.3. Comparison of Agreement of Respiratory Index Measured by Alice PDX (PSG) and Alice NightOne (PG)

There was a weak agreement between the mean of AHI, MAI, and HI measured by Alice PDx (PSG) and Alice NightOne (PG) (0.545, 0.431, and 0.309, respectively; Table 2). There was a moderate agreement between the mean of CAI measured by PSG (PDx) vs. that by PG (NightOne) (0.674 and p < 0.05; Table 2). The mean of SpO2 measured by PSG was significant and strongly agreed with PG (0.923 and p< 0.05; Table 2).

4. Discussion

In this small, clinic-based sample, the PG showed a low measurement agreement with a simultaneous PSG at the sleep laboratory, where the AHI values were derived. There is a significant difference between the AHI measured by two devices in a population of low suspicion of OSA (approximately AHI < 4 events per hour).
An analogous result can be seen in Lindemann J’s study, which reported that there was not a strong agreement between PG and PSG recording simultaneously, with the rank correlation coefficient being r = 0.574. The PG devices used showed a comparable diagnostic accuracy (r = 0.513–0.657), with a sensitivity of 81.3–96.9% and a specificity of 33.3–50.0%. On average, PG underestimated the AHI by 6.4 (±20.5) events/h. Based on these results, 57% OSAS severity would have been omitted [14].
AHI recording by PG was higher than that of PSG (by a mean of 5.409 events per hour) in this study, and we speculate that this distinction may derive from the difference in flow detection sensitivity between the nasal sensor and the thermistor.
AbdelKebir Sabil et al. reported that nasal pressure detected the largest number of apneas, 23.1% less than with a thermistor. A Pearson correlation was run to determine the relationship between the thermistor and nasal pressure (r = 0.968, n = 35, p < 0.001) [15]. Some obstructive apneas lasted close to the necessary 10 s duration when scored on the nasal pressure, but they were shorter when evaluated with the thermistor. Thus, some borderline apneas were detected using some sensors, but not others, and this may have contributed to the higher number of apneas detected by the NP [15]. This means that if an event could be called an “apnea” in Alice NightOne, this result (≥90% pressure reduction for at least 10 s) is more sensitive than that in Alice PDx (≥90% thermal reduction for at least 10 s).
This pattern was mirrored by CAI, OAI, and MAI when two criteria were mostly different between PSG and PG devices. We suppose that these variances originated from the same principle as AHI. One important finding of this study is that PG and PSG have low agreement on OSA diagnosis; therefore, PG should only be used as a screening method. We recommend that both nasal oxygen cannula and thermal signal should be applied to patients. In order to ensure the convenience of patients by minimizing the occlusion of the nasal passage, we recommend using dual-lumen nasal cannulas, which allow for simultaneous PG and PSG pressure sampling via a y-connector.
The limitations of our study should be mentioned and included: (1) The sample was limited (11 participants), which is not representative of the population. (2) The nasal pressure sensor in Alice PDx was rejected to assure comfort for the participants. Thus, more measurements on the PSG to compensate for the removal of the main sensor from the set-up should be performed. Further studies with sufficient sensors in the expanded populations of OSA are needed.

5. Conclusions

In the population with a low suspicion of OSA, the PG showed a low agreement with a simultaneous PSG in the sleep laboratory. However, PG with a nasal pressure sensor might be more accurate than the thermal nasal sensor used in PSG. Therefore, PG should only be used as a screening method. Further studies with sufficient sensors in the expanded populations of OSA are needed.

Author Contributions

Conceptualization, B.-T.T.-T., M.Q.-T., T.T.-T.-T., T.N.-V. and S.D.-Q.; Methodology, B.-T.T.-T., M.Q.-T., T.T.-T.-T., T.N.-V. and S.D.-Q.; software, B.-N.L.-T., D.N.-D., N.T.-H., T.N.-T., Y.-L.N.-N. and A.N.-T.; Validation, T.T.-T.-T., T.N.-V. and S.D.-Q.; Formal analysis, B.-N.L.-T., D.N.-D., N.T.-H., T.N.-T., Y.-L.N.-N. and A.N.-T.; Investigation, B.-T.T.-T., M.Q.-T., T.T.-T.-T., T.N.-V. and S.D.-Q.; Resources, B.-N.L.-T., D.N.-D., N.T.-H., T.N.-T., Y.-L.N.-N. and A.N.-T.; Data curation, B.-N.L.-T., D.N.-D., N.T.-H., T.N.-T., Y.-L.N.-N. and A.N.-T.; Writing—original draft preparation, B.-T.T.-T., M.Q.-T., T.T.-T.-T., T.N.-V. and S.D.-Q.; Writing—review and editing, B.-T.T.-T., M.Q.-T., T.T.-T.-T., T.N.-V. and S.D.-Q.; Visualization, B.-N.L.-T., D.N.-D., N.T.-H., T.N.-T., Y.-L.N.-N. and A.N.-T.; Supervision, B.-N.L.-T., D.N.-D., N.T.-H., T.N.-T., Y.-L.N.-N. and A.N.-T.; Project administration, T.T.-T.-T., T.N.-V. and S.D.-Q. All authors have read and agreed to the published version of the manuscript.

Funding

This research received no external funding.

Institutional Review Board Statement

The study was conducted according to the guidelines of the Declaration of Helsinki, and approved in 14 April 2021 by the Institutional Review Board of Lam Dong Medical College (NCKH2021_TTYS_02.21).

Informed Consent Statement

Informed consent was obtained from all subjects involved in the study. Written informed consent has been obtained from the subject(s) to publish this paper.

Data Availability Statement

The data presented in this study are available on request from the corresponding author.

Conflicts of Interest

The authors declare no conflict of interest.

References

  1. Spicuzza, L.; Caruso, D.; Di Maria, G. Obstructive sleep apnoea syndrome and its management. Ther. Adv. Chronic. Dis. 2015, 6, 273–285. [Google Scholar] [CrossRef] [PubMed] [Green Version]
  2. Lyons, M.M.; Bhatt, N.Y.; Pack, A.I.; Magalang, U.J. Global burden of sleep-disordered breathing and its implications. Respirology 2020, 25, 690–702. [Google Scholar] [CrossRef] [PubMed]
  3. Duong-Quy, S.; Van N, T.; Hua-Huy, T.; Chalumeau, F.; Dinh-Xuan, A.T.; Soyez, F.; Martin, F. Study about the prevalence of the obstructive sleep apnoea syndrome in Vietnam. Rev. Mal. Respir. 2018, 35, 14–24. (In French) [Google Scholar] [CrossRef] [PubMed]
  4. Bharadwaj, N.; Edara, P.; Sun, C. Sleep disorders and risk of traffic crashes: A naturalistic driving study analysis. Saf. Sci. 2021, 140, 105295. [Google Scholar] [CrossRef]
  5. Farajzadeh, M.; Hosseini, M.; Mohtashami, J.; Chaibakhsh, S.; Tafreshi, M.Z.; Gheshlagh, R.G. The Association Between Obstructive Sleep Apnea and Depression in Older Adults. Nurs. Midwifery Stud. 2016, 5, e32585. [Google Scholar] [CrossRef] [PubMed] [Green Version]
  6. Sorajja, D. Independent Association between Obstructive Sleep Apnea and Subclinical Coronary Artery Disease. Available online: https://www.sciencedirect.com/science/article/abs/pii/S0012369215496813 (accessed on 23 September 2021).
  7. Reutrakul, S.; Mokhlesi, B. Obstructive Sleep Apnea and Diabetes. Chest 2017, 152, 1070–1086. [Google Scholar] [CrossRef] [PubMed]
  8. Darien, I.L. Economic Burden of Undiagnosed Sleep Apnea in the U.S. is nearly $150B per Year, American Academy of Sleep Medicine. Available online: https://aasm.org/economic-burden-of-undiagnosed-sleep-apnea-in-u-s-is-nearly-150b-per-year/ (accessed on 24 September 2021).
  9. Tan, H.L.; Gozal, D.; Ramirez, H.M.; Bandla, H.P.; Kheirandish-Gozal, L. Overnight polysomnography versus respiratory polygraphy in the diagnosis of pediatric obstructive sleep apnea. Sleep 2014, 37, 255–260. [Google Scholar] [CrossRef] [PubMed] [Green Version]
  10. Berry, R.B.; Budhiraja, R.; Gottlieb, D.J. Rules for scoring respiratory events in sleep: Update of the 2007 AASM Manual for the Scoring of Sleep and Associated Events: Deliberations of the Sleep Apnea Definitions Task Force of the American Academy of Sleep Medicine. J. Clin. Sleep Med. 2012, 8, 597–619. [Google Scholar] [CrossRef] [PubMed] [Green Version]
  11. Eckert, D.J.; Jordan, A.S.; Merchia, P.; Malhotra, A. Central sleep apnea: Pathophysiology and treatment. Chest 2007, 131, 595–607. [Google Scholar] [CrossRef] [PubMed]
  12. Epstein, L.J.; Kristo, D.; Strollo, P.J., Jr.; Friedman, N.; Malhotra, A.; Patil, S.P.; Ramar, K.; Rogers, R.; Schwab, R.J.; Weaver, E.M.; et al. Clinical guideline for the evaluation, management and long-term care of obstructive sleep apnea in adults. J. Clin. Sleep Med. 2009, 5, 263–276. [Google Scholar] [PubMed]
  13. Jeon, H.; Sohn, M.K.; Jeon, M.; Jee, S. Clinical Characteristics of Sleep-Disordered Breathing in Subacute Phase of Stroke. Ann. Rehabil. Med. 2017, 41, 556–563. [Google Scholar] [CrossRef] [PubMed] [Green Version]
  14. Lindemann, J.; Augenstein, B. Diagnostic accuracy of outpatient polygraphy devices: A comparison with inpatient polysomnography in clinical routine. HNO 2017, 65, 134–140. (In German) [Google Scholar] [CrossRef] [PubMed]
  15. Sabil, A.; Glos, M.; Günther, A.; Schöbel, C.; Veauthier, C.; Fietze, I.; Penzel, T. Comparison of Apnea Detection Using Oronasal Thermal Airflow Sensor, Nasal Pressure Transducer, Respiratory Inductance Plethysmography, and Tracheal Sound Sensor. J. Clin. Sleep Med. 2019, 15, 285–292. [Google Scholar] [CrossRef] [PubMed] [Green Version]
Figure 1. Bland-Altman plots. Distinction between the AHI-Alice PDx plotted against the two devices’ AHI difference (n = 11). The red line presents the mean difference, while the green ones reveal the limits of agreement. AHI: apnea-hypopnea index.
Ohbm 03 00004 g001
Figure 2. Bland-Altman plots. Distinction between the CAI-Alice PDx plotted against the two devices’ CAI difference (n = 11). The red line presents the mean difference, while the green ones reveal the limits of agreement. CAI: central apnea index.
Ohbm 03 00004 g002
Figure 3. Bland-Altman plots. Distinction between the OAI-Alice PDx plotted against the two devices’ OAI difference (n = 11). The red line presents the mean difference, while the green ones present the limits of agreement. OAI: obstructive apnea index.
Ohbm 03 00004 g003
Figure 4. Bland-Altman plots. Distinction between the MAI-Alice PDx plotted against the two devices’ MAI difference (n = 11). The red line presents the mean difference, while the green ones reveal the limits of agreement. MAI: mixed apnea index.
Ohbm 03 00004 g004
Figure 5. Bland-Altman plots. Distinction between the HI-Alice PDx plotted against the two devices’ HI difference (n = 11). The red line presents the mean difference, while the green ones present the limits of agreement. HI: hypopnea index.
Ohbm 03 00004 g005
Figure 6. Bland-Altman plots. Distinction between the SpO2 mean-Alice PDx plotted against the two devices’ mean SpO2 difference (n = 11). The red line presents the mean difference, while the green ones reveal the limits of agreement.
Ohbm 03 00004 g006
Table 1. Demographic characteristics of study subjects and their AHI measured by PSG.
ParametersN%MeanSDMin–Max
 Age (years)1110022.70.622–24
 Sex
      Male763.6---
      Female436.4---
 Height (cm)11100164.77.1154–174
 Weight (kg)1110059.58.945–74
 BMI (kg/m2)1110021.82.217.4–24.4
 Sleep disorders
      Snoring at night00---
      Insomnia00---
 AHI (apnea–hypopnea index)
      PDx111002.42.20.2–8.8
      NightOne111007.87.70.8–29.6
 CAI (central apnea index)
      PDx111000.71.10.0–3.9
      NightOne111000.60.70.0–2.4
 OAI (obstructive apnea index)
      PDx111000.50.40.0–1.6
      NightOne111001.92.90.0–10.3
 MAI (mixed apnea index)
      PDx111000.30.20.0–0.8
      NightOne111000.71.10.0–4.1
 HI (hypopnea index)
      PDx111004.910.40.0–37.0
      NightOne111004.73.70.8–12.9
 SpO2
      PDx1110094.21.092–96
      NightOne1110094.01.092–95
Table 2. Comparison of Respiratory Index between Alice PDX (PSG) and Alice NightOne (PG).
ParametersSpearman’s RhoMean DifferenceLower LOAUpper LOA
AHI0.5455.41 *−6.7417.56
CAI0.674 *−0.12−1.180.95
OAI0.061.35−4.767.46
MAI0.4310.42−1.542.38
HI0.3090.54−23.2224.29
SpO20.923 *−0.23−1.240.79
AHI: apnea–hypopnea index; CAI: central apnea index; OAI: obstructive apnea index; MAI: mixed apnea index; HI: hypopnea index; LOA: limit of agreement. * p < 0.05.
Publisher’s Note: MDPI stays neutral with regard to jurisdictional claims in published maps and institutional affiliations.

