
Thin-Walled Part Properties in Powder Bed Fusion of Polymers—A Comparative Study on Temperature Development and Part Performance Depending on Part Thickness and Orientation
Abstract
:1. Introduction
2. Materials and Methods
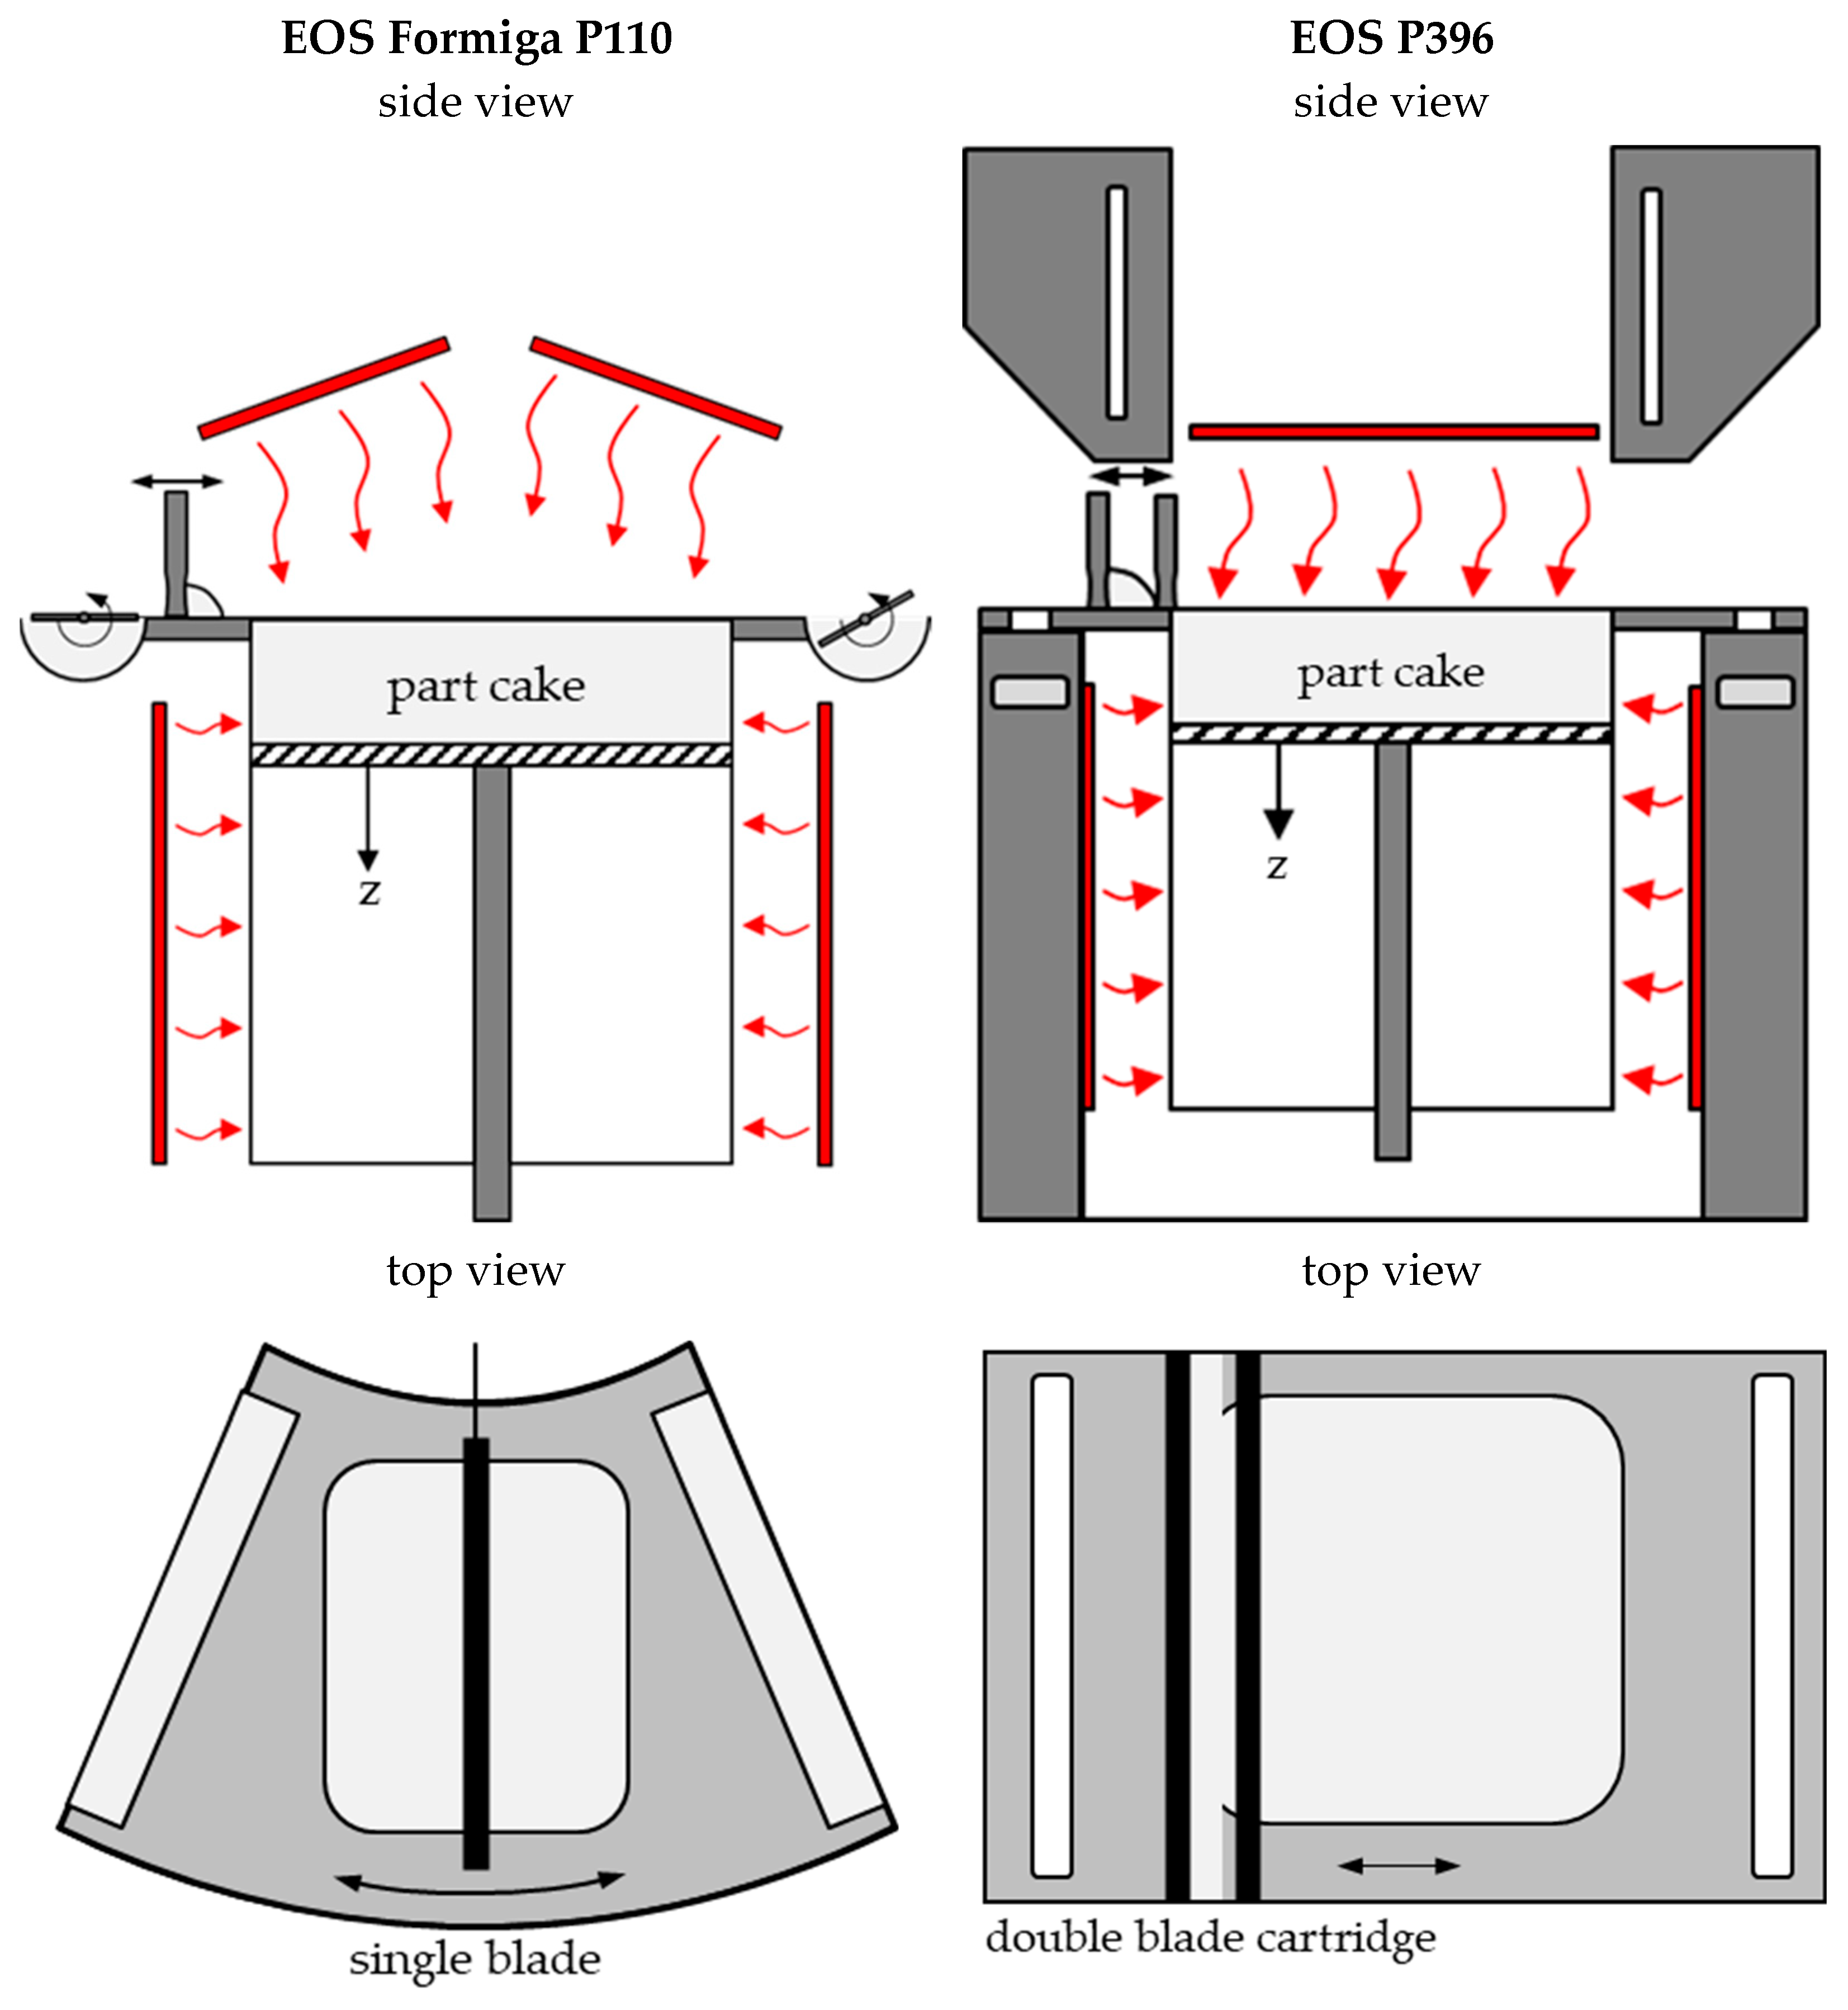
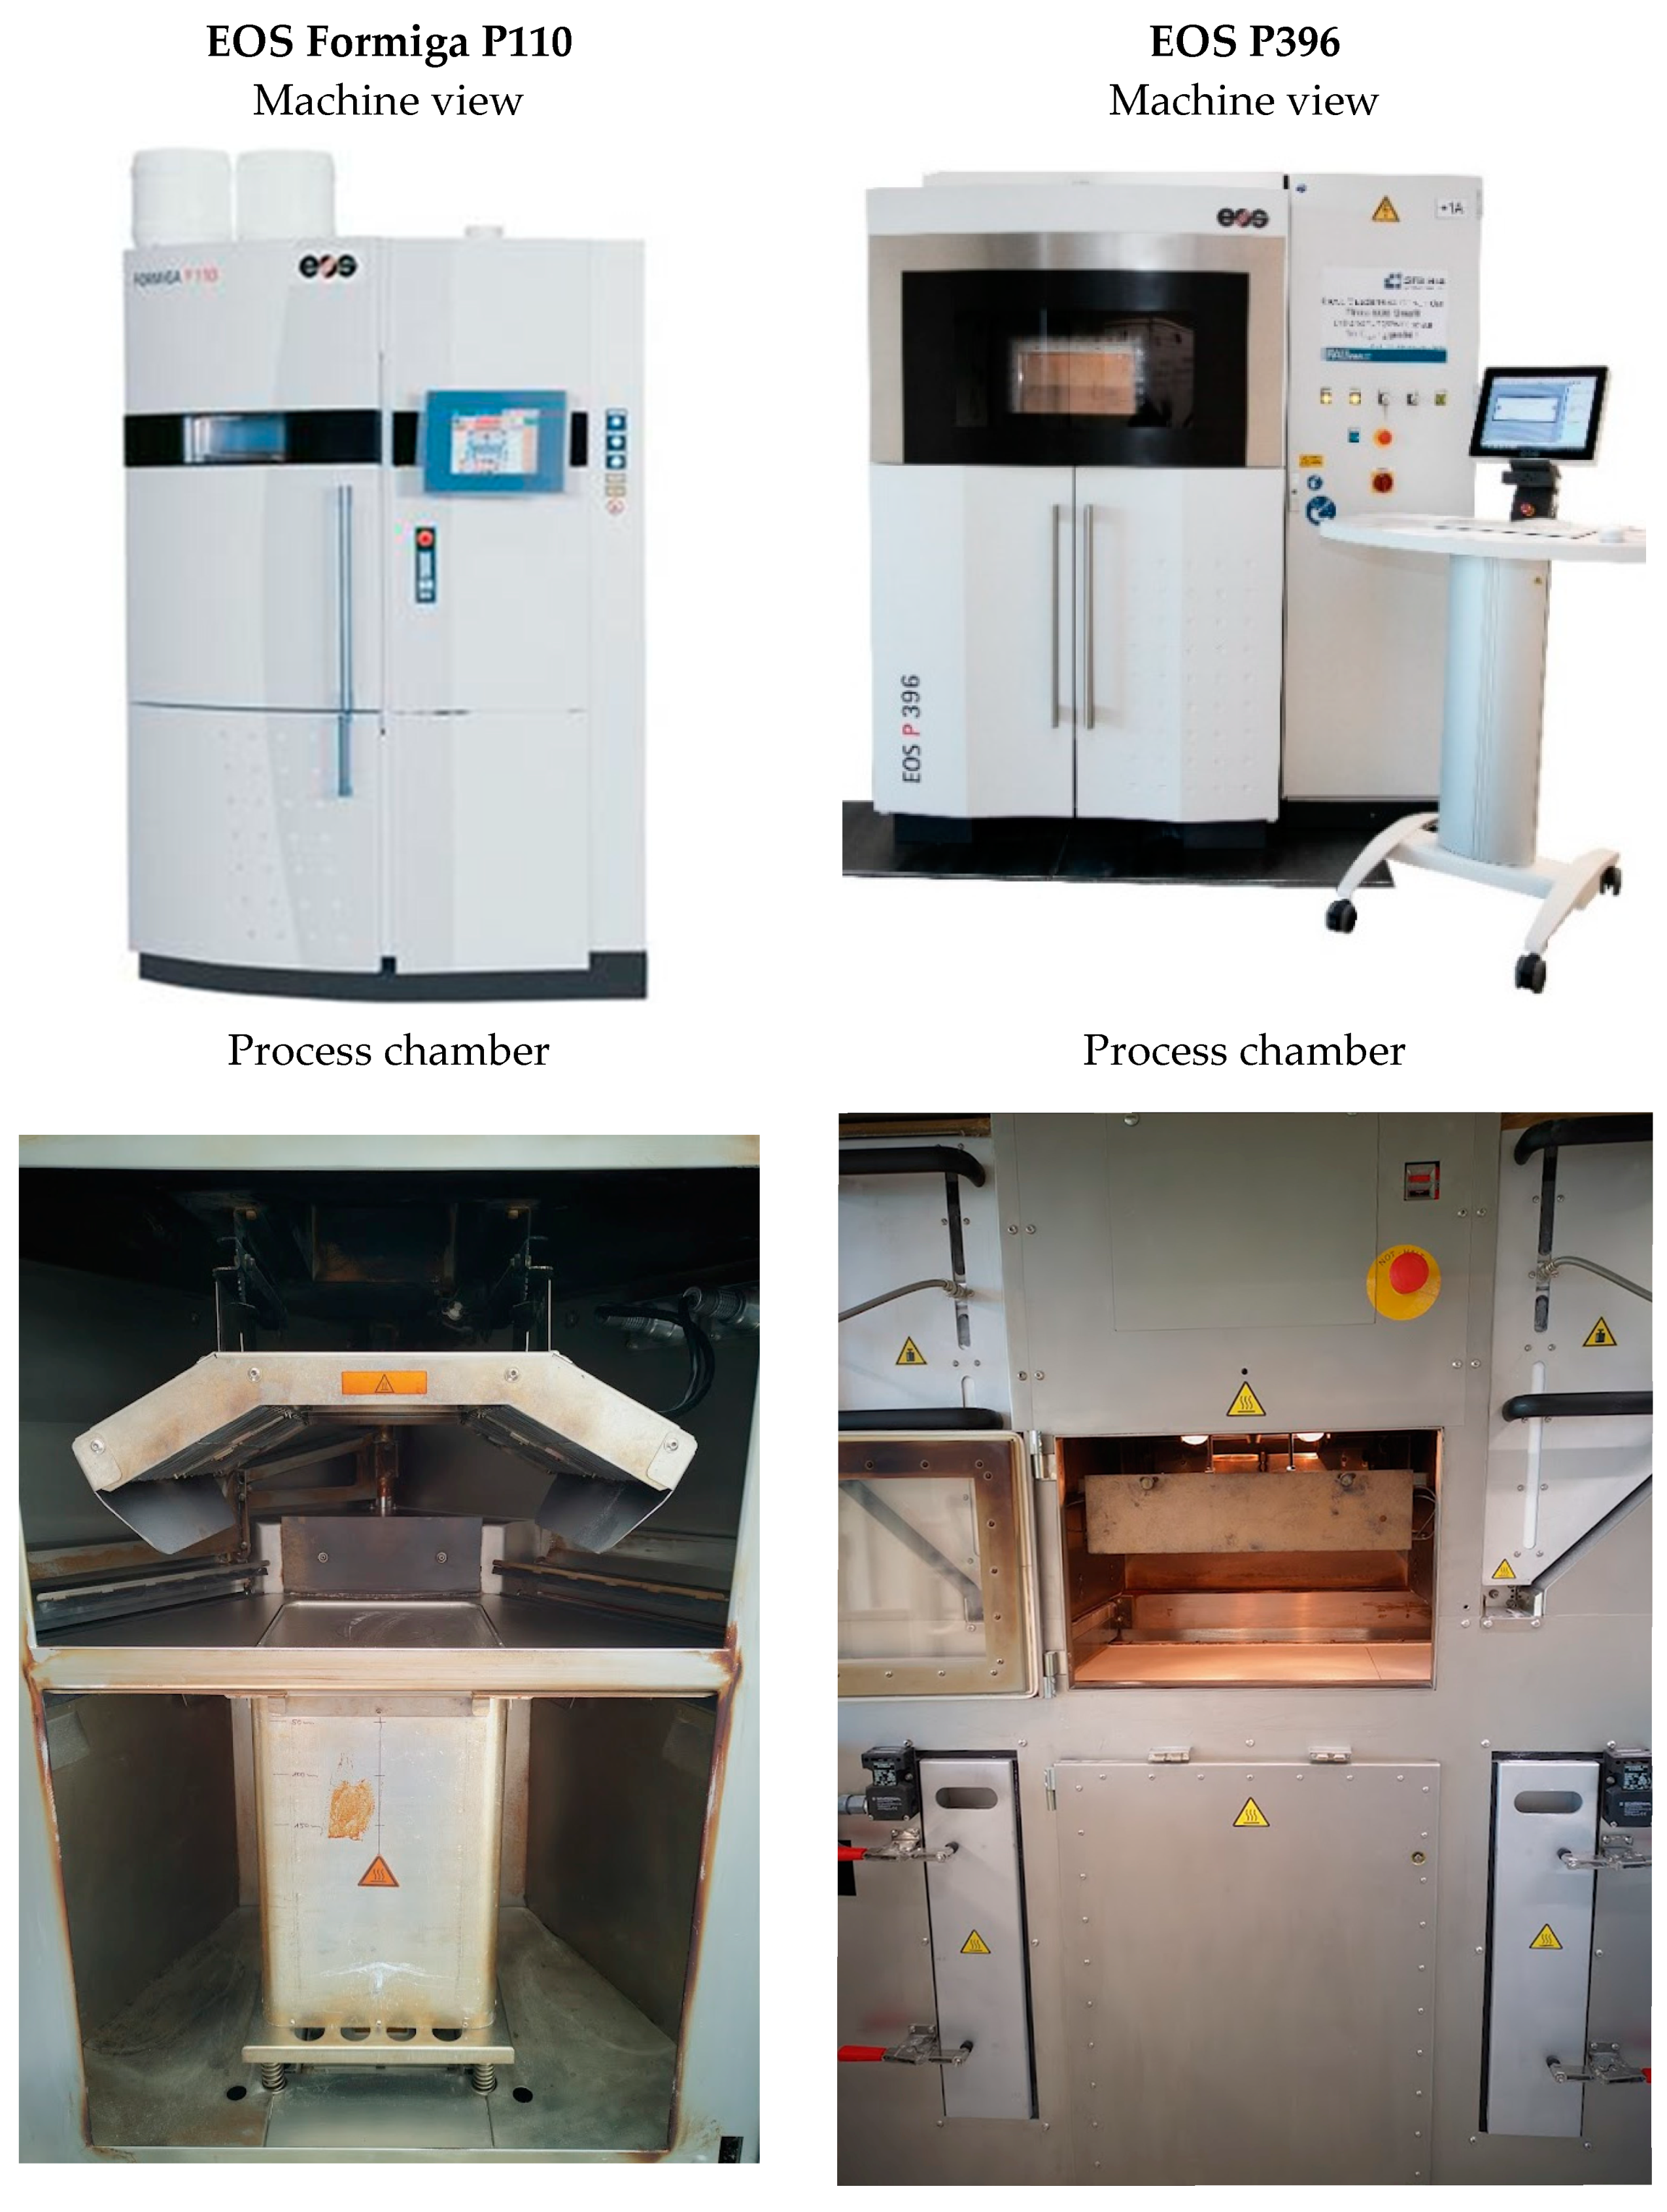
2.1. Machines
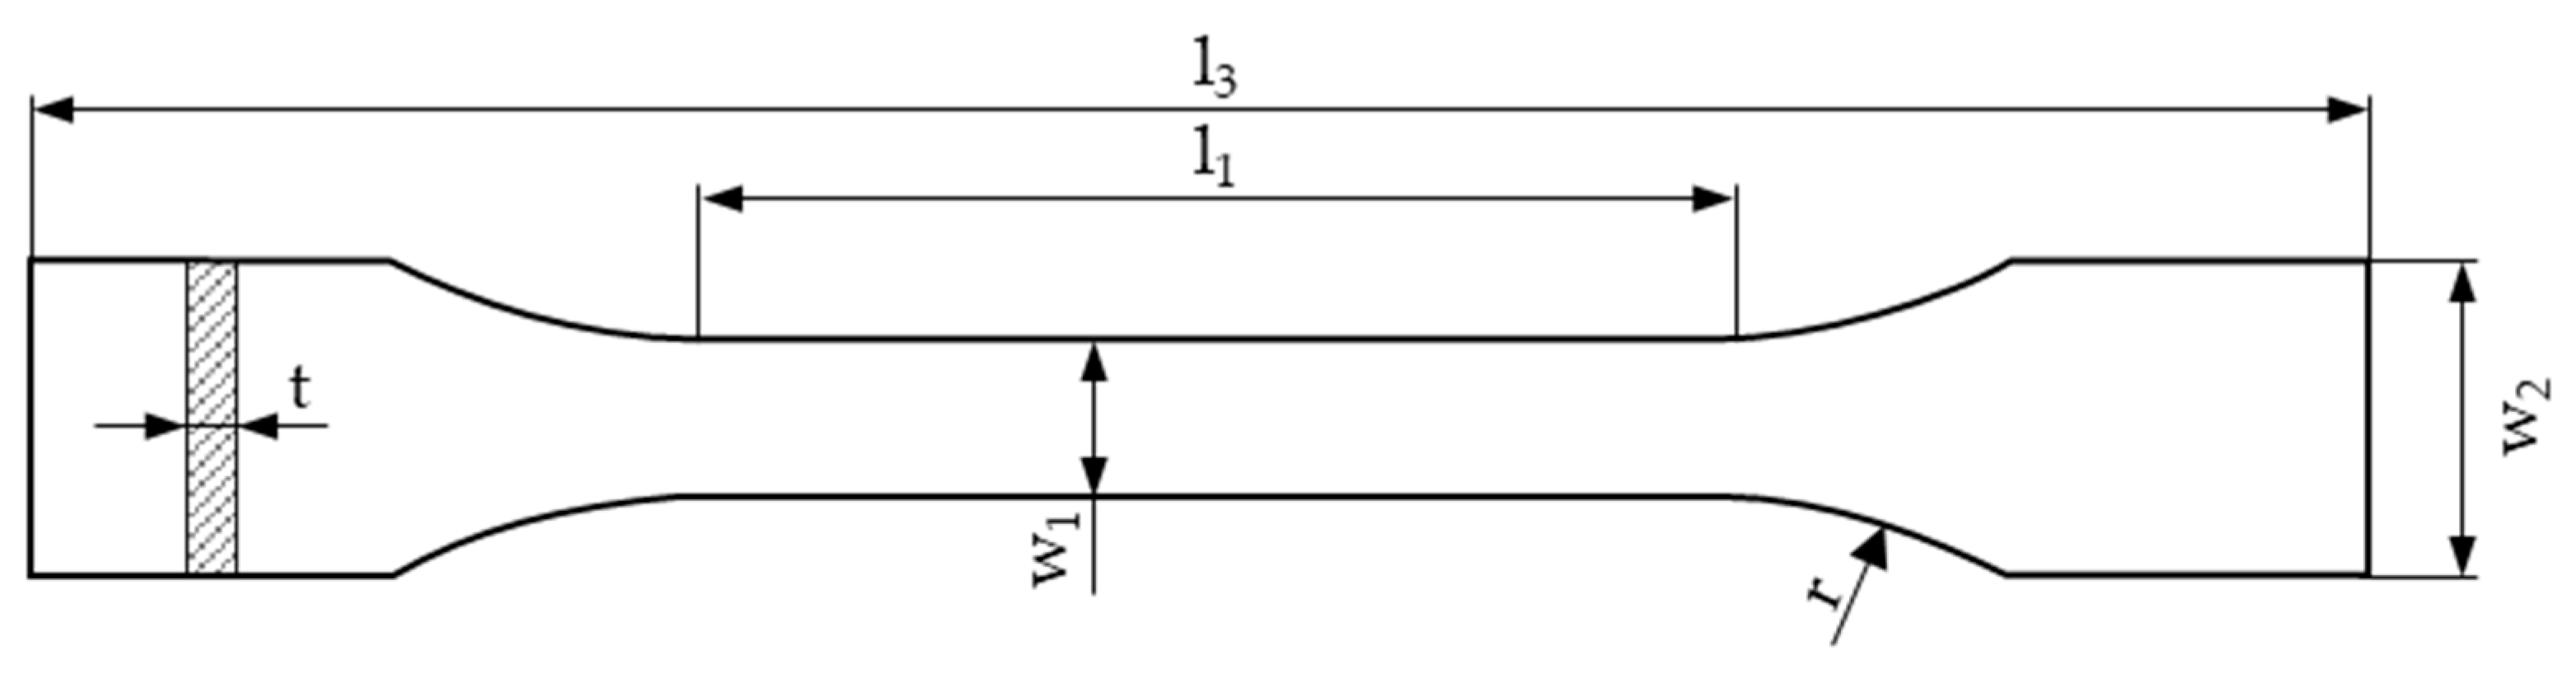
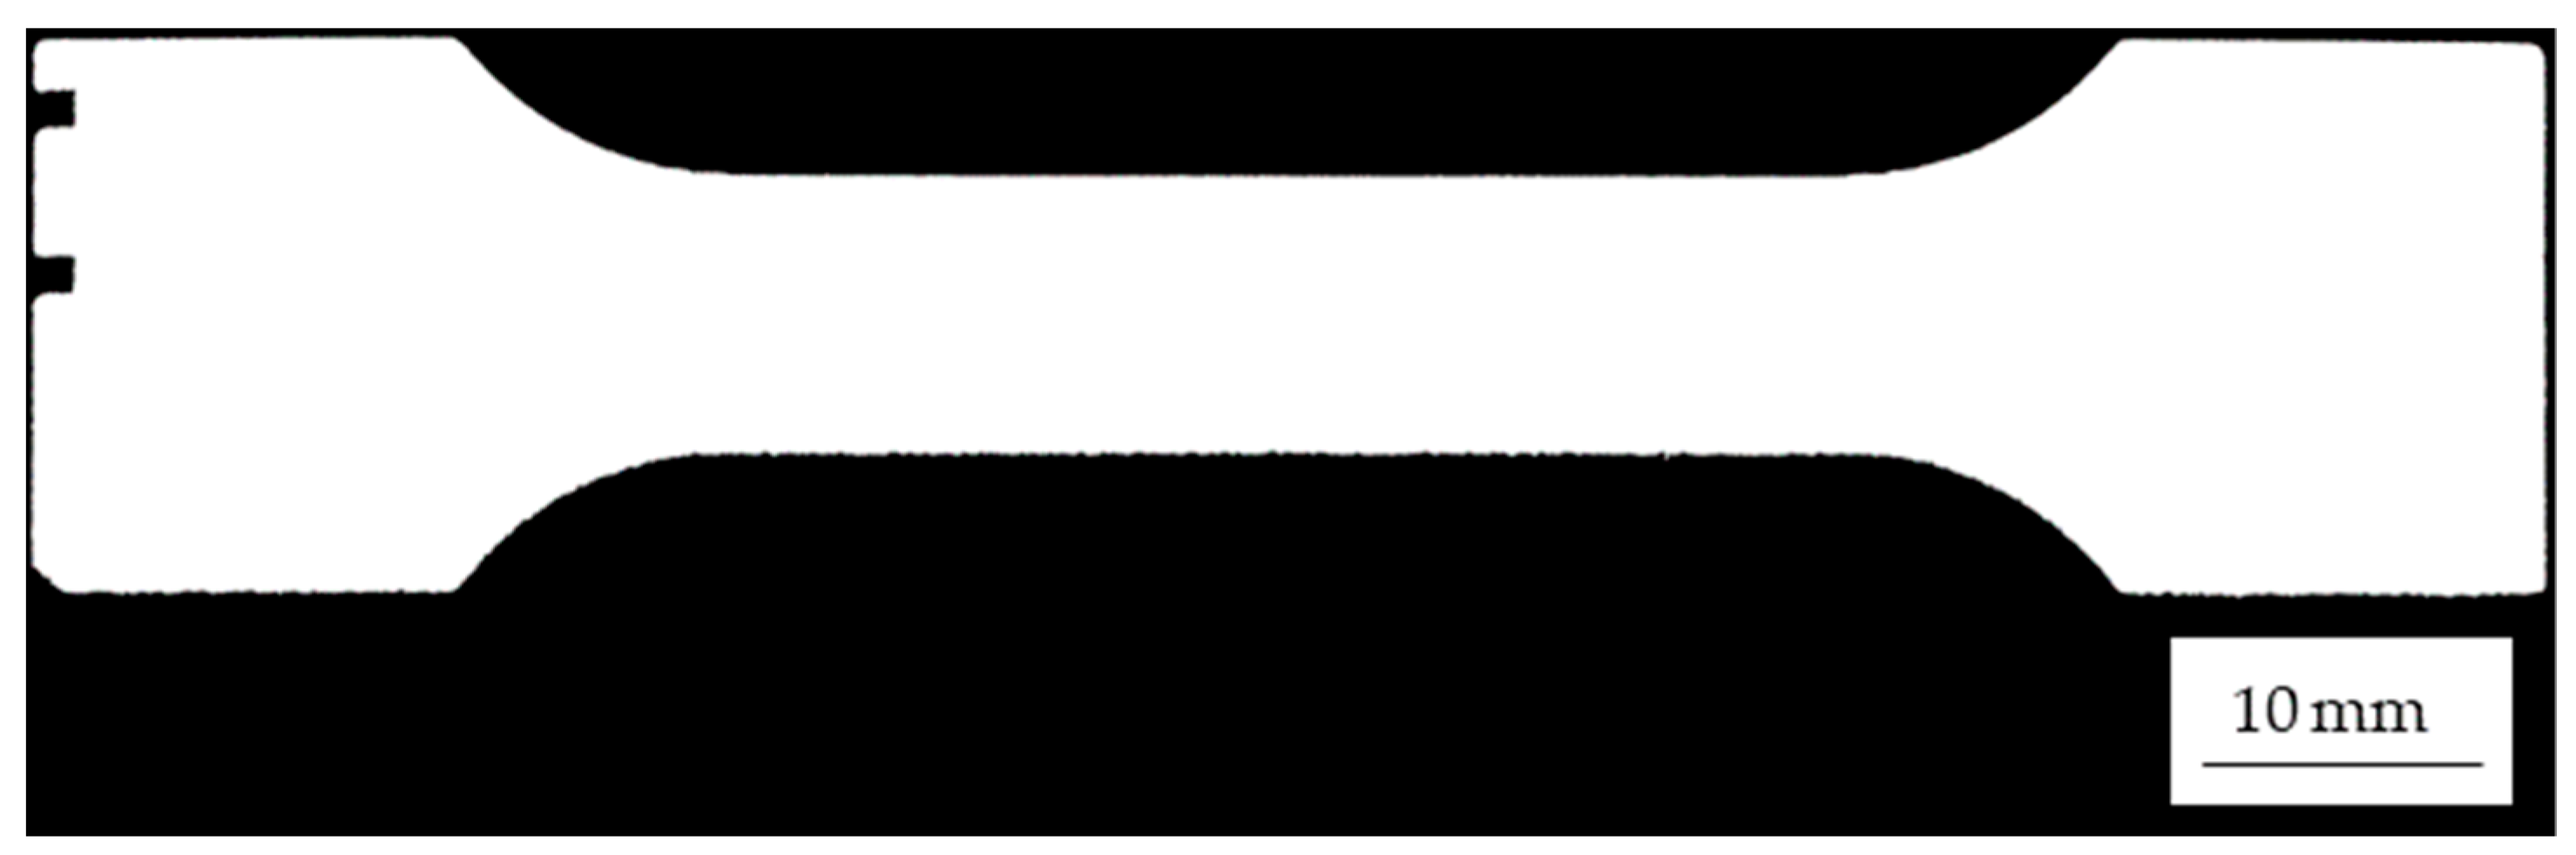
2.2. Test Specimens
2.3. Build Job Layouts
2.4. Process Parameters
2.5. Analysis Methods
2.5.1. Normalized Energy Density (NED)
2.5.2. Thermographic Measurements
2.5.3. Geometry
2.5.4. Surface Roughness
2.5.5. Part Density and Porosity
2.5.6. Mechanical Properties
3. Results
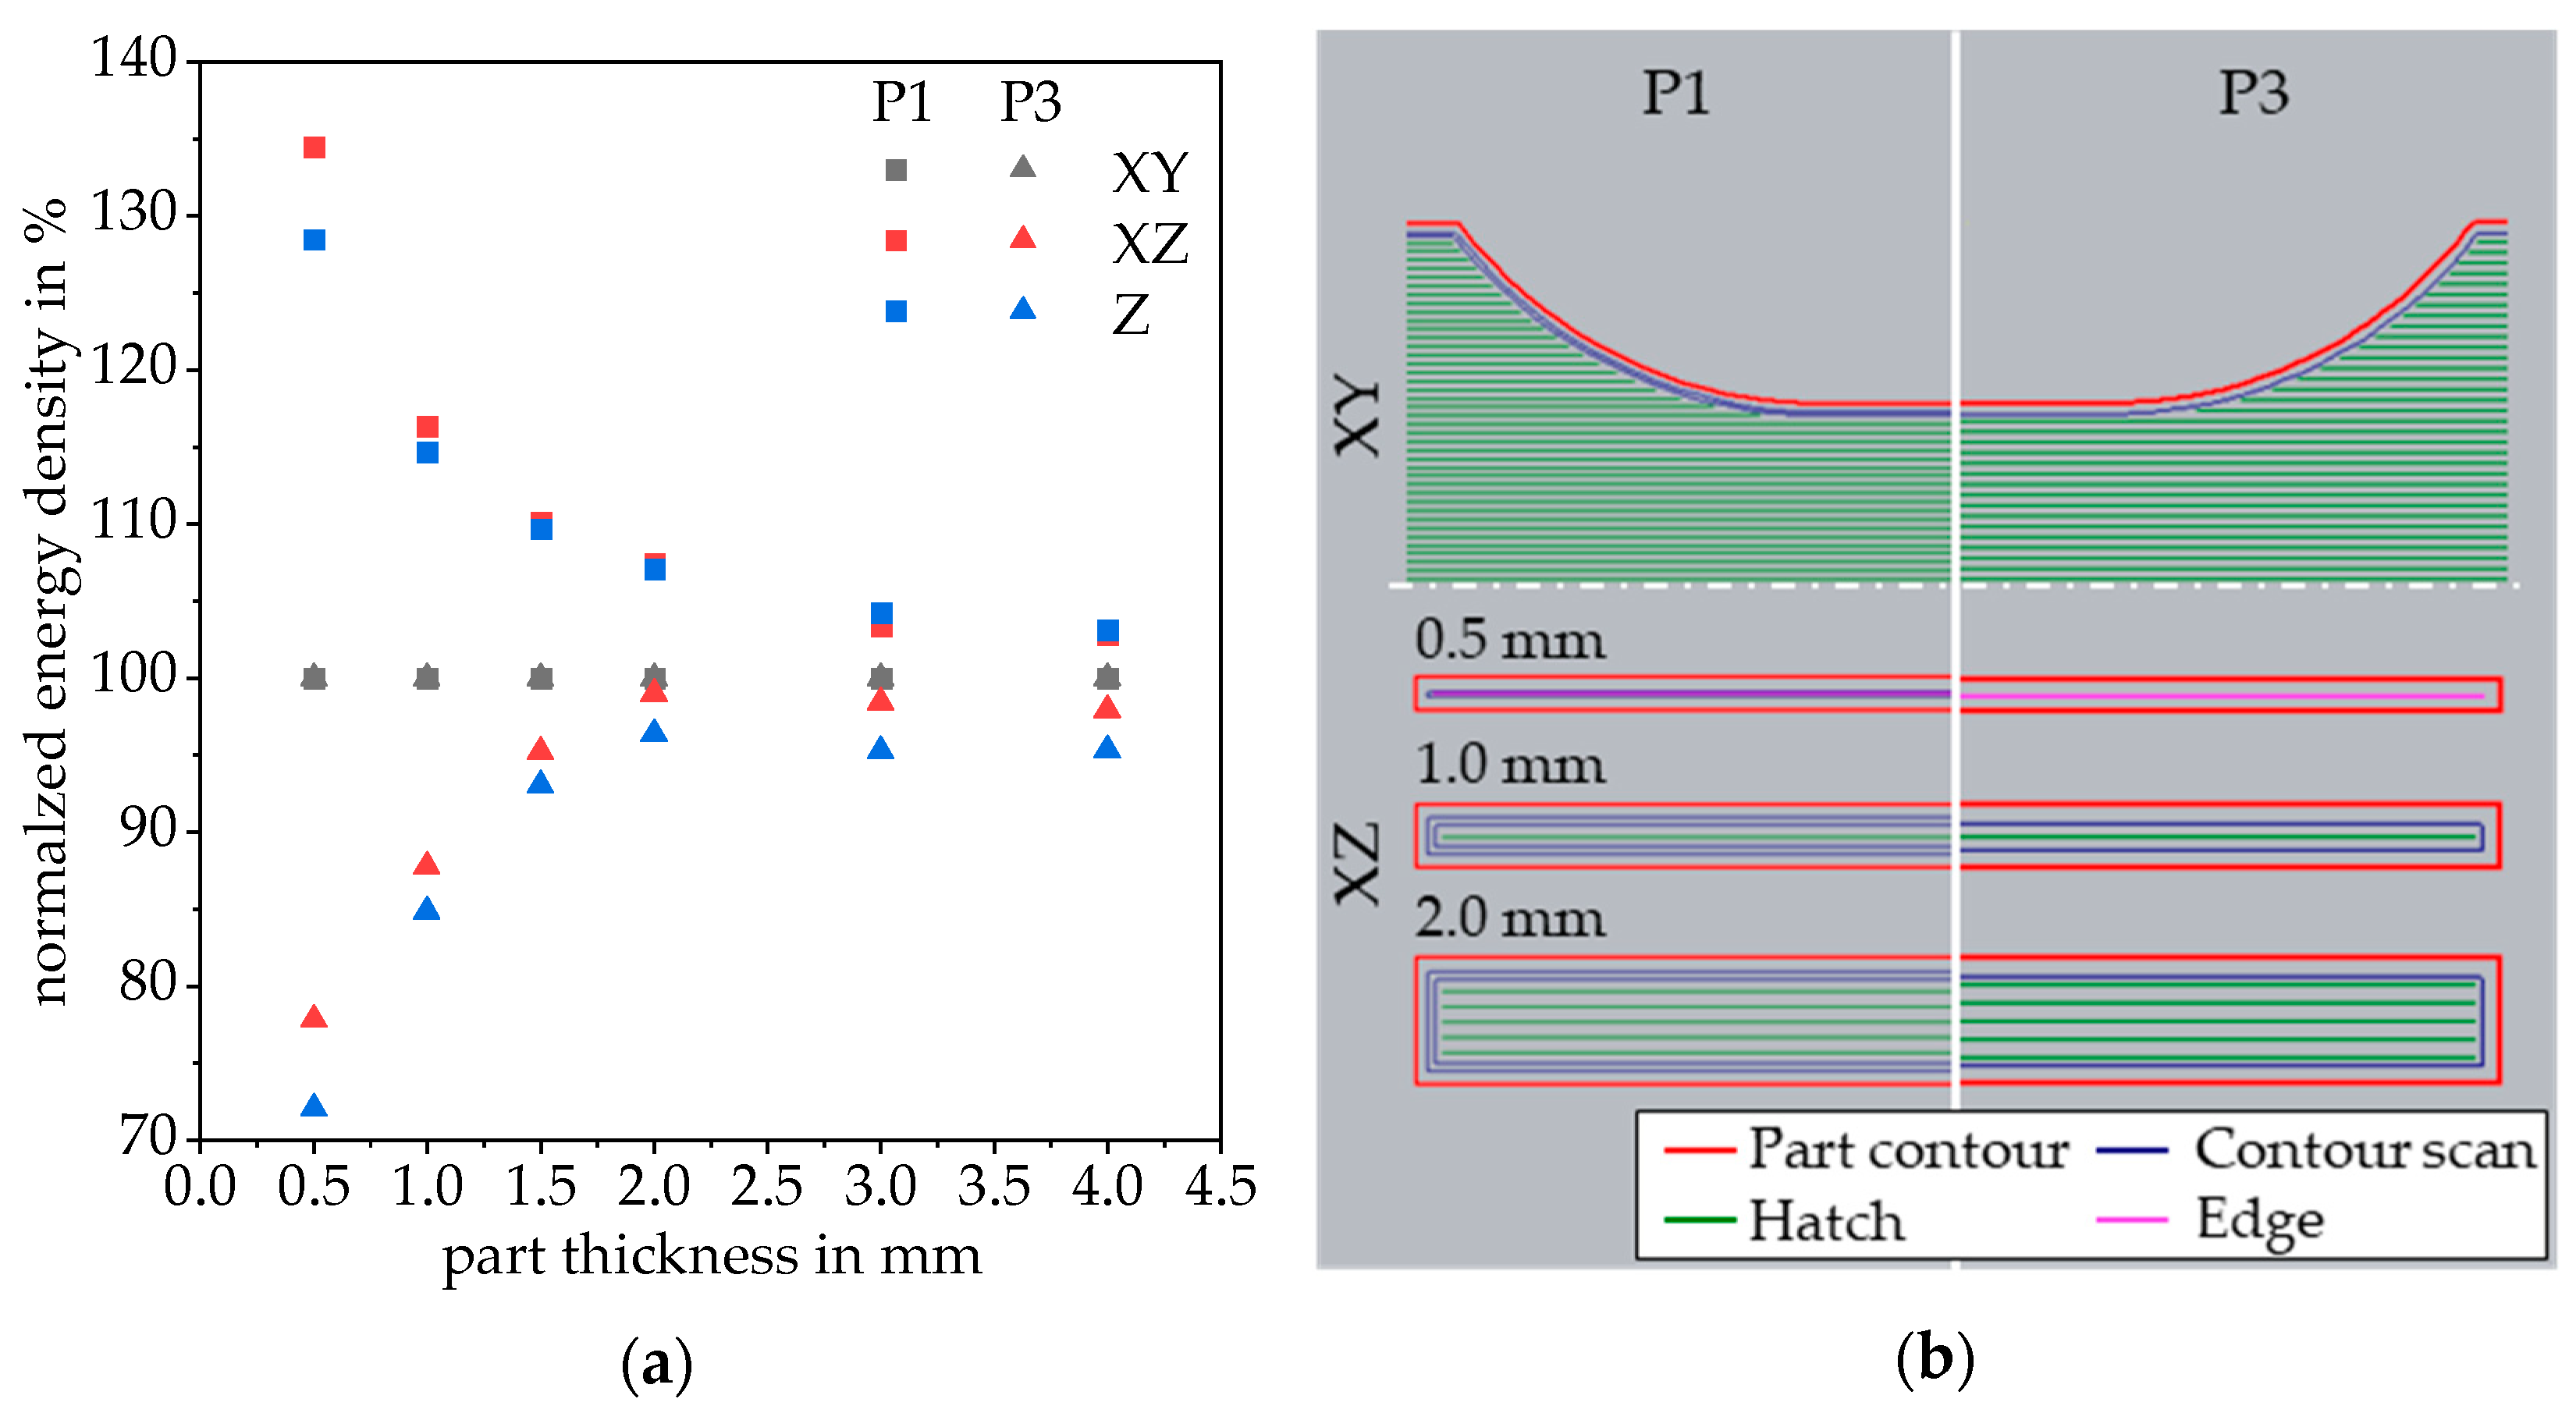
3.1. Normalized Energy Density
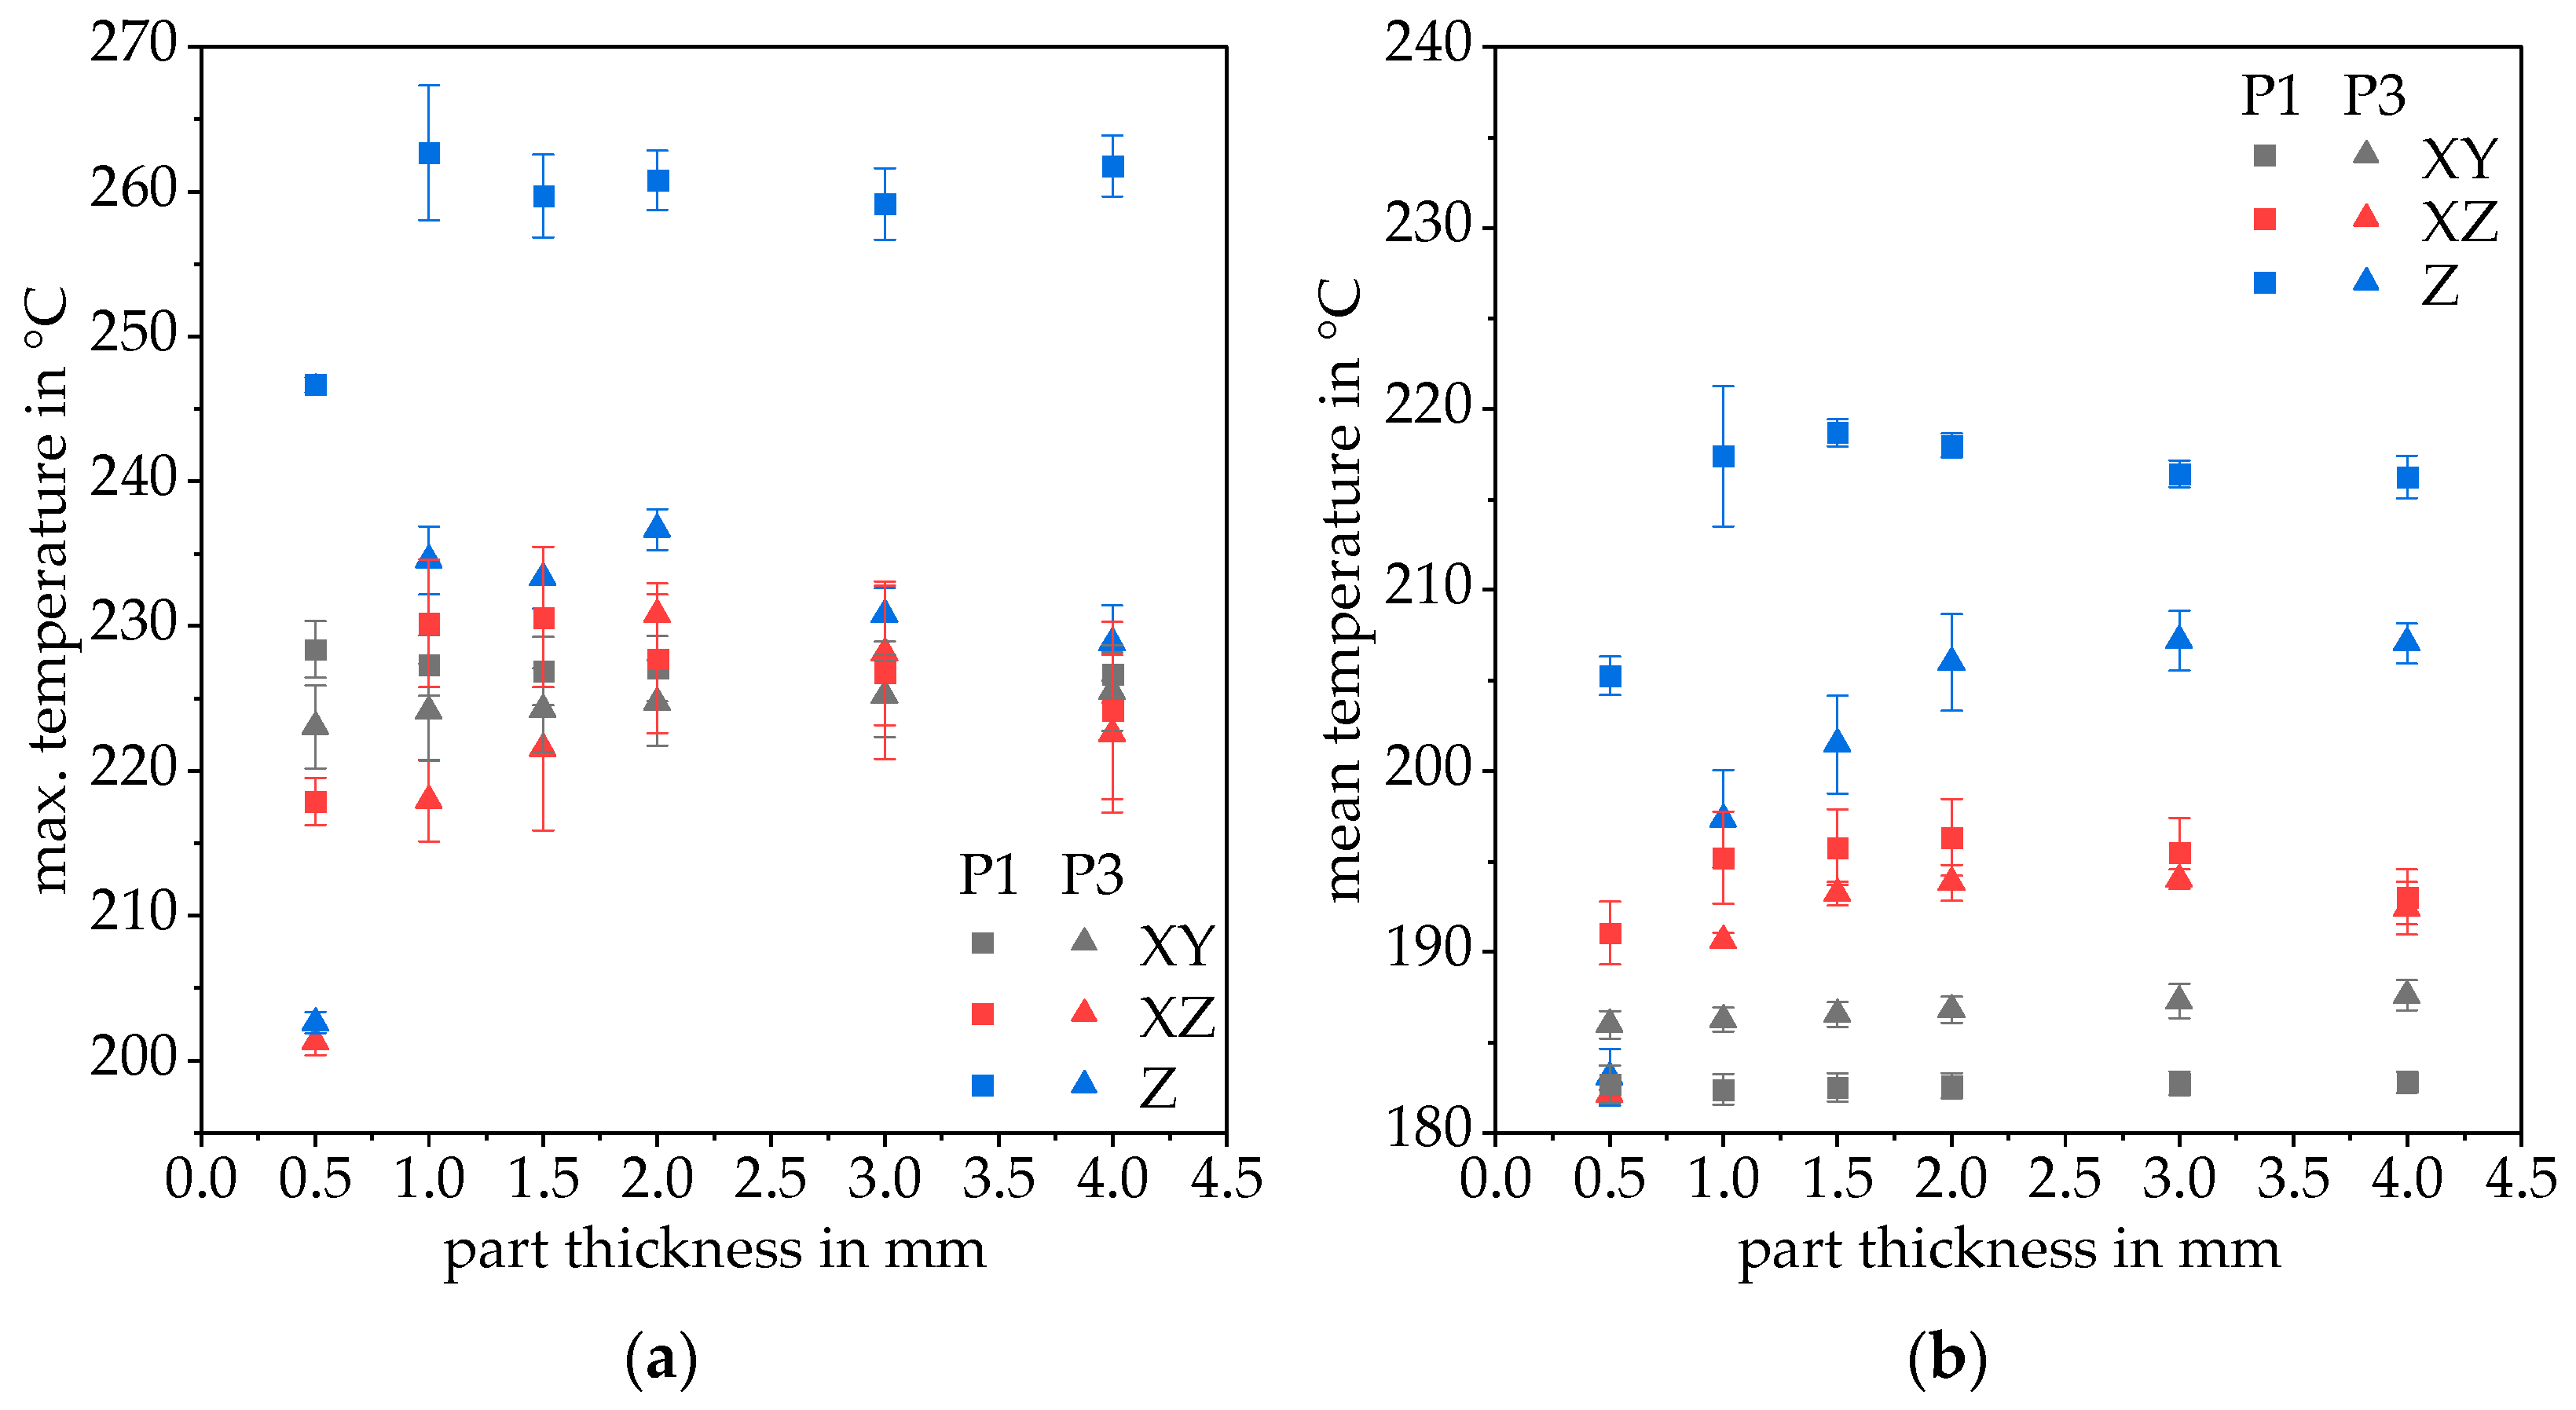
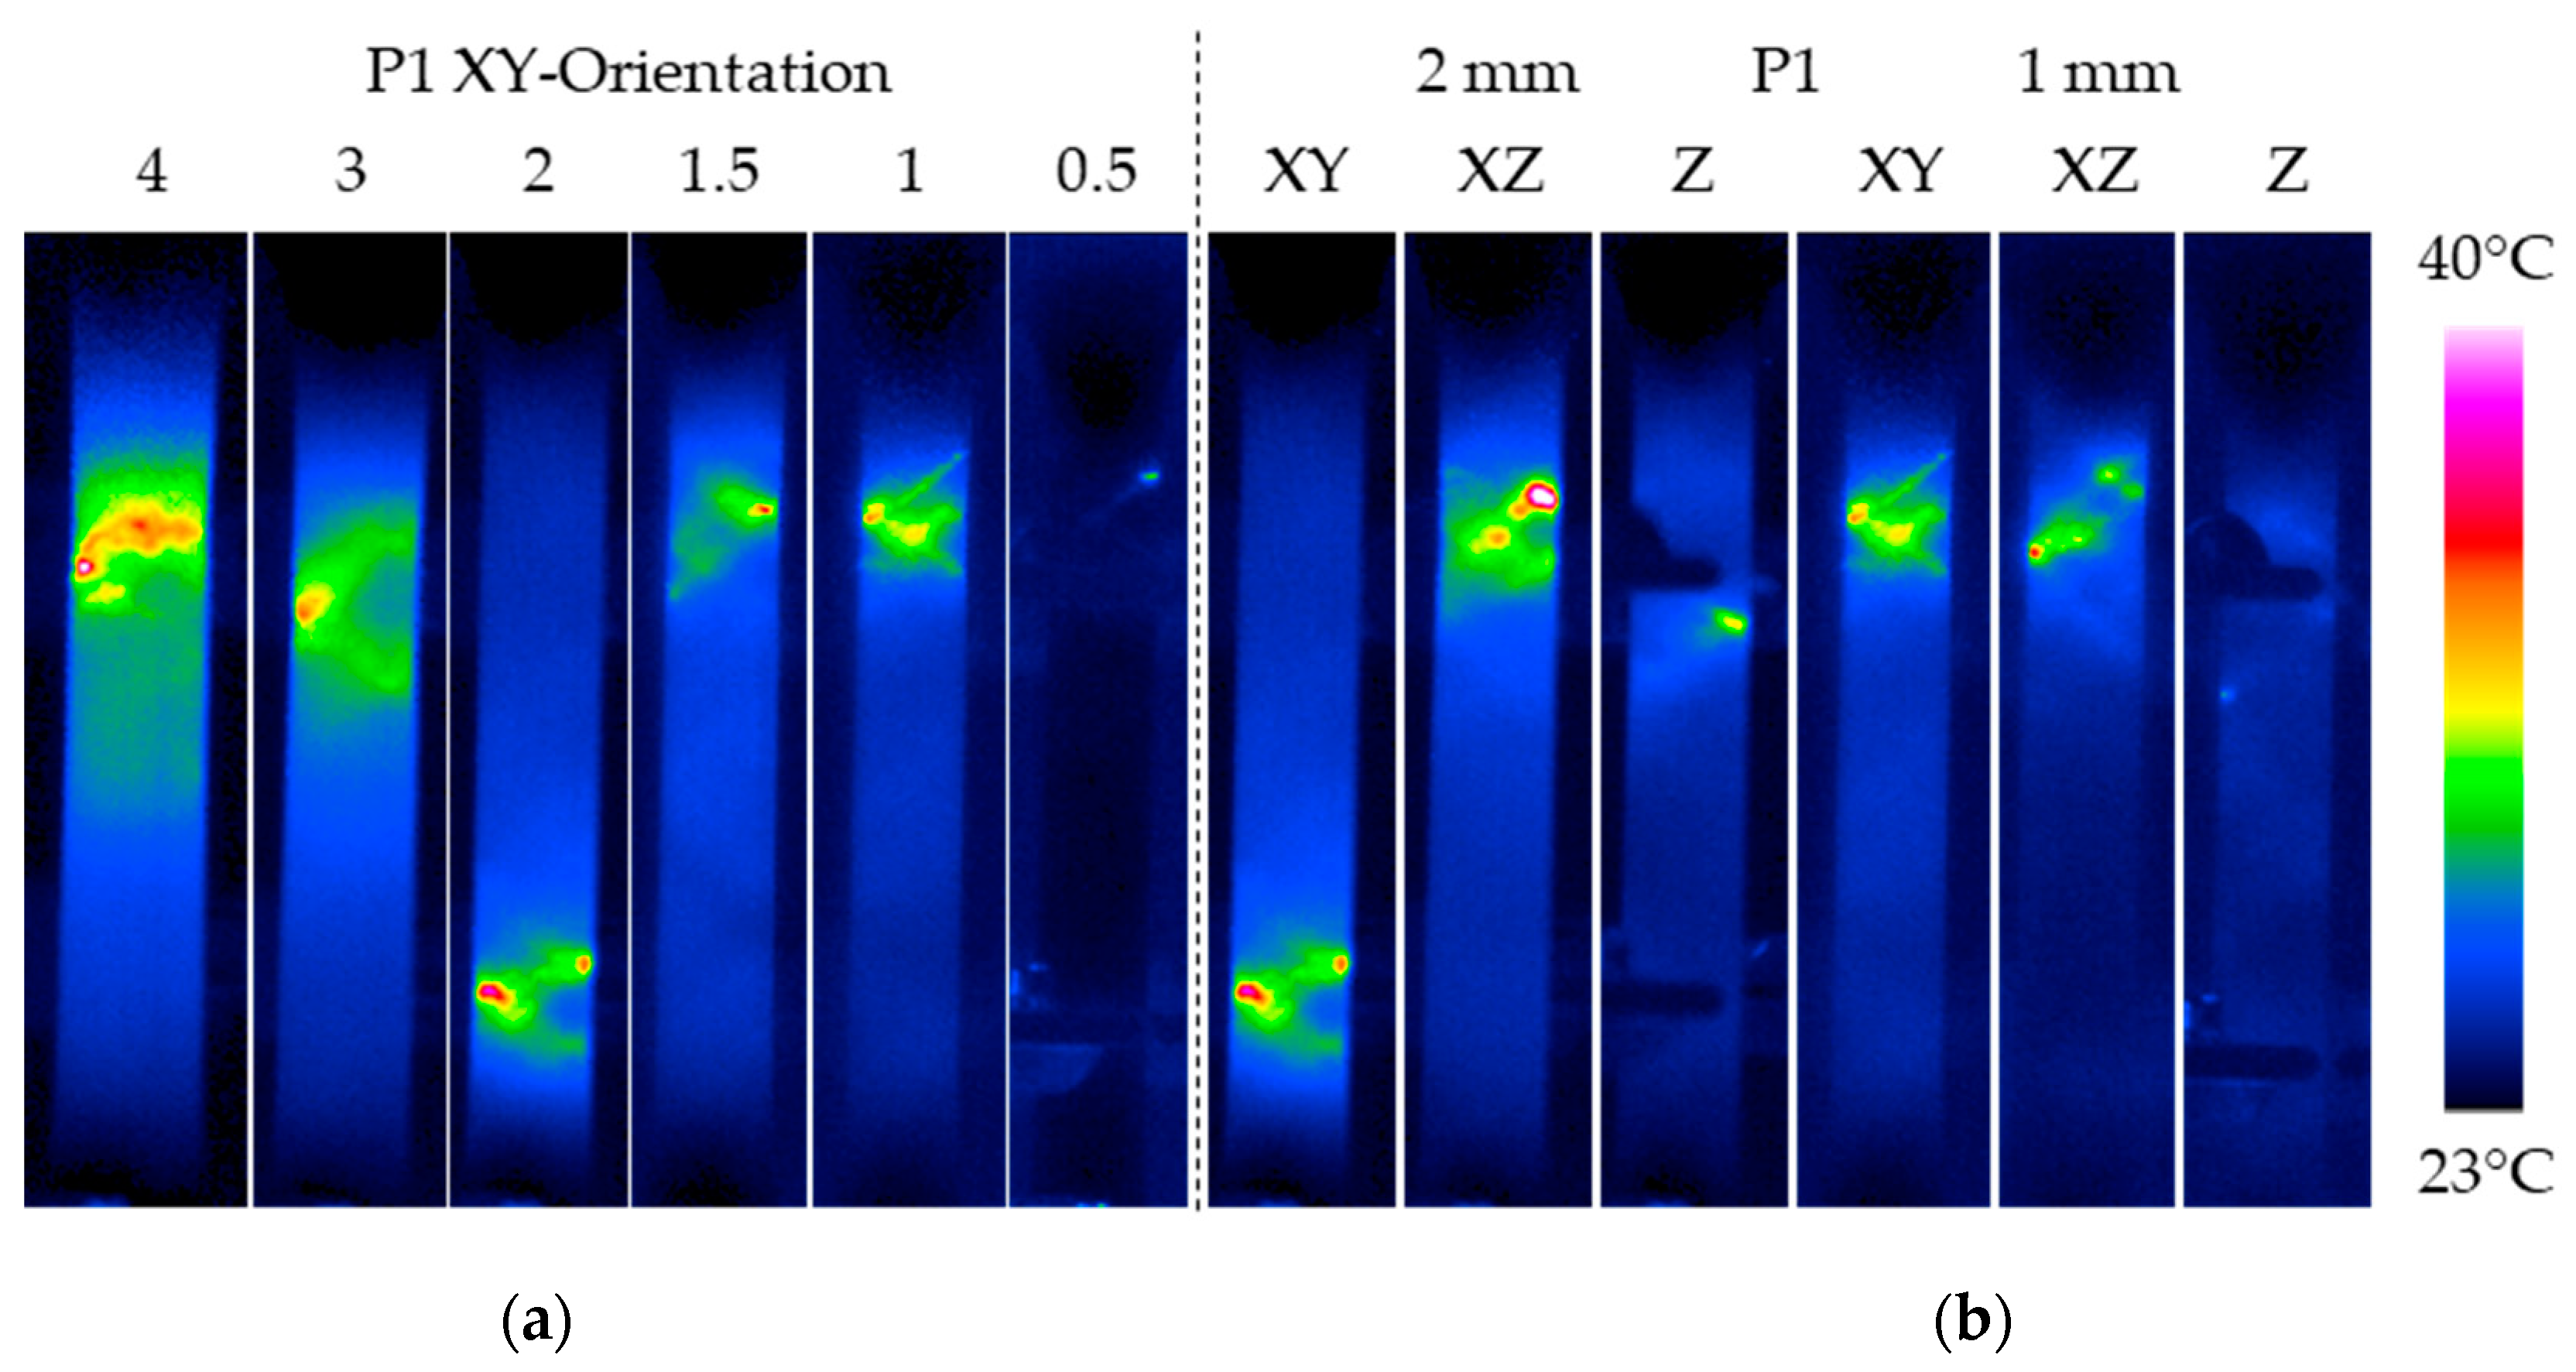
3.2. IR-Thermography
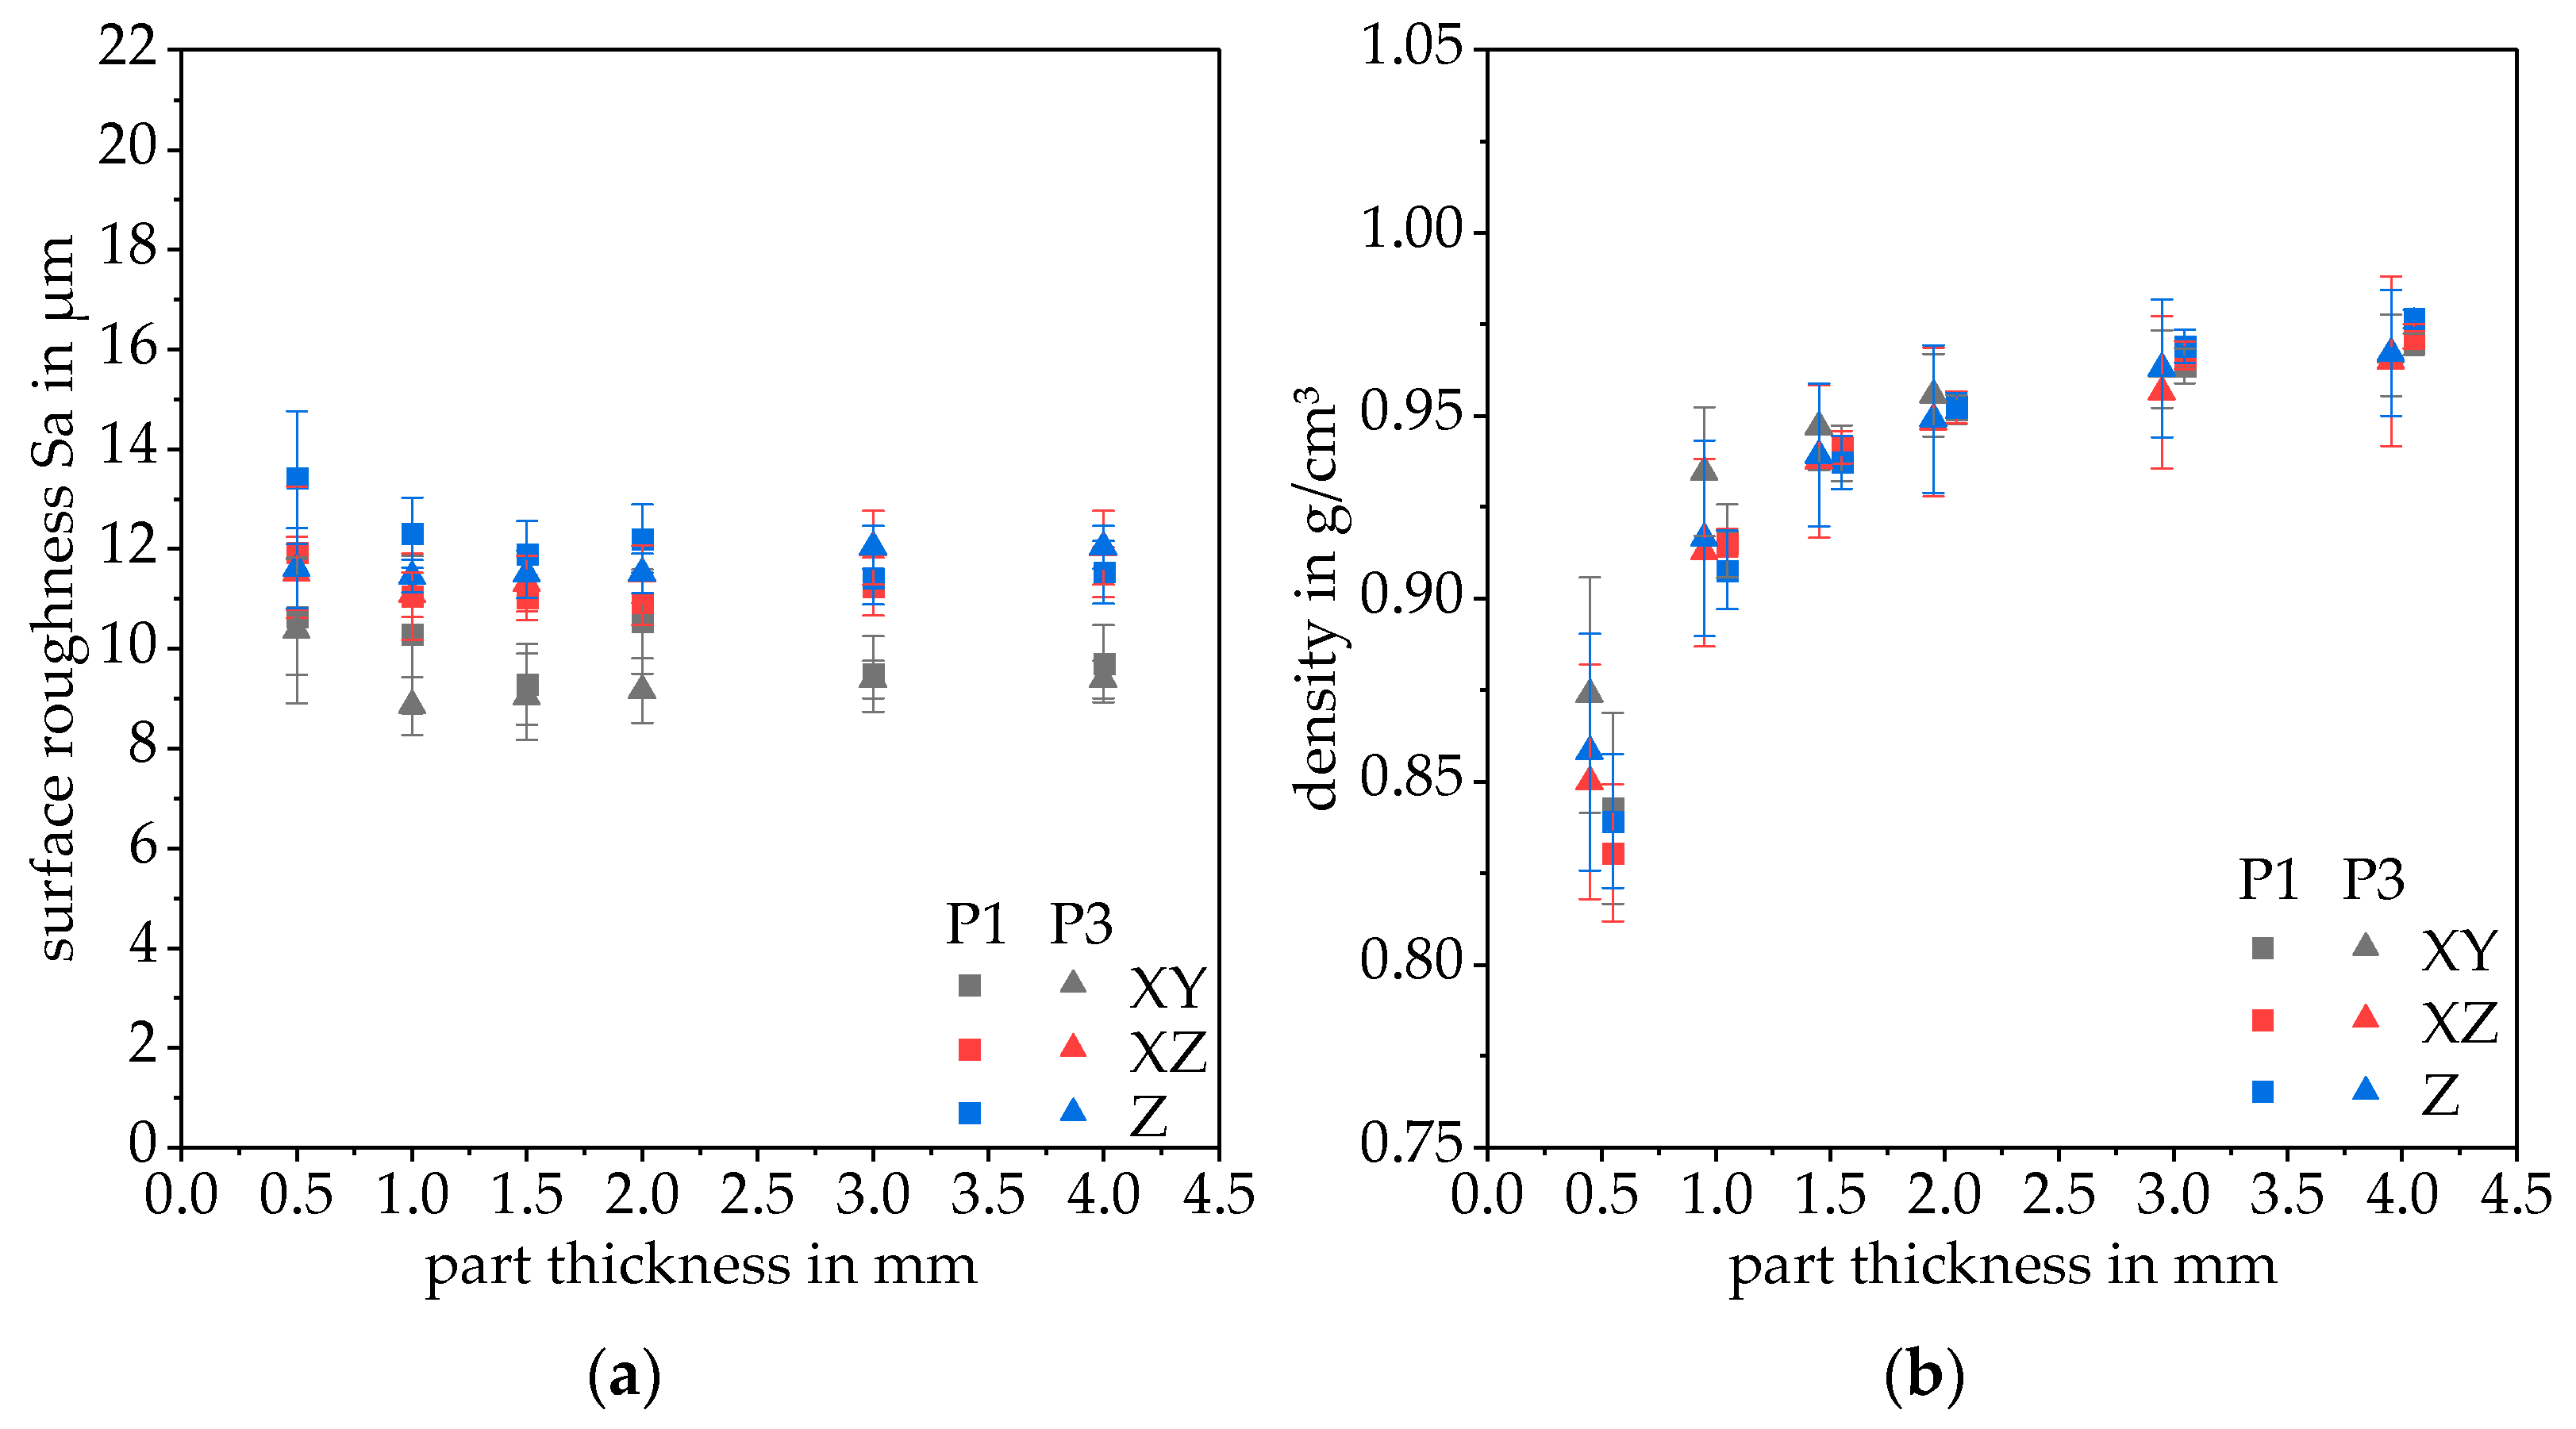
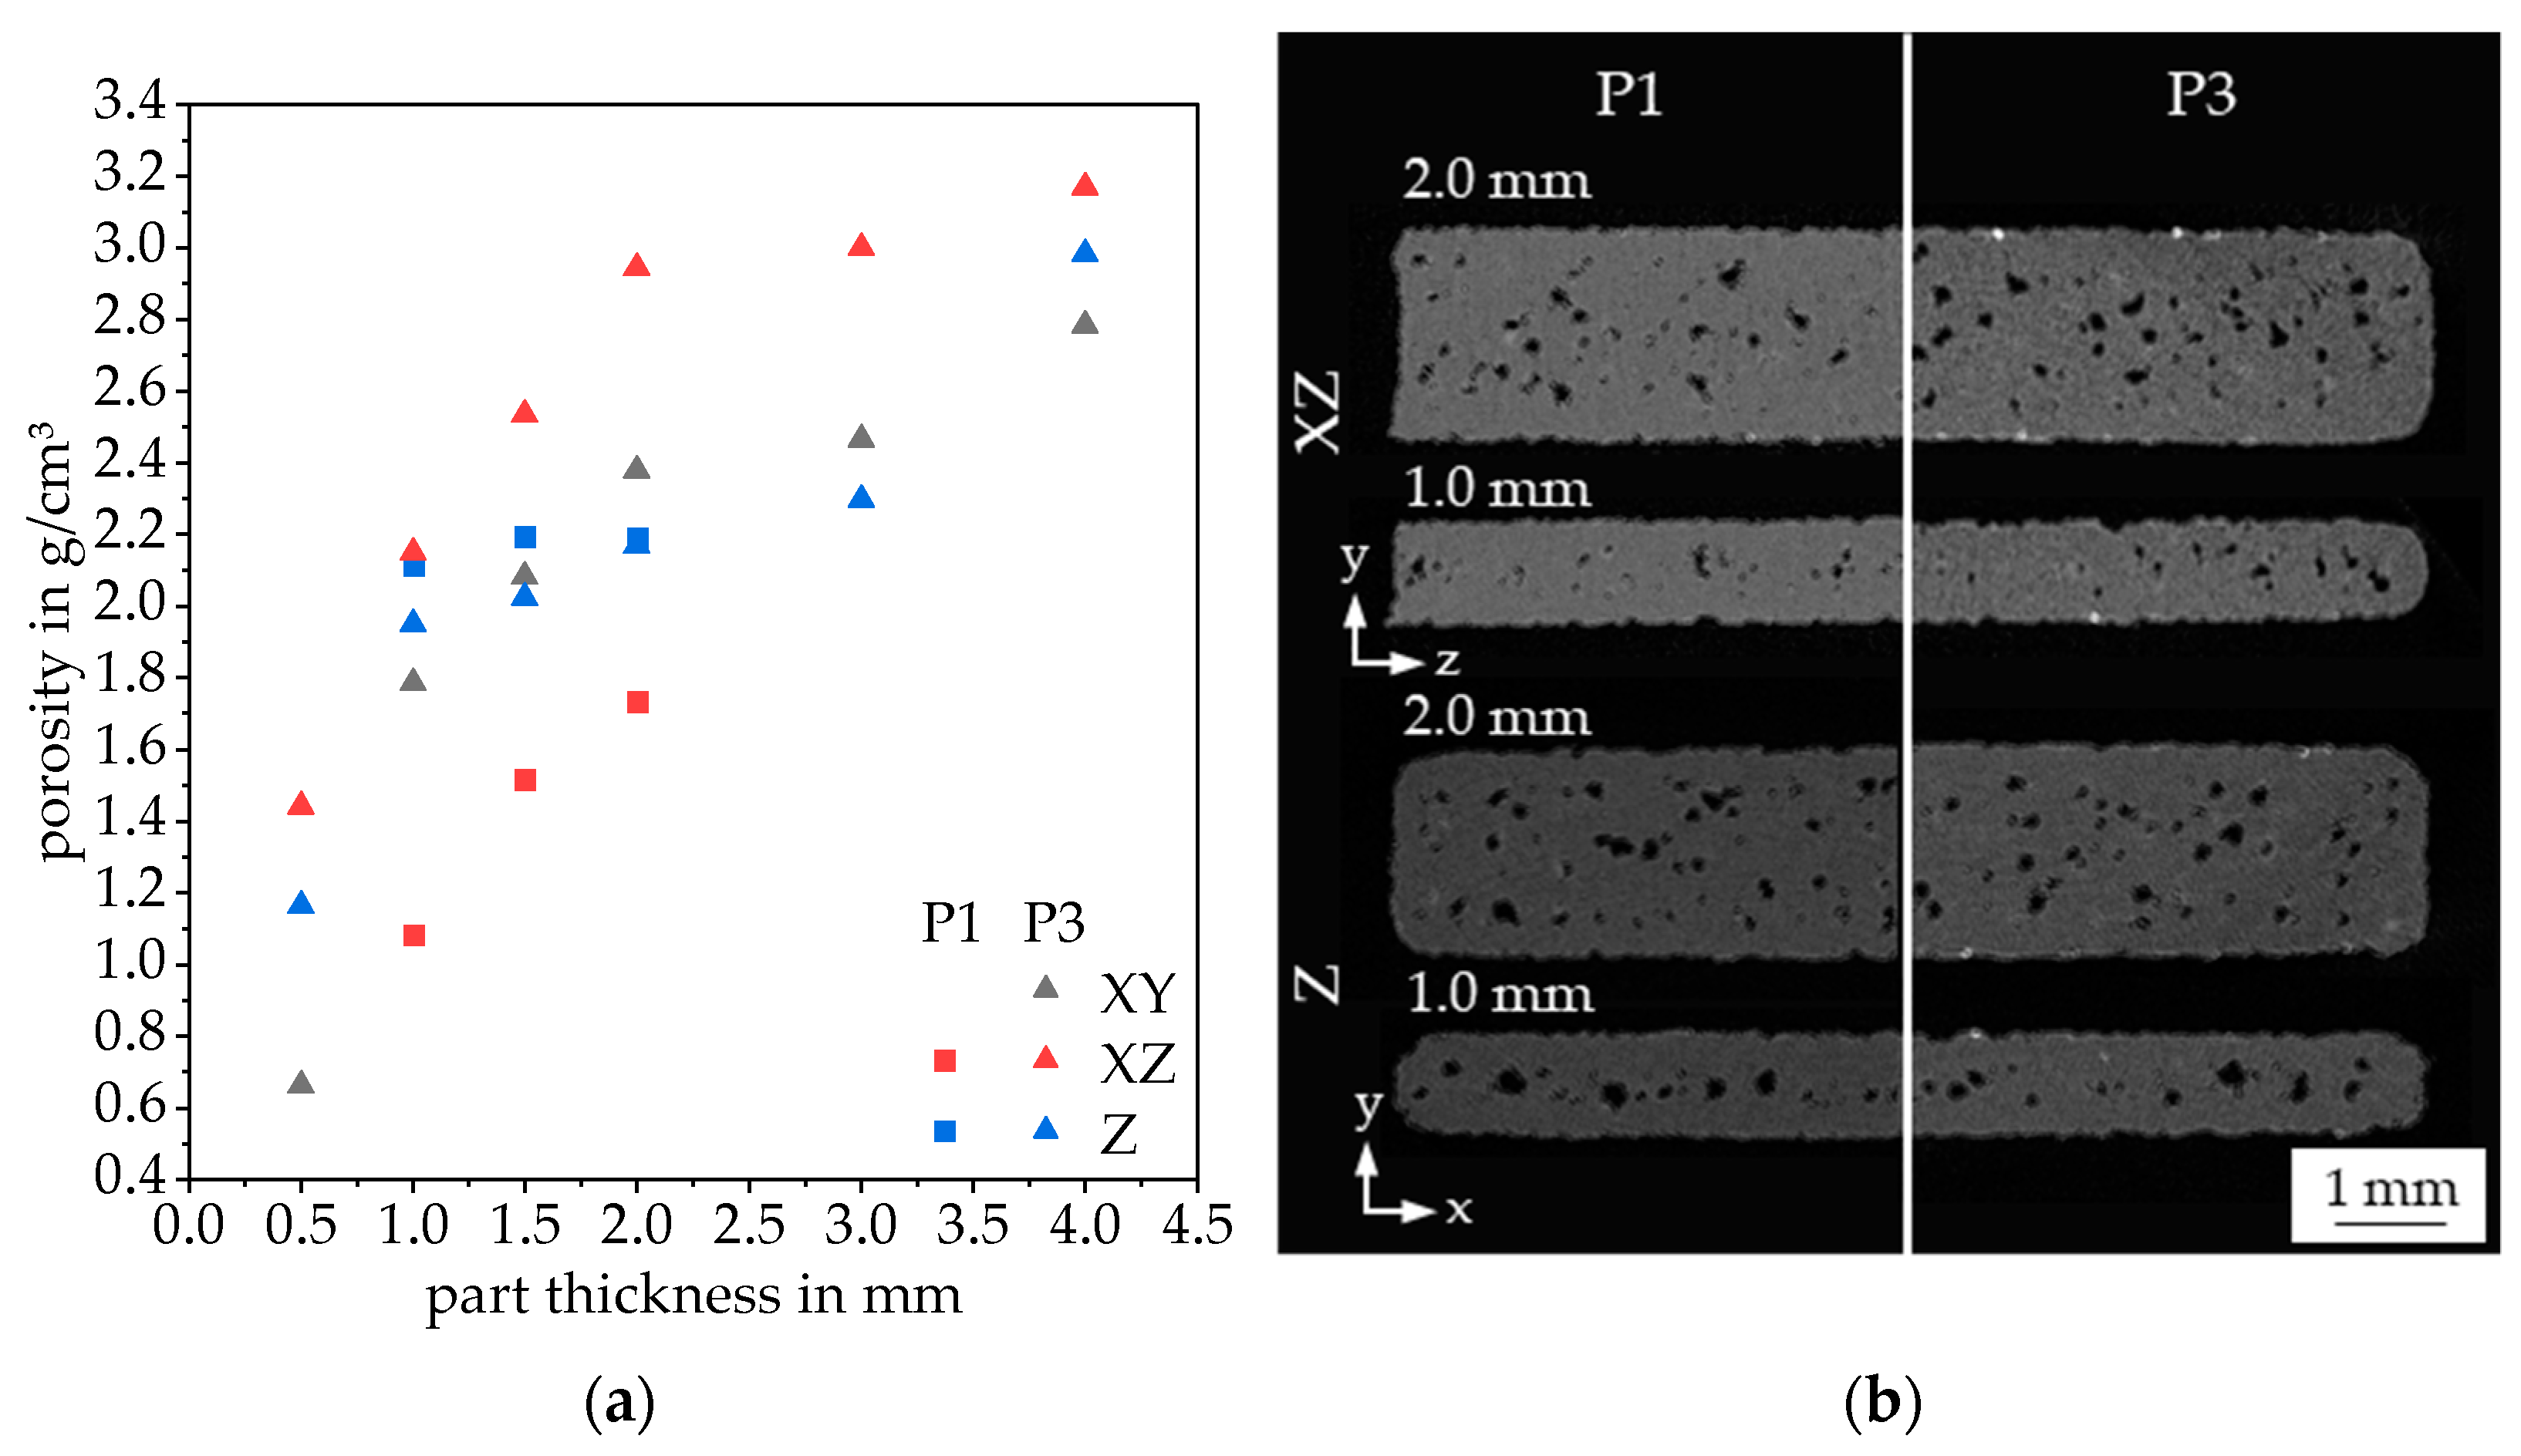
3.3. Porosity and Surface Roughness
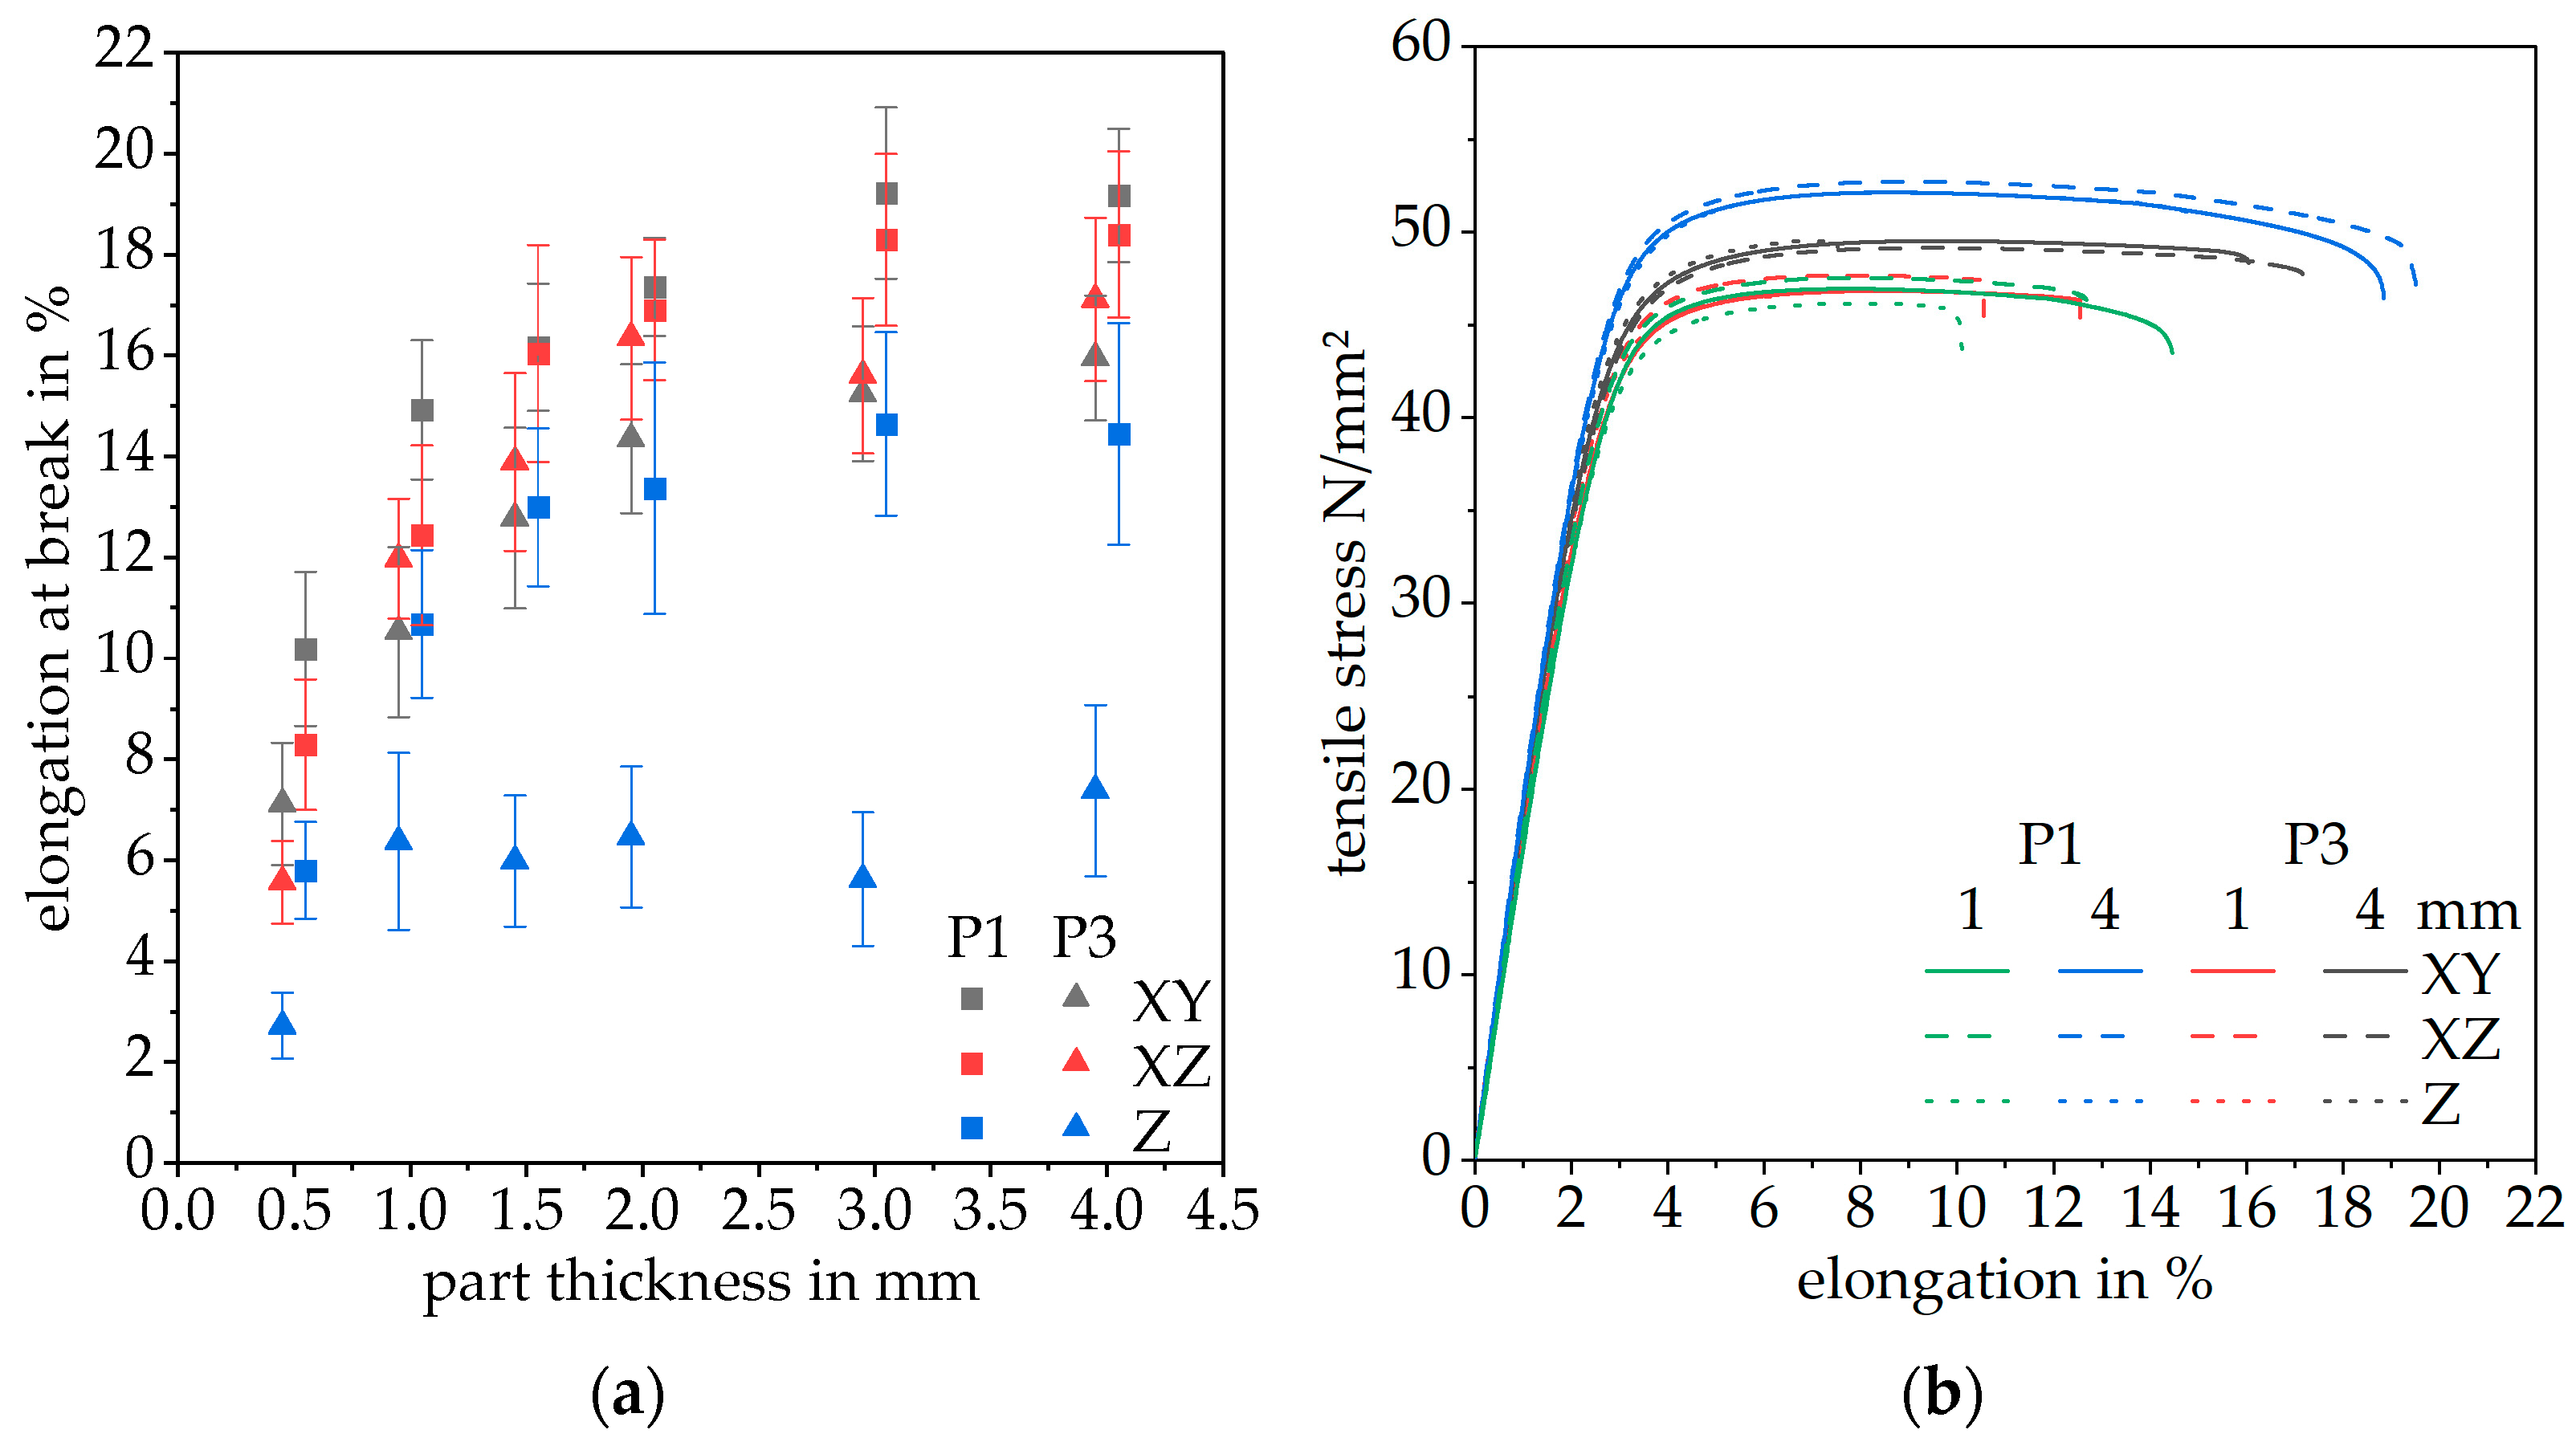
3.4. Mechanical Properties
4. Conclusions
- Normalized Energy Density (NED): NED was found to be highly dependent on the exposure strategy employed. For the P1 system, NED increased as the part thickness decreased, while the P3 system showed a decrease in NED for the EOS parameters. The differences in contour scans significantly impacted the exposure temperatures and part properties. This highlights the importance of understanding the machine-specific parameters and exposure strategies when designing and fabricating additively manufactured parts.
- Surface Roughness: Surface roughness was largely independent of the machine used, and remained relatively constant between part thicknesses of 1–4 mm. However, the orientation had the most significant influence on surface roughness, with XY-orientation resulting in the lowest surface roughness and XZ- and Z-orientations showing the highest surface roughness. This indicates that optimizing part orientation is a key factor in improving surface quality.
- Porosity: Inner porosity increased with increasing wall thickness, and was primarily independent of the machine used. Pores in the part act as imperfections, initiating cracks and affecting the mechanical properties. Therefore, careful consideration of part thickness is crucial when designing and fabricating parts for applications where high strength and minimal porosity are required.
- Mechanical Properties: The E-modulus and ultimate tensile strength (UTS) were found to decrease for parts thinner than 2 mm, while elongation at break decreased for parts thinner than 1.5 mm. The P3 system reached a slightly higher UTS than the P1 system, but the differences were not significant. The most significant difference in elongation at break was observed in the Z-orientation, suggesting the impact of machine type and orientation on the mechanical performance of parts.
Author Contributions
Funding
Data Availability Statement
Acknowledgments
Conflicts of Interest
Appendix A

Appendix B

References
- Mehrpouya, M.; Dehghanghadikolaei, A.; Fotovvati, B.; Vosooghnia, A.; Emamian, S.S.; Gisario, A. The Potential of Additive Manufacturing in the Smart Factory Industrial 4.0: A Review. Appl. Sci. 2019, 9, 3865. [Google Scholar] [CrossRef]
- Tofail, S.A.M.; Koumoulos, E.P.; Bandyopadhyay, A.; Bose, S.; O’Donoghue, L.; Charitidis, C. Additive manufacturing: Scientific and technological challenges, market uptake and opportunities. Mater. Today 2018, 21, 22–37. [Google Scholar] [CrossRef]
- Ligon, S.C.; Liska, R.; Stampfl, J.; Gurr, M.; Mülhaupt, R. Polymers for 3D Printing and Customized Additive Manufacturing. Chem. Rev. 2017, 117, 10212–10290. [Google Scholar] [CrossRef]
- Wörz, A.; Wudy, K.; Drummer, D.; Wegner, A.; Witt, G. Comparison of long-term properties of laser sintered and injection molded polyamide 12 parts. J. Polym. Eng. 2018, 38, 573–582. [Google Scholar] [CrossRef]
- Vanaei, H.R.; El Magri, A.; Rastak, M.A.; Vanaei, S.; Vaudreuil, S.; Tcharkhtchi, A. Numerical–Experimental Analysis toward the Strain Rate Sensitivity of 3D-Printed Nylon Reinforced by Short Carbon Fiber. Materials 2022, 15, 8722. [Google Scholar] [CrossRef] [PubMed]
- Schmid, M. Laser Sintering with Plastics: Technology, Processes, and Materials, 1st ed.; Hanser Publications, Cincinnati: Munich, Germany, 2018. [Google Scholar]
- Goodridge, R.D.; Tuck, C.J.; Hague, R.J.M. Laser sintering of polyamides and other polymers. Prog. Mater. Sci. 2012, 57, 229–267. [Google Scholar] [CrossRef]
- Greiner, S.; Jaksch, A.; Cholewa, S.; Drummer, D. Development of material-adapted processing strategies for laser sintering of polyamide 12. Adv. Ind. Eng. Polym. Res. 2021, 4, 251–263. [Google Scholar] [CrossRef]
- Launhardt, M.; Wörz, A.; Loderer, A.; Laumer, T.; Drummer, D.; Hausotte, T.; Schmidt, M. Detecting surface roughness on SLS parts with various measuring techniques. Polym. Test. 2016, 53, 217–226. [Google Scholar] [CrossRef]
- Rietzel, D.; Drexler, M.; Kühnlein, F.; Drummer, D. Influence of temperature fields on the processing of polymer powders by means of laser and mask sintering technology. In Proceedings of the 2011 International Solid Freeform Fabrication Symposium, Austin, TX, USA, 8–10 August 2011; University of Texas at Austin (Freeform): Austin, TX, USA, 2011; pp. 252–254. [Google Scholar]
- Tasch, D.; Mad, A.; Stadlbauer, R.; Schagerl, M. Thickness dependency of mechanical properties of laser-sintered polyamide lightweight structures. Addit. Manuf. 2018, 23, 25–33. [Google Scholar] [CrossRef]
- Josupeit, S.; Schmid, H.-J. Temperature history within laser sintered part cakes and its influence on process quality. Rapid Prototyp. J. 2016, 22, 788–793. [Google Scholar] [CrossRef]
- Josupeit, S.; Schmid, H.-J. Three-Dimensional In-Process Temperature Measurement of Laser Sintered Part Cakes. In Proceedings of the 2014 International Solid Freeform Fabrication Symposium, Austin, TX, USA, 4–6 August 2014; University of Texas at Austin: Austin, TX, USA, 2014. [Google Scholar] [CrossRef]
- Lanzl, L.; Wudy, K.; Drexler, M.; Drummer, D. Laser-high-speed-DSC: Process-oriented Thermal Analysis of PA 12 in Selective Laser Sintering. Phys. Procedia 2016, 83, 981–990. [Google Scholar] [CrossRef]
- Wegner, A.; Witt, G. Process Monitoring in Laser Sintering Using Thermal Imaging. In Proceedings of the 2011 International Solid Freeform Fabrication Symposium, Austin, TX, USA, 8–10 August 2011; University of Texas at Austin: Austin, TX, USA, 2011. [Google Scholar] [CrossRef]
- Wegner, A.; Witt, G. Understanding the decisive thermal processes in laser sintering of polyamide 12. In AIP Conference Proceedings; AIP Publishing LLC: Cleveland, OH, USA, 2015; p. 160004. [Google Scholar] [CrossRef]
- Mielicki, C.; Wegner, A.; Gronhoff, B.; Wortberg, J.; Witt, G. Prediction of PA12 melt viscosity in laser sintering by a time and temperature dependent rheological model. RTejournal 2012, 32, 1–32. [Google Scholar]
- Drummer, D.; Drexler, M.; Wudy, K. Resulting melt-pool-shape during selective beam melting of thermoplastics as function of energy input parameters. In Proceedings of the DDMC 2014, Fraunhofer Direct Digital Manufacturing Conference, Berlin, Germany, 12–13 March 2014; Fraunhofer Verlag: Aachen, Germany, 2014. [Google Scholar]
- Greiner, S.; Wudy, K.; Wörz, A.; Drummer, D. Thermographic investigation of laser-induced temperature fields in selective laser beam melting of polymers. Opt. Laser Technol. 2019, 109, 569–576. [Google Scholar] [CrossRef]
- Abdelrahman, M.; Starr, T.L. Layerwise Monitoring of Polymer Laser Sintering Using Thermal Imaging. In Proceedings of the 2014 International Solid Freeform Fabrication Symposium, Austin, TX, USA, 4–6 August 2014; University of Texas at Austin: Austin, TX, USA, 2014. [Google Scholar] [CrossRef]
- Launhardt, M.; Fischer, C.; Drummer, D. Research on the Influence of Geometry and Positioning on Laser Sintered Parts. Appl. Mech. Mater. 2015, 805, 105–114. [Google Scholar] [CrossRef]
- Raghunath, N.; Pandey, P.M. Improving accuracy through shrinkage modelling by using Taguchi method in selective laser sintering. Int. J. Mach. Tools Manuf. 2007, 47, 985–995. [Google Scholar] [CrossRef]
- Soe, S.P. Quantitative analysis on SLS part curling using EOS P700 machine. J. Mater. Process. Technol. 2012, 212, 2433–2442. [Google Scholar] [CrossRef]
- Wang, R.-J.; Wang, L.; Zhao, L.; Liu, Z. Influence of process parameters on part shrinkage in SLS. Int. J. Adv. Manuf. Technol. 2007, 33, 498–504. [Google Scholar] [CrossRef]
- Drexler, M. Zum Laserstrahlschmelzen von Polyamid 12: Analyse Zeitabhängiger Einflüsse in der Prozessführung. Ph.D. Thesis, Lehrstuhl für Kunststofftechnik, Erlangen, Germany, 2016. [Google Scholar]
- Deng, X.; Zong, G.; Beaman, J.J. Parametric Analysis for Selective Laser Sintering of a Sample Polymer System. In Proceedings of the 1992 International Solid Freeform Fabrication Symposium, Austin, TX, USA, 3–5 August 1992. [Google Scholar]
- Launhardt, M.; Drummer, D. Determination of the fundamental dimension development in building direction for laser-sintered parts. J. Polym. Eng. 2019, 39, 197–206. [Google Scholar] [CrossRef]
- Sindinger, S.-L.; Kralovec, C.; Tasch, D.; Schagerl, M. Thickness dependent anisotropy of mechanical properties and inhomogeneous porosity characteristics in laser-sintered polyamide 12 specimens. Addit. Manuf. 2020, 33, 101141. [Google Scholar] [CrossRef]
- Stichel, T.; Frick, T.; Laumer, T.; Tenner, F.; Hausotte, T.; Merklein, M.; Schmidt, M. A Round Robin study for Selective Laser Sintering of polyamide 12: Microstructural origin of the mechanical properties. Opt. Laser Technol. 2016, 89, 31–40. [Google Scholar] [CrossRef]
- Wegner, A. Theorie Über die Fortführung von Aufschmelzvorgängen als Grundvoraussetzung für eine Robuste Prozessführung Beim Laser-Sintern von Thermoplasten. Ph.D. Thesis, Universitätsbibliothek Duisburg-Essen, Essen, Germany, 2015. [Google Scholar]
- Zarringhalam, H. Investigation into Crystallinity and Degree of Particle Melt in Selective Laser Sintering, Loughborough University. 2007. Available online: https://repository.lboro.ac.uk/articles/Investigation_into_crystallinity_and_degree_of_particle_melt_in_selective_laser_sintering/9516743 (accessed on 2 June 2020).
- Wörz, A.; Wudy, K.; Drummer, D. Understanding the influence of energy-density on the layer dependent part properties in laser-sintering of PA12. In Proceedings of the Annual International Solid Freeform Fabrication Symposium, Austin, TX, USA, 12–14 August 2019; pp. 1560–1569. [Google Scholar]
- Wörz, A.; Drummer, D. Understanding hatch-dependent part properties in SLS. In Proceedings of the 2018 International Solid Freeform Fabrication Symposium, Austin, TX, USA, 13–15 August 2018; pp. 1360–1369. [Google Scholar]
- Majewski, C.; Hopkinson, N. Effect of section thickness and build orientation on tensile properties and material characteristics of laser sintered nylon-12 parts. Rapid Prototyp. J. 2011, 17, 176–180. [Google Scholar] [CrossRef]
- Hesse, N.; Winzer, B.; Peukert, W.; Schmidt, J. Towards a generally applicable methodology for the characterization of particle properties relevant to processing in powder bed fusion of polymers—From single particle to bulk solid behavior. Addit. Manuf. 2021, 41, 101957. [Google Scholar] [CrossRef]
- Launhardt, M. Zur Entstehung von Dimensionen und Maßabweichungen beim Laserstrahlschmelzen von Kunststoffen; FAU University Press: Erlangen, Germany, 2021. [Google Scholar]
- Cholewa, S.; Jaksch, A.; Drummer, D. Coalescence Behavior of Polyamide 12 as Function of Zero-Shear Viscosity and Influence on Mechanical Performance. In Proceedings of the 2022 International Solid Freeform Fabrication Symposium, Austin, TX, USA, 25–27 July 2022. [Google Scholar] [CrossRef]
- Tumor, I.Y.; Thompson, D.C.; Wood, K.L.; Crawford, R.H. Characterization of surface fault patterns with application to a layered manufacturing process. J. Manuf. Syst. 1998, 17, 23–36. [Google Scholar] [CrossRef]
- Greiner, S.; Lanzl, L.; Zhao, M.; Wudy, K.; Drummer, D. Influence of powder bed surface on part properties produced by selective laser beam melting of polymers. In Proceedings of the 7th International Congress on Architectural Technology (ICAT 2018), Maribor, Slovenia, 14–17 June 2018; pp. 153–161. [Google Scholar]
- Wudy, K. Alterungsverhalten von Polyamid12 Beim Selektiven Lasersintern; Lehrstuhl für Kunststofftechnik: Erlangen, Germany, 2017. [Google Scholar]


| Type | l1 | l3 | w1 | w2 | r | t |
|---|---|---|---|---|---|---|
| 1 A “short” | 40 mm | 90 mm | 10 mm | 20 mm | 12 mm | 0.5; 1; 1.5; 2; 3; 4 mm |
| Type | Unit | Formiga P110 | P396 |
|---|---|---|---|
| x-Scaling | % | 3.02 | 2.8 |
| y-Scaling | % | 2.97 | 3.0 |
| z-Scaling | % | z(0) 2.6–z(300) 2.0 | z(0) 2.55–z(300) 1.4 |
| z-Compensation | µm | 100 | 120 |
| Layer thickness | µm | 100 | 120 |
| Build height | mm | 310 | 310 |
| Beam offset | mm | 0.21 | 0.3 |
| Process-chamber temperature | °C | 169 | 174 |
| Removal-chamber temperature | °C | 150 | 130 |
| Exposure parameters | PA2200_100_102 | PA2200_120_111 |
| Thickness | Contour | P1 Hatch | Edge | Contour | P3 Hatch | Edge | Aspect-Ratio | ||
|---|---|---|---|---|---|---|---|---|---|
| xy | xz | z | |||||||
| 0.5 mm | 1 | - | 1 | - | - | 1 | 9 | 0 | 0 |
| 1.0 mm | 2 | 1 | - | 1 | 1 | - | 9 | 607 | 63 |
| 1.5 mm | 2 | 3 | - | 1 | 3 | - | 9 | 136 | 14 |
| 2.0 mm | 2 | 5 | - | 1 | 5 | - | 9 | 76 | 8 |
| 3.0 mm | 2 | 9 | - | 1 | 7 | - | 9 | 41 | 4 |
| 4.0 mm | 2 | 13 | - | 1 | 11 | - | 9 | 28 | 3 |
Disclaimer/Publisher’s Note: The statements, opinions and data contained in all publications are solely those of the individual author(s) and contributor(s) and not of MDPI and/or the editor(s). MDPI and/or the editor(s) disclaim responsibility for any injury to people or property resulting from any ideas, methods, instructions or products referred to in the content. |
© 2023 by the authors. Licensee MDPI, Basel, Switzerland. This article is an open access article distributed under the terms and conditions of the Creative Commons Attribution (CC BY) license (https://creativecommons.org/licenses/by/4.0/).
Share and Cite
Jaksch, A.; Cholewa, S.; Drummer, D. Thin-Walled Part Properties in Powder Bed Fusion of Polymers—A Comparative Study on Temperature Development and Part Performance Depending on Part Thickness and Orientation. J. Manuf. Mater. Process. 2023, 7, 96. https://doi.org/10.3390/jmmp7030096
Jaksch A, Cholewa S, Drummer D. Thin-Walled Part Properties in Powder Bed Fusion of Polymers—A Comparative Study on Temperature Development and Part Performance Depending on Part Thickness and Orientation. Journal of Manufacturing and Materials Processing. 2023; 7(3):96. https://doi.org/10.3390/jmmp7030096
Chicago/Turabian StyleJaksch, Andreas, Simon Cholewa, and Dietmar Drummer. 2023. "Thin-Walled Part Properties in Powder Bed Fusion of Polymers—A Comparative Study on Temperature Development and Part Performance Depending on Part Thickness and Orientation" Journal of Manufacturing and Materials Processing 7, no. 3: 96. https://doi.org/10.3390/jmmp7030096