1. Introduction
Powder-based additive manufacturing is revolutionising the manufacturing industry due to the ability to create unprecedented structural components layer-by-layer not otherwise achievable [
1]. The main limitation of powder-based methods is the actual maximum size of the printable components, along with low deposition rates, resulting in a time-consuming process [
2,
3]. Therefore, arc-DED (directed energy deposition) using wire as feedstock has emerged for printing large structures [
4,
5]. Amongst the available heat sources [
6,
7], plasma metal deposition offers higher deposition rates and a better temperature control as well as higher depth-to-width ratios compared to other arc-DED processes [
8,
9]. These are especially relevant for Al alloys, which are notoriously difficult to deposit [
10,
11,
12]. Specifically, the main problem in additive manufacturing of Al alloys is related to the thin layer of alumina, which has a remarkably higher melting temperature (i.e., 2037 °C [
10]) compared to Al (i.e., 660 °C), present on the surface of the feedstock wire. The ability of plasma metal deposition to work with alternating current allows the circumvention of the oxide layer problem. The reverse polarity part of the cycle (i.e., positive electrode) permits the elimination of the alumina layer, whilst the straight polarity part of the cycle (i.e., negative electrode) is used to melt and deposit the Al alloy [
13].
Attempts to use arc-DED methods to additively manufacture Al alloys are available in the literature; however, contrasting results have been reported. In particular, using cold metal transfer equipment, Ryan et al. [
14] reported that the travel and wire feed speeds deposition parameters did not have a significant influence on porosity for the 2319 alloy. It was found that the formation of the porosity was due to the presence of dissolved hydrogen, which was primarily related to the surface finishing of the feedstock wire. Conversely, Hauser et al. [
15] demonstrated a close relationship between the porosity and the deposition parameters, where the surface finish and arc stability were the most important parameters related to the travel speed, and higher shielding gas flow rates with higher velocities led to more pores.
The higher the feed-to-travel speed ratio, the higher the amount of porosity generated. This was justified by analysing the geometry of the deposited track, as higher diffusion paths are needed in wider tracks for the hydrogen to reach the surface during cooling. Furthermore, Hauser et al. [
16] proved that porosity decreased if the molten pool remained liquid as long as possible (i.e., slow solidification rate) so that hydrogen has enough time to escape [
17]. Nonetheless, using gas tungsten arc welding, Zhou et al. [
18] showed that increasing the travel speed increased the solidification rate and reduced the heat input, resulting in the refinement of the grain size and the attendant reduction of the porosity [
19,
20]. It is worth mentioning that other deposition-technique-dependent parameters such as the input current, current/voltage ratio, and equipment power have an effect and have been considered [
21,
22,
23]. Furthermore, a preheating of the deposition substrate also affects the solidification pathways, and thus the resultant porosity and microstructure, but this has been far less investigated [
24].
It Is well known that the main cause of porosity in Al is the hydrogen released during solidification, due to the difference in the solubility of hydrogen in liquid (0.69 cm
3 per 100 g) and solid Al (0.036 cm
3 per 100 g) [
14,
16,
17]. The porosity formed upon solidification during additive manufacturing is crucial, as it decreases the mechanical properties of the material and reduces the robustness and reliability of arc-DED processes as potential commercial methods [
2]. Apart from deposition parameters, the absorption of hydrogen and the associated formation of porosity are affected by the shielding gas [
25]. The most common shielding gas is Ar, but He, though more expensive and lighter, resulting in the need of higher shielding gas flow rates [
25], permits higher heat inputs. Thus, the ionization potential and thermal conductivity of Ar/He mixtures is much higher comparted to Ar. Moreover, a similarly enhanced thermal energy transmission during deposition can also be achieved via the addition of N to Ar, but these have not been extensively studied.
From the literature, conflicting results on the effect of deposition parameters, including the deposition speed, wire feed speed, and input current, on the quality of additively manufactured Al walls have been reported due to the interdependence of these parameters in combination with other less-investigated factors such as shielding gas mixtures and substrate preheating, where all of these aspects are arc-DED-process-specific, as characterised by different types of transfer [
15,
16,
17,
18]. Therefore, this study seeks to clarify the interrelationship between these parameters when plasma metal depositing Al alloys and explore their influence to study the feasibility of advanced plasma manufacturing technology in the production of structural metal components. As arc-DED methods take advantage of commercially available welding wire, the study was performed using a commercial 2319 alloy, which has recently been proposed for building additively manufactured Al alloy components [
26,
27].
2. Experimental Procedure
The material used in the study included a commercial rectangular (200 × 100 × 10 mm
3) AA5083 substrate and a commercial 1.2 mm diameter AA2319 wire, supplied by MIGAL.CO GmbH, whose chemical compositions are reported in
Table 1.
The deposition of single-bead 70 mm long tracks to analyse the effect of several input parameters was performed using a commercial plasma metal deposition equipment using a 3.2 mm tungsten + 2% La
2O
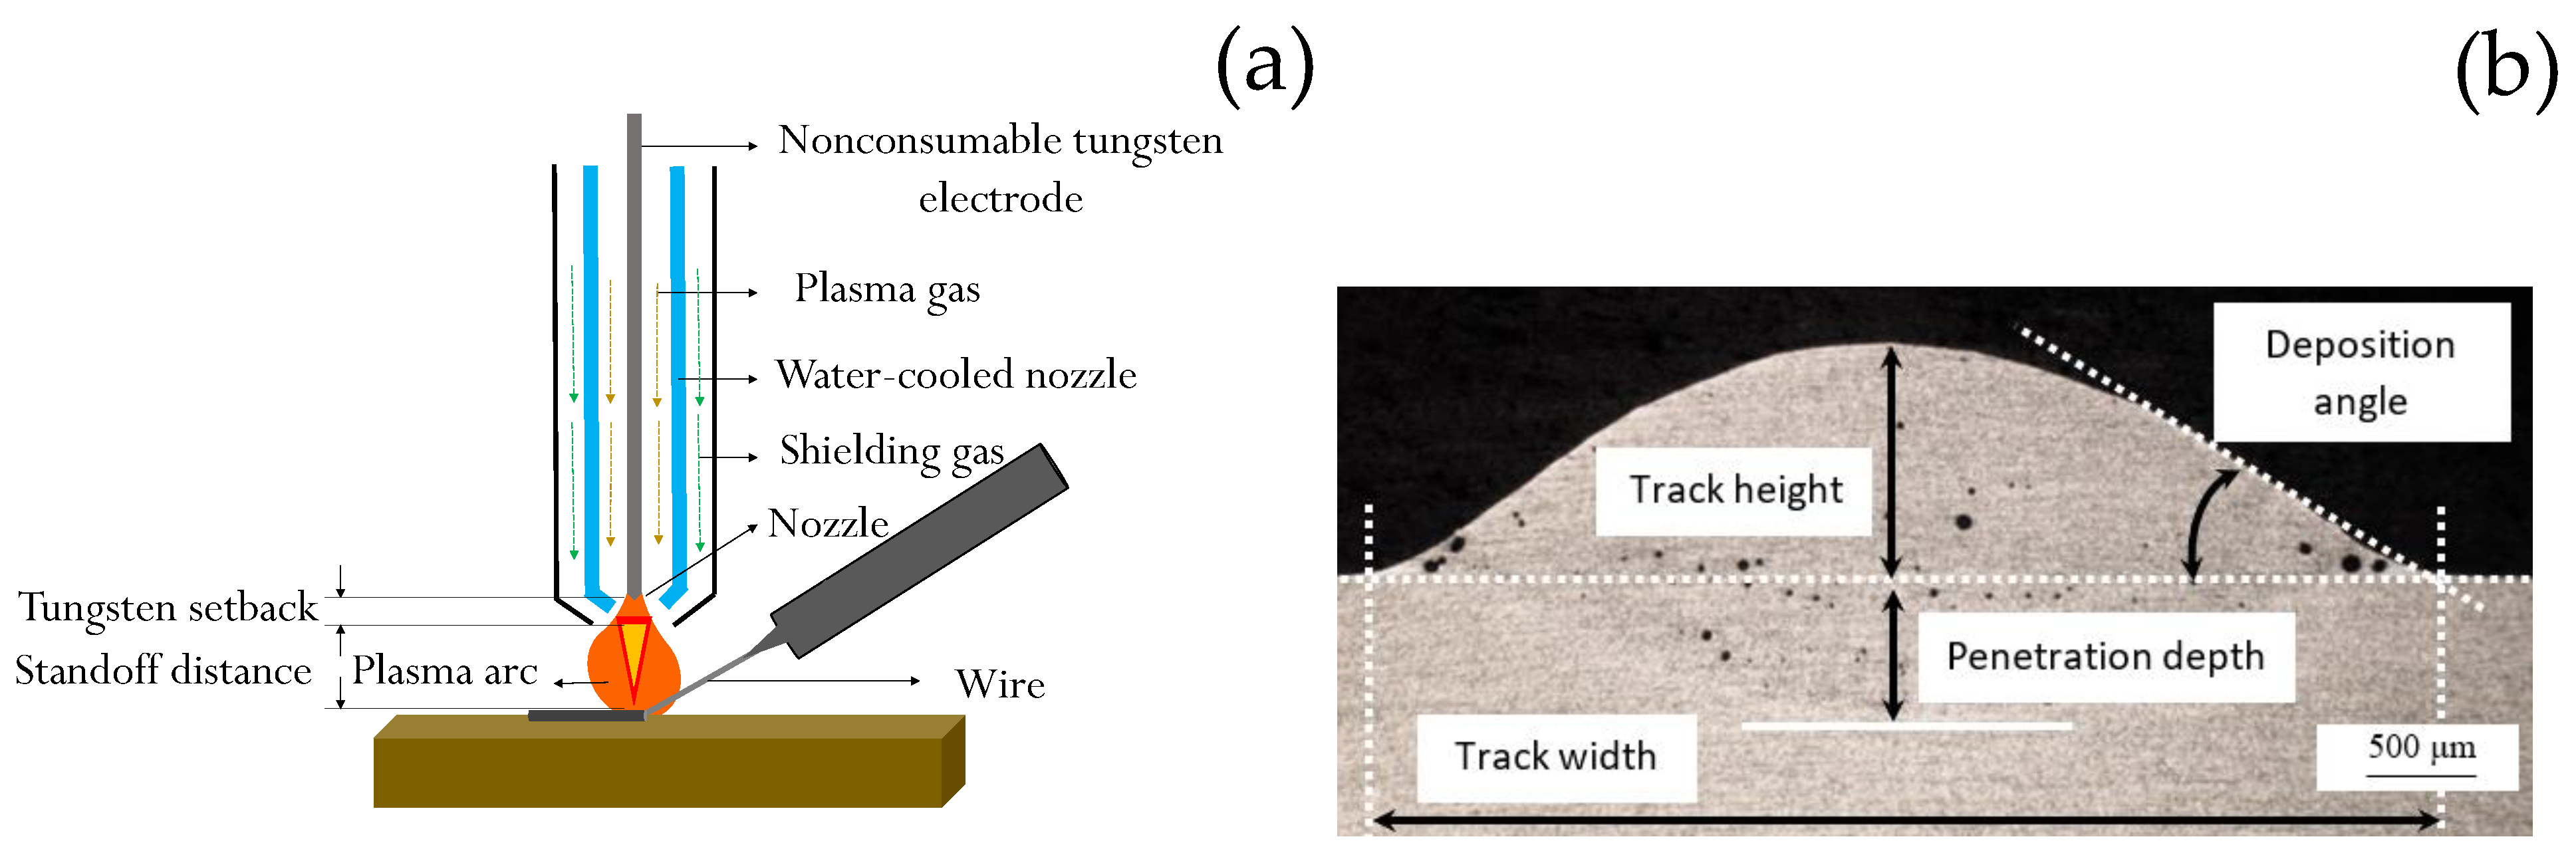
3 electrode, a 2.6 mm nozzle, 2.3 mm as the electrode setback, and 6 mm as the arc length. The welding was performed from left to right (
Figure 1a).
A series of single-bead track experiments was designed by taking into account the effect of three input parameters on the quality of the deposited material. Specifically, the analysed input current, deposition rate, and wire feed speed were, respectively, 110–180 A, 100–220 mm/min, and 0.7–1.1 m/min. The intervals used for the input parameters was selected according to previous work developed on plasma metal deposition for light alloys [
28]. Three single-bead tracks were made for each combination of parameters showing an average of the experimental measurements. The relevant deposition aspects of the single-bead tracks quantified included height, width, penetration depth, and deposition angle, as defined in
Figure 1b. For that, the samples were cut and prepared using the standard metallographic procedure. The cross section of the tracks was observed using a Nikon Epiphot optical microscope (Nikon, Tokyo, Japan) coupled with a Jenoptik Progres C3 camera (Jenoptik, Jena, Germany).
The results of the previous characterisation were used to identify the deposition parameters to utilise to analyse the influence of the shielding gas on the quality of the deposited material. In particular, the effect of independently changing the shielding gas mixture, the shielding gas flow rate, and the plasma gas flow rate was studied. For the former, experiments with high purity Ar, Ar/He15, and Ar/He15/N0.015 mixtures of shielding gas with a fixed shielding gas flow rate of 15 L/min and plasma gas flow of 0.3 L/min were performed. The effect of shielding gas flows of 10 L/min, 15 L/min, and 20 L/min with Ar/He15/N0.015 as a shielding gas mixture and a plasma gas flow of 0.3 L/min was then quantified. Finally, the plasma gas flow rate was varied between 0.2 L/min and 0.8 L/min using the Ar/He15/N0.015 shielding gas mixture and fixing the shielding gas flow rate at 10 L/min.
Lastly, the influence of the waveshape controls (i.e., frequency and balance [
28]) and of the substrate temperature was analysed. For the former, 50–160 Hz frequencies combined with 50–90% balance (i.e., straight polarity/reverse polarity ratio) were studied. For the latter, a substrate preheating temperature of 200 ± 10 °C, achieved by means of a ceramic pad heater, was considered.
3. Results and Discussion
Figure 2 shows the variation of the height, width, penetration depth, and deposition angle of the tracks as a function of the input current, deposition rate, and wire feed speed, respectively. From it, it can be seen that generally, no good straight correlation between the individual input parameters and the measured output deposition track’s quality aspects was found. This is due to the fact that each input parameter affected both the other input parameters as well as the outputs. Nevertheless, from the analysis, it can be inferred that the input current had the strongest effect, followed by the wire feed speed and, finally, the deposition rate. Specifically, the input current had a decreasing impact on the penetration depth, deposition angle, track width and, finally, track height. The highest effect of the wire feed speed was on the track width followed by the deposition angle, penetration depth, and track height. The individual effect of the deposition rate on the track quality seemed negligible.
In order to properly identify independent/dependent variables and represent the cause–effect relationship and the intercorrelations between the individual input parameters and the measured output deposition track’s quality aspects, the response surface methodology was used [
4,
28,
29,
30]. The details of the mathematical modelling performed are available in
Appendix A.
Figure 3 shows the correlation between the measured and predicted values of the output deposition track’s quality aspects. From it, it can be seen that a good relationship between the experimental and the predicted data was obtained with R
2 ≥ 92%, with the exception of the penetration depth, whose R
2 was 87%. A deeper analysis of the data of
Figure 3 by means of an ANOVA test revealed that the input parameter with the highest effect across the deposition outputs was the input current. Moreover,
Table 2 shows the statistically significant (
p < 0.05, Equation (A3),
Appendix A) input parameters for each one of the outputs of the deposition process. The wire feed speed, and its interaction with the input current, was the second input parameter with the highest effect, as it affected all the deposition outputs. The deposition rate was the one found to have the lowest impact on the quality of the deposited track, which was consistent with the results presented in
Figure 2.
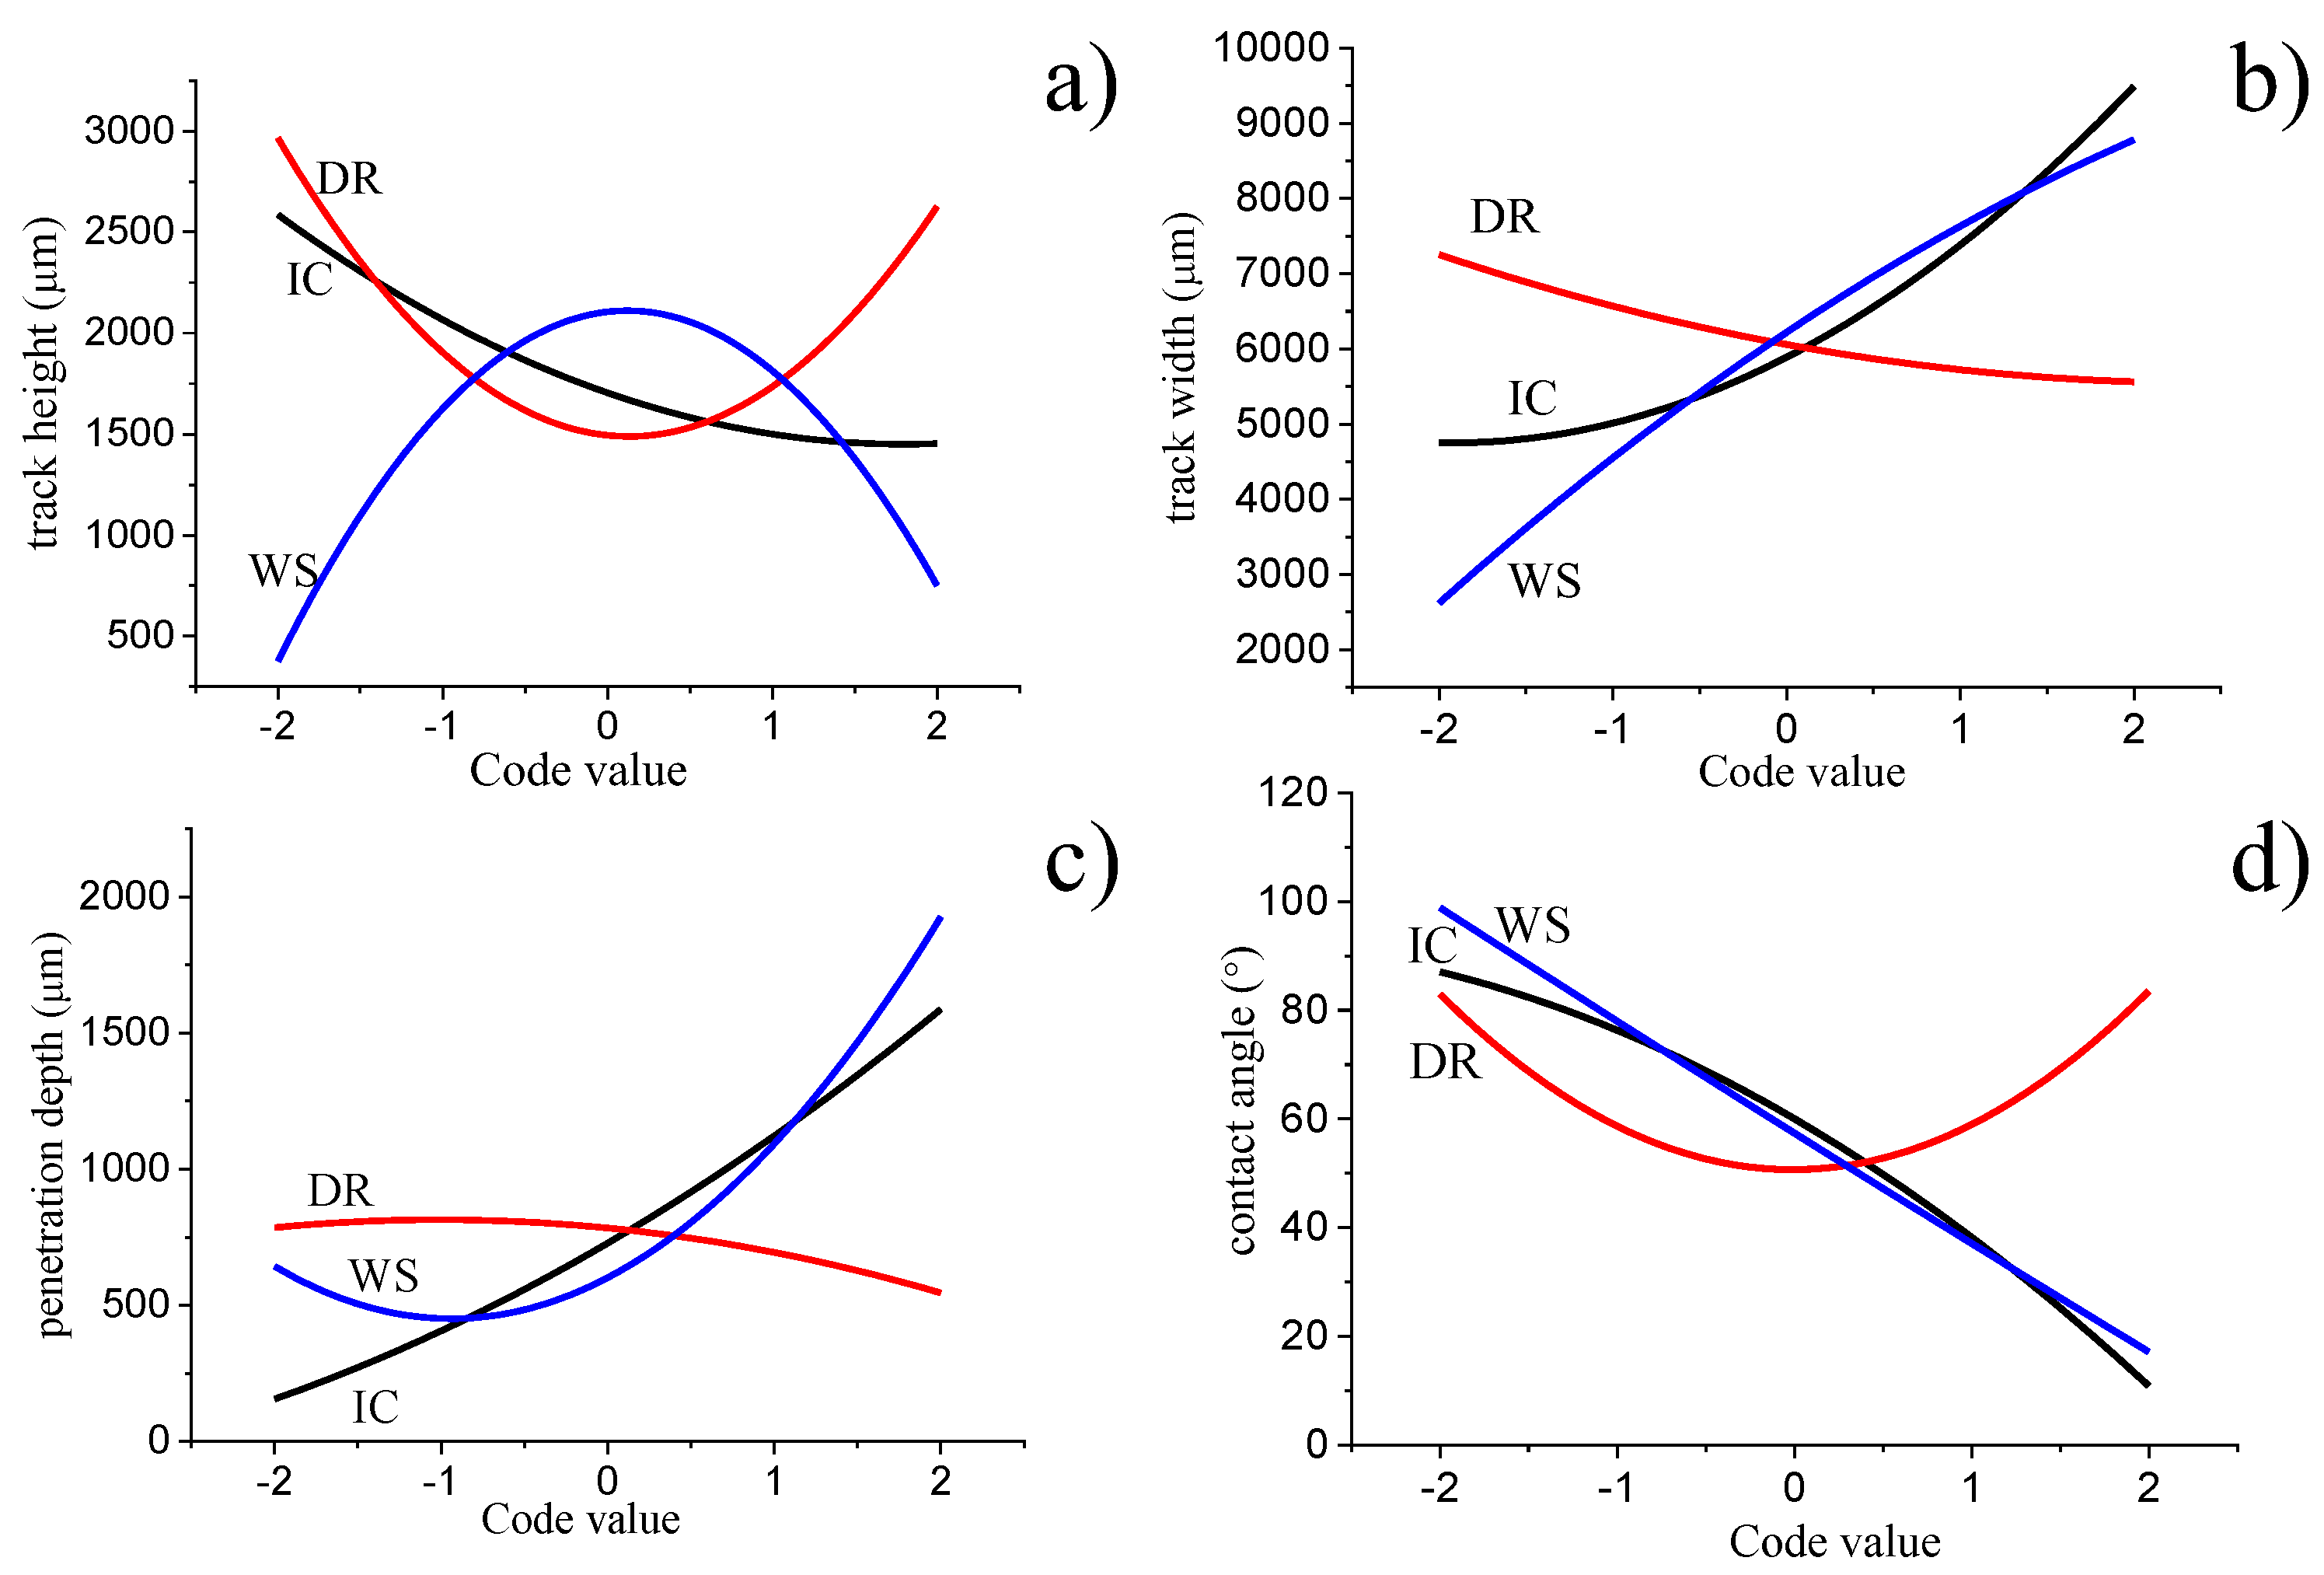
A further clarification of the intercorrelations between the individual input parameters and the measured output deposition track’s quality aspects was gained by simultaneously plotting the predicted responses as a function of the variation of the input parameters, as shown in
Figure 4. It was found that the track height continuously decreased when the input current increase, it initially decreased and then increased with the deposition rate, and it initially increased and then decreased with the wire feed speed (
Figure 4a). This indicated that the deposition rate and wire feed speed had opposite effects on the track height. In the case of the track width (
Figure 4b), increasing either the input current or the wire feed rate increased the width; however, increasing the deposition rate led to the opposite effect. The same trends were also applicable to the penetration depth (
Figure 4c), which increased with the increment of the input current and wire feed speed and decreased with the increment of the deposition rate. Regarding the deposition angle (
Figure 4d), generally, the increase of the input parameters led to a decrease; however, the deposition angle started to increase again when the deposition rate was higher than a specific threshold value (i.e., 140 mm/min in this study).
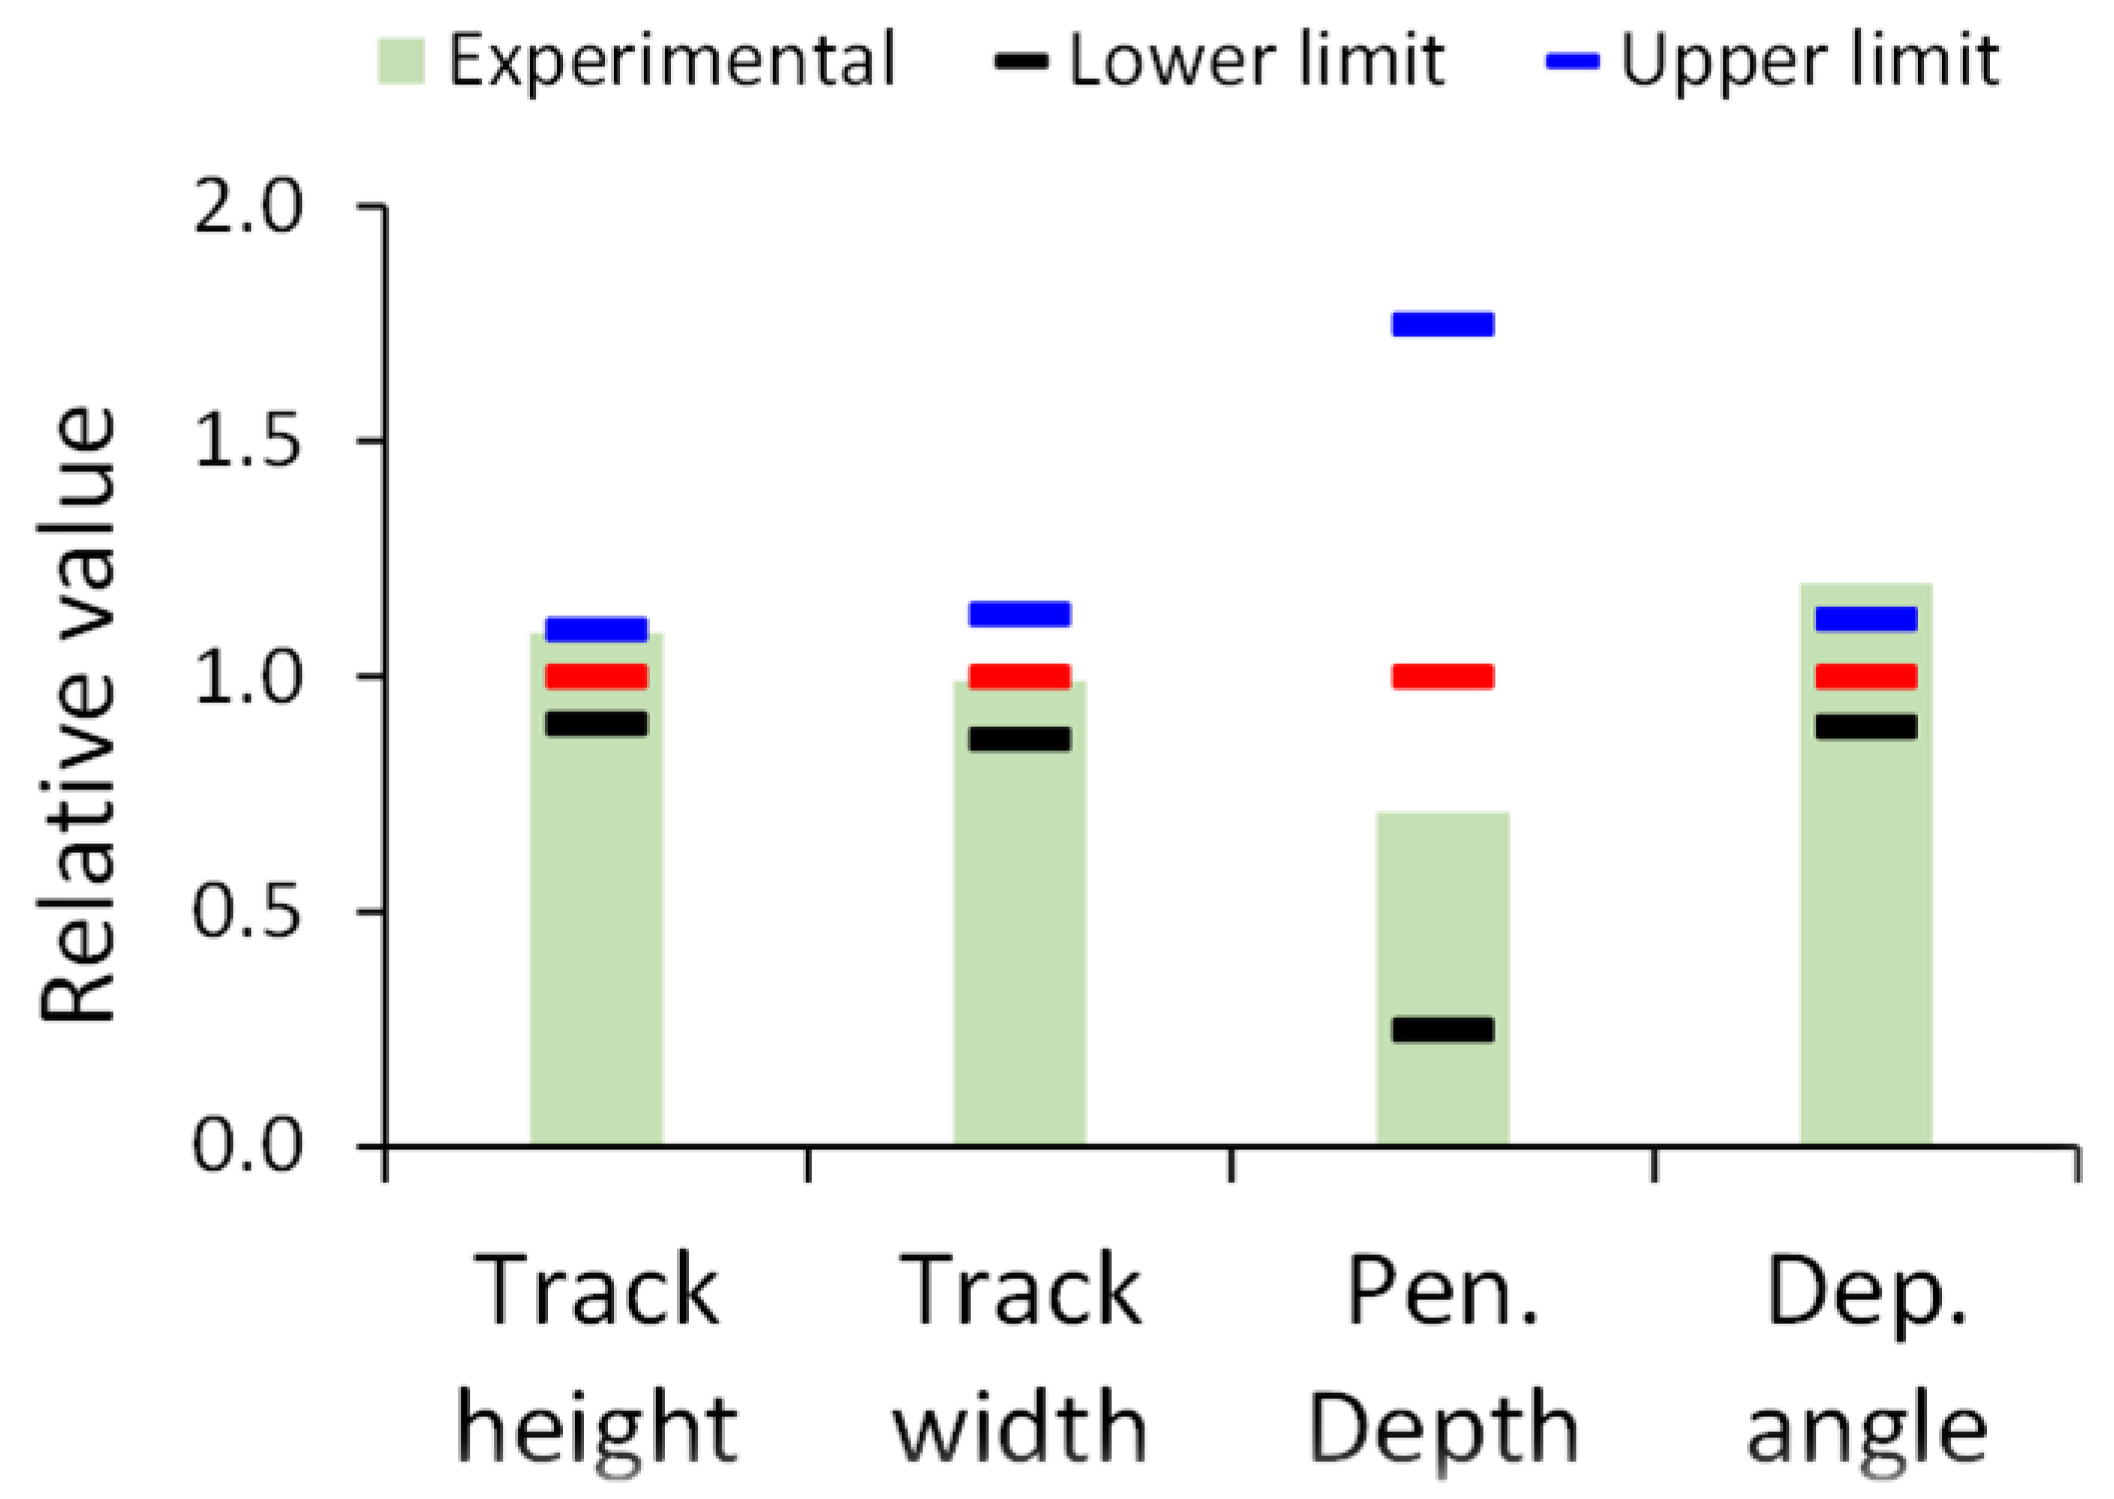
The simultaneous analysis of the previously described intercorrelations using the multiple-response prediction function indicated that the optimum parameters to guarantee the ability to actually 3D-print layer-by-layer walls via plasma metal deposition were an input current of 120 A, a deposition rate of 140 mm/min, and a wire feed speed of 0.9 m/min. Specifically, these would allow us to build a wall with the minimum required track width combined with a maximised track height (i.e., faster building time), minimised penetration depth (i.e., to ensure a structural connection between the layer), and minimised deposition angle (i.e., to ensure the wettability of the molten metal with previously deposited layers). Using the identified parameters, confirmation experiments were run, and the results are summarised, in terms of relative values compared to the predicted one, in
Figure 5. It was found that, with the exception of the deposition angle, the experimental values of the output deposition track’s quality aspects were close to the predicted value and within the 95% confidence interval (i.e., lower and upper limits). The experimental track height and deposition angle were actually higher than the respective predicted value; however, the former was within the limits whereas the latter was not. Moreover, the experimental track width was the same as the predicted one whilst the penetration depth was lower. Despite these discrepancies, it can be stated that the model was reliable, being on the safer side, guaranteeing the correct track width, a slightly higher-than-expected height, a lower penetration depth, and a higher deposition angle, which are all beneficial to build interconnected deposited layers.
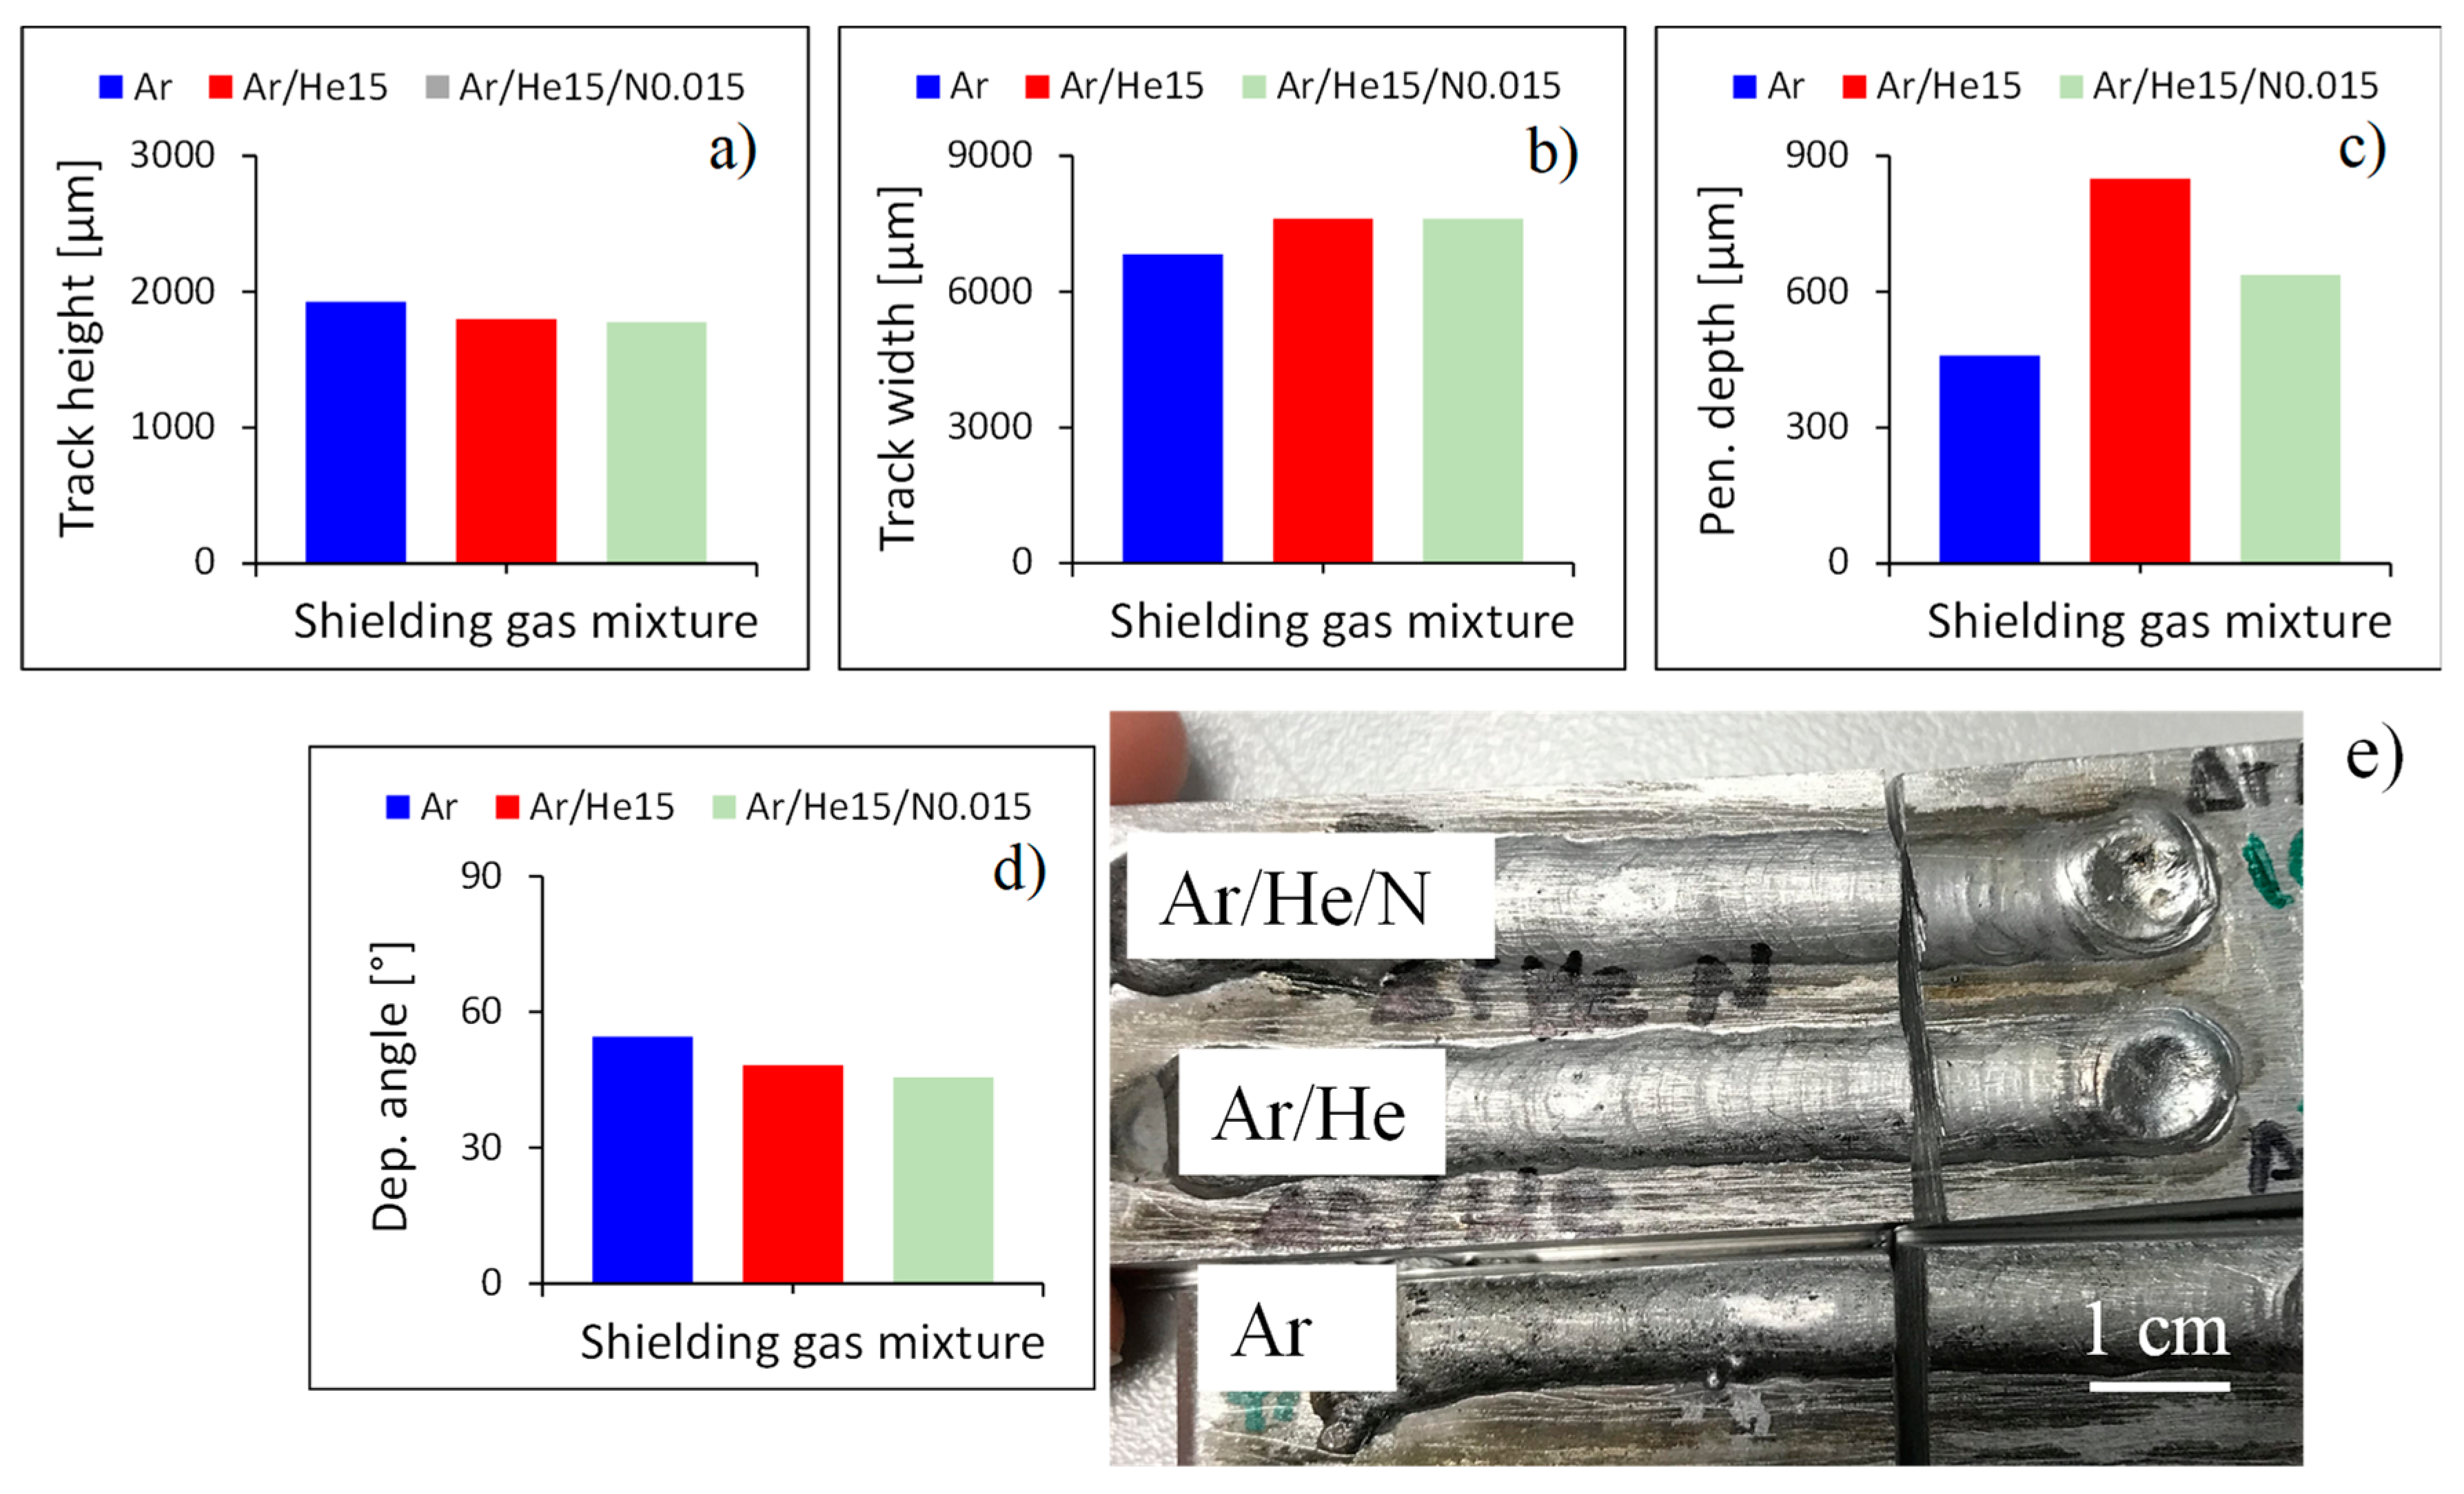
Once their efficacy was confirmed, the optimized deposition parameters were used to investigate the effect of the shielding gas mixture. Changing the shielding gas from Ar to Ar/He15 and eventually to Ar/He15/N0.015 had a minor effect on the track height and on the deposition angle, both of which slightly decreased, as can be seen in
Figure 6. Conversely, the track width increased and there was a much more significant effect, especially when He was jointly flowed with Ar (
Figure 6b). Nevertheless, the highest impact of the shielding gas mixture was on the penetration depth (
Figure 6c) due to the much higher heat introduced on the track. Consequently, the highest penetration depth was obtained when the Ar/He15 mixture was used, whilst the extra addition of a small amount of nitrogen reduced the penetration depth. It is worth mentioning that, regardless of the shielding gas mixture used, well deposited tracks with a consistent profile, a good surface finishing as well as minimal sputtering, and no visible porosity on the surface were attained.
Using the same optimized deposition parameters, the effect of changing the shielding gas flow rate was also studied and the results are shown in
Figure 7 where it can be seen that increasing the shielding gas flow rate slightly affected both the track height and the deposition angle, both of which monotonically decreased. As in the case of the shielding gas mixture, the track width had the opposite trend of the previous two aspects, and therefore it increased with the increment of the shielding gas flow rate (
Figure 7b). Once again, the most drastic effect of changing one aspect of the protective atmosphere was on the penetration depth, which, in that case, actually continuously increased as the shielding gas flow rate was increased (
Figure 7c). With respect to the quality of the deposited tracks,
Figure 7e shows that despite achieving good tracks, a too-high shielding gas flow rate (i.e., 20 L/min in this study) led to the formation of superficial pores due to the excess energy supplied, whilst a too-slow shielding gas flow rate (i.e., 10 L/min in this study) generated metallic oxides [
31] identified as black spots and commonly known as smuts [
32]. They form due to the evaporation of the Al and Mg of the 2319 alloy, as their boiling point is lower than the temperature of the deposition plasma [
33].
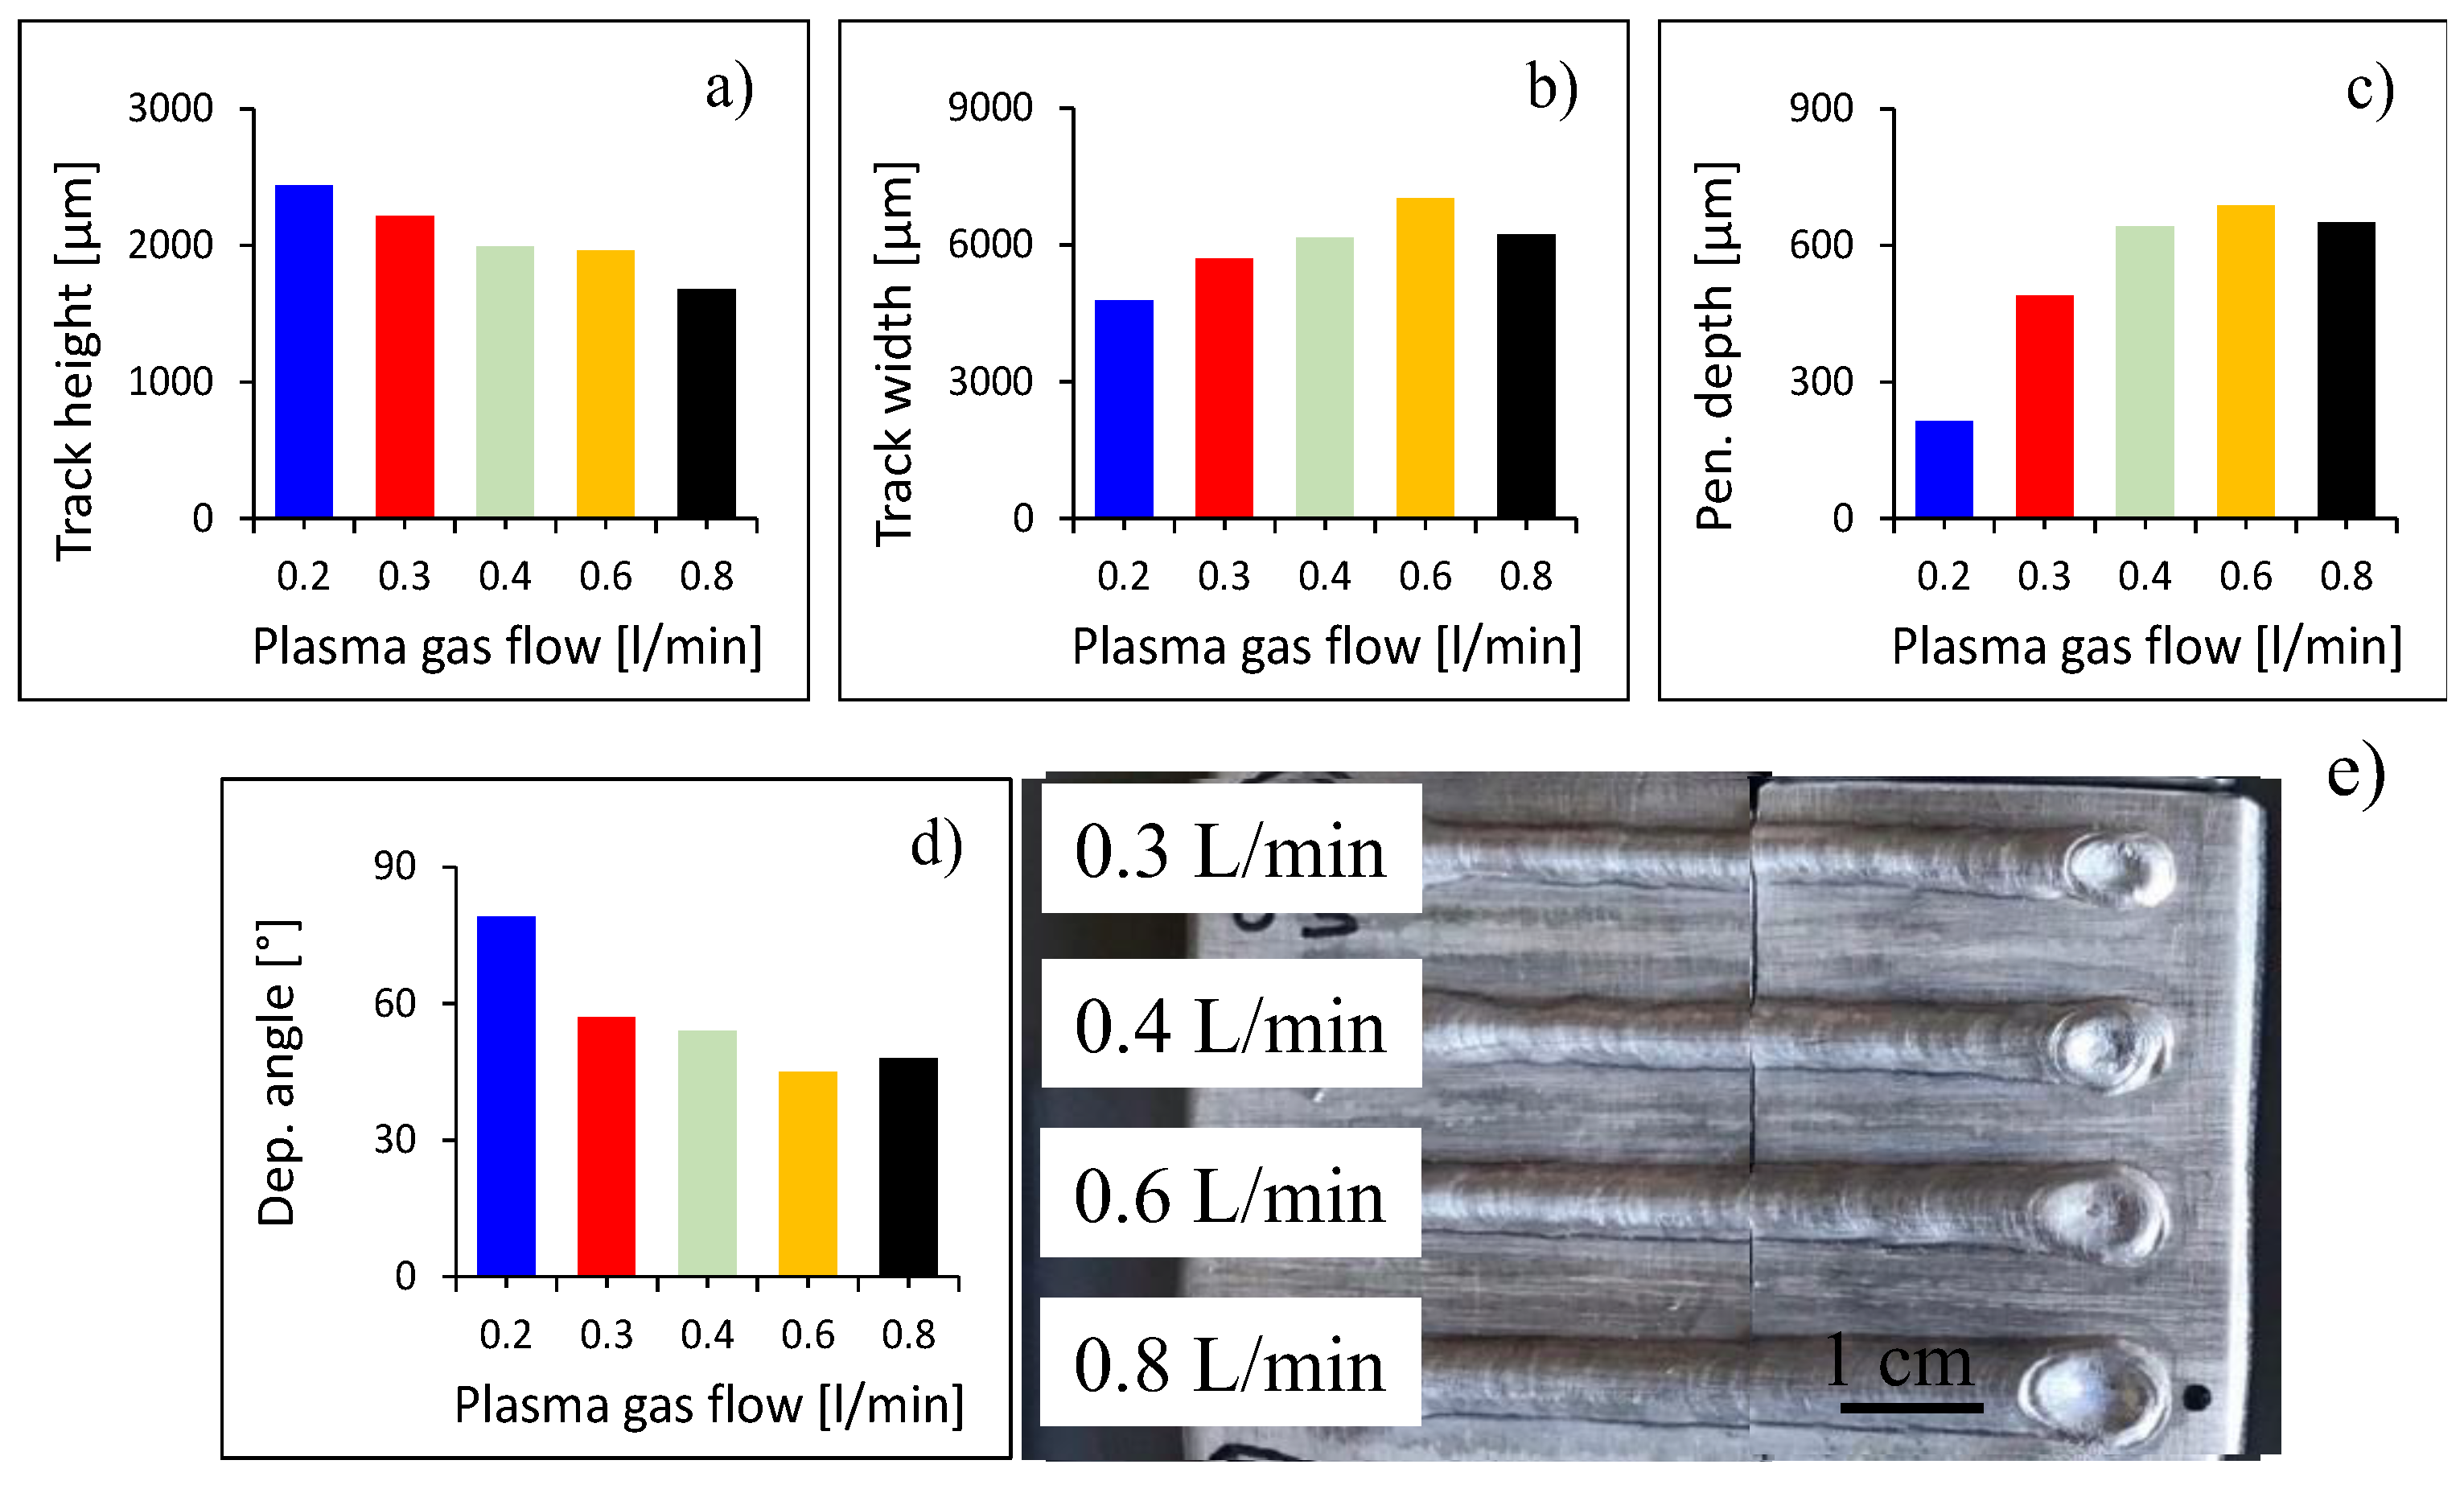
Finally, by means of the same optimized deposition parameters, the plasma gas flow was changed to understand how it affected the deposition outputs, as a higher plasma flow rate results in a proportionally higher heat input confined within the track.
Figure 8a shows that the increase of the plasma flow rate led to the monotonic decrease of the track height. Moreover, the plasma flow rate had the same effect on both the track width and penetration depth as they both increased with the progressive increment of the plasma flow rate; however, they both started to decrease once a threshold value was reached, which, in this study, was identified as 0.6 L/min. Regarding the deposition angle, the trend was the opposite of the one just described, as the angle progressively decreased as the plasma flow rate increased, but it started to increase after using a plasma flow rate of 0.6 L/min (
Figure 8d). In terms of appearance and uniformity of the deposited tracks,
Figure 8e shows that there were no clear visible defects and inconsistencies independently of the actual plasma flow rate used.
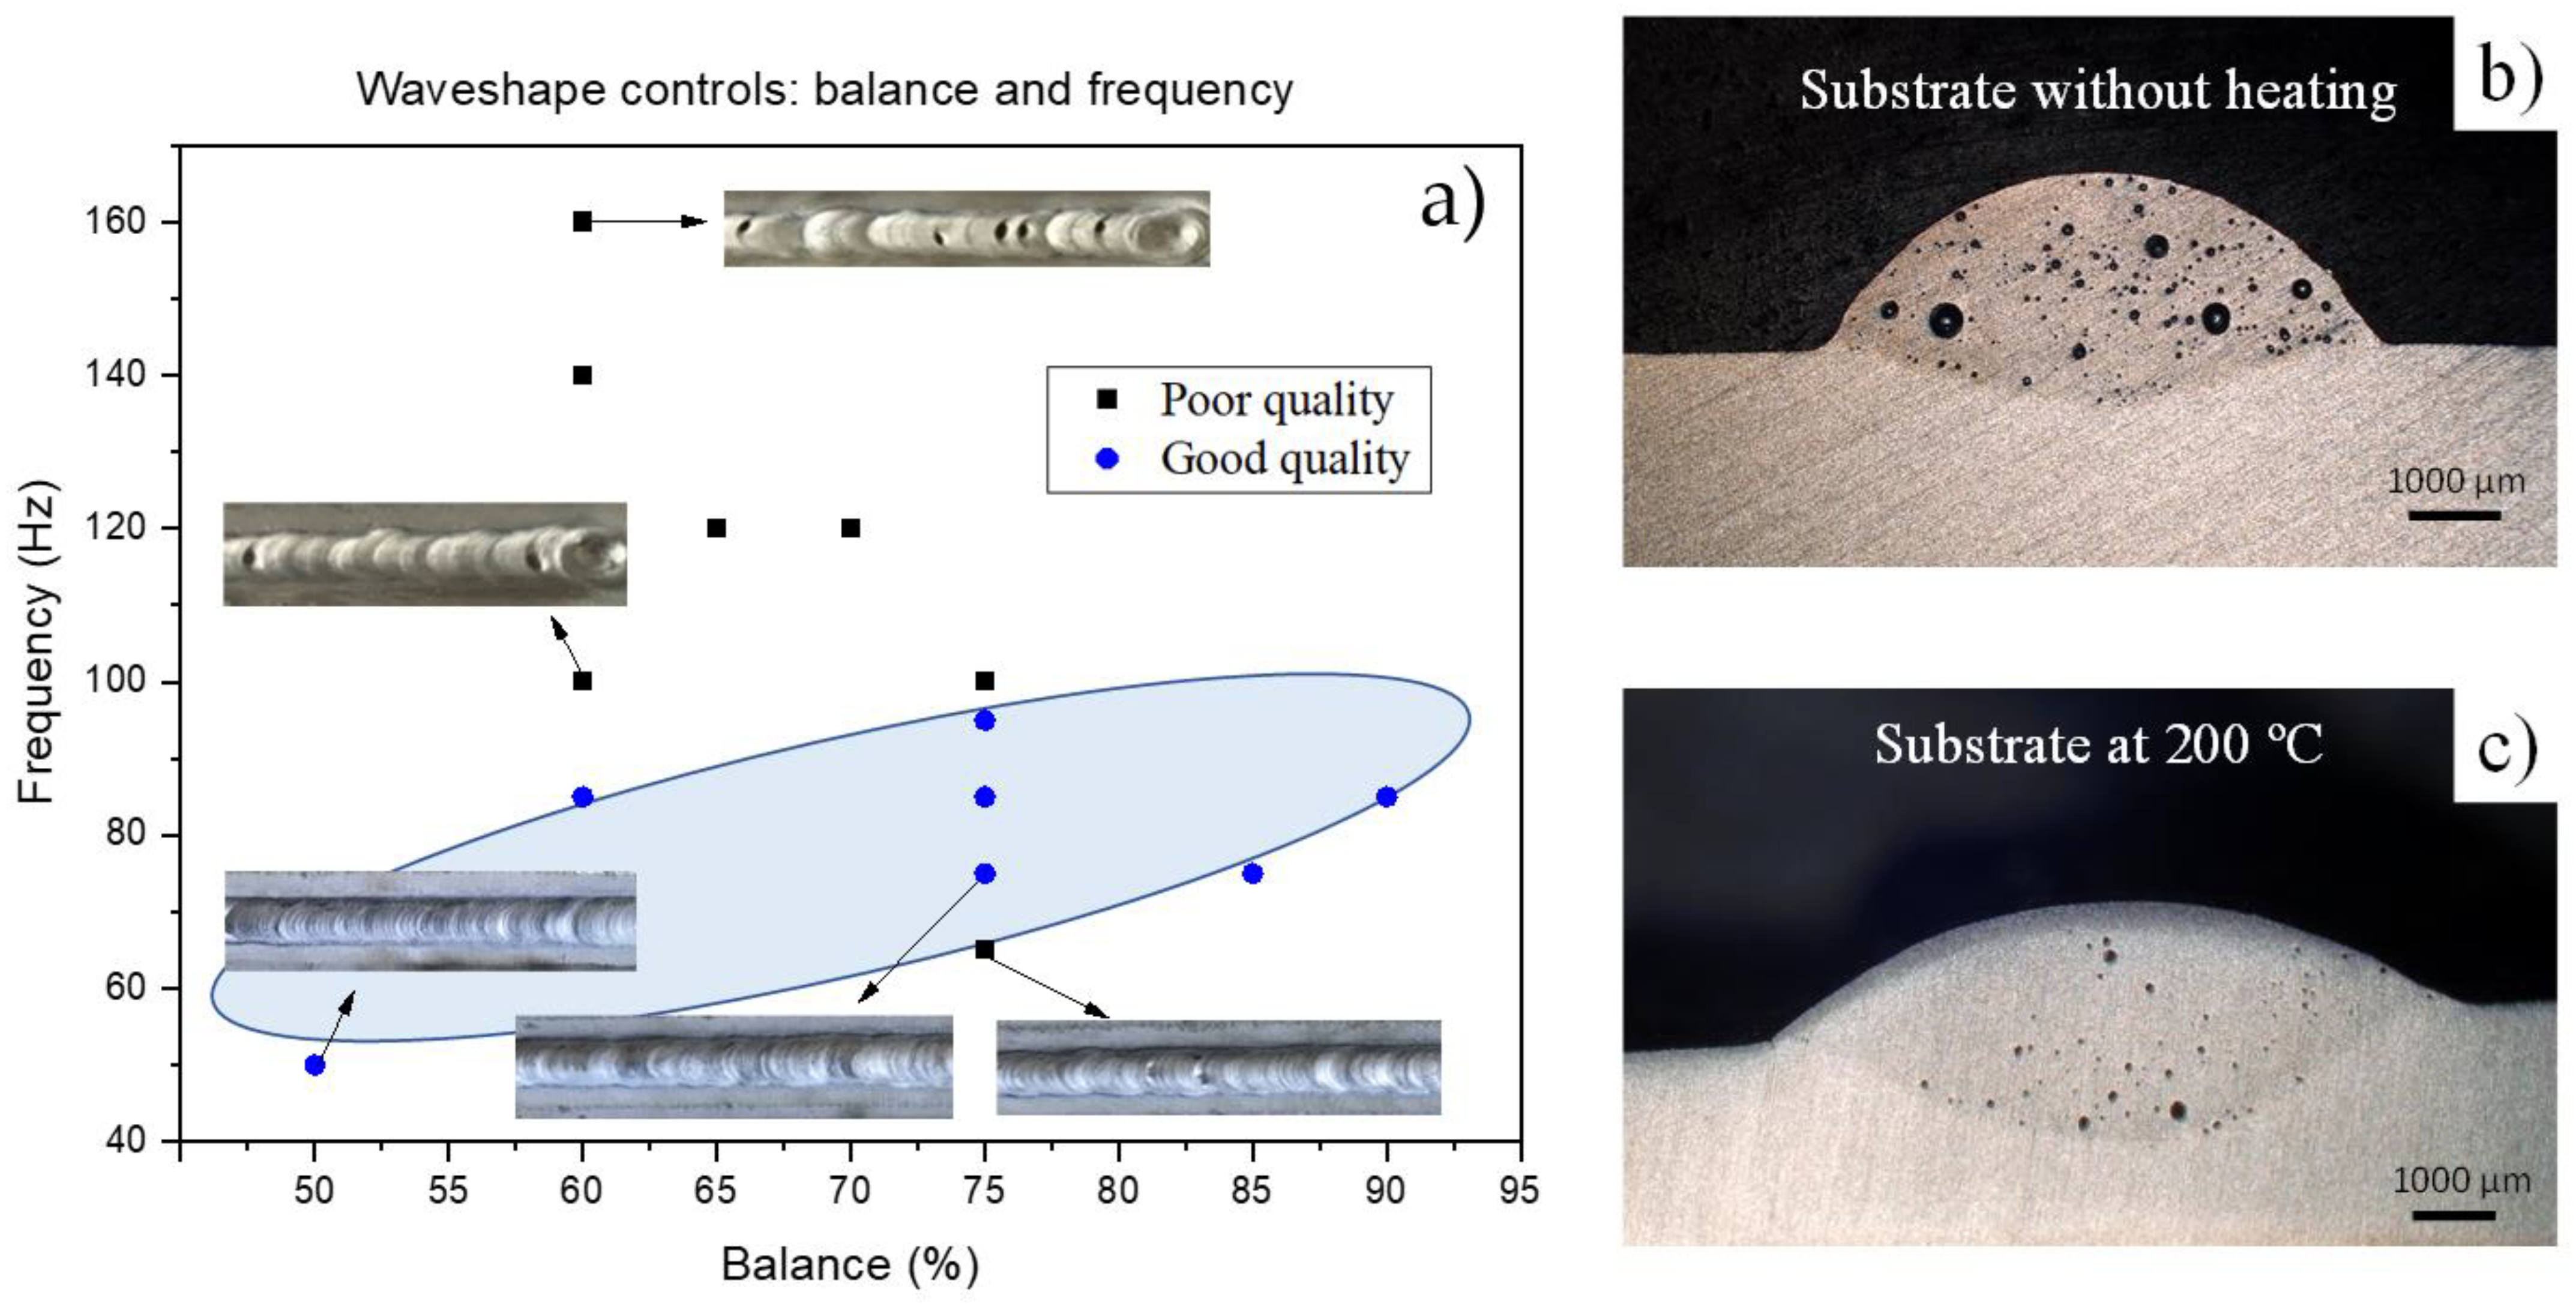
Optimised input parameters combined with optimum shielding gas atmosphere (i.e., Ar/He15/N0.015 shielding gas mixture, 15 L/min shielding gas flow rate, and 0.3 L/min plasma gas flow) were used to understand the effect of the waveshape controls and of the substrate temperature. The effects of balance and frequency on the weld track geometry were studied. A visual inspection or external appearance criteria were considered to determine the good quality of the single tracks. The results of such characterisation are presented in
Figure 9a and the main findings can be summarised as the use of a too-high frequency, regardless of the balance used, leading to the deposition of poor-quality track characterised by inconsistent deposited profiles and the formation of large superficial pores. Frequencies in the 50–100 Hz range permitted us to obtain good deposition tracks with a good superficial appearance (shaded area in
Figure 9a), independently of the range of balance investigated, which was between 50% and 90% in the present study. Nevertheless, very low frequencies (e.g., 50 Hz) need to be coupled with low balances (e.g., 50%) in order to achieved good quality deposited tracks. However, it is worth recalling that the use of low frequencies results in wider deposited tracks, as the input heat is spread over the workpiece, whilst the use of high frequencies leads to the deposition of narrower tracks.
Throughout the analysis of the deposited 2319 tracks, it was found that the porosity was always present, where the actual number of pores and their size were significantly affected by the chosen deposition parameters. Amongst other strategies, such as working with low frequency and balance values, which might have drawbacks such as the loss of the shape of the tip of the tungsten electrode, the preheating of the deposition substrates helped in reducing the number of pores formed as seen from the comparison of
Figure 9b,c. This is due to the fact that the preheating of the substrate decreases the actual cooling rate resulting in the deposited material spending longer times at higher temperatures, which is beneficial for eliminating the hydrogen dissolved within the Al matrix upon deposition.
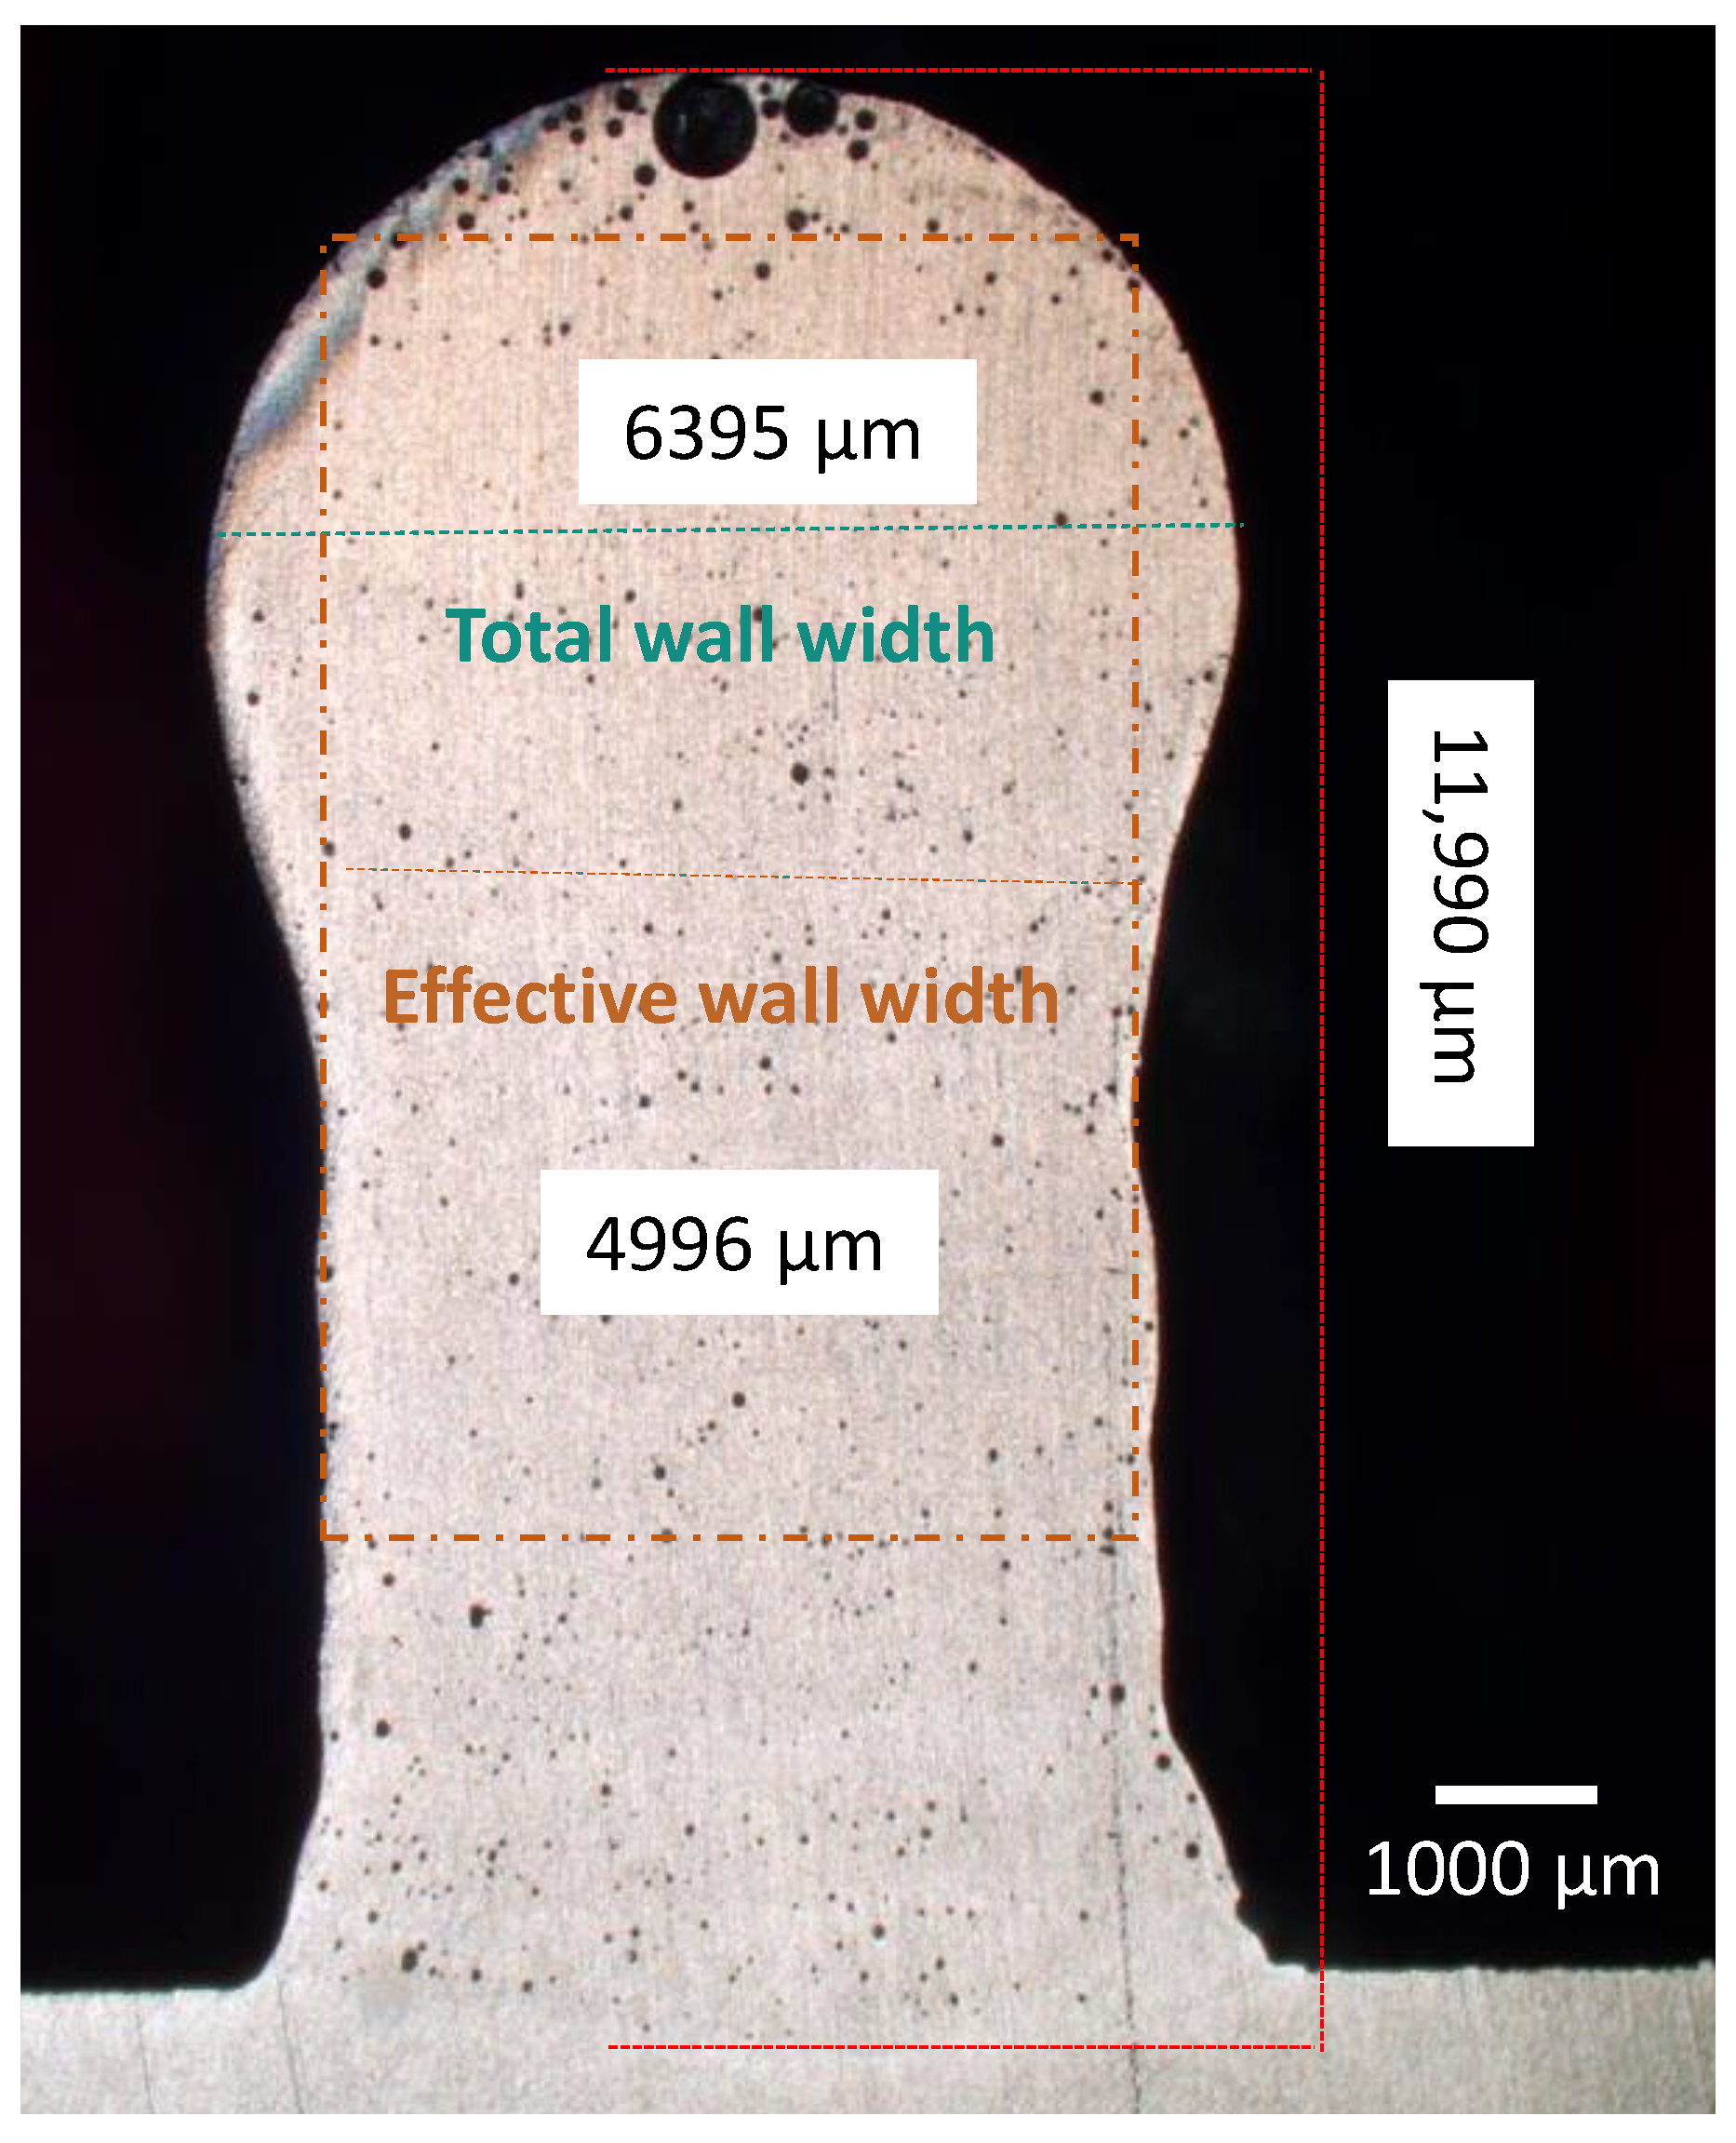
The comprehensive understanding generated via the analysis of the effects and intercorrelations between the deposition parameters, shielding atmosphere, and substrate preheating was eventually used to additively manufacture free-standing multilayer walls. Specifically, the walls were built using an input current of 120 A, a deposition rate of 140 mm/min, a wire feed speed of 0.9 m/min, in combination with a shielding gas mixture of Ar/He15/N0.015, a shielding gas flow rate of 15 L/min, and a plasma gas flow of 0.3 L/min, as well as selecting a frequency of 50 Hz, a balance of 50%, and a preheating temperature of the substrate of 200 °C.
Figure 10 shows a representative image of the cross section of the deposited multilayer walls, which is characterised by a good quality, consistent profile and a minimised amount of gas porosity. This proves the viability of using plasma metal deposition for the creation of additively manufactured components made out of the 2319 Al alloys, used as representative of weldable Al alloys.
4. Conclusions
This study aimed at clarifying the different effects and intercorrelations that the input parameters of plasma metal deposition have on the ability and quality of additively manufactured Al alloys, using the commercial 2319 alloy as a representative. From it, it can be concluded that there was no direct correlation between the individual input parameters investigated (i.e., input current, deposition rate, and wire feed speed) and the measured output deposition track’s quality aspects, which included track height and width, penetration depth and deposition angle. A predicting model analysing the cause–effect relationship and the intercorrelations between the individual input parameters and the measured output deposition track’s quality aspects was successfully developed, permitting us to identify that the input current had the greatest effect on the quality of the deposited tracks. Moreover, the wire feed speed, and its interaction with the input current, was the second input parameter with the highest effect. The prediction was sound, as the experimental values were comparable with the predicted ones. According to the proposed models, the optimal process parameters corresponding to the best responses and results were a welding current of 120 A, a welding speed of 140 mm/min, and a wire feed speed of 0.9 m/min.
It was also found that the shielding gas mixture and shielding gas flow rate mostly affected the penetration depth, whilst the plasma gas flow significantly affected all the measured output deposition track’s quality aspects. Furthermore, the selection of the right frequency/balance ratio and/or preheating of the deposition substrates permitted us to reduce the amount of porosity formed within the deposited tracks, concluding that a stable temperature of the substrate above 200 °C significantly reduced the porosity from pores to micropores. It was finally demonstrated that plasma metal deposition was a suitable additive manufacturing method to deposit multilayer walls made out of Al alloys characterised by a good surface quality, a consistent profile, and a minimised amount of gas porosity.


 ,
, 


