
Multi-Response Optimization and Influence of Expanded Graphite on Performance of WEDM Process of Ti6Al4V
 , , , and
Abstract
:1. Introduction
2. Materials and Methods
2.1. Expanded Graphite Nano-Powder
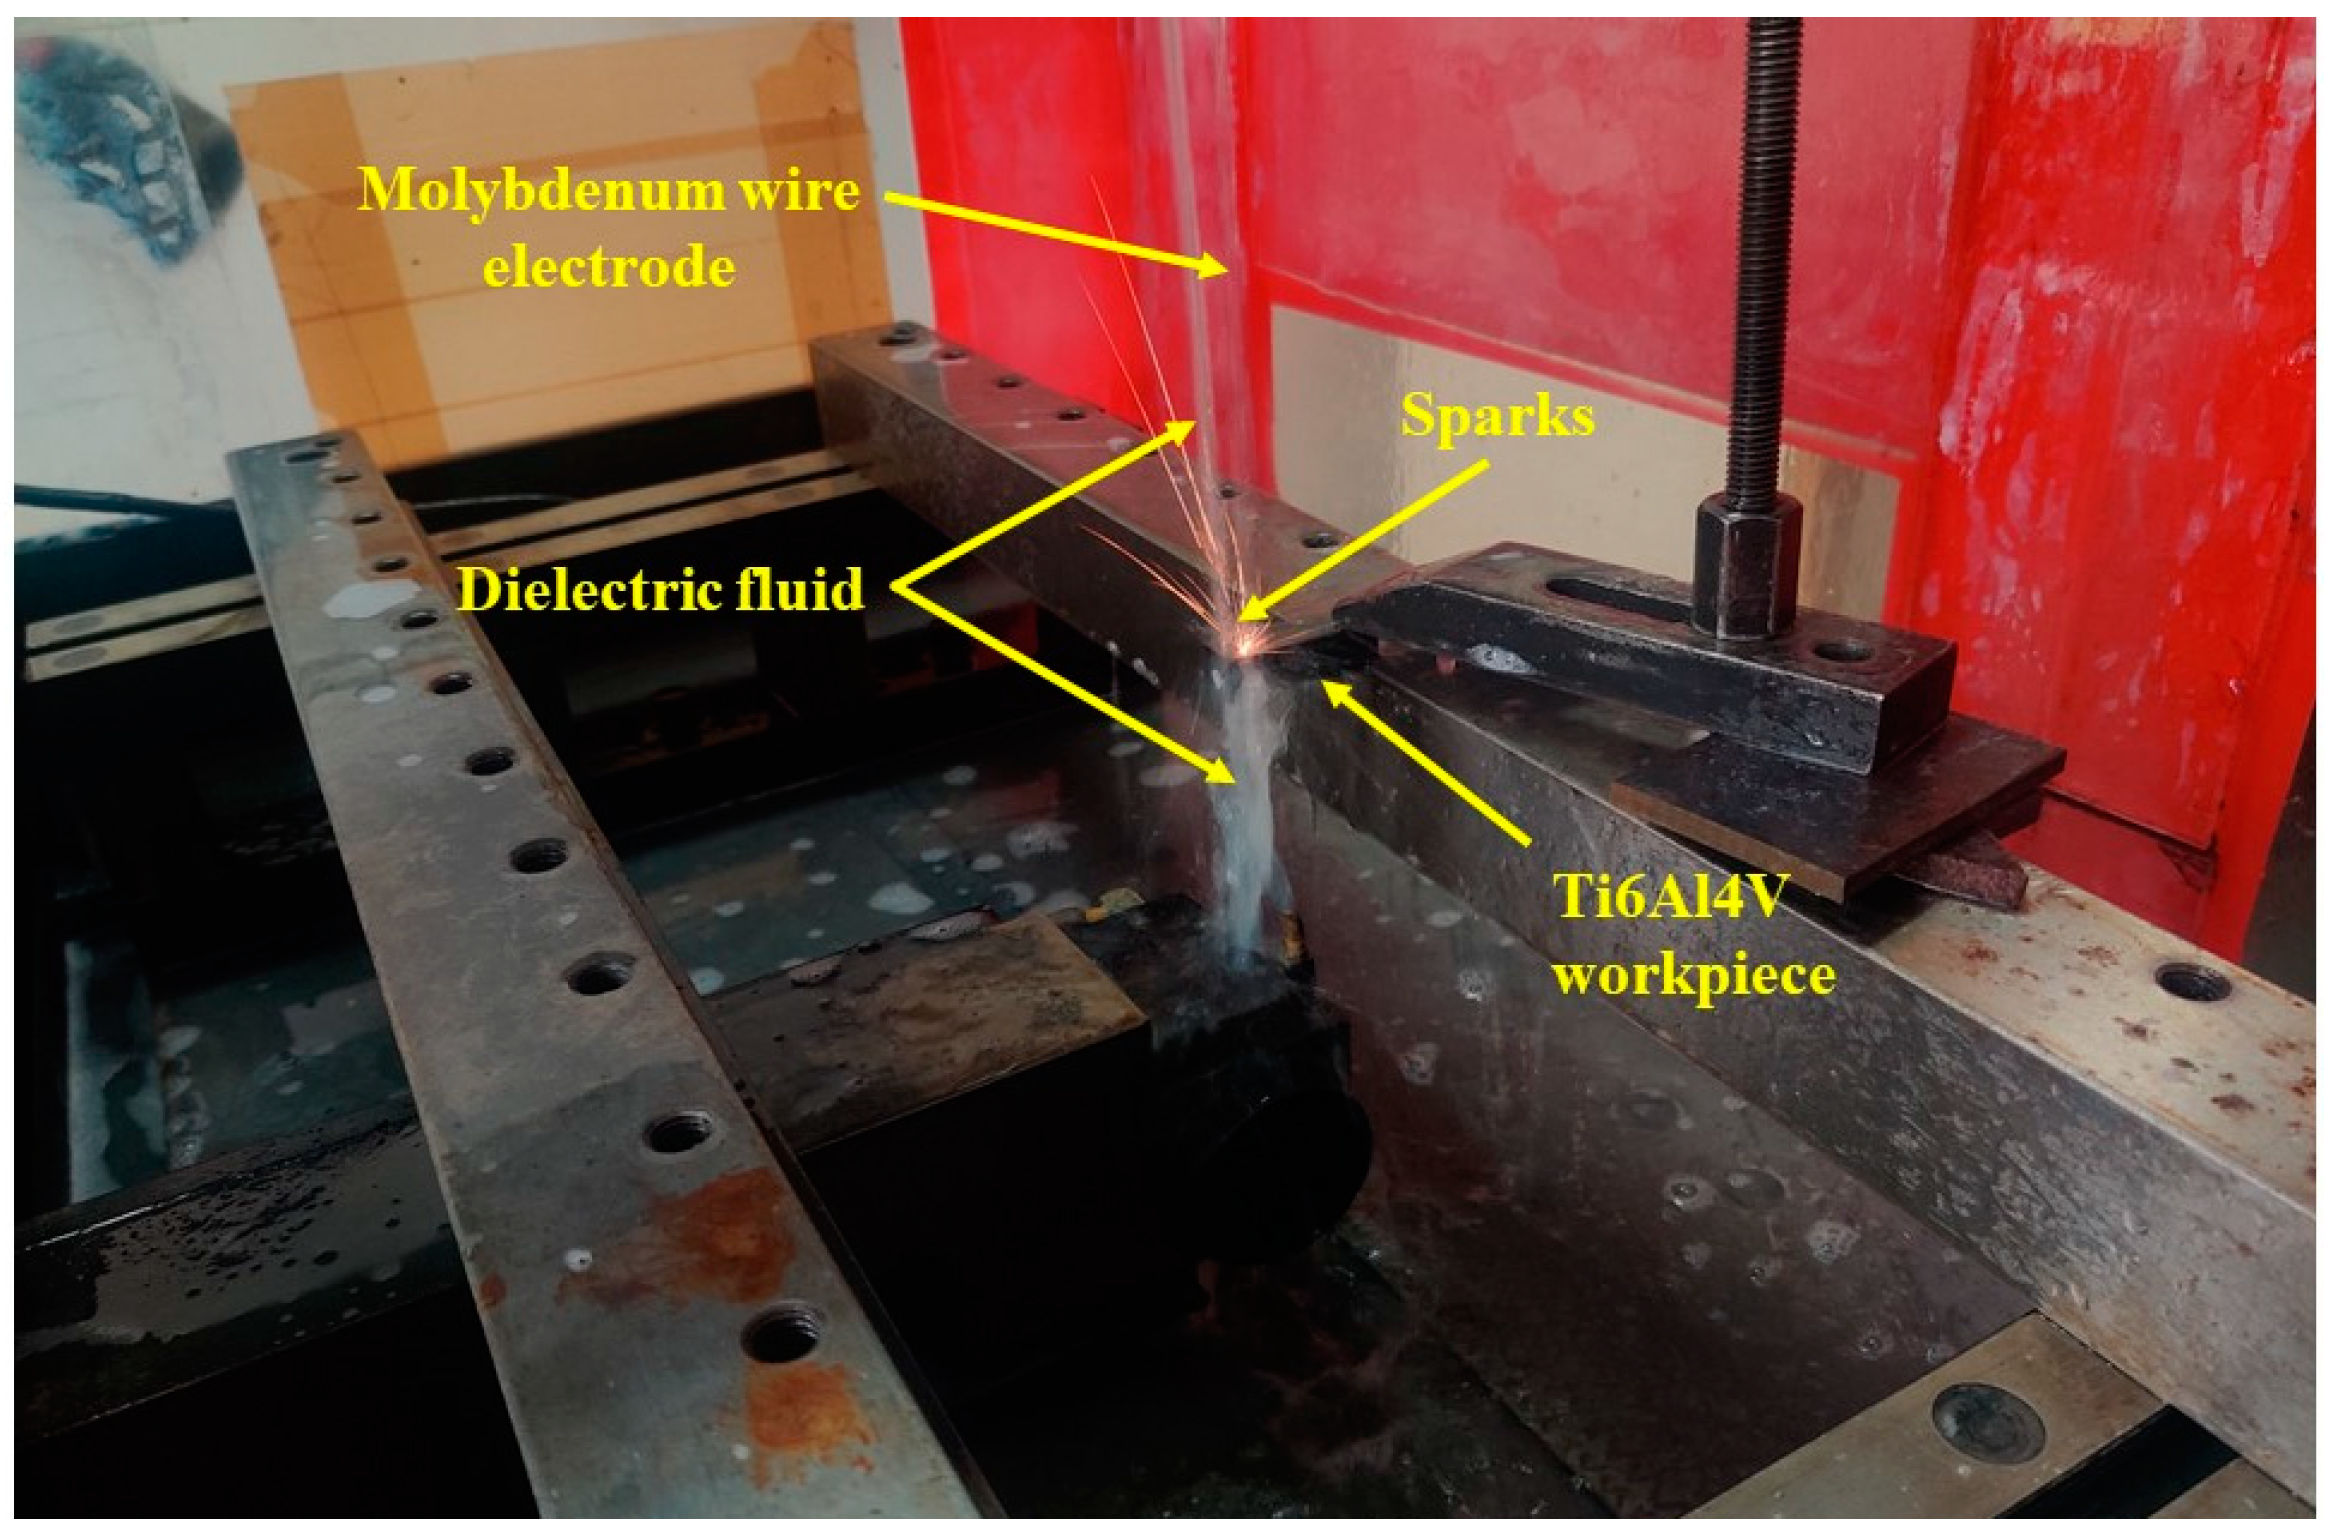
2.2. Experimental Set-Up and Conditions
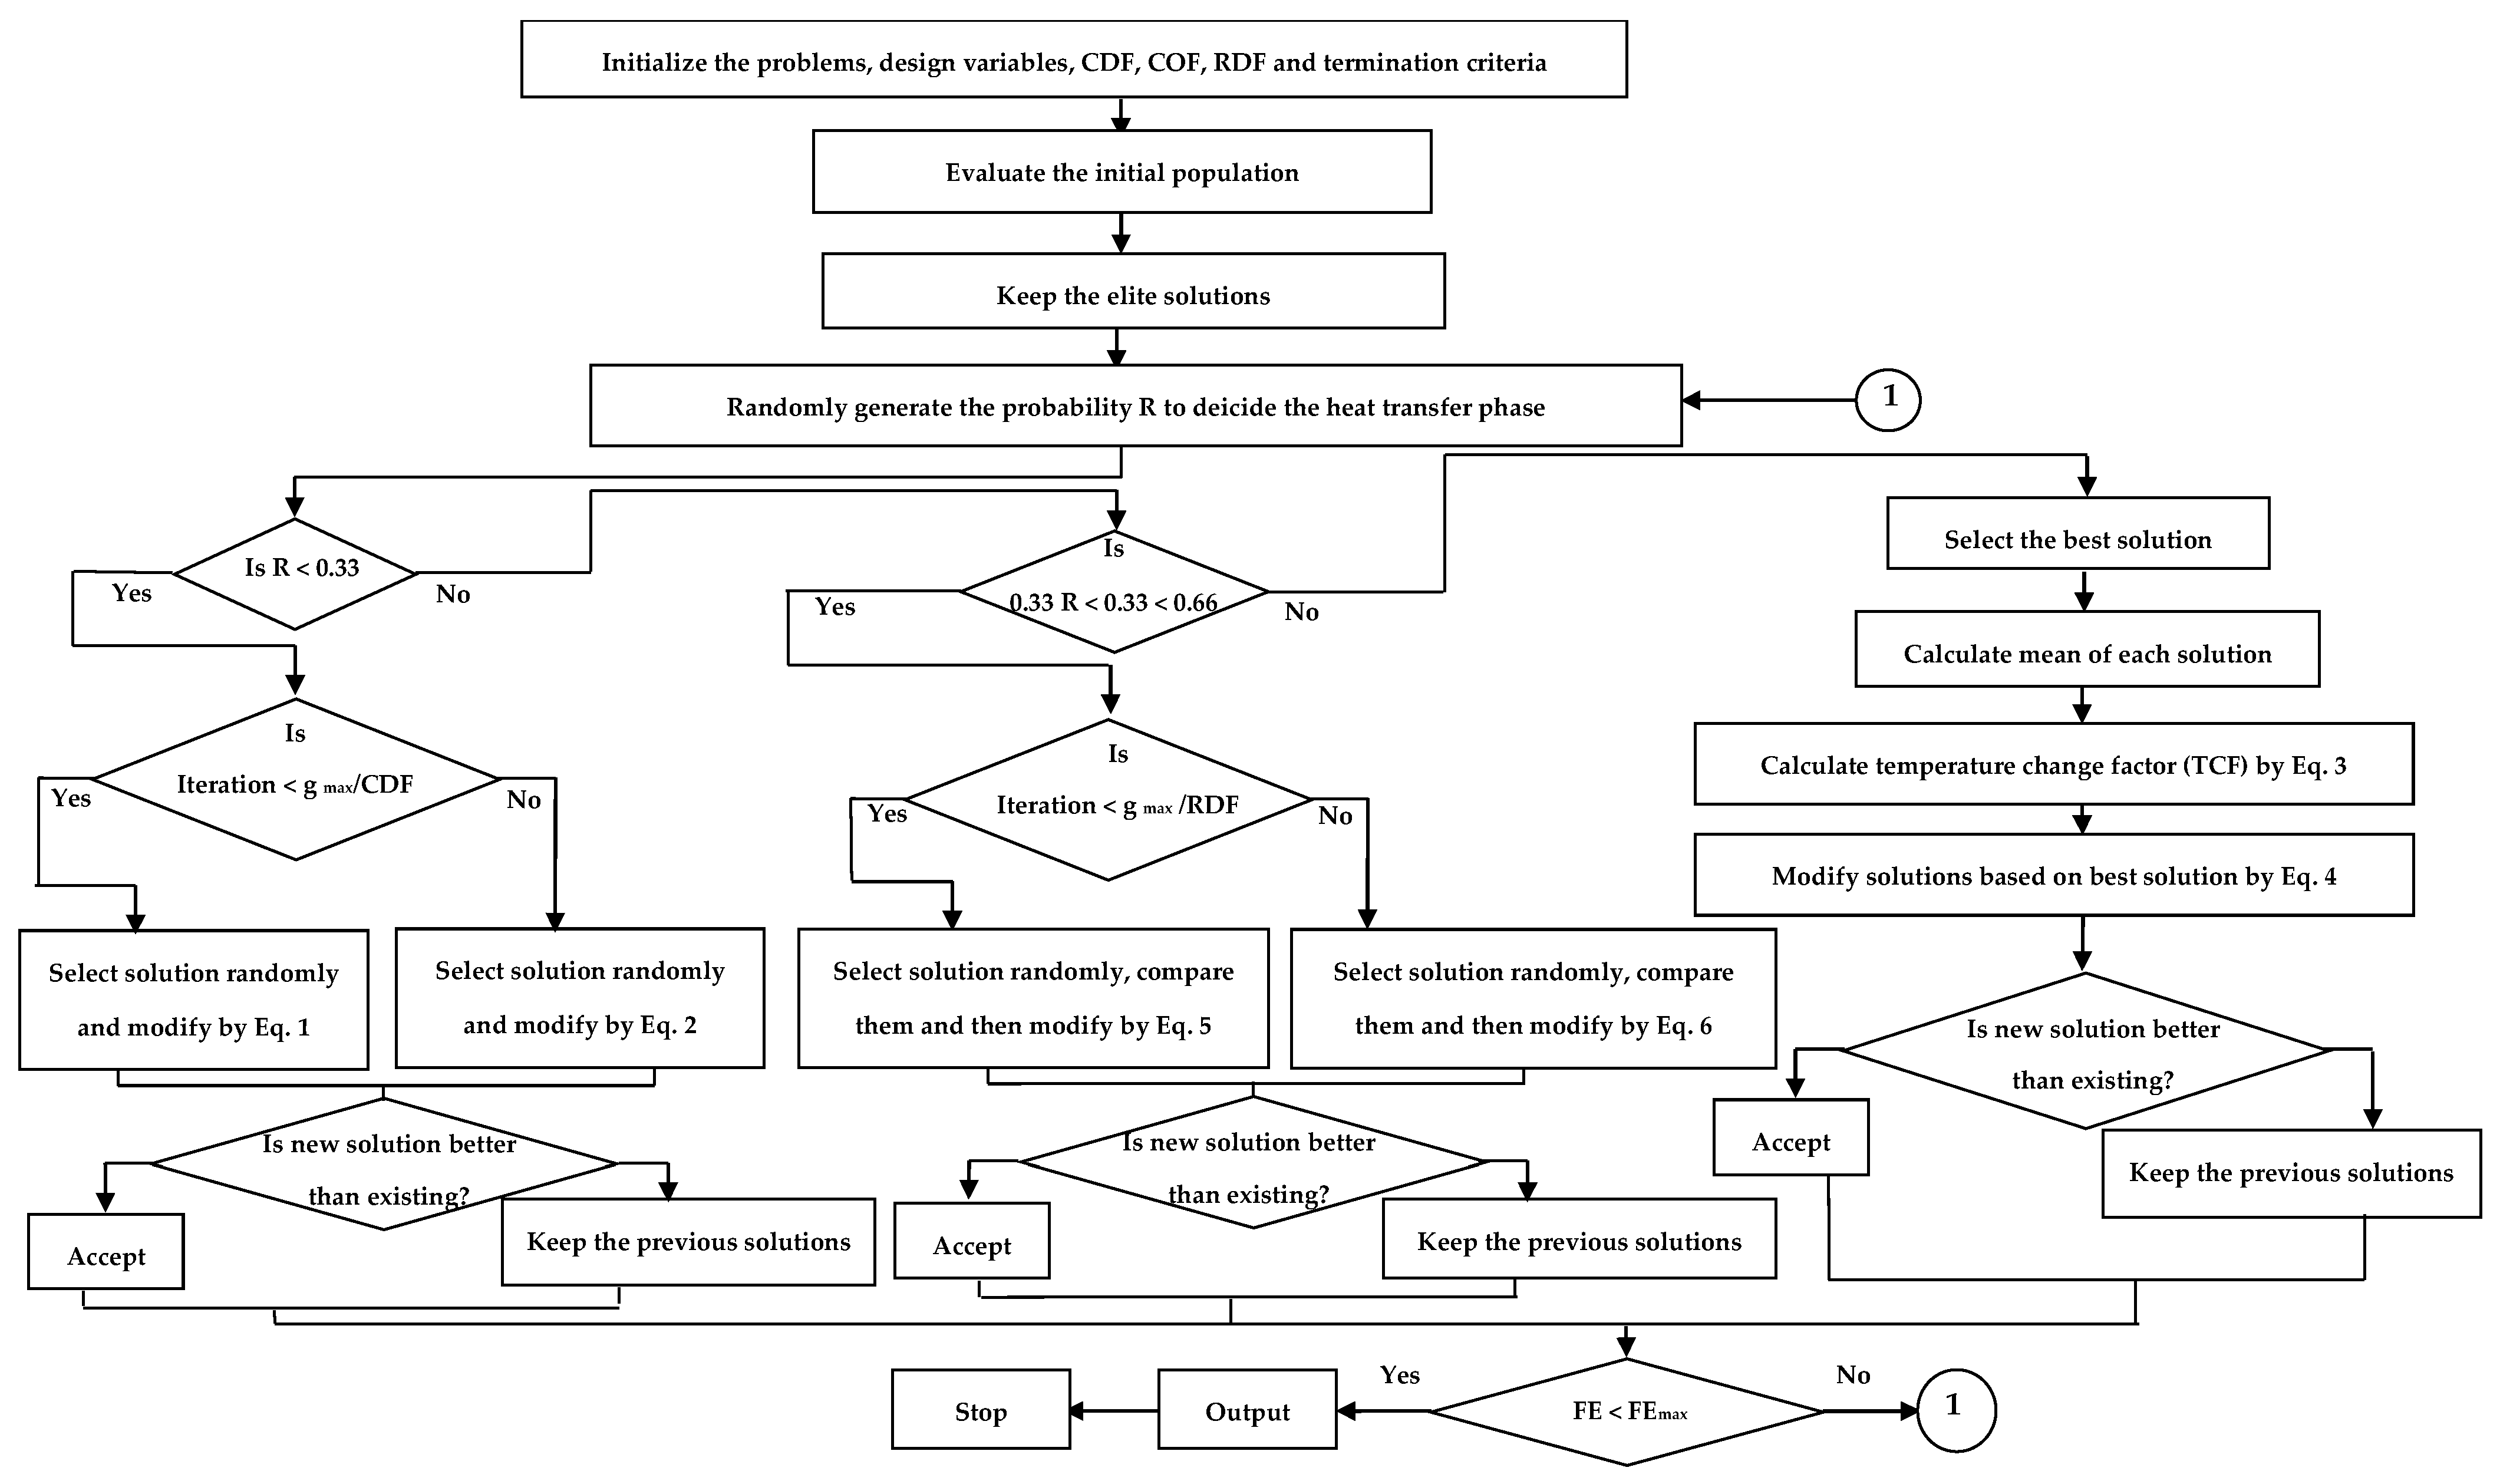
2.3. Optimization
2.3.1. Conduction Mode
2.3.2. Convection Mode
2.3.3. Radiation Mode
3. Results and Discussions
3.1. Empirical Model Terms for Response Measures
3.2. ANOVA Analysis for Response Measures
3.2.1. MRR
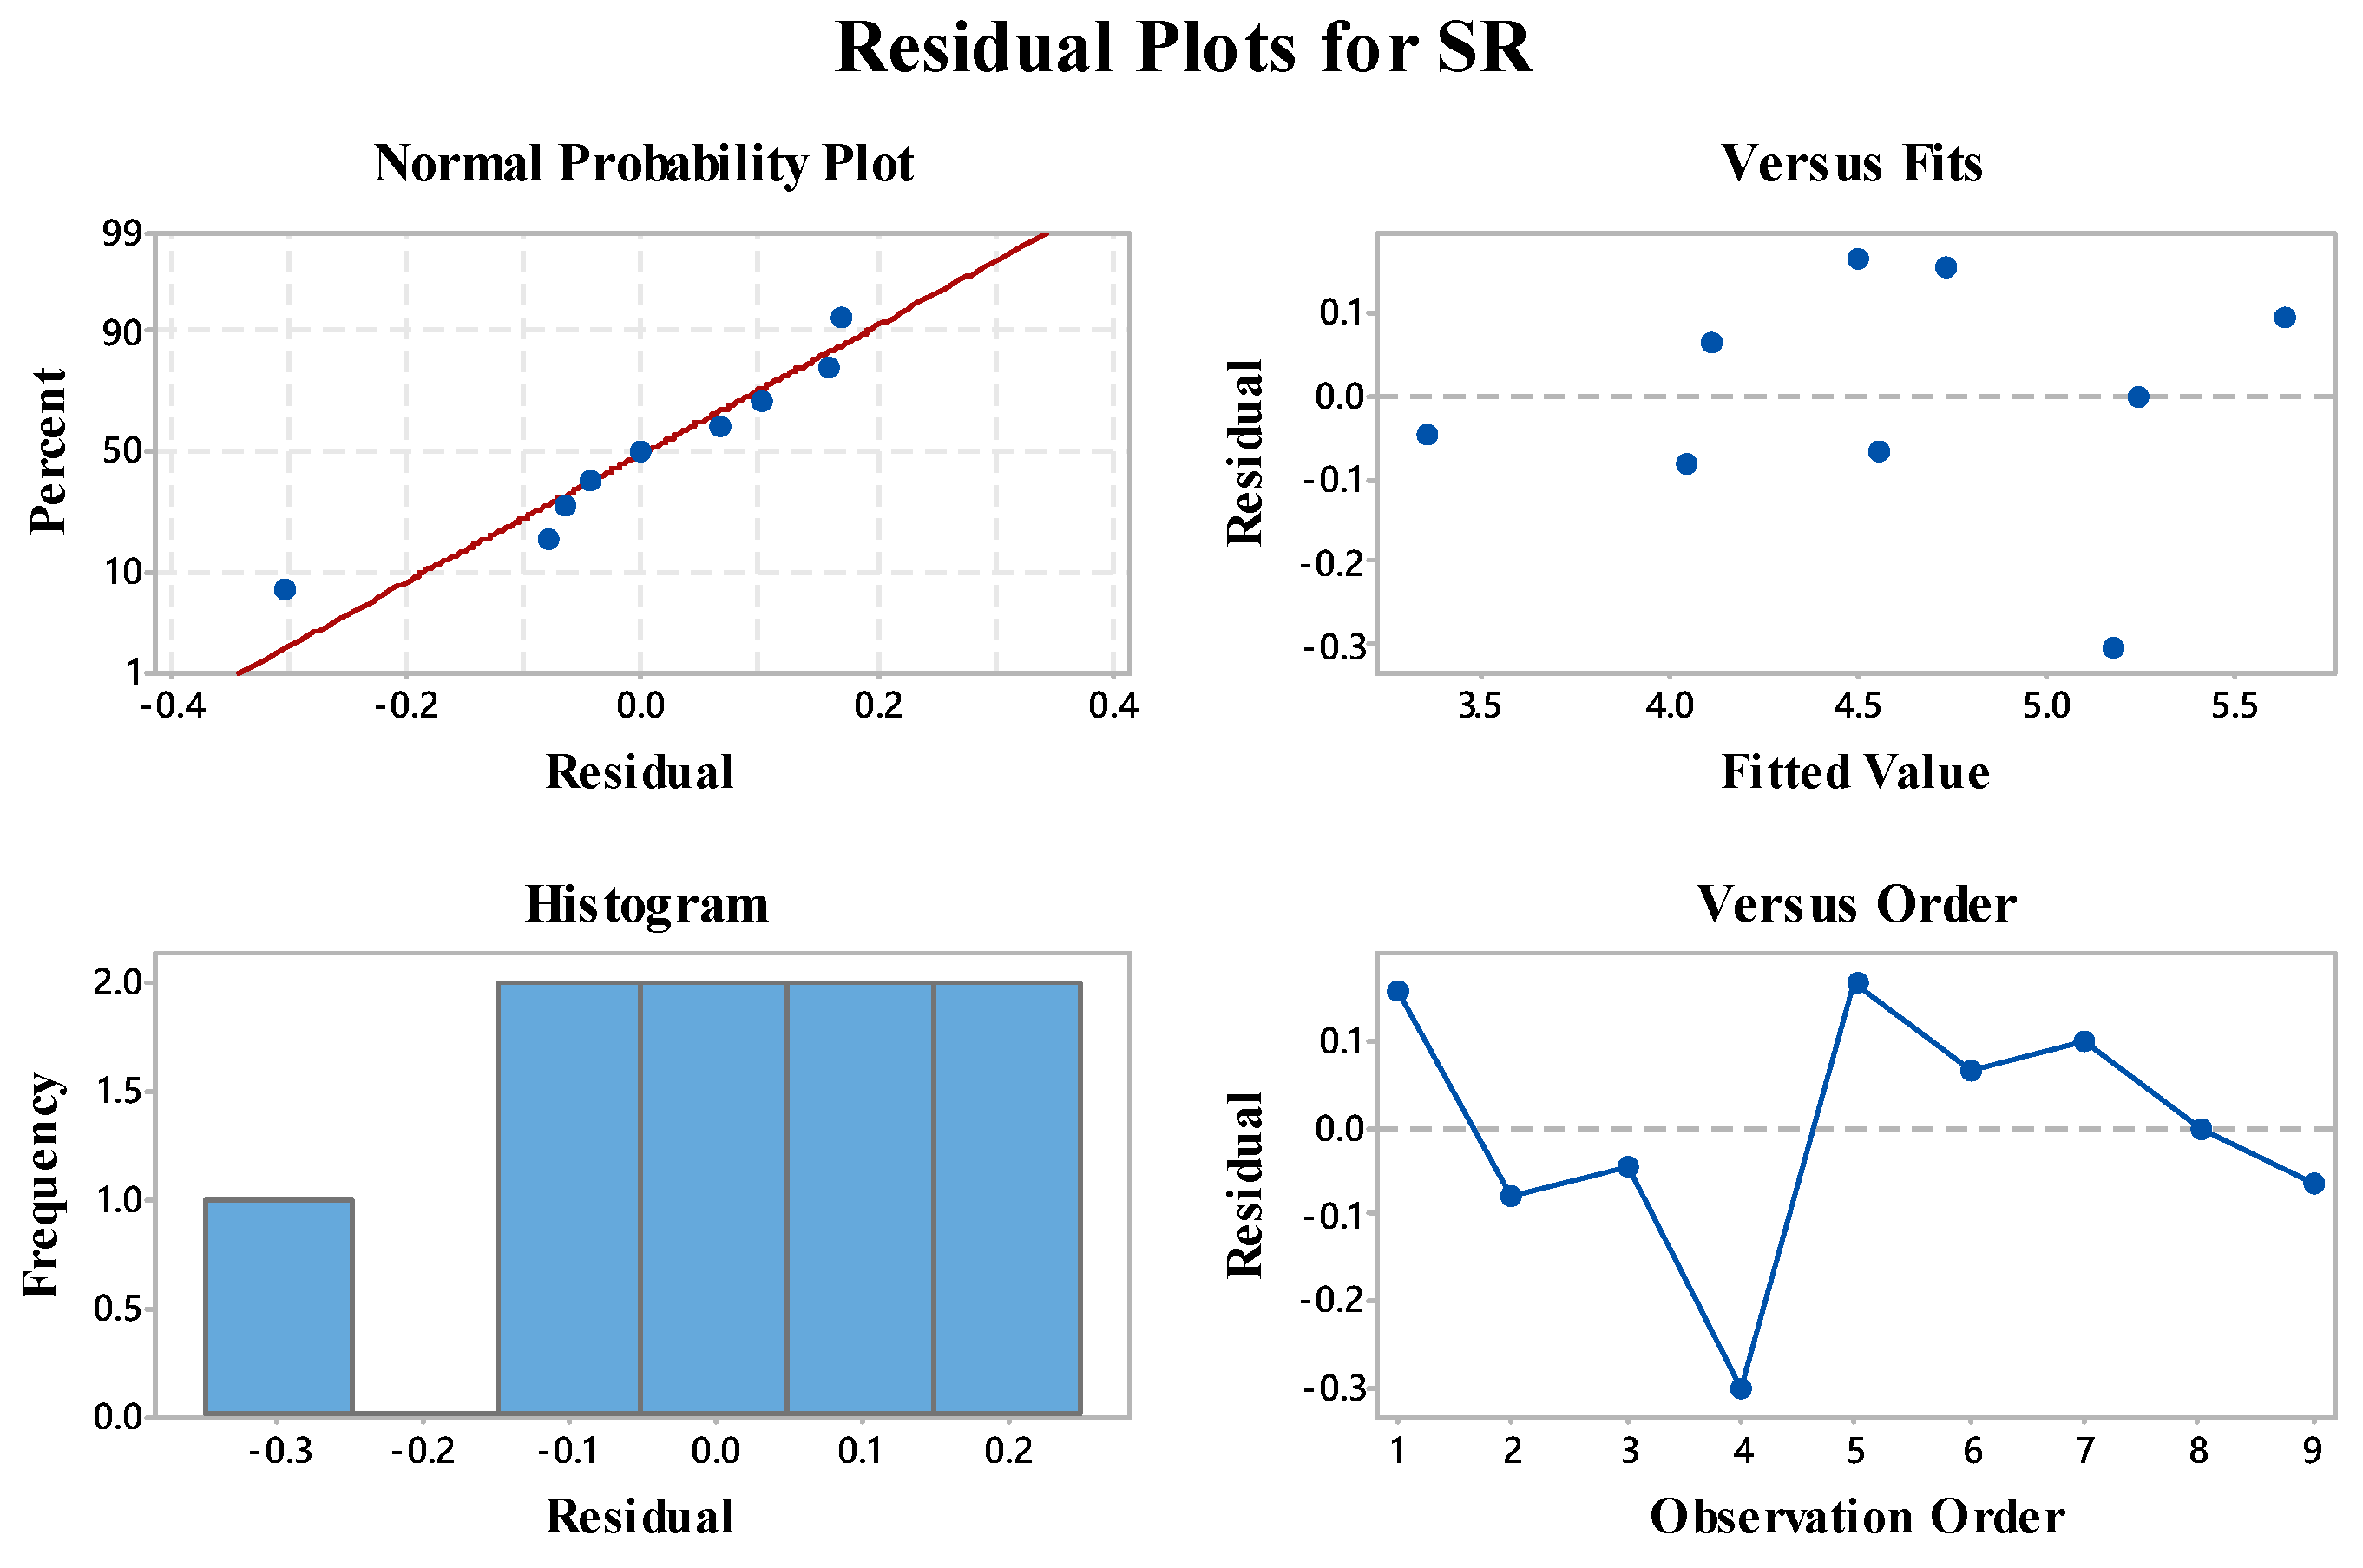
3.2.2. SR
3.3. Residual Plots for MRR and SR Measures
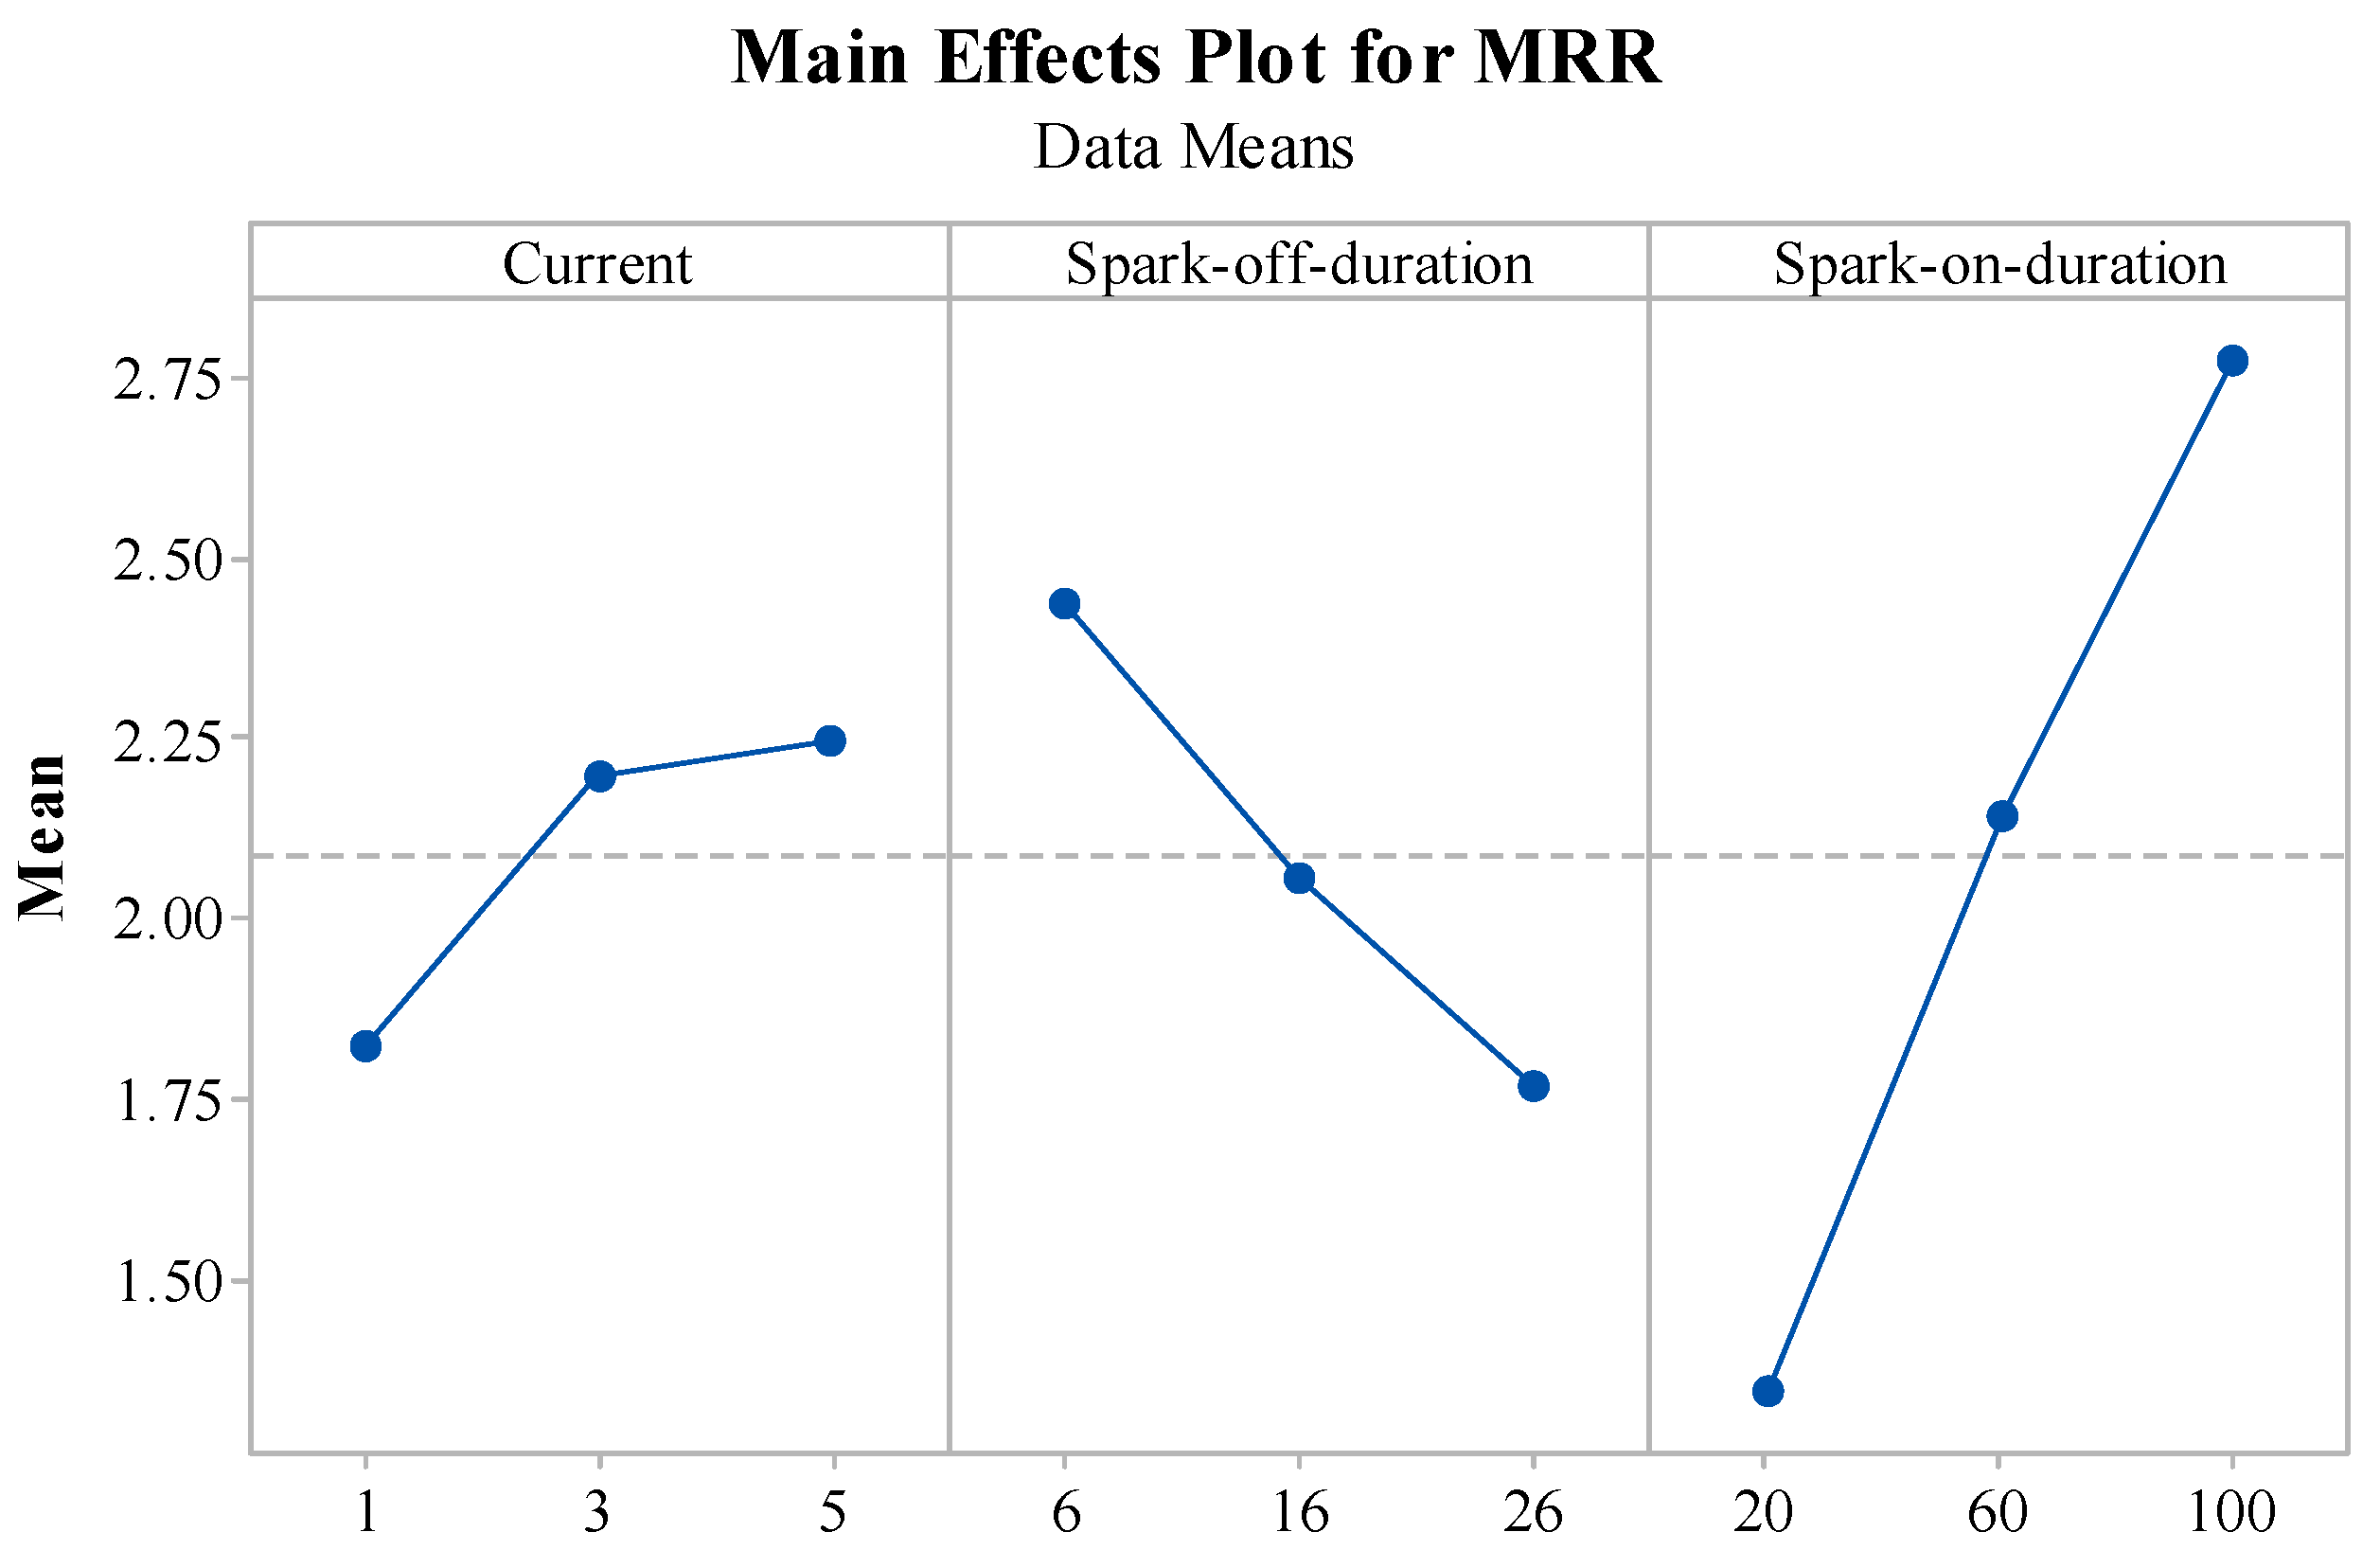
3.4. Main Effect Plots for Response Measures
3.4.1. Main Effect Plot for MRR
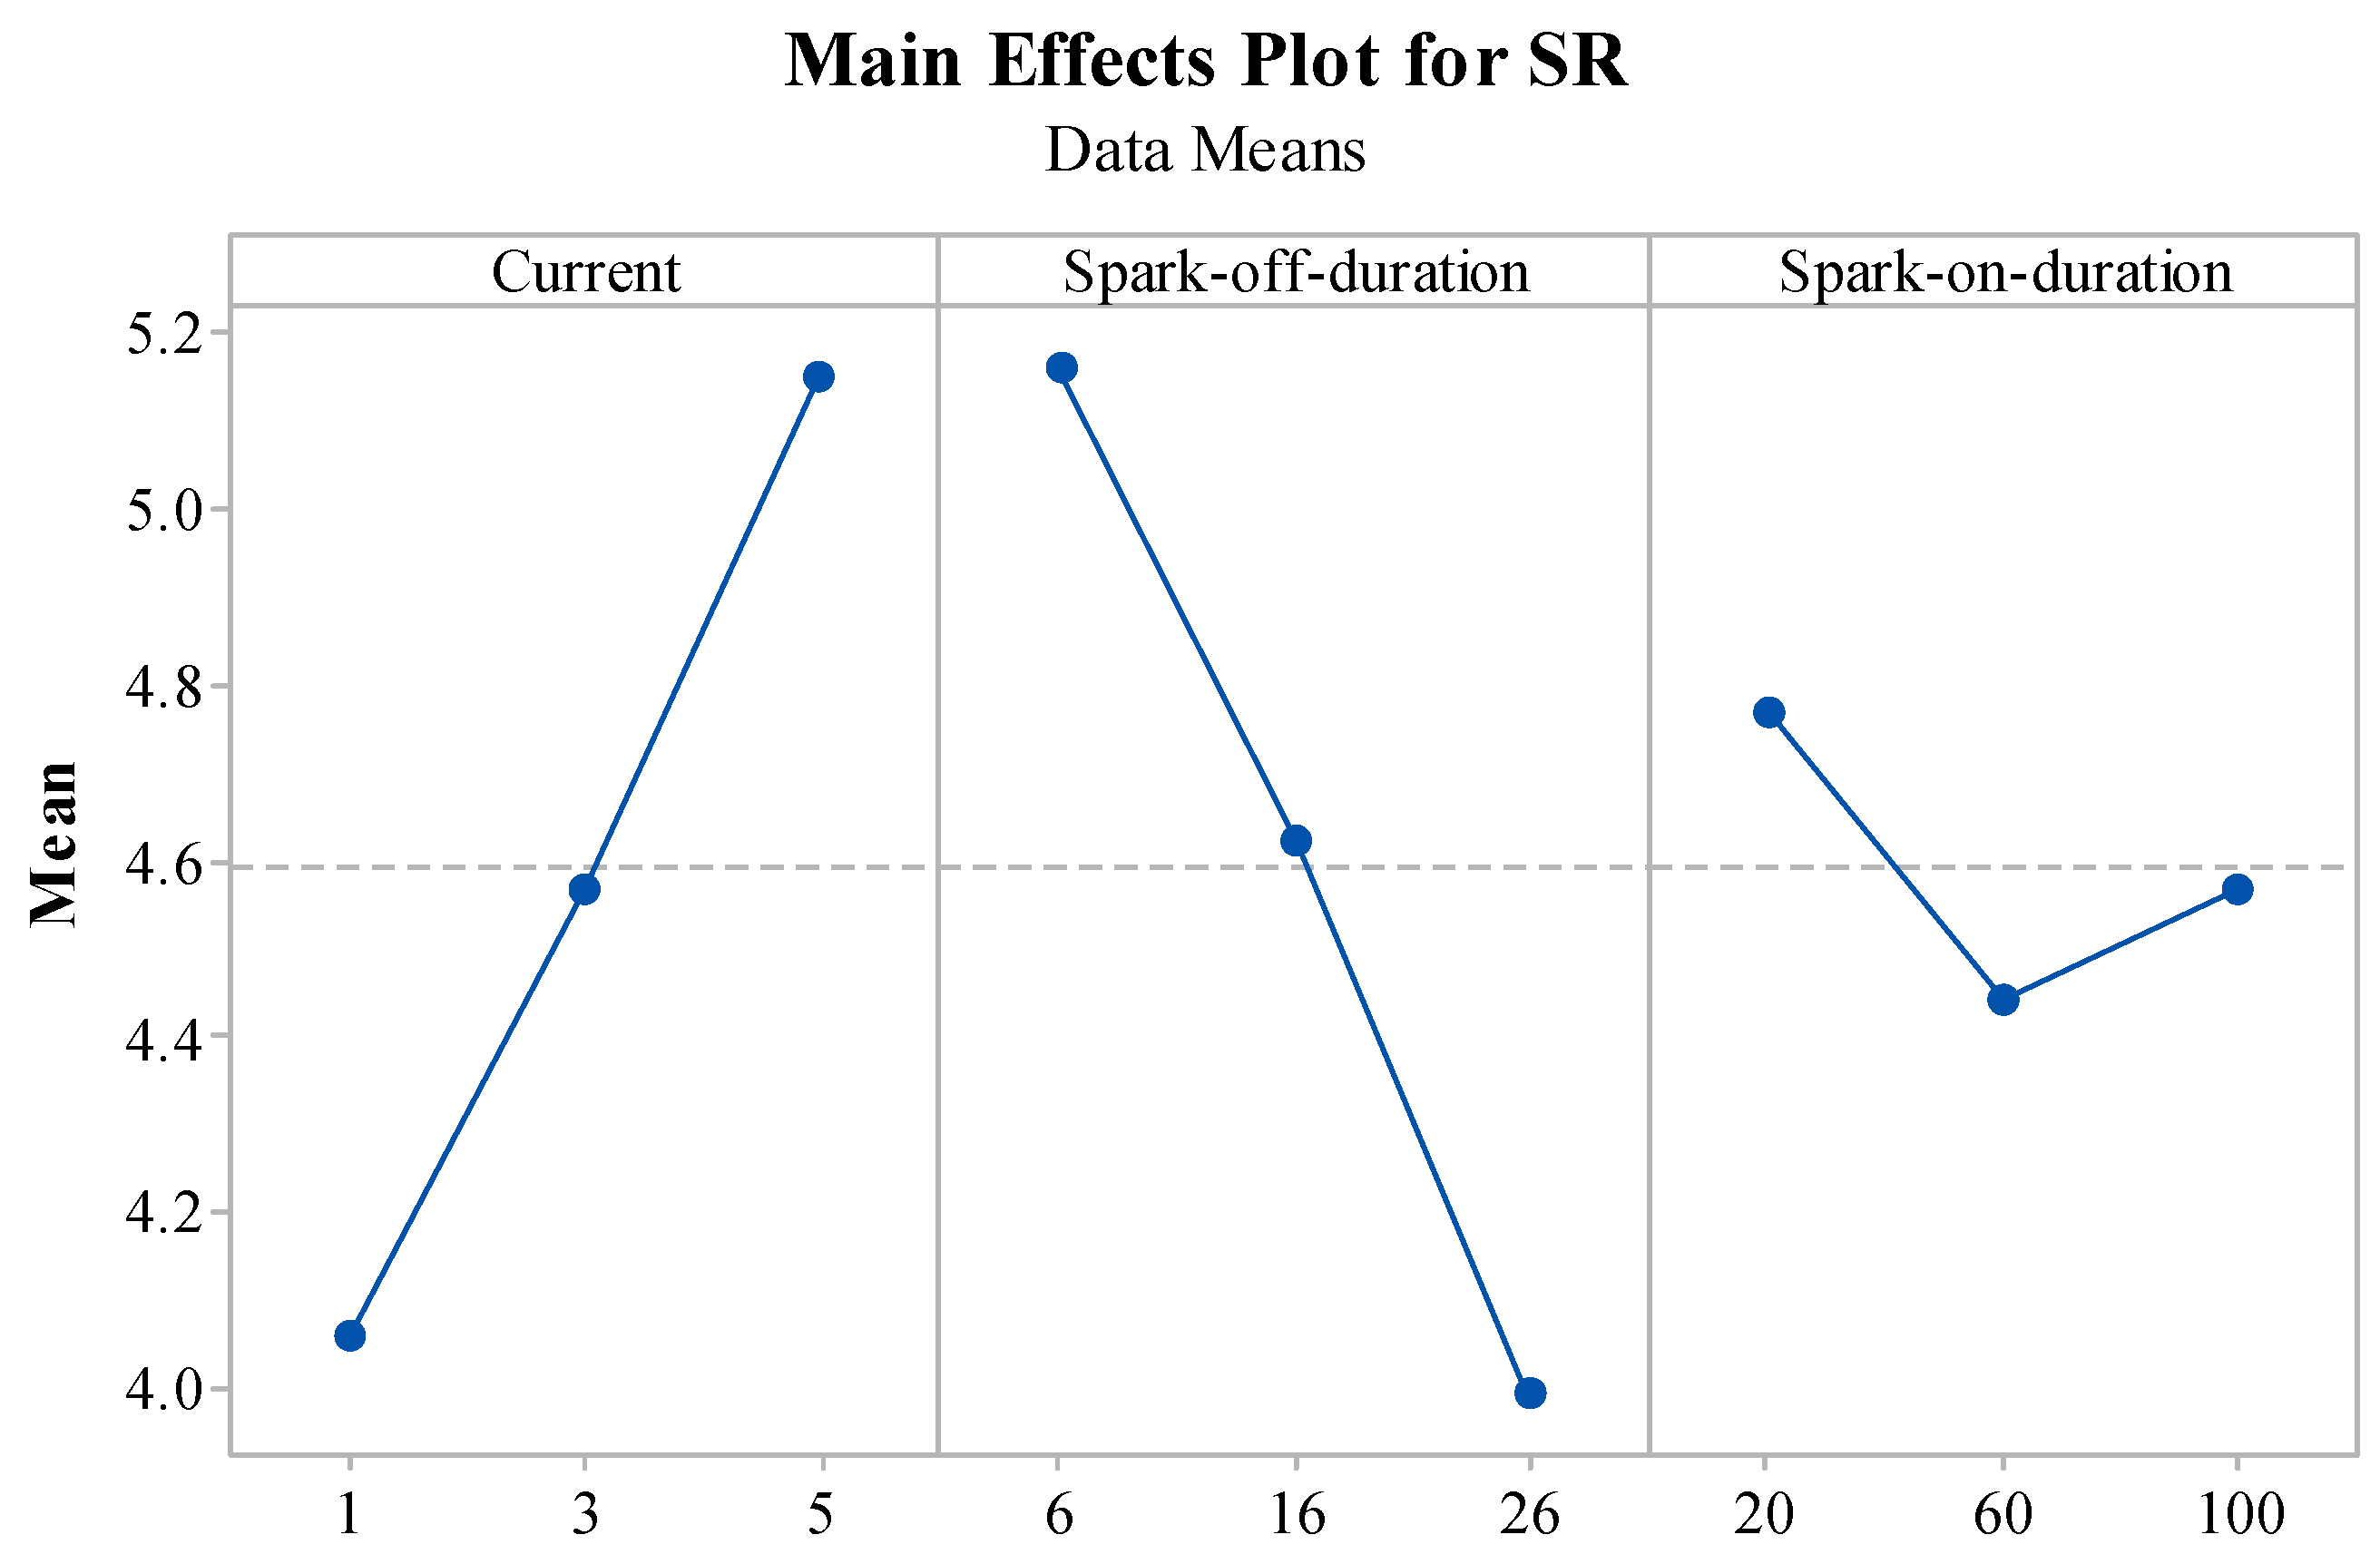
3.4.2. Main Effect Plot for SR
3.5. Optimization Results
3.6. Effect of Expanded Graphite on Output Factors
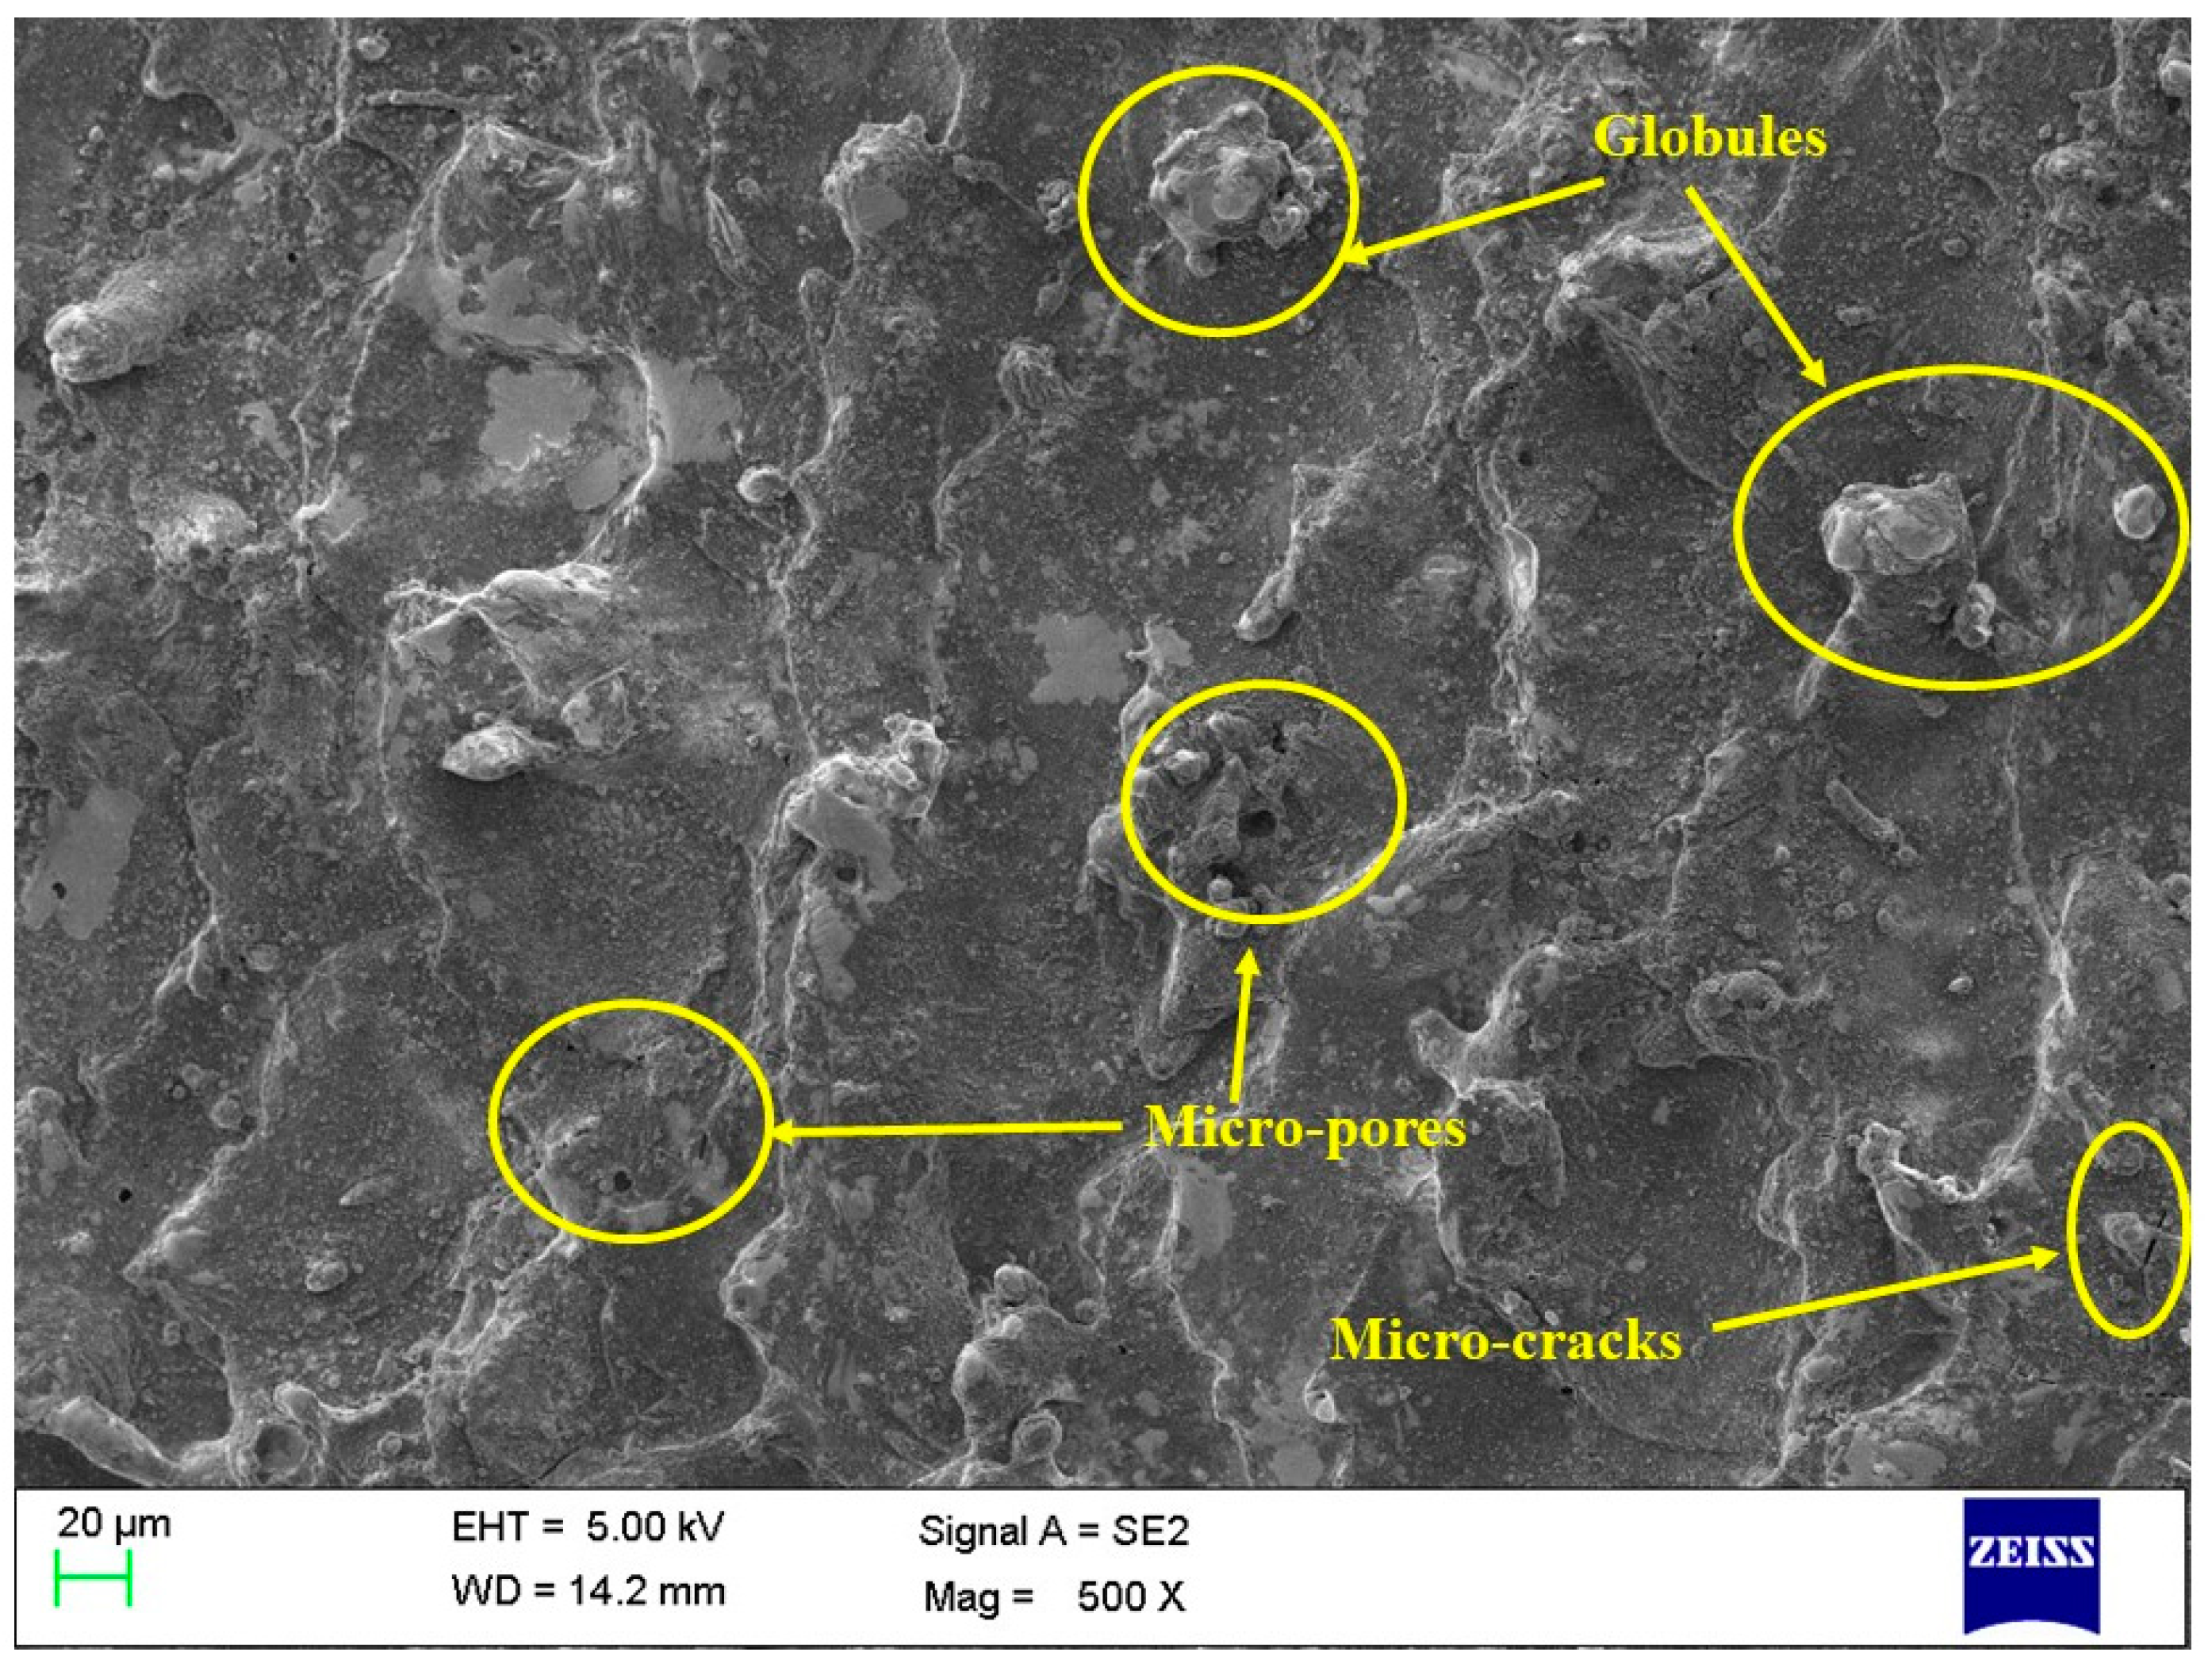
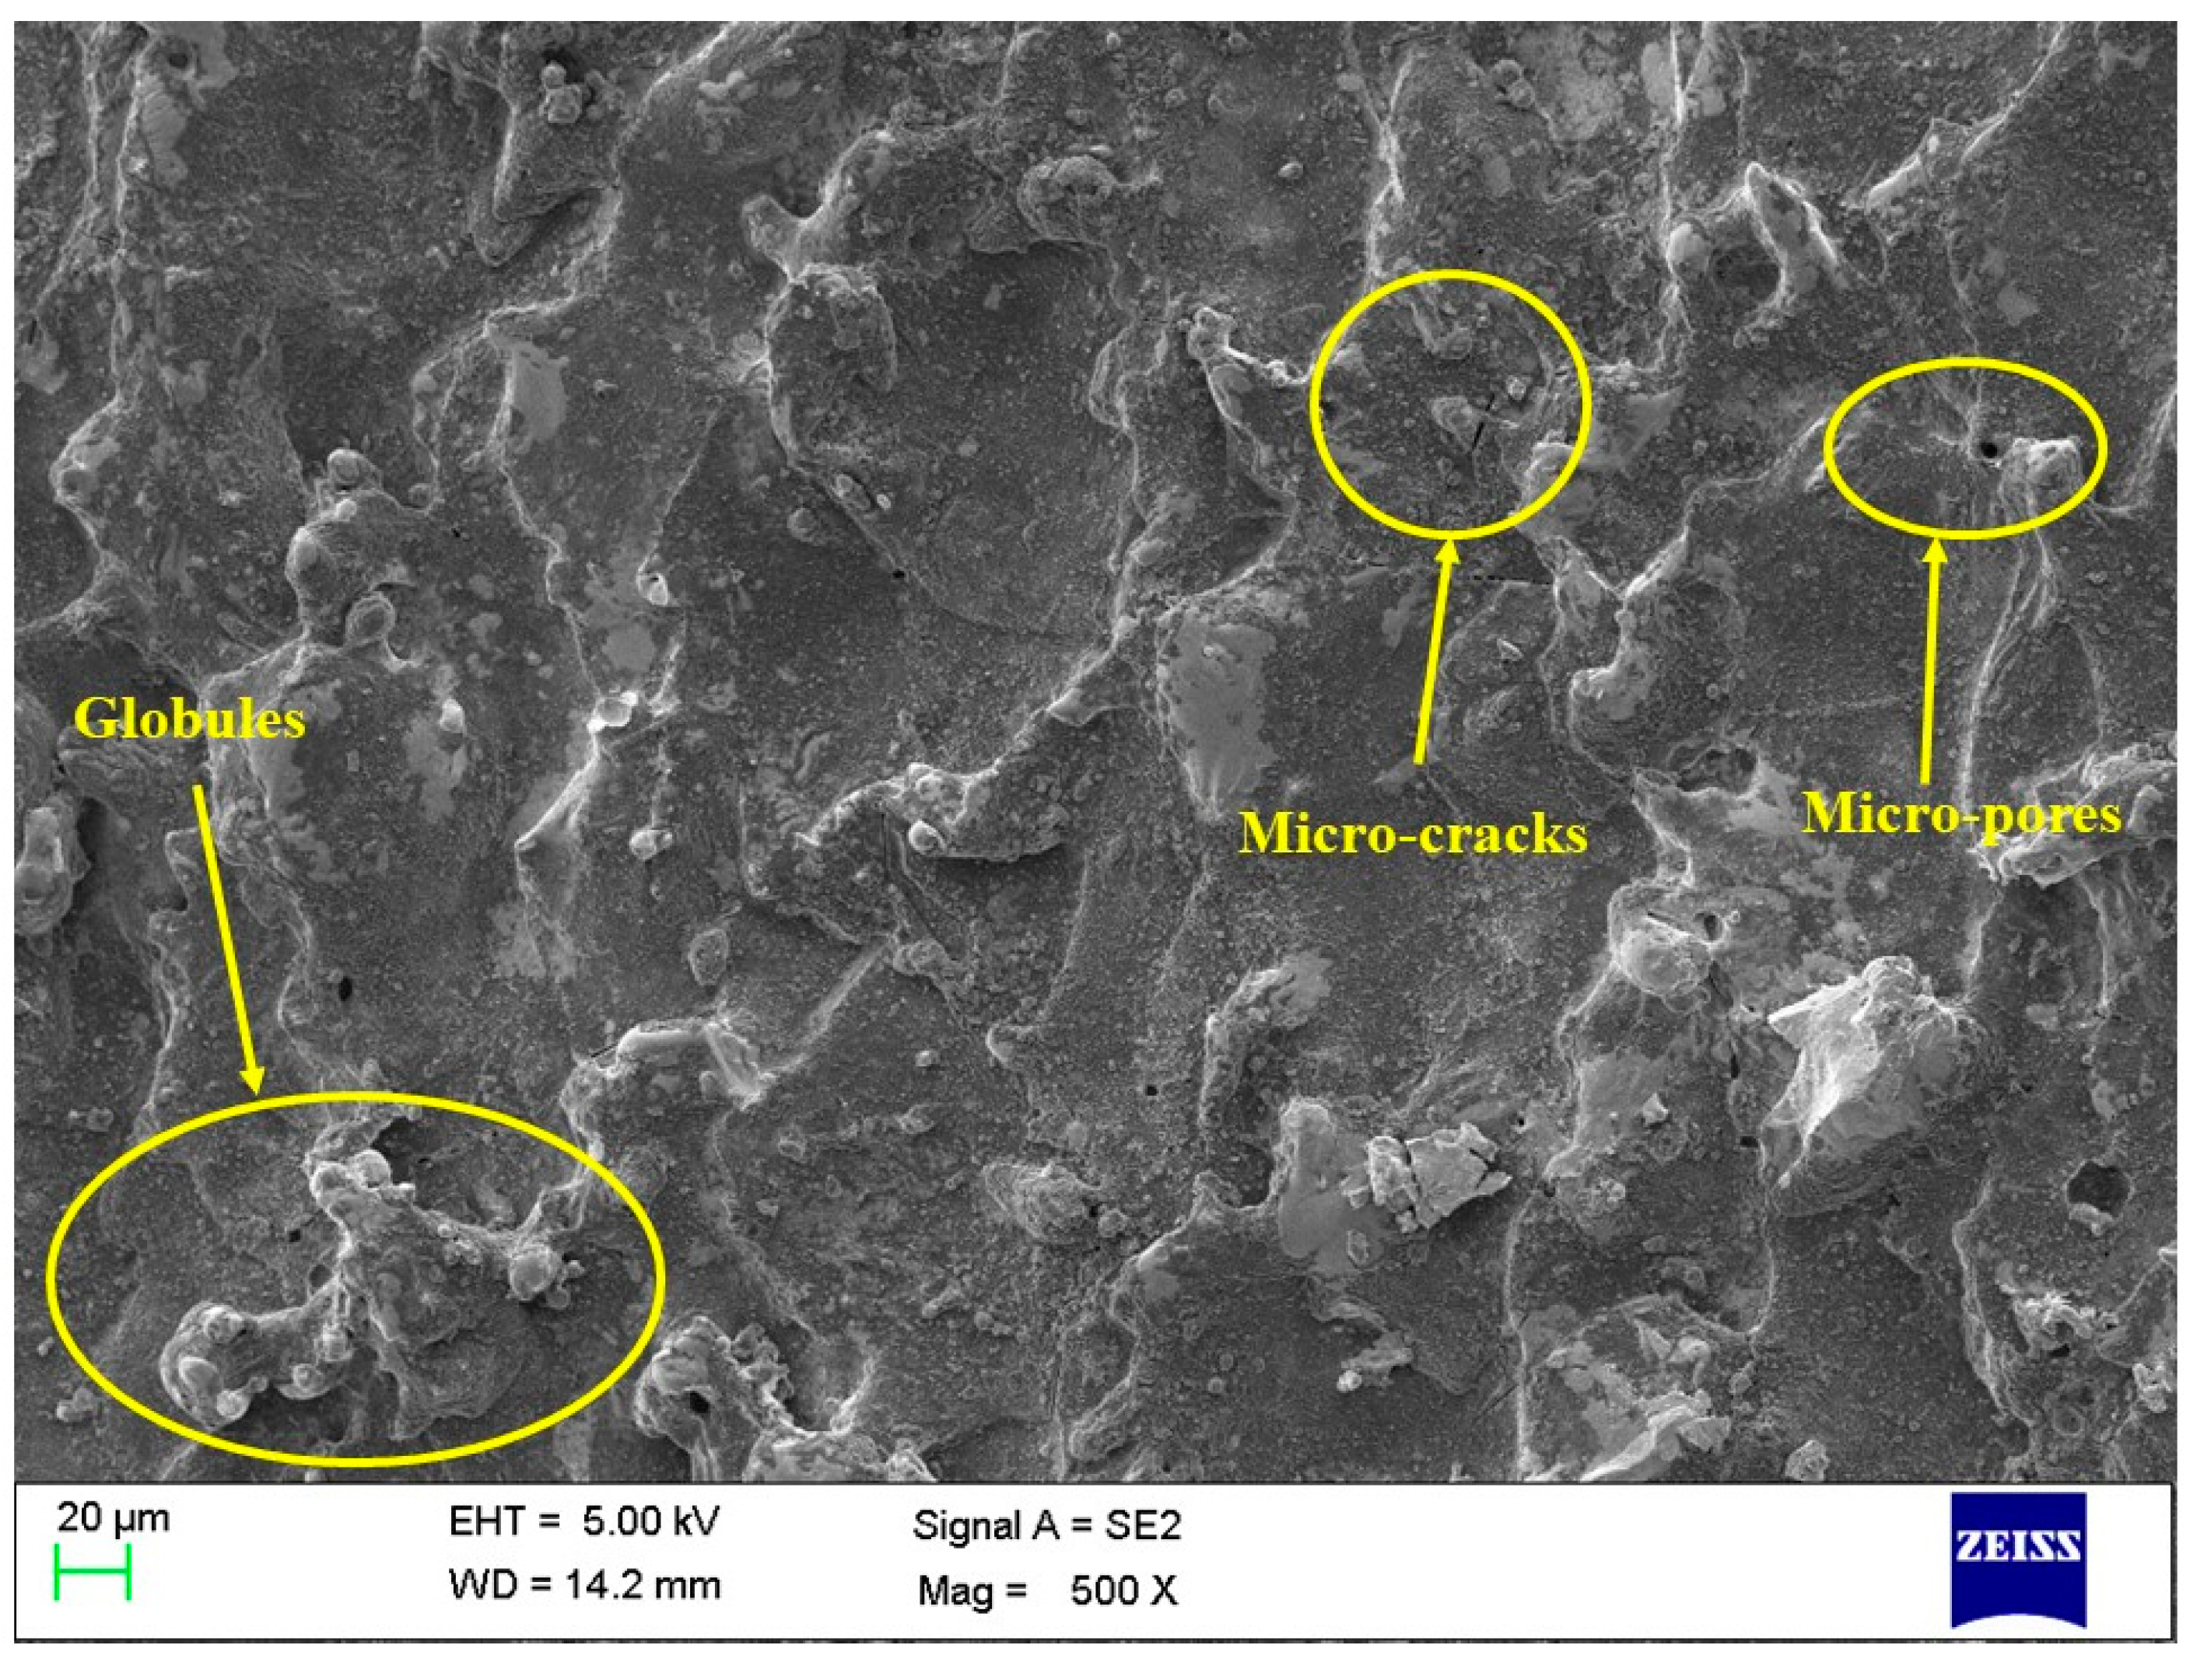
3.7. Effect of Expanded Graphite on Surface Morphology
4. Conclusions
Author Contributions
Funding
Data Availability Statement
Conflicts of Interest
Nomenclature
| ANOVA | Analysis of variance |
| CI | Confidence interval |
| DOE | Design of experiments |
| EDM | Electrical discharge machining |
| EG | Expanded graphite |
| HTS | Heat transfer search |
| MOHTS | Multi-objective heat transfer search |
| MRR | Material removal rate (g/s) |
| PMEDM | Powder-mixed electrical discharge machining |
| PMWEDM | Powder-mixed wire electrical discharge machining |
| SEM | Scanning electron microscope |
| SR | Surface roughness (µm) |
| Ton | Pulse on time (µs) |
| Toff | Pulse off time (µs) |
| t | Time in seconds |
| RLT | Recast layer thickness |
| WEDM | Wire electric discharge machine |
| ρ | Density in g/cm3 |
| R | Probability |
| n | Randomy generated initial population |
| g | Updated population in each generation |
| m | Number of optimization parameters |
| i | 1, 2, …, m |
| j | 1, 2, …, n |
| k | Randomy selection solution from population |
| Xj,i, Xk,i, … | Temperature gradients |
| CDF | Conduction factor |
| COF | Convection factor |
| RDF | Radiation factor |
References
- Wanjara, P.; Backman, D.; Sikan, F.; Gholipour, J.; Amos, R.; Patnaik, P.; Brochu, M. Microstructure and mechanical properties of Ti-6Al-4V additively manufactured by electron beam melting with 3D part nesting and powder reuse influences. J. Manuf. Mater. Process. 2022, 6, 21. [Google Scholar] [CrossRef]
- Boyer, R.R. An overview on the use of titanium in the aerospace industry. Mater. Sci. Eng. A 1996, 213, 103–114. [Google Scholar] [CrossRef]
- Outeiro, J.; Cheng, W.; Chinesta, F.; Ammar, A. Modelling and optimization of machining of Ti-6Al-4V titanium alloy using machine learning and design of experiments methods. J. Manuf. Mater. Process. 2022, 6, 58. [Google Scholar] [CrossRef]
- Cui, C.; Hu, B.; Zhao, L.; Liu, S. Titanium alloy production technology, market prospects and industry development. Mater. Des. 2011, 32, 1684–1691. [Google Scholar] [CrossRef]
- Chaudhari, R.; Vora, J.; Parikh, D.; Wankhede, V.; Khanna, S. Multi-response optimization of WEDM parameters using an integrated approach of RSM–GRA analysis for pure titanium. J. Inst. Eng. Ser. D 2020, 101, 117–126. [Google Scholar] [CrossRef]
- Farshid, S.; Ebrahimian-Hosseinabadi, M.; Rafienia, M. Electrophoretic deposition of biphasic calcium phosphate/graphene nanocomposite coatings on Ti6Al4V substrate for biomedical applications. J. Alloy. Compd. 2022, 892, 162150. [Google Scholar] [CrossRef]
- Kugalur Palanisamy, N.; Rivière Lorphèvre, E.; Gobert, M.; Briffoteaux, G.; Tuyttens, D.; Arrazola, P.-J.; Ducobu, F. Identification of the Parameter Values of the Constitutive and Friction Models in Machining Using EGO Algorithm: Application to Ti6Al4V. Metals 2022, 12, 976. [Google Scholar] [CrossRef]
- Fuse, K.; Chaudhari, R.; Vora, J.; Patel, V.K.; de Lacalle, L.N.L. Multi-Response Optimization of Abrasive Waterjet Machining of Ti6Al4V Using Integrated Approach of Utilized Heat Transfer Search Algorithm and RSM. Materials 2021, 14, 7746. [Google Scholar] [CrossRef]
- Rajput, G.S.; Vora, J.; Prajapati, P.; Chaudhari, R. Areas of recent developments for shape memory alloy: A review. Mater. Today Proc. 2022, 62, 7194–7198. [Google Scholar] [CrossRef]
- Vora, J.; Chaudhari, R.; Patel, C.; Pimenov, D.Y.; Patel, V.K.; Giasin, K.; Sharma, S. Experimental investigations and Pareto optimization of fiber laser cutting process of Ti6Al4V. Metals 2021, 11, 1461. [Google Scholar] [CrossRef]
- Pradhan, S.; Singh, S.; Prakash, C.; Królczyk, G.; Pramanik, A.; Pruncu, C.I. Investigation of machining characteristics of hard-to-machine Ti-6Al-4V-ELI alloy for biomedical applications. J. Mater. Res. Technol. 2019, 8, 4849–4862. [Google Scholar] [CrossRef]
- Fuse, K.; Dalsaniya, A.; Modi, D.; Vora, J.; Pimenov, D.Y.; Giasin, K.; Prajapati, P.; Chaudhari, R.; Wojciechowski, S. Integration of fuzzy AHP and fuzzy TOPSIS methods for wire electric discharge machining of titanium (Ti6Al4V) alloy using RSM. Materials 2021, 14, 7408. [Google Scholar] [CrossRef] [PubMed]
- Sarıkaya, M.; Gupta, M.K.; Tomaz, I.; Pimenov, D.Y.; Kuntoğlu, M.; Khanna, N.; Yıldırım, Ç.V.; Krolczyk, G.M. A state-of-the-art review on tool wear and surface integrity characteristics in machining of superalloys. CIRP J. Manuf. Sci. Technol. 2021, 35, 624–658. [Google Scholar] [CrossRef]
- Hourmand, M.; Sarhan, A.A.; Sayuti, M.; Hamdi, M. A comprehensive review on machining of titanium alloys. Arab. J. Sci. Eng. 2021, 46, 7087–7123. [Google Scholar] [CrossRef]
- Khanna, N.; Zadafiya, K.; Patel, T.; Kaynak, Y.; Rashid, R.A.R.; Vafadar, A. Review on machining of additively manufactured nickel and titanium alloys. J. Mater. Res. Technol. 2021, 15, 3192–3221. [Google Scholar] [CrossRef]
- Vora, J.; Jain, A.; Sheth, M.; Gajjar, K.; Abhishek, K.; Chaudhari, R. A review on machining aspects of shape memory alloys. In Recent Advances in Mechanical Infrastructure; Springer: Singapore, 2022; pp. 449–458. [Google Scholar]
- Sethy, S.; Behera, R.K.; Davim, J.P.; Rana, J. Effect of Thermo-Physical Properties of the Tool Materials on the Electro-Discharge Machining Performance of Ti-6Al-4V and SS316 Work Piece Materials. J. Manuf. Mater. Process. 2022, 6, 96. [Google Scholar] [CrossRef]
- Dekster, L.; Karkalos, N.E.; Karmiris-Obratański, P.; Markopoulos, A.P. Evaluation of the Machinability of Ti-6Al-4V Titanium Alloy by AWJM Using a Multipass Strategy. Appl. Sci. 2023, 13, 3774. [Google Scholar] [CrossRef]
- Rathi, P.; Ghiya, R.; Shah, H.; Srivastava, P.; Patel, S.; Chaudhari, R.; Vora, J. Multi-response optimization of Ni55. 8Ti shape memory alloy using taguchi–grey relational analysis approach. In Recent Advances in Mechanical Infrastructure: Proceedings of the ICRAM 2019, Ahmedabad, India, 20–21 April 2019; Springer: Singapore, 2019; pp. 13–23. [Google Scholar]
- Chaudhari, R.; Ayesta, I.; Doshi, M.; Khanna, S.; Patel, V.K.; Vora, J.; De Lacalle, L.N.L. Effect of Multi-walled carbon nanotubes on the performance evaluation of Nickel-based super-alloy–Udimet 720 machined using WEDM process. Int. J. Adv. Manuf. Technol. 2022, 123, 2087–2105. [Google Scholar] [CrossRef]
- Chaudhari, R.; Shah, H.; Ayesta, I.; de Lacalle, L.L.; Vora, J. Experimental investigations and optimization of WEDM parameters using Taguchi analysis of pure titanium. In Recent Advances in Mechanical Infrastructure: Proceedings of the ICRAM 2021; Springer: Singapore, 2022; pp. 349–358. [Google Scholar]
- Sharma, N.; Gupta, R.D.; Khanna, R.; Sharma, R.C.; Sharma, Y.K. Machining of Ti-6Al-4V biomedical alloy by WEDM: Investigation and optimization of MRR and Rz using grey-harmony search. World J. Eng. 2023, 20, 221–234. [Google Scholar] [CrossRef]
- Maurya, R.; Porwal, R.K.; Singh, R. Concerning drifts to optimization techniques of wire-EDM process for titanium based super alloys: A review. Mater. Today Proc. 2019, 18, 4509–4514. [Google Scholar] [CrossRef]
- Chaudhari, R.; Vora, J.J.; Mani Prabu, S.; Palani, I.; Patel, V.K.; Parikh, D.; de Lacalle, L.N.L. Multi-response optimization of WEDM process parameters for machining of superelastic nitinol shape-memory alloy using a heat-transfer search algorithm. Materials 2019, 12, 1277. [Google Scholar] [CrossRef] [Green Version]
- Chaudhari, R.; Vora, J.J.; Prabu, S.M.; Palani, I.; Patel, V.K.; Parikh, D. Pareto optimization of WEDM process parameters for machining a NiTi shape memory alloy using a combined approach of RSM and heat transfer search algorithm. Adv. Manuf. 2021, 9, 64–80. [Google Scholar] [CrossRef]
- Vakharia, V.; Vora, J.; Khanna, S.; Chaudhari, R.; Shah, M.; Pimenov, D.Y.; Giasin, K.; Prajapati, P.; Wojciechowski, S. Experimental investigations and prediction of WEDMed surface of Nitinol SMA using SinGAN and DenseNet deep learning model. J. Mater. Res. Technol. 2022, 18, 325–337. [Google Scholar] [CrossRef]
- Gupta, A.; Kumar, H. Optimization of EDM process parameters: A review of technique, process, and outcome. In Advances in Manufacturing Industrial Engineering; Springer: Singapore, 2021; pp. 981–996. [Google Scholar]
- Chaudhari, R.; Vora, J.J.; Pramanik, A.; Parikh, D. Optimization of parameters of spark erosion based processes. In Spark Erosion Machining; CRC Press: Boca Raton, FL, USA, 2020; pp. 190–216. [Google Scholar]
- Devarasiddappa, D.; Chandrasekaran, M.; Arunachalam, R. Experimental investigation and parametric optimization for minimizing surface roughness during WEDM of Ti6Al4V alloy using modified TLBO algorithm. J. Braz. Soc. Mech. Sci. Eng. 2020, 42, 128. [Google Scholar] [CrossRef]
- Farooq, M.U.; Ali, M.A.; He, Y.; Khan, A.M.; Pruncu, C.I.; Kashif, M.; Ahmed, N.; Asif, N. Curved profiles machining of Ti6Al4V alloy through WEDM: Investigations on geometrical errors. J. Mater. Res. Technol. 2020, 9, 16186–16201. [Google Scholar] [CrossRef]
- Vora, J.; Prajapati, N.; Patel, S.; Sheth, S.; Patel, A.; Khanna, S.; Ayesta, I.; de Lacalle, L.L.; Chaudhari, R. Multi-response optimization and effect of alumina mixed with dielectric fluid on WEDM process of Ti6Al4V. In Recent Advances in Mechanical Infrastructure: Proceedings of the ICRAM 2021; Springer: Singapore, 2022; pp. 277–287. [Google Scholar]
- Lin, M.; Tsao, C.; Huang, H.; Wu, C.; Hsu, C. Use of the grey-Taguchi method to optimise the micro-electrical discharge machining (micro-EDM) of Ti-6Al-4V alloy. Int. J. Comput. Integr. Manuf. 2015, 28, 569–576. [Google Scholar] [CrossRef]
- Priyadarshini, M.; Pal, K. Multi-objective optimisation of EDM process using hybrid Taguchi-based methodologies for Ti-6Al-4V alloy. Int. J. Manuf. Res. 2016, 11, 144–166. [Google Scholar] [CrossRef]
- Alam, M.N.; Siddiquee, A.N.; Khan, Z.A.; Khan, N.Z. A comprehensive review on wire EDM performance evaluation. Proc. Inst. Mech. Eng. Part E J. Process Mech. Eng. 2022, 236, 1724–1746. [Google Scholar] [CrossRef]
- Mao, X.; Almeida, S.; Mo, J.; Ding, S. The state of the art of electrical discharge drilling: A review. Int. J. Adv. Manuf. Technol. 2022, 121, 2947–2969. [Google Scholar] [CrossRef]
- Kumar, S.S.; Varol, T.; Canakci, A.; Kumaran, S.T.; Uthayakumar, M. A review on the performance of the materials by surface modification through EDM. Int. J. Lightweight Mater. Manuf. 2021, 4, 127–144. [Google Scholar] [CrossRef]
- Abdudeen, A.; Abu Qudeiri, J.E.; Kareem, A.; Ahammed, T.; Ziout, A. Recent advances and perceptive insights into powder-mixed dielectric fluid of EDM. Micromachines 2020, 11, 754. [Google Scholar] [CrossRef] [PubMed]
- Chaudhari, R.; Khanna, S.; Vora, J.; Patel, V.K.; Paneliya, S.; Pimenov, D.Y.; Giasin, K.; Wojciechowski, S. Experimental investigations and optimization of MWCNTs-mixed WEDM process parameters of nitinol shape memory alloy. J. Mater. Res. Technol. 2021, 15, 2152–2169. [Google Scholar] [CrossRef]
- Chaudhari, R.; Prajapati, P.; Khanna, S.; Vora, J.; Patel, V.K.; Pimenov, D.Y.; Giasin, K. Multi-response optimization of Al2O3 nanopowder-mixed wire electrical discharge machining process parameters of nitinol shape memory alloy. Materials 2022, 15, 2018. [Google Scholar] [CrossRef] [PubMed]
- Al-Amin, M.; Abdul Rani, A.M.; Abdu Aliyu, A.A.; Abdul Razak, M.A.H.; Hastuty, S.; Bryant, M.G. Powder mixed-EDM for potential biomedical applications: A critical review. Mater. Manuf. Process. 2020, 35, 1789–1811. [Google Scholar] [CrossRef]
- Vora, J.; Khanna, S.; Chaudhari, R.; Patel, V.K.; Paneliya, S.; Pimenov, D.Y.; Giasin, K.; Prakash, C. Machining parameter optimization and experimental investigations of nano-graphene mixed electrical discharge machining of nitinol shape memory alloy. J. Mater. Res. Technol. 2022, 19, 653–668. [Google Scholar] [CrossRef]
- Alhodaib, A.; Shandilya, P.; Rouniyar, A.K.; Bisaria, H. Experimental investigation on silicon powder mixed-EDM of nimonic-90 superalloy. Metals 2021, 11, 1673. [Google Scholar] [CrossRef]
- Joshi, A.Y.; Joshi, A.Y. A systematic review on powder mixed electrical discharge machining. Heliyon 2019, 5, e02963. [Google Scholar] [CrossRef] [Green Version]
- Kiran, P.; Mohanty, S.; Das, A.K. Surface modification through sustainable micro-EDM process using powder mixed bio-dielectrics. Mater. Manuf. Process. 2022, 37, 640–651. [Google Scholar] [CrossRef]
- Singh, S.; Patel, B.; Upadhyay, R.K.; Singh, N.K. Improvement of process performance of powder mixed electrical discharge machining by optimisation-A Review. Adv. Mater. Process. Technol. 2022, 8, 3074–3104. [Google Scholar] [CrossRef]
- Bui, V.D.; Mwangi, J.W.; Meinshausen, A.-K.; Mueller, A.J.; Bertrand, J.; Schubert, A. Antibacterial coating of Ti-6Al-4V surfaces using silver nano-powder mixed electrical discharge machining. Surf. Coat. Technol. 2020, 383, 125254. [Google Scholar] [CrossRef]
- Ishfaq, K.; Maqsood, M.A.; Anwar, S.; Harris, M.; Alfaify, A.; Zia, A.W. EDM of Ti6Al4V under nano-graphene mixed dielectric: A detailed roughness analysis. Int. J. Adv. Manuf. Technol. 2022, 120, 7375–7388. [Google Scholar] [CrossRef]
- Chandra, K.S.; Sarkar, D. Structural properties of Al2O3–MgO–C refractory composites improved with YAG nanoparticle hybridized expandable graphite. Mater. Sci. Eng. A 2021, 803, 140502. [Google Scholar] [CrossRef]
- Gong, S.; Cheng, X.; Li, Y.; Wang, X.; Wang, Y.; Zhong, H. Effect of nano-SiC on thermal properties of expanded graphite/1-octadecanol composite materials for thermal energy storage. Powder Technol. 2020, 367, 32–39. [Google Scholar] [CrossRef]
- Sun, W.; Hu, R.; Zhang, H.; Wang, Y.; Yang, L.; Liu, J.; Zhu, M. A long-life nano-silicon anode for lithium ion batteries: Supporting of graphene nanosheets exfoliated from expanded graphite by plasma-assisted milling. Electrochim. Acta 2016, 187, 1–10. [Google Scholar] [CrossRef]
- Karami, B.; Azimi, N.; Ahmadi, S. Increasing the electrical efficiency and thermal management of a photovoltaic module using expanded graphite (EG)/paraffin-beef tallow-coconut oil composite as phase change material. Renew. Energy 2021, 178, 25–49. [Google Scholar] [CrossRef]
- Sheth, M.; Gajjar, K.; Jain, A.; Shah, V.; Patel, H.; Chaudhari, R.; Vora, J. Multi-objective optimization of inconel 718 using Combined approach of taguchi—Grey relational analysis. In Advances in Mechanical Engineering: Select Proceedings of the ICAME 2020; Springer: Singapore, 2021; pp. 229–235. [Google Scholar]
- Wankhede, V.; Jagetiya, D.; Joshi, A.; Chaudhari, R. Experimental investigation of FDM process parameters using Taguchi analysis. Mater. Today Proc. 2020, 27, 2117–2120. [Google Scholar] [CrossRef]
- Chaudhari, R.; Patel, H.; Sheth, M.; Prajapati, N.; Fuse, K.; Abhishek, K.; Vora, J. Effect of different tool electrodes (wire) of WEDM process of inconel 718. In Recent Advances in Mechanical Infrastructure: Proceedings of the ICRAM 2021; Springer: Singapore, 2022; pp. 317–327. [Google Scholar]
- Patel, V.K.; Savsani, V.J. Heat transfer search (HTS): A novel optimization algorithm. Inf. Sci. 2015, 324, 217–246. [Google Scholar] [CrossRef]
- Galati, M.; Antonioni, P.; Calignano, F.; Atzeni, E. Experimental Investigation on the Cutting of Additively Manufactured Ti6Al4V with Wire-EDM and the Analytical Modelling of Cutting Speed and Surface Roughness. J. Manuf. Mater. Process. 2023, 7, 69. [Google Scholar] [CrossRef]
- Vora, J.; Shah, Y.; Khanna, S.; Chaudhari, R. Effect of Near-Dry WEDM Process Variables through Taguchi-based-GRA Approach on Performance Measures of Nitinol. J. Manuf. Mater. Process. 2022, 6, 131. [Google Scholar] [CrossRef]
- Pratiwi, D.K.; Arifin, A.; Mardhi, A. Investigation of Welding Parameters of Dissimilar Weld of SS316 and ASTM A36 Joint Using a Grey-Based Taguchi Optimization Approach. J. Manuf. Mater. Process. 2023, 7, 39. [Google Scholar] [CrossRef]
- Chaudhari, R.; Kevalramani, A.; Vora, J.; Khanna, S.; Patel, V.K.; Pimenov, D.Y.; Giasin, K. Parametric optimization and influence of near-dry WEDM variables on nitinol shape memory alloy. Micromachines 2022, 13, 1026. [Google Scholar] [CrossRef]
- Rashwan, S.S.; Abdelkader, B.; Abdalmonem, A.; Abou-Arab, T.W.; Nemitallah, M.A.; Habib, M.A.; Ibrahim, A.H. Experimental and Statistical ANOVA Analysis on Combustion Stability of CH4/O2/CO2 in a Partially Premixed Gas Turbine Combustor. J. Energy Resour. Technol. 2022, 144, 062301. [Google Scholar] [CrossRef]
- Shanmugam, B.K.; Vardhan, H.; Raj, M.G.; Kaza, M.; Sah, R.; Hanumanthappa, H. Regression modeling and residual analysis of screening coal in screening machine. Int. J. Coal Prep. Util. 2022, 42, 2849–2864. [Google Scholar] [CrossRef]
- Tharian, B.; Kumar, M.; Dhanish, P.; Manu, R. Effect of Peak Current on Material Removal Rate During EDM of Ti–6Al–4V Using Cold Treated Brass Electrode. In Advances in Forming, Machining and Automation: Select Proceedings of the AIMTDR 2021; Springer: Singapore, 2022; pp. 243–251. [Google Scholar]
- Sahoo, R.; Debnath, T.; Patowari, P.K. Machinability characteristics of titanium diamond using EDM and its parametric optimization. Mater. Manuf. Process. 2023, 38, 78–88. [Google Scholar] [CrossRef]
- Chaudhari, R.; Vora, J.J.; Patel, V.; López de Lacalle, L.; Parikh, D. Surface analysis of wire-electrical-discharge-machining-processed shape-memory alloys. Materials 2020, 13, 530. [Google Scholar] [CrossRef] [PubMed] [Green Version]
- Goyal, A.; Pandey, A.; Rahman, H.U. Present and future prospective of shape memory alloys during machining by EDM/wire EDM process: A review. Sādhanā 2022, 47, 217. [Google Scholar] [CrossRef]
- Chaudhari, R.; Sheth, M.; Patel, H.; Fuse, K.; Ayesta, I.; de Lacalle, L.L.; Vora, J. Multi-response optimization of alumina powder-mixed WEDM process using taguchi-TOPSIS approach of nitinol SMA. In Recent Advances in Mechanical Infrastructure: Proceedings of the ICRAM 2021; Springer: Singapore, 2022; pp. 359–367. [Google Scholar]
- Sahu, D.R.; Mandal, A. Critical analysis of surface integrity parameters and dimensional accuracy in powder-mixed EDM. Mater. Manuf. Process. 2020, 35, 430–441. [Google Scholar] [CrossRef]
- Chaudhari, R.; Ayesta, I.; Doshi, M.; Khanna, S.; Patel, V.K.; Vora, J.; López de Lacalle, L.N. Implementation of Passing Vehicle Search Algorithm for Optimization of WEDM Process of Nickel-Based Superalloy Waspaloy. Nanomaterials 2022, 12, 4394. [Google Scholar] [CrossRef]
- Talla, G.; Gangopadhyay, S.; Biswas, C. Influence of graphite powder mixed EDM on the surface integrity characteristics of Inconel 625. Part. Sci. Technol. 2017, 35, 219–226. [Google Scholar] [CrossRef]


| Input Factors | Levels/Values |
|---|---|
| Current (A) | 1, 3, 5 |
| Pulse-off-duration (µs) | 6, 16, 26 |
| Pulse-on-duration (µs) | 20, 60, 100 |
| Type of nano-powder | Expanded Graphite |
| Graphene nano powder-size (nm) | 200–400 |
| Run Order | Current (A) | Toff (µs) | Ton (µs) | MRR (g/s) | SR (µm) |
|---|---|---|---|---|---|
| 1 | 1 | 6 | 20 | 1.3741 | 4.89 |
| 2 | 1 | 16 | 60 | 1.8744 | 3.97 |
| 3 | 1 | 26 | 100 | 2.2235 | 3.32 |
| 4 | 3 | 6 | 60 | 2.6372 | 4.87 |
| 5 | 3 | 16 | 100 | 2.8013 | 4.66 |
| 6 | 3 | 26 | 20 | 1.1561 | 4.18 |
| 7 | 5 | 6 | 100 | 3.3017 | 5.72 |
| 8 | 5 | 16 | 20 | 1.5102 | 5.24 |
| 9 | 5 | 26 | 60 | 1.9287 | 4.49 |
| Source | Adj. SS | F-Value | p-Value | % Contribution |
|---|---|---|---|---|
| Regression | 3.9998 | 78.46 | 0.000 | |
| Current | 0.2682 | 15.78 | 0.011 | 6.56 |
| Toff | 3.0618 | 180.18 | 0.000 | 74.95 |
| Ton | 0.6698 | 39.42 | 0.002 | 16.39 |
| Error | 0.0849 | 2.10 | ||
| Total | 4.0848 | 100 | ||
| R2 = 97.92%, R2 adj. = 96.67%, R2 pred. = 93.18% | ||||
| Source | Adj. SS | F-Value | p-Value | % Contribution |
|---|---|---|---|---|
| Regression | 3.8792 | 37.28 | 0.001 | |
| Current | 1.7831 | 51.41 | 0.001 | 43.99 |
| Toff | 0.0599 | 1.73 | 0.246 | 1.47 |
| Ton | 2.0363 | 58.71 | 0.001 | 50.24 |
| Error | 0.1734 | 4.30 | ||
| Total | 4.0526 | 100 | ||
| R2 = 95.72%, R2 adj. = 93.15%, R2 pred. = 87.20% | ||||
| Function | Input Factors | Output Measures | |||
|---|---|---|---|---|---|
| Current (A) | Toff (µs) | Ton (µs) | MRR (g/s) | SR (µm) | |
| Maximum MRR | 5 | 6 | 100 | 3.3501 | 5.62 |
| Minimum SR | 1 | 26 | 100 | 2.2590 | 3.36 |
| Sr. No. | Current (A) | Toff (µs) | Ton (µs) | MRR (g/s) | SR (µm) |
|---|---|---|---|---|---|
| 1 | 5 | 6 | 100 | 3.3501 | 5.62 |
| 2 | 1 | 26 | 100 | 2.2590 | 3.36 |
| 3 | 5 | 8 | 100 | 3.2832 | 5.50 |
| 4 | 1 | 13 | 100 | 2.6934 | 4.12 |
| 5 | 3 | 7 | 100 | 3.1052 | 5.02 |
| 6 | 1 | 12 | 100 | 2.7268 | 4.18 |
| 7 | 3 | 8 | 100 | 3.0718 | 4.96 |
| 8 | 2 | 7 | 100 | 2.9995 | 4.74 |
| 9 | 1 | 7 | 100 | 2.8938 | 4.47 |
| 10 | 5 | 9 | 100 | 3.2498 | 5.45 |
| 11 | 3 | 9 | 100 | 3.0384 | 4.90 |
| 12 | 1 | 6 | 100 | 2.9272 | 4.53 |
| 13 | 2 | 9 | 100 | 2.9327 | 4.63 |
| 14 | 4 | 6 | 100 | 3.2443 | 5.35 |
| 15 | 2 | 6 | 100 | 3.0329 | 4.80 |
| 16 | 4 | 9 | 100 | 3.1441 | 5.17 |
| 17 | 3 | 6 | 100 | 3.1386 | 5.08 |
| 18 | 1 | 19 | 100 | 2.4929 | 3.77 |
| 19 | 1 | 24 | 100 | 2.3259 | 3.48 |
| 20 | 1 | 18 | 100 | 2.5263 | 3.83 |
| 21 | 1 | 11 | 100 | 2.7602 | 4.24 |
| 22 | 1 | 23 | 100 | 2.3593 | 3.54 |
| 23 | 1 | 10 | 100 | 2.7936 | 4.30 |
| 24 | 2 | 8 | 100 | 2.9661 | 4.69 |
| 25 | 4 | 8 | 100 | 3.1775 | 5.23 |
| 26 | 1 | 8 | 100 | 2.8604 | 4.41 |
| 27 | 1 | 14 | 100 | 2.6600 | 4.06 |
| 28 | 1 | 9 | 100 | 2.8270 | 4.36 |
| 29 | 1 | 17 | 100 | 2.5597 | 3.89 |
| 30 | 1 | 23 | 100 | 2.3593 | 3.54 |
| 31 | 1 | 15 | 100 | 2.6266 | 4.01 |
| 32 | 1 | 20 | 100 | 2.4595 | 3.71 |
| 33 | 1 | 24 | 100 | 2.3259 | 3.48 |
| 34 | 1 | 25 | 100 | 2.2925 | 3.42 |
| 35 | 1 | 21 | 100 | 2.4261 | 3.66 |
| 36 | 1 | 20 | 100 | 2.4595 | 3.71 |
| 37 | 1 | 16 | 100 | 2.5931 | 3.95 |
| 38 | 1 | 22 | 100 | 2.3927 | 3.60 |
| 39 | 1 | 18 | 100 | 2.5263 | 3.83 |
| 40 | 1 | 10 | 100 | 2.7936 | 4.30 |
| 41 | 1 | 9 | 100 | 2.8270 | 4.36 |
| 42 | 1 | 14 | 100 | 2.6600 | 4.06 |
| 43 | 1 | 25 | 100 | 2.2925 | 3.42 |
| 44 | 1 | 16 | 100 | 2.5931 | 3.95 |
| 45 | 1 | 21 | 100 | 2.4261 | 3.66 |
| 46 | 5 | 7 | 100 | 3.3166 | 5.56 |
| 47 | 4 | 7 | 100 | 3.2109 | 5.29 |
| 48 | 5 | 7 | 100 | 3.3166 | 5.56 |
| Experimental Condition | WEDM Factors | Response Measures |
|---|---|---|
| Use of Expanded Graphite nano-powder | Current = 1 A Ton = 100 µs Toff = 13 µs EG nano-powder = 1 g/L | MRR = 3.91 g/s SR = 2.63 µm |
| Without EG nano-powder (Conventional EDM) | Current = 1 A Ton = 100 µs Toff = 13 µs EG nano-powder = 1 g/L | MRR = 2.69 g/s SR = 4.12 µm |
Disclaimer/Publisher’s Note: The statements, opinions and data contained in all publications are solely those of the individual author(s) and contributor(s) and not of MDPI and/or the editor(s). MDPI and/or the editor(s) disclaim responsibility for any injury to people or property resulting from any ideas, methods, instructions or products referred to in the content. |
© 2023 by the authors. Licensee MDPI, Basel, Switzerland. This article is an open access article distributed under the terms and conditions of the Creative Commons Attribution (CC BY) license (https://creativecommons.org/licenses/by/4.0/).
Share and Cite
Vora, J.; Shah, Y.; Khanna, S.; Patel, V.K.; Jagdale, M.; Chaudhari, R. Multi-Response Optimization and Influence of Expanded Graphite on Performance of WEDM Process of Ti6Al4V. J. Manuf. Mater. Process. 2023, 7, 111. https://doi.org/10.3390/jmmp7030111
Vora J, Shah Y, Khanna S, Patel VK, Jagdale M, Chaudhari R. Multi-Response Optimization and Influence of Expanded Graphite on Performance of WEDM Process of Ti6Al4V. Journal of Manufacturing and Materials Processing. 2023; 7(3):111. https://doi.org/10.3390/jmmp7030111
Chicago/Turabian StyleVora, Jay, Yug Shah, Sakshum Khanna, Vivek K. Patel, Manoj Jagdale, and Rakesh Chaudhari. 2023. "Multi-Response Optimization and Influence of Expanded Graphite on Performance of WEDM Process of Ti6Al4V" Journal of Manufacturing and Materials Processing 7, no. 3: 111. https://doi.org/10.3390/jmmp7030111