1. Introduction
Self-fluxing alloys consists of iron-, nickel-, and cobalt-based materials with a proven record of accomplishment for hardfacing applications [
1]. This family of alloys has traditionally been used for thermal spray processes but not for metal additive manufacturing, so the knowledge of the hardening and strengthening mechanisms and the influence of chemical elements such as Cr, B, and C on these mechanisms is lacking, especially due to the particularities of laser material processing and the solidification of these alloys and the microstructure generated. In this research work, the focus is on nickel-based self-fluxing alloys, and, in particular, the Ni-Cr-Si-Fe-B family of alloys, due to the high interest in substituting current Co-based alloys used in aeronautical components for high-temperature applications, such as in sealing rings, valve seats, sliding bearing seats, etc. New generations of commercial nickel-based self-fluxing alloys offering high hardness (up to 60 HRC) are available in powder format only, mainly used to obtain hardfacing coatings or overlays by means of thermal spray [
2,
3] processes such as high-velocity oxy fuel (HVOF) or deposited by arc processes [
4] such as plasma-transferred arc (PTA). Ni-Cr-Si-Fe-B alloys are developed and commonly used for coatings in different applications in which resistance to wear, corrosion, and high temperatures is required, such as in boilers in coal-fueled power plants or gas turbines, depending on the working conditions that generate a specific wear type.
Other compositions of self-fluxing alloys such as Ni-Cr-B-Si are among the most widely used hardfacing alloys for wear and corrosion protection [
1,
5]. Common deposition techniques include thermal spraying, fuse techniques, and laser cladding [
1,
6]. However, there is almost no information about the properties and microstructures of these alloys in casting applications, since these alloys are mainly used for coatings and due to the wide solidification temperature range, which causes segregation problems in casting. Regarding the laser material processing of Ni-Cr-B-Si-C alloys, these alloys present great challenges regarding their laser processability, since they have a wide range of solidification temperatures, which causes segregation and an uncontrolled solidification path, and their high Cr, C, and B content tends to result in a high cracking tendency. There are three pioneering works in the study of the laser material processing of Ni-Cr-B-Si-C alloys: Guo et al. [
7], Conde et al. [
8], and Hemmati et al. [
9]. The latter quickly came to the conclusion that pre-heating and strict control of the laser-based deposition process is necessary to obtain a crack-free material with an adequate microstructure.
During their recent studies, Hemmati et al. [
10,
11] observed that there is a strong relation between the alloy composition and phase formation, microstructure, and properties in laser-clad Ni-Cr-B-Si deposits. They stated that the phase formation of Ni-Cr-B-Si laser-deposited coatings primarily depends on the Cr content and Si/B ratio, with the former controlling the number of Cr-rich precipitates and the latter influencing the nature of the eutectic structures. The high-alloy grades revealed numerous Cr boride precipitates, a low Si/B ratio (Si/B = 1.5), and substantial Ni-B-Si eutectics, while the low-alloy grades showed very few Cr boride precipitates, a high Si/B ratio (Si/B > 3), and small amounts of interdendritic eutectics. The large amounts of hard Cr-rich precipitates and the eutectic structures produced high hardness levels. The effect of lower Cr content and a higher Si/B ratio was to reduce the quantity of borides and modify the nature of the eutectic phases. Some authors have reported the results of laser cladding deposits with Ni-Cr-B-Si alloys reinforced with Tantalum [
12] and with WC [
13,
14,
15]. Ta significantly improves the high-temperature wear resistance of Ni-Cr-B-Si coatings; TaC carbides in Ta-reinforced coatings are only formed in the shape of a block. Since TaC are tightly bonded with the matrix, no TaC particles are pulled out of the coating [
12]; however, the laser material processing is more difficult due to the reflection of Ta and the mechanical mixing procedure with Ni-Cr-B-Si powder does not guarantee homogeneity. In the case of WC reinforcement, high W content promotes also the formation of WC and W
2C structures and an increase in the volume fractions of these carbides in some regions, as evidenced in the induction cladding process [
14]. The microstructure revealed the formation of a γ-Ni dendrite structure with the immersion of WC particles, and the addition of WC improved the hardness of coatings [
16], but, again, the mixture procedure did not guarantee the homogeneity of the hard particles’ distribution.
According to the ISO/ASTM 52900 standard [
17], directed energy deposition (DED) is an additive manufacturing (AM) process that uses a focused thermal energy source (laser, electron beam, or plasma arc) to fuse/melt materials as they are deposited. DED technology covers multiple direct metal deposition processes according to the thermal source used, such as laser metal deposition (DED-LB, more commonly known as LMD in the industrial sector), wire and arc additive manufacturing (DED-Arc or WAAM), and electron beam additive manufacturing (DED-EB or EBAM). Among these processes, the LMD-powder process (DED-LB/p), which utilizes a laser beam and powder feedstock to melt the materials delivered coaxial to the beam, enables the processing of difficult-to-weld materials and multi-material and in-situ alloying. This method has been chosen as a manufacturing technology in this research work. LMD is a key process for the improved design and manufacturing of near-net-shape parts. In fact, some novel results were published recently using this technology for AM with Ni-Cr-Si-B alloys [
18,
19]. This process allows one to obtain a lower layer height and better resolution and accuracy compared with WAAM, and lower investment and implementation costs compared with EBAM. Moreover, WAAM and EBAM have the following drawbacks: the availability of commercial wire materials is limited, and they are more difficult processes to control. Moreover, it is worth mentioning that LMD allows changes in the design (size, material, and shape) of the part/component easily, without major impacts on the manufacturing process chain, reducing the time-to-market.
Among the expected benefits of using LMD as an industrial alternative is to achieve a flexible manufacturing route, which allows reduced design, manufacturing, and market entry times, with less environmental impact than current manufacturing solutions such as centrifugal casting, gravity casting, etc., and to reach similar or superior high-temperature wear behavior (up to 700 °C) compared to the cobalt-based (Stellite-type) alloys currently used for aeronautical components. The aim of this work was to gain knowledge about the microstructure resulting from the LMD process with Ni-Cr-Si-Fe-B alloys of different chemical compositions, and to establish more clearly the solidification path and strengthening mechanisms that contribute to the hardness of the self-fluxing Ni-based alloys obtained by the directed energy deposition process using a laser beam. After studying promising solutions and evaluating the commercial composition grades of self-fluxing Ni-based alloys, three potential compositions were selected as a starting point for a deep process manufacturing route study. The material samples used for this research work were obtained after optimization of the LMD process parameter set and deposition conditions for the additive manufacturing of bulk preforms. The evaluation of the as-built microstructure, hardness, and elastic modulus was based on the measurement of the hot hardness, nanoindentation, and electron microscopy in bulk cylindrical samples manufactured by LMD.
2. Materials and Methods
In this section, we detail all materials, equipment, and methods that were used in the research work. We started with the selection of three potential composition grades from commercial Ni-Cr-Si-B alloy powders with different chemical compositions, and then we manufactured a bulk cylinder with optimized DED-LB/p process parameters. Afterwards, we carried out an extensive material characterization campaign using optical microscopy (LOM), hardness measurements at room (RT) and high temperature (HT), field emission scanning electron microscopy (FESEM) analysis, and nanoindentation tests to measure the hardness and elastic modulus in the phases identified in the microstructure.
2.1. Ni-Cr-Si-Fe-B Alloys Studied
Three Ni-based self-fluxing alloys as feedstocks were selected, covering a wide range of chemical compositions and achievable hardness in the as-built condition, due to their content of Cr and C (as carbide promoters) and solid solution hardening and boride promoters (B, Ni, Si, Cr). Moreover, corrosion resistance (Cr, Ni) and potential wear behavior at HT (certain Fe content is needed for the formation of the glaze layer) were taken into consideration for the preselection of the composition grades.
The gas-atomized Ni-Cr-Si-Fe-B powder particles used in this study were manufactured by Oerlikon Metco AG, Wohlen, Switzerland (Alloy A) and by Flame Spray Technologies B.V., Duiven, The Netherlands (Alloys B and C); they were sieved to achieve a particle size of +53–125 μm in Alloy A and +20–53 μm in Alloys B and C, according to the technical specifications provided by the manufacturers. The plates used as substrates were manufactured with austenitic stainless steel (EN 1.4404, 10 mm thickness) and were provided in a soft condition (hot-rolled and annealed). The batch chemical compositions reported by the manufacturers of the powders are shown in
Table 1.
The pre-alloyed powders were analyzed in LORTEK S.Coop. Spain, using an FESEM microscope, the Zeiss Ultra Plus model, equipped with an X-ray detector from Oxford Instruments (X-Max), which allowed us not only to capture high-resolution images of the particles, but also to perform a semi-quantitative chemical analysis using the energy-dispersive spectroscopy (EDS) technique. The particles showed a spherical shape, a morphology commonly obtained from the gas atomization procedure in their manufacturing. After the image analysis of the particles, the results revealed that 10% of the particles had sizes of less than 76.21, 33.52, and 33.06 microns in diameter (d10 parameter) for powders A, B, and C, respectively; 50% of the particles (d50) were less than 94.80, 47.05, 47.19 microns in diameter; and a cumulative 90% volume of the powder particles (d90) had a diameter of less than 116.05, 58.52, and 52.18 microns in each powder. The analysis of the particle shape and size distribution (diameter) in the powder is very important for the LMD process, to ensure an adequate powder stream when using discrete coaxial nozzles. The particle size distribution of these particles was almost normal. Due to the typical powder feeder system used in the DED process, a fine-medium granulometry and regular sizes and shapes are required, so the adequate flowability of the powder determines the optimal powder stream and efficiency in the coaxial nozzle for laser melting and the deposition of the raw material in the AM process.
2.2. Laser Metal Deposition Equipment and Set-Up
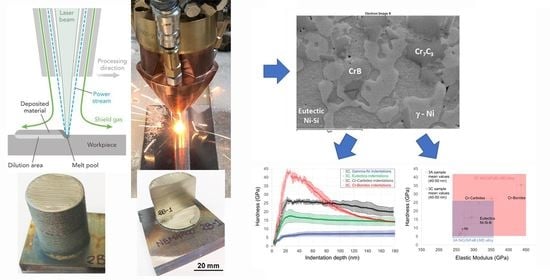
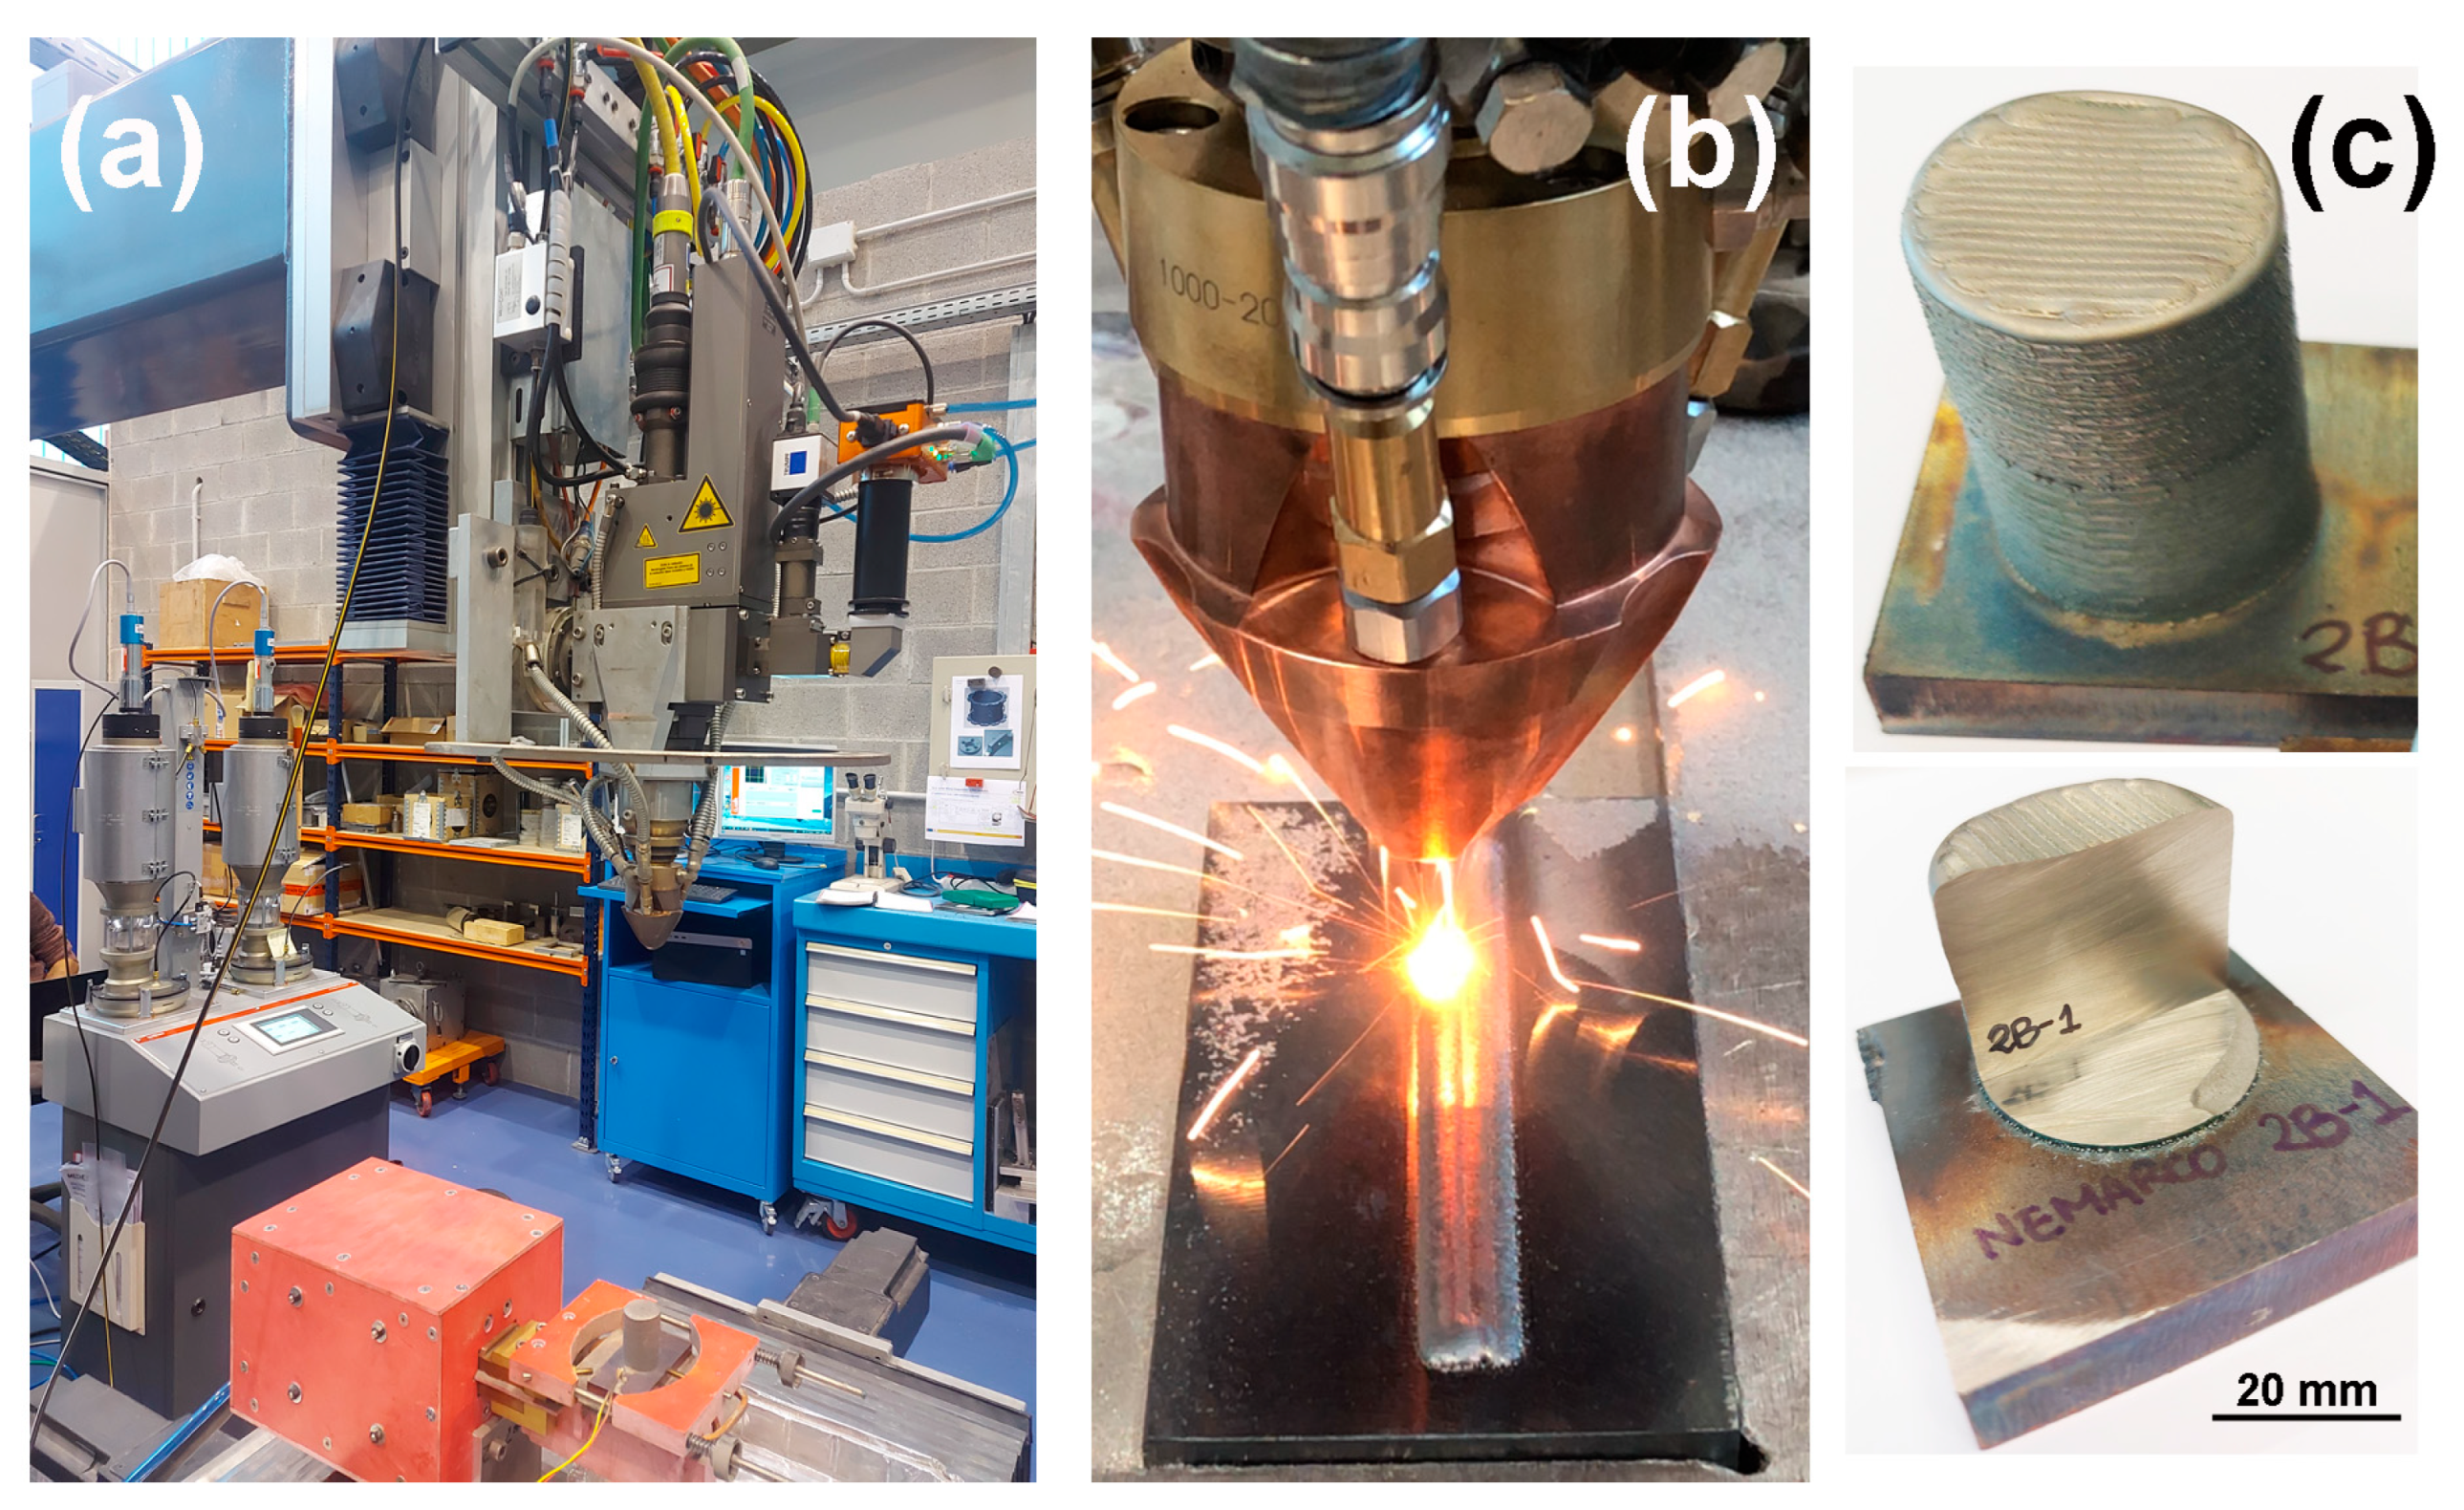
The system used for the DED-LB (LMD) process was a 4-axis Cartesian kinematic station equipped with classical CNC (FAGOR 8070, Mondragón, Spain) and a solid-state 3 kW Nd:YAG laser source (Trumpf HL-3006D, Ditzingen, Germany), operated in continuous wave mode with a wavelength of 1064 nm, and the beam was guided through an optic fiber of 600 µm. The configuration of the LMD station included an optic head (Trumpf BEO D70B, Ditzingen, Germany) with two on-axis camera/sensor ports and an electric induction heating system for the build plates (up to 1000 °C and 10 kW) with temperature control, installed in the CNC table, and floating clamps were added to the fixture to allow thermal expansion and distortions in the build plate during deposition. For powder delivery, the LMD station had a powder feeder with two 5 L heated hoppers (Oerlikon Twin 150, Wohlen, Switzerland) and a 3-jet discrete nozzle (3-Jet-SO16-F manufactured by FhG ILT, Aachen, Germany). Argon was used as a protective gas (10 L/min) and as a carrier gas (4 L/min flow at 2 the system is illustrated in
Figure 1).
The new manufacturing process route and process parameter optimization of the Ni-Cr-Si-Fe-B self-fluxing alloys obtained by LMD were reported previously in a research paper by the authors [
20]. The current research work is closely related to the previous one and is based on the process development and experimental work performed. A constant laser power of 700 W and a focused laser spot diameter of 2.2 mm were used. The track overlap was 37.5%. The criterion to set these parameters as constant values was to obtain a certain bead geometry (width, heigh, and aspect ratio) based on the geometry of the bulk cylinders for the test plan and with a view to the final preform geometry of the objective aeronautical components. The rest of the process parameters were modified in a type of simplified design of experiments (DoE), influencing the laser energy density delivered and the solidification conditions of the molten metal, and to ensure a fixed layer thickness. The deposition speed was varied in three levels, 1—slow, 2—medium, and 3—fast, using 300, 500, and 700 mm/min, respectively. The powder mas flow was adjusted for each speed to achieve a layer thickness of 0.7 mm. The three process parameters set and the three composition grades for the Ni-Cr-Si-Fe-B alloys used were derived in nine different experiments for the simplified DoE. Bulk cylinders were manufactured and the samples were labeled using a number and a letter, with the number indicating the deposition speed level (1, 2, or 3) and the letter indicating the alloy used (A, B, or C), e.g., Sample 3C was obtained with Alloy C and a fast speed deposition level.
2.3. Solidification Simulation, Microstructural Characterization, and Testing Techniques
For the solidification path analysis, Scheil solidification simulations were performed with the FactSage 8.2 software using the databases FactPS and FSstel and considering the measured chemical compositions of the as-built LMD samples. The Scheil solidification model was used previously by Feng et al. [
21] to carry out simulations of solidification behavior during welding. The Scheil model considers perfect diffusion in the liquid but no diffusion in the solid as the temperature is decreased. It is a well-accepted approximation for weld solidification since the relatively fast cooling rate during welding limits the solid-state diffusion of alloying elements (other than carbon and boron), and the strong molten metal flow during welding tends to homogenize the chemical composition in the molten weld pool.
For microstructural evaluation, the bulk cylinders additively manufactured were cut from the build plate and their cross-sections used for porosity and microstructure analysis. For RT and HT hardness samples, the cylinders were machined to a lower diameter and additional disks (25 mm diameter and 5 mm in height) were extracted from the initial (bottom), middle, and final (top) layers. Over these samples, the metallographic preparations were carried out. The metallographic preparation procedure followed the guidelines of the ASTM E3 standard. The first step was the embedding of the samples in conductive resin, followed by grinding with abrasive papers of different grit sizes, and finally fine polishing using polycrystalline diamond particles in an aqueous suspension. To reveal the microstructure, a chemical etch was carried out, using a chemical reagent recommended for this type of material according to the ASTM E407 standard.
Microhardness Vickers measurements at room and a high temperature (650 °C) were performed in a modified Buehler MacroMet 5112 durometer, using a load of 500 g (HV0.5 scale). For the hot hardness measurements, the Vickers hardness device was modified to operate at elevated temperatures and incorporated a WC Vickers tip. The samples were heated at 650 °C, indented, and then cooled with a water-cooling device at each measurement. A thermal shield was installed on the mechanical components of the tester to avoid unwanted effects. For temperature control, a K-type thermocouple was installed inside the disc sample using a lateral drill hole of D1.1 mm and a 10 mm depth, generated by electric discharge machining (EDM). Five tests or indentations were made on one flat side of the disc, and then the hardness was obtained by measuring the diagonals of the indentations by interferometry. The high-temperature hardness values were corrected considering the thermal expansion of the footprint at HT. The Vickers hardness values were converted to Rockwell C hardness (HRC) for comparison purposes using the tables of the ASTM E140-12B standard.
The macro- and microstructural analysis was carried out using light optical microscopy (LOM) at different magnifications (from 100X to 1000X) with an Olympus GX51 optical microscope with an image acquisition system via a digital camera. The chemical etching was carried out manually for 12 s with a reagent composed of 7 mL HF, 3 mL HNO3, and 5 mL of H2O. For more advanced studies of the microstructure, an FESEM microscope, the Zeiss Ultra Plus model, equipped with an X-ray detector from Oxford Instruments (X-Max), was also used.
To identify the mechanical response of each phase/microstructure and their contributions to the properties of the obtained material, a square matrix of 144 nanoindentations was obtained for each sample using an Agilent Tech. G-200 nanoindenter. Indentation tests were performed using a Berkovich geometry tip at 250 nm depth and spaced between them for 15 microns. The in-depth stiffness profile was obtained using the Continuous Stiffness Measurement method. For the calculation of the hardness and elastic modulus, profiles were averaged between 40 and 50 nm indentation depth, since it was found that at greater indentation depths, a mixture in the measured values could be obtained due to the crossing of different microstructural phases in the sample. The Poisson’s coefficient used for the Young’s modulus calculation was 0.3 for all samples.
3. Results and Discussion
3.1. Powder and Additively Manufactured Material Characterization Using Optical Microscopy
The deposition strategy and trajectories were optimized to obtain cylindrical specimens with a diameter of 32.5 mm and a 35.2 mm height, with minimal geometrical distortions (near-net-shape cylinder form). In the process development of the bulk cylinder preforms, adequate additively manufactured material was obtained, and lower internal porosity and adequate layer thickness was achieved. However, in Alloys B and C, some cracks appeared at medium- and high-speed deposition rates without a certain level of pre-heating of the build platform. To address this situation, in the last trials, it was decided to pre-heat the build plate at 300, 400, and 500 °C for Alloys A, B, and C, respectively, in all deposition conditions. The temperature in the build plate was controlled during the pre-heating and during deposition, using a type K thermocouple soldered on the top surface; the temperature control acted on the induction system used. The strategy used was the controlling of the build plate temperature during the deposition, implementing slight tuning on the powder flow rate to achieve a layer thickness of 0.7 mm due to the different powder granulometry used. The build plate was pre-heated up to 500 °C and the temperature control during deposition allowed us to reduce the heating rate (°C/s) and the cooling rate (°C/s) in the Ni-Cr-Si-Fe-B alloys. The amplitude of the temperature peaks that occurred in the thermal history of the layers previously deposited in the cylinder was also reduced, contributing to reduced crack susceptibility, as reported by Sadhu et al. [
22] and Shi et al. [
23]. The pre-heating also influenced the thermal stress field and residual stresses after deposition in these alloys [
23,
24]. Initially, cross-sections of solid samples with four layers deposited were evaluated, and no significant cracks or other defects were observed using pre-heating. Then, bulk cylinders with a 35.2 mm height were produced for the three composition grades for testing and evaluation. Nondestructive inspections were performed (visual and penetrant tests), with positive results at least on the external surfaces of the samples produced.
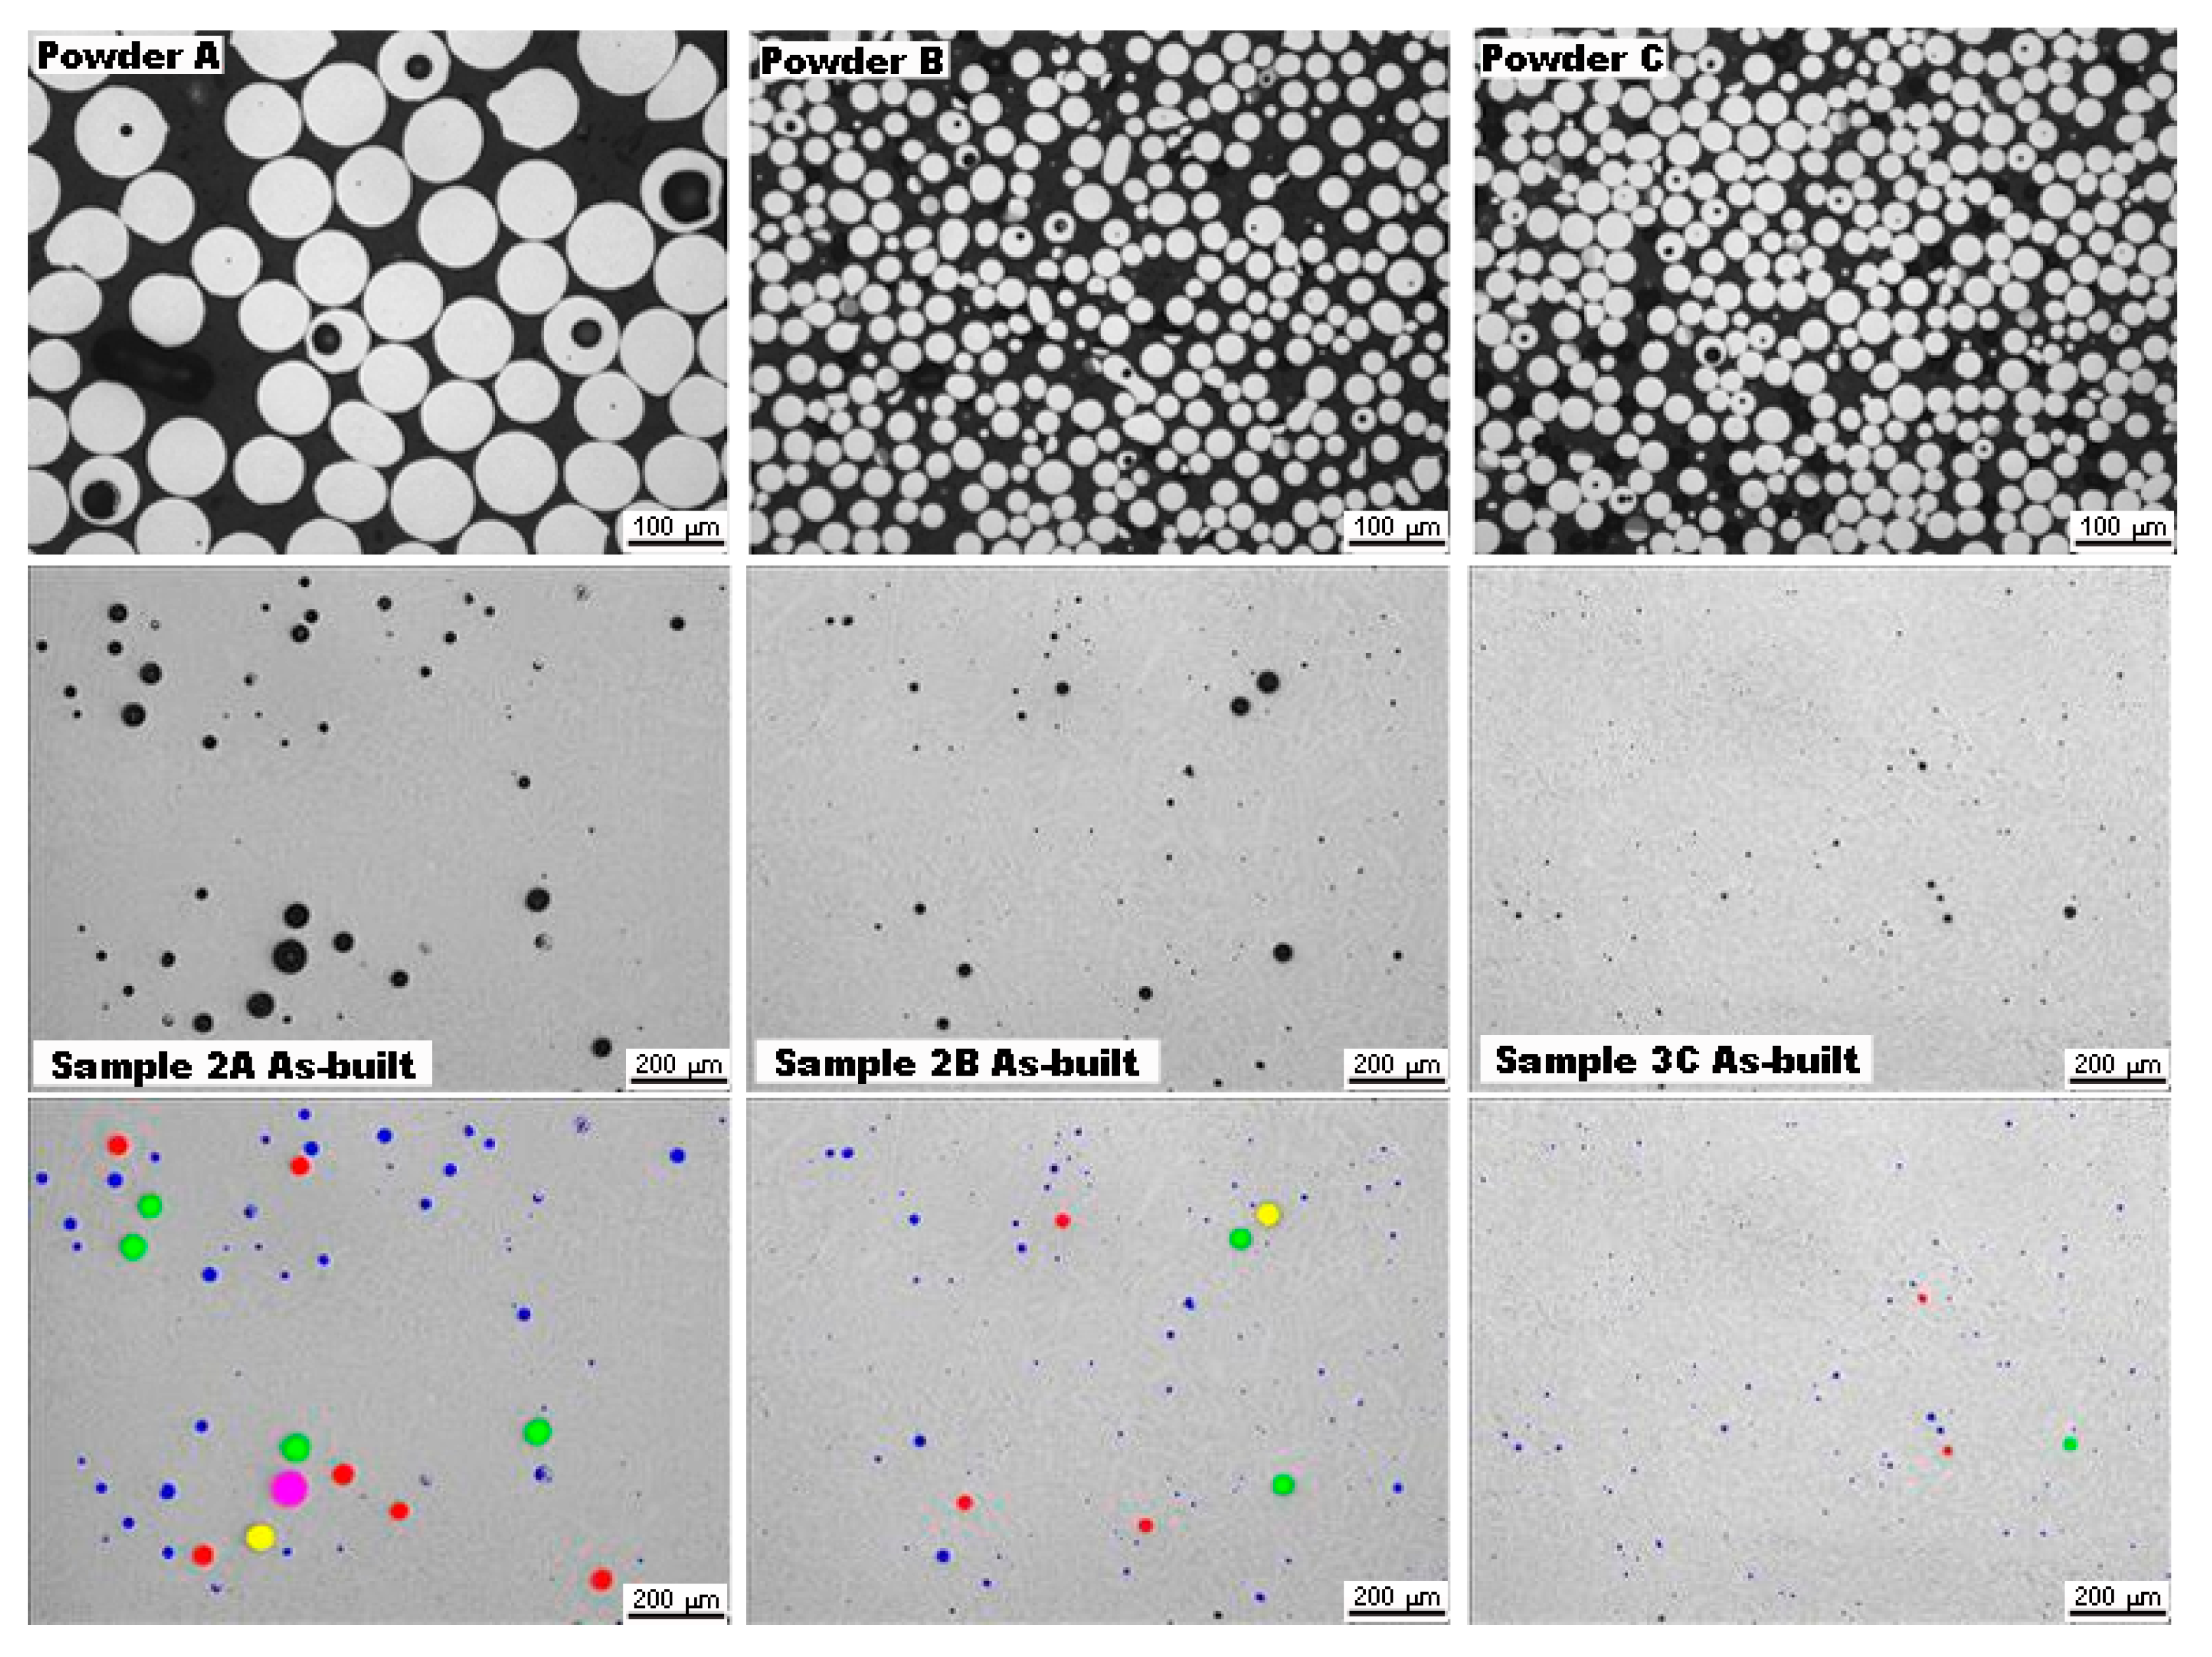
The first stage in the material characterization of the samples was the measurement of the internal porosity level in the powder feedstocks and in the nine LMD bulk cylinders. This was performed by evaluating the cross-sections (XZ plane) of the cylinders with a metallographic preparation procedure, followed by an image analysis of the micrographs taken with a digital camera system installed in the optical microscope and using algorithms for the detection and classification of the porosities in terms of size and shape, as well as subsequent quantification in terms of the porosity area (%) on each image. Six optical micrographs at 100X magnification were taken in different zones of each sample studied, to calculate then the mean value.
Between the three composition grades pre-selected, in Alloy A, greater internal porosity was found in some particles compared to the rest of the characterized powders. In the micrographs of
Figure 2, we can see, as an example, the porosity shape and distribution in the cross-section of the powder particles and then in the XZ plane of the bulk cylinders obtained by LMD. The worst results were obtained with Alloy A, independently of the LMD process parameters used (see
Table 2), and the best results were achieved in general with Alloy C, with the higher densification obtained using a fast deposition speed (Sample 3C). There was a clear correlation between the internal porosity observed in the powder particles and the resulting porosity due to gas trapped during solidification in the deposited material for all the alloys studied.
The mean value and deviation of the calculated porosity percentage measured in six micrographs for each sample are compiled in
Table 2, and their evolution with the composition grade and LMD process parameter set is shown in the bar graph in
Figure 3. No clear tendency was observed for the influence of the deposition speed on the porosity, but the highest values were obtained on medium-deposition-speed samples, and the lowest values (at least for Alloys B and C) were measured with a fast deposition speed.
Optical microscopy examination was used to identify characteristic features of the material obtained by additive manufacturing by LMD. The layers located in the middle zone of each cylinder had a very fine microstructure but they grew slightly when the slow process parameter was used (set 1). The dendritic structure observed in the zones near to the cylinder’s surface and near to the build plate indicated that very rapid cooling had taken place within the individual molten pool, after each laser track. The dendrite size for process parameter set 1 was the largest, decreasing for set 2 and set 3 according to the increase in the cooling speed and solidification rate (see
Figure 4), so the finest/thinnest dendrite microstructure was achieved with the highest deposition rate. This is because, with the high deposition rate and pre-heating conditions used, the solidification rate of the solid–liquid interface (R in mm/s) was high, and the temperature gradient in the liquid ahead of the solid–liquid interface (G in K/mm) was not particularly high, which favored columnar dendritic structures after solidification. The combination of G and R in turn generated two important combined parameters, mentioned previously: the cooling rate, which is equal to GxR in directional growth, and the interface stability criterion (for sub-constitutional cooling), which is the G/R ratio. The former essentially defines the nature of the dendritic growth.
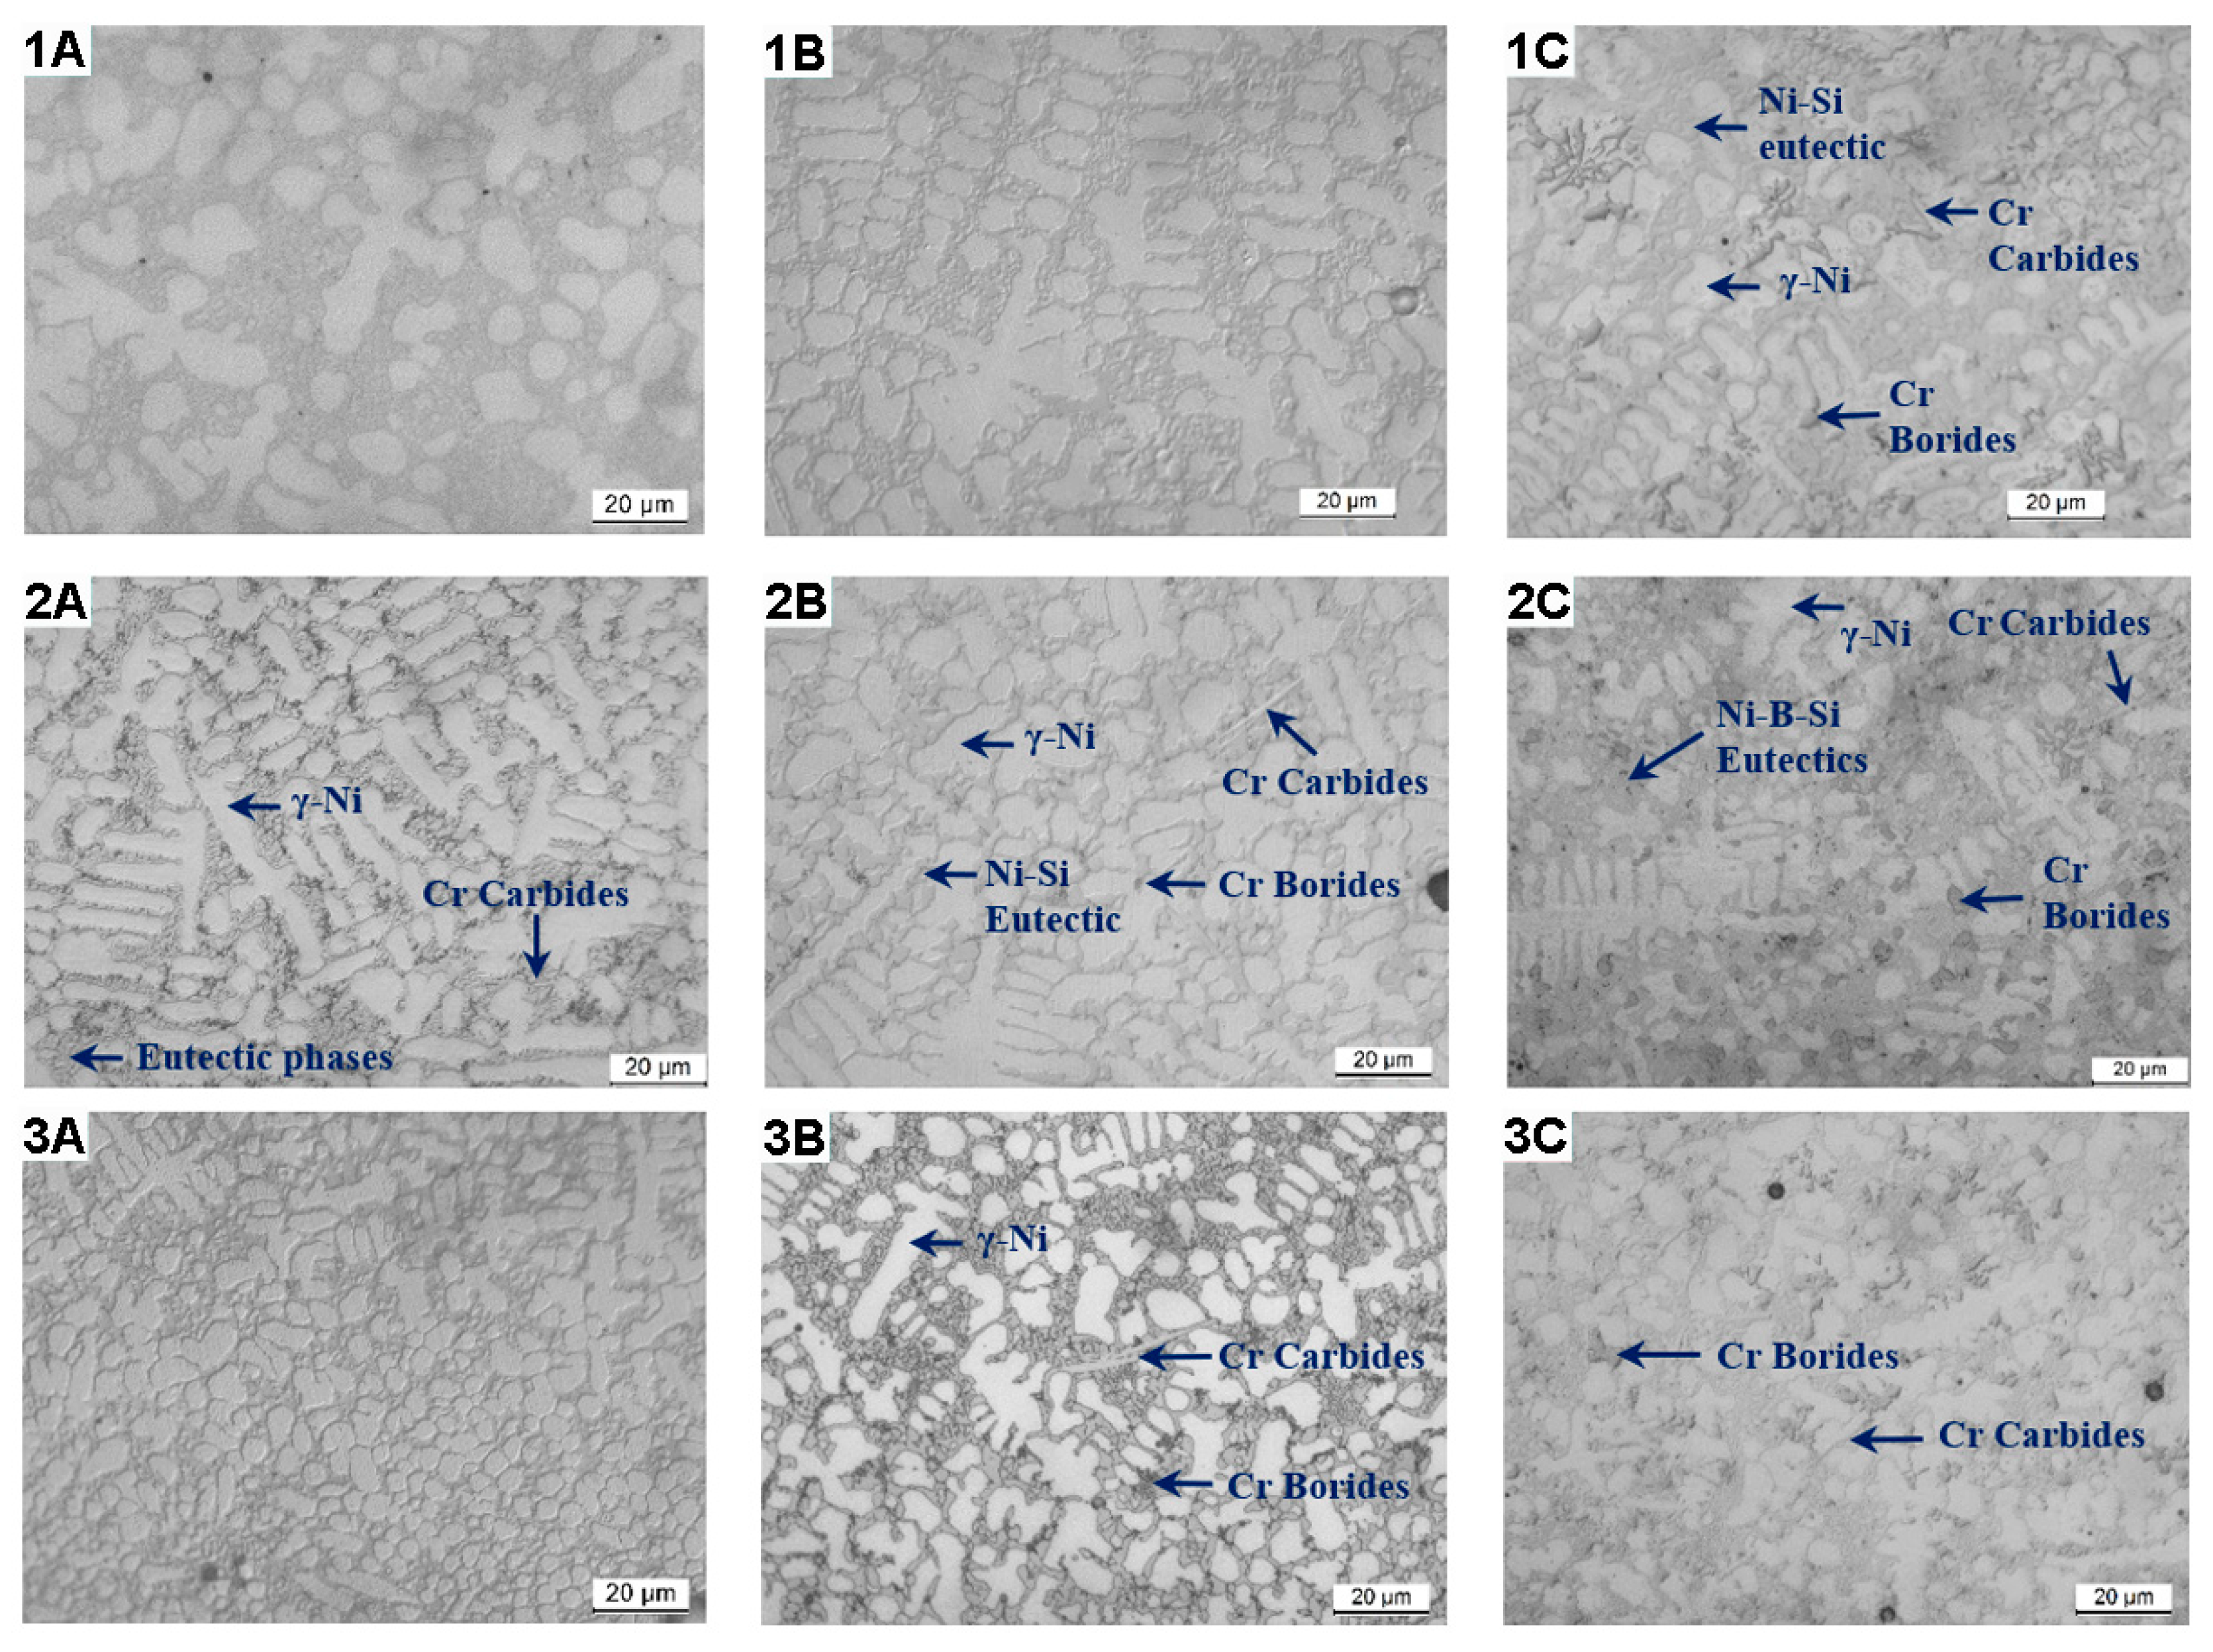
According to the morphology and color of the observed phases after chemical etching, each one was labeled during optical microscopy analysis. In Alloy A, the main phases were gamma Ni, which was the predominant dendritic matrix phase, eutectics, and small quantities of carbides. In Alloy B, higher quantities of carbides and small quantities of borides were present with similar eutectic structures, and, in Alloy C, a larger number of homogeneously distributed carbides and borides was observed. The increase in Cr, Si, B, and C content seemed to promote the increased formation of borides and carbides, as well as eutectics of a slightly different morphology.
3.2. Microhardness Measurements at Room and at High Temperature
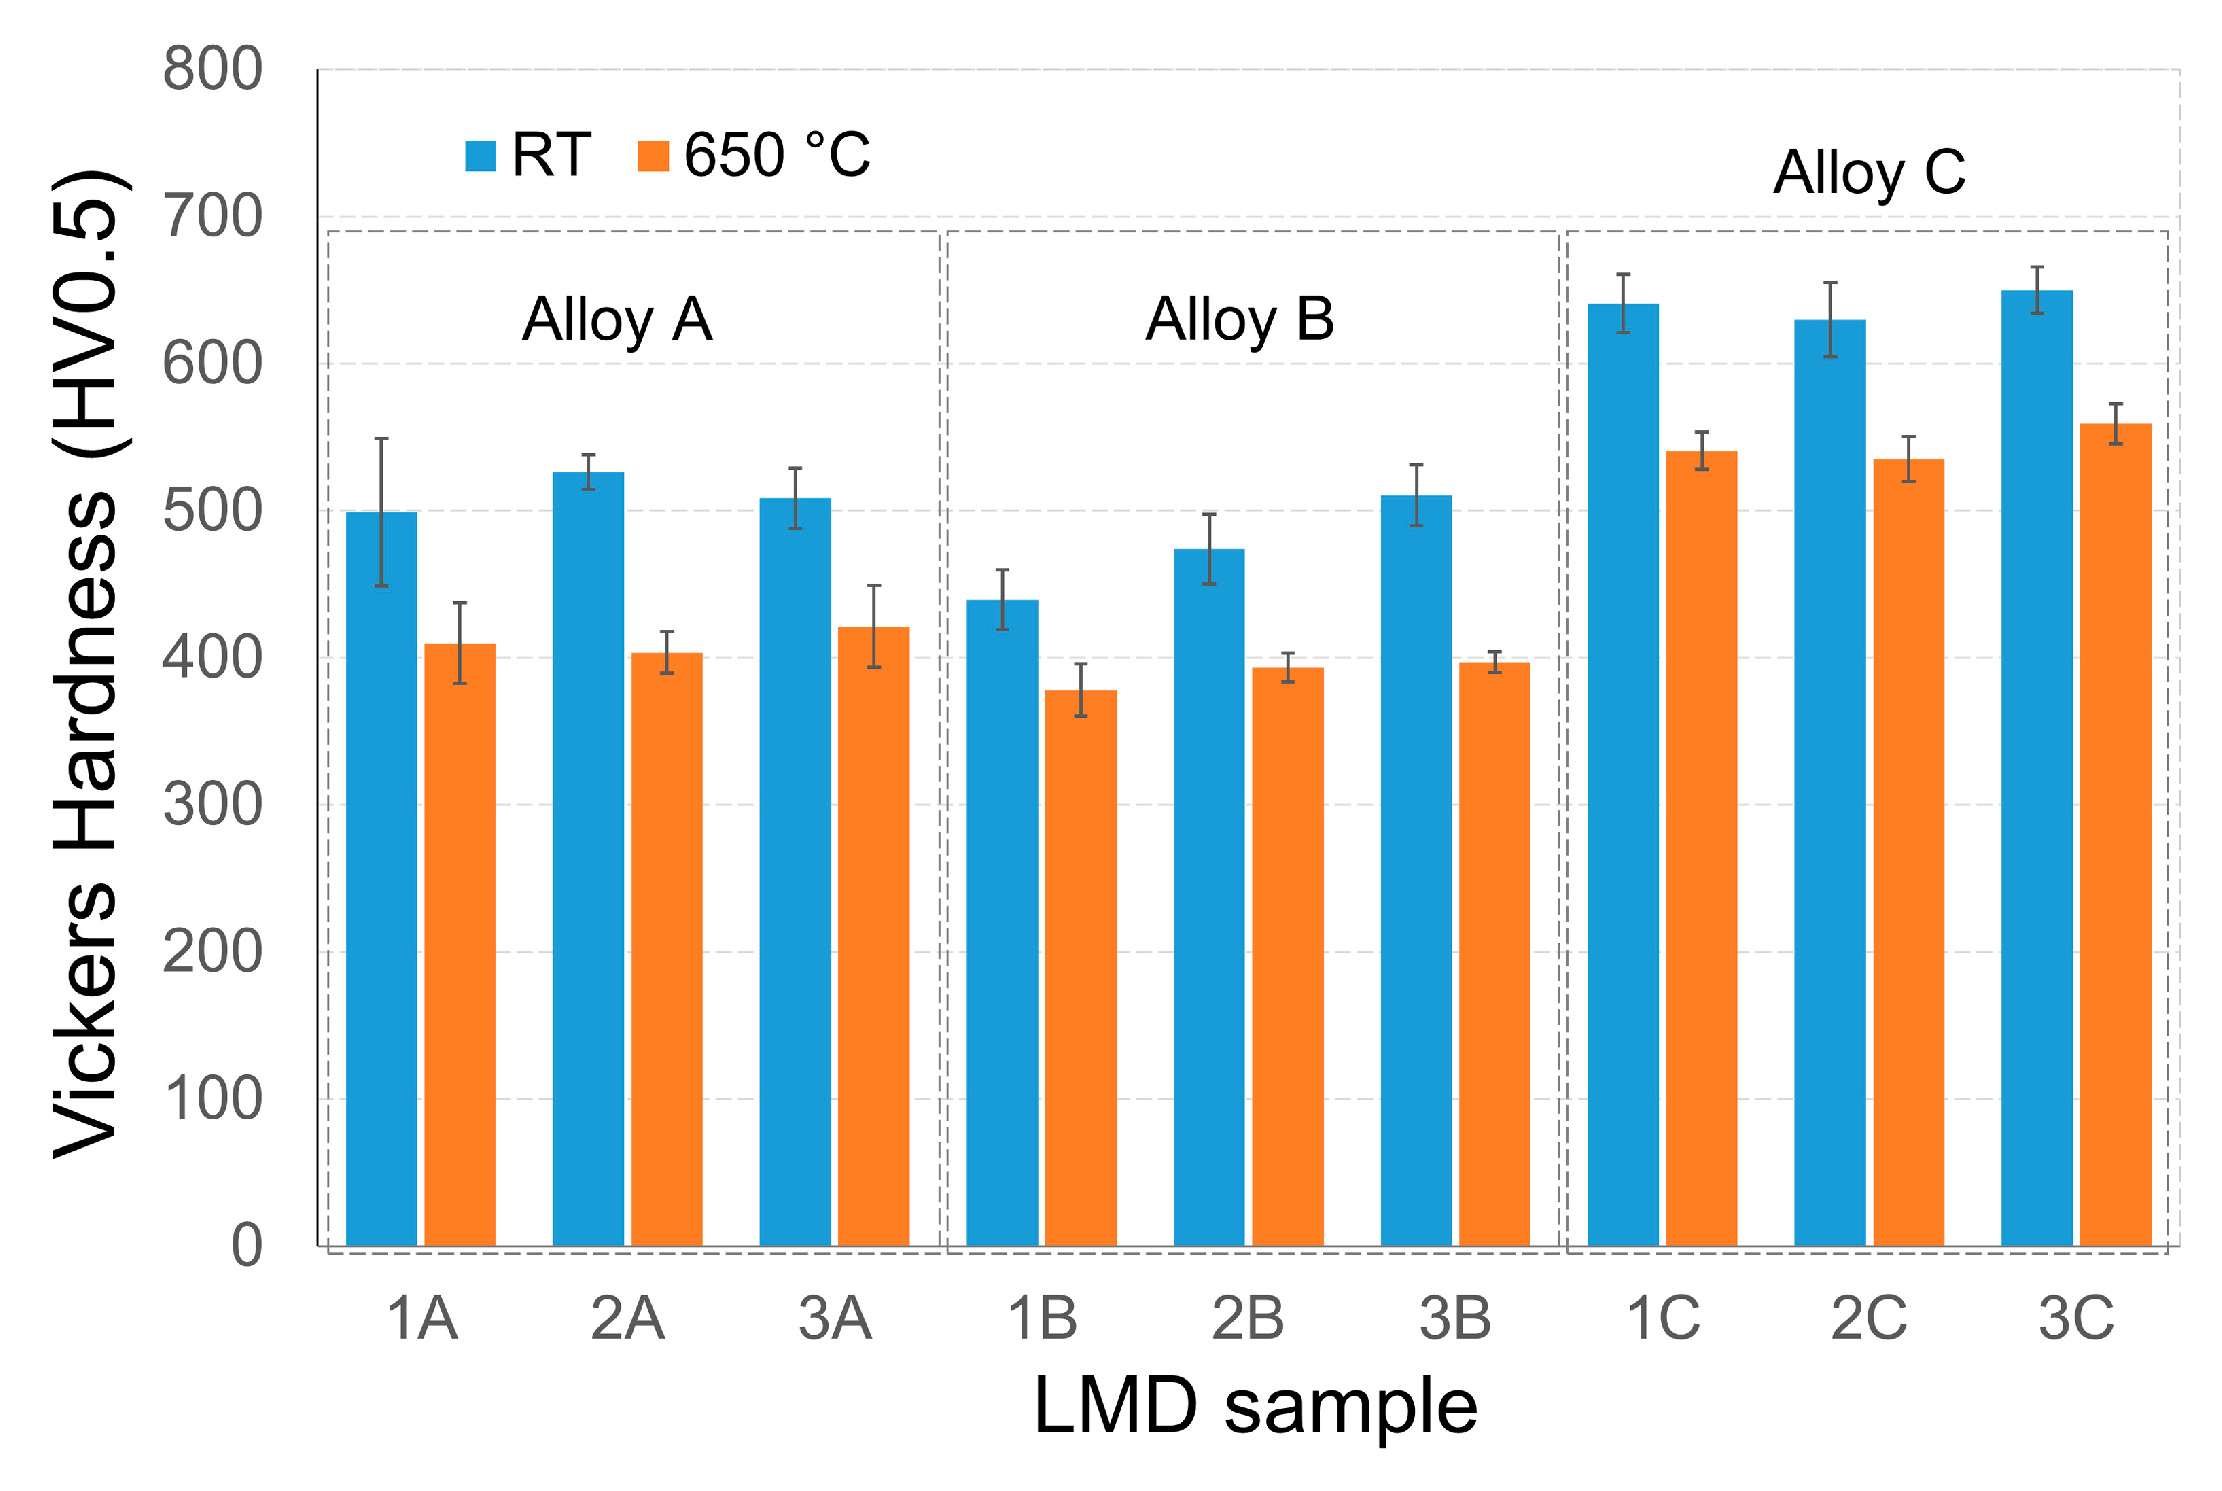
A comparative analysis of the hardness behavior at room temperature (RT) and at high temperatures (HT) was performed. In the following bar graph (
Figure 5), the mean values and deviation of the measured microhardness values, evaluated in the nine Ni-Cr-Si-Fe-B disc samples extracted from bulk cylinders obtained by LMD, can be observed. Among the three composition grades studied, Alloy C was the one with the highest hardness. In the literature, similar values of RT hardness are reported, in some cases slightly higher [
19,
25,
26] and in other cases lower [
23,
27,
28] than obtained here. No references to HT hardness values were found in the literature review. The micro- and macrohardness in the as-built condition are strongly dependent on the content of Cr, C, and B in Ni-Cr-Si-Fe-B alloys and by the specific LMD process parameters used. Our results revealed that the hardness measured at higher temperatures showed in a reduction in hardness (softening) of 14–18% depending on the deposition rate, being higher in the samples deposited at the lower rate, in which a coarser microstructure was observed in the optical microscopy analysis.
The hardness measured at room temperature in the samples manufactured with Alloy C was higher than the hardness reported for the Stellite 6 cobalt-based alloy obtained by laser processing [
29] and casting [
30], which is a promising result/solution for its substitution.
The high hardness of Alloy C can be explained as follows. In the microstructure of Alloy C, larger amounts of carbides and borides were observed, which enhanced the strengthening mechanisms via precipitation hardening. In addition to the potential solid solution hardening of the γ-Ni dendrites, the higher alloying element content (Cr, C, and B) in Alloy C and also the presence of hard boron-rich Ni-Si-B eutectics raised the hardness of the alloy. Borides were not present in Alloy A and were present in a very low quantity in Alloy B (at least in this initial LOM characterization analysis), so the hardness in the case of Alloys A and B may have been largely due to solid solution hardening in both eutectics and the gamma nickel matrix. This hypothesis could be confirmed by measuring the hardness and elastic modulus by nanoindentation on these phases and precipitates.
For subsequent advanced microstructural characterization and nanoindentation measurements, Alloys A and C, obtained with fast deposition parameters (Samples 3A and 3C), were selected to continue the study. The criteria for selection were essentially the high-temperature hardness achieved and the specific manufacturing condition that generated a fine microstructure and reduced deposition time. A comparison between the two extreme composition grades by FESEM and nanoindentation can help to better discriminate and analyze the hardening mechanisms of these alloys.
3.3. Microstructural Characterization with FESEM and EDS
In LMD samples, the matrix phase is a solid solution of Ni with some Cr and Fe providing a dendritic structure (γ-Ni phase), as reported in Ni-based alloys processed by a laser [
31,
32] and observed previously in an optical microscopy analysis (see
Figure 4). There is an interdendritic lamellar eutectic phase composed mainly of Ni and small amounts of Si (Ni-Si eutectic phase), according to the chemical composition obtained by semi-quantitative EDS analysis.
FESEM analysis was used for the identification and quantification of carbides and borides. Initially, the microstructure analysis was performed for the intermediate conditions of process parameter set 2 (medium speed) as a reference to evaluate the nature of the different alloys, as it was a medium range within the deposition rates studied. This allowed us to intuit the relationship that may exist between the microstructure and hardness, which may indicate the predominant strengthening mechanism considering the variation in the deposition rate.
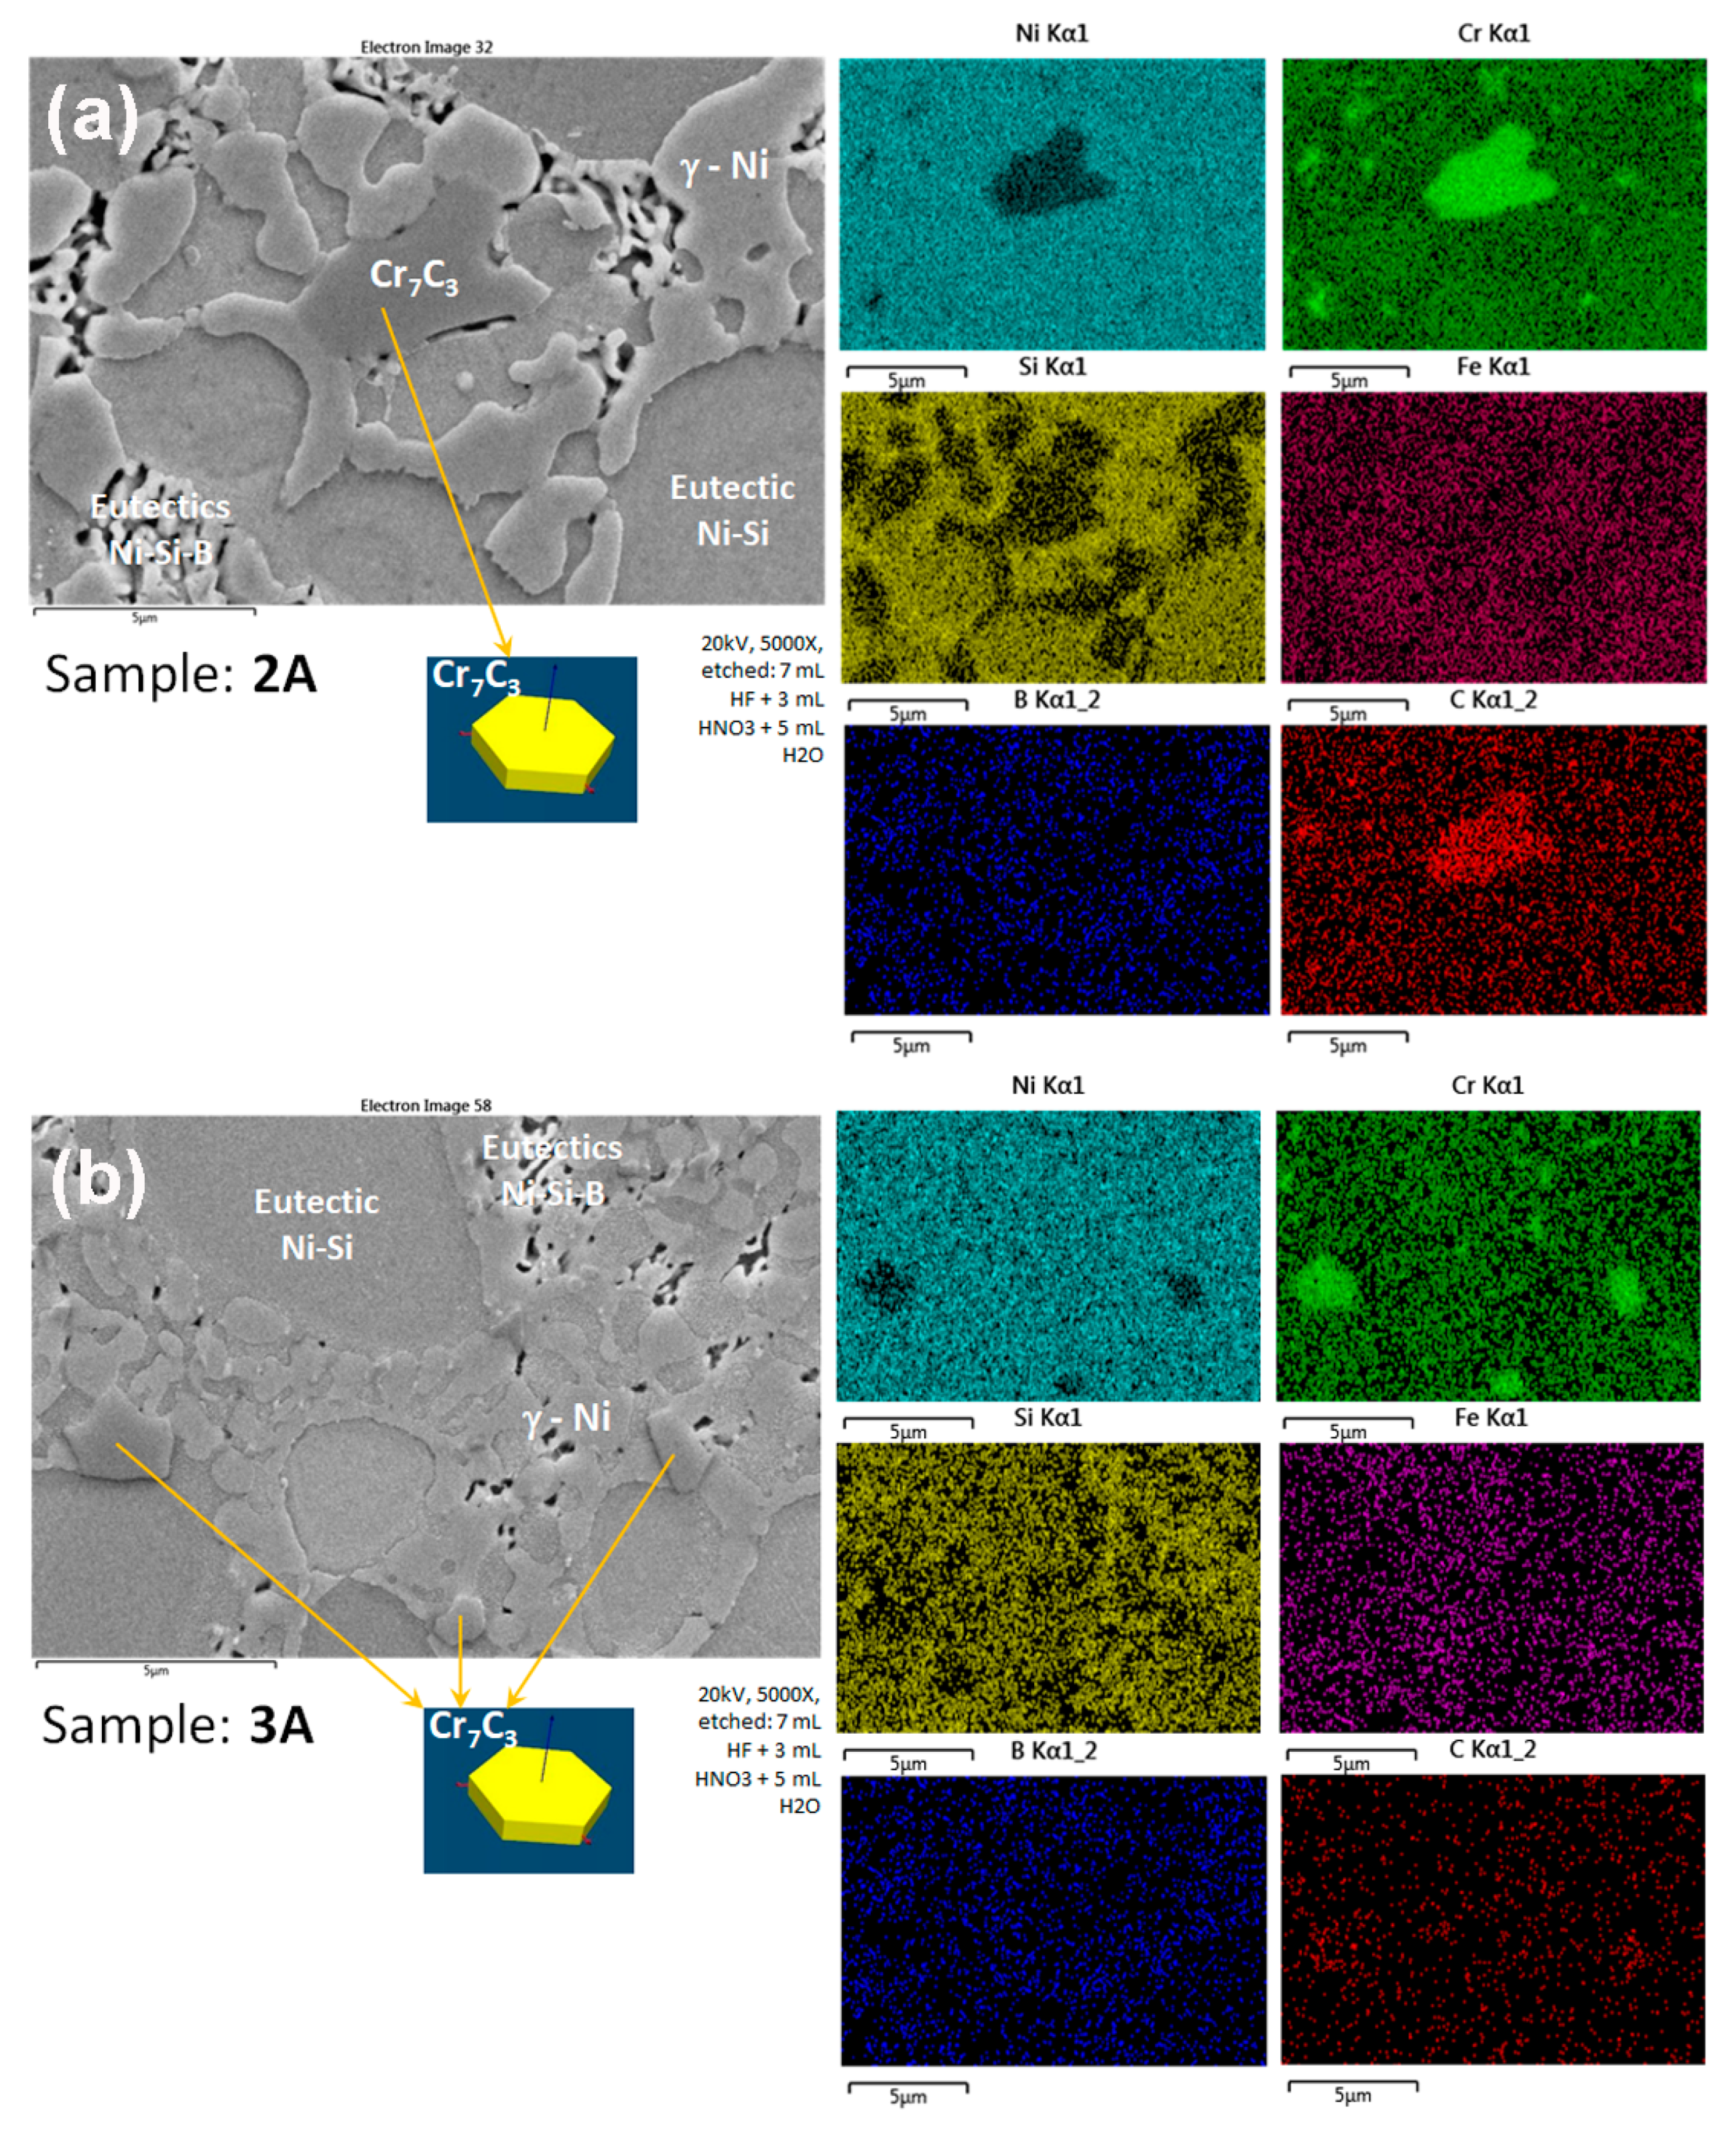
Figure 6 shows the FESEM micrographs and EDS maps for the samples obtained with Alloy A and different process parameters. The microstructure for medium and fast deposition differed in the dendrite and eutectics morphology; the microstructure became finer as the deposition rate increased.
Figure 7 shows the microstructure at high magnification for the samples obtained with Alloy C, where we can observe the small differences in the size and distribution of the phases. The main differences between the two alloy composition grades were the presence of borides in Alloy C and their different eutectic morphologies in comparison with Alloy A.
Differently shaped boron-containing precipitates permeated the matrix, but they were observed mainly in the high-alloyed Ni-Cr-Si-Fe-B composition grade C in the form of isolated borides (CrB) and as Ni
3B in the Ni-B-Si eutectic phase. This is in agreement with the in-depth analyses conducted by other authors [
17,
26,
33,
34]. The precipitation of the carbides (chromium-rich carbide compounds) was observed in all composition grades studied. The phase labeling in the LOM micrographs was supported by the identification of the different phases, precipitates, and segregates after an in-depth FESEM analysis with semi-quantitative measurements using EDS microanalysis and chemical composition maps.
The main phases identified are shown in
Figure 6 and
Figure 7 for composition grades A and C, respectively. The samples were obtained with process parameter sets 2 and 3, with medium and fast deposition rates (Samples 2A–3A and 2C–3C, respectively). In the composition grades with lower content of B and Cr, it was possible to identify blocky, irregularly shaped Cr
7C
3 carbides and additionally different eutectic phases, such as binary Ni-Si (Ni3Si) and ternary eutectic Ni-B-Si phases (combining Ni
3B, Ni
2B, and Ni
3Si). In Alloy C with higher amounts of Cr, B, and C (as in Ni60A and Colmonoy 6 alloys), the blocky Cr-rich carbides and borides and binary Ni-Si eutectics were observed in our study. However, according to the literature [
9,
35], in the Ni60A and Colmonoy 6 alloys, other well-defined Cr-rich precipitates, such as Cr
23C
6, Cr
3C
2, and Cr
2B, confirmed by XRD analysis, could be present in the high-alloyed grades.
According to the stoichiometry derived from the EDS analysis, the borides present in Sample 3C could have been CrB (indexed also by EBSD), and, in the case of carbides, the indexed type was the Cr7Cr3 chromium carbide type in both Samples 3A and 3C. As is well known, the rapid solidification induced by the laser deposition process generates an out-of-equilibrium microstructure, and it is very difficult to determine the compositions of phases and to predict phase formation through equilibrium diagrams. At high magnifications, precipitates of Ni3B, Ni2B, and perhaps Ni2Si could have been present in the eutectics, but this was not confirmed by our FESEM microstructure analysis.
3.4. Scheil Solidification Simulation and Solidification Path Proposed
According to the literature, the solidification range of Ni-Cr-Si-Fe-B alloys increases with increasing Cr, Si, Fe, B, and C content, resulting in the formation of borides and carbides in the liquid [
34,
36]. In the Ni-Si-B ternary system, the thermodynamic and phase equilibria studies presenting ternary diagrams show how the liquid is enriched in Si and B, causing the formation of a hard Ni
3B phase in the eutectics [
37,
38]. In a similar way, in Ni-Cr-Si-Fe-B alloys, the high content of Cr, Fe, B, and C during solidification preferably gives rise to boride and carbide precipitation. Considering these mechanisms of microstructure formation, the following solidification paths could be proposed for the alloys studied as a function of the increase in the content of their main chemical elements:
Liquid → (Cr)C + Liquid 1 → (Cr)C + (Cr)B + Liquid 2 → (Cr)C + (Cr)B + Solid Solution γ-Ni(Fe, Cr, Si, B) + Liquid 3 → (Cr)C + (Cr)B + Solid Solution γ-Ni(Fe, Cr, Si, B) + Eutectics (γ-Ni + Ni3B + Ni3Si).
This solidification pathway is quite similar to others proposed by Aubry et al. [
18] and by Wang et al. [
34] for Ni-based self-fluxing alloys processed by a laser, but the solidification path proposed by us also takes into consideration the fact that, according to the carbon, boron, and chromium content and the temperatures of the phase reactions that may occur during the LMD process, the first precipitates should be the chromium carbides, and, only if the boron and chromium content is high enough, the formation of subsequent chromium borides is possible. The solid solution strengthening in γ-Ni dendrites is increased if additional content of Fe, Cr, Si, and B is available for this mechanism. As observed in the FESEM micrographs and EDS analysis, in Alloy A, only carbides were observed, and then the remaining B and Si with Fe was directed toward the interdendritic eutectics.
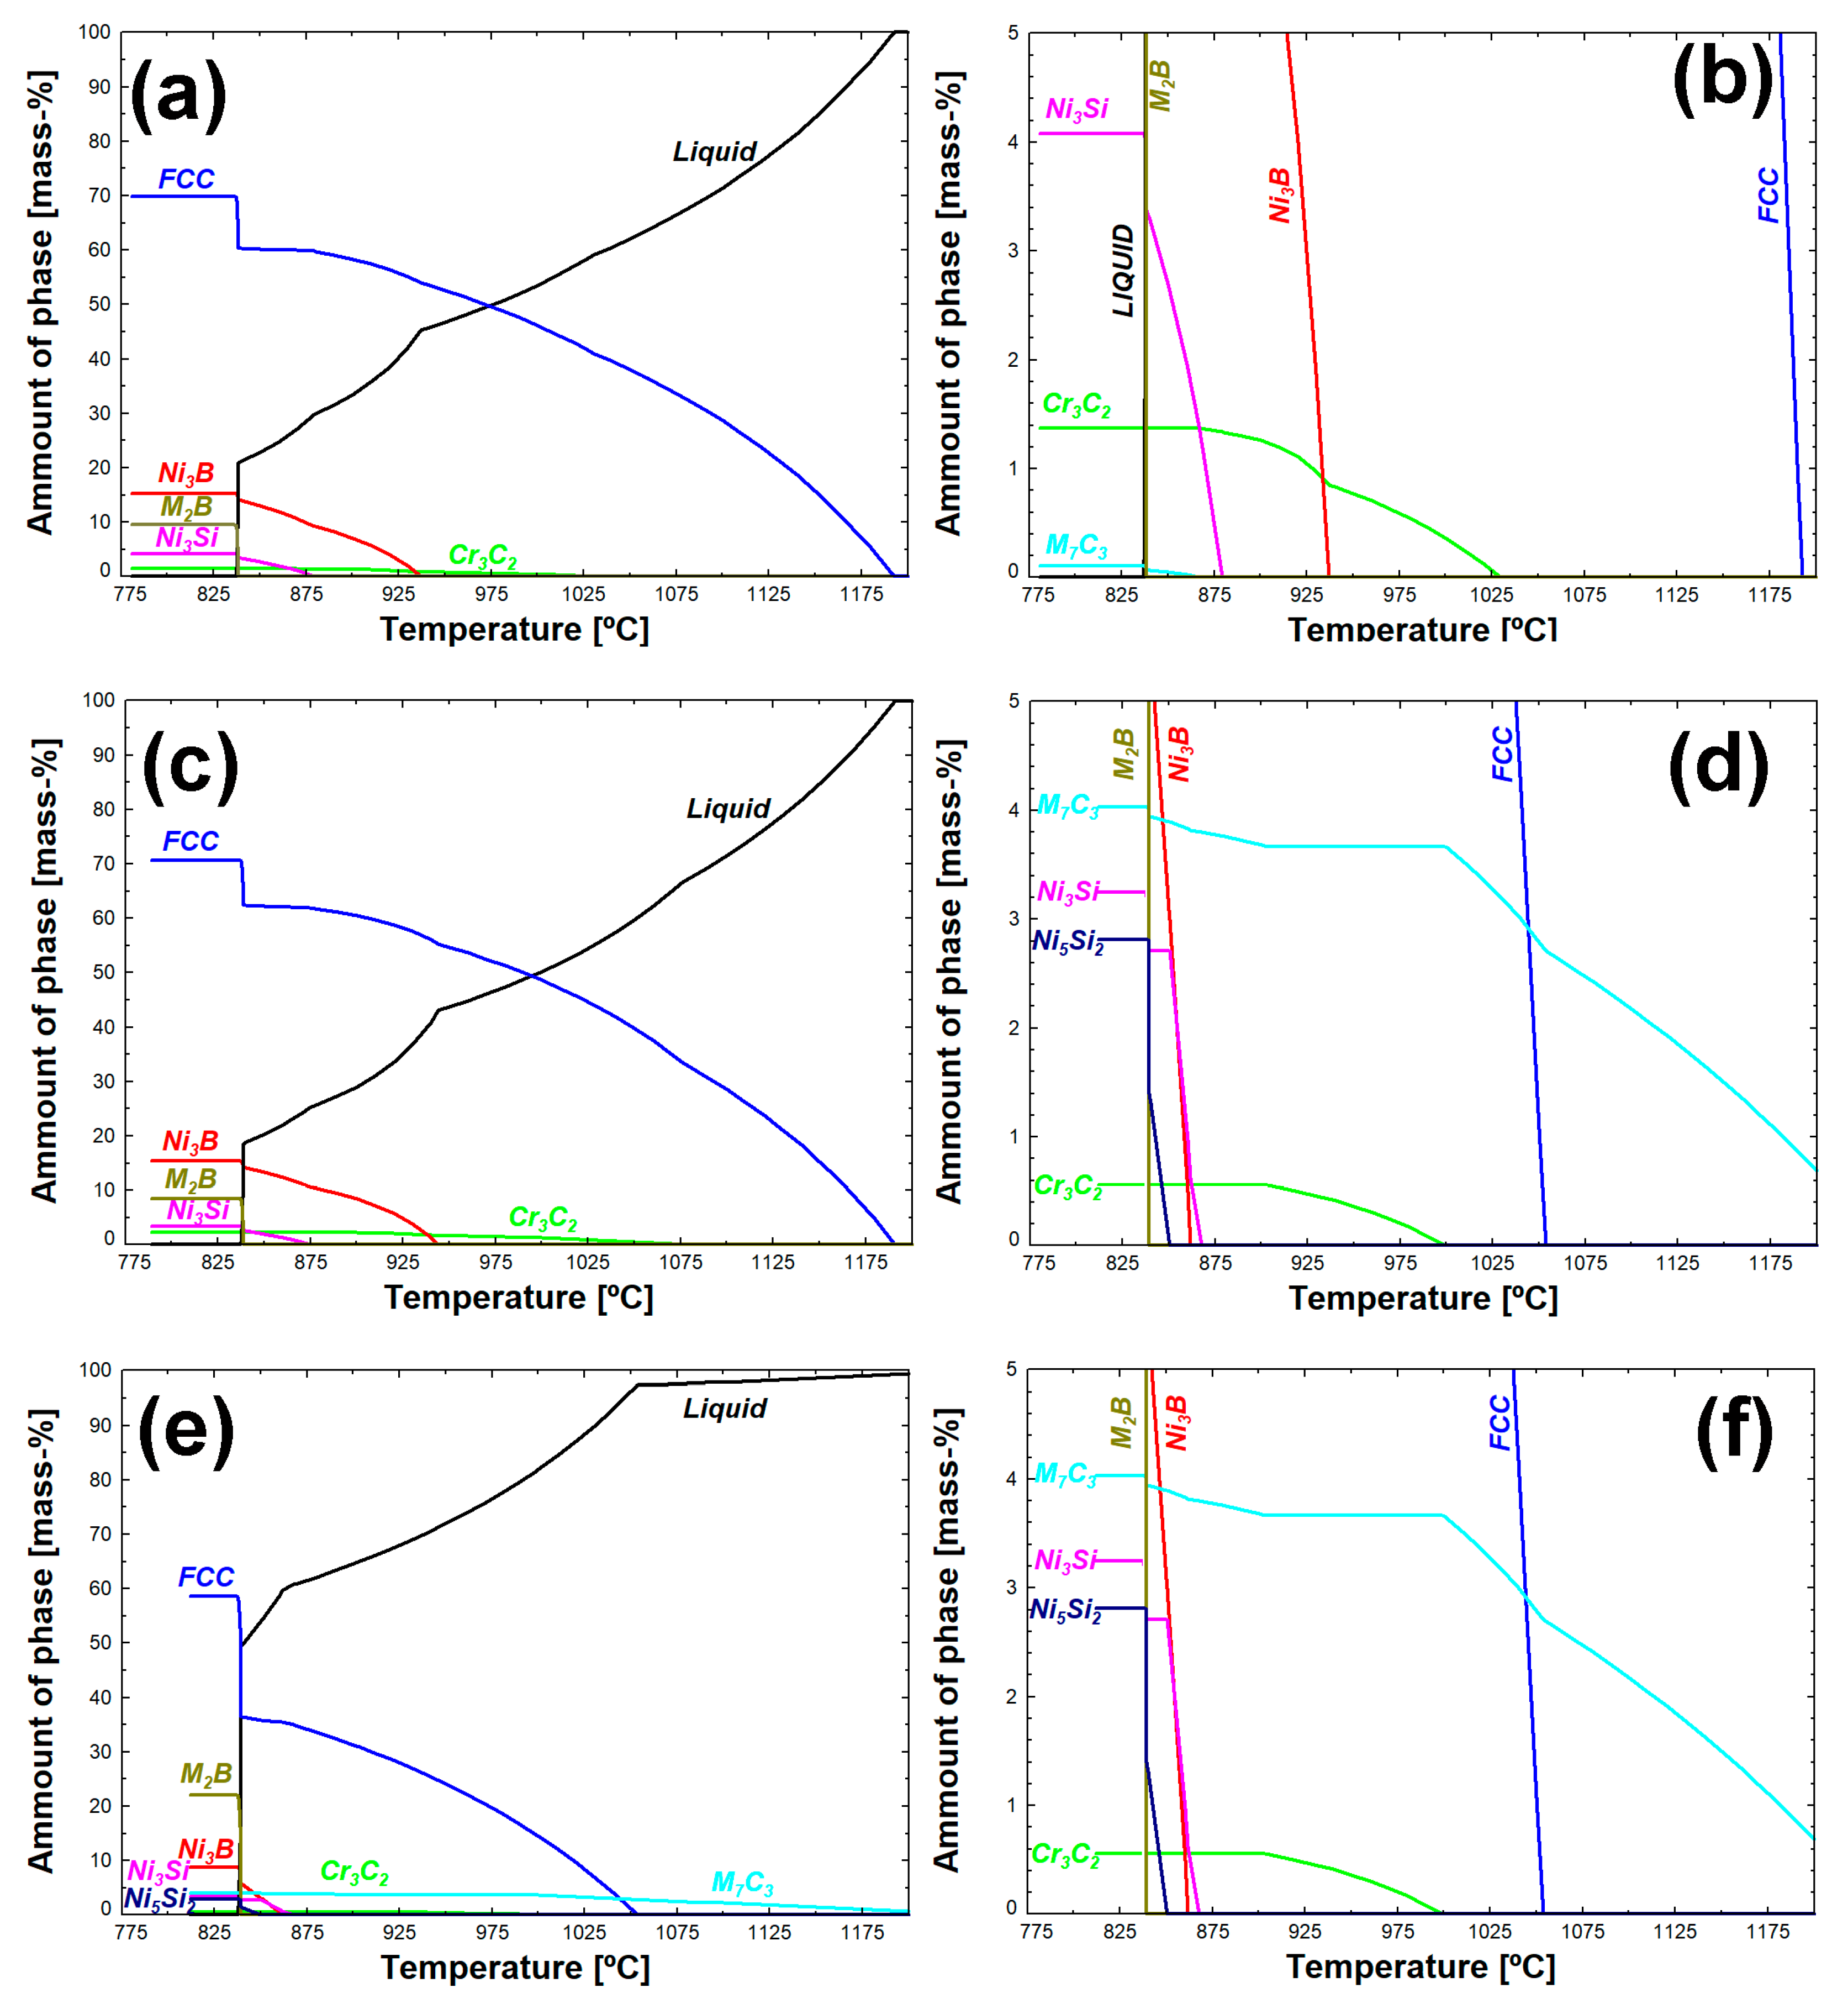
The formation of phases during solidification was evaluated by Scheil solidification simulation using the FactSage software. The amounts of the phases formed during solidification were plotted as a function of temperature (
Figure 8). The Scheil solidification sequence according to the Scheil model for Alloys A and B is as follows:
Liquid (L) → L + γ-Ni → L + γ-Ni + Cr3C2 → L + Cr3C2 + γ-Ni + Eutectics (γ-Ni + Ni3B) → L + Cr3C2 + γ-Ni + Eutectics (γ-Ni + Ni3B + Ni3Si) → L + Cr3C2 + Cr7C3 + γ-Ni + Eutectics (γ-Ni + Ni3B + Ni3Si) → L + Cr3C2 + Cr7C3 + M2B + γ-Ni + Eutectics (γ-Ni + Ni3B + Ni3Si + Ni5Si2)
In case of the high alloy grade (Alloy C), the solidification sequence is similar, but Cr7C3 starts to precipitate in the liquid before γ-Ni dendrites are formed. In the other alloys, this carbide forms in the liquid together with γ-Ni. The formed phases, in general, are in accordance with the observed phases in the LMD samples’ FESEM analysis. Some differences in the chemical compositions of borides and carbides could be related to the high solidification rate of the LMD manufacturing process. The classic Scheil model does not consider the cooling rate, which is 4 × 10³ and 40 × 103 K/s for slow and fast deposition, respectively.
The amounts of the different phases present at the end of solidification are compiled in
Table 3. It can be observed that with the increasing Cr, B, and C content in the alloys, the amount of carbides and especially the content of borides increases too; at the same time, the amount of eutectic Ni
3B decreases in Alloy C (
Table 3). This is in agreement with the eutectic phases observed in this study (see
Figure 6 and
Figure 7). Fewer Ni-Si-B eutectics were observed in Alloy C (see
Figure 7); instead, the Cr-rich boride was found. Furthermore, the high Si content of Alloy C increased also the amount of Si-rich compounds (Ni
3Si and Ni
5Si
2) in this alloy.
Furthermore, Alloys A and B show a similar solidification range of 357 °C (Alloy A) and 356 °C (Alloy B), while Alloy C shows a larger solidification range of 401 °C. The reason for the similar solidification range for Alloys A and B could be related to the similar B content. B is known to be an element that strongly segregates, and boron and silicon form low-melting eutectics [
36,
39].
3.5. Measurement and Quantification of Carbides and Borides
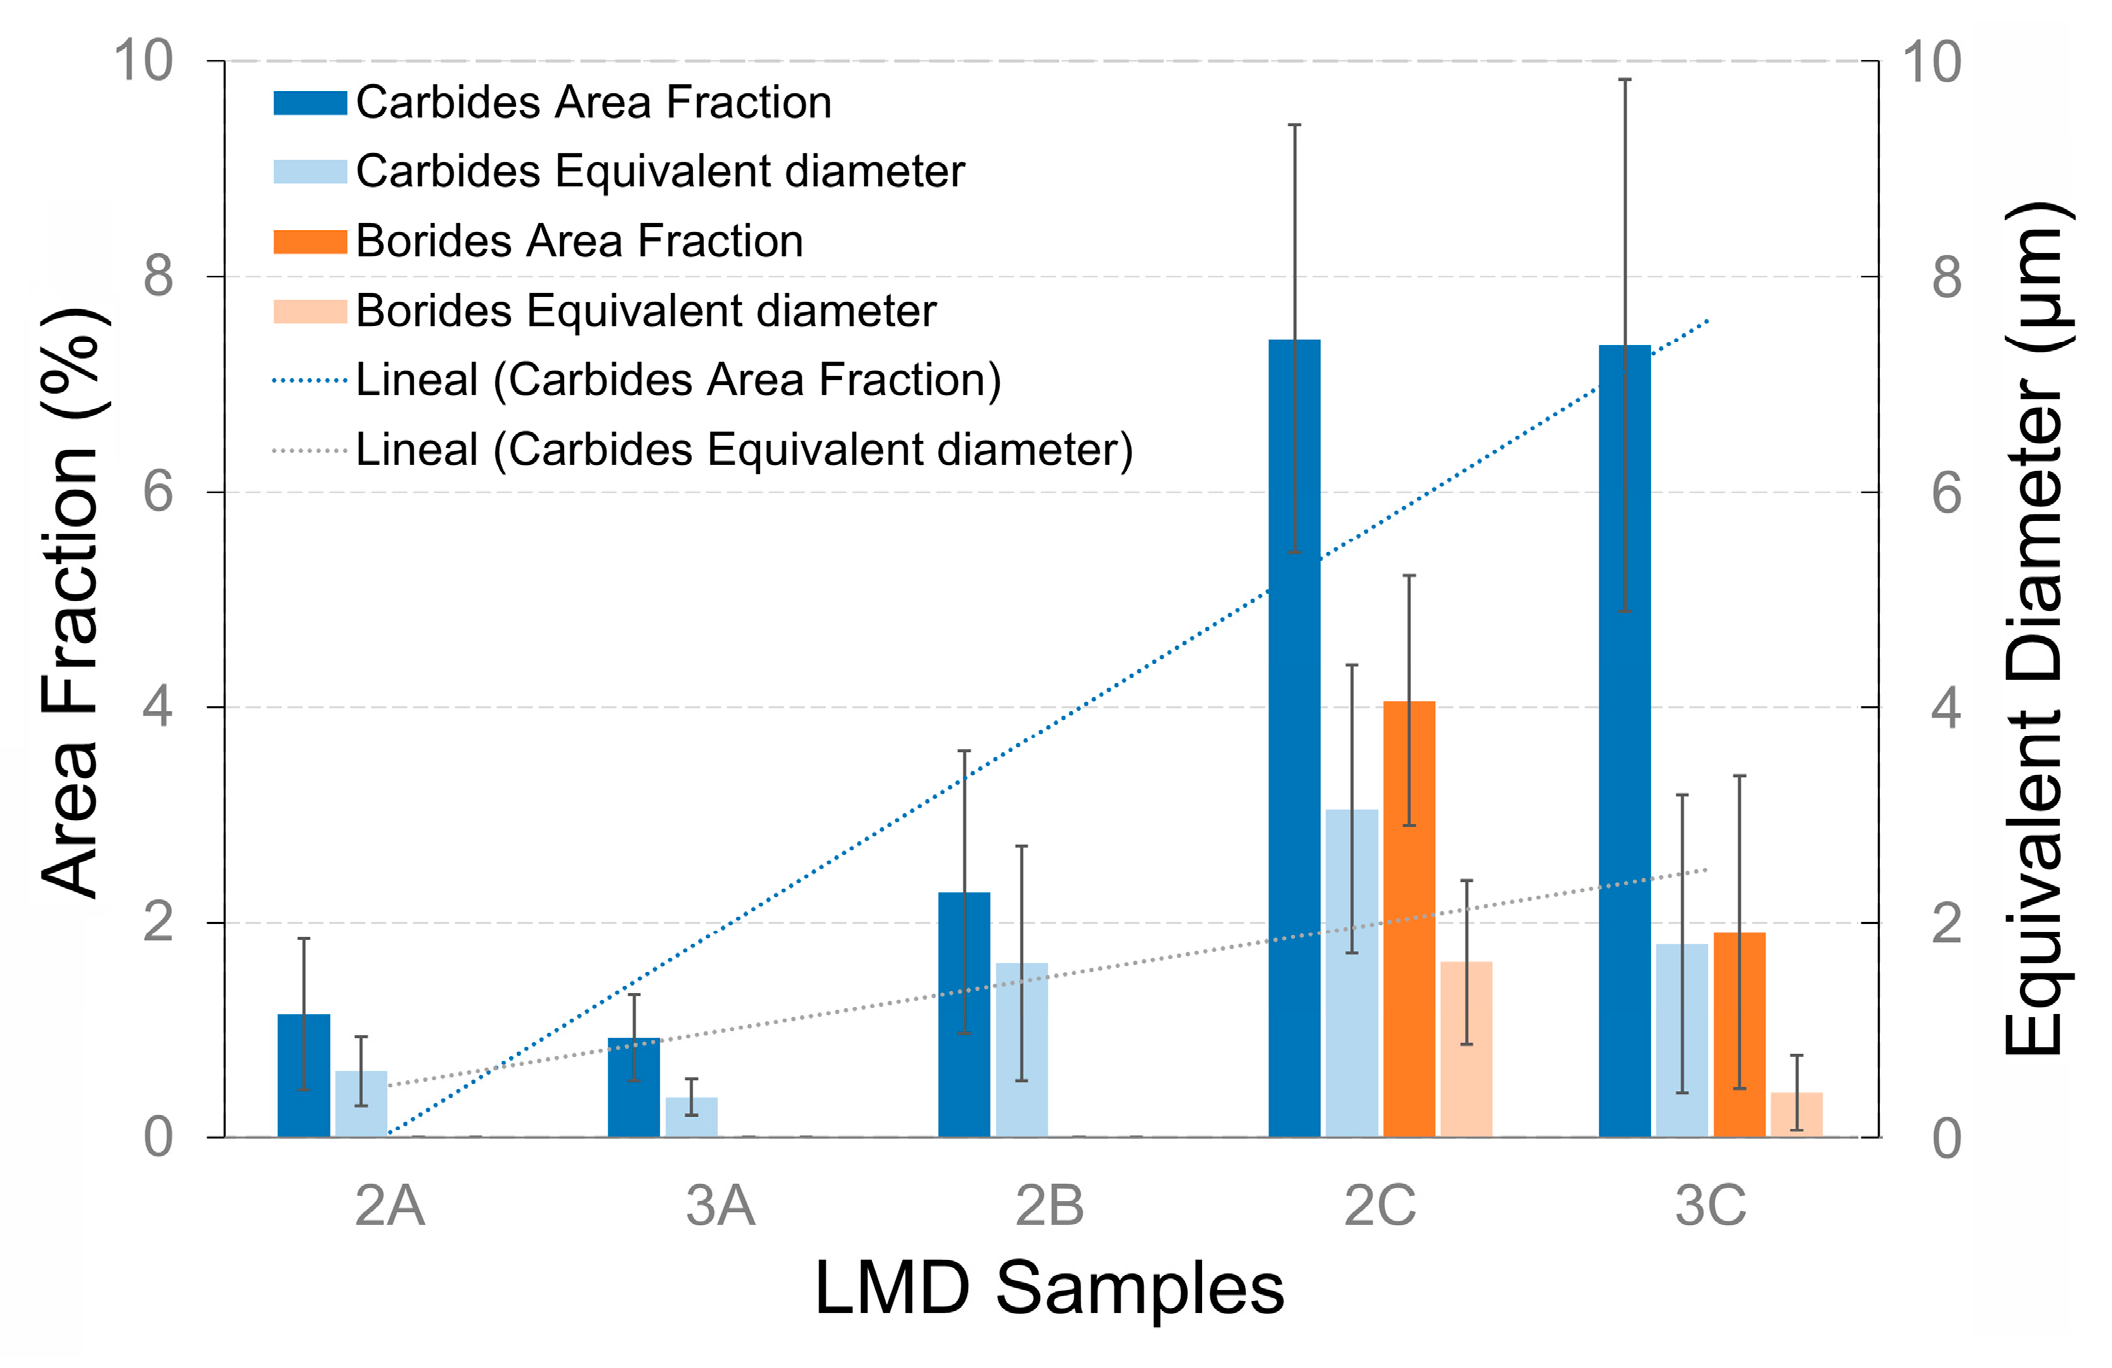
For the size measurement and fraction quantification of carbides and borides, the procedure followed was to perform an image analysis of six FESEM micrographs in total, taken at 15kX magnification for each alloy, with two in each study area that was previously defined (lower, middle, and upper zones of the manufactured bulk cylinders). The detection and calculation of the area fraction (%) occupied by the carbides and borides in the cross-section, as well as their size measurements (equivalent diameter), were obtained by image processing analysis performed with the Leica LAS software
®. The evolution of the carbide and boride area sizes and the area fraction sizes for the three alloys is shown in
Figure 9. In the case of Alloys A and B, the presence of borides was not clearly identified; however, the presence of carbides was well identified in all alloys studied.
In
Figure 9, it can be observed clearly how the amounts of both carbides and borides increase in quantity and size with the increase in Cr, C, and B content for the same deposition rate (2C > 2B > 2A), but it is also observed as a trend that when the deposition rate is increased, the sizes of carbides and borides decrease (3A < 2A and 3C < 2C) but the fraction size is maintained (almost the same). Thus, it can be said that they are distributed in the microstructure in greater quantities but with a small size, according to the amounts of chemical elements that promote precipitation hardening (Cr, B, and C). In Sample 3C, the mean equivalent diameter of borides is lower than 1 micron (0.42 ± 0.35 µm), while, in Sample 2C, it is higher than 1 micron (1.63 ± 0.76 µm).
Considering the results of the microstructure characterization and measurements, the main strengthening mechanism in Alloy C could be precipitation hardening due to the large quantity of carbides (M7C3 type mainly) and hard borides (Cr2B and Ni3B) observed and evenly distributed in the microstructure. In Alloy A, there appears to be solid solution hardening in the matrix and eutectics, as well as the precipitation reinforcement of Cr-rich carbides. This hypothesis is confirmed with the analysis of the hardness contributions of the phases, precipitates, and compounds in the following section.
An interesting characteristic of high-alloy Ni-Cr-Si-Fe-B grades is their microstructural sensitivity to variations in the cooling rate during solidification. This characteristic is mostly due to the more complex phase constitution of high-alloy Ni-Cr-Si-Fe-B grades and their possibility to follow various solidification paths in comparison to low-alloy grades. As the thermal conditions are usually not constant during laser deposition processes, such sensitivity may cause heterogeneities in the microstructures and properties of laser-deposited high-alloy Ni-Cr-Si-Fe-B grades. Consequently, in addition to a high cracking tendency and the necessity for substantial pre-heating and post-heating, microstructural instability can pose another issue in the laser metal deposition of the high-alloy members of the Ni-Cr-B-Si self-fluxing alloy family.
3.6. Nanoindentation on Main Phases/Compounds Observed in the Microstructure
To evaluate more precisely the contribution of each phase to the mechanical behavior and hardening of the Ni-Cr-Si-Fe-B alloys obtained by LMD, an extensive analysis was carried out on Samples 3A and 3C using nanoindentation tests under the experimental conditions discussed in the corresponding section. The aim of this analysis was to stablish the microstructure–hardness relationship and to confirm the strengthening mechanisms identified previously. There are a few reports in the literature on the hardness of these alloys but no reports have been found on the hardness and elastic modulus of the individual phases and precipitates for such thin/fine microstructures.
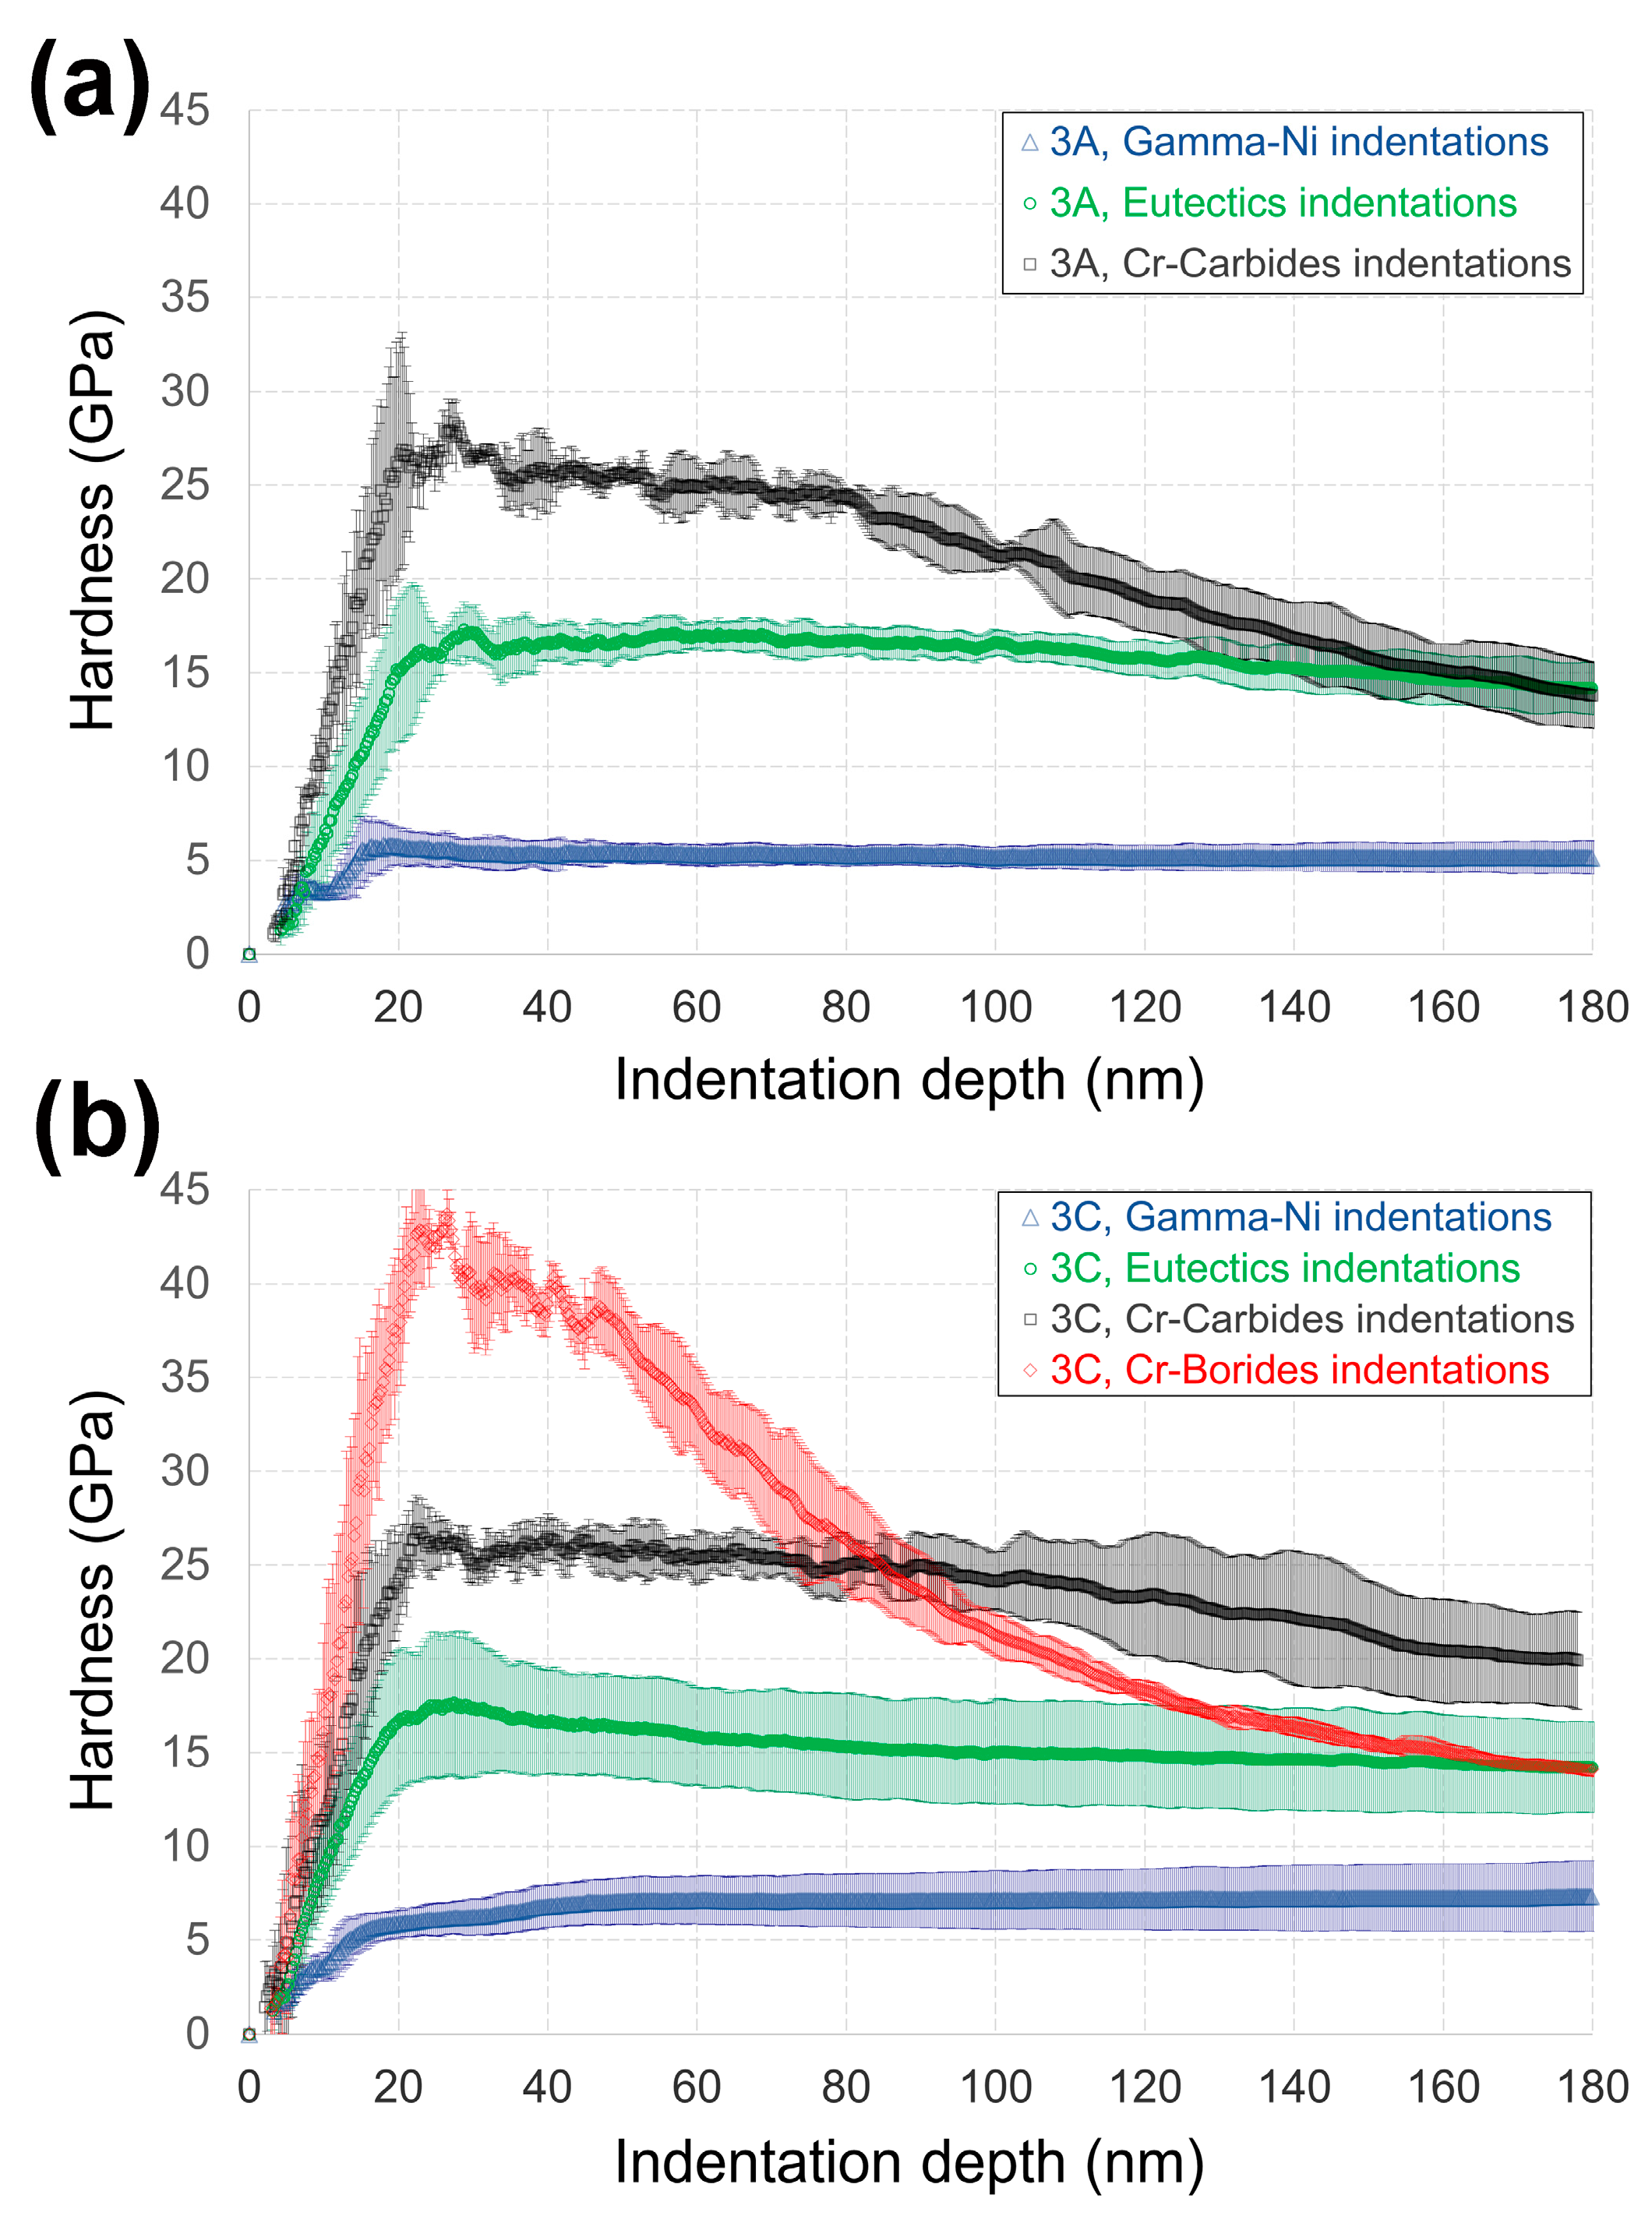
Figure 10 shows the obtained in-depth nanohardness (H) profiles resulting from average multiple curves according to the observed behavior. Three different responses were obtained for Sample 3A (Ni-Cr-Si-Fe-B LMD) and four for Sample 3C. The drop in values at depth for the higher mechanical responses is due to the effect of the softer γ-Ni matrix, explaining why the subsequent average of H and E calculation was estimated at a 40~50 nm range of depth [
40].
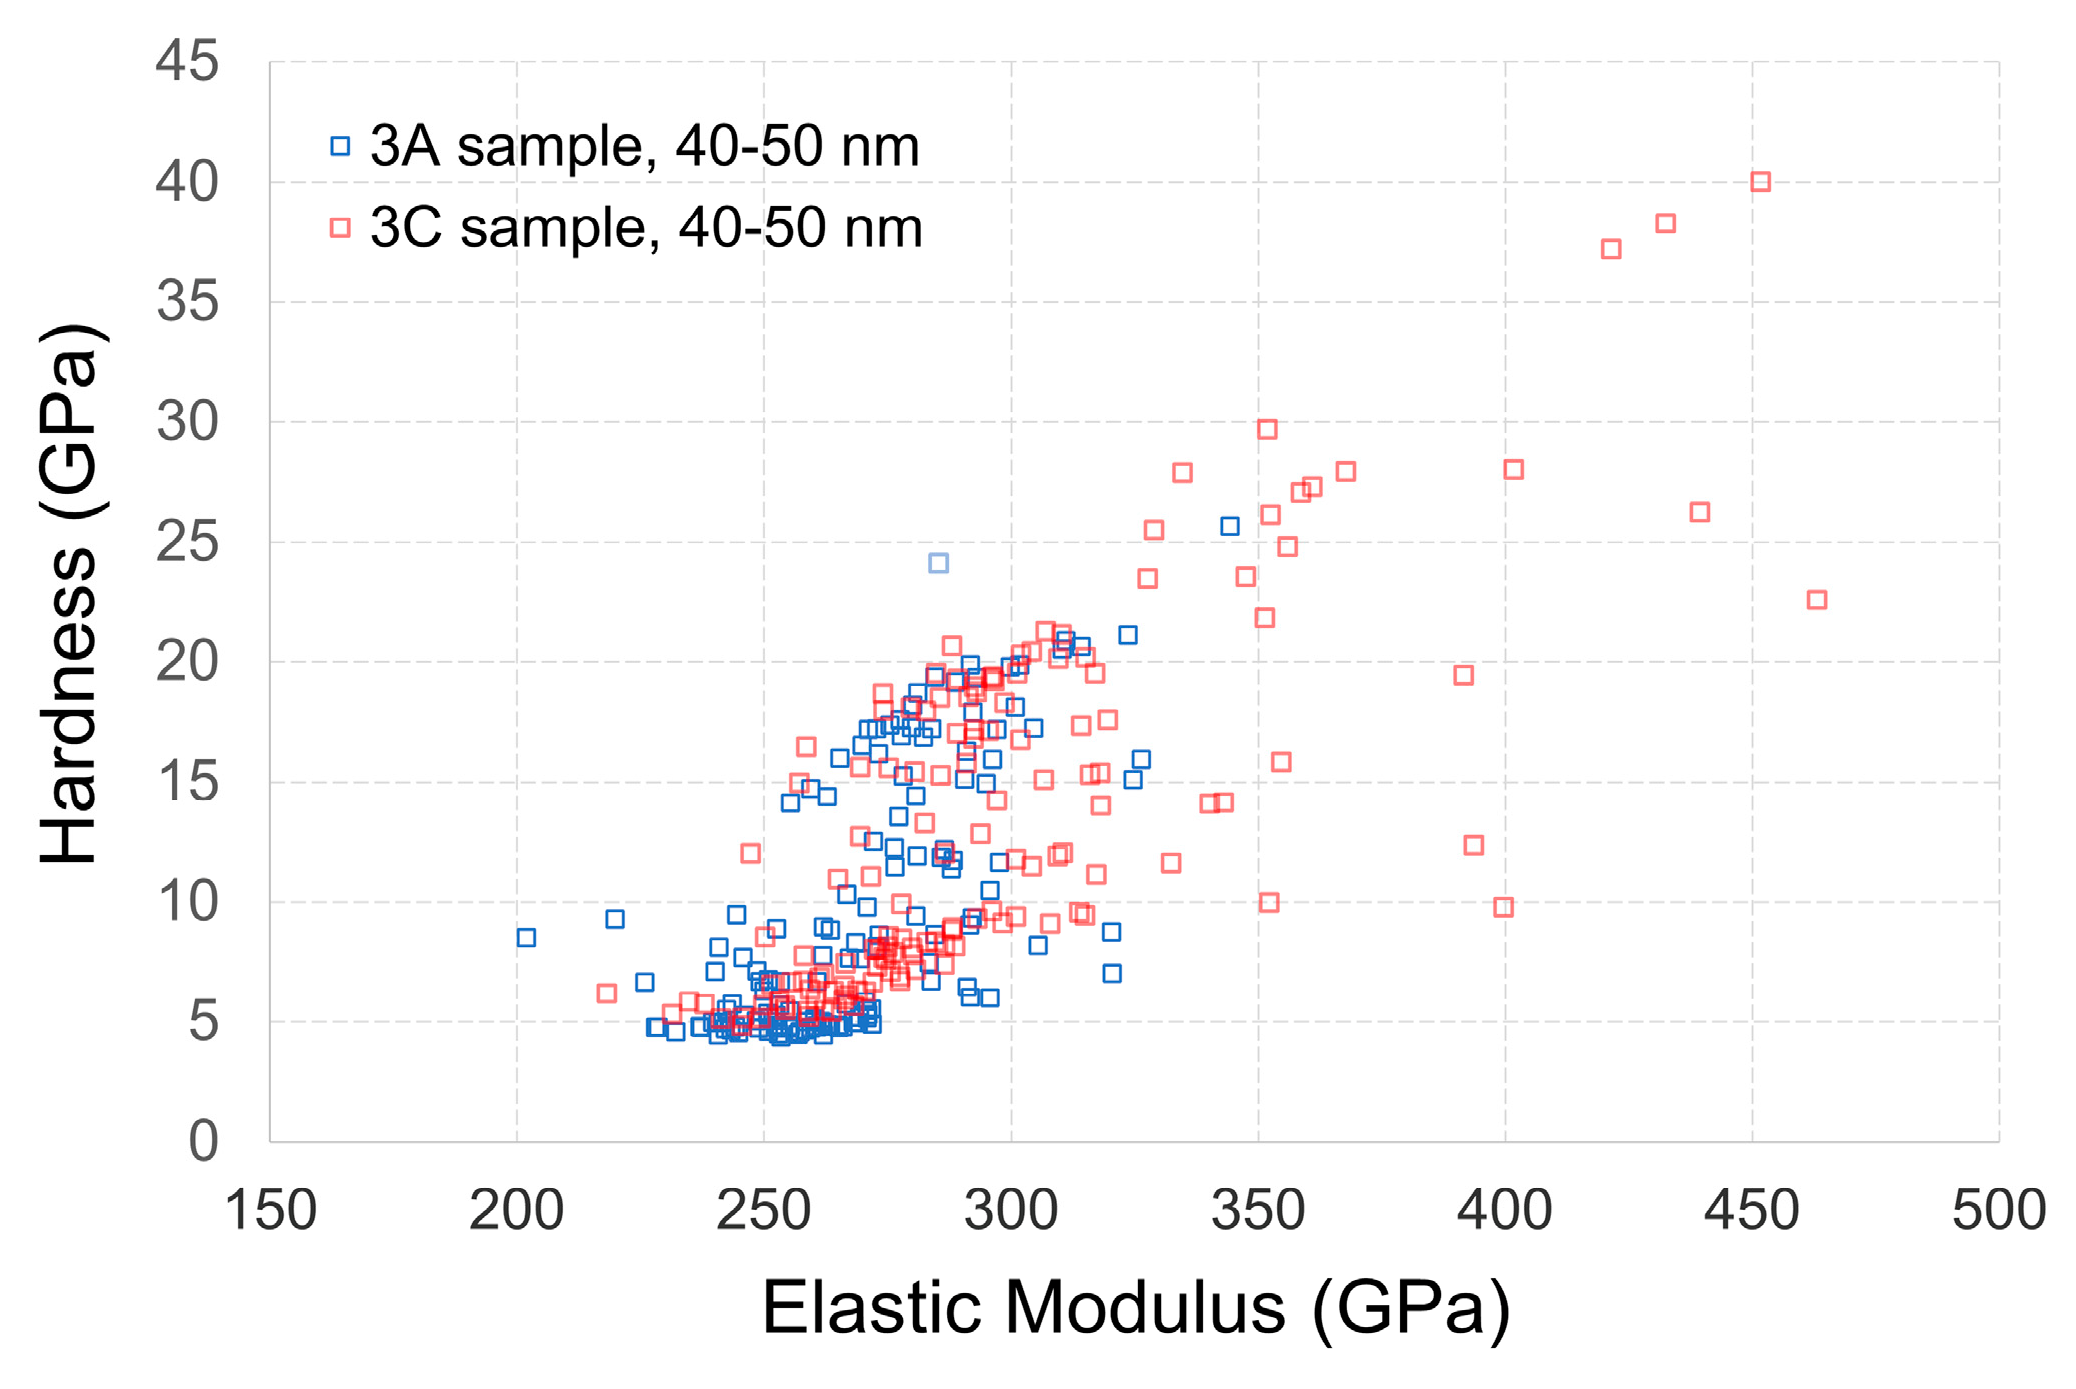
Figure 11 shows the H vs. E results calculated in the 40–50 nm depth range, corroborating that the chosen 40–50 nm range was adequate to resolve the behavior of each indented phase. Higher depths would be influenced by the softer phase, whereas depths below 40 nm would increase the error amplitude of the measurement [
41].
To assign each response to the indented phase/microstructure obtained for each sample, the indentation marks were observed by a backscattered electron (BSE) detector in an FESEM, obtaining high-magnification images. For a clearer representation, the results of the nanohardness (H) and elastic modulus (E) were superimposed in a color scale on the FESEM image. The colored maps were obtained using the Origin Pro 2018
® software with the 2D-plot contour color fill option.
Figure 12 shows the H and E colored maps superimposed onto the BSE-FESEM micrographs for both LMD samples. They clearly revealed the content of the well-dispersed microstructure/phase formed by the softest matrix phase and dispersed, harder small phases. The software interpolated the regions’ values between the indented marks. The colored maps also showed that the highest hardening obtained for Sample 3C was concentrated in the hard compounds and phases obtained for this sample (red regions).
The mean H and E results for each sample are summarized in
Table 4. Phases were identified as follows: (i) γ-Ni dendritic phase, (ii) interdendritic eutectics, (iii) chromium-rich carbides, and (iv) chromium-rich borides.
The lowest hardness and elastic modulus values were associated with the γ-Ni dendritic matrix phase, as expected. However, the H and E values obtained for this γ-Ni phase were slightly lower for Alloy A compared to Alloy C, resulting in a difference of 18.3% and 4.6% for H and E, respectively. A similar trend was observed for the eutectics and carbides, concluding that the resulting hardening of Alloy C could be explained by the increase in the stiffness of both the matrix γ-Ni solid solution and the eutectics formed, with a lower contribution from the carbides.
In Alloy C, the strengthening mechanisms were identified as hardening by the solid solution of the γ-Ni dendrites and the precipitation hardening of carbides and, in particular, borides. The hardening in eutectics (where present) was presumed to be a combination of solid solution and the dispersion of nanometric intermetallic compounds or precipitates that were not observed by FESEM. In general, the hardness of borides (in GPa) is five times the hardness of γ-nickel dendrites, while carbides are expected to possess up to four-times higher H than dendrites. Eutectics are third in terms of hardness and have almost triple the hardness of γ-Ni.
Few research works have been published containing nanoindentation measurements on laser-processed Ni-Cr-Si-B alloys. Furthermore, the results were obtained by means of a Vickers hardness conversion scale [
13], providing a less rigorous comparison. Karuppasamy et al. [
25] reported H values in the cladded region of a similar alloy, resulting in very similar values to those obtained in this study for the γ-Ni phase of Alloy A. When comparing the H values measured by nanoindentation on Ni-Cr-B-Si coatings obtained by thermal projection (flame spray) and by laser cladding, it was observed that laser material processing gave a higher H and slightly lower E [
33]. These results are very promising and indicate the sensitivity of these alloys depending on the processing route used.
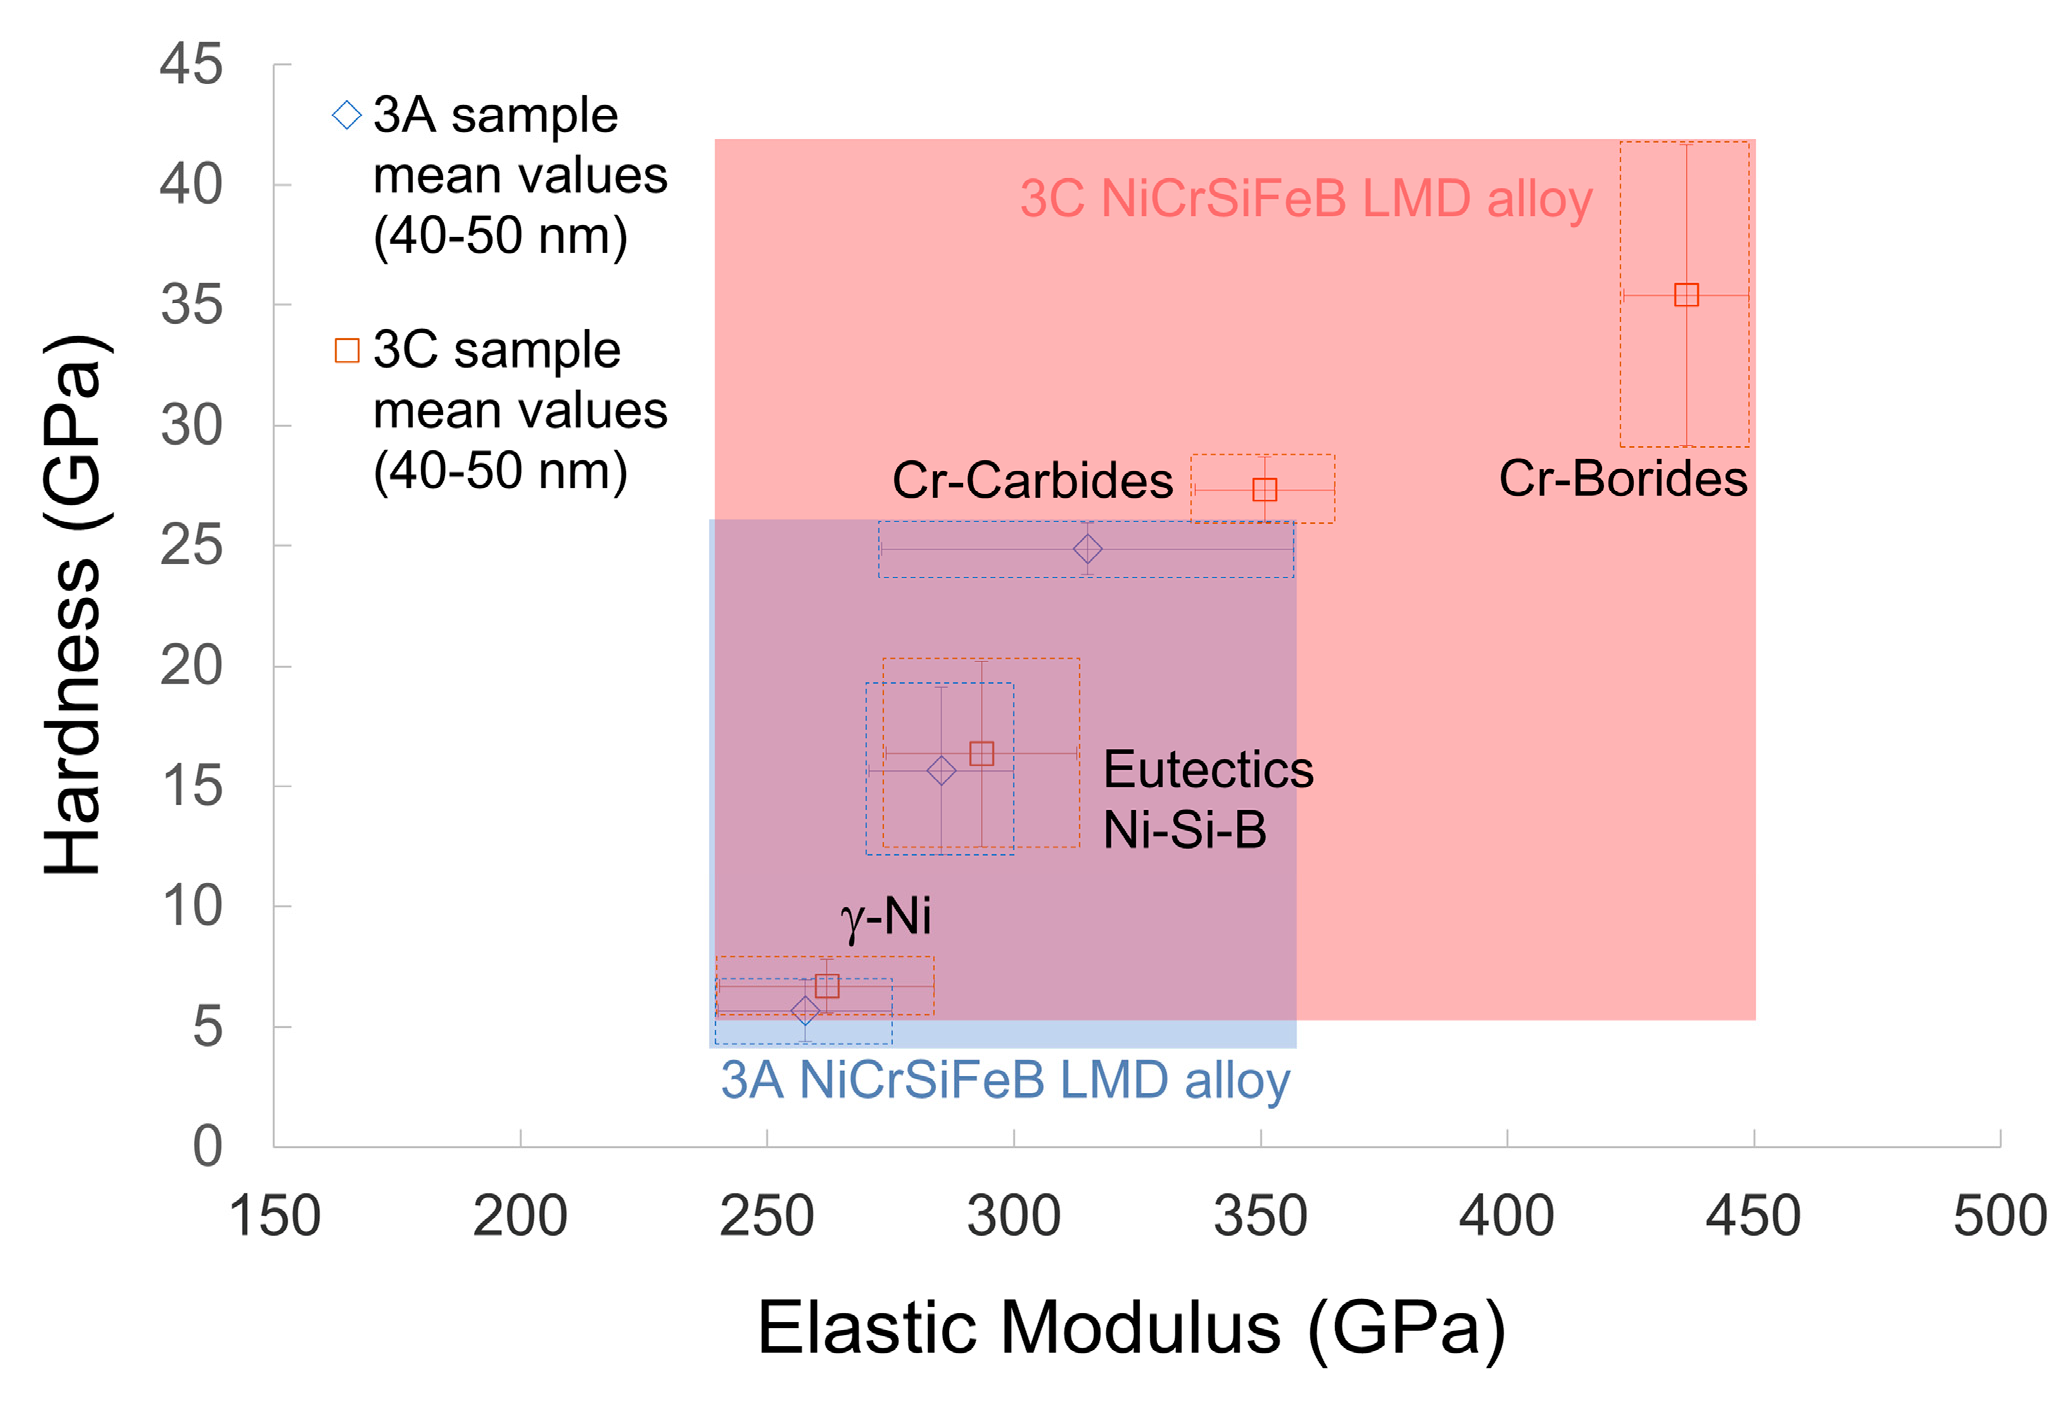
Figure 13 graphically summarizes the hardness vs. moduli, identifying the phases and precipitates/compounds for each alloy studied. The strengthening of Sample 3C was enhanced by the precipitation hardening provided by chromium-rich borides and carbides, but also powered by the better solid solution hardening observed in their eutectics and matrix dendrites. The most important conclusion is that Alloy C can provide higher hardness without any heat treatment (in as-built condition) due to the particular characteristics of the temperature gradients and solidification rates in the LMD additive manufacturing process and the final microstructure formed according to the solidification path proposed.


 ,
, 


