Article

Investigation of Effect of Processing Parameters for Direct Energy Deposition Additive Manufacturing Technologies

1
Department of Mechanical Engineering, Northern Illinois University, DeKalb, IL 60115, USA
2
Advanced Research of Materials and Manufacturing Laboratory, Northern Illinois University, DeKalb, IL 60115, USA
3
Manufacturing Times Digital (MxD), Chicago, IL 60642, USA
*
Author to whom correspondence should be addressed.
J. Manuf. Mater. Process. 2023, 7(3), 105; https://doi.org/10.3390/jmmp7030105
Submission received: 9 May 2023 / Revised: 18 May 2023 / Accepted: 22 May 2023 / Published: 24 May 2023

Abstract

:
In order to capitalize on the cost-effectiveness of additive manufacturing (AM), it is critical to understand how to build components with consistency and high quality. Directed energy deposition (DED) is an AM method for creating parts layer by layer through the use of a moving heat source and powder material inserted into the melt pool generated on the substrate. DED, like most AM processes, is highly complex due to the rapid thermal gradients experienced during processing. These thermal gradients are determined by a variety of processing parameters, which include laser power, powder feed rate, travel speed, layer height hatch spacing, etc. A lot of effort has been carried out in the additive manufacturing community to understand what these critical parameters are and how they influence the thermal gradients. Despite all these efforts, AM industries rely on a trial-and-error-based approach to find the right set of parameters to produce a quality part. This is time-consuming and not a cost-effective use of AM technology. The aim of our research is to reduce the amount of experimental data in combination with numerical analysis to optimize this relationship. Physics-based two-dimensional melt-pool modeling and experimental results from an OPTOMEC 850M LENS will be utilized to investigate the effects of processing parameters on melt-pool geometry, and the results from this study will provide key processing guidelines to achieve desirable clad geometry and powder efficiency for the DED method.

1. Introduction

The global market size of additive manufacturing was valued at USD 13.84 billion in 2021 and USD 16.75 billion in 2022, and it will grow at a compound annual growth rate (CAGR) of 20.8% to 2030 [1,2]. Industries such as nuclear, aerospace, and biomedical have taken an interest in AM’s ability to build near-finished parts that are lightweight with complex geometries and microstructures. By utilizing AM’s layer-by-layer deposition based on 3D CAD models, it is possible to manufacture parts that are not possible with conventional manufacturing methods [3,
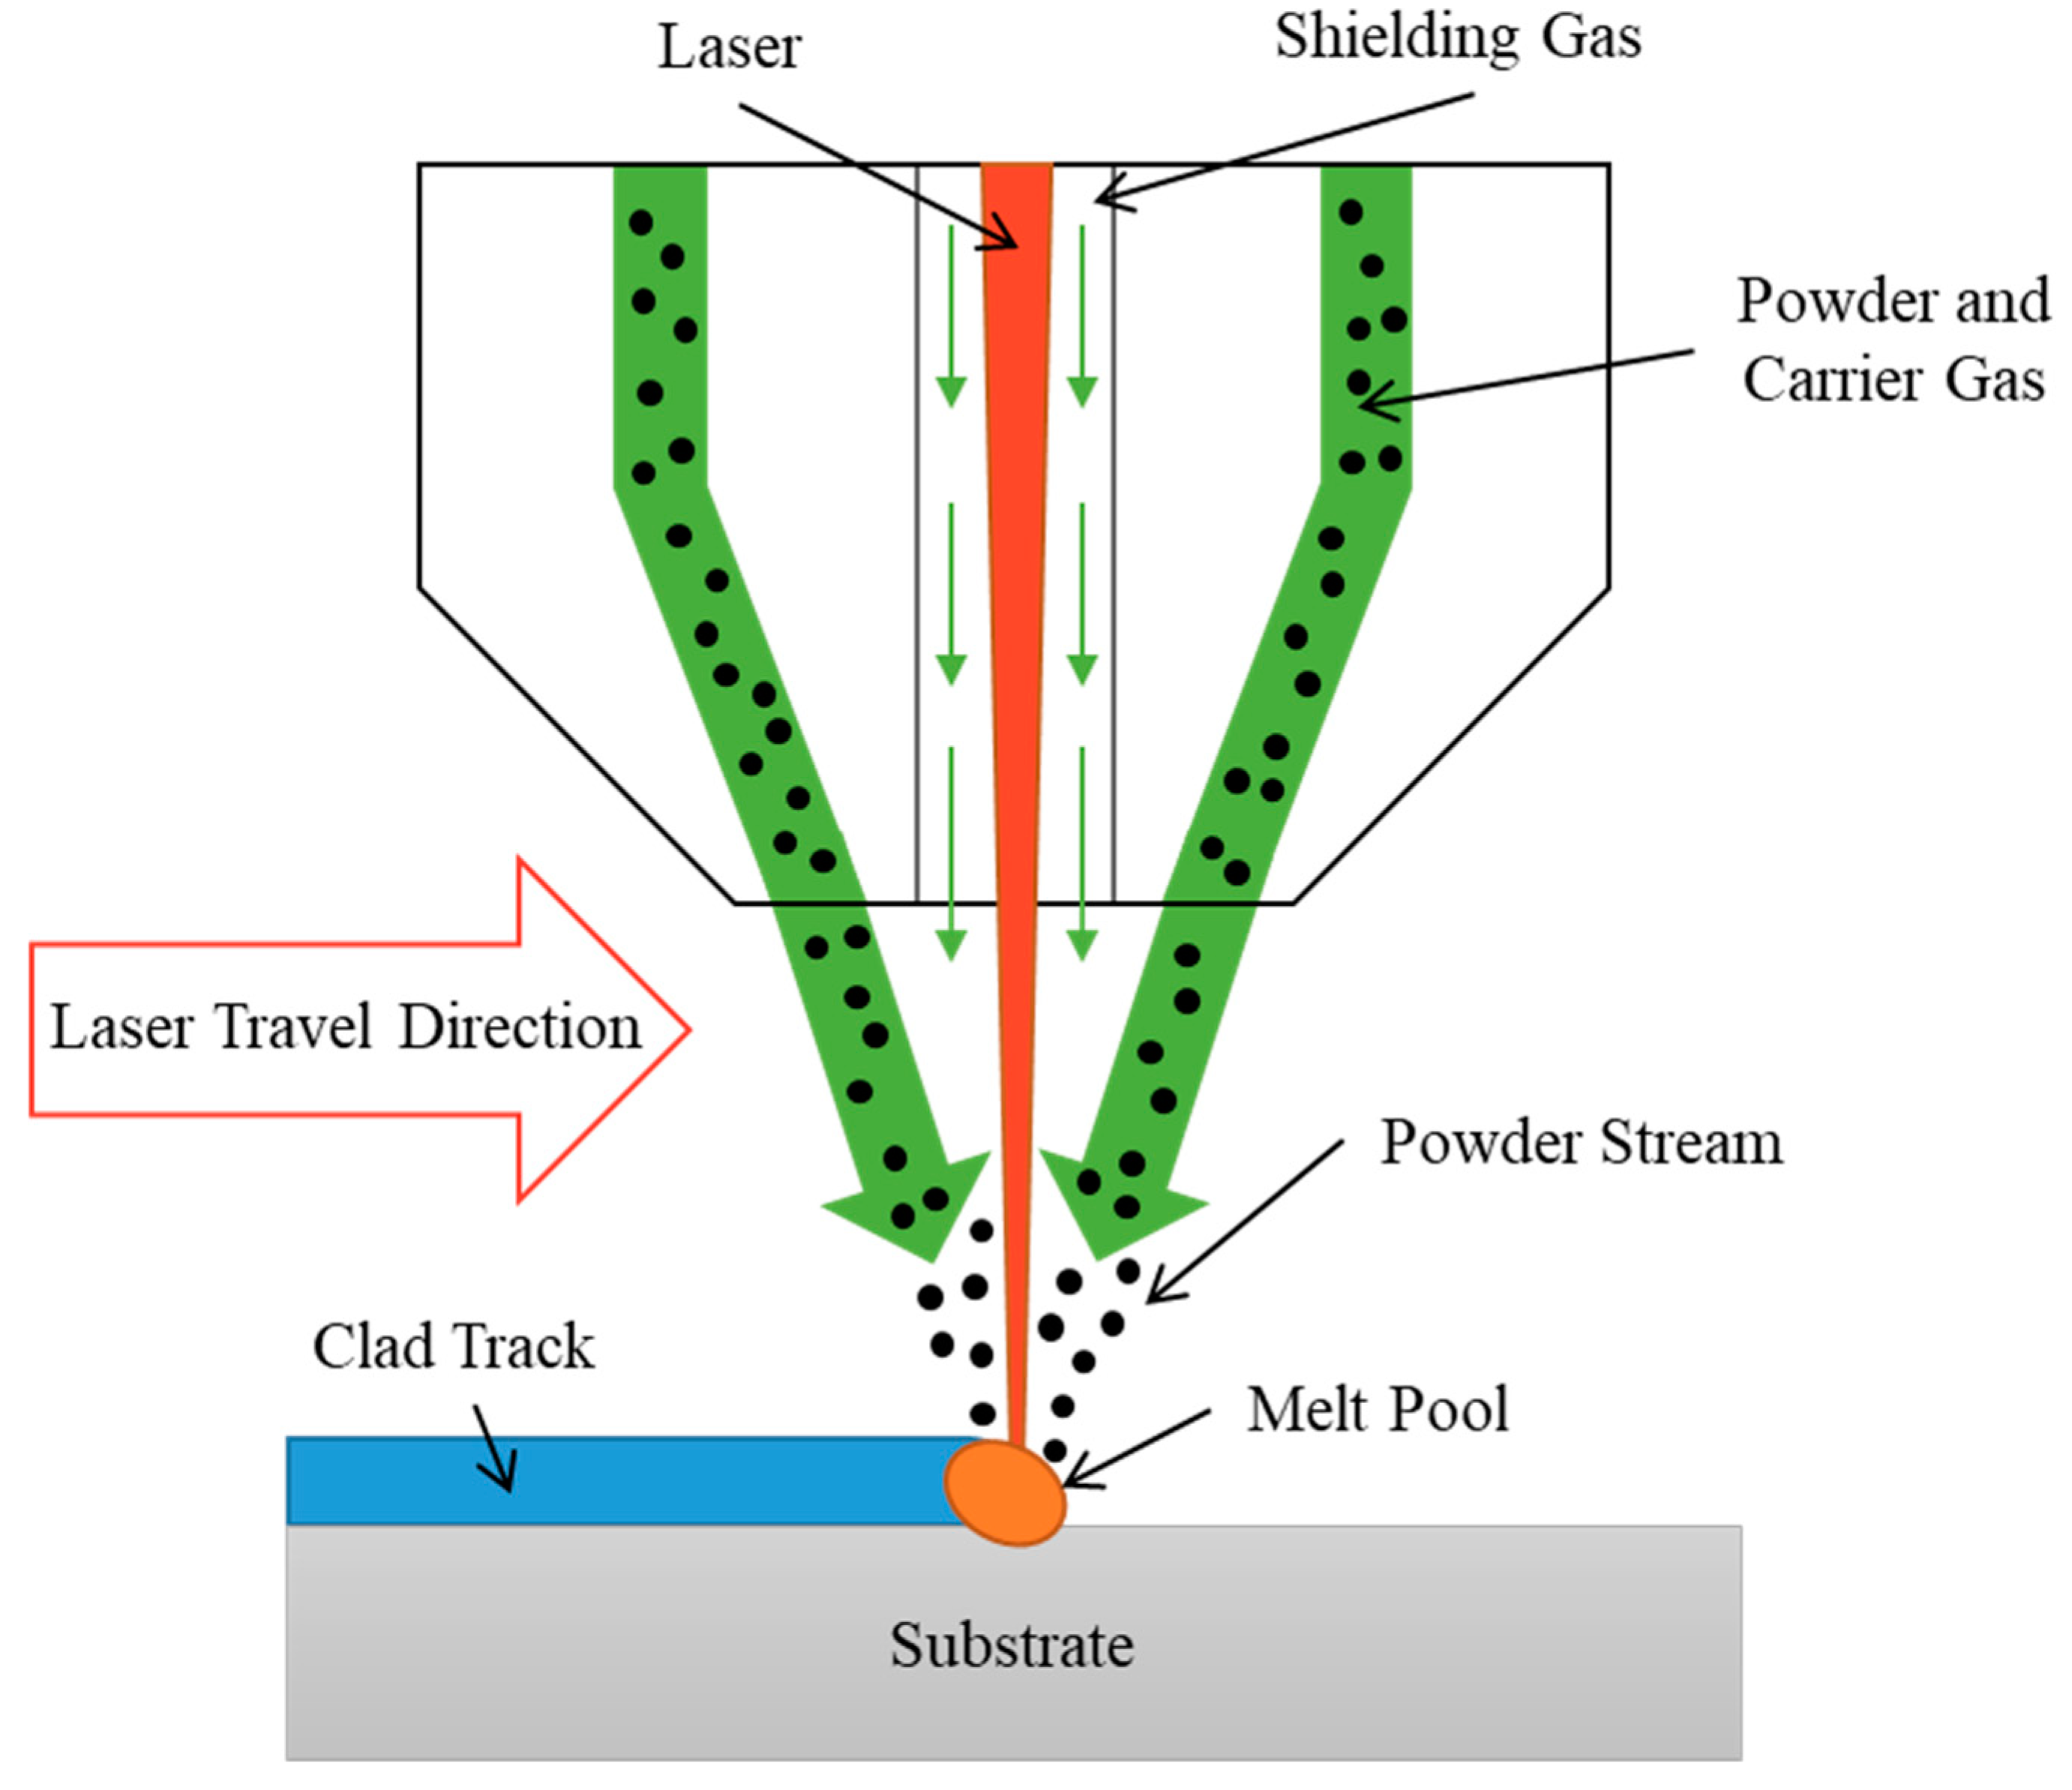
4]. Directed energy deposition (DED) is an AM process that utilizes a high-energy laser heat source to melt a substrate, while powdered metal material is inserted into the melt pool, usually with a carrier gas [5]. As the deposition head and the heat source move relative to the substrate, the material inserted into the melt pool cools and solidifies, leading to the generation of clad [6], as shown in Figure 1.
The DED process can be controlled through process parameters such as laser power, spot size, scan speed, and powder feed rate. The relationship between these process parameters and the resulting thermal histories is key information to understand the mechanisms that contribute to the generation of clad, residual stresses, and distortion during the DED process [7]. Residual stress occurs due to large thermal gradients (~106 K/m) and non-homogenous heating/cooling rates (~105 K/s) that are localized around the melt pool [4,5,6]. Residual stress and distortion caused by this non-uniform thermal history can generate poor surface quality, dimensional inaccuracy, and failure of fabricated components [8]. These complex thermal histories define the different metallurgical phases and microstructures that occur. The microstructures in turn determine the mechanical properties of a part, such as yield stress, ductility, elasticity, etc. [9]. In industry, the proper selection of processing parameters can be difficult because of the complicated relations among these input parameters.
To improve the efficiency of the DED process, many studies have conducted analytical and numerical modeling to investigate the physical relationships of processing parameters in the DED process and to understand the effects of processing parameters and the resulting thermal gradients and clad geometry [10,11,12,13]. Caiazo et al. [11,12] developed a 2D numerical modeling for the DED process of metal deposition and laser welding, successfully predicting melt-pool temperatures of the deposition of overlapped clad tracks. Recently, 3D finite-element (FE) models of AM by Romano et al. [10] investigated temperature predictions of laser melting of metallic powder for powder bed fusion. More complex models have been developed by Ren et al. [13], who implemented a combined thermal–mechanical model and thermal imaging experiments to optimize laser scanning patterns of a single layer, leading to well-controlled thermal history and residual stress.
There are also previous works that have investigated the effect of various physical phenomena important in melt-pool temperature prediction during the laser melting process [6,11,14]. Temperature predictions are useful because they provide insight into the thermal gradients and non-uniform heating observed during the laser melting process. Thermal models can also be fed into other models for the prediction of microstructural evolution, metallurgical composition, and mechanical properties that are dependent on temperature and cooling rates. Batut et al. [6] focused on computational performance with a finite-element (FE)-based model and compared temperature predictions of melt-pool geometry with experiments for TiAl64V. The effect of travel speed and power on the resulting melt pool was investigated to find processing parameter relationships between input power and laser travel speed and their effect on melt-pool temperature [6]. Phase change that occurs during the melting and solidification is important to understanding DED. Cho et al. [14] looked at the inclusion of latent heat during the melting process in predicting melt-pool temperature, reporting smaller melt-pool sizes and lower temperatures when including latent heat.
Several studies have modeled the DED process with the inclusion of surface pressures and forces. The carrier gas, shielding gas, and powder injected into the melt pool may apply pressure onto the melt-pool surface, and the pressure influence on the surface shape was studied [15]. Surface forces such as the Marangoni effect (i.e., the change in surface tension with respect to temperature), the natural convection within the molten fluid, and the movement of the surface interface are induced during the cladding process, and the effect of surface forces on deforming the surface was investigated [7,11].
Molten fluid movement effects such as convection and surface deformation during the clad generation process have also been investigated. Most models do not consider the surface of the substrate as a moving interface and assume a laminar flow just within the melt pool formed in the substrate. A study carried out by Arrizubieta et al. [5] focused on quantifying the relevance of the effects of melt-pool dynamics or fluid flow in the prediction of clad geometry with a 2D symmetric laser source. Two models were developed, and one included the effects of fluid dynamics inside the melt pool, and the other neglected these effects, only solving for conduction within the substrate. Both these models were compared for accuracy in estimating melt-pool geometry and clad generation. While the non-fluid dynamic model performed worse at predicting geometry with high deformation or clad generation, they were able to define a window for accuracy of the non-melt-pool model and created a model that was 10 times faster than the fluid dynamic model with the same accuracy of less than 10% error.
A simulation of clad geometry was developed by Ya et al. [11], using a deformed mesh geometry and predicting dilution by correlating powder efficiency. This study focused on the particle interaction between the laser and melt pool. The effect of powder catchment, powder distribution, and powder efficiency is an important factor in the estimation of clad geometry [11]. Experimental powder efficiency relations found by measuring the weight of deposited clad tracks were coupled with modeling in order to better predict processing parameter windows. A melt pool can be characterized by size, shape, phase, and temperature. Investigation of the melt pool can include various physical phenomena such as the inclusion of latent heat, fluid flow due to convection, temperature-dependent physical properties, phase change, laser attenuation, etc. During the laser cladding process, the energy from the laser attenuation due to particle interaction of the powder stream is an important phenomenon. Tabernero et al. [16] proposed a model for estimating laser attenuation due to particle interaction within the powder stream during the laser cladding process.
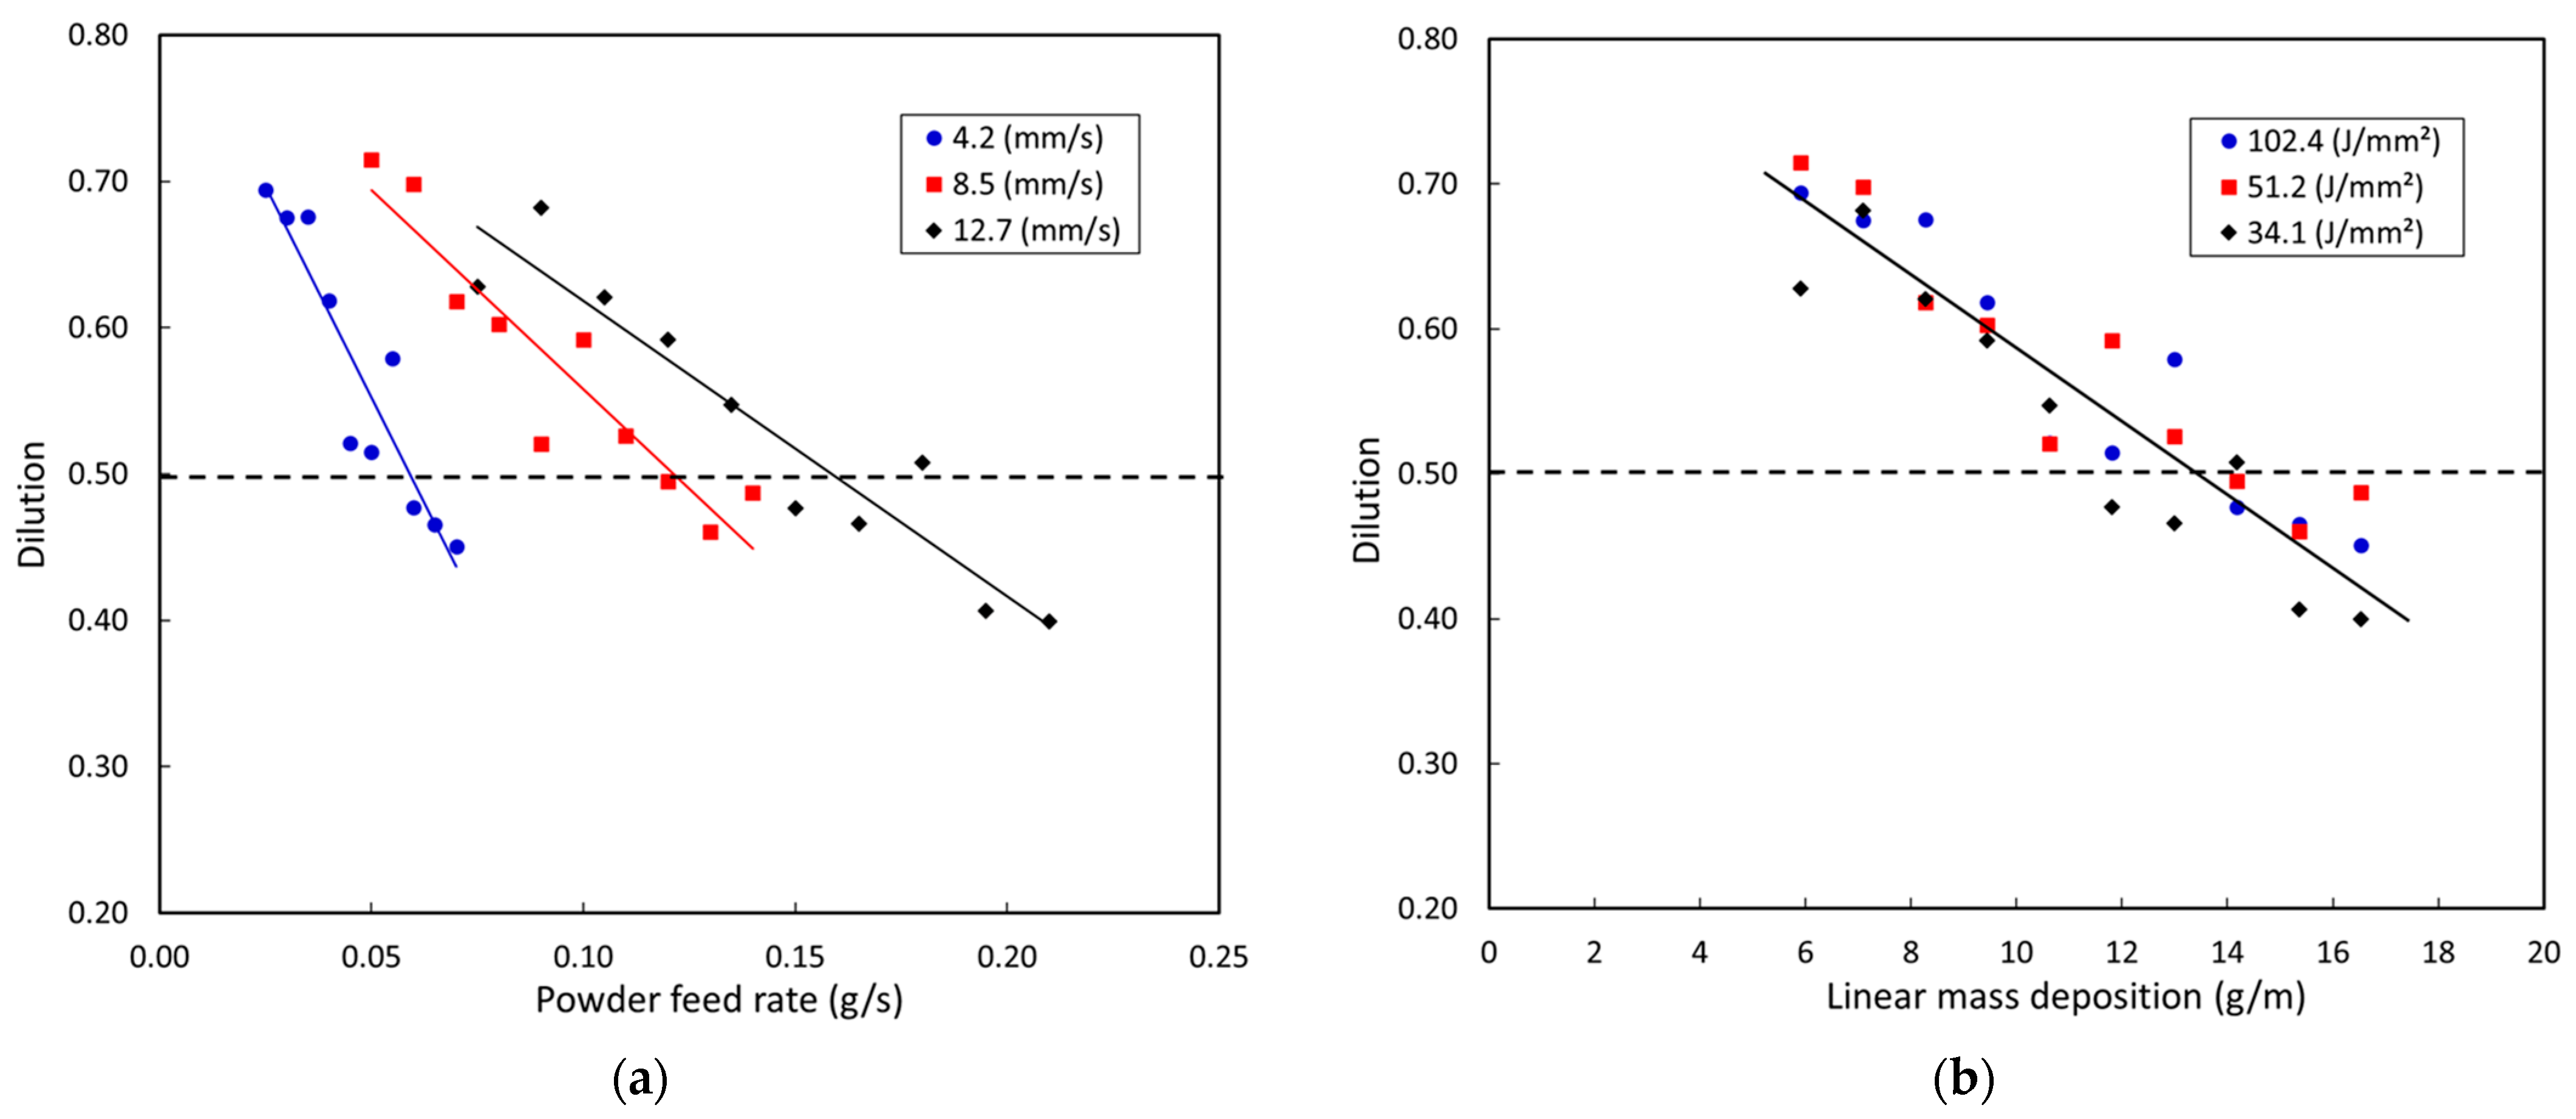
Ya et al. [11] also compared the effects of different processing parameters using global energy density (GED) to normalize the input power and travel speed. Ya et al. then compared different feed rates at different energy densities observing important relationships between powder efficiency, dilution, and energy density, which were validated experimentally. Powder efficiency increases as energy density increases, indicating the melt pool catches more of the mass entering the molten zone with more energy. Secondly, as the powder feed rate increases, a smaller percentage of powder is captured by the melt pool and hence powder efficiency decreases. Last, dilution, which is the ratio of melted substrate to generated clad due to mass addition, increases with an increase in GED or a decrease in powder efficiency [11]. This relationship can be thought by focusing on melted depth or area. Melted depth increases with less powder injection or more input energy, resulting in an increase in dilution.
There still lacks a deeper understanding of the DED process that would benefit industrial applications. This understanding revolves around key processing parameters and their relationships to clad geometry, indicating there is a serious knowledge gap. To fill the knowledge gap, our group has conducted extensive research by synergistically combining physics-based modeling, data-based machine-learning modeling, and experimental work [17,18,19,
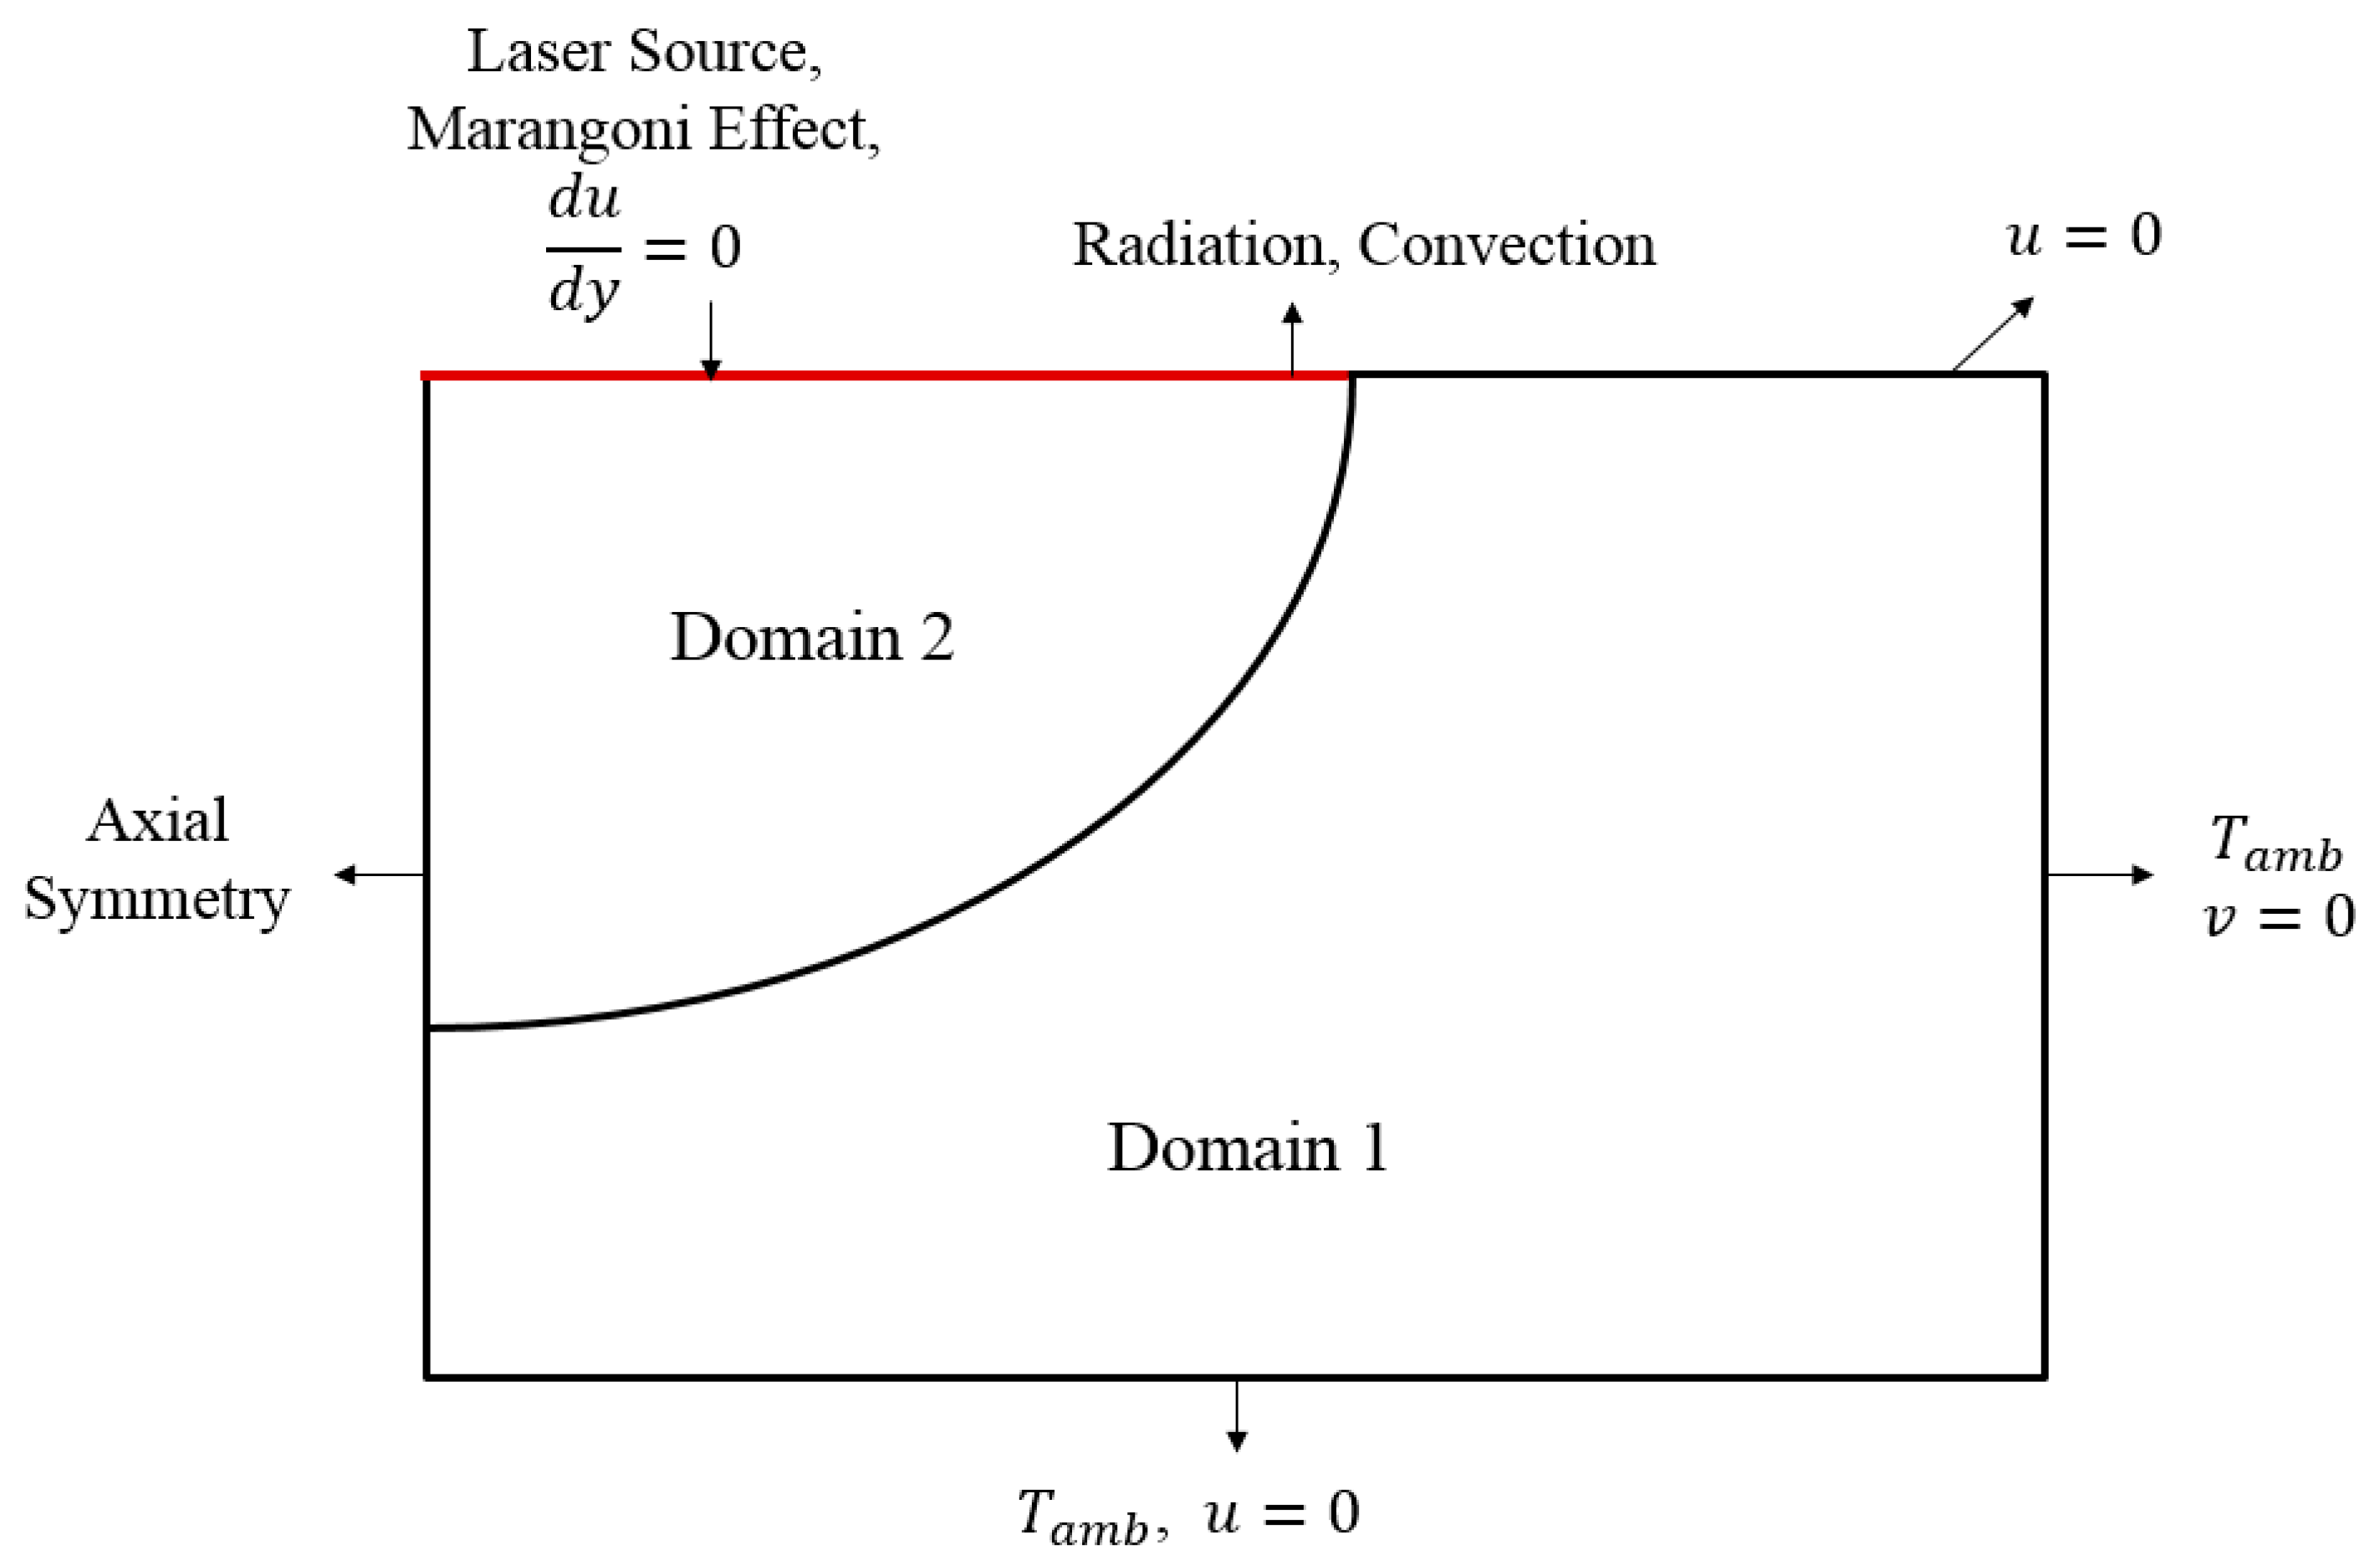
20]. In this study, a numerical 2D model will be developed based on experimental results. Physics associated with the DED process will be implemented into the model, including natural convection, temperature-dependent thermo-physical properties, phase change, fluid dynamics, and surface deformation. Then, the developed model will be utilized to predict clad geometry, and to investigate the relationship among the clad geometries and processing parameters such as powder feed rates, laser power intensities, and laser travel speeds. It is expected that this comprehensive research will not only elucidate the fundamental physics in the DED process, but also provide processing guidelines for DED industries to fabricate their desired products.

2. Experiments

One of the issues in the adoption of DED in industry is the lack of understanding on how to select the appropriate processing parameters independent of the machine setup and materials that result in desired thermal, mechanical, and geometrical properties. Experiments enable the investigation of the relationships between the process parameters and those properties in order to better understand how to control the DED process. Clad shape and size are determined by the primary processing parameters in the DED process: power input, laser scan speed, laser spot size, and powder feed rate. The relationship between clad generation and processing parameters is not necessarily intuitive. The mass entering the melt pool depends on the powder distribution, powder efficiency, and travel speed of the laser beam, while the size and shape of the clad depend on the powder captured within the melt pool, which is also affected by energy input. In this experiment, the relationship between clad shape and process parameters is investigated in order to predict the height and dilution of a single clad tracks using a 316L stainless steel substrate and powder [17].
In this study, two key equations are used to relate primary processing parameters. Global energy density (GED) is a control volume estimation of the energy input into the melt pool [17]. GED, shown in Equation (1), is determined with laser input power, laser scan speed, and laser spot size. Given a fixed laser spot size, the different energy densities can be compared by varying the power levels and laser scan speed. The second parameter relation is mass deposition per unit length ( λ m , ratio of powder feed rate to laser travel speed), which is a metric developed by Sciammarella et al. [17] to select powder feed rates and ideal clad geometries at varying laser scan speeds, power levels, and energy densities, shown in Equation (2). As the laser scan speed increases, the actual amount of mass that is deposited per unit length will decrease. Thus, this parameter can be used to select processing parameters that result in ideal repeatable components. The comparison of λ m allows the quantification, optimization, and selection of powder feed rate as a function of the laser scan speed and resulting clad geometry [17].
G E D = P 2 r l v l
where r l is the beam spot radius, and v l is the laser travel speed.
λ m = m ˙ v l
where m ˙ is power mass flow rate.
To characterize the clad geometry generated, “dilution” will be measured. The dilution is the ratio of the height of the generated clad to the depth of the melted substrate. A dilution of 0% would represent no melted substrate and pure clad generation, while a dilution of 100% would represent a melt pool with no clad generated on the substrate. A comparison of processing parameters and dilution has been performed in a study by Ya et al. [11]. In this study, dilution will be quantified as a percentage of melted substrate compared to the overall height of the clad. The following experiments utilize varying λ m and GED with a fixed power level and spot size to investigate and predict the effect of λ m on the prediction of a processing parameter window that results in clad generation with a dilution of 50% or less.
d i l u t i o n = d e p t h c l a d d e p t h c l a d + h e i g h t c l a d

2.1. Experimental Setup

Experiments were conducted at Northern Illinois University in the Advanced Research of Manufacturing and Materials (ARMM) Lab at the College of Engineering and Engineering Technology. Samples were fabricated on an OPTOMEC 850M LENS (OPTOMEC, St. Paul, MN, USA) DED machine seen in Figure 2. The OPTOMEC is capable of three-axis deposition with a Nd:YAG 3 kW laser as the heat source where the tool path code (DMC) is inputted and controlled through a GUI. Within the build chamber, argon is used as the shielding and carrier gas for metal powders. The chamber has also been retrofitted with a custom pressure seal, reducing the oxidation due to heating and cooling during manufacturing.

2.2. Experimental Conditions

The experimental conditions were the same as outlined in Sciammarella et al. [17]. The main differences are the focus on the investigation of single power levels (650 W) and smaller laser spot sizes (1.5 mm). Each of the three laser travel speeds will be tested for the same ten λ m at different energy densities, resulting in ten different powder feed rates for each energy density. To expand the powder feed rates and the resulting clad dilution previously investigated, a larger range of λ m (5.90–16.52 g/m) was utilized. The material used is stainless steel 316 L powder and substrate. The substrate will be mounted on the calorimeter, an active cooling device that uses a fixed mass flow rate of water underneath the substrate, allowing for substrate temperature control [18]. A single clad track length of 20 mm will be deposited for each set of parameters, analyzing the cross-sectional area at the midpoint, for a total of 30 samples. Table 1 shows the processing parameters used for the experiments.

2.3. Sample Processing and Characterization

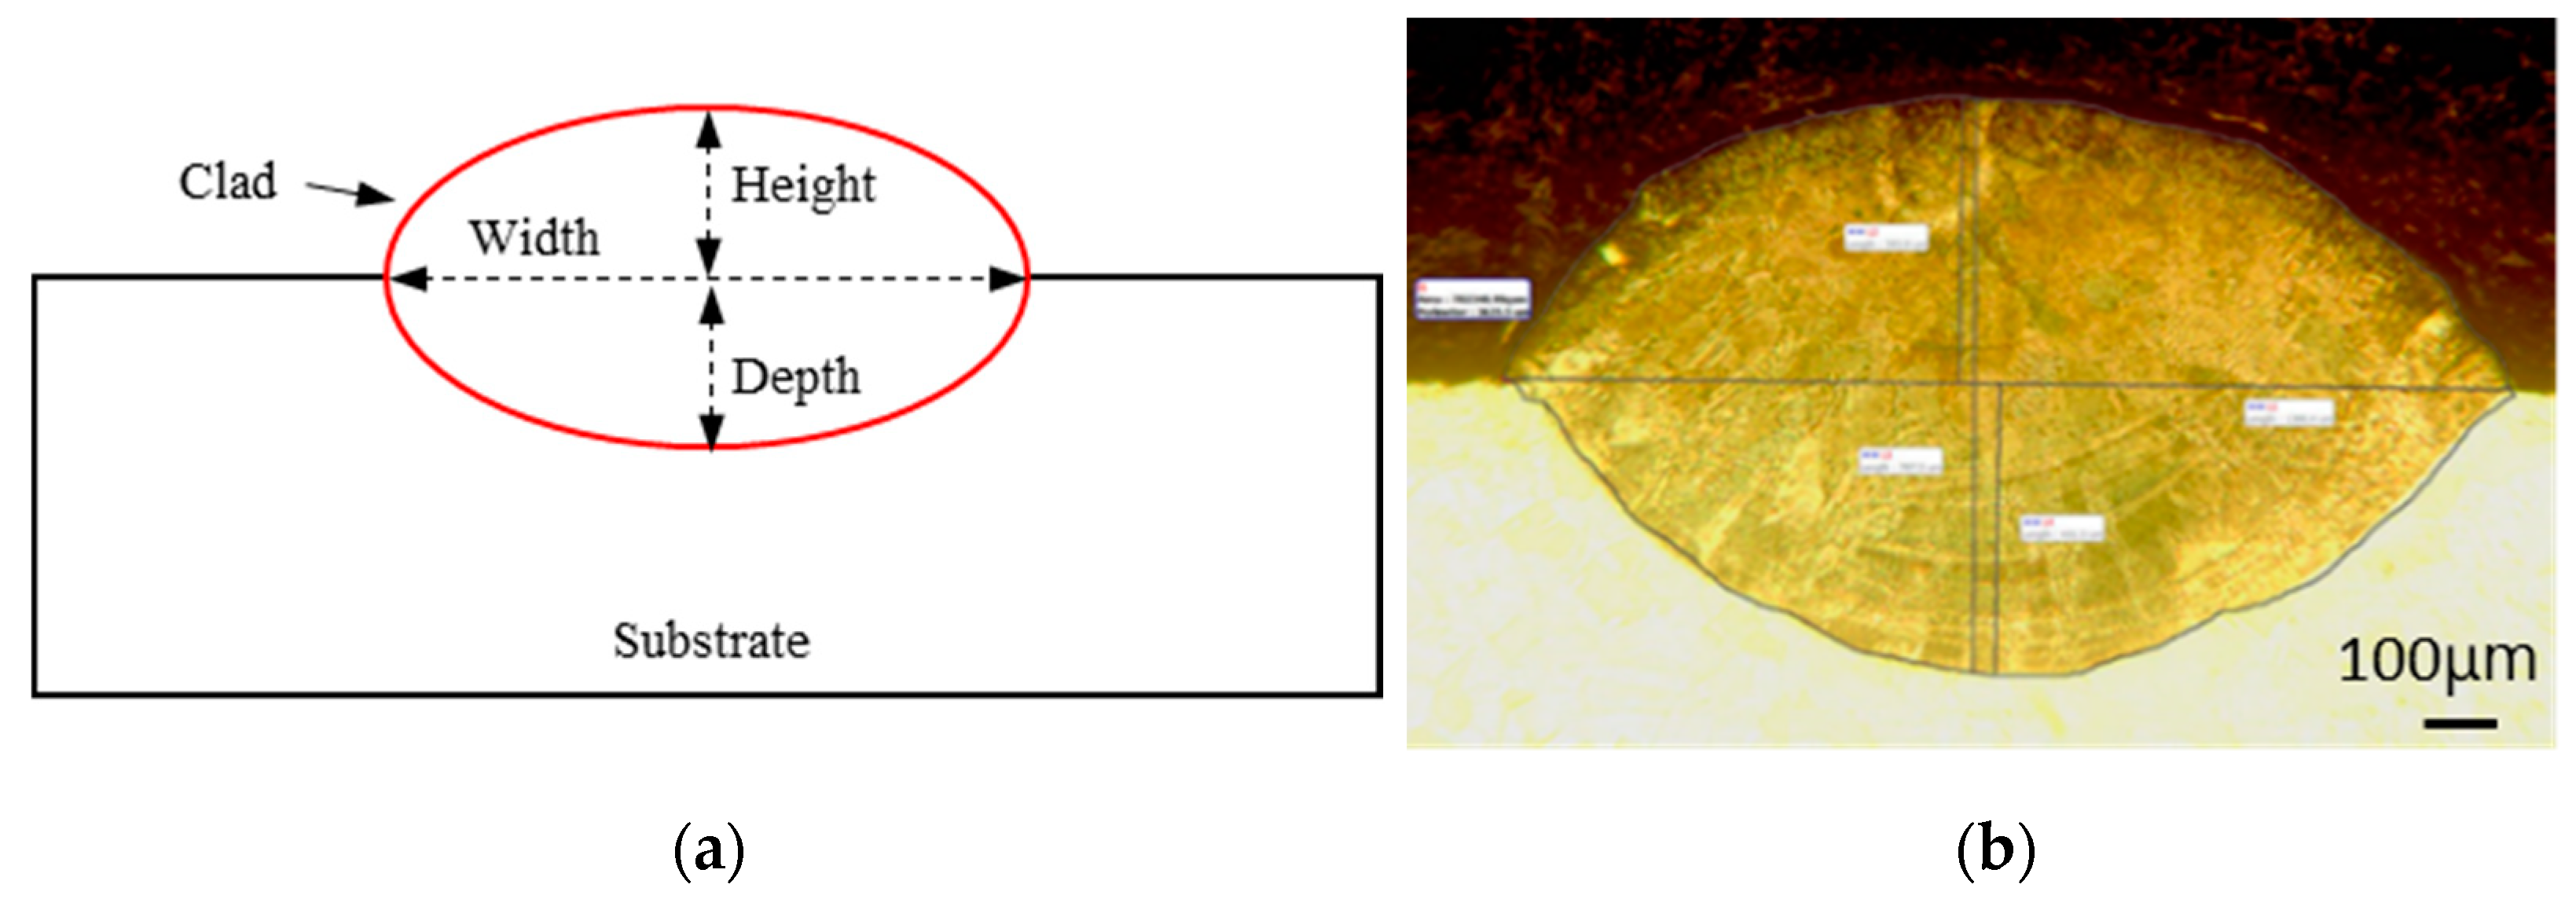
Samples were cut perpendicular to the direction of travel using a circular abrasive saw, and each set of 10 beads was mounted with a resin mounting material. Samples were then polished using a multisampling Buehler (Buehler, Lake Buff, IL, USA) EcoMet Grinder / Polisher for the grits 120, 240, 600, 800, and 1200, followed by polishing using an alumina powder at 1 and 0.05 microns. After cleaning the polished samples, they were etched using a Kalling No. 2 reagent to reveal the microstructure and differentiate the deposited clad from the substrate. Samples were then analyzed on an Olympus PMG 3 (Olympus, Tokyo, Japan) imaging microscope. Images were taken using a 50× magnification with a scale bar of 100 μm. Images were then measured digitally using Motic 2.0 imaging program (Motic, Hong Kong, China). The cross-sectional images of each clad were measured for the following characteristics: depth, height, and width. A diagram of clad cross-section used to characterize is shown in Figure 3a, and a processed sample can be seen in Figure 3b.

3. Numerical Modeling

A two-dimensional model was developed based on COMSOL Multiphysics 5.3 (COMSOL, Burlington, MA, USA) to simulate the powder addition, melting, melt flow, and surface deformation during the generation of a single DED clad track. A stationary laser was utilized as a heat input for stainless steel 316 L, and temperature-dependent thermophysical properties such as conductivity, viscosity, and specific heat were used for the solidus, liquidus, and mushy phases. To facilitate melt flow within the molten region, a modified dynamic viscosity was utilized, which inhibits motion in the solid state due to the high viscosity [21]. Natural convection (i.e., gravity-driven flow) and Marangoni flow (i.e., surface-tension-driven flow) were incorporated to induce the flow in the melt pool. A deformed geometry was described through a moving mesh based on an arbitrary Lagrangian–Eulerian method (ALE) in COMSOL, which allows simulating mass addition into the melt pool and predicting the clad growth and generation. The CFD model was meshed using the quadrilateral element type, and the size of the elements was controlled at 13 μm for the melt-pool generation domain and at 100 μm near the fixed temperature boundaries. Mesh independence was studied by checking the effect of mesh size on the simulation results as the mesh size decreased, and the element sizes at which the computation results were not changed anymore were utilized for this modeling study. The calculation was performed with the direct PARDISO solver associated with the implicit Backward Differentiation Formula (BDF) solver. Relative and absolute tolerances were 10−3 and 10−4, respectively.

3.1. Mass and Momentum Conservation Equations

The flow in the melt pool can be described by mass and momentum conservations in Equations (4) and (5). In order to simulate the convective field during the melting process, this model used a method introduced by Murray et al. [21], which treats the different phases of material within the domain with temperature-dependent dynamic viscosity “μ”. With this modified dynamic viscosity “μ(T)”, the solidus state is represented by viscosity that is of an extremely high magnitude (108) to restrict fluid flow within the substrate in Equation (6). The convective melt flow is induced by buoyancy force (Fbouy) during the melting process. According to the Boussinesq approximation, the volume expansion of the melt is assumed to be sufficiently small that its only effect is the buoyance force to the momentum equation [22], and the effect of temperature change on buoyance force is described in Equation (7). Additionally, the melt flow is also driven by the surface tension force developed along the melt-pool boundaries, and the effect of surface tension change due to the temperature variation (i.e., Marangoni effect) is implemented as a boundary condition.
· u = 0
ρ u t + ρ · u u = p + · ( μ u ) + F b o u y
μ ( T ) = 10 8 10 8 μ T s o l i d u s T T l i q u i d u s T s o l i d u s μ    T T s o l i d u s    T s o l i d u s T T l i q u i d u s    T l i q u i d u s T
F b o u y = ρ g β T T

3.2. Energy Equations

Temperature and the distribution of the substrate under the DED process are obtained from the energy equation shown in Equation (8). Energy balance, such as heat input from the injected laser energy into the substrate, heat release from the hot substrate out to regions of lower temperature by conduction, convection, and radiation, and phase-change-related energy transfer, governs temperature distribution in the substrate. In particular, the effect of heat convection induced by the density gradient of the melt substrate and surface tension associated with temperature difference at the boundaries was taken into consideration by coupling with the momentum equation.
ρ c p T t + ρ u · c p T = k T
where ρ denotes the density of the substrate, c p is the specific heat, u is the melt flow velocity, and k is the thermal conductivity.
The effect of temperature on thermophysical material properties during the DED process was included in the modeling to accurately predict the thermal gradients and clad geometry. The changes in thermal conductivity and specific heat change at the high operating temperature are determined based on functions in NIST Thermophysical Properties [23]. As shown in Equations (9) and (10), thermal properties are described by a piecewise function for conditions below the solidus temperature ( T s o l i d u s ), within the mushy zone, and above the liquidus temp ( T l i q u i d u s ). Energy associated with a phase change, latent heat of fusion L F , was incorporated between the solidus and liquidus phases with a modified specific heat according to Ref. [6] and shown in Equation (10).
k T = k s o l i d u s ( T ) k m u s h y T k l i q u i d u s ( T )    T T s o l i d u s    T s o l i d u s T T l i q u i d u s    T l i q u i d u s T
c p T = c ( T ) c T + L F T l i q u i d u s T s o l i d u s c T    T T s o l i d u s    T s o l i d u s T T l i q u i d u s    T l i q u i d u s T
During the DED process, the heat source moves relative to the substrate, but a stationary 2D symmetric laser will be utilized in this model, requiring a method to include the effect of the moving heat source. Here, an interaction time “ t i n ” will be utilized to determine the period of time for the laser injection and its interaction with in-flight metal powders. The interaction time is dependent on the laser beam diameter ( r l ) and the travel speed of the laser “ v l ”, as shown in Equation (11).
t i n = 2 r l v l
Clads are generated in the processes of the injection of powder particles, melting of the power and substrate, deformation of the surface, and solidification of the molten pool. The interaction between the powder particles and the heat source before they enter the melt pool is an important component in the cladding process. The intensity of laser power influx can be attenuated due to interactions with powder particles, and it is especially affected by the powder particle size, surface angle, absorptivity, and particle stream distribution within the laser beam area, according to Ref. [6]. With such a large distribution of small particles (50–180 µm), it would be computationally difficult to track individual particles and their interaction within the laser beam. Thus in this study, the laser intensity values measured experimentally during the DED process [18] were utilized to take into consideration these interactions. Additionally, powder particles are assumed to enter the melt pool in a molten state since the energy required to melt the powder particles is less than 10% of the laser power [4,19]. The phase growth is accounted for by the moving mesh during clad generation.
Some models [7,24] use natural convective velocity to control the deformation of the free surface, and clad generation is implemented through a deformed geometry. In our study, deformed geometry is implemented with an arbitrary Lagrangian–Eulerian (ALE) method, allowing for a moving mesh to simulate the deformation of the free surface. The velocity of the moving mesh is based on the powder mass flow rate “ m ˙ ” and the radius of the powder stream “ r p ”, shown in Equation (12). Since powder catchment is assumed to occur only when the melt pool temperature rises above liquidus temperature, the moving mesh only moves above ( T l i q u i d u s ), as shown in Equation (13). Since the model is 2D symmetric, only the top and left boundary within the molten fluid region (i.e., Domain 2 in Figure 4) will have the moving mesh velocity applied since this will be the region in which melting occurs.
v c l a d = η p m ˙ ρ r p 2 π
v m e s h = η p m ˙ ρ r p 2 π e x 2 r p 2 T T l i q u i d u s
The amount of mass actually captured by the melt pool is key to predicting clad generation, and Ya et al. [11] report that experimental powder efficiency “ η p ” can predict clad generation and dilution, finding powder efficiency in the range of 50–95%. Moving mesh speed is a function of a constant powder distribution based on the powder stream radius, as shown in Ref. [24]. This assumption allowed for varying clad generation speeds and efficiency based on the mass flow rate and powder stream radius.
η p = m ˙ m e a s u r e d m ˙ i n p u t

3.3. Boundary and Initial Conditions

The boundary conditions for this model are shown in Figure 4. For the thermal analysis, convective and radiative losses from the top of Domain 1 and Domain 2 to the surroundings were considered. The laser heat input occurs on the top boundary along Domain 2. Since this model is only simulating a single-track clad on a portion of a much larger substrate that is being held at a constant temperature due to the use of the calorimeter [18], the bottom and right boundaries are assumed to be fixed at ambient temperature. For momentum analysis, the walls of Domain 1 have a no-slip condition. For the top boundary of Domain 2, a slip condition was coupled with a Marangoni boundary condition. For both domains, the left boundary is a line of axial symmetry, and symmetry conditions are applied. The stationary laser heat flux was implemented in the model as an energy-supplying rate ( Q i n ) in the Gaussian function (Equation (15)). In particular, the measured power was used for the value of “p”, which was obtained experimentally with a Molectron PM5 power meter [17] to implement the interference effect by metal powders. The measured power was found to be ~75% of the input set power within the working range of 450 W–850 W. The laser-energy-supplying rate changes spatially with “x” relative to beam spot radius “ r l ”. Surface absorptivity “α” is assumed to be constant, as conducted in Ref. [6].
Q i n = α P π r l 2 e 2 x 2 r l 2
where Q i n denotes the laser power input.
The heat energy is released to the environment through convection and radiation, which is applied onto the top surface as a boundary condition:
Q o u t = h T T a m b + ϵ σ T 4 T a m b 4
where h denotes the convection coefficient, and ϵ is emissivity. Ambient temperature ( T a m b = 293 K) is assumed to be constant. In the experiments, argon gas was used not only as shielding gas to maintain inert conditions, but also as carrier gas to deliver powders into the melt pool.

4. Results and Discussion

4.1. Experimental Results

The resulting geometric property of each clad track (i.e., the clad height) is used to investigate the effects of processing parameters of laser power intensity, laser scan speed, and powder feed rate. As the powder feed rate increases, more mass can be captured and solidified within the melt pool, resulting in increased clad height, as shown in Figure 5a. The effect of laser power on the clad height is influenced by laser scan speeds, and as the scan speed decreases from 12.7 to 8.5 and 4.2 mm/s, the available laser power for melting the powdered material increases, resulting in higher clad. So, the term “global energy density”, which is the laser power normalized by the scan speed as defined in Equation (1), can be utilized to account for the effect of the actual laser power. Additionally, selection of clad height based on only powder feed rate is not straightforward, since the same powder feed rate can result in drastically different clad generation at different energy densities. In order to take into consideration of those effects, powder feed rate normalized by laser scan speed, called “linear mass deposition” as defined in Equation (2), can be utilized.
The experimental data were plotted with respect to two normalized parameters (i.e., energy density and linear mass deposition) in Figure 5b, and the effect of linear mass deposition on clad height was compared for three energy density cases (34.1, 51.2, 102.4 J/mm2). Even though the data could not be well correlated to a single linear line, the data clearly showed the trend of clad height, which increases with the increase of linear deposition for all the energy density cases, indicating the normalized parameters can be used as key factors to characterize the effect of processing parameters on the clad geometry.
The goal of this analysis is to select processing parameters and their conditions that result in “ideal” clad geometry, and dilution (Equation (3)) of 50% shows that the clad height is equal to the melted depth. The ideal clad can be conceptualized as the point where the energy input for clad generation is equal to the energy used for melting of the substrate. Thus, 50% of dilution was decided as a criterion for the ideal clad, and process conditions producing less than 50% of dilution (i.e., more energy used for clad generation) are desirable.
Images of clad whose dilution is less than 50% can be seen in Figure 6. Figure 6a is the image of clad fabricated at a laser scan speed of 4.2 mm/s and powder flow rate of 0.065 g/s, and the clad’s height, depth, and width are 377.6, 328.8, and 1307.1 μm, respectively. The clad image for a scan speed of 8.5 mm/s and flow rate of 0.13 g/s is in Figure 6b, and the dimensions of the clad are 332.1, 283.3, and 1126.2 for height, depth, and width, respectively. Figure 6c is the clad image made at the scan speed (12.7 mm/s) and flow rate (0.15 g/s), and the clad dimensions are height = 246.4 μm, depth = 224.6 μm, and width = 1037.8 μm. It should be noted that the height and depth of the clad provide important information to determine the stability of the produced clad and powder and energy efficiencies of the DED process, and thus in this study, clad height and depth were mainly utilized as key geometry information of the clad.
The overall effect of processing parameters on dilution can be understood in Figure 7. As shown in Figure 7a, a powder feed rate of 0.07 g/s results in dilution of 45.05% and 69.78% for scan speeds of 4.2 and 8.5 mm/s, which corresponds to energy densities of 102.36 and 51.18 (J/mm2). This shows that energy density has a significant role in the effect of the powder feed rates on the dilution, and higher feed rates are required to reach the same dilution for the lower energy density cases. As energy density increases (i.e., scan speed decreases at the fixed laser intensity), laser interaction time with the melt pool increases, and the amount of powders captured in the melt pool is larger, leading to higher clad generation.
The dilution is also compared with respect to two normalized parameters (energy density and linear mass deposition) in Figure 7b. The data clearly show the trend of dilution with respect to linear mass deposition for all the energy density cases, which can be used as important guidelines for selecting processing conditions. For instance, the linear mass deposition below around 13 g/m is not desirable because ideal dilution cannot be achieved for all the energy densities.

4.2. Model Results

The clad geometry and temperature distribution were predicted from the developed model, and they were compared with the experimental results, as shown in Figure 8. The largest error for clad height was 26.26% at the conditions of GED = 34.12 J/mm2 and λ m = 7.08 g/m, and the smallest error was 3.72% at the conditions of GED = 102.36 J/mm2 and λ m = 16.53 g/m, resulting in an average error for height of 8.89%. The largest error at the smallest GED is considered to occur due to the effect of uncontrollable dynamic interferences to the injected laser by the sprayed metallic powders, and the effect becomes more severe as GED decreases. Thus, actual laser power hitting the melt pool will be varied sensitively by the powder interference, affecting clad formation. However, the average error is less than 10%, and the developed model can be used for the analysis. Maximum temperature increased from 3000 K to 4000 K as GED was changed from 34.12 to 102.36 J/mm2, which agrees with Ref. [25].
Figure 9 shows that the data (i.e., clad height and dilution) predicted from the model are well aligned with those measured in the experiment. There are few deviations or errors, and they may be due to the assumptions utilized for model development such as interactions of preheated and cooling powder particles, laser attenuation, and local phase-change effects. The prediction may be improved by using three-dimensional simulation with the inclusion of metal powder dynamics, allowing us to use fewer assumptions for model development, which is in future work.
The developed model was utilized to characterize the DED process with two normalized parameters of global energy densities (GEDs) and linear mass deposition ( λ m ). Powder efficiency was analyzed for various operating conditions, and as shown in Figure 10, the powder efficiency increased linearly with the increase in GED. For λ m = 16.5 g/m, the powder efficiency was 0.45 at GED = 34.1 J/mm2, and it linearly increased to 0.51 (i.e., 13.2% increase) at GDE = 102.4 J/mm2. The powder efficiency was also affected by λ m , and it increased by 28% as λ m decreased from 16.5 to 5.9 g/m. In Figure 11, dilution was analyzed with respect to GED. There was a significant effect of λ m on the dilution, but the effect of GED on each linear mass deposition was not great.
The results of Figure 10 and Figure 11 can be utilized to find proper processing conditions. Desirable clad dilution (i.e., less than 50% of dilution) can be achieved as long as the linear mass deposition is greater than λ m = 14.2 g/m, regardless of the GED values considered in this study, as shown in Figure 11, suggesting λ m could be the dominant processing parameter for DED. However, we need to consider an additional important performance index, powder efficiency as well. The powder efficiency is affected by GED and λ m , as illustrated in Figure 10. At a linear mass deposition of λ m = 14.2 g/m, GED greater than around 60 J/mm2 should be used to have desirable clad dilution and powder efficiency above 50%, indicating the results of this study can be utilized as processing guidelines. People in industry can similarly utilize this study results to find the operating conditions recommended for their DED processes.

5. Conclusions

In this study, directed energy deposition (DED) metal additive manufacturing was investigated through experimental and physics-based modeling studies to advance the current understanding of the effect of processing conditions on the geometry of fabricated samples. An OPTOMEC 850M LENS was used to fabricate 30 samples with stainless steel 316 L in the various processing conditions such as laser travel speed, powder flow rate, and laser power intensity, and the clad geometries were measured with an imaging microscope. In order to analyze the effect in detail, a physics-based two-dimensional unsteady melt-pool model was developed by including natural convection, temperature-dependent thermophysical properties, phase change, fluid dynamics, and surface deformation. The DED process was successively analyzed by two normalized processing parameters such as global energy density (GED) and linear mass deposition ( λ m ), which can be obtained by normalizing laser power intensity and mass flow rate by laser scan speed.
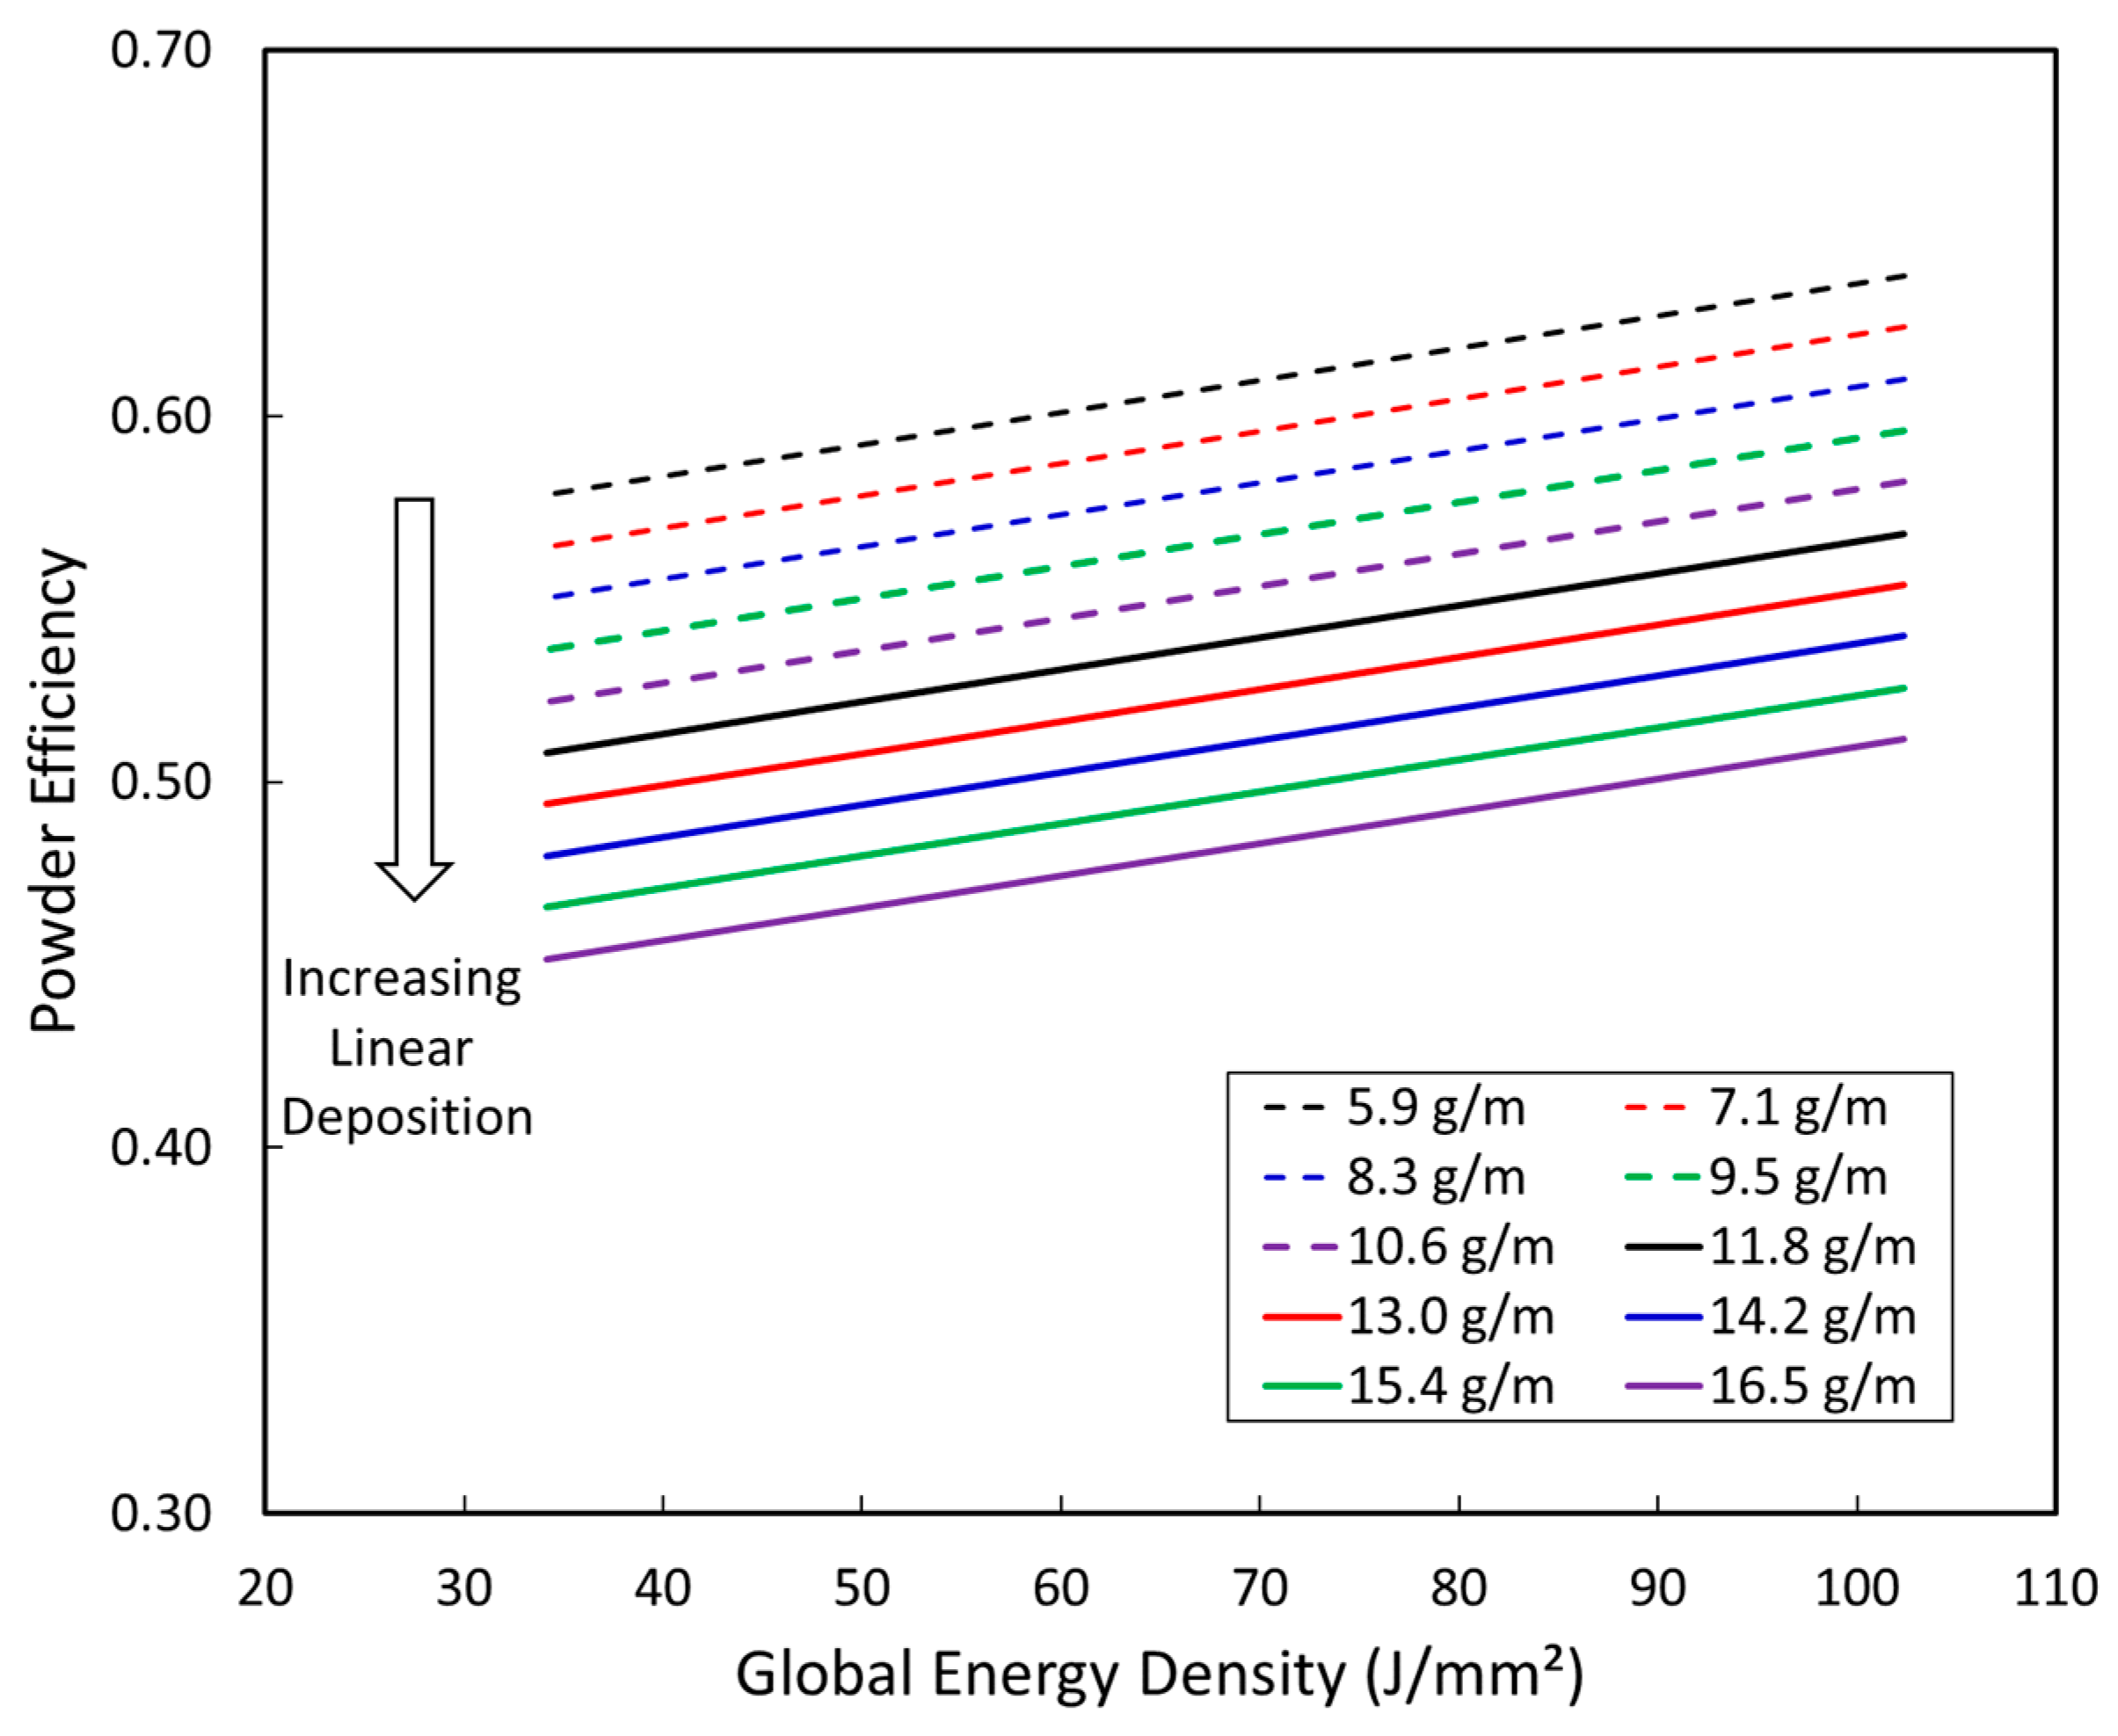
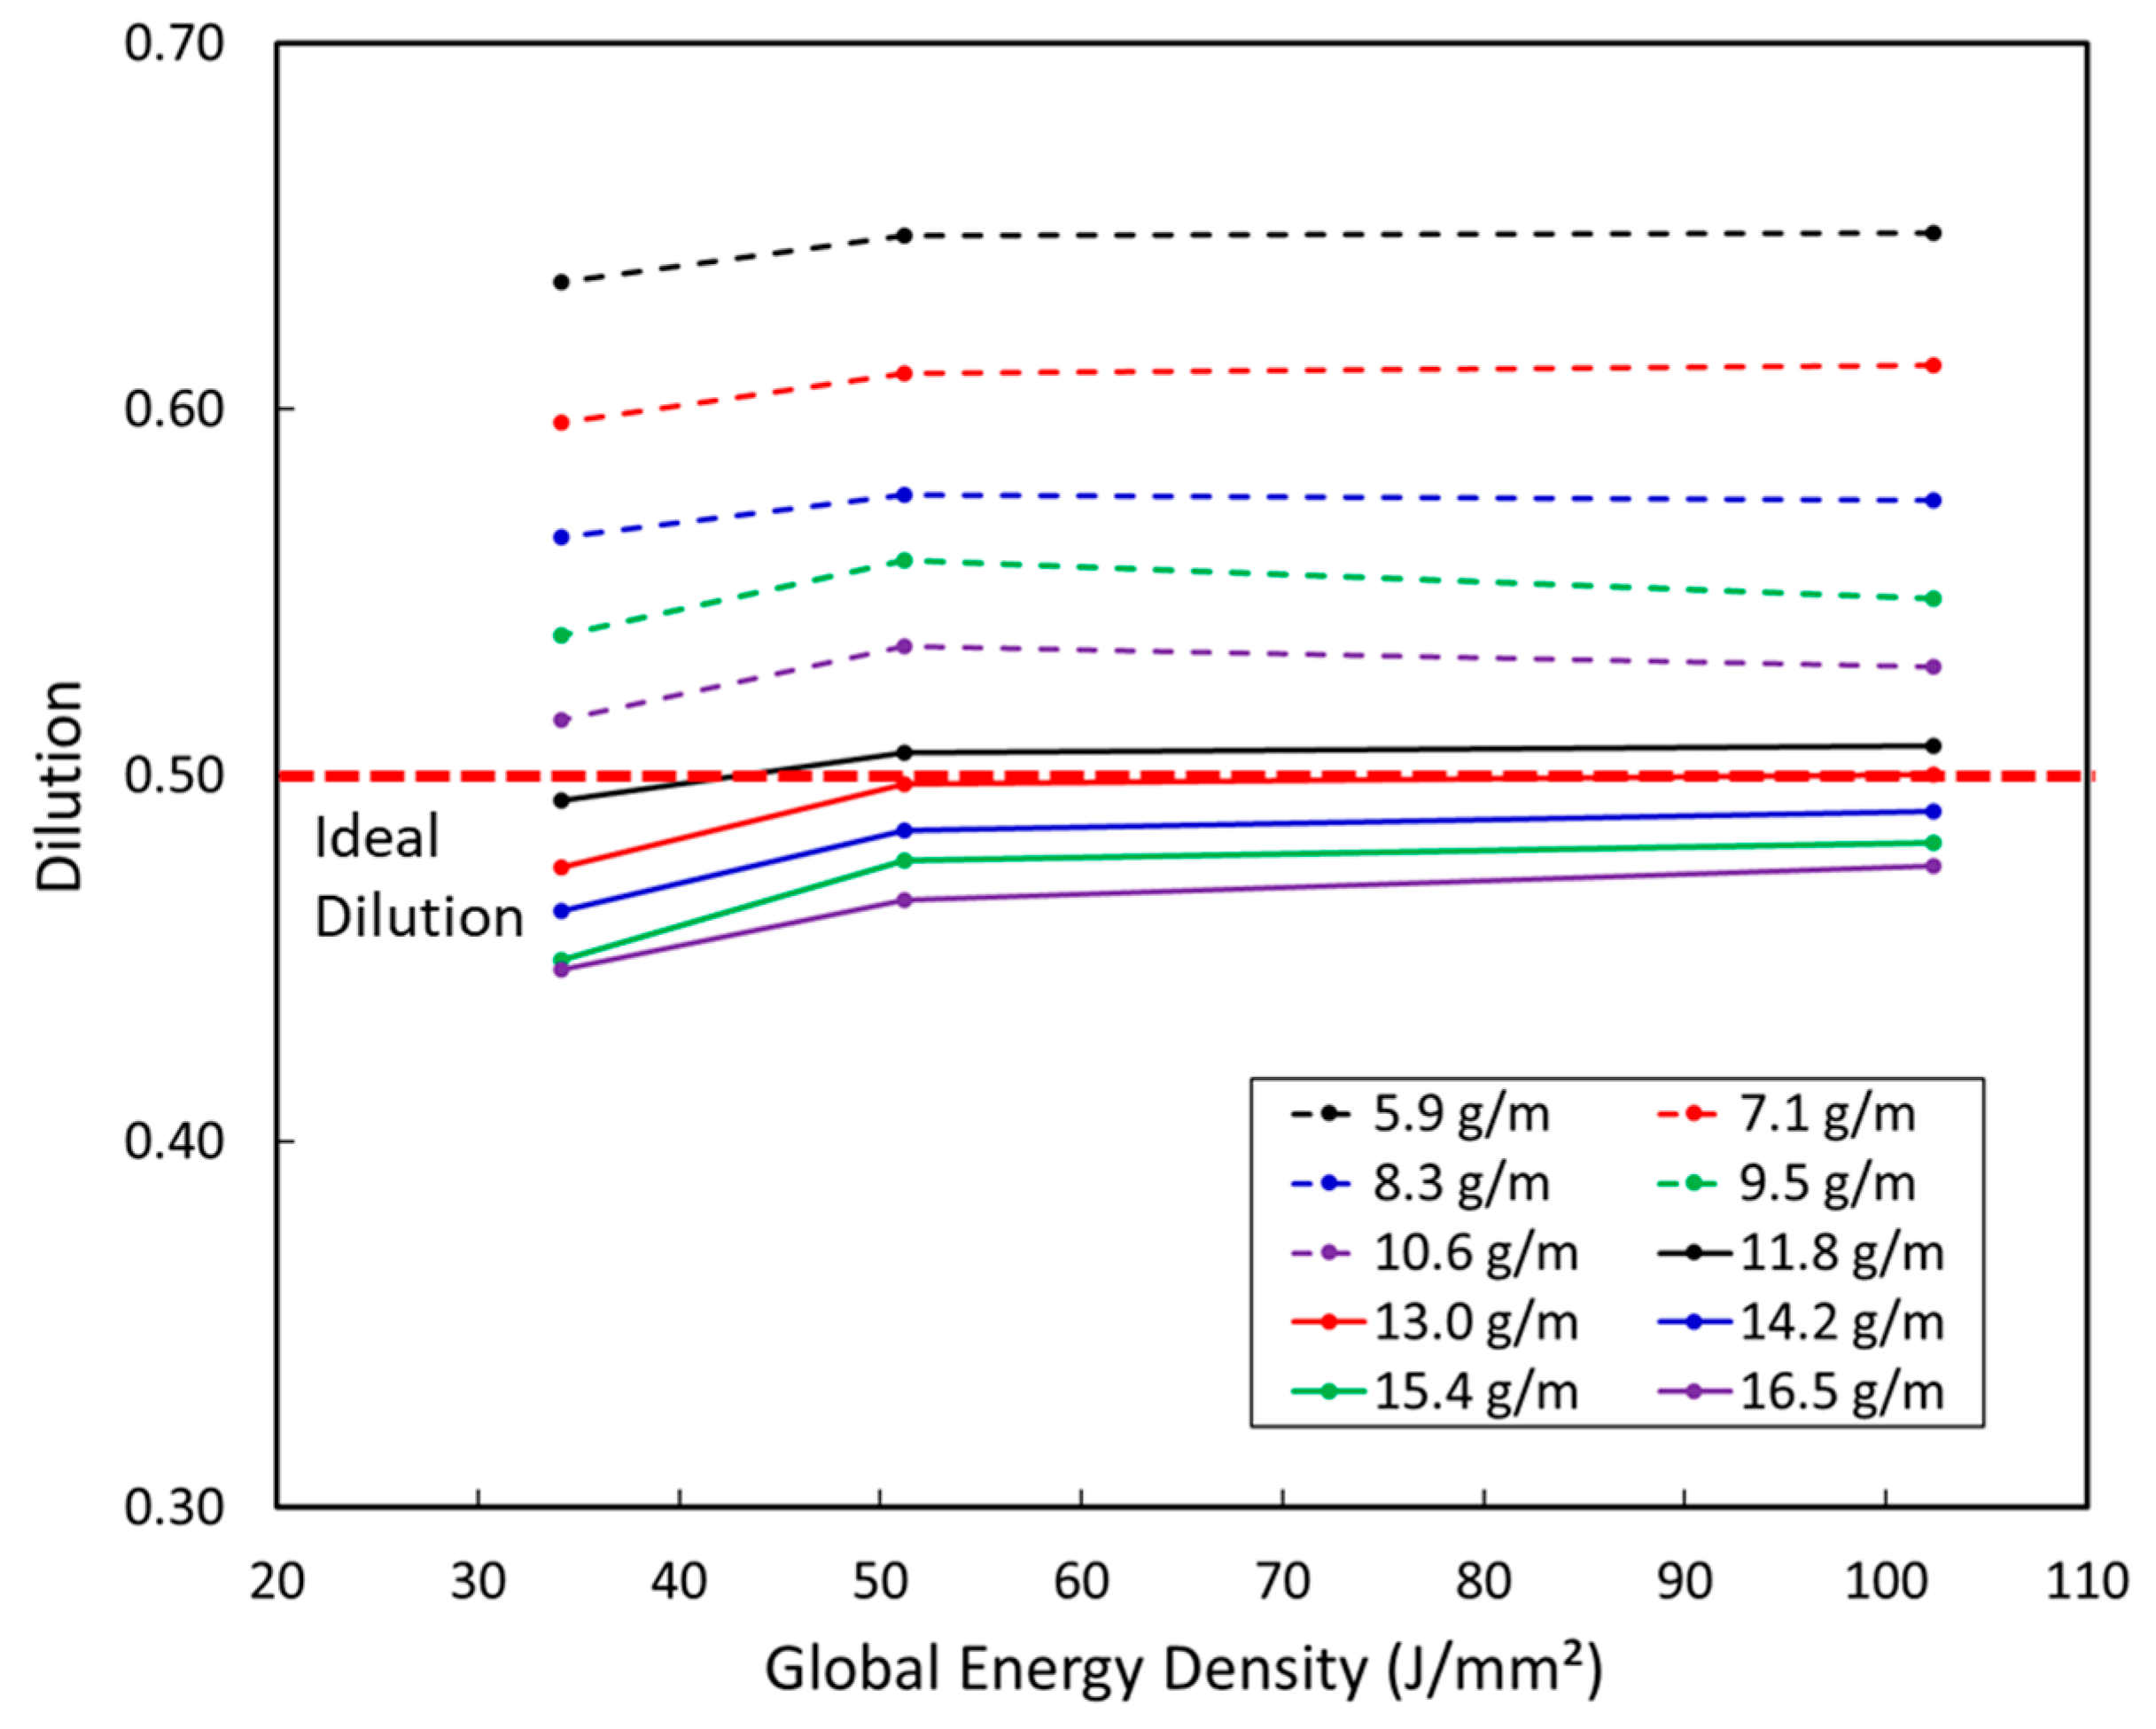
It was found that the desirable clad dilution (i.e., less than 50% of dilution) could be achieved as long as λ m is greater than 14.2 g/m at all the GED conditions, and a powder efficiency above 50% could be obtained with the same λ m but at GED greater than around 60 J/mm2, indicating the results of this study can be utilized as processing guidelines for the DED method. In order to develop universal process maps covering all the possible processing conditions and AM technologies, an advanced method synergistically combining experimental, physics-models, and data-based artificial intelligence models needs to be utilized to correlate highly non-linear and large data sets, which is under investigation.

Author Contributions

Conceptualization, L.N., K.T.C., J.S. and F.S., methodology, L.N. and K.T.C.; software and validation, L.N.; formal analysis and investigation, L.N.; resources, K.T.C.; data curation, L.N. and K.T.C.; writing—original draft preparation, L.N. and K.T.C.; writing—review and editing, K.T.C., J.S. and F.S.; supervision, K.T.C., J.S. and F.S. All authors have read and agreed to the published version of the manuscript.

Funding

This research received no external funding. The processing fee for the publication was supported by the NIU library.

Institutional Review Board Statement

Not applicable because this study does not involve humans or animals.

Informed Consent Statement

Not applicable because this study does not involve humans or animals.

Data Availability Statement

Some or all data, models, or code presented in this study are available on reasonable request from the corresponding author.

Acknowledgments

The authors appreciate the experimental assistance from many undergraduate students at NIU.

Conflicts of Interest

The authors declare no conflict of interest.

Nomenclature

SymbolDescriptionUnits
ϵ Emissivity1
vlLaser travel speedm s−1
ρDensitykg m−3
μDynamic viscositykg m−1 s−1
δSurface anglerad
βCoefficient of thermal expansionK−1
αAbsorptivity1
pPressureN m−2
kThermal conductivityW m−1 K−1
gGravitational coefficientm s−2
cSpecific HeatJ kg−1 K−1
cpModified specific heatJ kg−1 K−1
TTemperatureK
PLaser powerW
hConvection coefficientW m−2 K−1
σbStefan–Boltzmann constantW m−1 K−4
u Velocity fieldm s−1
rlBeam radiusm
TsolidusSolidus temperatureK
TliquidusLiquidus temperatureK
LfLatent heat of fusionJ kg−1
pambAmbient pressureN m−2
TambAmbient temperatureK
v m e s h Moving mesh velocitym s−1
G E D Global energy densityJ mm−2

References

  1. U.S. Additive Manufacturing Market Size Report, 2030. Available online: https://www.grandviewresearch.com/industry-analysis/us-additive-manufacturing-market-report (accessed on 1 November 2022).
  2. U.S. Department of Energy. Additive Manufacturing: Building the Future, Office of Technology Transisitons; U.S. Department of Energy: Washington, DC, USA, 2019.
  3. Pinkerton, A.J. [INVITED] Lasers in additive manufacturing. Opt. Laser Technol. 2016, 78, 25–32. [Google Scholar] [CrossRef]
  4. Yan, Z.; Liu, W.; Tang, Z.; Liu, X.; Zhang, N.; Li, M.; Zhang, H. Review on thermal analysis in laser-based additive manufacturing. Opt. Laser Technol. 2018, 106, 427–441. [Google Scholar] [CrossRef]
  5. Arrizubieta, J.I.; Lamikiz, A.; Klocke, F.; Martínez, S.; Arntz, K.; Ukar, E. Evaluation of the relevance of melt pool dynamics in Laser Material Deposition process modeling. Int. J. Heat Mass Transf. 2017, 115, 80–91. [Google Scholar] [CrossRef]
  6. De La Batut, B.; Fergani, O.; Brotan, V.; Bambach, M.; El Mansouri, M. Analytical and numerical temperature prediction in direct metal deposition of Ti6Al4V. J. Manuf. Mater. Process. 2017, 1, 3. [Google Scholar] [CrossRef]
  7. Parekh, R.; Buddu, R.K.; Patel, R.I. Multiphysics Simulation of laser cladding process to study the effect of process parameters on clad geometry. Procedia Technol. 2016, 23, 529–536. [Google Scholar] [CrossRef]
  8. Foteinopoulos, P.; Papacharalampopoulos, A.; Stavropoulos, P. On thermal modeling of additive manufacturing processes. CIRP J. Manuf. Sci. Technol. 2018, 20, 66–83. [Google Scholar] [CrossRef]
  9. Gouge, M.; Michaleris, P. (Eds.) Thermo-Mechanical Modeling of Additive Manufacturing; Butterworth-Heinemann: Oxford, UK, 2018; ISBN 978-0-12-811820-7. [Google Scholar]
  10. Romano, J.; Ladani, L.; Sadowski, M. Thermal modeling of laser based additive manufacturing processes within common materials. Procedia Manuf. 2015, 1, 238–250. [Google Scholar] [CrossRef]
  11. Ya, W.; Pathiraj, B.; Liu, S. 2D modelling of clad geometry and resulting thermal cycles during laser cladding. J. Mater. Process. Technol. 2016, 230, 217–232. [Google Scholar] [CrossRef]
  12. Caiazzo, F.; Alfieri, V. Simulation of laser-assisted directed energy deposition of aluminum powder: Prediction of geometry and temperature evolution. Materials 2019, 12, 2100. [Google Scholar] [CrossRef] [PubMed]
  13. Ren, K.; Chew, Y.; Fuh, J.Y.H.; Zhang, Y.F.; Bi, G.J. Thermo-mechanical analyses for optimized path planning in laser aided additive manufacturing processes. Mater. Des. 2019, 162, 80–93. [Google Scholar] [CrossRef]
  14. Cho, C.; Zhao, G.; Kwak, S.-Y.; Kim, C.B. Computational mechanics of laser cladding process. J. Mater. Process. Technol. 2004, 153–154, 494–500. [Google Scholar] [CrossRef]
  15. Gürtler, F.-J.; Karg, M.; Leitz, K.-H.; Schmidt, M. Simulation of laser beam melting of steel powders using the three-dimensional volume of fluid method. Phys. Procedia 2013, 41, 881–886. [Google Scholar] [CrossRef]
  16. Tabernero, I.; Lamikiz, A.; Martínez, S.; Ukar, E.; López de Lacalle, L.N. Modelling of energy attenuation due to powder flow-laser beam interaction during laser cladding process. J. Mater. Process. Technol. 2012, 212, 516–522. [Google Scholar] [CrossRef]
  17. Sciammarella, F.M.; Salehi Najafabadi, B. Processing parameter DOE for 316L using directed energy deposition. J. Manuf. Mater. Process. 2018, 2, 61. [Google Scholar] [CrossRef]
  18. Malin, V.; Sciammarella, F. Controlling heat input by measuring net power. Weld. J. 2006, 85, 44–50. [Google Scholar]
  19. Sciammarella, F.; Santner, J.; Gonser, M.; Whiting, J.; Nikolov, D. Uniform Chilling Calorimeter System. US Patent 10,466,189 B2, 2019. [Google Scholar]
  20. Whiting, J.; Springer, A.; Sciammarella, F. Real-time acoustic emission monitoring of powder mass flow rate for directed energy deposition. Addit. Manuf. 2018, 23, 312–318. [Google Scholar] [CrossRef] [PubMed]
  21. Modeling Convection during Melting of a Phase Change Material. Available online: https://www.comsol.com/paper/modeling-convection-during-melting-of-a-phase-change-material-10463 (accessed on 1 September 2022).
  22. Cook, P.S.; Murphy, A.B. Simulation of melt pool behaviour during additive manufacturing: Underlying physics and progress. Addit. Manuf. 2020, 31, 100909. [Google Scholar] [CrossRef]
  23. Valencia, J.J.; Quested, P.N. Thermophysical Properties; National Institute of Standards and Technology: Gaithersburg, MD, USA, 2013.
  24. Morville, S.; Carin, M.; Peyre, P.; Gharbi, M.; Carron, D.; Le Masson, P.; Fabbro, R. 2D longitudinal modeling of heat transfer and fluid flow during multilayered direct laser metal deposition process. J. Laser Appl. 2012, 24, 032008. [Google Scholar] [CrossRef]
  25. Wang, D.; Li, S.; Deng, G.; Liu, Y.; Attallah, M.M. A melt pool temperature model in laser powder bed fabricated CM247LC Ni superalloy to rationalize crack formation and microstructural inhomogeneities. Metall. Mater. Trans. A 2021, 52, 5221–5234. [Google Scholar] [CrossRef]
Figure 1. Diagram of directed energy deposition (DED).
Jmmp 07 00105 g001
Figure 2. OPTOMEC 850M machine.
Jmmp 07 00105 g002
Figure 3. (a) Cross-sectional clad diagram, and (b) Processed clad sample picture. Small labels in the picture are simply experimental notes.
Jmmp 07 00105 g003
Figure 4. Diagram of boundary conditions.
Jmmp 07 00105 g004
Figure 5. Effect of processing parameters on clad height at laser power of 650 W: (a) clad height with respect to powder feed rate at various laser scan speeds; (b) clad height with respect to linear mass deposition at various energy densities.
Jmmp 07 00105 g005
Figure 6. Cross-sectional images of clad fabricated at ideal dilution conditions: (a) laser scan speed (4.2 mm/s) and powder flow rate (0.065 g/s), (b) laser scan speed (8.47 mm/s) and powder flow rate (0.13 g/s), and (c) laser scan speed (12.7 mm/s) and powder flow rate (0.15 g/s). Small labels in the pictures are simply experimental notes.
Jmmp 07 00105 g006
Figure 7. Effect of processing parameters on dilution at laser power of 650 W: (a) dilution with respect to powder feed rate at various laser scan rates; (b) dilution with respect to linear mass deposition at various energy densities.
Jmmp 07 00105 g007
Figure 8. Experimental and model image comparison at the conditions: (a) GED = 34.12 J/mm2, λ m = 7.08 g/m; (b) GED = 102.36 J/mm2, λ m = 16.53 g/m. Small labels in the pictures are simply experimental notes.
Jmmp 07 00105 g008
Figure 9. Comparison of experimental and modeling results: (a) comparison of clad height from experiment and modeling results; (b) comparison of dilution from experiment and modeling results.
Jmmp 07 00105 g009
Figure 10. Powder efficiency with respect to global energy densities.
Jmmp 07 00105 g010
Figure 11. Dilution with respect to global energy densities.
Jmmp 07 00105 g011
Table 1. Experimental Processing Parameters.
Processing ParametersConditions
Power level (W)650
Travel speed (mm/s)4.2, 8.5, 12.7
Linear mass deposition ( λ m ) (g/m)5.9, 7.1, 8.3, 10.6, 11.8, 13.0, 14.2, 15.3, 16.5
Disclaimer/Publisher’s Note: The statements, opinions and data contained in all publications are solely those of the individual author(s) and contributor(s) and not of MDPI and/or the editor(s). MDPI and/or the editor(s) disclaim responsibility for any injury to people or property resulting from any ideas, methods, instructions or products referred to in the content.

