

Investigation of the Shape and Detectability of Pores with X-ray Computed Tomography
Abstract
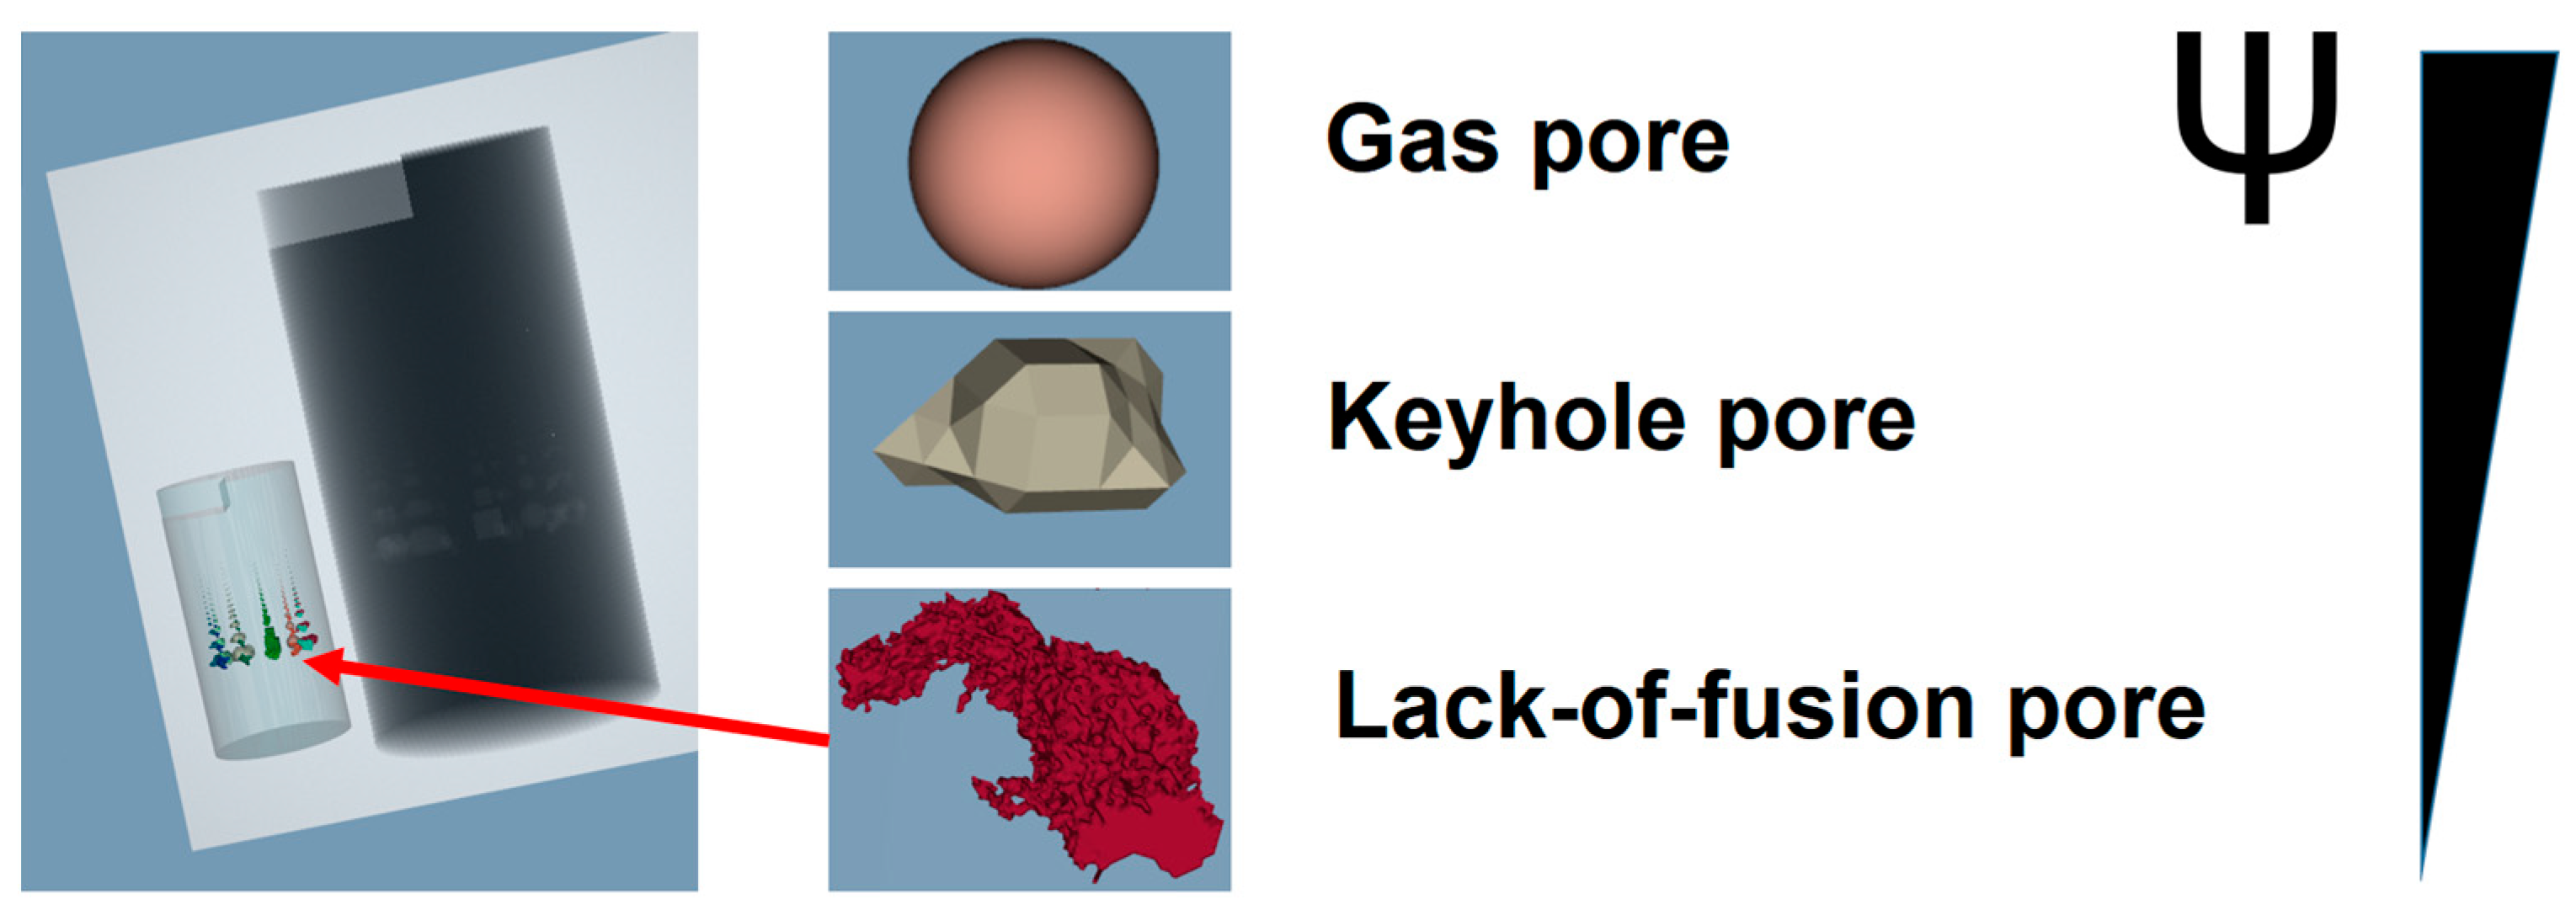
:1. Introduction
2. Materials and Methods
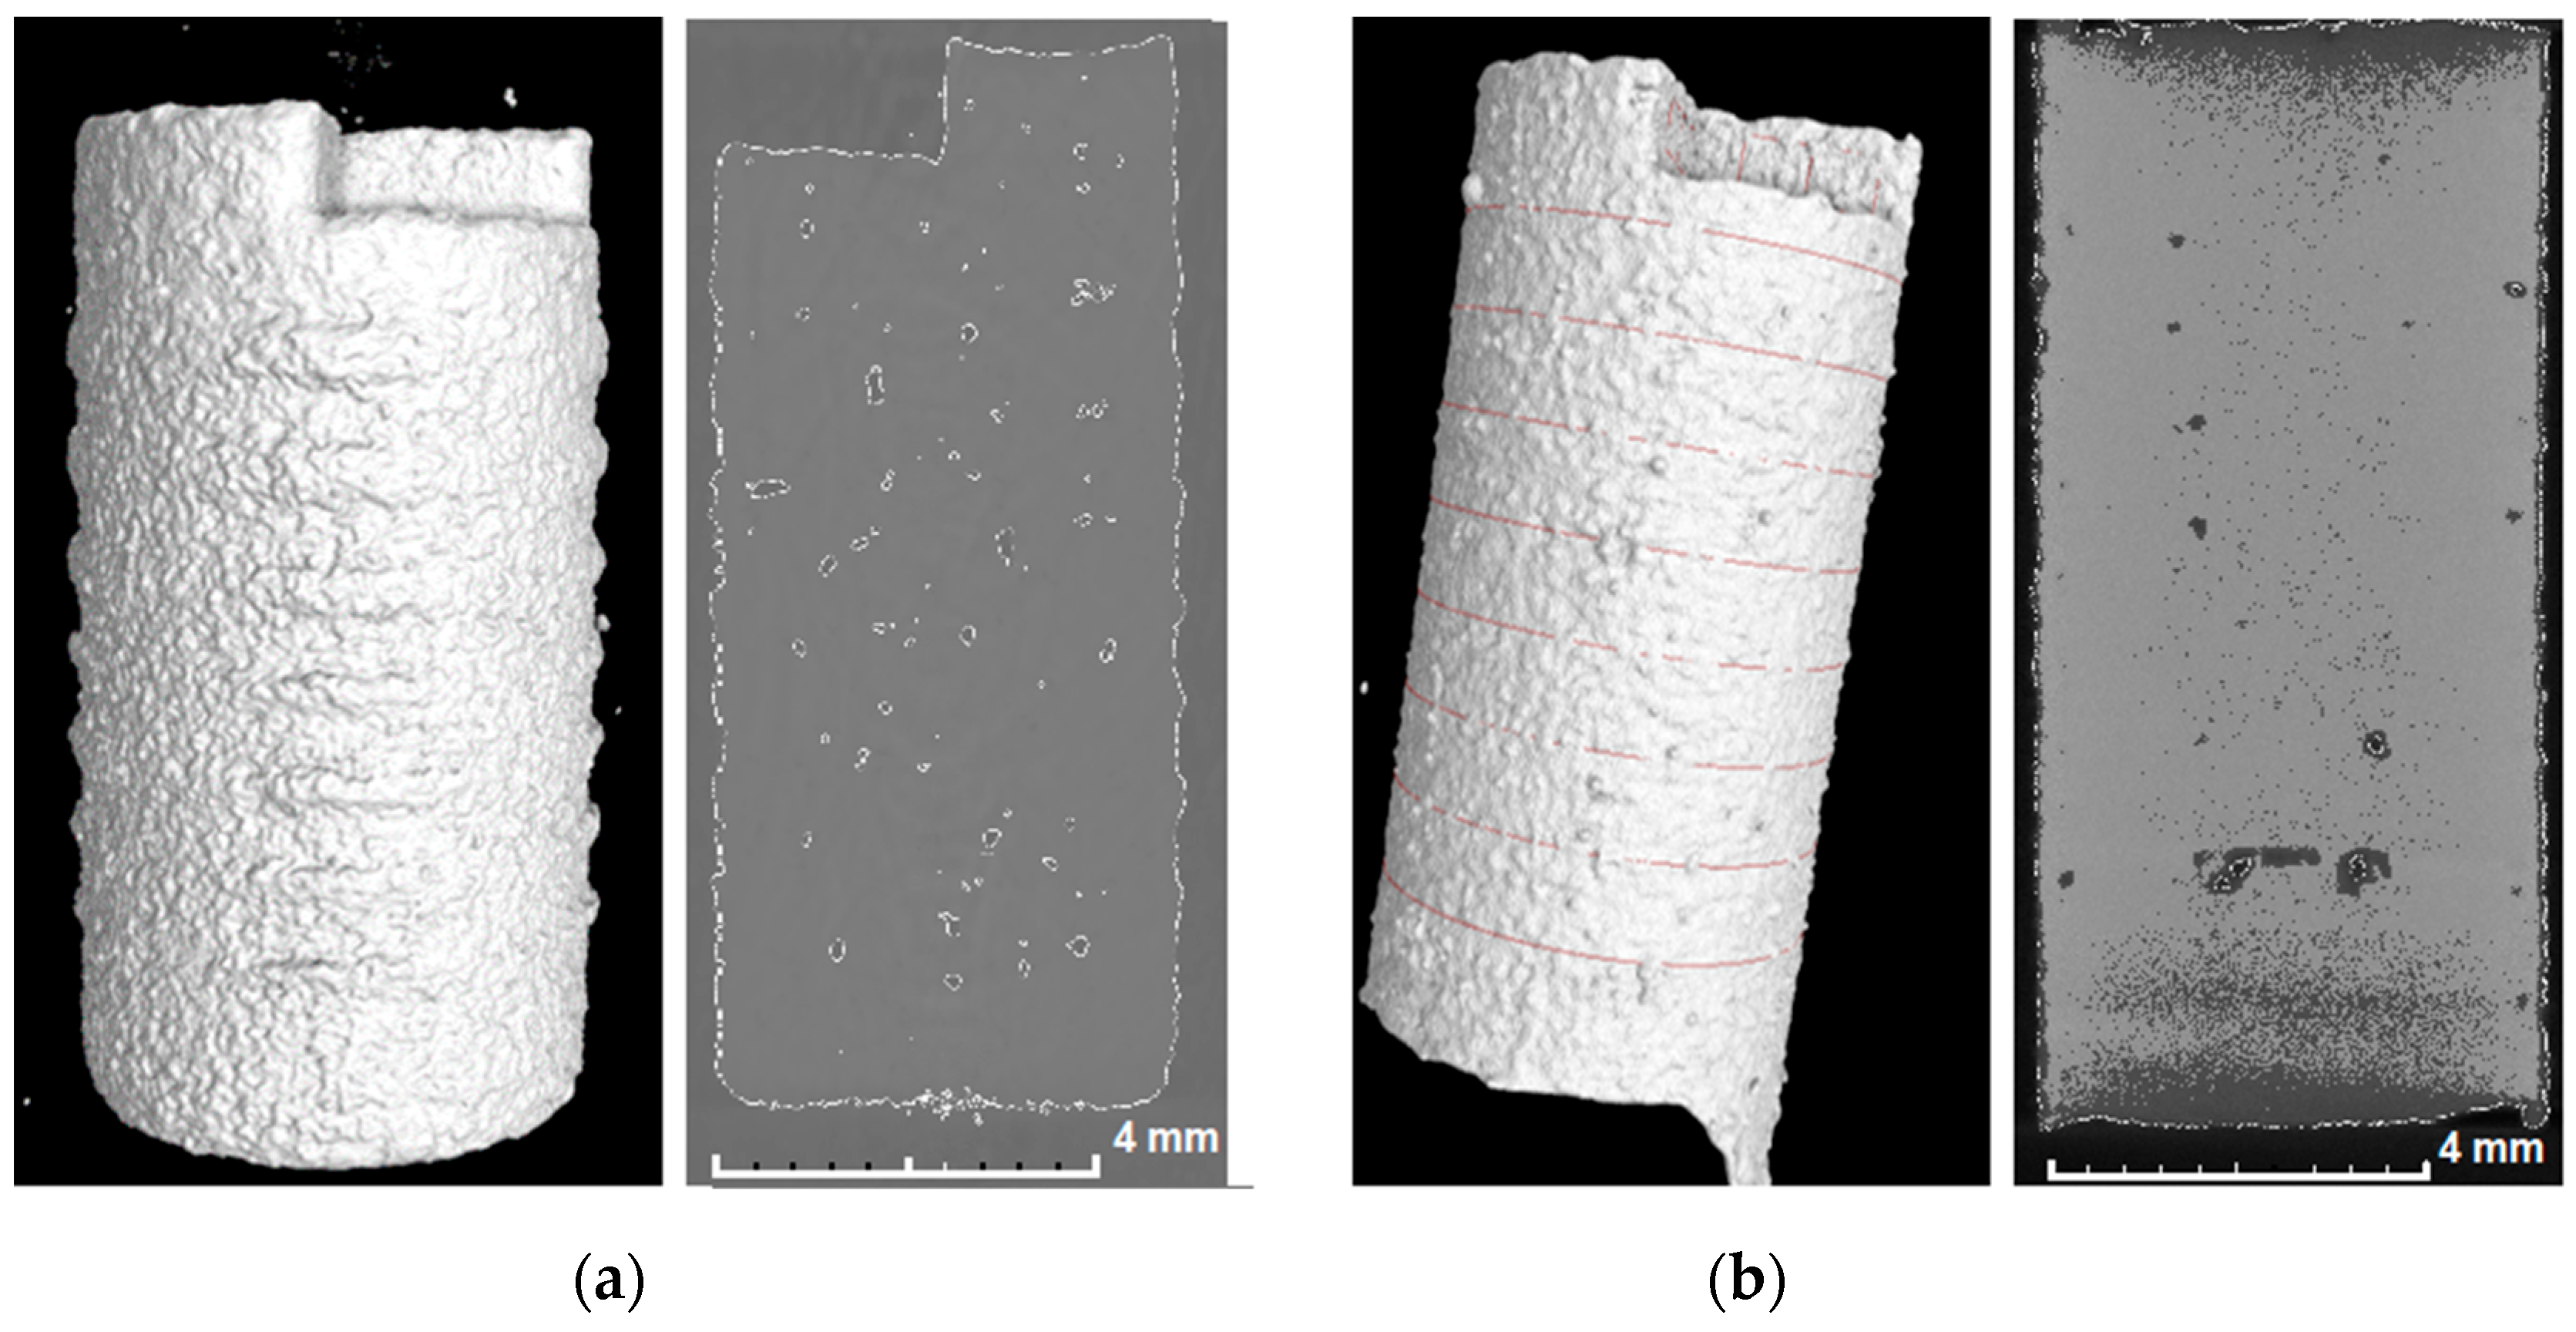
2.1. Samples
2.2. CT Measurement
2.3. CT Simulation
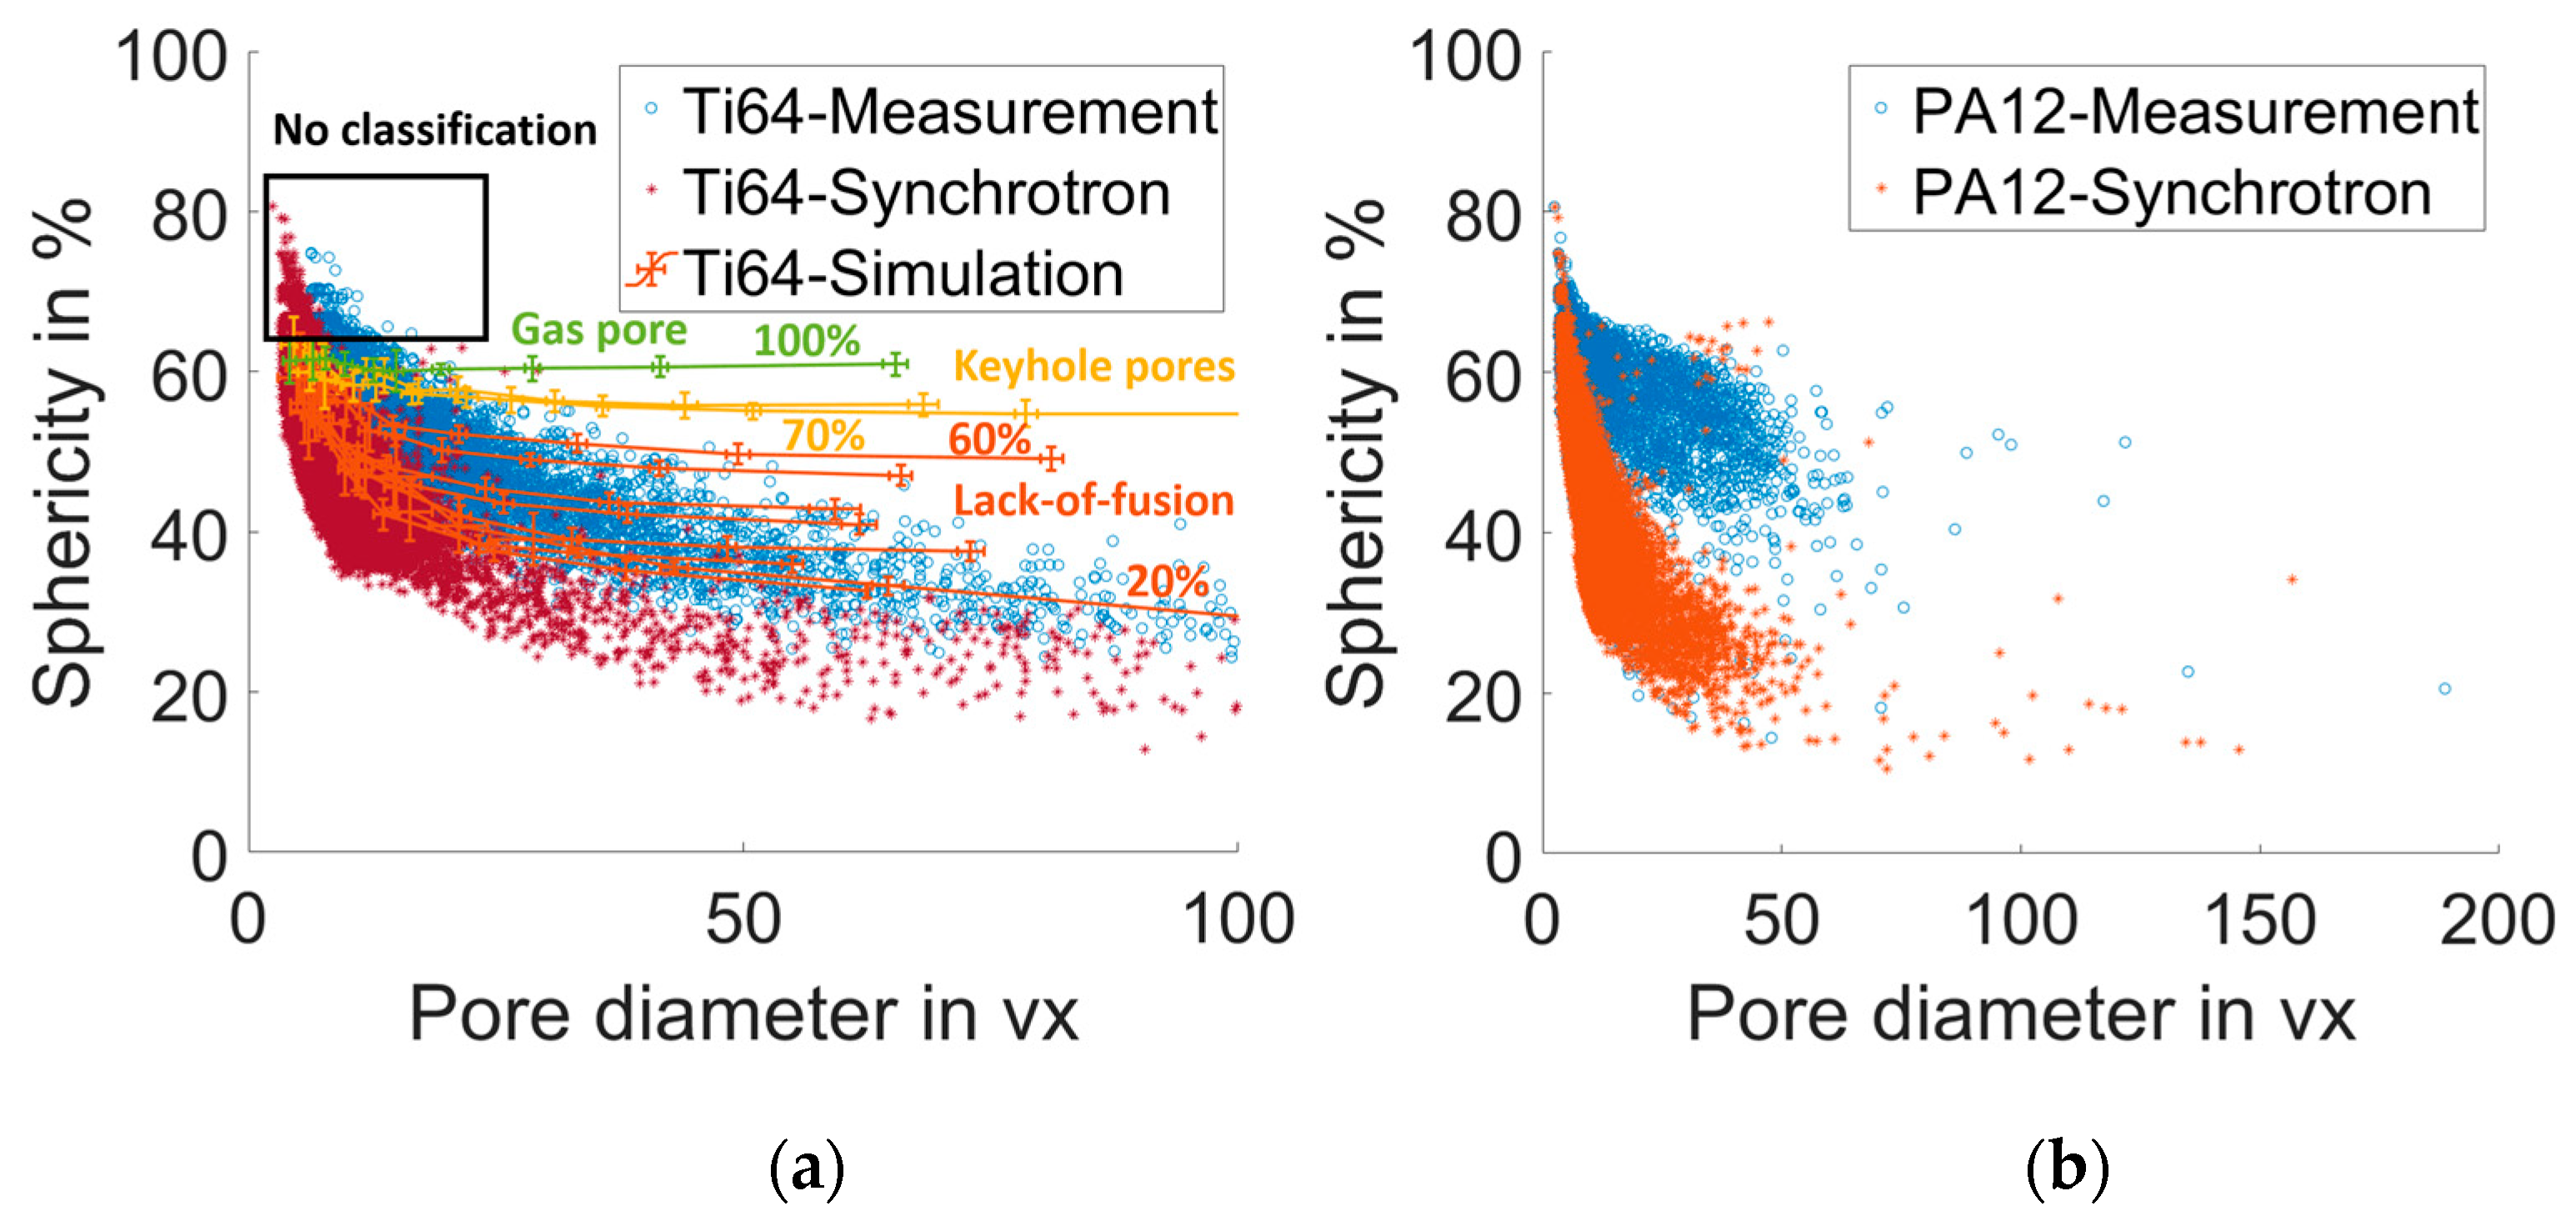
2.4. Metrological Evaluation
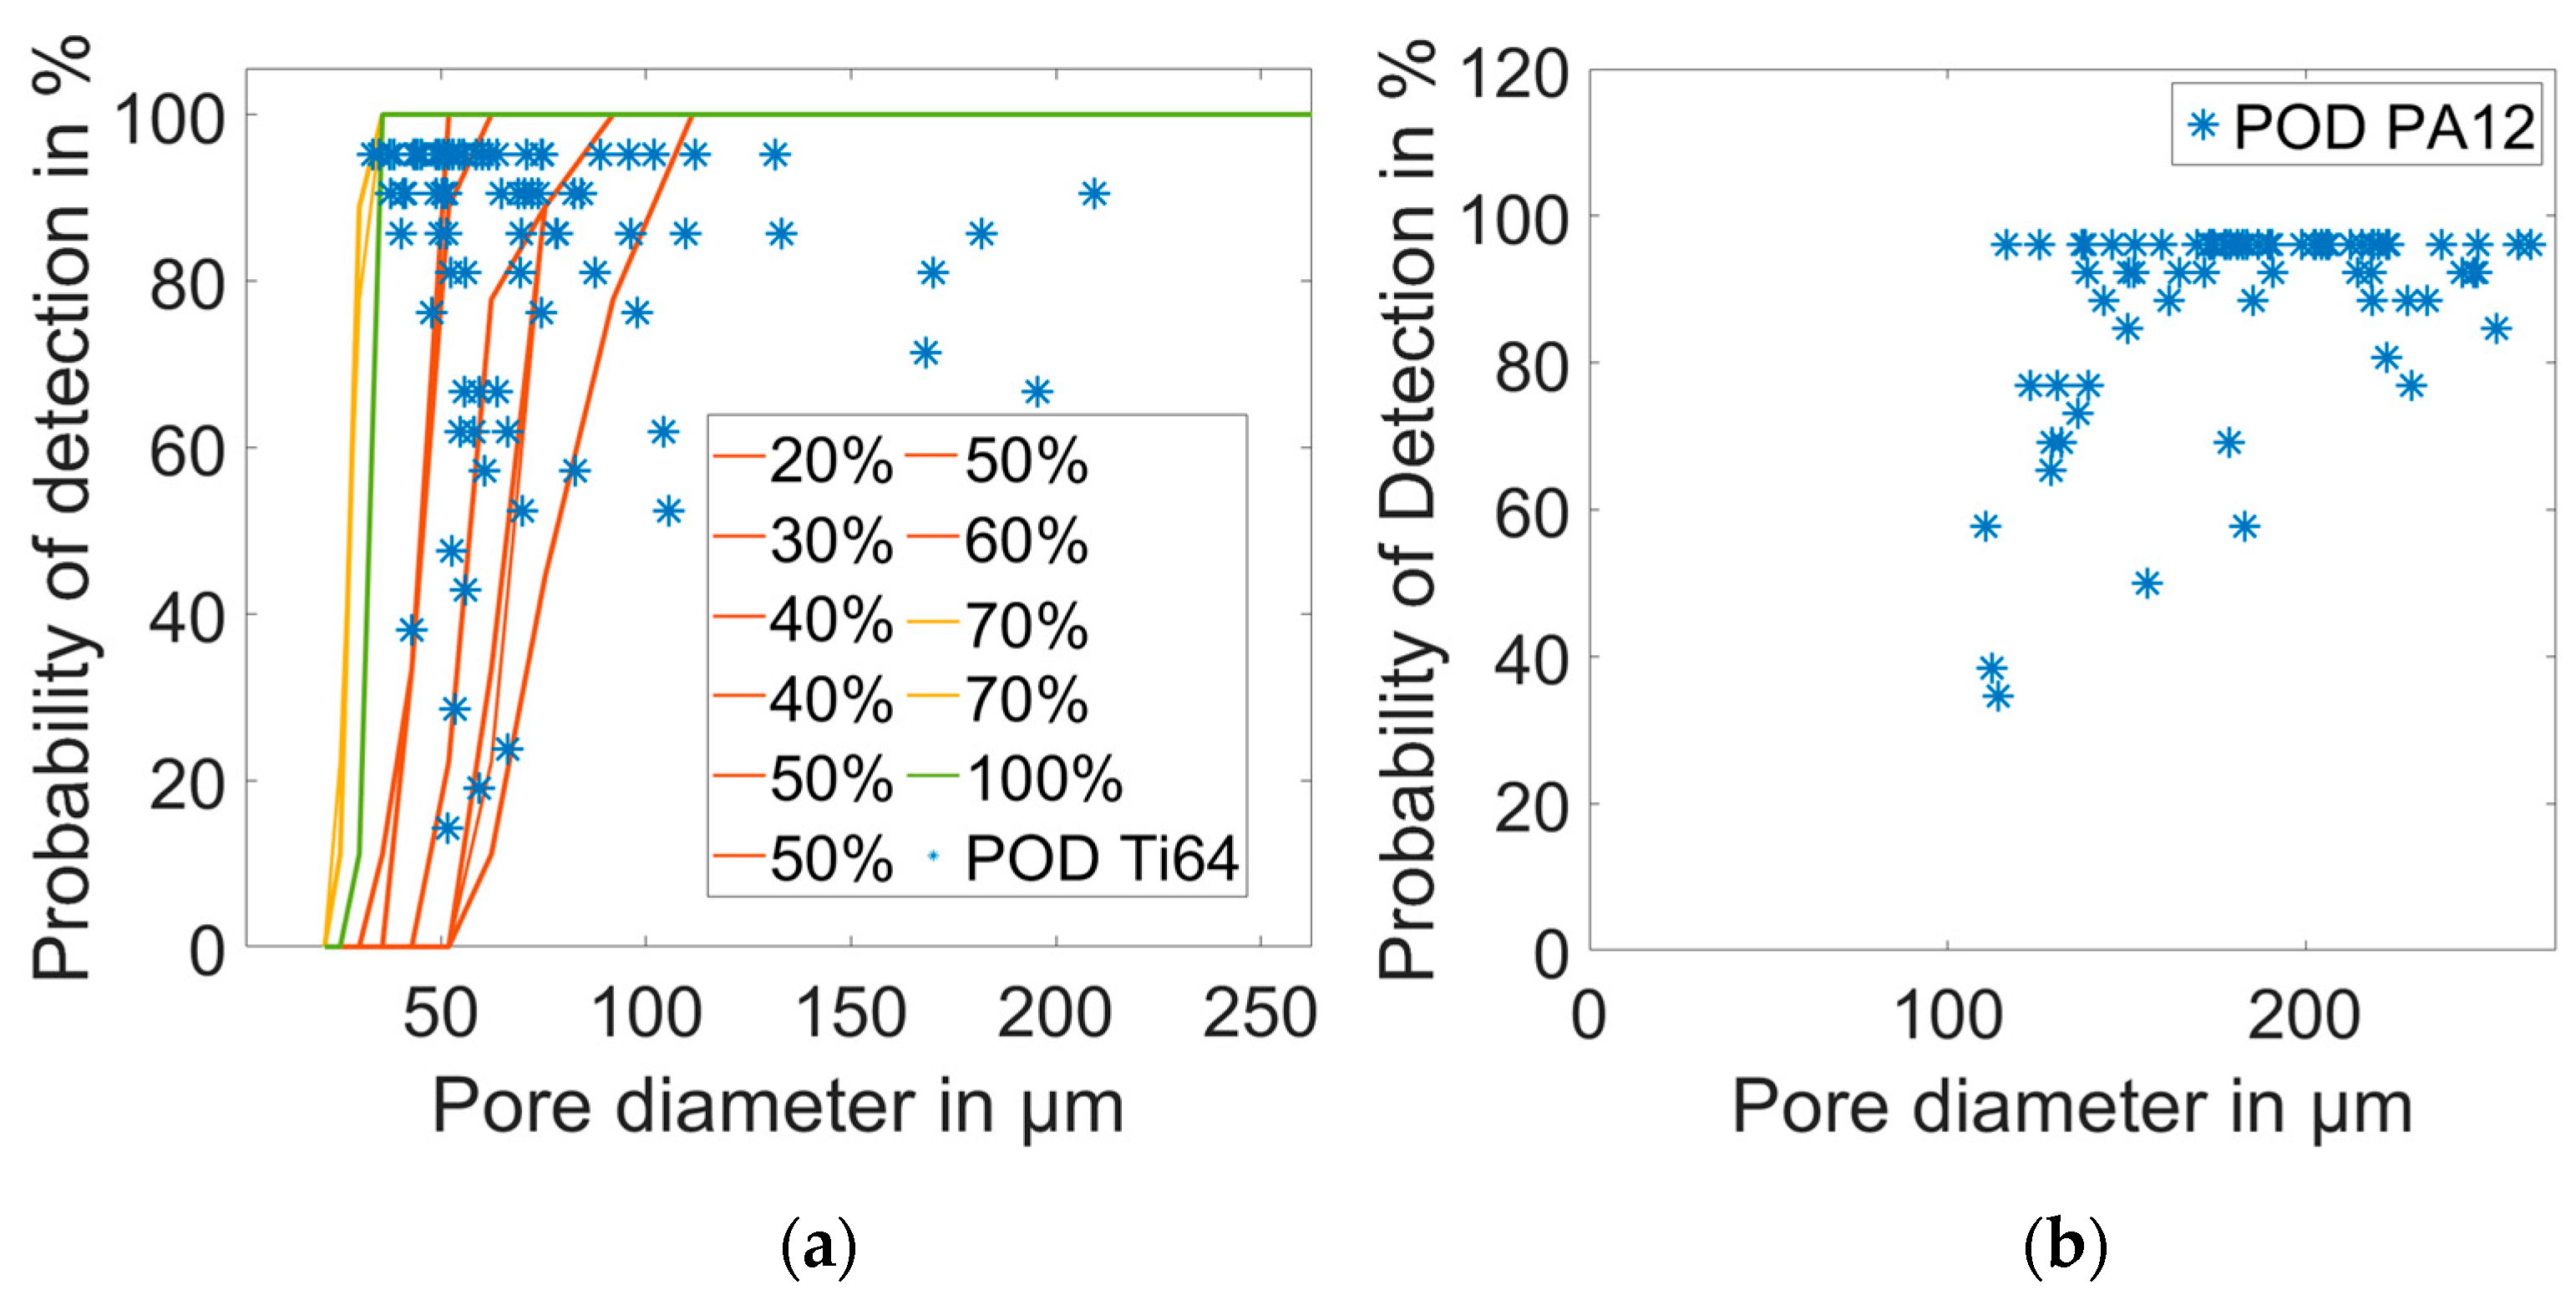
2.5. Calculation of the Probability of Detection
2.6. Synchrotron CT Measurement
3. Results
4. Discussion
5. Conclusions
Author Contributions
Funding
Data Availability Statement
Conflicts of Interest
References
- Brückner, F.; Leyens, C. Hybrid laser manufacturing. In Laser Additive Manufacturing; Elsevier: Amsterdam, The Netherlands, 2017; pp. 79–97. [Google Scholar]
- Gockel, J.; Sheridan, L.; Koerper, B.; Whip, B. The influence of additive manufacturing processing parameters on surface roughness and fatigue life. Int. J. Fatigue 2019, 124, 380–388. [Google Scholar] [CrossRef]
- Dutta, B.; Froes, F.H.S. The additive manufacturing (AM) of titanium alloys. Met. Powder Rep. 2017, 72, 96–106. [Google Scholar] [CrossRef]
- Snell, R.; Tammas-Williams, S.; Chechik, L.; Lyle, A.; Hernández-Nava, E.; Boig, C.; Panoutsos, G.; Todd, I. Methods for Rapid Pore Classification in Metal Additive Manufacturing. JOM 2020, 72, 101–109. [Google Scholar] [CrossRef]
- Liu, X.; Chu, P.K.; Ding, C. Surface modification of titanium, titanium alloys, and related materials for biomedical applications. Mater. Sci. Eng. R Rep. 2004, 47, 49–121. [Google Scholar] [CrossRef]
- Pavan, M.; Craeghs, T.; Verhelst, R.; Ducatteeuw, O.; Kruth, J.-P.; Dewulf, W. CT-based quality control of Laser Sintering of Polymers. Case Stud. Nondestruct. Test. Eval. 2016, 6, 62–68. [Google Scholar] [CrossRef]
- Wingham, J.R.; Turner, R.; Shepherd, J.; Majewski, C. Micro-CT for analysis of laser sintered micro-composites. Rapid Prototyp. J. 2020, 26, 649–657. [Google Scholar] [CrossRef]
- Kittler, J.; Illingworth, J. Illingworth. Minimum Error Thresholding. Pattern Recognit. 1986, 19, 41–47. [Google Scholar] [CrossRef]
- Otsu, N. A Threshold Selection Method from Gray-Level Histograms. IEEE Trans. Syst. Man Cybern. 1979, 9, 62–66. [Google Scholar] [CrossRef]
- Jaques, V.A.J.; Du Plessis, A.; Zemek, M.; Šalplachta, J.; Stubianová, Z.; Zikmund, T.; Kaiser, J. Review of porosity uncertainty estimation methods in computed tomography dataset. Meas. Sci. Technol. 2021, 32, 122001. [Google Scholar] [CrossRef]
- ASTM E1570-11; 1570-11-Standard Practice for Computed Tomographic (CT) Examination. ASTM International, United States: West Conshohocken, PA, USA, 2011.
- Bellens, S.; Vandewalle, P.; Dewulf, W. Deep learning based porosity segmentation in X-ray CT measurements of polymer additive manufacturing parts. Procedia CIRP 2021, 96, 336–341. [Google Scholar] [CrossRef]
- ZEISS. ZEISS CT Cookbook-English Edition: Best Practice Guide for ZEISS METROTOM Settings, Germany. Available online: https://shop.metrology.zeiss.de/INTERSHOP/web/WFS/IMT-DE-Site/de_DE/-/EUR/ViewProduct-Start?SKU=600033-2022-016&CategoryName=240100&CatalogID=200000&ExtendedNavigation=true (accessed on 15 March 2023).
- Davis, L.C.; Kress, J.V.; Feldkamp, L.A. Practical cone-beam algortihm. J. Opt. Soc. Am. 1984, 1, 612–619. [Google Scholar]
- Buades, A.; Coll, B.; Morel, J.-M. A Non-Local Algorithm for Image Denoising. In Proceedings of the 2005 IEEE Computer Society Conference on Computer Vision and Pattern Recognition (CVPR’05), San Diego, CA, USA, 20–26 June 2005; IEEE: Piscataway, NJ, USA, 2005; pp. 60–65, ISBN 0-7695-2372-2. [Google Scholar]
- Bundesverband der Deutschen Gießerei-Industrie, e.V. BDG. BDG-Richtlinie P203: Porositätsanalyse Und -Beurteilung Mittels Industrieller Röntgen-Computertomographie (CT); Bundesverband der Deutschen Gießerei-Industrie e.V. BDG: Düsseldorf, Germany, 2019. [Google Scholar]


| Unit | PBF/M | PBF/P | |
|---|---|---|---|
| Material | Ti64 | PA12 | |
| Machine | Aconity Mini | Research System | |
| Beam power | W | 900 | 16 |
| Beam diameter | µm | 90 | 500 |
| Scanning speed | mm s−1 | 1200 | 2000 |
| Hatch line spacing | µm | 120 | 200 |
| Layer thickness | µm | 50 | 100 |
Disclaimer/Publisher’s Note: The statements, opinions and data contained in all publications are solely those of the individual author(s) and contributor(s) and not of MDPI and/or the editor(s). MDPI and/or the editor(s) disclaim responsibility for any injury to people or property resulting from any ideas, methods, instructions or products referred to in the content. |
© 2023 by the authors. Licensee MDPI, Basel, Switzerland. This article is an open access article distributed under the terms and conditions of the Creative Commons Attribution (CC BY) license (https://creativecommons.org/licenses/by/4.0/).
Share and Cite
Baumgärtner, B.; Hussein, J.; Hausotte, T. Investigation of the Shape and Detectability of Pores with X-ray Computed Tomography. J. Manuf. Mater. Process. 2023, 7, 103. https://doi.org/10.3390/jmmp7030103
Baumgärtner B, Hussein J, Hausotte T. Investigation of the Shape and Detectability of Pores with X-ray Computed Tomography. Journal of Manufacturing and Materials Processing. 2023; 7(3):103. https://doi.org/10.3390/jmmp7030103
Chicago/Turabian StyleBaumgärtner, Benjamin, Juan Hussein, and Tino Hausotte. 2023. "Investigation of the Shape and Detectability of Pores with X-ray Computed Tomography" Journal of Manufacturing and Materials Processing 7, no. 3: 103. https://doi.org/10.3390/jmmp7030103