Article

Possibilities of Artificial Intelligence-Enabled Feedback Control System in Robotized Gas Metal Arc Welding

Department of Mechanical Engineering, LUT University, Yliopistonkatu 34, 53850 Lappeenranta, Finland
*
Author to whom correspondence should be addressed.
J. Manuf. Mater. Process. 2023, 7(3), 102; https://doi.org/10.3390/jmmp7030102
Submission received: 29 March 2023 / Revised: 12 May 2023 / Accepted: 15 May 2023 / Published: 23 May 2023
(This article belongs to the Special Issue Advances in Welding Technology)

Abstract

:
In recent years, welding feedback control systems and weld quality estimation systems have been developed with the use of artificial intelligence to increase the quality consistency of robotic welding solutions. This paper introduces the utilization of an intelligent welding system (IWS) for feedback controlling the welding process. In this study, the GMAW process is controlled by a backpropagation neural network (NN). The feedback control of the welding process is controlled by the input parameters; root face and root gap, measured by a laser triangulation sensor. The NN is trained to adapt NN output parameters; wire feed and arc voltage override of the weld power source, in order to achieve consistent weld quality. The NN is trained offline with the specific parameter window in varying weld conditions, and the testing of the system is performed on separate specimens to evaluate the performance of the system. The butt-weld case is explained starting from the experimental setup to the training process of the IWS, optimization and operating principle. Furthermore, the method to create IWS for the welding process is explained. The results show that the developed IWS can adapt to the welding conditions of the seam and feedback control the welding process to achieve consistent weld quality outcomes. The method of using NN as a welding process parameter optimization tool was successful. The results of this paper indicate that an increased number of sensors could be applied to measure and control the welding process with the developed IWS.

1. Introduction

The manufacturing industry is in a changing phase from traditional to digital intelligent manufacturing. IIoT (Industrial Internet of Things) solutions and developments in sensor technologies provide a basis for further data utilization [1]. In welding technology, quality evaluation, adaptivity and feedback control have been the focus area. Traditionally, adaptivity has been applied by creating manual adjustment maps and simple algorithms. In recent years, artificial intelligence for evaluating and controlling the welding process has been in the scope of interest. Artificial intelligence (AI) has been typically applied to evaluate the weld quality, possible inconclusions, and weld bead dimensions [2,3], and has achieved penetration [4,5,6] during welding. Different AI-based algorithms can be applied to process sensor data automatically, to enable the possibility of real-time analysis and process control during welding [6,7,8,9,10,11,12,13].
AI-based systems create the basis for the development of a real-time feedback control system for the welding process. From a practical point of view, the advancements in computing power, algorithm data management, sensor connectivity (IoT) and sensor technology provide a sufficient base structure for developing a real-time feedback control system [14]. Thus, the knowledge and ability to utilize AI-based algorithms in practical applications have increased [7,15]. Practical applications enable enhancements for feature recognition, categorization and quality predictions for weld quality outcome and process control purposes [7,9].
In terms of process feedback control, there are manually defined parameter adjustments or adjustment windows based on manually defined algorithms and AI-based systems. Manually defined parameter adjustment can be defined as a fully manually created parameter control library based on experiments or theory. Algorithm-based systems can be utilized as an example by using linear [12], curve-fitting [16] and model-free [17] adaptive controls. These control methods are effective ways to control the welding process. However, in traditional welding production, multiple parameters affect the weld quality. The research problem of this study is that the parameter control with multiple input parameters is inaccurate and complicated to create with manually defined adaptive control, thus resulting in inconsistent weld quality output.
This study approaches the problem by developing an AI-based process control system that enables the possibility to increase the number of feedback control parameters. The number of parameters used in the parameter control drastically increases the complexity of the algorithm and the manually defined adjustment maps. However, AI-based systems are not sensitive to the complexity of data, increasing only the computing power/time required for training the algorithm. The AI-based feedback control system can provide a wide range of parameters that are taken into account in process control. Furthermore, the training of the system requires less human interaction for obtaining multi-dimensional parameter adjustment relationships.
This paper introduces a method to create an IWS (intelligent welding system) feedback control system, capable of ensuring the defined penetration and quality aspects of the weld in robotic butt weld application without root support in varying root gap and face conditions. First, the IWS system components, appliances and sensors and the digital connections between the appliances are introduced. Next, the data acquisition principle and the creation of the knowledge bank for the NN (neural network) are introduced. The neural network training principle with this knowledge bank is then introduced and followed by the optimization of the neural network layout configuration for IWS purposes. The introduced method is visualized and verified with practical experiments for knowledge bank creation (the gathering of training data for NN), NN training optimization and the practical examination of the control test with varying welding conditions (root gap and root face). Finally, the reliability of the developed system is evaluated.
Intelligent manufacturing technologies that consist of feedback require process parameters, preconditions and quality output measurement. The measurement is the key to obtaining the information and before–after relationships and consequences in which the process control can rely on its operational functions. The relations between the conditions, process control and quality output can be seen as a basis for reliable and functioning feedback control. Any variation in the data measured can lead to a false adjustment of the process parameters. Thus, the operating principle and properties of IWS are explained in this paper to highlight the challenges of developing the system.

2. Materials and Methods

The methods sections of this study are divided into the experimental setup, IWS operating principle and training sequence of the NN. Furthermore, the validation of the NN performance and reliability of IWS is introduced. The IWS is explained and practically verified in a butt weld case study [18] and with statistical analysis.
The utilization of the IWS is not limited to the case study’s experimental setup presented in this paper. However, the appearance of the welding equipment does affect the weld quality noticeably. Thus, the trained IWS only operates as desired by using a similar welding device.

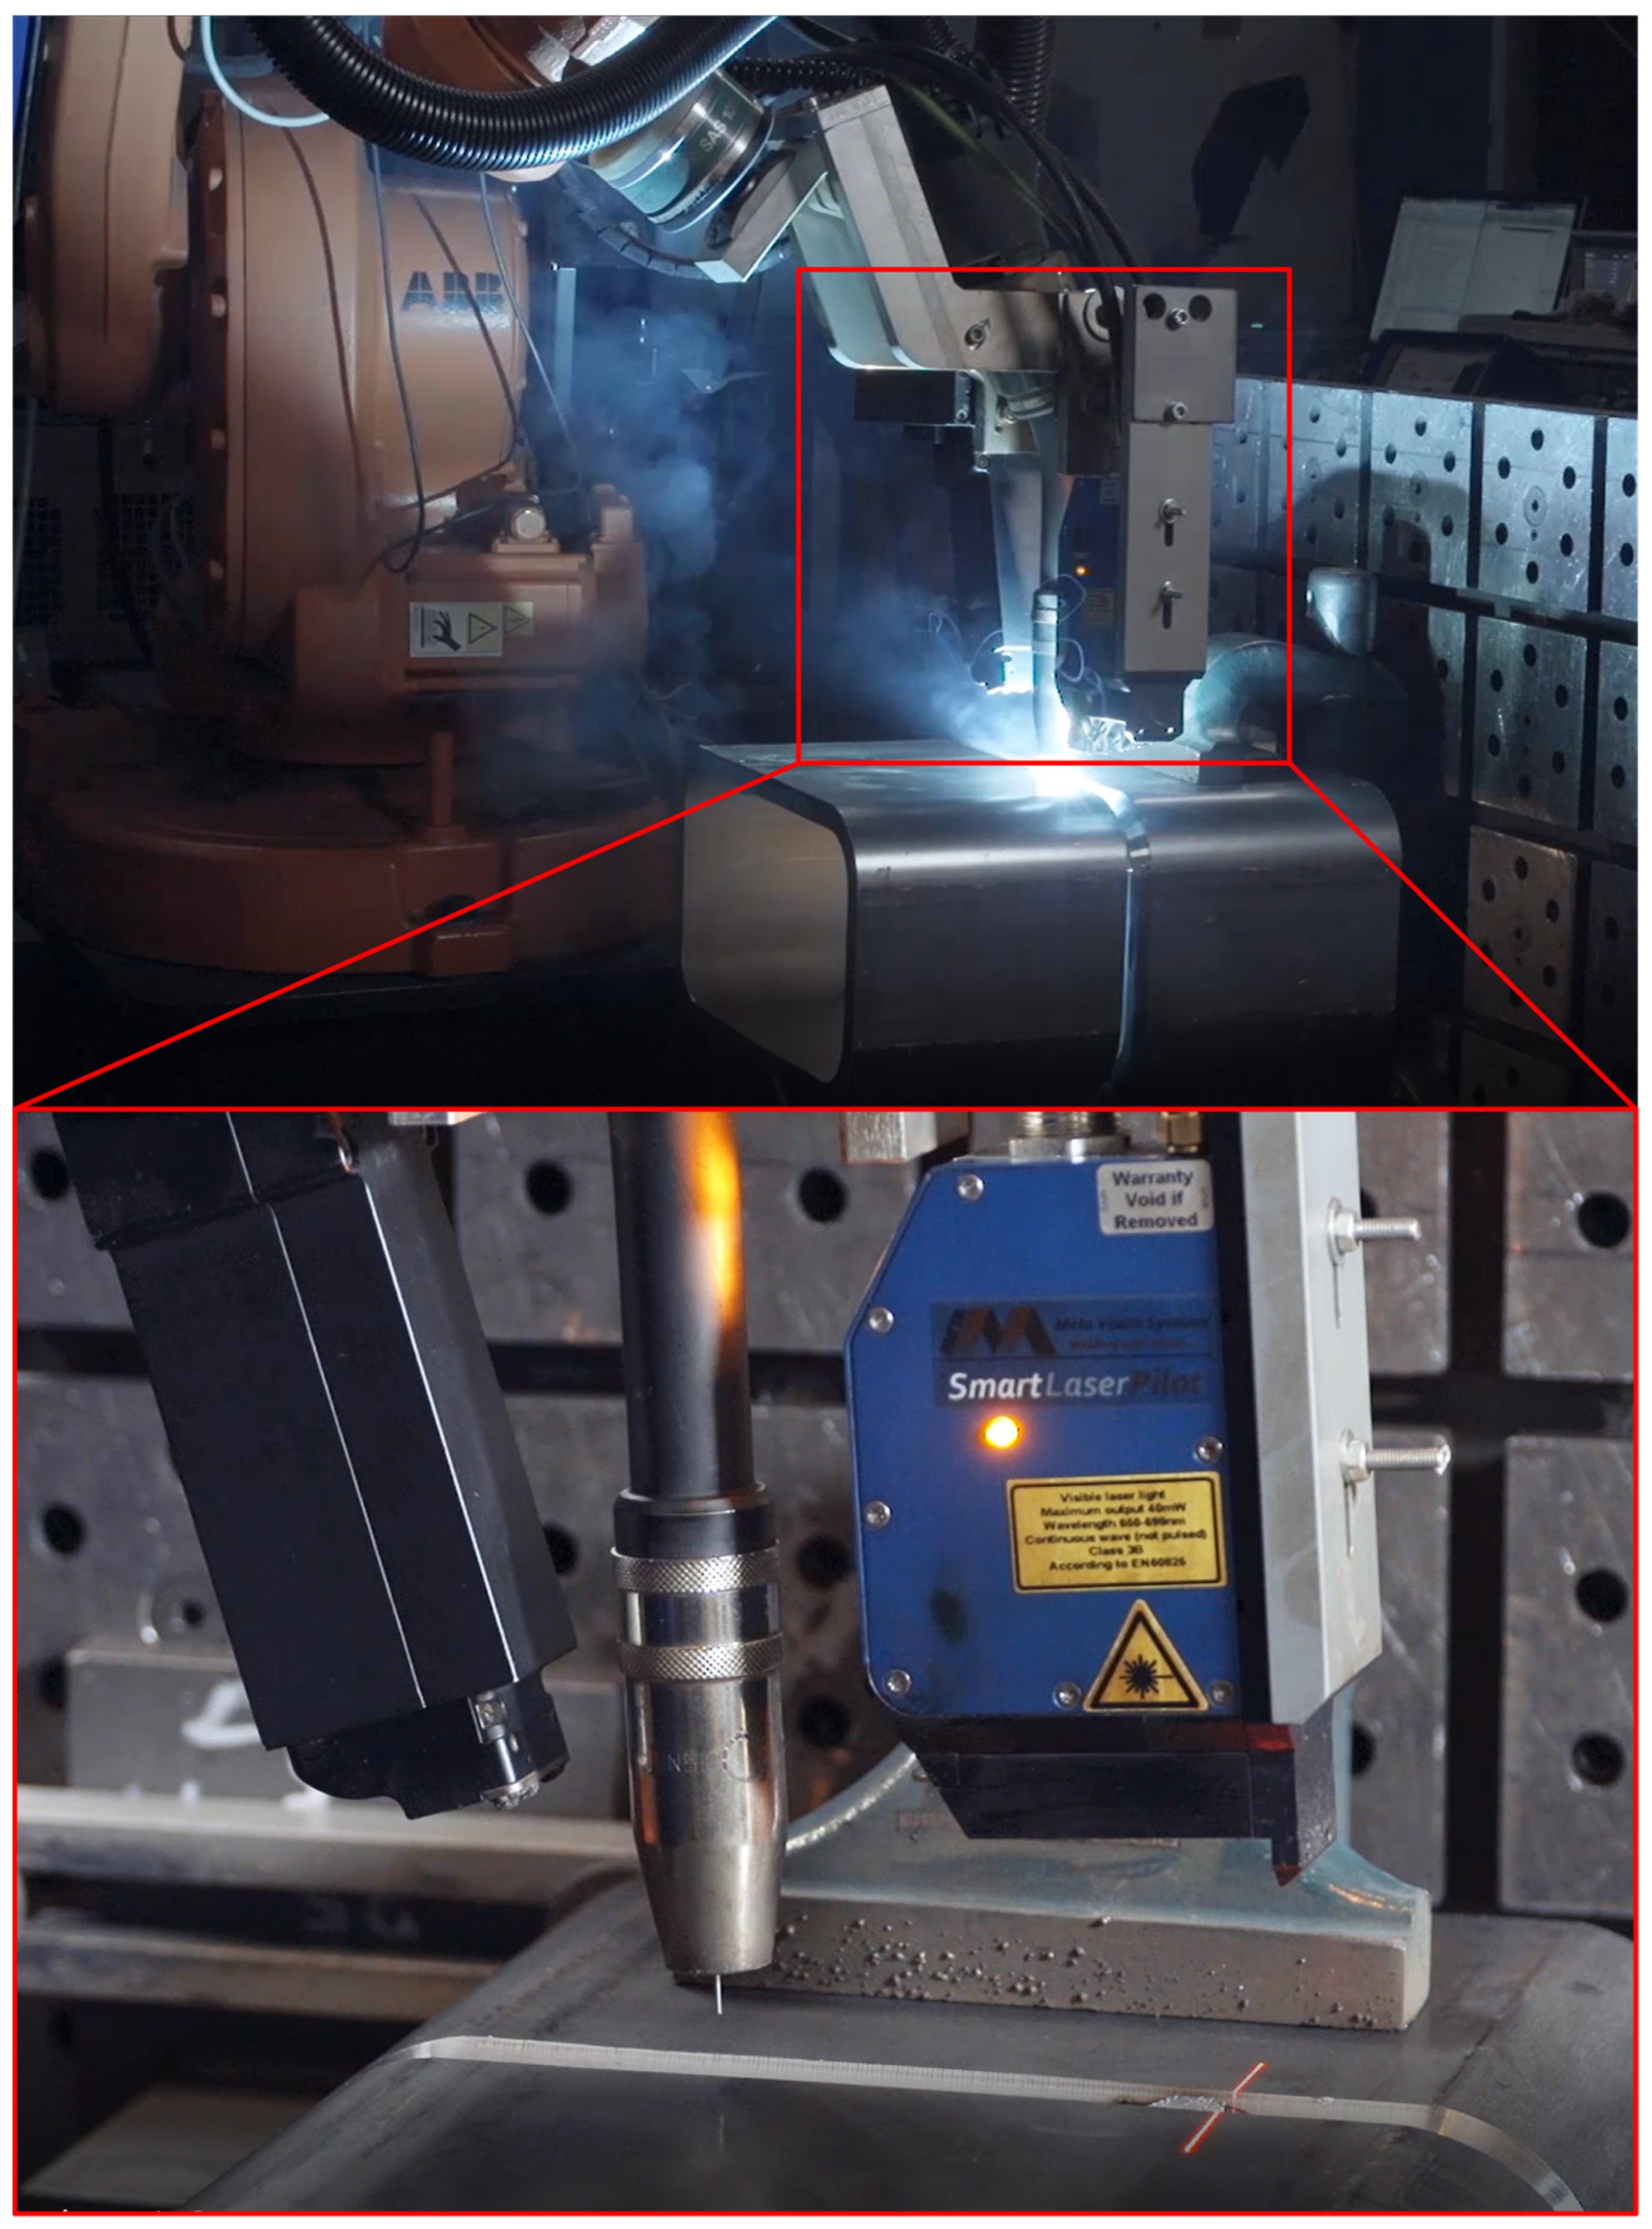
2.1. Experimental Setup

The experimental setup of the study consists of an ABB IRB1600-10 welding robot with ABB IRC5 robot controller, Fronius TPS 5000 power source with GMAW equipment and Meta Vision SLS50-v1 laser triangulation sensor, located in LUT University, Lappeenranta, Finland. The distance from the welding torch to the laser triangulation sensor was adjusted to 100 mm, as significant arc and spatter disturbances were noted in the sensor data with closer distances. The IRC5 robot controller was remote controlled (ethernet) from a PC via ABB RobotStudio, enabling 100 Hz update frequency of any welding process parameters used during welding. Similarly, the welding power source and the laser triangulation sensor were connected to the same PC via an ethernet connection. The experimental setup details and the information on the NN training can be found in Table 1 below.
More detailed chemical composition and mechanical properties of the materials used can be found in Table 2.
The physical experimental setup can be found in Figure 1. The torch configuration in Figure 1 also includes the HKS thermal profile sensor (black sensor behind the welding torch), which is capable of sensing the infrared radiation over the weld pool, thus enabling the measurement of the thermal distribution over the weld pool and analysis of the weld pool behavior. However, this sensor was not used for feedback control purposes, but separately to evaluate the thermal properties of the weld joint.
The physical connections enable the possibility to do close to real-time calculations, optimization and updating of the welding parameters during welding. The important data of the welding process were gathered on the PC, where it is processed and combined in the MATLAB R2017a software. The raw data from the Meta sensor (50 Hz) were first gathered and analyzed with the defined algorithm to recognize the important features of the seam; root gap and root face, as described in more detail in a previous research article [19]. An example of the groove profile can be found in Figure 2. The example groove profile can be seen in Figure 1. The figure colors change from deep blue, the most distant, to yellow, the closest point detected. The root gap can be measured by the width of the deep blue gap and the root height can be calculated by measuring the depth difference between the plate’s surface and the edge of the beveled groove near the root gap. In Figure 2, the tack weld can be seen between roughly 120 mm and 150 mm. The marking on the beveled surfaces originates from the manual grinding operation of the tack weld to achieve smooth connection and prevent any inclusion and quality imperfections in the connecting points of tack welds.
At the same time, the welding parameters, both set and actual, are gathered from the welding power source (100 Hz). These data were then combined with the Tool Center Point (TCP, coordinates of the tool) data from the robot controller (100 Hz). The RobotStudio software enables a 100 Hz update of any parameters to the robot controller (both welding process parameters and movement of the robot) during welding with specified commands, and can be run in MATLAB. Thus, any data can be fed and updated to the robot controller and welding power source with a 100 Hz limit. The experimental setup can be found in Figure 3. The training data for the case study used in this paper are introduced in our previous research article [18].

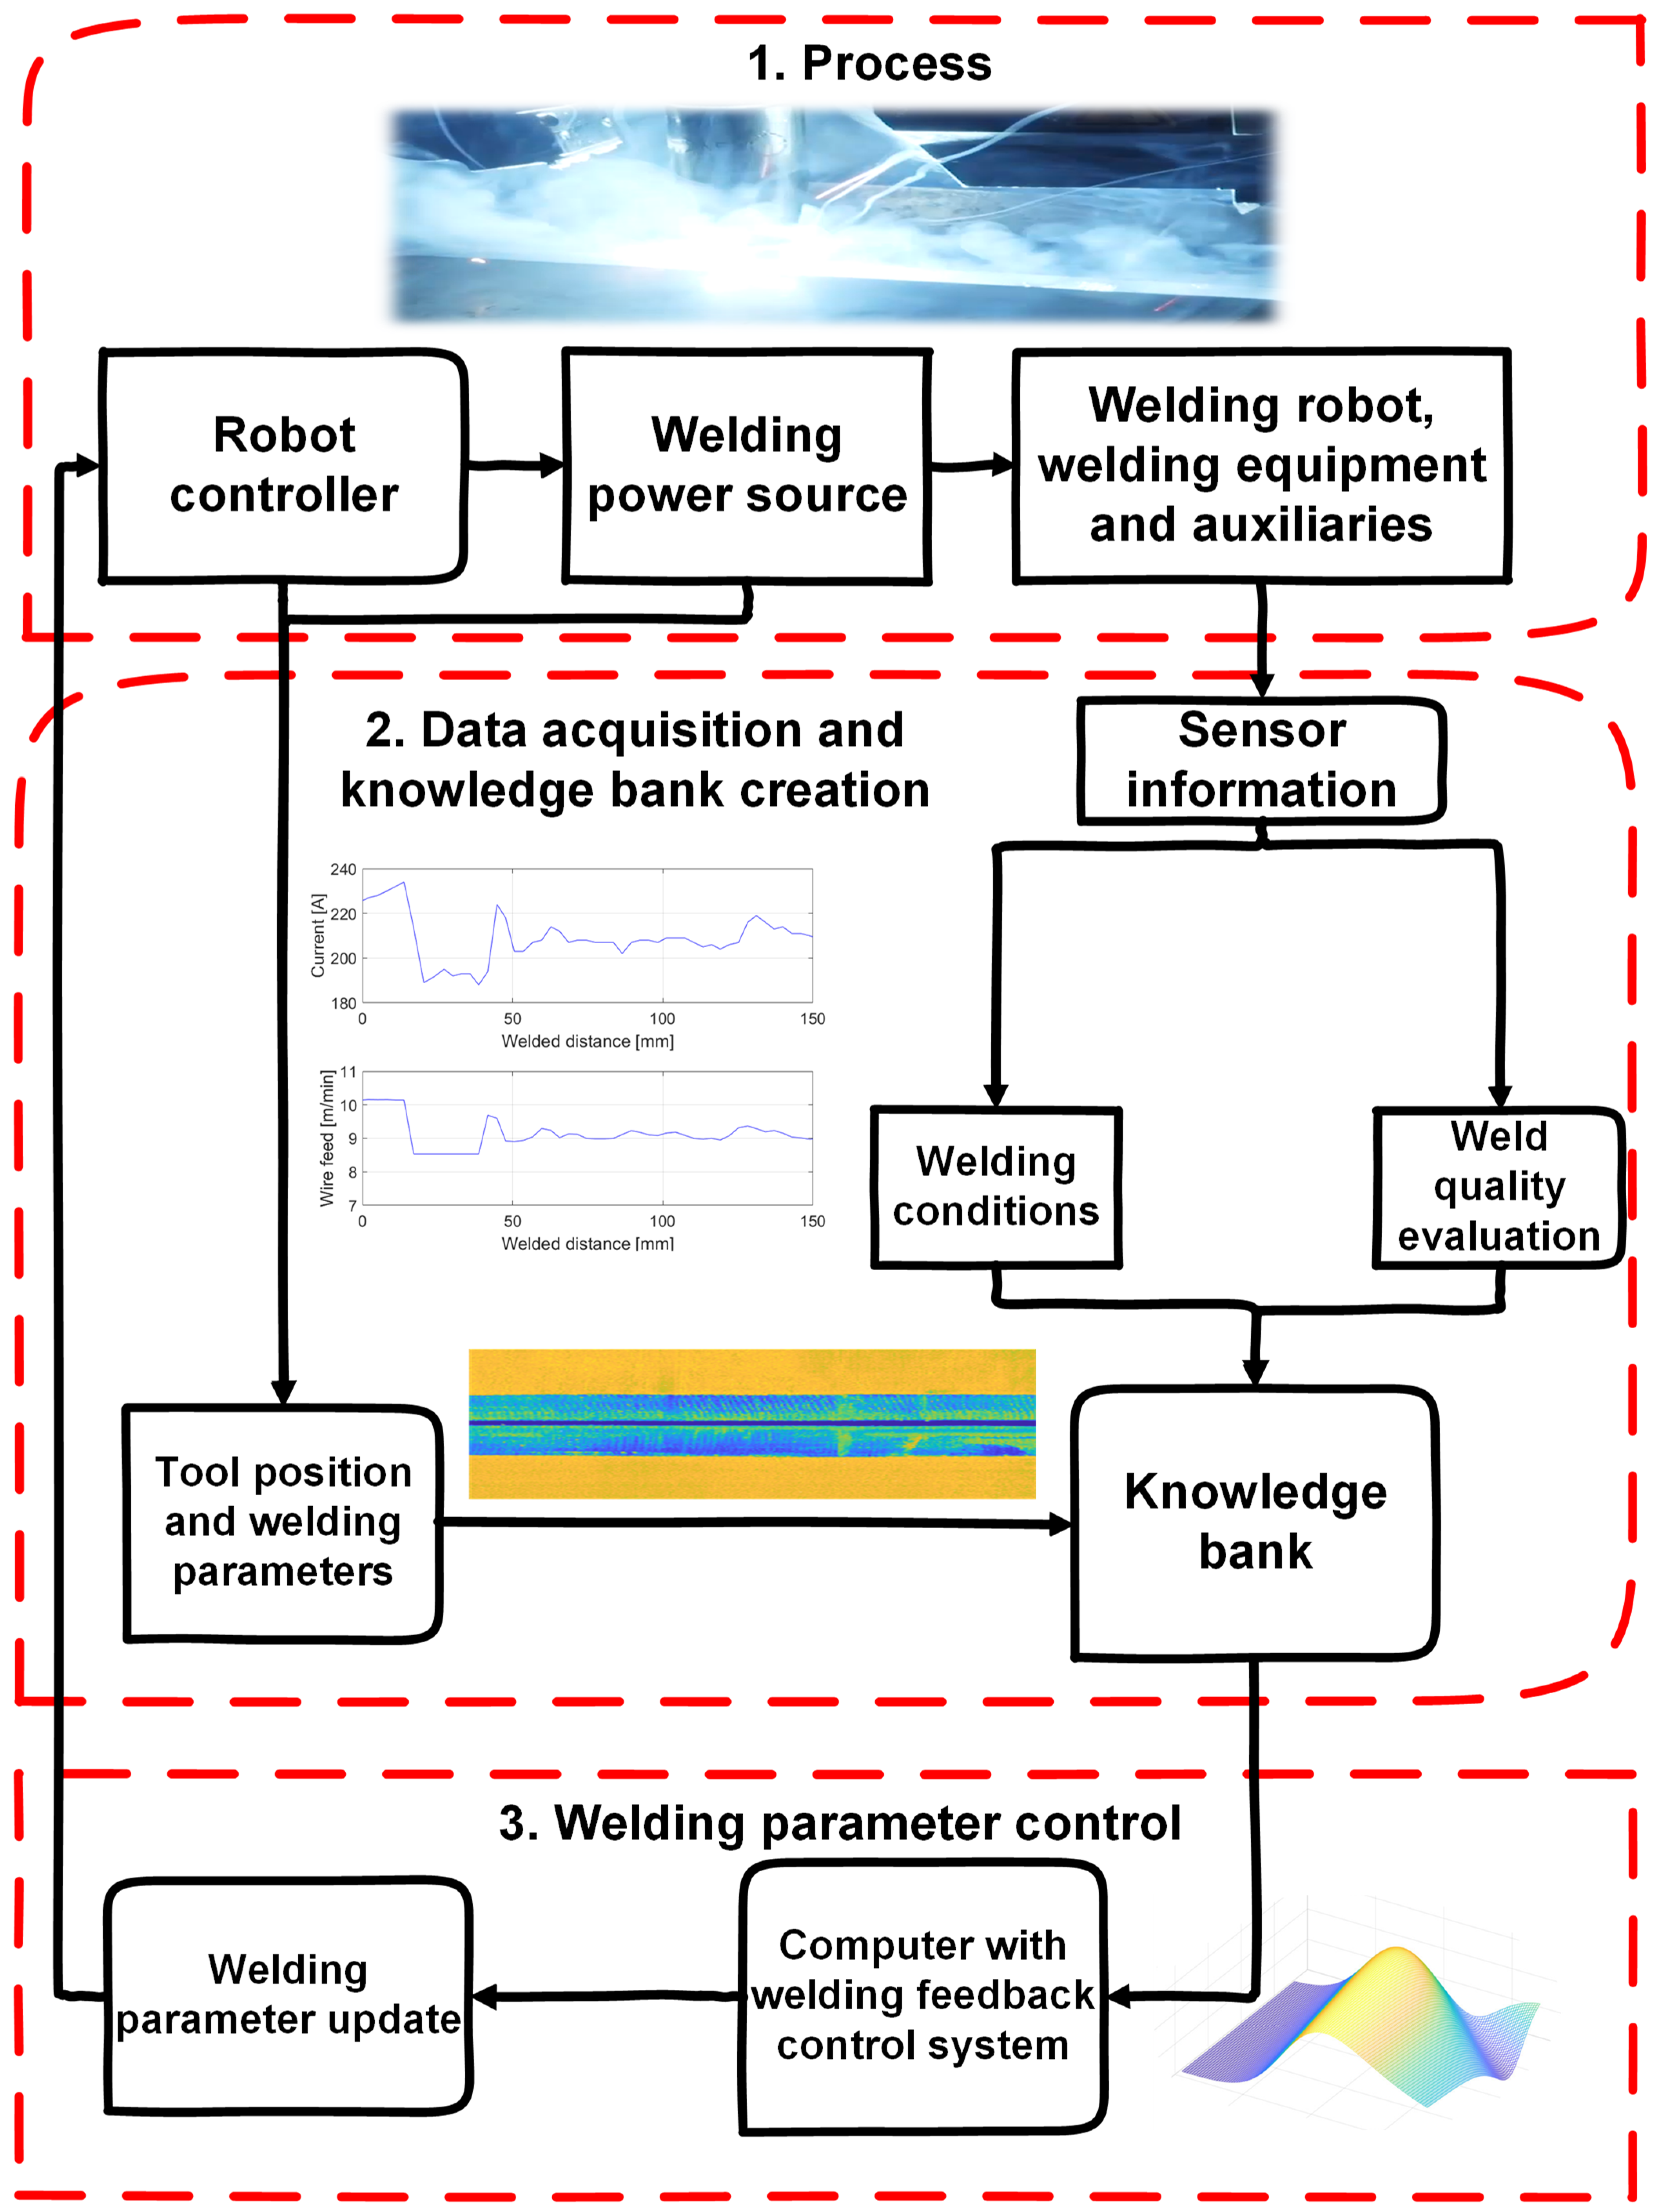
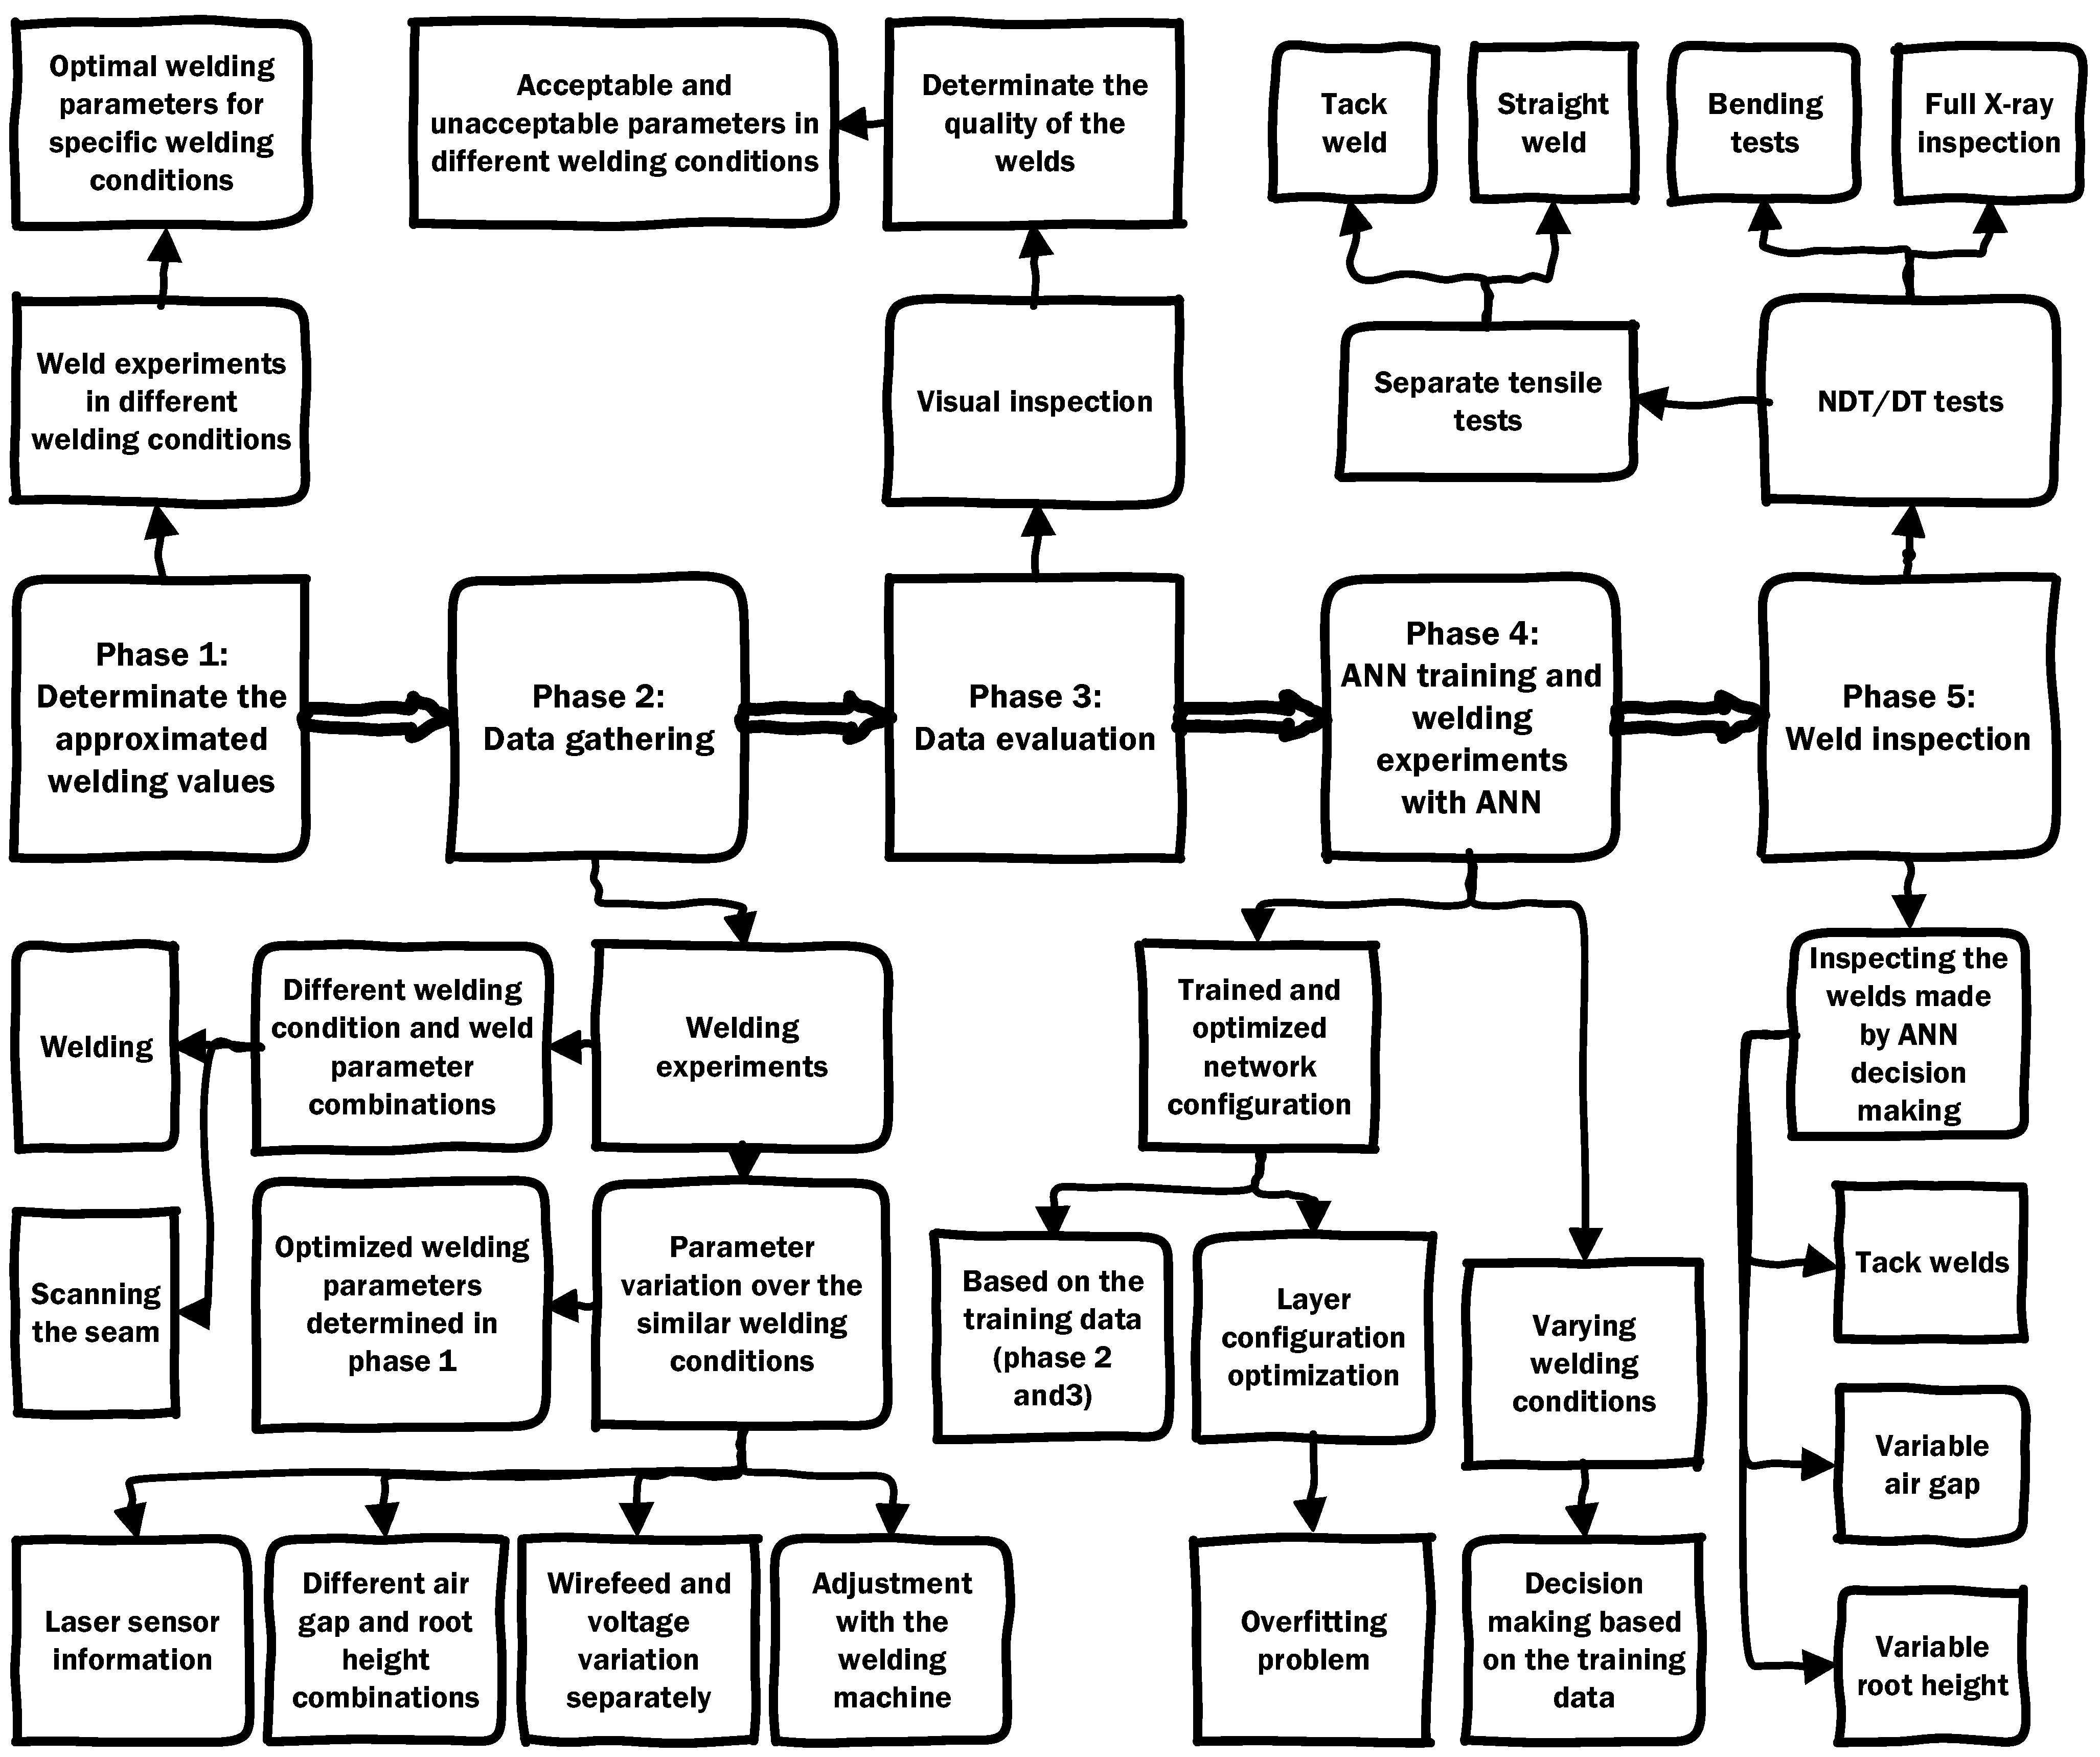
2.2. Data Flow and Knowledge Bank Creation

Now that the physical and digital connections are defined, the focus is turned to the data flow, knowledge bank creation and clarification of how the IWS operates. First of all, the IWS system requires data on the actual welding so that it can be trained to adapt to the conditions. This means that the system requires conditions before welding, welding parameters during welding and the outcome of the weld (Quality). As the laser triangulation sensor is capable of measuring the seam conditions and the weld quality after welding, it can be used to gather the data before and after the welding and combine the data in specific points via the TCP of the sensor. Similarly, the TCP of the welding torch is combined with the specific welding parameters at that specific point. The data of the welding process parameters are measured during the welding and combined with the welding torch TCP. The before-, during- and after-welding data are saved in the coordinate-based system. All the data are combined in the packs of closest TCPs as before–during–after welding data, as shown in Figure 4. This creates a knowledge bank and training dataset for the NN.
The experimental setup of this paper is divided into the five different phases that can be seen in Figure 5, where the schematics and the steps of the experiments are visualized.
The schematics in Figure 5 give the main overview of the phases of the experimental setup procedures. Phase 1 consists of the experimental testing of welding parameters in different welding conditions, which can be used as predetermined welding process parameters in phase 2, thus reducing the number of test samples while planning the actual experiments. In phase 2, the 27 different cases of welding experiments are conducted with varying welding conditions and by varying the wire feed and the arc voltage override above and below the initial values of the experiment.
Phase 3 consists of a visual inspection of the welds, to assure whether full penetration was achieved in the experiments as well as the visual quality of the top side weld bead. This was done with the automated weld visual quality inspection tool Winteria, by using laser triangulation measurement. Furthermore, in this phase, the accepted weld data are saved in the knowledge base for the NN training procedure.
In phase 4, the NN configuration is optimized for the case study and the results of the NN decision-making are simulated over the desired parameter window of the use case. In phase 5, the IWS is tested with separate test specimens, where the welding conditions, root gap and root face are varied. The specimens are tested in more detail with NDT and DT testing to verify the achieved quality of the test specimen. The more detailed procedures of the main steps are discussed in the following paragraphs and sections.
The rough estimates of the suitable welding parameters need to be defined to reduce the number of welding experiments. The appropriate parameter window determination process is easier with having the predetermined parameter window for the use case. The knowledge bank requires further validation and the data need to be gathered correctly to be suitable for the NN.
First, the data need to be gathered from across the parameter adjustment window. In this context, the parameter window means that all kinds of different conditions where the IWS wanted to operate are gathered. As an example, in the case study, the root gap and root face variations that can occur during welding are tested during the data-gathering process.
In this experimental case, the Taguchi method was used to define the parameter window in the defined experiments. The Taguchi method was found to be sufficient in accuracy while maintaining a low number of experiments in total. The experiments were conducted so that the welding process parameters varied with different welding conditions. First, the root gap and root face were fixed in specified values in the experimental plates. The plate was first scanned in order to obtain the root gap and root face values in different coordinates. Furthermore, the welding was conducted over the plate. The welding parameters were varied in such a way that individual parameters were adjusted to obtain unwanted quality in the extremes.
Next, the scanning of the quality was conducted to obtain the quality data of the specimen. In practice, this meant a minimum of 27 pieces of experimental plate for the case study, as two different process parameters (wire feed/current and voltage) and two welding conditions (root face and root gap) were adjusted. The more detailed experimental setup and Taguchi method parameters of the welding experiments can be found in Table 3. The experiments were conducted in all variations of the root gap and face combinations. As the experimental workpieces have variations and cannot be carried out absolutely according to the stated values, the seam dimensions have roughly ±0.5 mm variations compared to the desired values. This, however, can be beneficial while using the NN as an optimization tool.
As the welding process parameters are varied in each experiment, the parameters which enable sufficient weld quality can be gathered with a wider range over the desired parameter window. By utilizing this strategy, the data can also be gathered during the welding control process, thus improving the accuracy of the NN decision-making by retraining the network with more extensive data during the operation of the system.
When the data from the experiments are collected, they need to be combined and validated. NN requires that the validation of the experiments is done in such a way that only the welds that achieved sufficient quality within the limits of the standard (ISO 5817) [20] are used for the training. Furthermore, the data need to be well spread across the parameter window to obtain a reliable result from the NN training.
The data were further validated as follows: 25 mm from both ends of the experiments were excluded from the evaluation to prevent inconsistencies due to the welding start and end slopes. A similar procedure was carried out also in the positions of tack welds. As the knowledge bank only consisted of the welds where the quality is sufficient, the quality aspect of the data can be neglected. Hence, this results in a knowledge bank of welding preconditions (root gap and root face) and the welding parameters used (that enabled sufficient welding quality) which can be directly utilized for the NN training sequence. The validated data consisted of a total of 1477 pairs of input–output data. The validated data in Figure 6 show each parameter in the input–output pairs used for the NN training.
The validated data have sufficient data from the different combinations of the welding parameters. However, the root face data had some variation in some parts of the experiment. The variations occurred due to the manual grinding operations on the preparation phase of the experiments. The NN training sequence is explained in detail later (in Section 3.1) After the NN training, the NN is capable of adapting to the weld conditions by optimizing the welding parameters based on the training data.

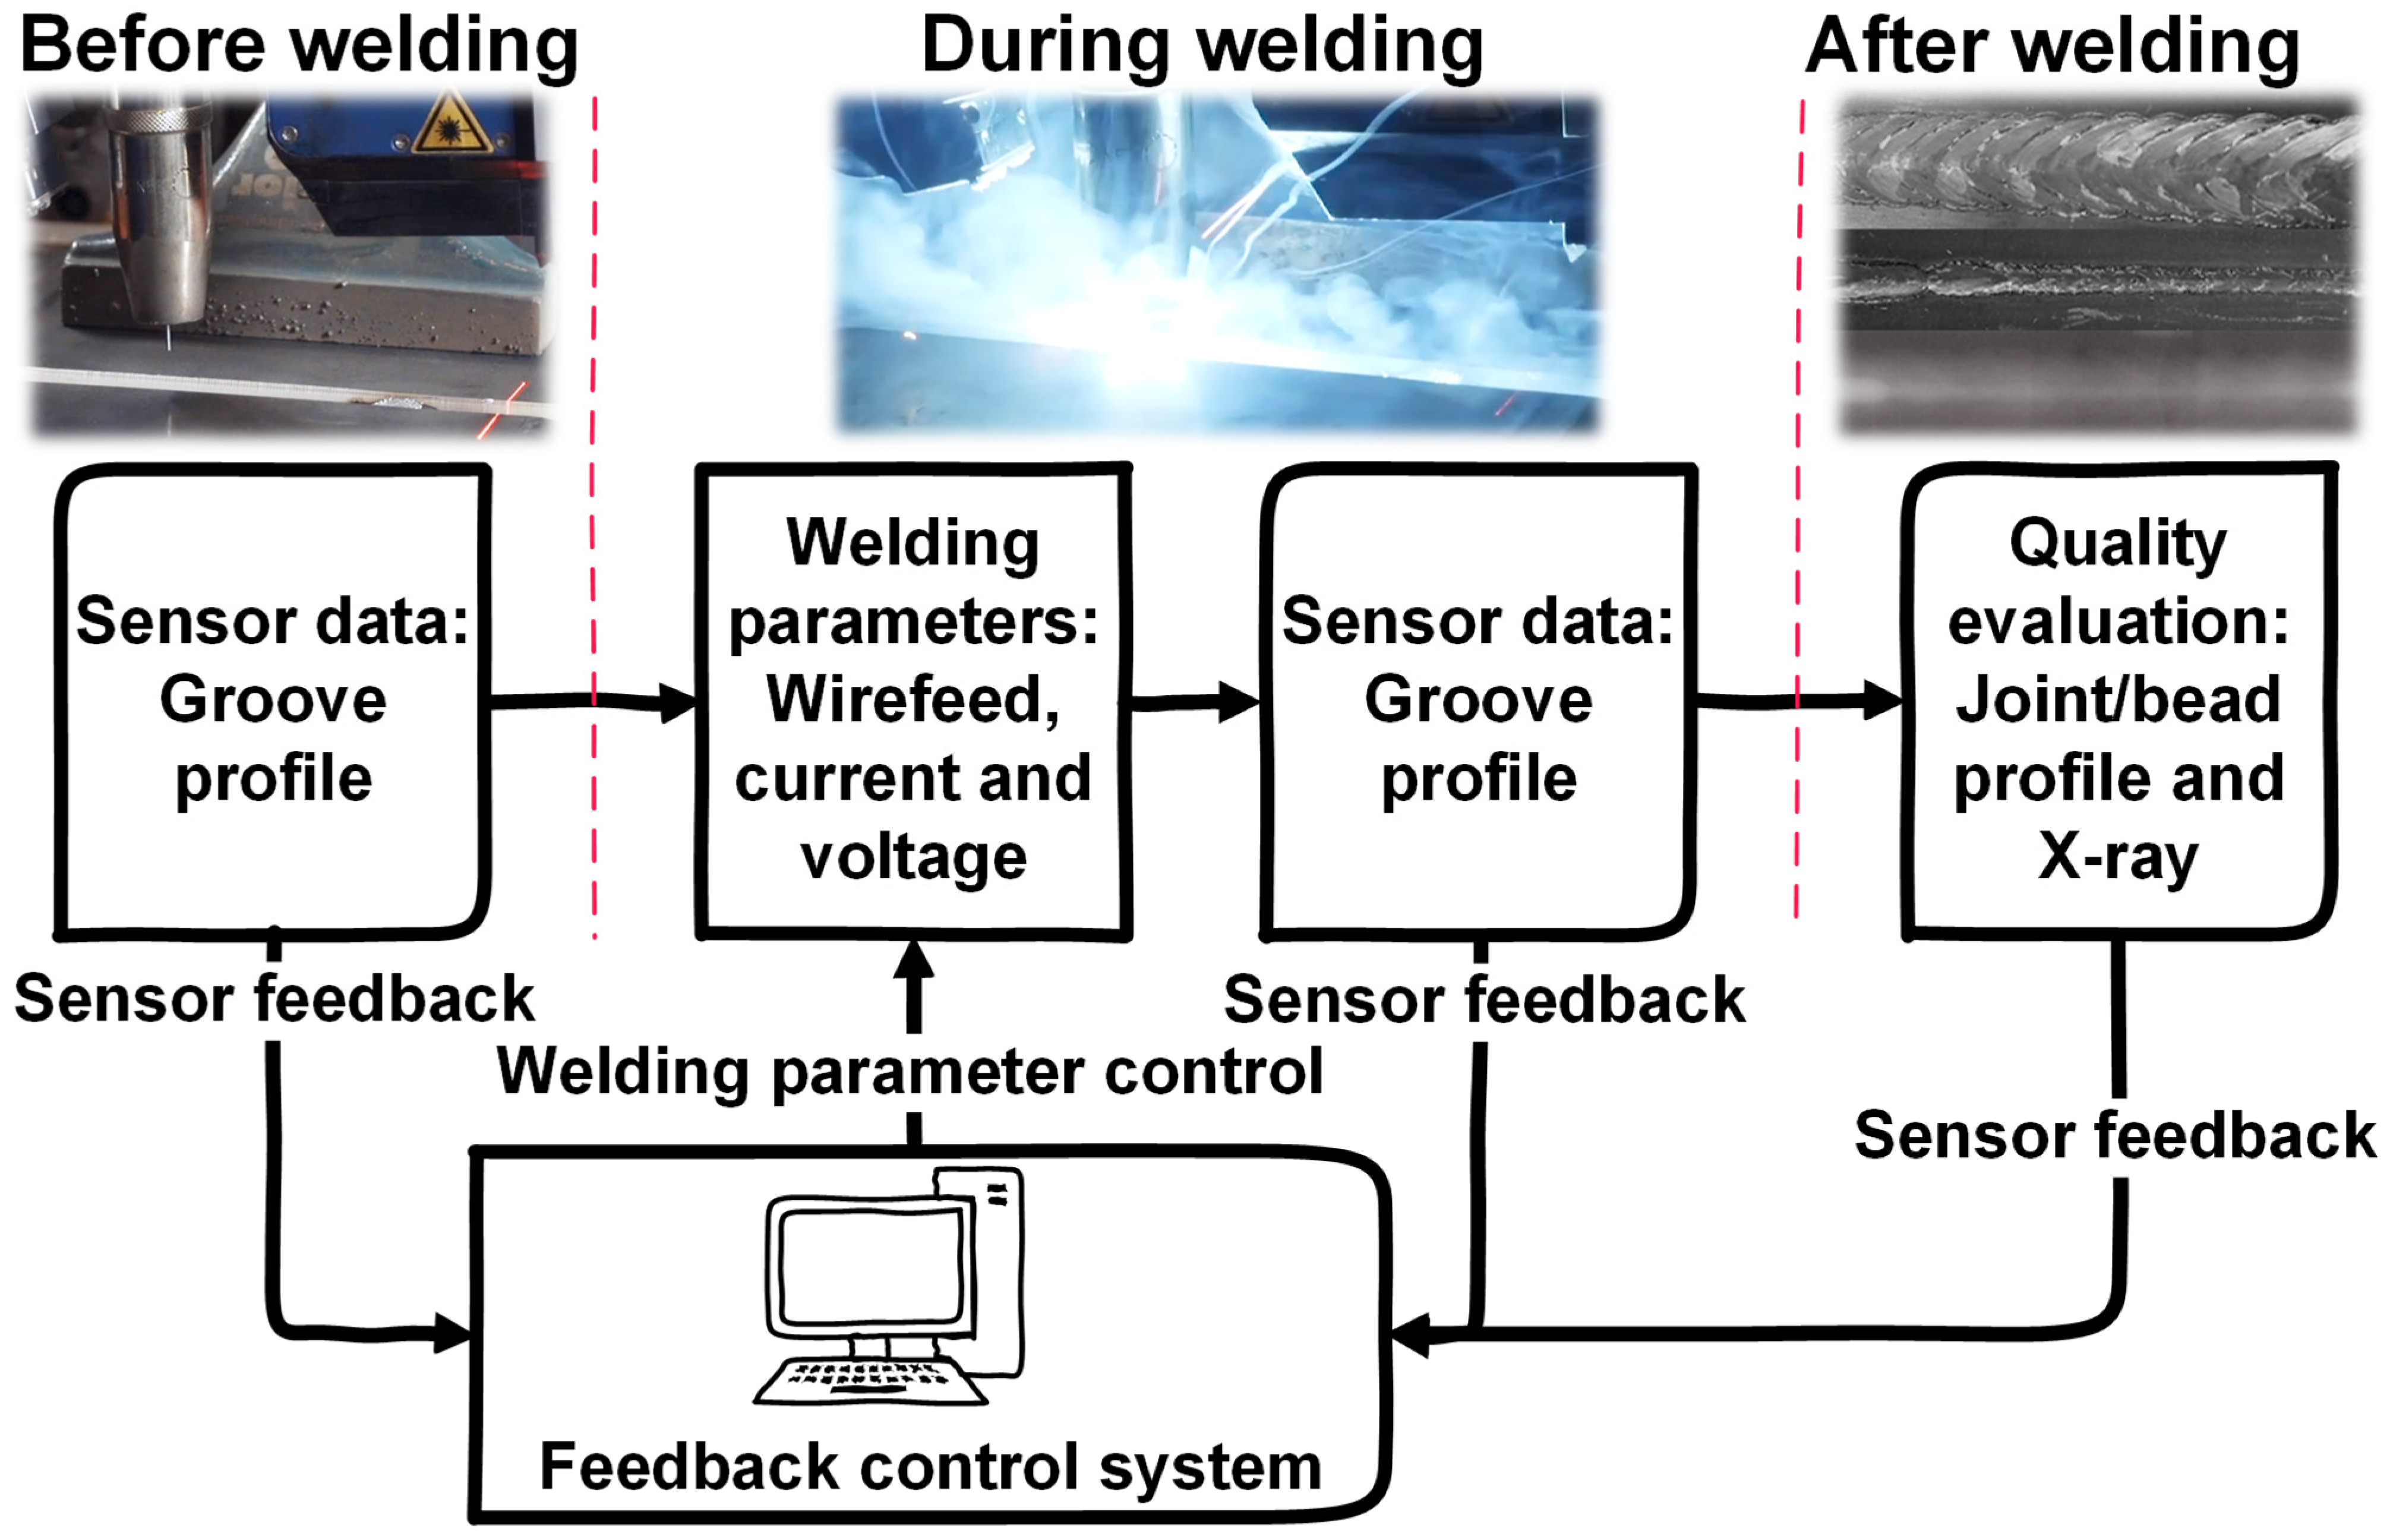
2.3. IWS Operating Principle

In terms of the IWS, the system’s operation is similar to the training sequence, apart from the NN welding parameter feedback control loop. The sensors gather the conditions during welding and the welding parameters are adjusted based on the conditions. In terms of laser triangulation sensors, or other sensors that are not measured at the same point where the welding torch is, the measurements are combined with the TCP of the sensor. When the TCP of the welding torch approaches the measured point of the specimen, the MATLAB script compares and finds the closest measured coordinates measured by the sensor to the welding torch TCP. The values of the welding conditions of the closest coordinates are fed into the feedback control system as an input parameter and the result is directly saved and the parameters are set in the welding power source (via robot controller). The gathering frequency of the welding conditions and the TCP of 50 Hz was used. However, to prevent singular measurement errors from affecting the welding process, the 2 Hz feedback control frequency was used. With a 2 Hz feedback control frequency, a median of 25 welding measurements could be used for single parameter adjustment. The input data for the NN consisted of root gap and root face, and were combined with the used welding parameter; wire feed and arc voltage override value, which are used as output parameters for the NN. This kind of link between the input (root gap and root face) and output (wire feed and arc voltage override value) parameters of the NN enables the possibility to develop a real-time, self-learning NN system in the future if combined with the quality measurement data.

2.4. Training Sequence and Validation of the NN Performance

The IWS training can be separated into the NN layout configuration and the training process itself. First, it is required to choose the appropriate number of hidden layers and neurons and further the performance evaluation of the NN. The welding process has often quite a significant parameter window, which does not require exact welding parameters. The variation of the welding parameters in order to achieve consistent weld output tends to be around ±10%, depending on the application. Thus, the absolute accuracy of the process parameter adjustment is not crucial in order to obtain sufficient weld quality. Therefore, the neural networks are well suited to solve the welding process optimization problems.
In this study, a Levenberg–Marquardt Algorithm (LMA) is used as an optimization algorithm in backpropagation, as LMA tends to perform well in optimization problems as proven in multiple studies [15,21,22,23,24,25,26,27]. The training process is similar regardless of what algorithm is used. The number of hidden layers and neurons is chosen by evaluating the effect of layer configurations (Hidden layers and neurons) on the Mean Squared Error (MSE) of the network, which is used for the performance evaluation of the network. The MSE was chosen because it has been widely used to evaluate the performance of the NNs and has been found to be an effective tool in previous studies [7,10,16,17,18,23,24].
The NN was trained with 1–4 hidden layers with neurons ranging from 1 to 30 for each layer. The training set was divided into 70% for training, 15% for validation and 15% for testing. For statistical consistency, each optimization was run 30 times. Furthermore, the best-fitting hidden layer configuration was chosen, and the optimization of neurons was conducted by measuring the performance with 1–60 neurons. Finally, the performance was analyzed further by comparing training, validation and testing dataset performances (MSE) to find the optimal configuration.

2.5. Reliability of IWS

The reliability of the IWS system was evaluated by comparing the NN decision accuracy based on the validated training data with ISO 5817 quality level B. Standard deviation from both the training and NN decision was used. With this data, the reliability of how well the NN mimicked the training data were evaluated. Reliability is measured by comparing the standard deviation of the training dataset to the individual decisions of the NN and further to the standard deviation of the NN decisions. As the validated training dataset consisted only of the ISO 5817 level B welds, the limits of level B were defined to be the standard deviation limits of the validated dataset.

3. Results and Analysis

This section addresses the results of the NN training sequence and the validation of the performance and reliability of the IWS. The results are also analyzed.

3.1. Training Sequence of NN

The specific parameters for training the network were chosen based on previous experience. Often, the optimal welding process parameters for each case are found mainly by trial and error. The most significant variation can be found in the complexity of the NN, which is created in terms of the NN training sequence—the optimization process takes a considerable amount of time. The desired dataset of the case study consisted of a total of 3600 trained NNs. The training process itself took over 12 h, even with a high-end computer and using all cores of the processor and the graphics card for the calculation (MATLAB parallel pool, eight cores and a graphics card). However, the calculation time is not a crucial aspect in terms of offline training, as the training system does not need to operate during the welding process. Thus, the optimization process should be carried out carefully to maximize the performance of the system. The median results of the MSE with 1–4 hidden layers with neurons ranging from 1 to 30 can be found in Figure 7.
As can be seen in Figure 7, the performance in terms of MSE (the lower the number the better) is not varying significantly with more than two layers. The complexity of the layer configuration should be kept minimal to prevent the issue of the overfitting appearance of NNs. Due to the stabilized performance, the three- and four-layer networks tend to have higher complexity in this case study. Thus, the two-hidden-layer network was chosen for further performance evaluation. Although it has been mentioned that the best performance can be found where the MSE is the lowest, the overall performance needs to be addressed by evaluating which part of the MSE is creating the overall reduction in MSE. The MSE performance of the NN can be found in Figure 8. The MSE is calculated from training, validation and testing performances and the result of the separate performances can be found in Figure 9.
The MSE of the two-layer network is steadily decreasing up until roughly 40 neurons, and stabilizes after that, as can be seen in Figure 7. However, the MSE decreases in the training performance dataset, as can be seen in Figure 8. The training data tends to decrease with the higher number of neurons as it measures the performance from the same dataset that was used to train the network. The more important aspect is to evaluate the validation and testing datasets. These datasets stabilize roughly in the 20 neurons range. The difference in training performance and the testing datasets increases after the similar 20-neuron range, indicating the increasing overfitting tendency of the NN. Thus, the most suitable network configuration for this case is the 2-20-20-2 network. After the optimization of NN training, the validation of the practical performance of the IWS can be evaluated with the trained NN. The NN decision-making software can be simulated by mapping the values of the welding conditions over time and plotting the decision of the NN in the graph. Both parameters are drawn in the different graphs to visualize the decisions of the NN separately for both wire feed and arc voltage correction separately. Figure 10 shows the wire feed and Figure 11 shows the arc voltage correction values in the trained parameter window.
Both NN decision-making simulated control maps have variations in the edges of the parameter window. This visualizes the extrapolation tendency of the NN, as the extreme values do not have enough, or any, related data. However, as an example, the extreme value of the root gap (2.5 mm) operates as expected within a 0.5–2.5 mm parameter window. It would be beneficial to narrow the parameter window to consist only of reliable data if the system would be used in the production environment to increase the reliability of the system.

3.2. Validation of the Performance and Reliability of the IWS

The performance and reliability of the IWS can be evaluated by comparing the standard deviation of the validated training dataset to the IWS decision-making compared to the training data. The percentual difference in the NN parameters (red is arc power and blue is arc voltage) compared to nominal parameter values from the training dataset are presented in Figure 12. Furthermore, the standard deviation limits of the validated training dataset, also defined to be the limits of quality level B, are presented as dashed and dotted lines in Figure 12.
The standard deviation of the training dataset for arc power was 9.5% and for arc, the voltage was 5.2%. These limits are the limits of ISO 5817 quality level B, as the training dataset only consisted of quality level B. It can be seen that the NN decisions have significant “spikes”, or singular decision errors, in the data. The individual spikes can be created due to small inconsistencies in the welding process, e.g., wire feeder slipping, wire twisting within the wire feeder tube, instability of the welding arc, magnetic arc blow, contact tip errors, or similar small instabilities. The arc power consisted of 2.7% false decisions while the arc voltage consisted of 2.4% incorrect values. When comparing the standard deviation of the NN decisions, only 0.4% points of error can be stated for arc power, and 0.8% points for arc voltage. The overall performance in terms of the standard deviation of the decisions of the trained NN resulted in a reliability of 99.5% for arc power and 99.4% for arc voltage. Similarly, with practical examination and evaluation already carried out in a previous article, the weld consistently reached ISO 5817 level B [18].

4. Discussion

This study shows that the IWS enables the possibility to simplify adaptive welding and enable multiple welding conditions and welding process parameters to control the welding process. Although “simplifying” is relative in terms of NN, as it requires knowledge of NN, it reduces the amount of manual interaction and reduces human error in the process. Furthermore, when using multiple inputs and outputs for the NN decision, the problem becomes so complex that it is not possible or feasible to solve it manually. The results of the study show a possible method to utilize the NN to feedback control the welding process. Although the dataset was limited as it consisted of 1477 data pairs (~10 m of weld), the accuracy of the NN was sufficient and the reliability of the parameter control remained at a suitable level in both practical welding experiments as well as statistical evaluation. The singular spikes that are shown in Figure 6 show the effect of possible inaccuracies in validating the training datasets. Therefore, it is suggested to use the median of multiple measurements and NN decisions to prevent singular errors from affecting the welding quality.
The results of the study show that the developed IWS enables the possibility to utilize NN for welding process feedback control. In the restricted number of experiments, the system operated as intended; however, further study needs to be conducted on a larger scale. Nevertheless, the method for controlling the process was proven to be reliable in practical terms. The reliability of the system is complicated to evaluate in practical applications, as the accuracy of the training data affects the evaluation. It was noted that the training data had significant variation, which led to quality level B in terms of ISO 5817 [20]. However, by combining the practical examination with statistical evaluation, the results of the study could be concluded.
A similar multi-variable parameter control would be challenging to achieve, although not impossible, with manual parameter adjustment methods. The main benefit of using the algorithm is to reduce the time and effort to create such parameter control. Furthermore, this study was conducted to prove the method of utilizing NN in the welding process feedback control and to prove the functionality of the IWS in successful process control. The main benefit of the IWS lies in the increased number of sensors used for process control. Now that the state-of-the-art principle of the IWS has been proven successful, the IWS can be used in more demanding applications with extended use of sensors. Furthermore, the understanding of the causality between the NN input and output parameters could be better visualized and clarified by using numerical modelling techniques [28,29,30]. A deeper analysis and understanding of the welding process itself could also help to decide the most beneficial sensors for each use case.
There are, however, inconsistencies and inaccuracies in the IWS. The utilized laser triangulation sensor itself has a significant 100 mm distance from the welding torch. This distance will affect the real-time aspect of the data, creating variation between the actual conditions and the gathered conditions with the sensor. In some cases, the data can behave similarly, but approaching the point of discontinuity, such as a tack weld or a corner, the variations could have a significant effect. It would be beneficial to have the welding conditions as real-time as possible, but in this paper, challenges with interference were noted if the sensor was closer to the welding torch. Improvements to the sensor’s protection and the filter lenses could be added to reduce the effect of arc disturbance. Furthermore, the air or shielding gas flow could be utilized to blow off the small flying spatters in the air toward the sensor. This, however, requires further investigation.
Further remarks have been made related to the data transfer delays between the sensors and devices, as well as decision-making software decisions, until the realized adjustment in the actual welding parameters. This, however, requires significant testing to measure, and the delays are test-setup-dependent, thus distracting from the main research topic of this paper. Therefore, the process delay evaluation was ruled out from this paper and will be part of a future study. In principle, all the inaccuracies, refresh rate and data transfer variations will affect the weld quality and reduce the performance of the IWS. Depending on the delay type, some of the effects will be reduced by the testing setup itself, as the NN training and testing setups will both have the same delays.
As a future study, the self-learning IWS could be developed by utilizing these research outcomes. The basis for the operating principle of such systems has already been discussed and researched already some time ago [31,32,33,34], and the novel developments and possibilities should be revised. The main feature of such a self-learning system is the measurement of weld quality. As all of the measurements are taken automatically, the sensor needs to be chosen correctly to evaluate the desired quality to a reasonable extent. Furthermore, the training can be done in batches after each weld or by training the system consistently after each pair of data is gathered. Both are valid methods and worth researching in the future.

5. Conclusions

This paper introduced the method by which to develop IWS, a welding adaptive feedback control system for welding process parameters. The system utilizes NNs to create parameter adjustments based on the welding conditions. This IWS was trained by using training data created by using the Taguchi method-type experimental setup for welding experiments. The data flow within the system and the training principle of the NN were introduced in order to operate the feedback control system. Furthermore, the optimization of the NN layer configuration was explained and demonstrated with the training data. Finally, the IWS performance and reliability were addressed.
The study shows that the method for developing an intelligent welding system, IWS, can be utilized to control welding feedback with multiple welding conditions and welding process parameters. The reliability shows that the system is capable of reaching the set quality limits with 99.4% reliability from the statistical point of view. However, in practical experimentation in our previous research article [18], no variation or unaccepted weld quality was observed. This proves the method of creating IWS to be valid, and the NN optimization resulted in the desired outcome.
This paper proves that the IWS method of using NN as an optimization tool for controlling the welding process and achieving consistent weld quality is successful. The prospect of using more sensors to evaluate the welding process and control it can now be enabled. The benefits of the IWS rely on the extensive benefits of using NN to increase the complexity of the process control. This can be utilized by increasing the number of sensors and process control measurements. This will enable more benefits from cause-and-effect type welding process controls in the future. This, however, was not evaluated in the current paper and needs to be investigated in future research.

Author Contributions

Conceptualization, S.P. and T.S.; methodology, S.P. and T.S.; software, S.P.; validation, S.P.; formal analysis, S.P., H.L. and T.S.; investigation, S.P.; resources, S.P.; data curation, S.P.; writing—original draft preparation, S.P., H.L. and T.S.; writing—review and editing, S.P. and H.L.; visualization, S.P. and H.L.; supervision, T.S. All authors have read and agreed to the published version of the manuscript.

Funding

This research received no external funding.

Data Availability Statement

The data presented in this study are available in [18].

Conflicts of Interest

The authors declare no conflict of interest.

References

  1. Mourtzis, D.; Vlachou, E.; Milas, N. Industrial Big Data as a Result of IoT Adoption in Manufacturing. Procedia CIRP 2016, 55, 290–295. [Google Scholar] [CrossRef]
  2. Kim, I.S.; Son, J.S.; Park, C.E.; Lee, C.W.; Prasad, Y.K. A study on prediction of bead height in robotic arc welding using a neural network. J. Mater. Process. Technol. 2002, 130, 229–234. [Google Scholar] [CrossRef]
  3. Nagesh, D.S.; Datta, G.L. Genetic algorithm for optimization of welding variables for height to width ratio and application of ANN for prediction of bead geometry for TIG welding process. Appl. Soft Comput. J. 2010, 10, 897–907. [Google Scholar] [CrossRef]
  4. Chokkalingham, S.; Chandrasekhar, N.; Vasudevan, M. Predicting the depth of penetration and weld bead width from the infra red thermal image of the weld pool using artificial neural network modeling. J. Intell. Manuf. 2012, 23, 1995–2001. [Google Scholar] [CrossRef]
  5. Chandrasekhar, N.; Vasudevan, M.; Bhaduri, A.K.; Jayakumar, T. Intelligent modeling for estimating weld bead width and depth of penetration from infra-red thermal images of the weld pool. J. Intell. Manuf. 2013, 26, 59–71. [Google Scholar] [CrossRef]
  6. Ren, W.; Wen, G.; Liu, S.; Yang, Z.; Xu, B.; Zhang, Z. Seam Penetration Recognition for GTAW Using Convolutional Neural Network Based on Time-Frequency Image of Arc Sound. In Proceedings of the IEEE International Conference on Emerging Technologies and Factory Automation, ETFA, Turin, Italy, 4–7 September 2018; IEEE: Piscataway, NJ, USA, 2018; pp. 853–860. [Google Scholar]
  7. Bestard, G.A.; Sampaio, R.C.; Vargas, J.A.R.; Alfaro, S.C.A. Sensor fusion to estimate the depth and width of the weld bead in real time in GMAW processes. Sensors 2018, 18, 962. [Google Scholar] [CrossRef]
  8. Ren, W.; Wen, G.; Xu, B.; Zhang, Z. A Novel Convolutional Neural Network Based on Time-Frequency Spectrogram of Arc Sound and Its Application on GTAW Penetration Classification. IEEE Trans. Ind. Inform. 2021, 17, 809–819. [Google Scholar] [CrossRef]
  9. Cheng, Y.; Wang, Q.; Jiao, W.; Yu, R.; Chen, S.; Zhang, Y.; Xiao, J. Detecting dynamic development of weld pool using machine learning from innovative composite images for adaptive welding. J. Manuf. Process. 2020, 56, 908–915. [Google Scholar] [CrossRef]
  10. Shin, S.; Jin, C.; Yu, J.; Rhee, S. Real-time detection of weld defects for automated welding process base on deep neural network. Metals 2020, 10, 389. [Google Scholar] [CrossRef]
  11. Wu, D.; Huang, Y.; Zhang, P.; Yu, Z.; Chen, H.; Chen, S. Visual-Acoustic Penetration Recognition in Variable Polarity Plasma Arc Welding Process Using Hybrid Deep Learning Approach. IEEE Access 2020, 8, 120417–120428. [Google Scholar] [CrossRef]
  12. Yamane, S.; Matsuo, K. Adaptive control by convolutional neural network in plasma arc welding system. ISIJ Int. 2020, 60, 998–1005. [Google Scholar] [CrossRef]
  13. Tao, F.; Zhang, H.; Liu, A.; Nee, A.Y.C. Digital Twin in Industry: State-of-the-Art. IEEE Trans. Ind. Inform. 2019, 15, 2405–2415. [Google Scholar] [CrossRef]
  14. Lee, K.; Hwang, I.; Kim, Y.-M.; Lee, H.; Kang, M.; Yu, J. Real-time weld quality prediction using a laser vision sensor in a lap fillet joint during gas metal arc welding. Sensors 2020, 20, 1625. [Google Scholar] [CrossRef] [PubMed]
  15. Oh, W.B.; Yun, T.J.; Lee, B.R.; Kim, C.G.; Liang, Z.L.; Kim, I.S. A Study on Intelligent Algorithm to Control Welding Parameters for Lap-joint. Procedia Manuf. 2019, 30, 48–55. [Google Scholar] [CrossRef]
  16. Zou, S.; Wang, Z.; Hu, S.; Wang, W.; Cao, Y. Control of weld penetration depth using relative fluctuation coefficient as feedback. J. Intell. Manuf. 2020, 31, 1203–1213. [Google Scholar] [CrossRef]
  17. Wu, D.; Chen, H.; Huang, Y.; Chen, S. Online Monitoring and Model-Free Adaptive Control of Weld Penetration in VPPAW Based on Extreme Learning Machine. IEEE Trans. Ind. Inform. 2019, 15, 2732–2740. [Google Scholar] [CrossRef]
  18. Penttilä, S.; Kah, P.; Ratava, J.; Eskelinen, H. Artificial Neural Network Controlled GMAW System: Penetration and Quality Assurance in a Multi-Pass Butt Weld Application. Int. J. Adv. Manuf. Technol. 2019, 105, 3369–3385. [Google Scholar] [CrossRef]
  19. Ratava, J.; Penttilä, S.; Lohtander, M.; Kah, P. Optical measurement of groove geometry. Procedia Manuf. 2018, 25, 111–117. [Google Scholar] [CrossRef]
  20. SFS-EN ISO 5817; Welding-Fusion-Welded Joints in Steel, Nickel, Titanium and Their Alloys (Beam Welding Excluded)—Quality Levels for Imperfections. The Finnish Standard Association: Helsinki, Finland, 2014.
  21. Kim, I.-S.; Son, J.-S.; Lee, S.-H.; Yarlagadda, P.K. Optimal design of neural networks for control in robotic arc welding. Robot. Comput.-Integr. Manuf. 2004, 20, 57–63. [Google Scholar] [CrossRef]
  22. Cui, D.; Xia, B.; Zhang, R.; Sun, Z.; Lao, Z.; Wang, W.; Sun, W.; Lai, Y.; Wang, M. A novel intelligent method for the state of charge estimation of lithium-ion batteries using a discrete wavelet transform-based wavelet neural network. Energies 2018, 11, 995. [Google Scholar] [CrossRef]
  23. Lv, C.; Xing, Y.; Zhang, J.; Na, X.; Li, Y.; Liu, T.; Cao, D.; Wang, F. Levenberg-marquardt backpropagation training of multilayer neural networks for state estimation of a safety-critical cyber-physical system. IEEE Trans. Ind. Inform. 2018, 14, 3436–3446. [Google Scholar] [CrossRef]
  24. Reddy, V.R.; Reddy, V.C.V.; Mohan, V.C.J. Speed Control of Induction Motor Drive Using Artificial Neural Networks-Levenberg-Marquardt Backpropogation Algorithm. Int. J. Appl. Eng. Res. 2018, 13, 80–85. [Google Scholar]
  25. Işcan, B. ANN modeling for justification of thermodynamic analysis of experimental applications on combustion parameters of a diesel engine using diesel and safflower biodiesel fuels. Fuel 2020, 279, 118391. [Google Scholar] [CrossRef]
  26. Jeong, S.H.; Lee, K.B.; Ham, J.H.; Kim, J.H.; Cho, J.Y. Estimation of Maximum Strains and Loads in Aircraft Landing Using Artificial Neural Network. Int. J. Aeronaut. Space Sci. 2020, 21, 117–132. [Google Scholar] [CrossRef]
  27. Kannaiyan, M.; Karthikeyan, G.; Raghuvaran, J.G.T. Prediction of specific wear rate for LM25/ZrO2 composites using Levenberg-Marquardt backpropagation algorithm. J. Mater. Res. Technol. 2020, 9, 530–538. [Google Scholar] [CrossRef]
  28. Caruso, S.; Imbrogno, S. Finite element modelling and experimental validation of microstructural changes and hardness variation during gas metal arc welding of AISI 441 ferritic stainless steel. Int. J. Adv. Manuf. Technol. 2022, 119, 2629–2637. [Google Scholar] [CrossRef]
  29. Peiyun, X.; Chunming, W.; Gaoyang, M.; Mingyang, Z.; Lingda, X.; Xiong, Z.; Chuncheng, Z.; Xiaosong, F.; Yiyang, H. Numerical simulation of molten pool flow behavior and keyhole evolution behavior in dual-laser beam oscillating bilateral synchronous welding of T-joints. Int. J. Heat Mass Transf. 2023, 209, 124114. [Google Scholar]
  30. Darko, P.; Goran, V.; Spiro, I. Welded steel in marine environment—Experimental and numerical study of mechanical properties degradation. Mater. Today Commun. 2023, 34, 105280. [Google Scholar]
  31. Chen, S.B.; Zhang, Y.; Qiu, T.; Lin, T. Robotic welding systems with vision-sensing and self-learning neuron control of arc welding dynamic process. J. Intell. Robot. Syst. 2003, 36, 191–208. [Google Scholar] [CrossRef]
  32. Chen, S.B.; Zhao, D.B.; Wu, L.; Lou, Y.J. Intelligent methodology for sensing, modeling and control of pulsed GTAW: Part 2—Butt joint welding. Weld. J. 2000, 79, 164–174. [Google Scholar]
  33. Zhang, Y.M.; Kovacevic, R. Neurofuzzy model-based predictive control of weld fusion zone geometry. IEEE Trans. Fuzzy Syst. 1998, 6, 389–401. [Google Scholar] [CrossRef]
  34. Kovacevic, R.; Zhang, Y.M. Real-time image processing for monitoring of free weld pool surface. J. Manuf. Sci. Eng. 1997, 119, 161–169. [Google Scholar] [CrossRef]
Figure 1. Experimental setup with a close-up image of the torch configuration consisting of thermal sensor, welding torch and laser triangulation sensor.
Jmmp 07 00102 g001
Figure 2. Depth measurement data of the groove profile is plotted in the graph.
Jmmp 07 00102 g002
Figure 3. Experimental setup with digital connections of the components.
Jmmp 07 00102 g003
Figure 4. Data acquisition flowchart of the IWS.
Jmmp 07 00102 g004
Figure 5. Experimental procedure phases of the IWS training and testing.
Jmmp 07 00102 g005
Figure 6. Gathered and validated data from the welding experiments. The sample number presents one pair of all four parameters at the time.
Jmmp 07 00102 g006
Figure 7. MSE performance of NN with one to four hidden layer configurations.
Jmmp 07 00102 g007
Figure 8. MSE performance of NN with two-hidden-layer configurations.
Jmmp 07 00102 g008
Figure 9. NN training, validation and testing performances with two-hidden-layer configurations.
Jmmp 07 00102 g009
Figure 10. Simulated NN decision graph of wire feed adjustment over the defined parameter window.
Jmmp 07 00102 g010
Figure 11. Simulated NN decision graph of arc voltage override adjustment over the defined parameter window.
Jmmp 07 00102 g011
Figure 12. IWS reliability as a relative error compared to training data. Limits of quality by ISO 5817 level B.
Jmmp 07 00102 g012
Table 1. Experimental setup details with the information of the NN training.
Material, plate thicknessS420 MC, 12 mm
Filler materialEsab OK Autrod 12.51, Ø 1 mm
Welding processGas metal arc welding (135)
Welding equipmentFronius TPS 5000
Joint typeButt weld
Weld positionPA
Groove angle60°
Welding speed7 mm/s
Welding gas and flow speed92% Ar + 8% CO2, AGA Mison 8, 19 L/min
Torch distance18 mm
Laser sensorMeta SLS50-v1
Neural network typeBackpropagation neural network
Optimization algorithmLevenberg–Marquardt algorithm
Neural network configuration2-20-20-2
Neural network input parametersRoot gap, root face
Neural network output parametersWire feed, arc voltage
Table 2. Chemical composition and mechanical properties of base and filler material.
DetailsBase MaterialFiller Material
Product commercial nameSSAB S420 MC plus, 12 mmEsab OK Autrod 12.51
Yield strength420 MPa460 MPa
Ultimate tensile strength490–620 MPa540 MPa
Elongation at break21%26%
C0.120.10
Mn1.51.11
Si0.030.72
S0.0150.012
P0.0200.013
Table 3. Experimental setup details of utilized welding parameters.
Root gap variation values1 mm, 1.5 mm, 2 mm
Root face variation values1 mm, 1.5 mm, 2 mm
Wire feed variation values±1 m/min compared to the predefined value
arc voltage override values±5% compared to the predefined value
Actual root gap variation in experiments0.7–2.2 mm
Actual root face variation in experiments0.9–2.6 mm
Disclaimer/Publisher’s Note: The statements, opinions and data contained in all publications are solely those of the individual author(s) and contributor(s) and not of MDPI and/or the editor(s). MDPI and/or the editor(s) disclaim responsibility for any injury to people or property resulting from any ideas, methods, instructions or products referred to in the content.

