
Influence of Ambient Temperature and Crystalline Structure on Fracture Toughness and Production of Thermoplastic by Enclosure FDM 3D Printer

 , , , , and
Abstract
:1. Introduction
2. Methodology
2.1. Materials
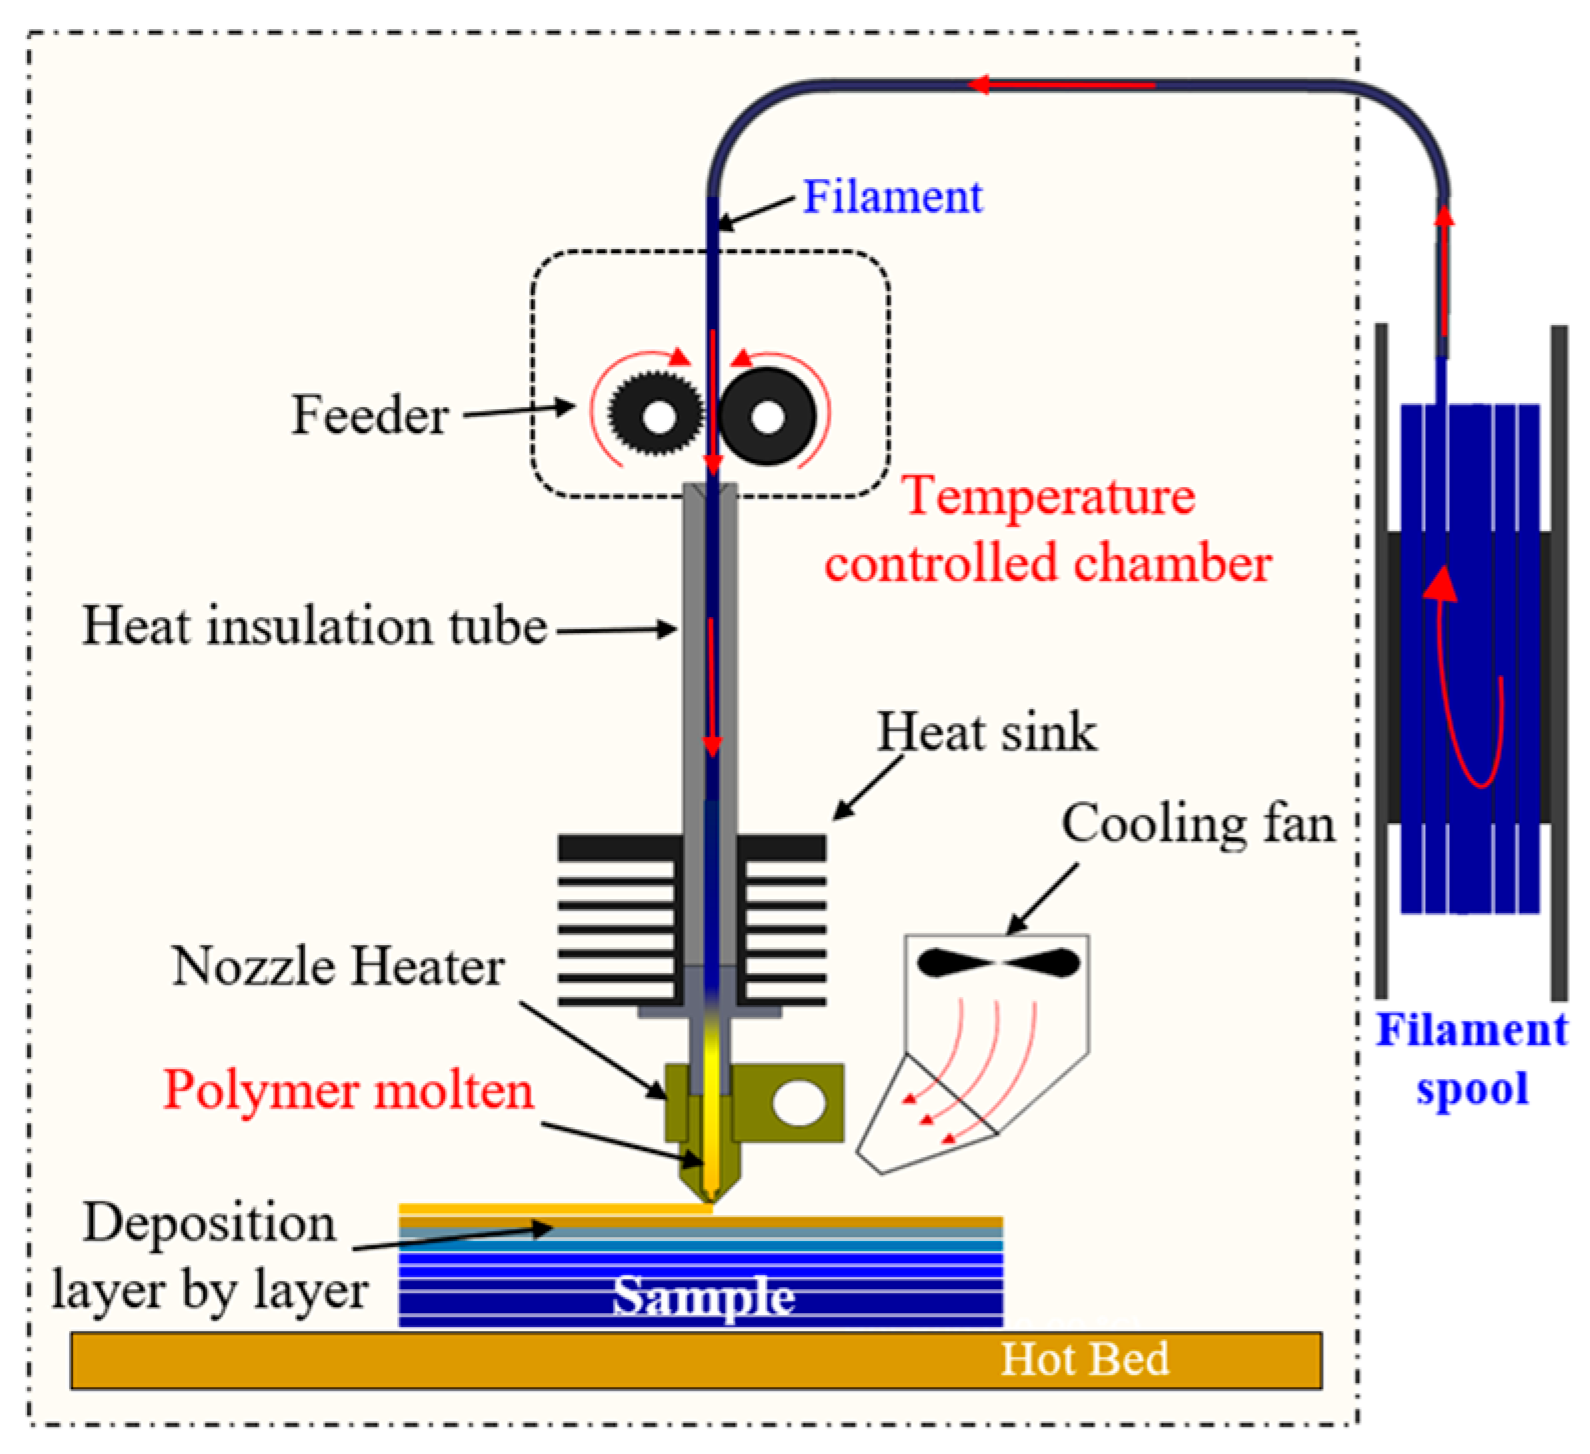
2.2. Method
2.3. Characterization
2.3.1. Wide Angle X-ray Diffraction
2.3.2. Differential Scanning Calorimeter
2.3.3. Dynamic Mechanical Analysis
2.3.4. Thermal Graphic Observation
2.3.5. Fracture Toughness Testing
2.3.6. Scanning Electron Microscope
3. Results and Discussion
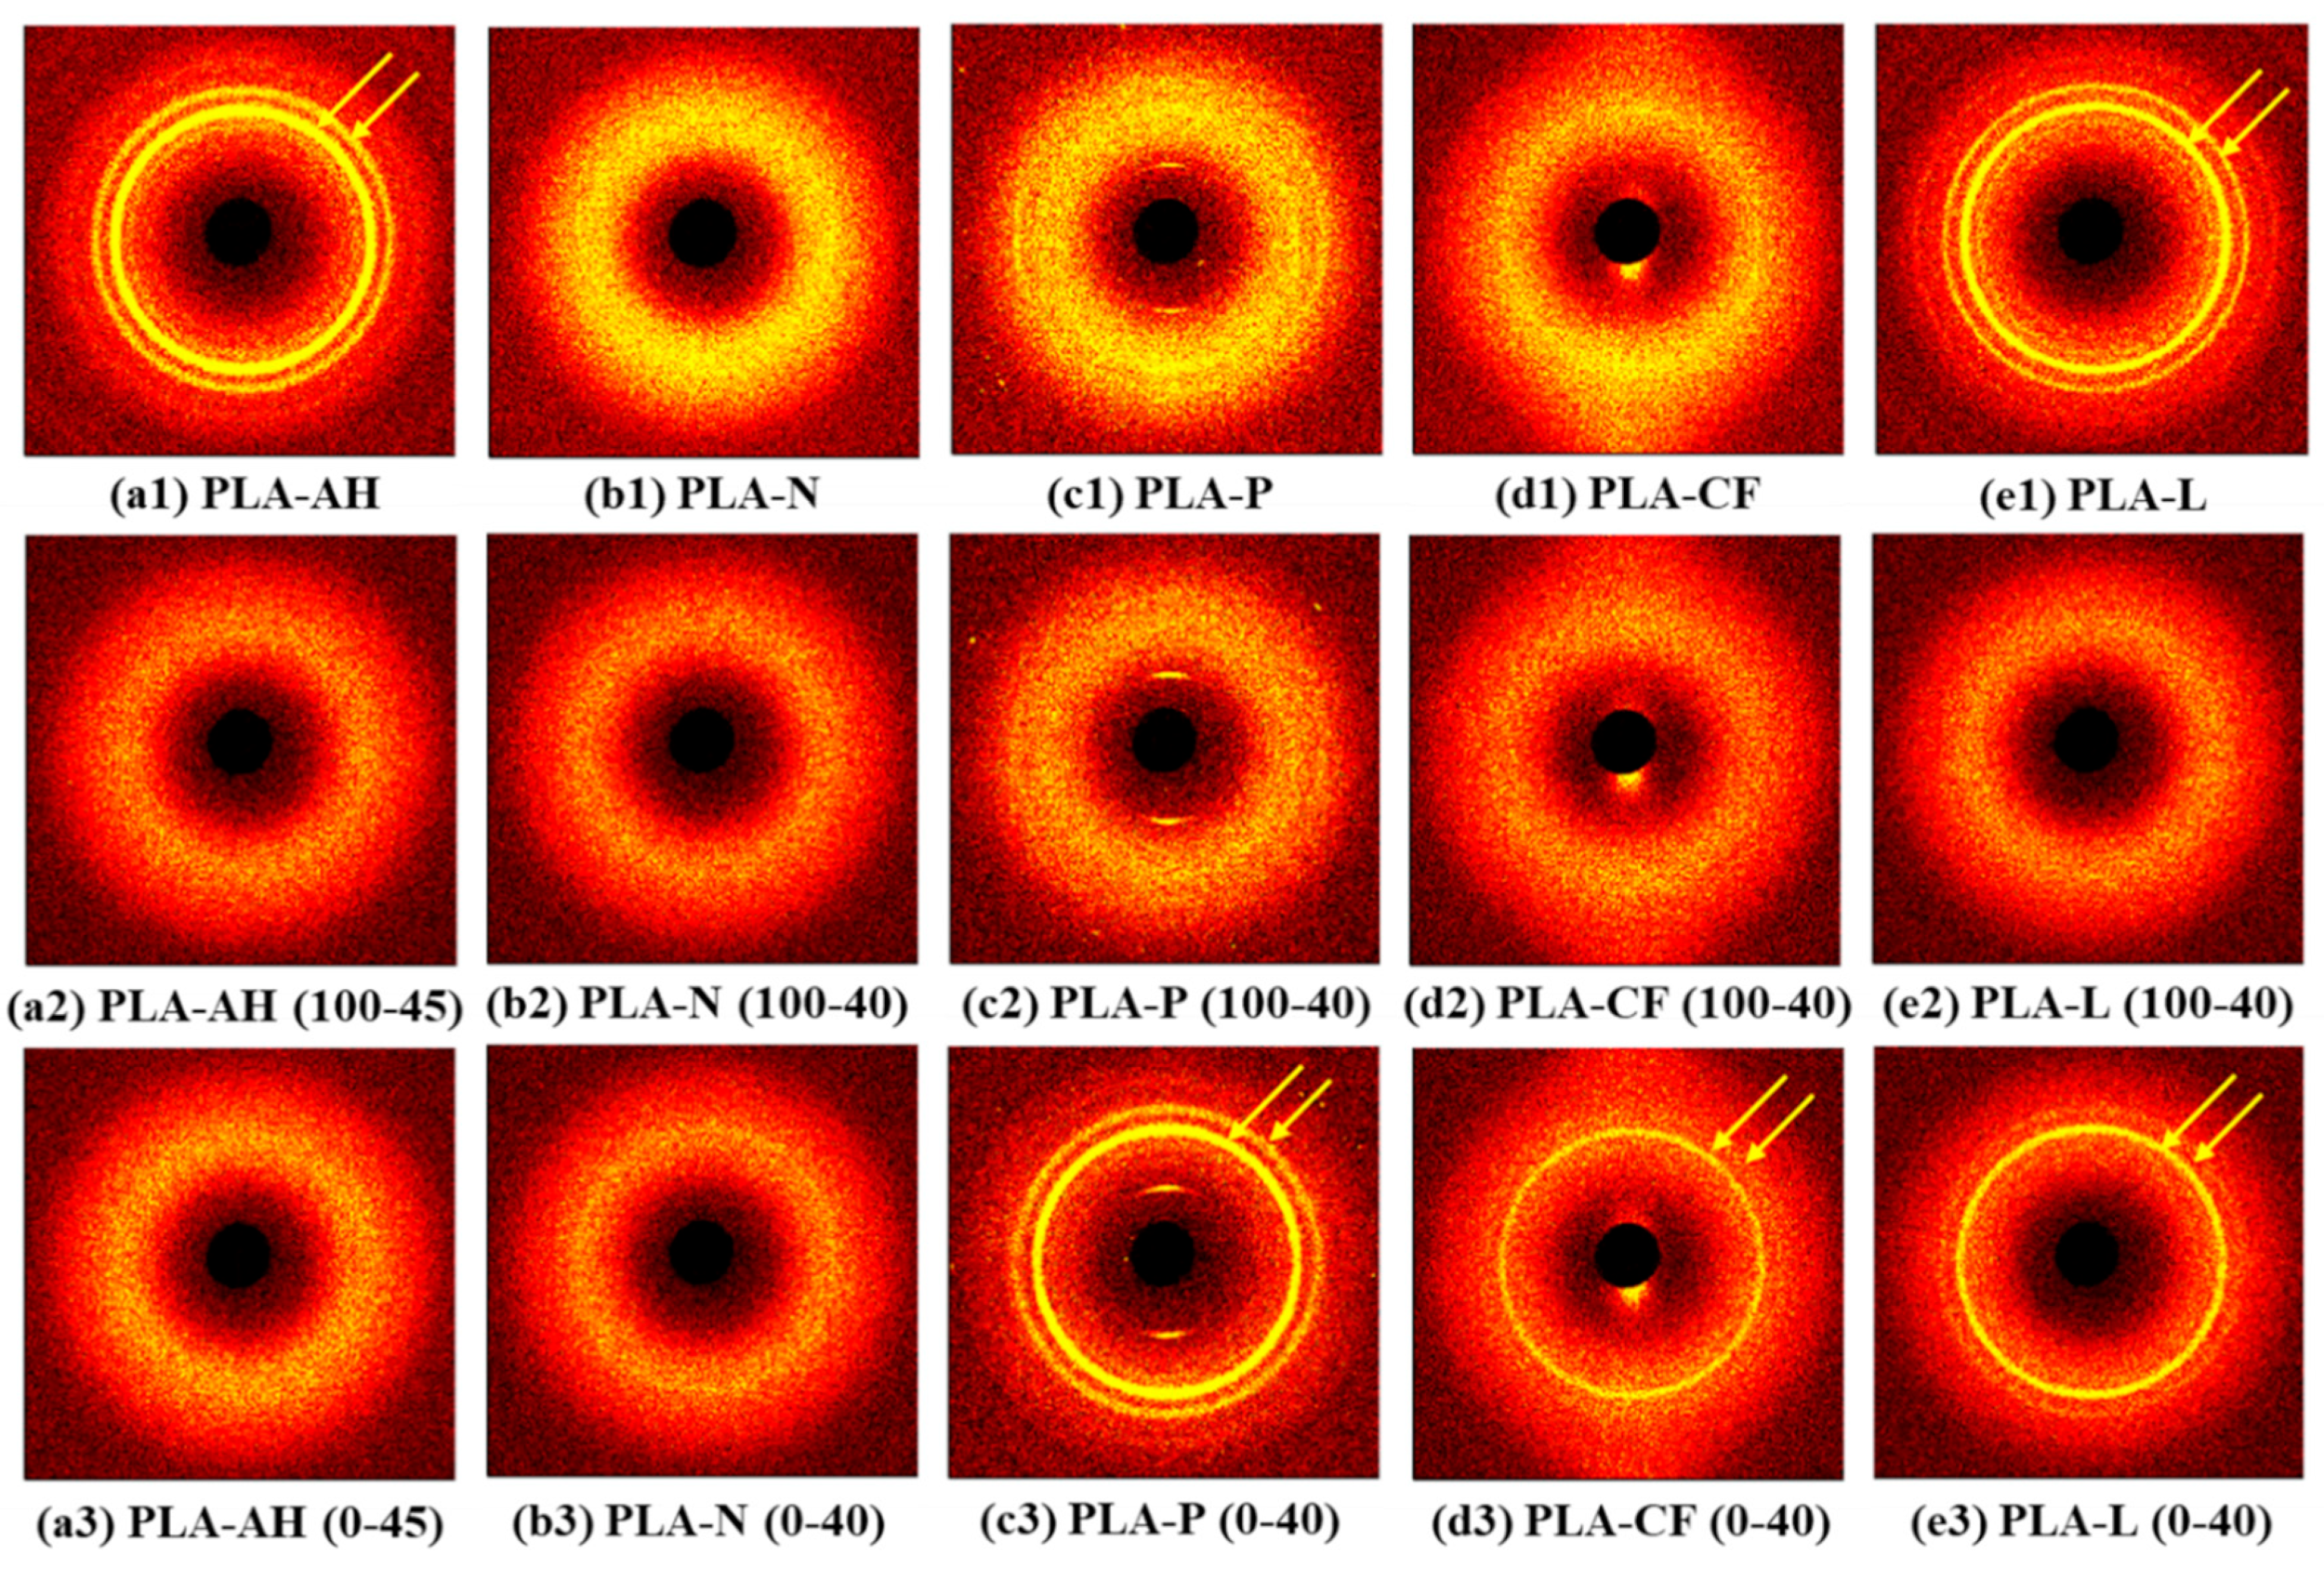
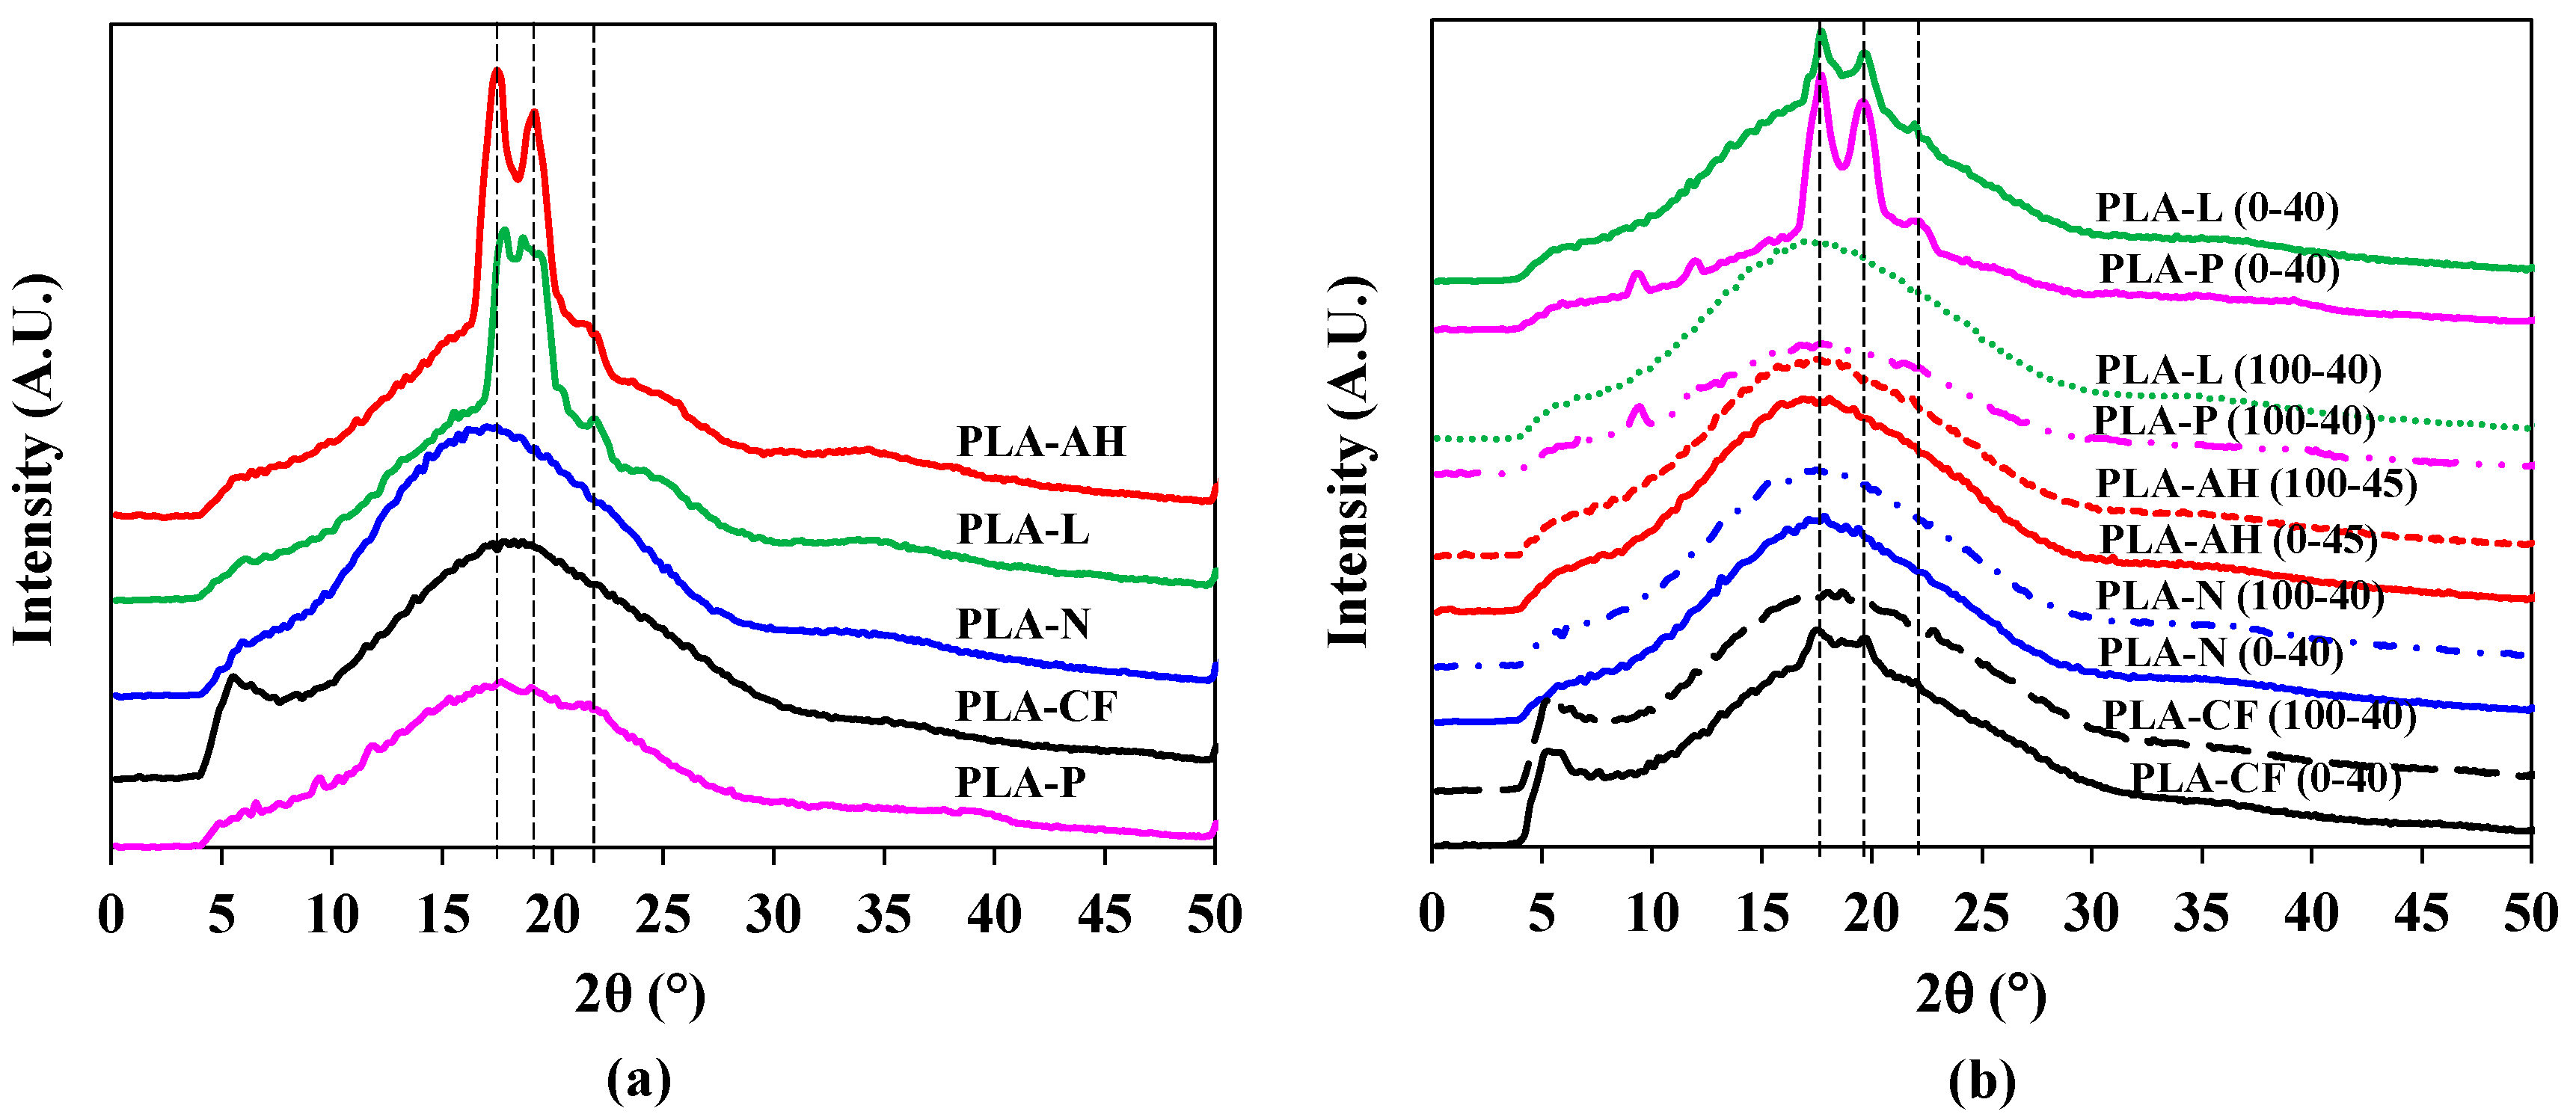
3.1. Crystalline Structure of PLA Filaments and 3D Printed Dumbbell Specimens
3.2. Thermal Properties of PLA Filaments and 3D Printed Dumbbell Specimens
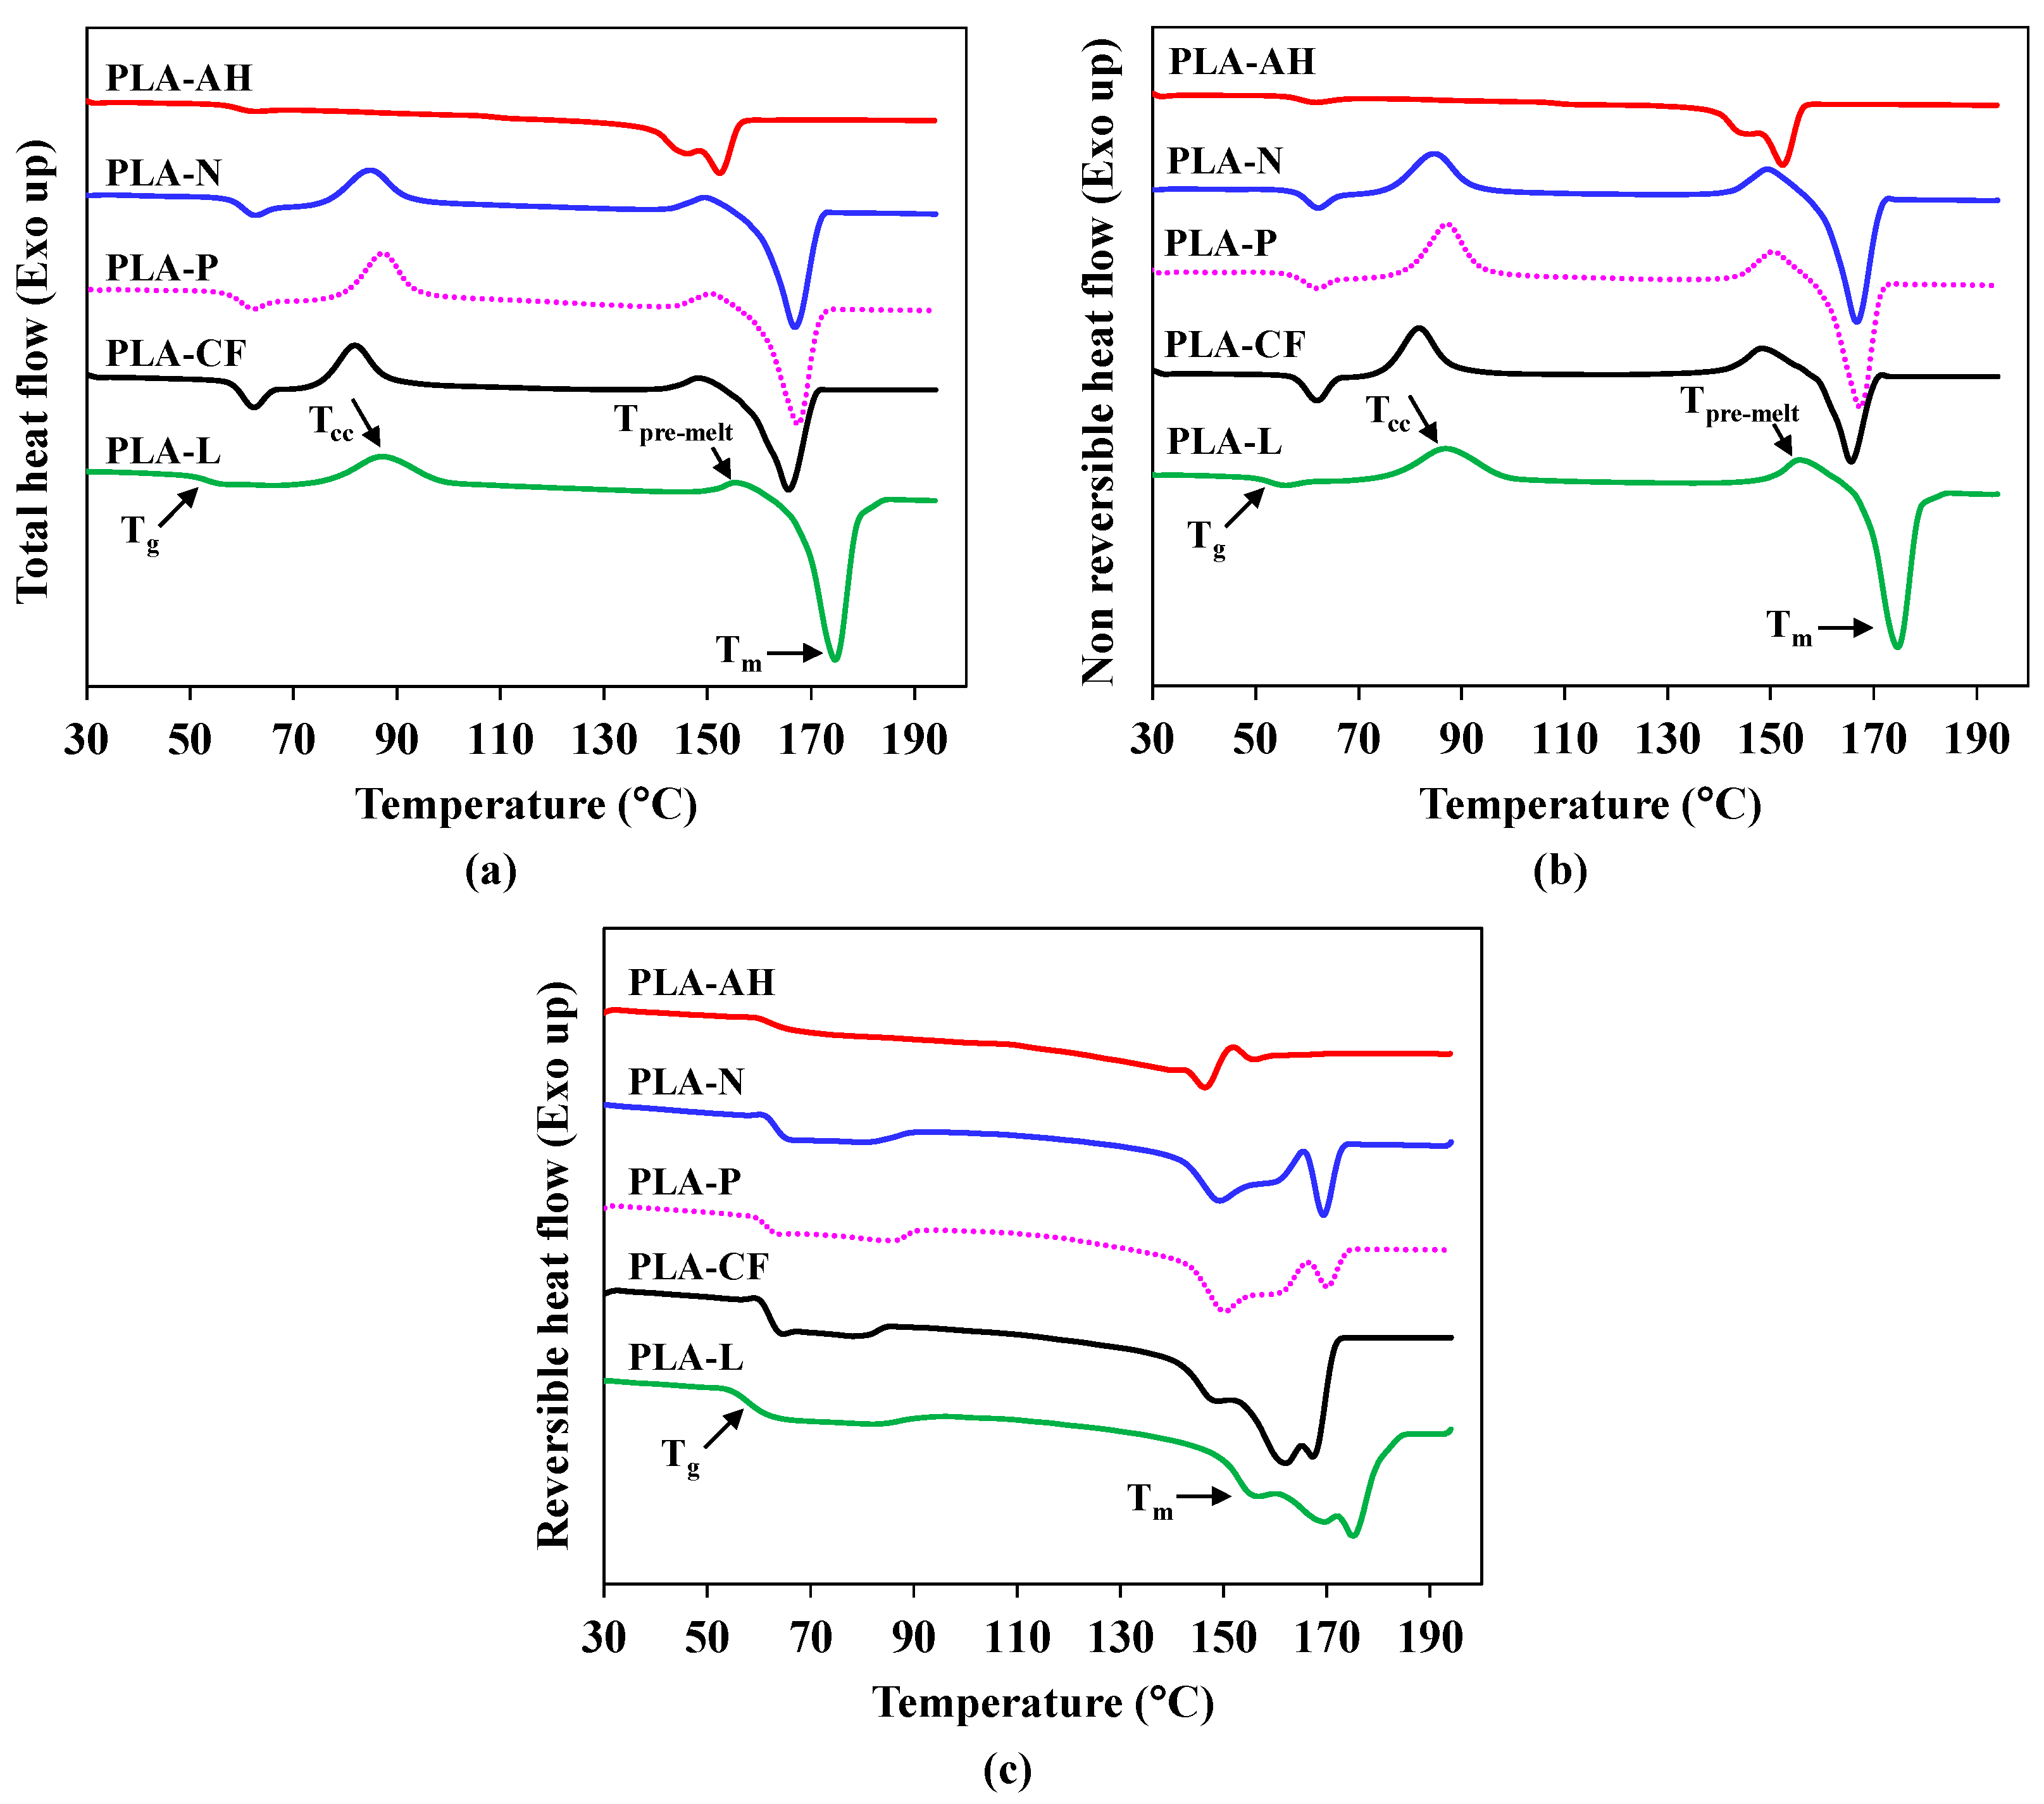
3.2.1. Thermal Properties of PLA Filaments
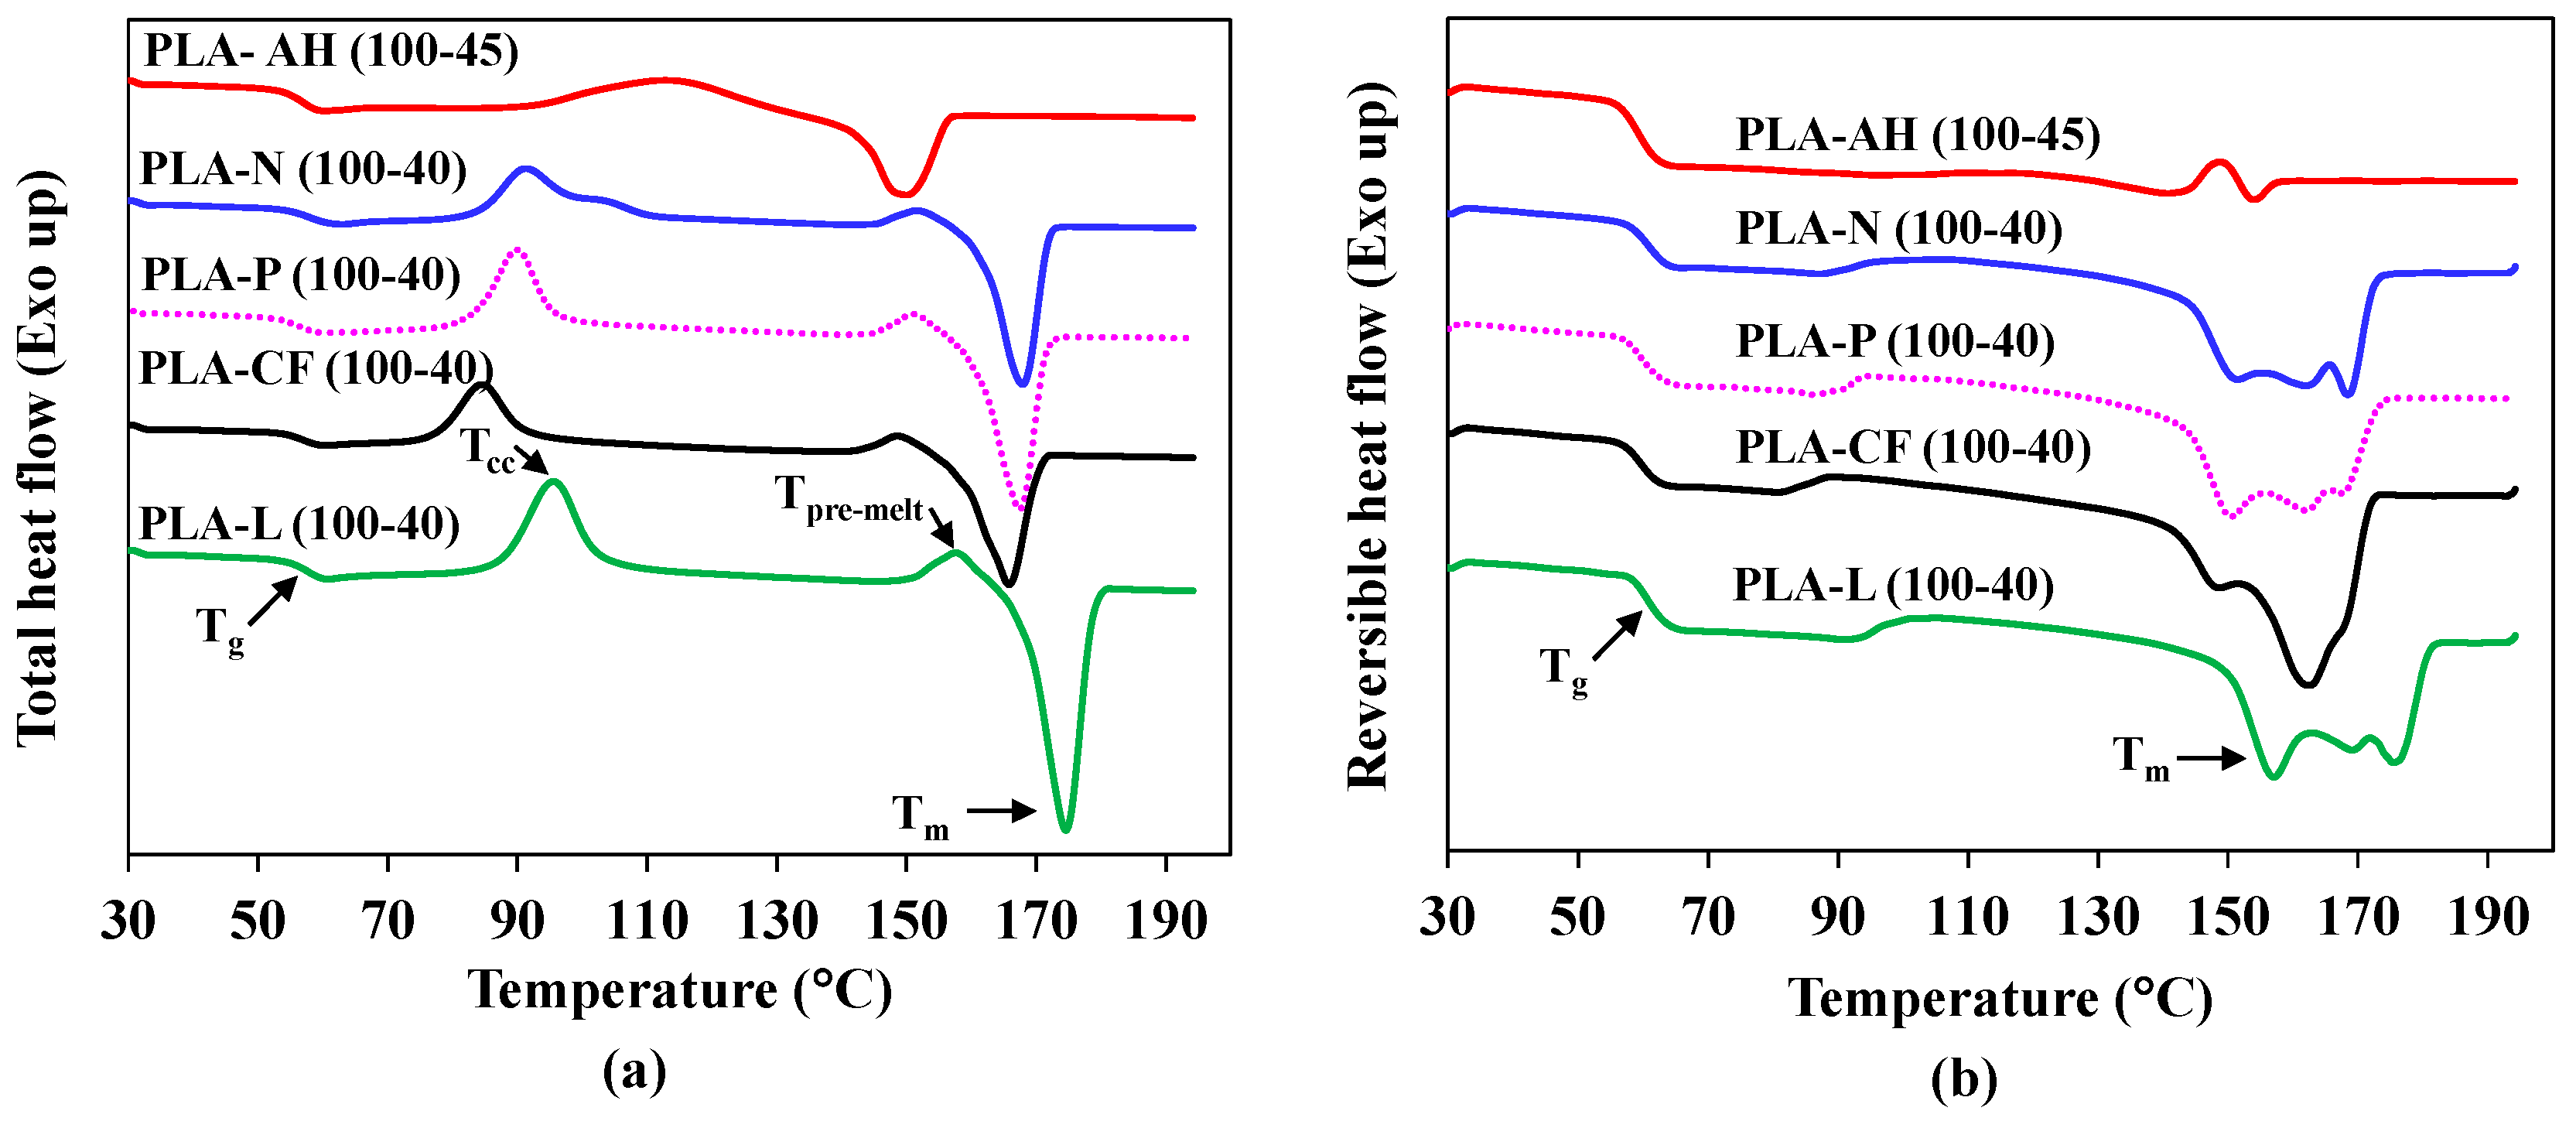
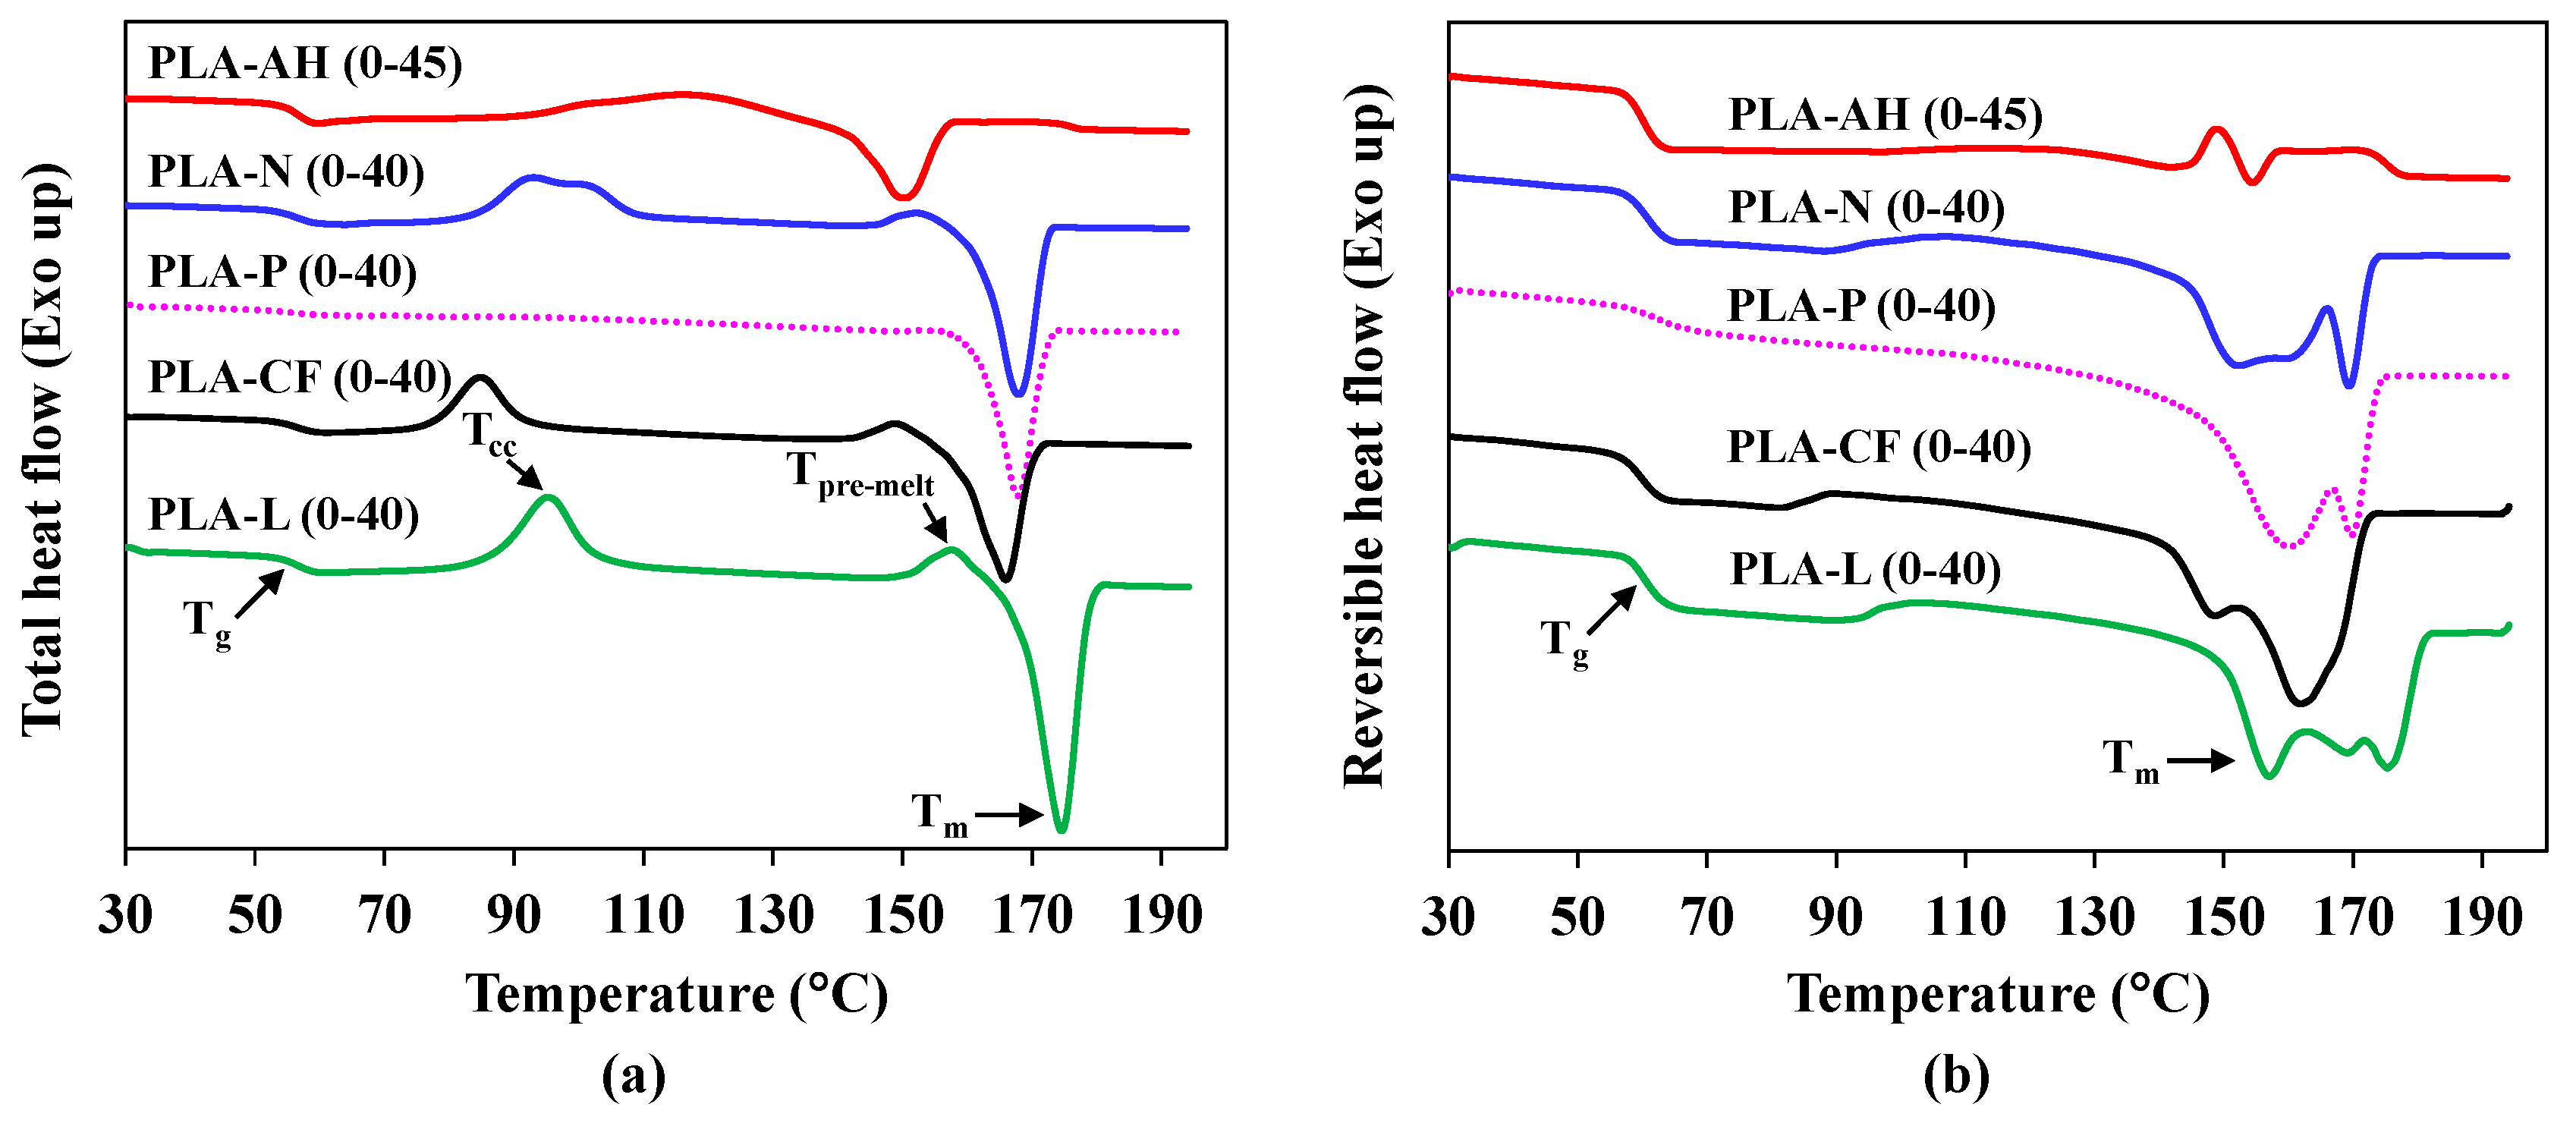
3.2.2. Thermal Properties of 3D Printed Dumbbell Specimens
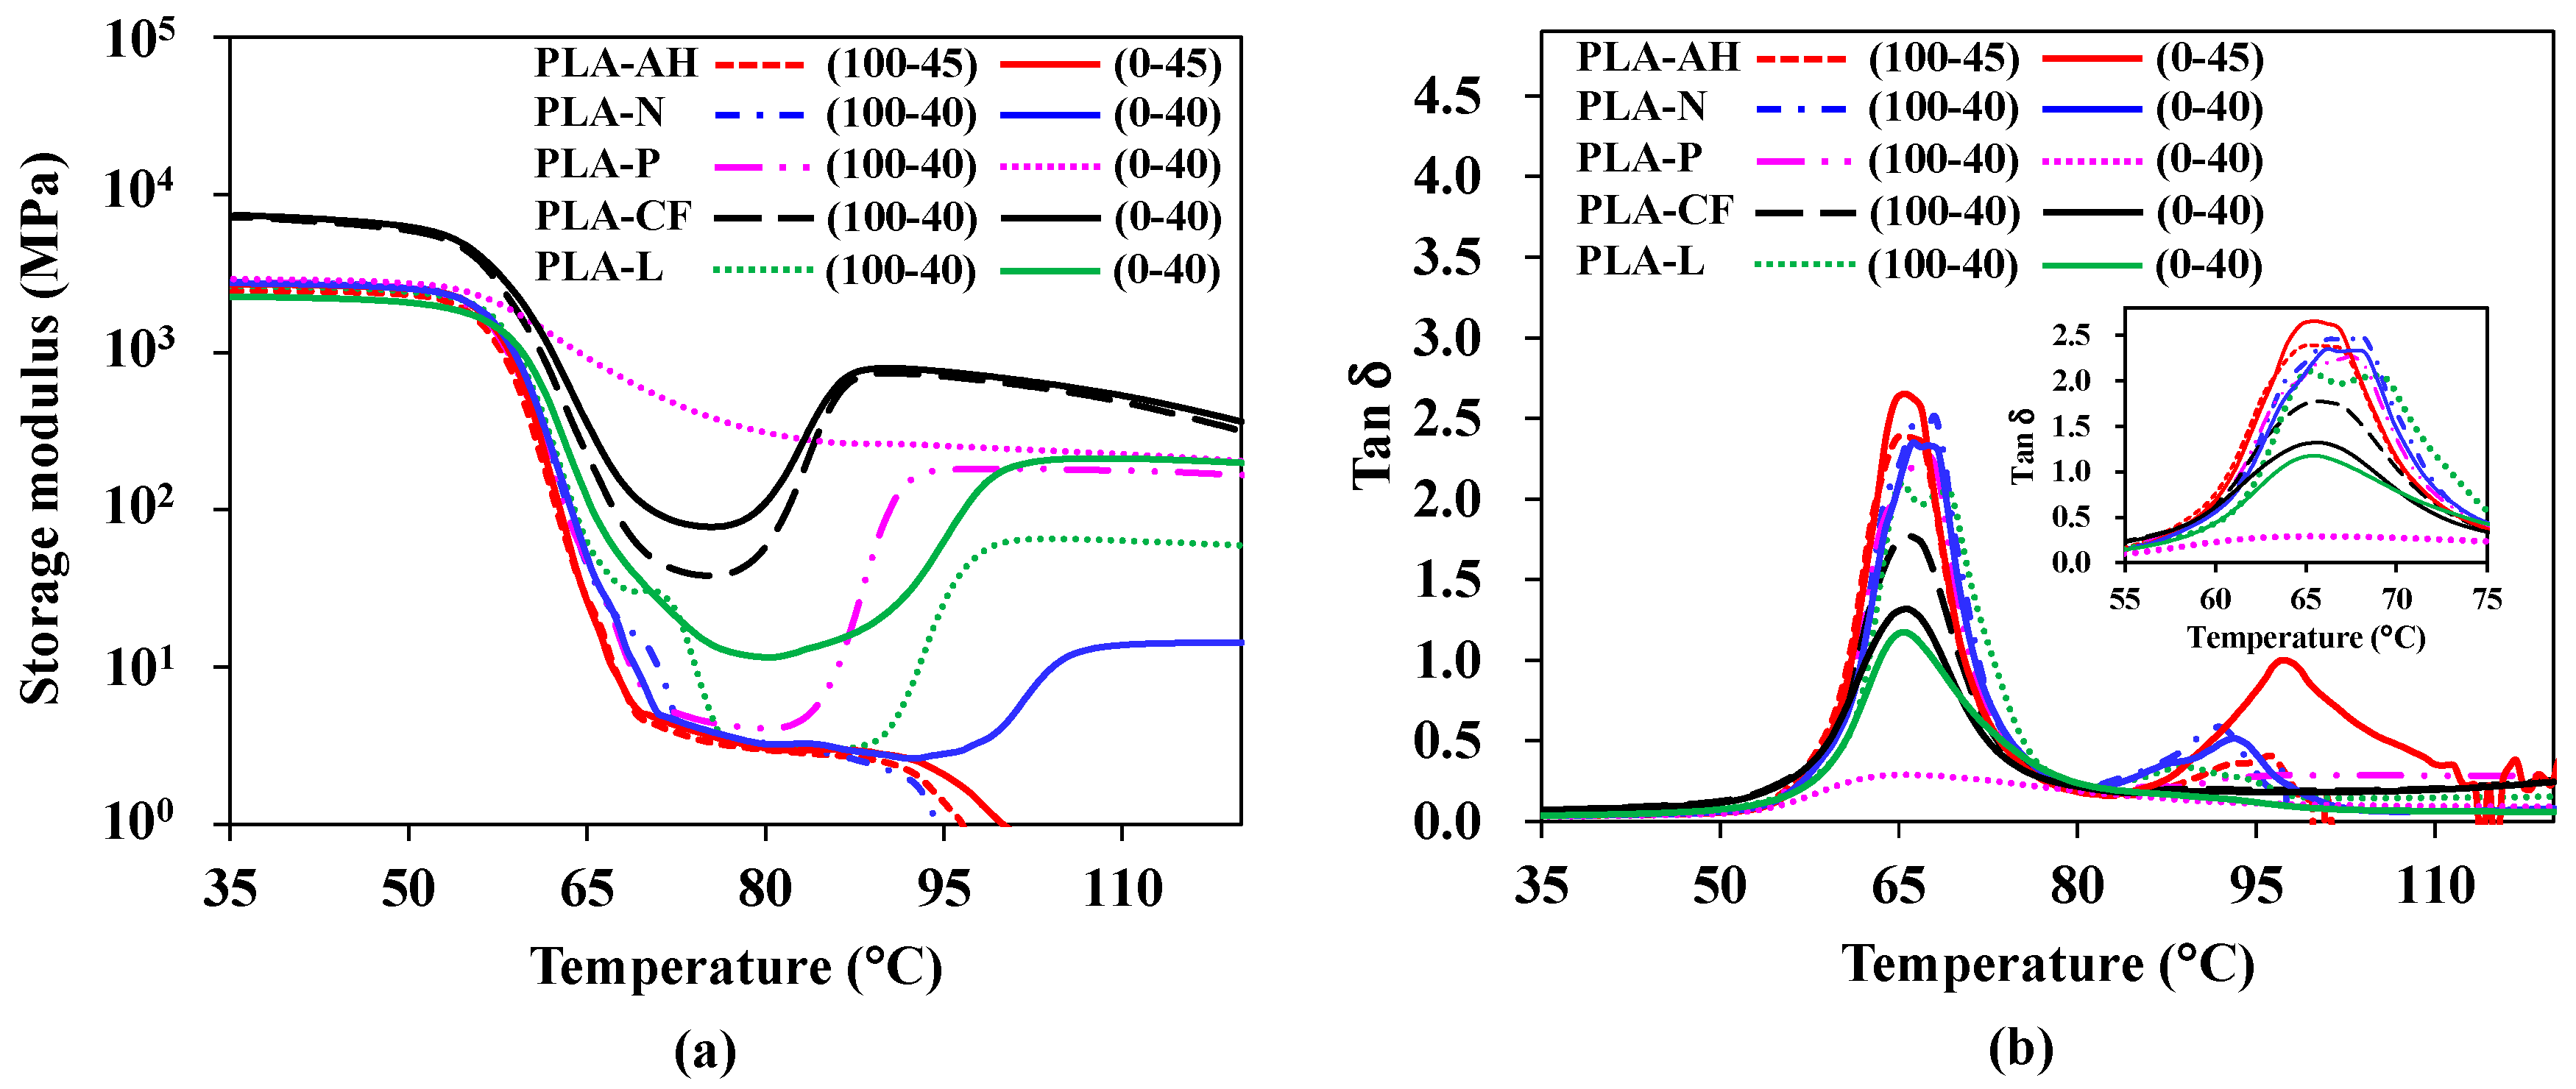
3.3. Dynamic Mechanical Properties
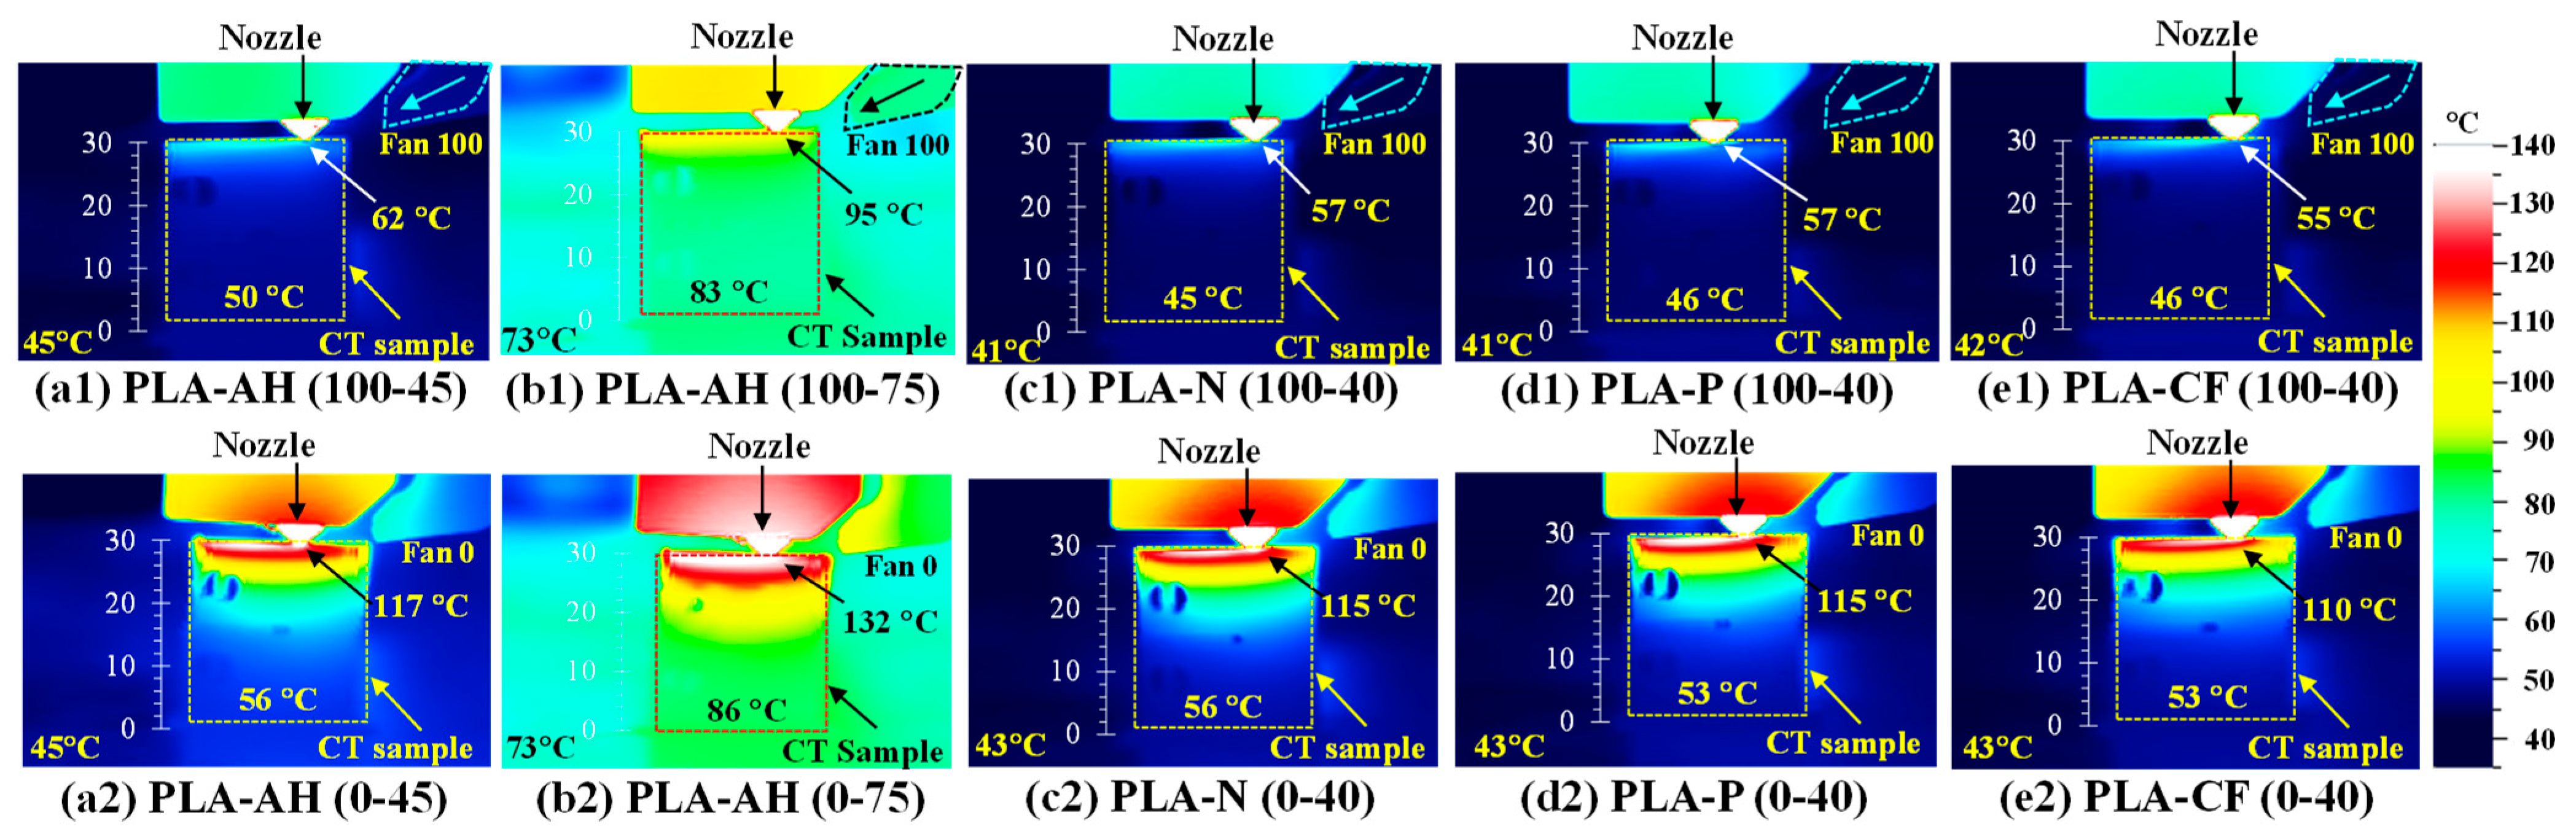
3.4. Thermal Profile of 3D Printed Compact Tension Specimen
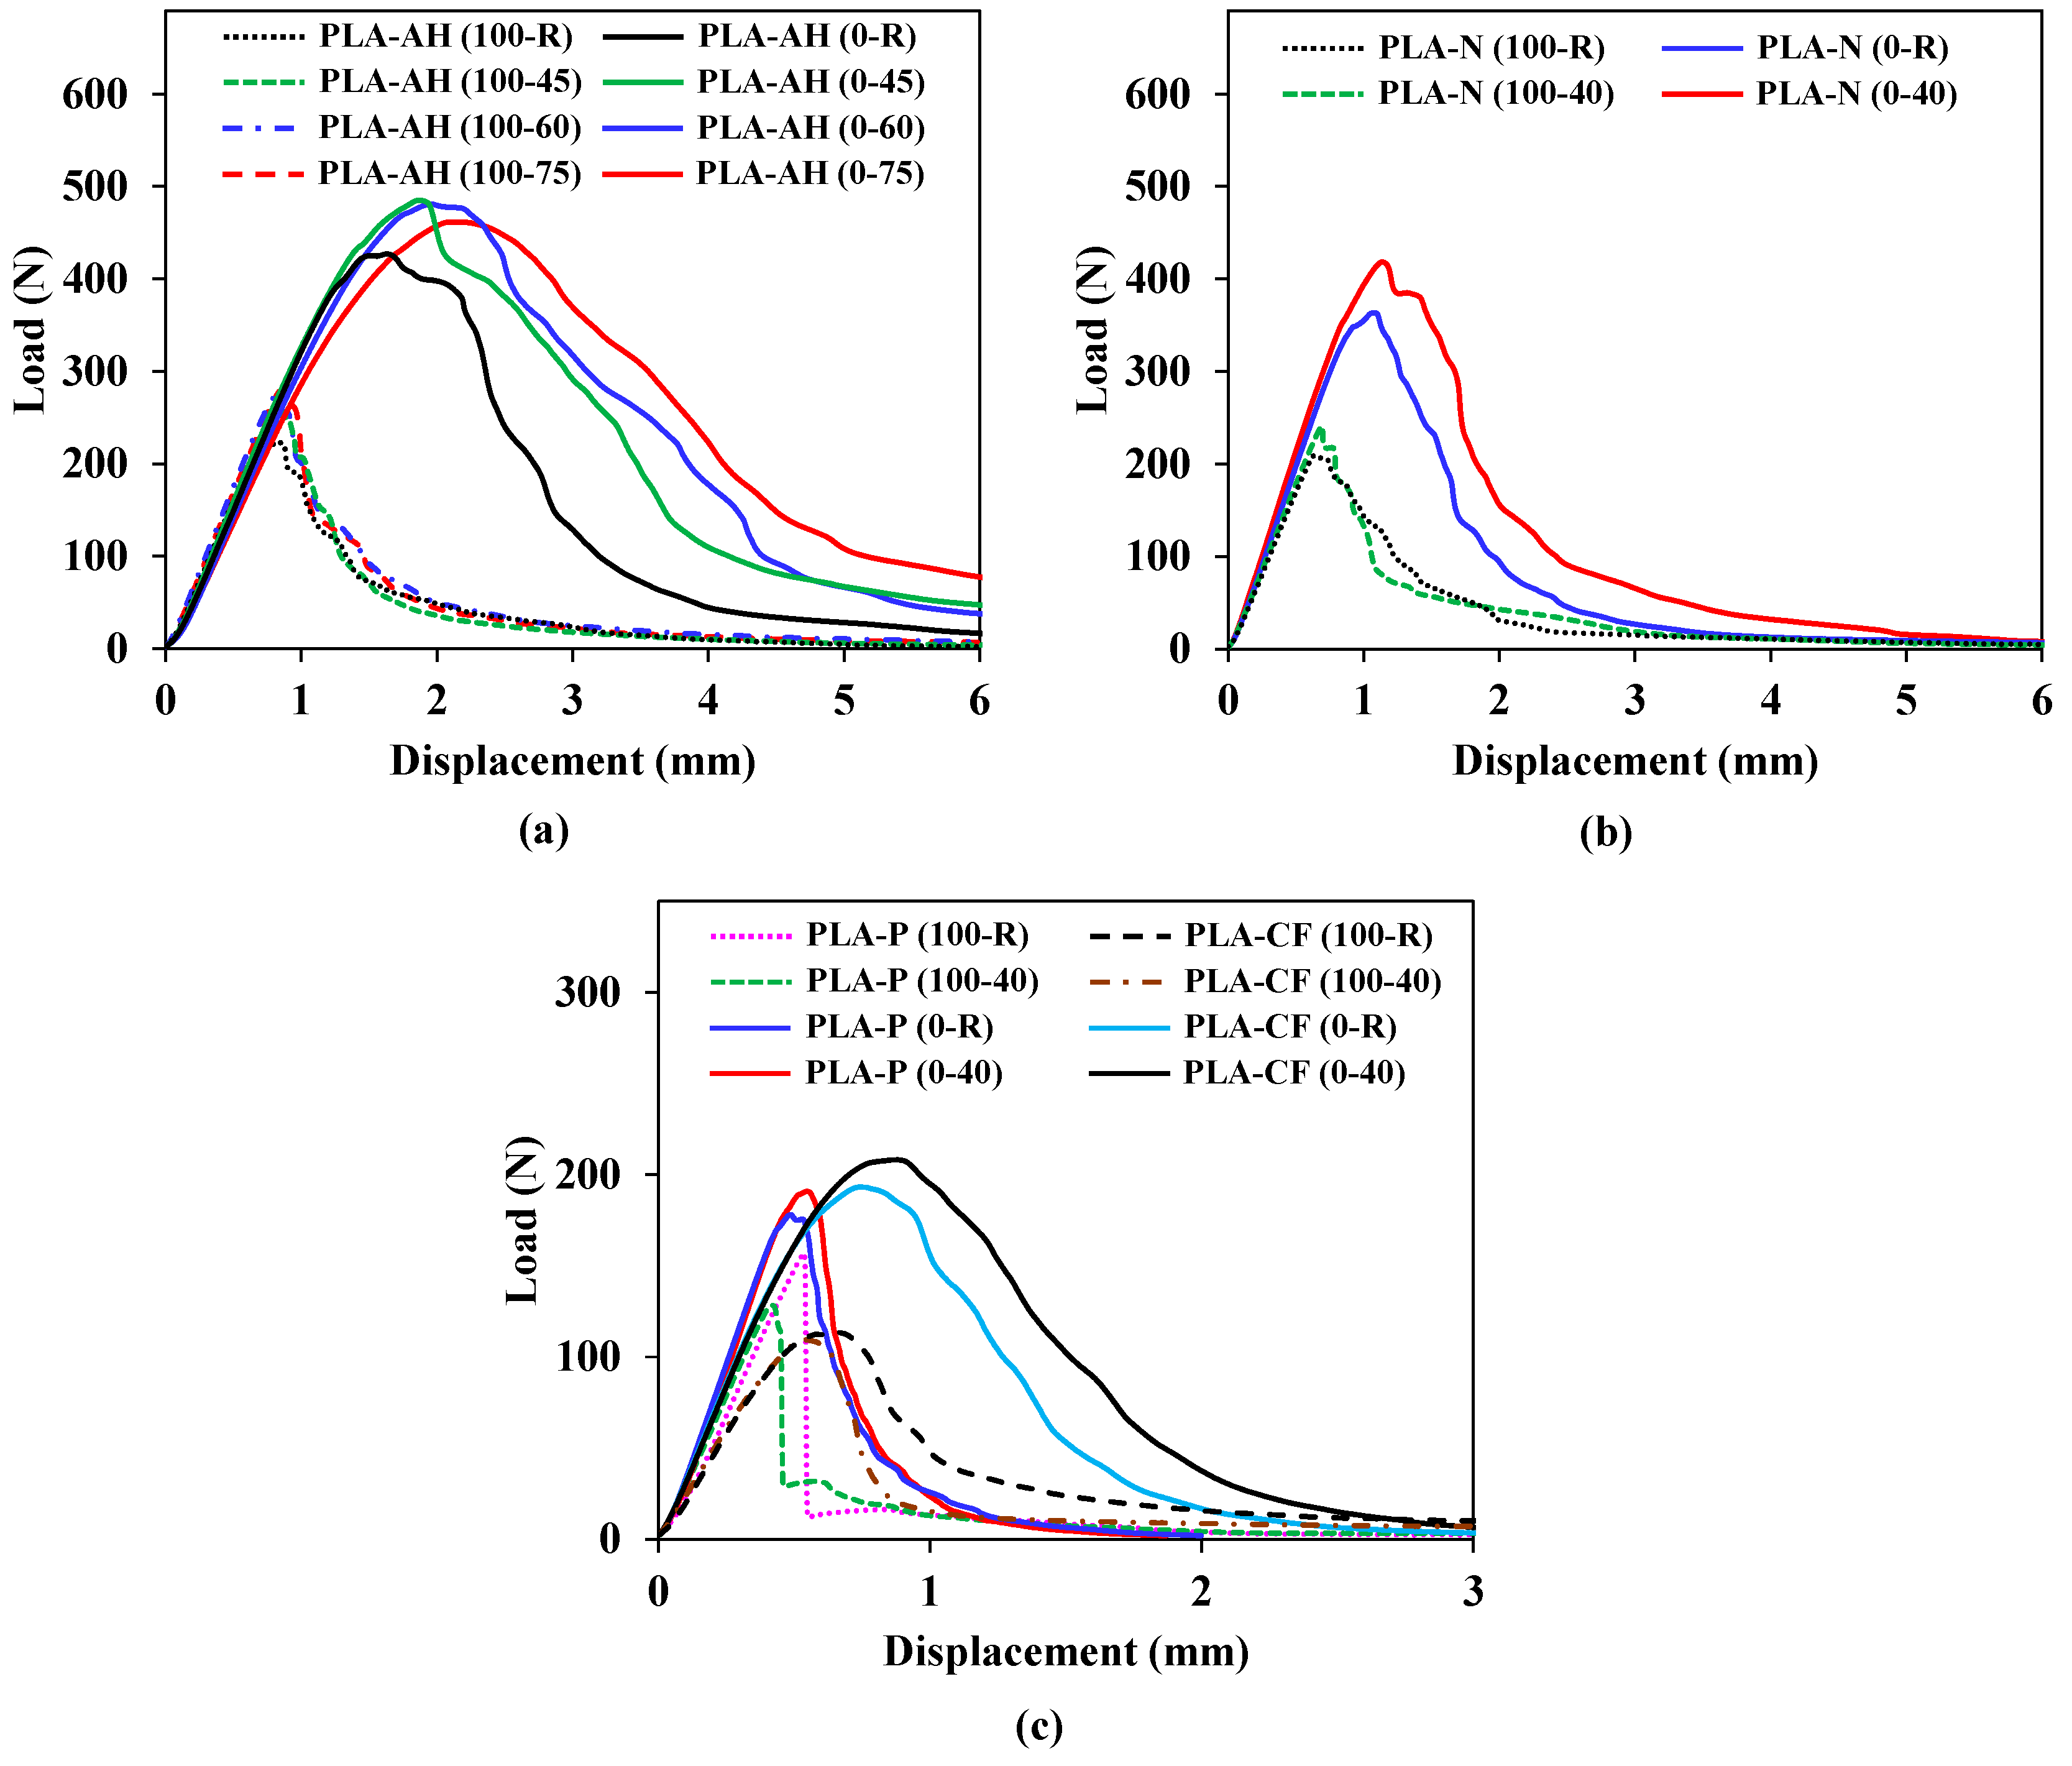
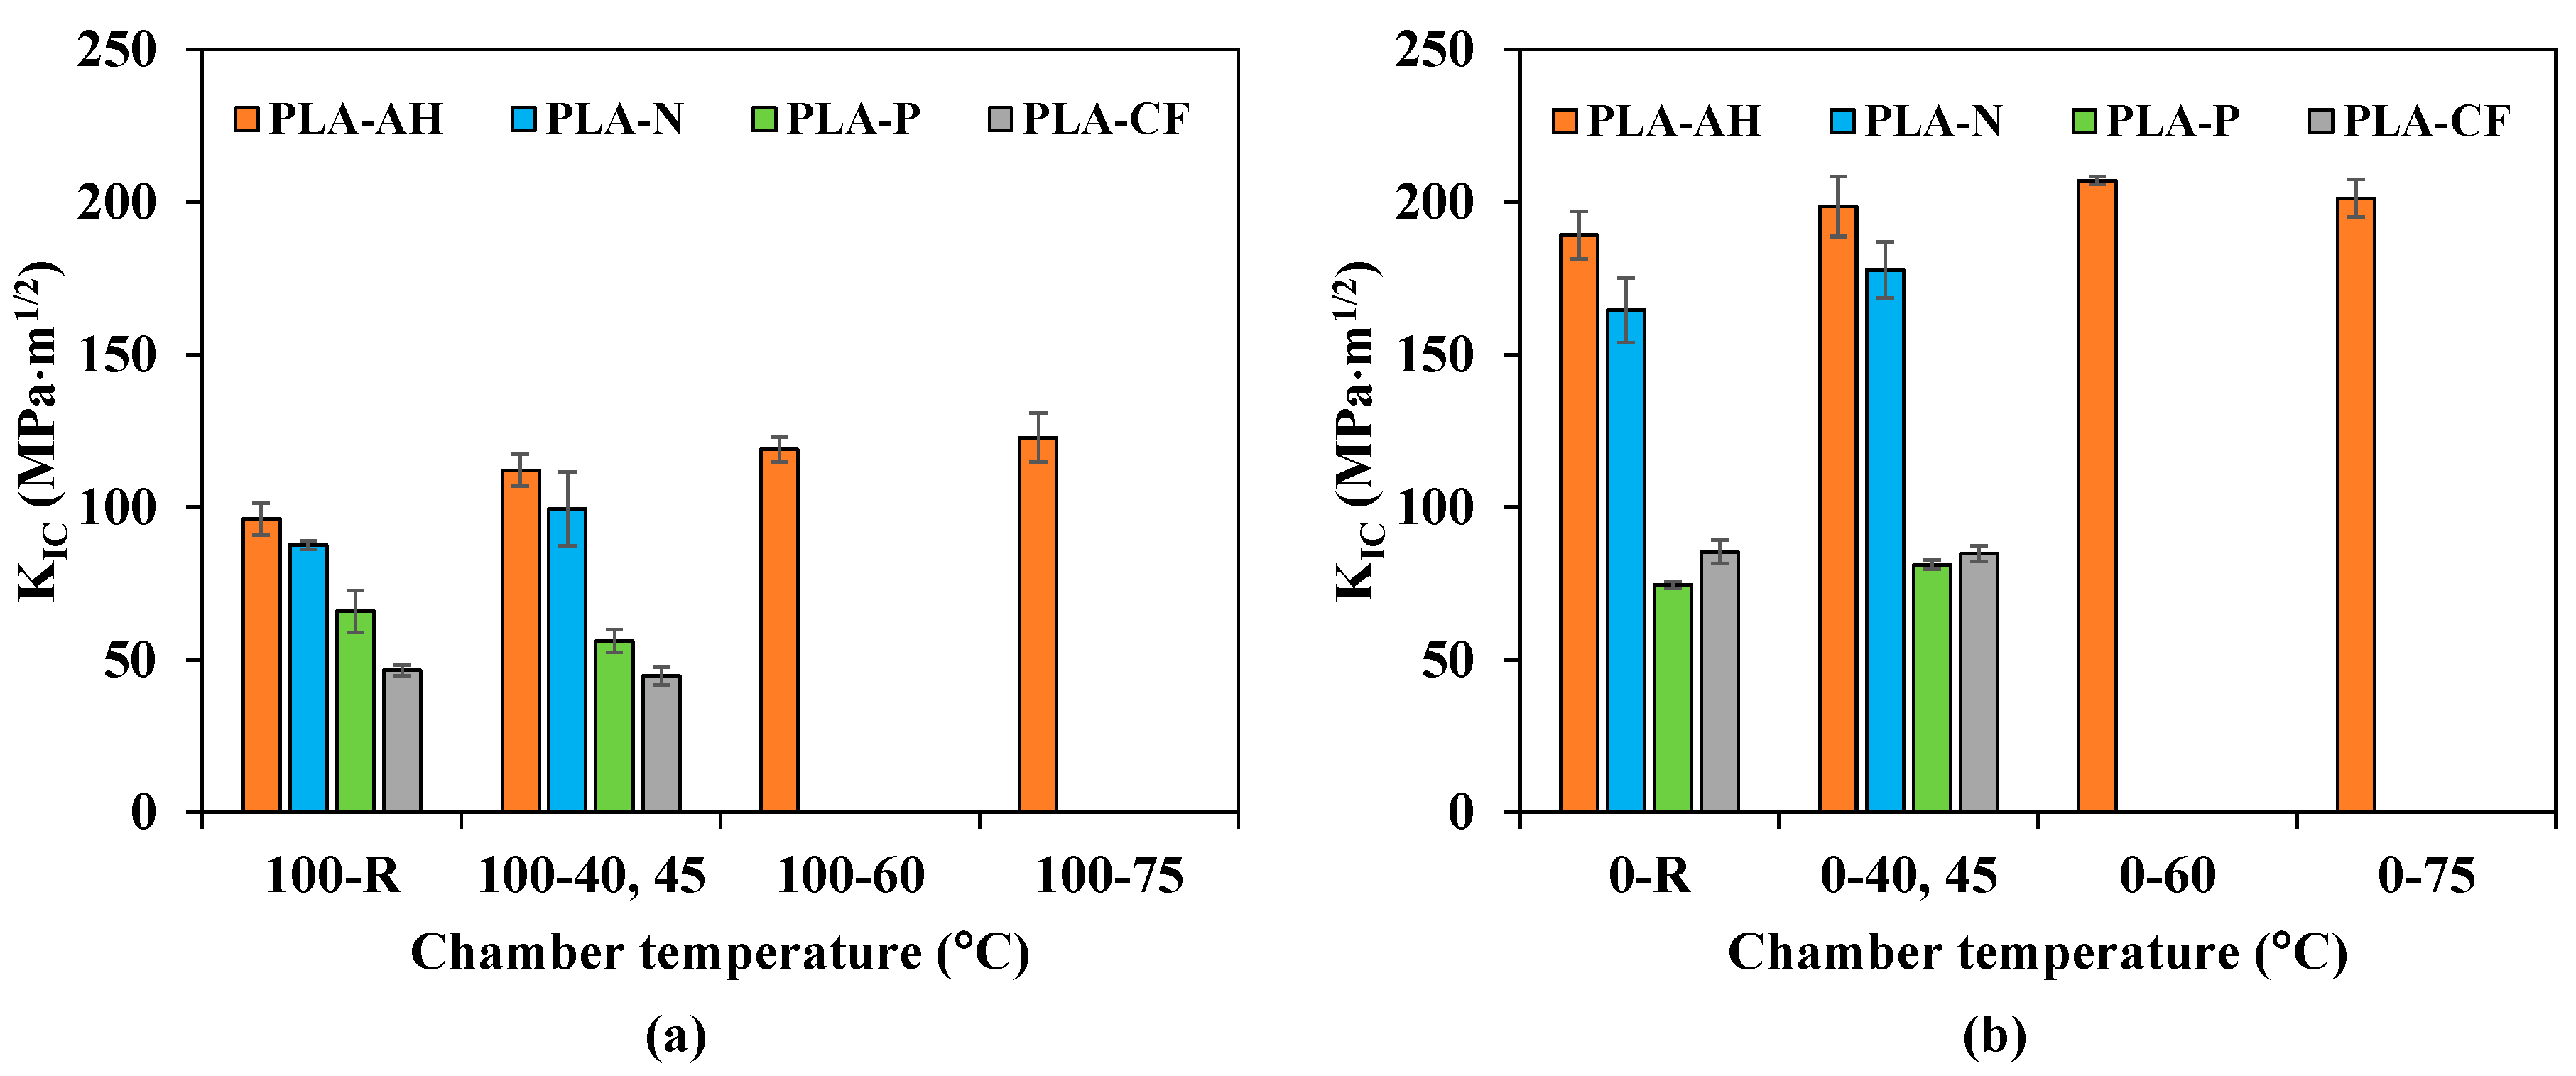
3.5. Fracture Toughness of 3D Printed Compact Tension Specimen
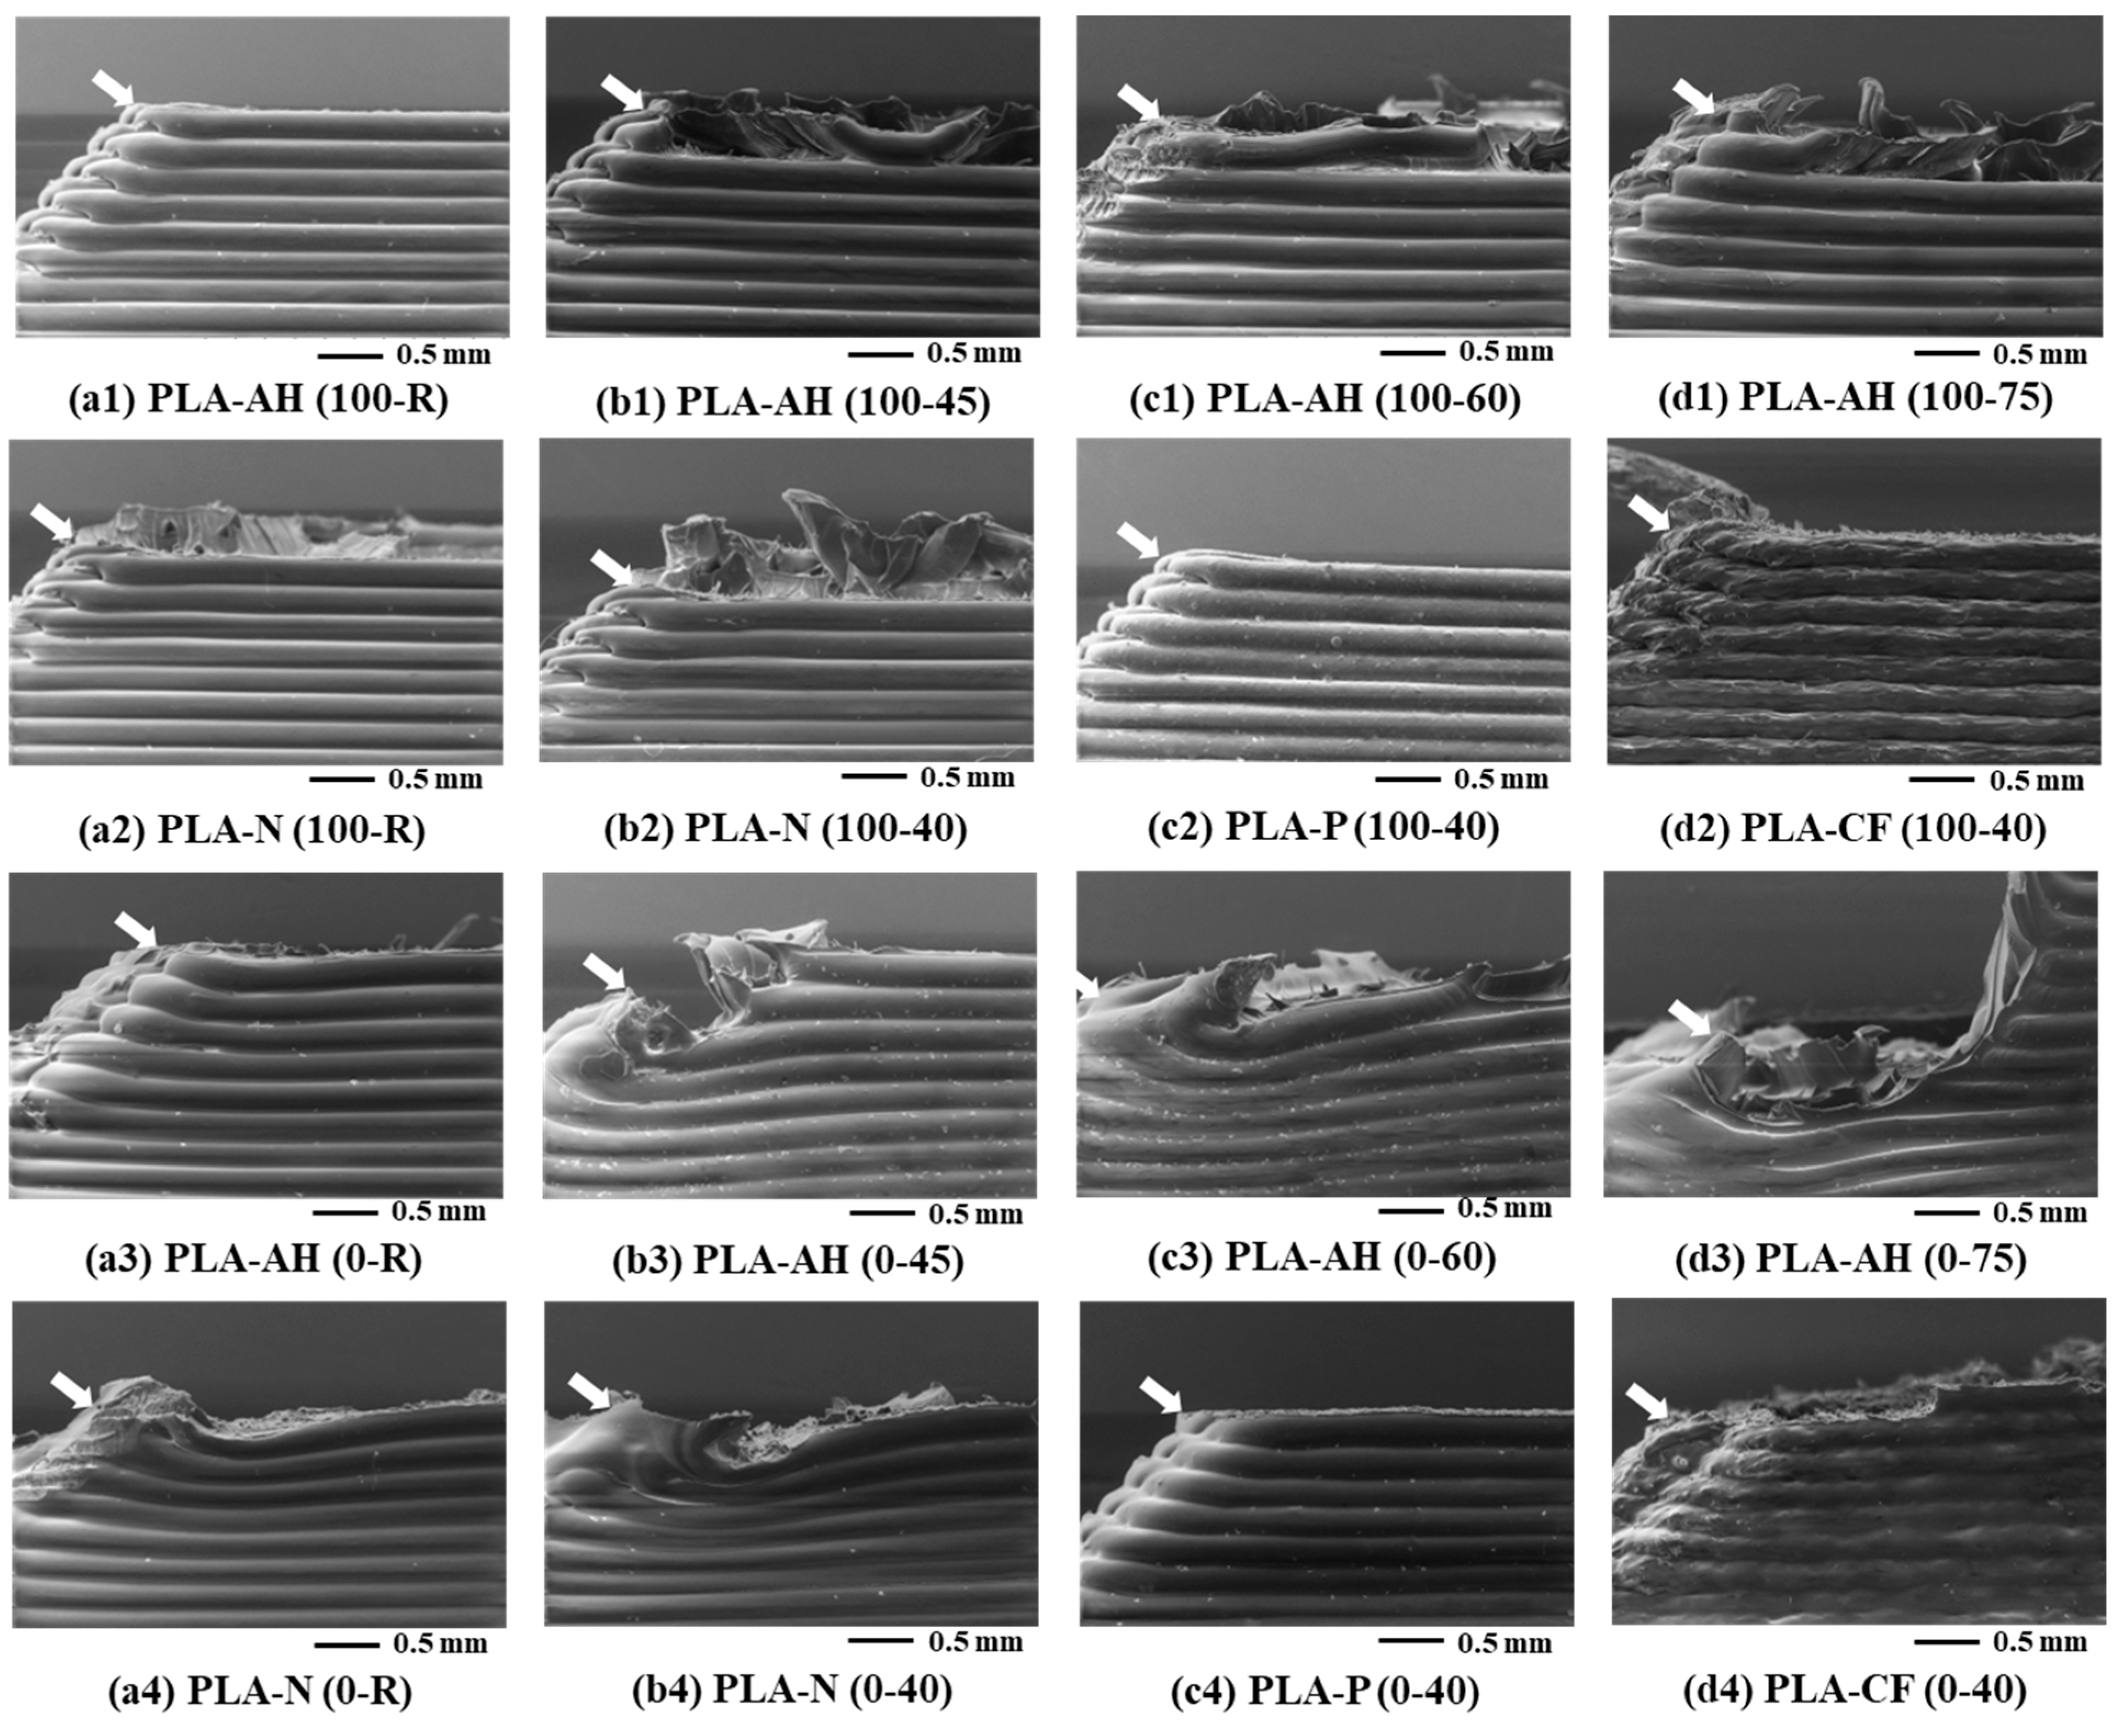
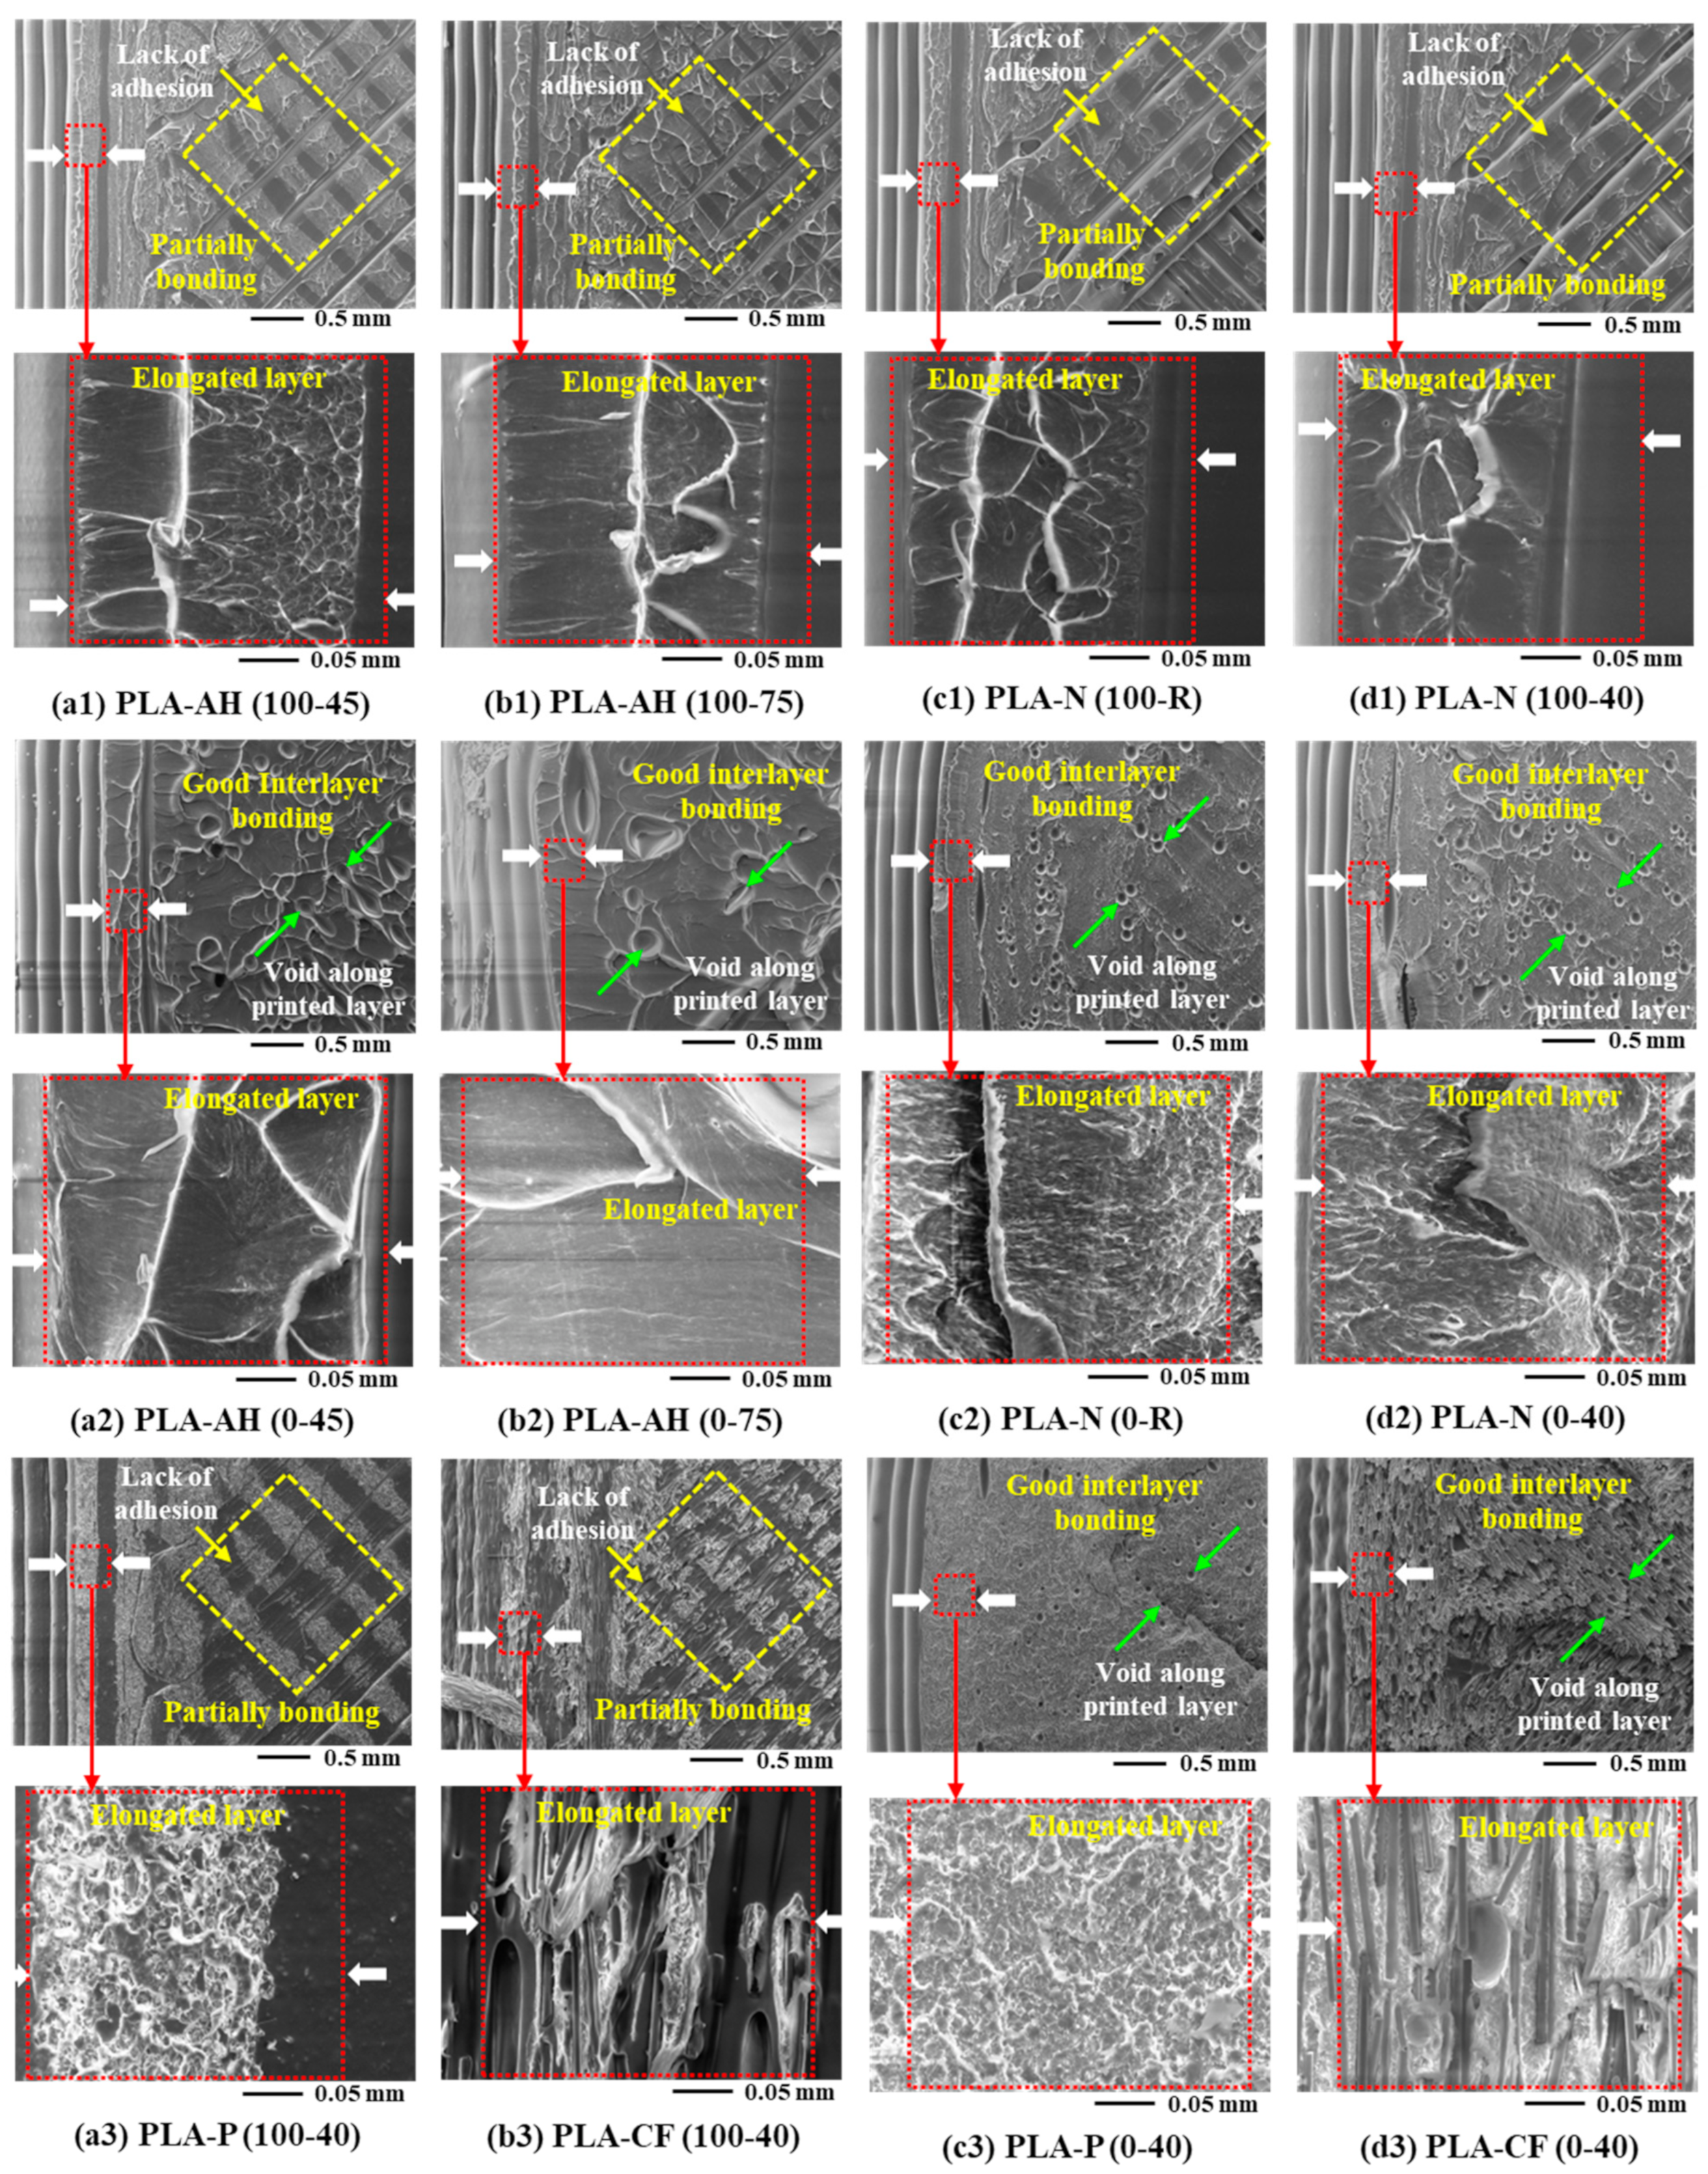
3.6. Morphology of Fractured Surface of 3D Printed Compact Tension Specimen
4. Conclusions
- -
- The heat resistance of the PLA-AH developed by the manufacturer is indicated by the highly crystalline structure of the filament production. This characteristic prevents the PLA-AH from clogging and allows it to be successfully printed at a higher chamber temperature than the PLA glass transition temperature.
- -
- The ambient temperatures from the temperature-controlled chamber and the cooling fan influenced on the 3D printed layer temperatures. The temperature of the printed layer increased with increasing the chamber temperature, especially when printed without the cooling fan. It induced molecular diffusion and increased molecular entanglement between printed layers, resulting in improved interlayer adhesion. The results were indicated by the increment in fracture toughness and the disappearance of the partially layer bonding.
- -
- The crystalline structure and dynamic mechanical properties of the 3D printed products were promoted when additives were incorporated into PLA, which limited printing at the chamber temperature of 40 °C without the cooling fan for the PLA-P and PLA-CF products.
- -
- The interlayer adhesion and the fracture toughness of the PLA-AH and PLA-N specimens increased with increasing chamber temperatures, which related to molecular diffusion of the amorphous characteristic. However, the dimensional stability of the PLA-AH and the PLA-N decreased when printed at the chamber temperature of over 60 °C without the cooling fan. The full factorial design method using ANOVA confirmed the relationship between the fracture toughness and the input parameters (the cooling fan and the chamber temperature). The coded unit regression model can be used for process optimization and quality control for the fracture toughness of the PLA-AH up to the chamber temperature of 75 °C and the PLA-N up to 40 °C.
- -
- The highly crystalline structure of the PLA-L 3D printings exhibited higher dynamic mechanical properties under high ambient temperatures and reported the improvement of interlayer bonding using the degree of entanglement density.
Supplementary Materials
Author Contributions
Funding
Data Availability Statement
Acknowledgments
Conflicts of Interest
References
- Dey, A.; Yodo, N. A Systematic Survey of FDM Process Parameter Optimization and Their Influence on Part Characteristics. J. Manuf. Mater. Process. 2019, 3, 64. [Google Scholar] [CrossRef]
- Vaes, D.; Van Puyvelde, P. Semi-crystalline feedstock for filament-based 3D printing of polymers. Prog. Polym. Sci. 2021, 118, 101411. [Google Scholar] [CrossRef]
- Jandyal, A.; Chaturvedi, I.; Wazir, I.; Raina, A.; Haq, M.I.U. 3D printing – A review of processes, materials and applications in industry 4.0. Sustain. Oper. Comput. 2021, 3, 33–42. [Google Scholar] [CrossRef]
- Frone, A.N.; Batalu, D.; Chiulan, I.; Oprea, M.; Gabor, A.R.; Nicolae, C.-A.; Raditoiu, V.; Trusca, R.; Panaitescu, D.M. Morpho-Structural, Thermal and Mechanical Properties of PLA/PHB/Cellulose Biodegradable Nanocomposites Obtained by Compression Molding, Extrusion, and 3D Printing. Nanomaterials 2019, 10, 51. [Google Scholar] [CrossRef] [PubMed]
- Bhagia, S.; Bornani, K.; Agrawal, R.; Satlewal, A.; Ďurkovič, J.; Lagaňa, R.; Bhagia, M.; Yoo, C.G.; Zhao, X.; Kunc, V.; et al. Critical review of FDM 3D printing of PLA biocomposites filled with biomass resources, characterization, biodegradability, upcycling and opportunities for biorefineries. Appl. Mater. Today 2021, 24, 101078. [Google Scholar] [CrossRef]
- Benwood, C.; Anstey, A.; Andrzejewski, J.; Misra, M.; Mohanty, A.K. Improving the Impact Strength and Heat Resistance of 3D Printed Models: Structure, Property, and Processing Correlationships during Fused Deposition Modeling (FDM) of Poly(Lactic Acid). ACS Omega 2018, 3, 4400–4411. [Google Scholar] [CrossRef]
- Prasong, W.; Muanchan, P.; Ishigami, A.; Thumsorn, S.; Kurose, T.; Ito, H. Properties of 3D Printable Poly(lactic acid)/Poly(butylene adipate-co-terephthalate) Blends and Nano Talc Composites. J. Nanomater. 2020, 2020, 8040517. [Google Scholar] [CrossRef]
- Butt, J.; Bhaskar, R. Investigating the Effects of Annealing on the Mechanical Properties of FFF-Printed Thermoplastics. J. Manuf. Mater. Process. 2020, 4, 38. [Google Scholar] [CrossRef]
- Tully, J.J.; Meloni, G.N. A Scientist’s Guide to Buying a 3D Printer: How to Choose the Right Printer for Your Laboratory. Anal. Chem. 2020, 92, 14853–14860. [Google Scholar] [CrossRef]
- Turner, B.N.; Strong, R.; Gold, S.A. A review of melt extrusion additive manufacturing processes: I. Process design and modeling. Rapid Prototyp. J. 2014, 20, 192–204. [Google Scholar] [CrossRef]
- Kristiawan, R.B.; Imaduddin, F.; Ariawan, D.; Ubaidillah; Arifin, Z. A review on the fused deposition modeling (FDM) 3D printing: Filament processing, materials, and printing parameters. Open Eng. 2021, 11, 639–649. [Google Scholar] [CrossRef]
- Braconnier, D.J.; Jensen, R.E.; Peterson, A.M. Processing parameter correlations in material extrusion additive manufacturing. Addit. Manuf. 2020, 31, 100924. [Google Scholar] [CrossRef]
- Vyavahare, S.; Teraiya, S.; Kumar, S. Auxetic structures fabricated by material extrusion: An experimental investigation of gradient parameters. Rapid Prototyp. J. 2021, 27, 1041–1058. [Google Scholar] [CrossRef]
- Stavropoulos, P.; Foteinopoulos, P. Modelling of additive manufacturing processes: A review and classification. Manuf. Rev. 2018, 5, 2. [Google Scholar] [CrossRef]
- Das, A.; Riet, J.A.; Bortner, M.J.; McIlroy, C. Rheology, crystallization, and process conditions: The effect on interlayer properties in three-dimensional printing. Phys. Fluids 2022, 34, 123108. [Google Scholar] [CrossRef]
- Yin, J.; Lu, C.; Fu, J.; Huang, Y.; Zheng, Y. Interfacial bonding during multi-material fused deposition modeling (FDM) process due to inter-molecular diffusion. Mater. Des. 2018, 150, 104–112. [Google Scholar] [CrossRef]
- Aliheidari, N.; Christ, J.; Tripuraneni, R.; Nadimpalli, S.; Ameli, A. Interlayer adhesion and fracture resistance of polymers printed through melt extrusion additive manufacturing process. Mater. Des. 2018, 156, 351–361. [Google Scholar] [CrossRef]
- Levenhagen, N.P.; Dadmun, M.D. Interlayer diffusion of surface segregating additives to improve the isotropy of fused deposition modeling products. Polymer 2018, 152, 35–41. [Google Scholar] [CrossRef]
- McIlroy, C.; Olmsted, P.D. Disentanglement effects on welding behaviour of polymer melts during the fused-filament-fabrication method for additive manufacturing. Polymer 2017, 123, 376–391. [Google Scholar] [CrossRef]
- Prasong, W.; Ishigami, A.; Thumsorn, S.; Kurose, T.; Ito, H. Improvement of Interlayer Adhesion and Heat Resistance of Biodegradable Ternary Blend Composite 3D Printing. Polymers 2021, 13, 740. [Google Scholar] [CrossRef]
- Aw, Y.Y.; Yeoh, C.K.; Idris, M.A.; Teh, P.L.; Hamzah, K.A.; Sazali, S.A. Effect of Printing Parameters on Tensile, Dynamic Mechanical, and Thermoelectric Properties of FDM 3D Printed CABS/ZnO Composites. Materials 2018, 11, 466. [Google Scholar] [CrossRef] [PubMed]
- Thumsorn, S.; Prasong, W.; Kurose, T.; Ishigami, A.; Kobayashi, Y.; Ito, H. Rheological Behavior and Dynamic Mechanical Properties for Interpretation of Layer Adhesion in FDM 3D Printing. Polymers 2022, 14, 2721. [Google Scholar] [CrossRef]
- Geng, P.; Zhao, J.; Wu, W.; Wang, Y.; Wang, B.; Wang, S.; Li, G. Effect of Thermal Processing and Heat Treatment Condition on 3D Printing PPS Properties. Polymers 2018, 10, 875. [Google Scholar] [CrossRef] [PubMed]
- Kuznetsov, V.E.; Solonin, A.N.; Tavitov, A.; Urzhumtsev, O.; Vakulik, A. Increasing strength of FFF three-dimensional printed parts by influencing on temperature-related parameters of the process. Rapid Prototyp. J. 2020, 26, 107–121. [Google Scholar] [CrossRef]
- Harris, M.; Potgieter, J.; Archer, R.; Arif, K.M. In-process thermal treatment of polylactic acid in fused deposition modelling. Mater. Manuf. Process. 2019, 34, 701–713. [Google Scholar] [CrossRef]
- Rydz, J.; Włodarczyk, J.; Ausejo, J.G.; Musioł, M.; Sikorska, W.; Sobota, M.; Hercog, A.; Duale, K.; Janeczek, H. Three-Dimensional Printed PLA and PLA/PHA Dumbbell-Shaped Specimens: Material Defects and Their Impact on Degradation Behavior. Materials 2020, 13, 2005. [Google Scholar] [CrossRef]
- Ahmad, M.N.; Ishak, M.R.; Taha, M.M.; Mustapha, F.; Leman, Z. Investigation of ABS–oil palm fiber (Elaeis guineensis) composites filament as feedstock for fused deposition modeling. Rapid Prototyp. J. 2022. [Google Scholar] [CrossRef]
- Lau, K.-T.; Taha, M.M.; Rashid, N.H.A.; Manogaran, D.; Ahmad, M.N. Effect of hBN Fillers on Rheology Property and Surface Microstructure of ABS Extrudate. J. Teknol. 2022, 84, 175–182. [Google Scholar] [CrossRef]
- Ru, J.-F.; Yang, S.-G.; Zhou, D.; Yin, H.-M.; Lei, J.; Li, Z.-M. Dominant β-Form of Poly(l-lactic acid) Obtained Directly from Melt under Shear and Pressure Fields. Macromolecules 2016, 49, 3826–3837. [Google Scholar] [CrossRef]
- Ji, N.; Hu, G.; Li, J.; Ren, J. Influence of poly(lactide) stereocomplexes as nucleating agents on the crystallization behavior of poly(lactide)s. RSC Adv. 2019, 9, 6221–6227. [Google Scholar] [CrossRef] [Green Version]
- Di Lorenzo, M.L.; Androsch, R. Influence of α′-/α-crystal polymorphism on properties of poly(l-lactic acid). Polym. Int. 2018, 68, 320–334. [Google Scholar] [CrossRef]
- Tábi, T.; Sajó, I.E.; Szabó, F.; Luyt, A.S.; Kovacs, J.G. Crystalline structure of annealed polylactic acid and its relation to processing. Express Polym. Lett. 2010, 4, 659–668. [Google Scholar] [CrossRef]
- Liao, Y.; Liu, C.; Coppola, B.; Barra, G.; Di Maio, L.; Incarnato, L.; Lafdi, K. Effect of Porosity and Crystallinity on 3D Printed PLA Properties. Polymers 2019, 11, 1487. [Google Scholar] [CrossRef]
- Yu, W.; Wang, X.; Ferraris, E.; Zhang, J. Melt crystallization of PLA/Talc in fused filament fabrication. Mater. Des. 2019, 182, 108013. [Google Scholar] [CrossRef]
- Xu, W.; Pranovich, A.; Uppstu, P.; Wang, X.; Kronlund, D.; Hemming, J.; Öblom, H.; Moritz, N.; Preis, M.; Sandler, N.; et al. Novel biorenewable composite of wood polysaccharide and polylactic acid for three dimensional printing. Carbohydr. Polym. 2018, 187, 51–58. [Google Scholar] [CrossRef]
- Prasong, W.; Ishigami, A.; Thumsorn, S.; Kurose, T.; Ito, H. Influence of ambient temperature on interlayer adhesion of thermoplastic materials in FDM 3D printing. In Proceedings of the Seikei-Kakou Annual Meeting, 2021, online, 17 June 2021; pp. 39–40. [Google Scholar]
- Prasong, W. Study on 3D Printability and Engineering Properties of Biodegradable Polymer Blends and Composites. Ph.D. Thesis, Yamagata University, Yamagata, Japan, 2021. [Google Scholar]
- Thumsorn, S.; Prasong, W.; Ishigami, A.; Kobayashi, Y.; Ito, H. Role of poly(lactic acid) crystallinity in fused deposition modelling 3D printing. In Proceedings of the Seikei-Kakou Autumn Meeting, 2021, online, 1 December 2021; pp. 43–44. [Google Scholar]
- Hitachi High-Tech Science Corporation. TA No. 81 Thermal Analysis of Polylactic Acid. 2007. Available online: https://www.hitachi-hightech.com/file/global/pdf/products/science/appli/ana/thermal/application_TA_081e.pdf (accessed on 7 November 2022).
- Vadas, D.; Nagy, Z.K.; Csontos, I.; Marosi, G.; Bocz, K. Effects of thermal annealing and solvent-induced crystallization on the structure and properties of poly(lactic acid) microfibres produced by high-speed electrospinning. J. Therm. Anal. Calorim. 2020, 142, 581–594. [Google Scholar] [CrossRef]
- Thomas, L.C. Modulated DSC® Paper #6 Measurement of Initial Crystallinity in Semi-crystalline Polymers. TA Instrum. 2005, TP011, 1–9. [Google Scholar]
- TA Instruments. TA384 Thermal Analysis Investigation of a Poly(Lactic acid) Biodegradable Plastic. 2007. Available online: https://www.tainstruments.com/pdf/literature/TA384%20Thermal%20Analysis%20Investigation%20of%20a%20Polylactic%20Acid%20Biodegradable%20Plastic.pdf (accessed on 7 November 2022).
- Ljungberg, N.; Wesslén, B. Preparation and Properties of Plasticized Poly(lactic acid) Films. Biomacromolecules 2005, 6, 1789–1796. [Google Scholar] [CrossRef]
- PerkinElmer, Inc. Dynamic Mechanical Analysis (DMA) A Beginner’s Guide. 2008. Available online: https://resources.perkinelmer.com/corporate/cmsresources/images/44-74546gde_introductiontodma.pdf (accessed on 7 November 2022).
- Cristea, M.; Ionita, D.; Iftime, M.M. Dynamic Mechanical Analysis Investigations of PLA-Based Renewable Materials: How Are They Useful? Materials 2020, 13, 5302. [Google Scholar] [CrossRef]
- Panaitescu, D.M.; Ionita, E.R.; Nicolae, C.-A.; Gabor, A.R.; Ionita, M.D.; Trusca, R.; Lixandru, B.-E.; Codita, I.; Dinescu, G. Poly(3-hydroxybutyrate) Modified by Nanocellulose and Plasma Treatment for Packaging Applications. Polymers 2018, 10, 1249. [Google Scholar] [CrossRef]
- Jyoti, J.; Singh, B.P.; Arya, A.K.; Dhakate, S.R. Dynamic mechanical properties of multiwall carbon nanotube reinforced ABS composites and their correlation with entanglement density, adhesion, reinforcement and C factor. RSC Adv. 2015, 6, 3997–4006. [Google Scholar] [CrossRef]
- Montgomery, D.C. Design and Analysis of Experiments, 8th ed.; Jonh Wiley & Sons, Inc.: New York, NY, USA, 2012. [Google Scholar]
- Deeying, J.; Asawarungsaengkul, K.; Chutima, P. Multi-objective optimization on laser solder jet bonding process in head gimbal assembly using the response surface methodology. Opt. Laser Technol. 2018, 98, 158–168. [Google Scholar] [CrossRef]
- Nadondu, B.; Surin, P.; Deeying, J. Multi-objective optimization on mechanical properties of glass-carbon and durian skin fiber reinforced poly(lactic acid) hybrid composites using the extreme mixture design response surface methodology. Case Stud. Constr. Mater. 2022, 17, e01675. [Google Scholar] [CrossRef]


| Designation | Polymer | Composition | Color | Remark |
|---|---|---|---|---|
| PLA-N | PLA | Neat [18] | Natural (Opaque) | Commercial |
| PLA-AH | PLA | 1 wt.% Additive and Heat-treatment | Natural (Opaque) | Commercial |
| PLA-P | PLA | 5 wt.% particle filler [18] | White | Commercial |
| PLA-CF | PLA | 15 wt.% carbon fiber [18] | Black | Commercial |
| PLA-L | PLA | 99.9% of L-isomer | Clear (Transparent) | Laboratory made |
| Parameter | Condition |
|---|---|
| Nozzle Temperature | 210 °C |
| Bed Temperature (Default) | 40 °C |
| Chamber Temperature | Room/40/45/60/75 °C |
| Cooling fan | On (fan 100%)/Off (fan 0%) |
| Printing Speed | 25 mm/s |
| Infill Density | 100% |
| Infill Type | Rectilinear |
| Layer Height | 0.2 mm |
| Shell Thickness | 2 layers |
| Material | Total Heat Flow | Nonreversible Heat Flow | Reversible Heat Flow | Initial Xc | |||||
|---|---|---|---|---|---|---|---|---|---|
| ΔHTotal * (J/g) | Tcc (°C) | Tpre-melt (°C) | Tm (°C) | ΔHnon ** (J/g) | Tg (°C) | Tm (°C) | ΔHrev *** (J/g) | ΔHrev–ΔHnon (J/g) | |
| PLA-AH | 35.6 | - | - | 145.9, 152.3 | 30.2 | 62.0 | 146.4, 155.7 | 5.8 | −24.4 |
| PLA-N | 5.0 | 92.0 | 151.8 | 167.3 | 8.5 | 63.1 | 151.6, 161.1, 169.7 | 16.2 | 7.7 |
| PLA-P | 5.0 | 87.2 | 150.5 | 167.4 | 6.2 | 61.3 | 150.1, 161.1, 170.1 | 13.1 | 6.9 |
| PLA-CF | 9.5 | 81.8 | 148.4 | 165.6 | 12.3 | 62.0 | 148.8, 162.0, 167.2 | 24.8 | 12.5 |
| PLA-L | 19.7 | 87.0 | 155.6 | 174.7 | 2.3 | 57.9 | 155.6, 169.5, 175.1 | 22.0 | 19.7 |
| Material | Total Heat Flow | Nonreversible Heat Flow | Reversible Heat Flow | Initial Xc | |||||
|---|---|---|---|---|---|---|---|---|---|
| ΔHTotal * (J/g) | Tcc (°C) | Tpre-melt (°C) | Tm (°C) | ΔHnon ** (J/g) | Tg (°C) | Tm (°C) | ΔHrev *** (J/g) | ΔHrev−ΔHnon (J/g) | |
| PLA-AH (100-R) | 2.6 | 111.1 | - | 149.7 | 1.2 | 59.4 | 141.9, 154.9 | 1.4 | 0.2 |
| PLA-AH (100-45) | 2.3 | 112.9 | - | 149.7 | 1.1 | 59.2 | 140.9, 153.9 | 1.4 | 0.3 |
| PLA-AH (100-60) | 2.6 | 116.7 | - | 149.6 | 2.6 | 60.2 | 140.9, 154.6 | 0.2 | −2.4 |
| PLA-AH (100-75) | 3.0 | 118.4 | - | 149.8 | 2.8 | 60.4 | 141.1, 154.6 | 0.3 | −2.5 |
| PLA-N (100-R) | 3.7 | 102.7 | 152.6 | 167.9 | 15.0 | 60.1 | 151.6, 160.5, 169.0 | 19.2 | 4.2 |
| PLA-N (100-40) | 4.9 | 91.3 | 151.6 | 167.8 | 14.0 | 60.9 | 151.5, 161.9, 168.4 | 19.3 | 5.3 |
| PLA-P (100-R) | 4.9 | 89.8 | 150.8 | 166.9 | 10.6 | 59.8 | 150.7, 160.8, 169.0 | 16.7 | 6.1 |
| PLA-P (100-40) | 5.3 | 89.9 | 150.8 | 167.5 | 12.1 | 59.8 | 150.4, 162.0, 167.4 | 18.4 | 6.3 |
| PLA-CF (100-R) | 8.1 | 84.0 | 148.9 | 166.2 | 15.9 | 60.0 | 148.7, 162.0 | 25.0 | 9.1 |
| PLA-CF (100-40) | 7.0 | 84.5 | 148. | 165.9 | 15.6 | 59.6 | 148.7, 162.4, 168.1 | 24.7 | 9.1 |
| PLA-L (100-R) | 5.9 | 95.3 | 156.8 | 174.0 | 19.0 | 60.7 | 156.8, 169.9, 174.9 | 25.2 | 6.2 |
| PLA-L (100-40) | 3.9 | 95.4 | 157.4 | 174.6 | 11.5 | 60.8 | 157.0, 169.1, 175.4 | 18.4 | 6.9 |
| Material | Total Heat Flow | Nonreversible Heat Flow | Reversible Heat Flow | Initial Xc | |||||
|---|---|---|---|---|---|---|---|---|---|
| ΔHTotal * (J/g) | Tcc (°C) | Tpre-melt (°C) | Tm (°C) | ΔHnon ** (J/g) | Tg (°C) | Tm (°C) | ΔHrev *** (J/g) | ΔHrev–ΔHnon (J/g) | |
| PLA-AH (0-R) | 1.9 | 118.7 | - | 150.8 | 1.4 | 59.6 | 140.5, 154.7 | 0.5 | −0.9 |
| PLA-AH (0-45) | 1.1 | 116.1 | - | 149.8 | 0.02 | 60.1 | 142.0, 154.5 | 1.3 | 1.3 |
| PLA-AH (0-60) | 1.8 | 106.6 | - | 149.3 | 0.6 | 60.0 | 141.9, 154.3 | 2.8 | 2.2 |
| PLA-AH (0-75) | 2.5 | 111.5 | - | 150.3 | 0.7 | 60.9 | 142.3, 154.4 | 1.9 | 1.2 |
| PLA-N (0-R) | 3.9 | 93.1 | 152.1 | 168.1 | 14.9 | 60.4 | 152.0, 161.1, 168.4 | 18.8 | 3.9 |
| PLA-N (0-40) | 4.4 | 92.9 | 152.2 | 167.7 | 11.2 | 60.6 | 152.4, 160.3, 169.4 | 16.6 | 5.4 |
| PLA-P (0-R) | 40.2 | - | 157.5 | 167.6 | 15.3 | 61.6 | 160.4, 168.8 | 26.7 | 11.4 |
| PLA-P (0-40) | 42.5 | - | 156.8 | 17.7 | 62.6 | 160.2, 169.8 | 24.5 | 6.8 | |
| PLA-CF (0-R) | 6.5 | 85.0 | 148.9 | 166.2 | 15.0 | 59.8 | 148.7, 161.7 | 22.6 | 7.6 |
| PLA-CF (0-40) | 7.7 | 84.8 | 148.8 | 166.0 | 13.1 | 59.9 | 148.6, 161.9 | 23.0 | 9.9 |
| PLA-L (0-R) | 6.1 | 96.4 | 156.8 | 174.3 | 14.7 | 60.5 | 157.2, 169.4, 175.5 | 20.7 | 6.0 |
| PLA-L (0-40) | 10.0 | 95.2 | 157.4 | 174.6 | 6.2 | 60.4 | 157.1, 169.2, 175.3 | 18.8 | 12.6 |
| Material | at 35 °C (GPa) | Tg * (°C) | Tan δ * | N × 104 (mol/m3) | ||||||||||||
|---|---|---|---|---|---|---|---|---|---|---|---|---|---|---|---|---|
| R | 40, 45 | 60 | 75 | R | 40, 45 | 60 | 75 | R | 40, 45 | 60 | 75 | R | 40, 45 | 60 | 75 | |
| PLA-AH 100 | 2.5 | 2.5 | 2.6 | 2.8 | 65.0 | 65.6 | 65.4 | 65.4 | 2.3 | 2.4 | 2.8 | 2.7 | 2.3 | 2.5 | 3.9 | 4.2 |
| PLA-AH 0 | 2.7 | 2.7 | 2.7 | 2.8 | 65.6 | 65.4 | 65.5 | 65.5 | 2.6 | 2.6 | 2.8 | 2.7 | 2.9 | 3.4 | 3.7 | 4.7 |
| PLA-N 100 | 2.8 | 2.8 | 66.4 | 67.5 | 2.5 | 2.5 | 3.7 | 4.4 | ||||||||
| PLA-N 0 | 2.9 | 2.7 | 66.9 | 66.8 | 2.4 | 2.3 | 3.9 | 4.5 | ||||||||
| PLA-P 100 | 2.7 | 2.8 | 66.9 | 67.6 | 2.4 | 2.3 | 3.5 | 3.9 | ||||||||
| PLA-P 0 | 3.3 | 2.9 | 65.9 | 65.4 | 0.3 | 0.3 | 11.3 | 9.7 | ||||||||
| PLA-CF 100 | 7.3 | 7.2 | 66.9 | 67.6 | 1.8 | 1.8 | 8.2 | 8.6 | ||||||||
| PLA-CF 0 | 7.2 | 7.4 | 65.6 | 66.0 | 1.1 | 1.3 | 10.5 | 10.8 | ||||||||
| PLA-L 100 | 2.5 | 2.6 | 65.3 | 65.3 | 2.2 | 2.1 | 3.5 | 4.1 | ||||||||
| PLA-L 0 | 2.6 | 2.5 | 66.6 | 65.6 | 1.1 | 1.3 | 5.3 | 5.4 | ||||||||
| Material | Sample Temperature (°C) | Printed Layer Temperature (°C) | ||||||||||||||
|---|---|---|---|---|---|---|---|---|---|---|---|---|---|---|---|---|
| Fan 100 | Fan 0 | Fan 100 | Fan 0 | |||||||||||||
| R | 40, 45 | 60 | 75 | R | 40, 45 | 60 | 75 | R | 40, 45 | 60 | 75 | R | 40, 45 | 60 | 75 | |
| PLA-AH | 41 | 50 | 66 | 83 | 54 | 56 | 71 | 86 | 52 | 62 | 80 | 95 | 110 | 117 | 125 | 132 |
| PLA-N | 44 | 45 | 54 | 56 | 52 | 57 | 111 | 115 | ||||||||
| PLA-P | 44 | 46 | 50 | 53 | 53 | 57 | 110 | 115 | ||||||||
| PLA-CF | 43 | 46 | 50 | 53 | 50 | 55 | 106 | 110 | ||||||||
Disclaimer/Publisher’s Note: The statements, opinions and data contained in all publications are solely those of the individual author(s) and contributor(s) and not of MDPI and/or the editor(s). MDPI and/or the editor(s) disclaim responsibility for any injury to people or property resulting from any ideas, methods, instructions or products referred to in the content. |
© 2023 by the authors. Licensee MDPI, Basel, Switzerland. This article is an open access article distributed under the terms and conditions of the Creative Commons Attribution (CC BY) license (https://creativecommons.org/licenses/by/4.0/).
Share and Cite
Thumsorn, S.; Prasong, W.; Ishigami, A.; Kurose, T.; Kobayashi, Y.; Ito, H. Influence of Ambient Temperature and Crystalline Structure on Fracture Toughness and Production of Thermoplastic by Enclosure FDM 3D Printer. J. Manuf. Mater. Process. 2023, 7, 44. https://doi.org/10.3390/jmmp7010044
Thumsorn S, Prasong W, Ishigami A, Kurose T, Kobayashi Y, Ito H. Influence of Ambient Temperature and Crystalline Structure on Fracture Toughness and Production of Thermoplastic by Enclosure FDM 3D Printer. Journal of Manufacturing and Materials Processing. 2023; 7(1):44. https://doi.org/10.3390/jmmp7010044
Chicago/Turabian StyleThumsorn, Supaphorn, Wattanachai Prasong, Akira Ishigami, Takashi Kurose, Yutaka Kobayashi, and Hiroshi Ito. 2023. "Influence of Ambient Temperature and Crystalline Structure on Fracture Toughness and Production of Thermoplastic by Enclosure FDM 3D Printer" Journal of Manufacturing and Materials Processing 7, no. 1: 44. https://doi.org/10.3390/jmmp7010044