
Investigation of the Pull-Out Behaviour of Metal Threaded Inserts in Thermoplastic Fused-Layer Modelling (FLM) Components
 , , , , and
Abstract
:1. Introduction
2. Materials and Methods
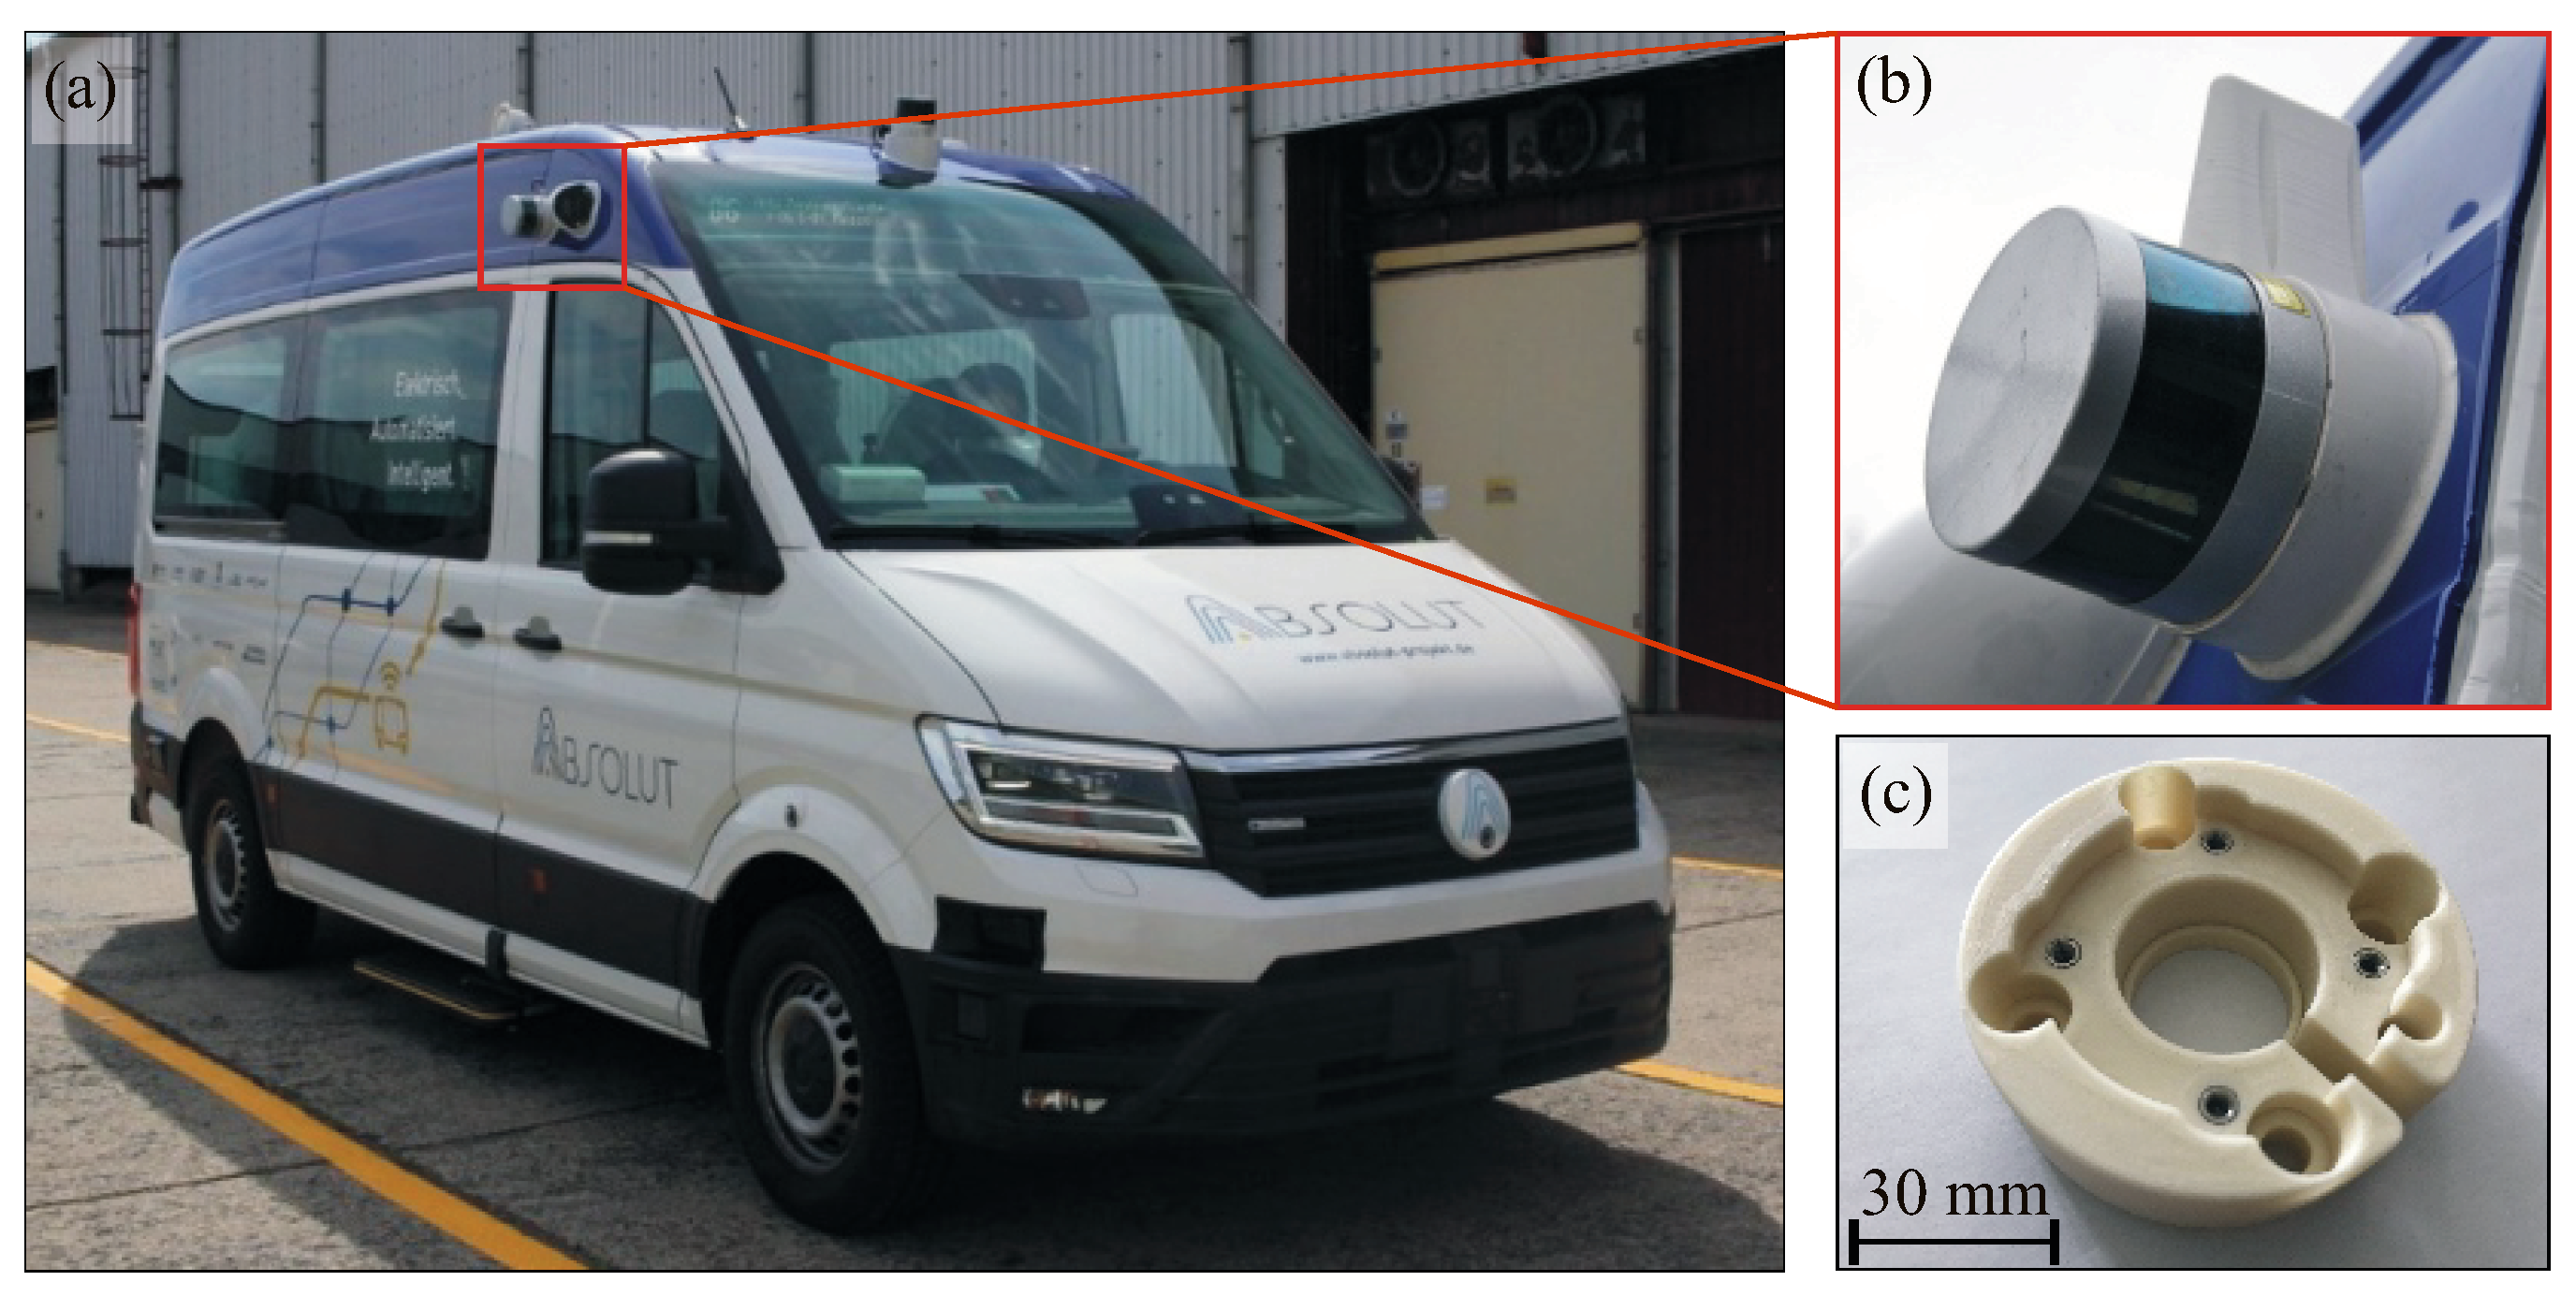
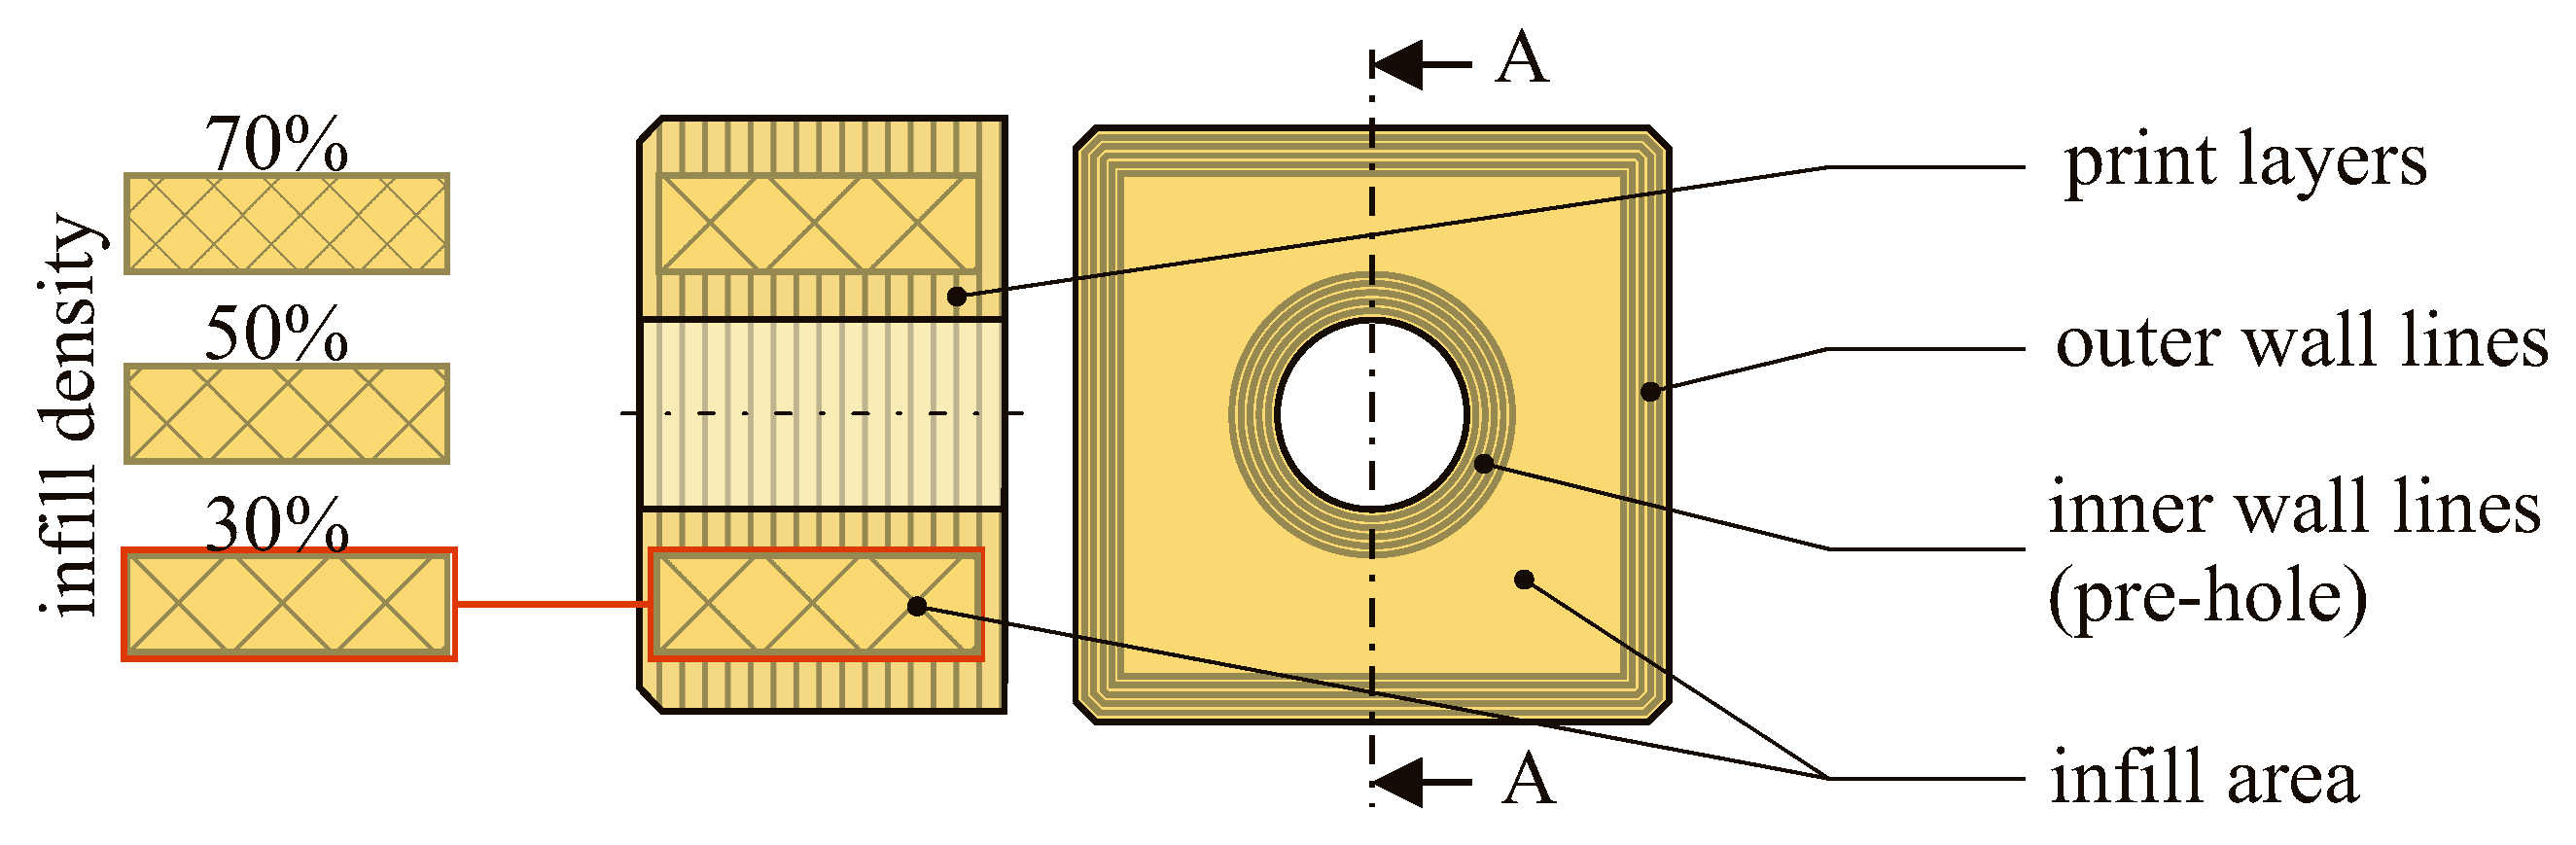
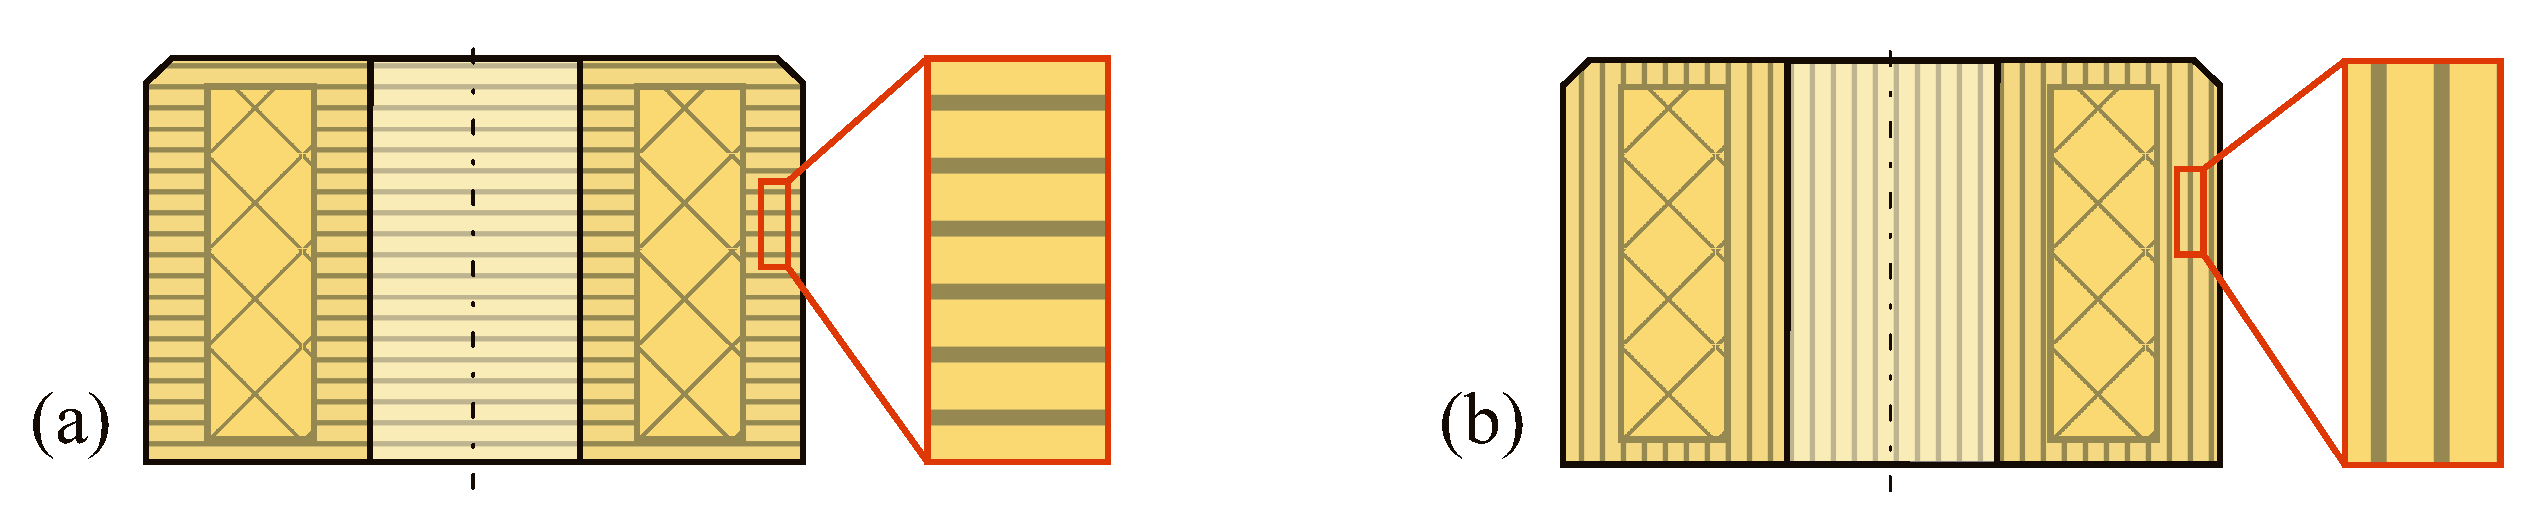
2.1. Materials and Specimen Manufacturing
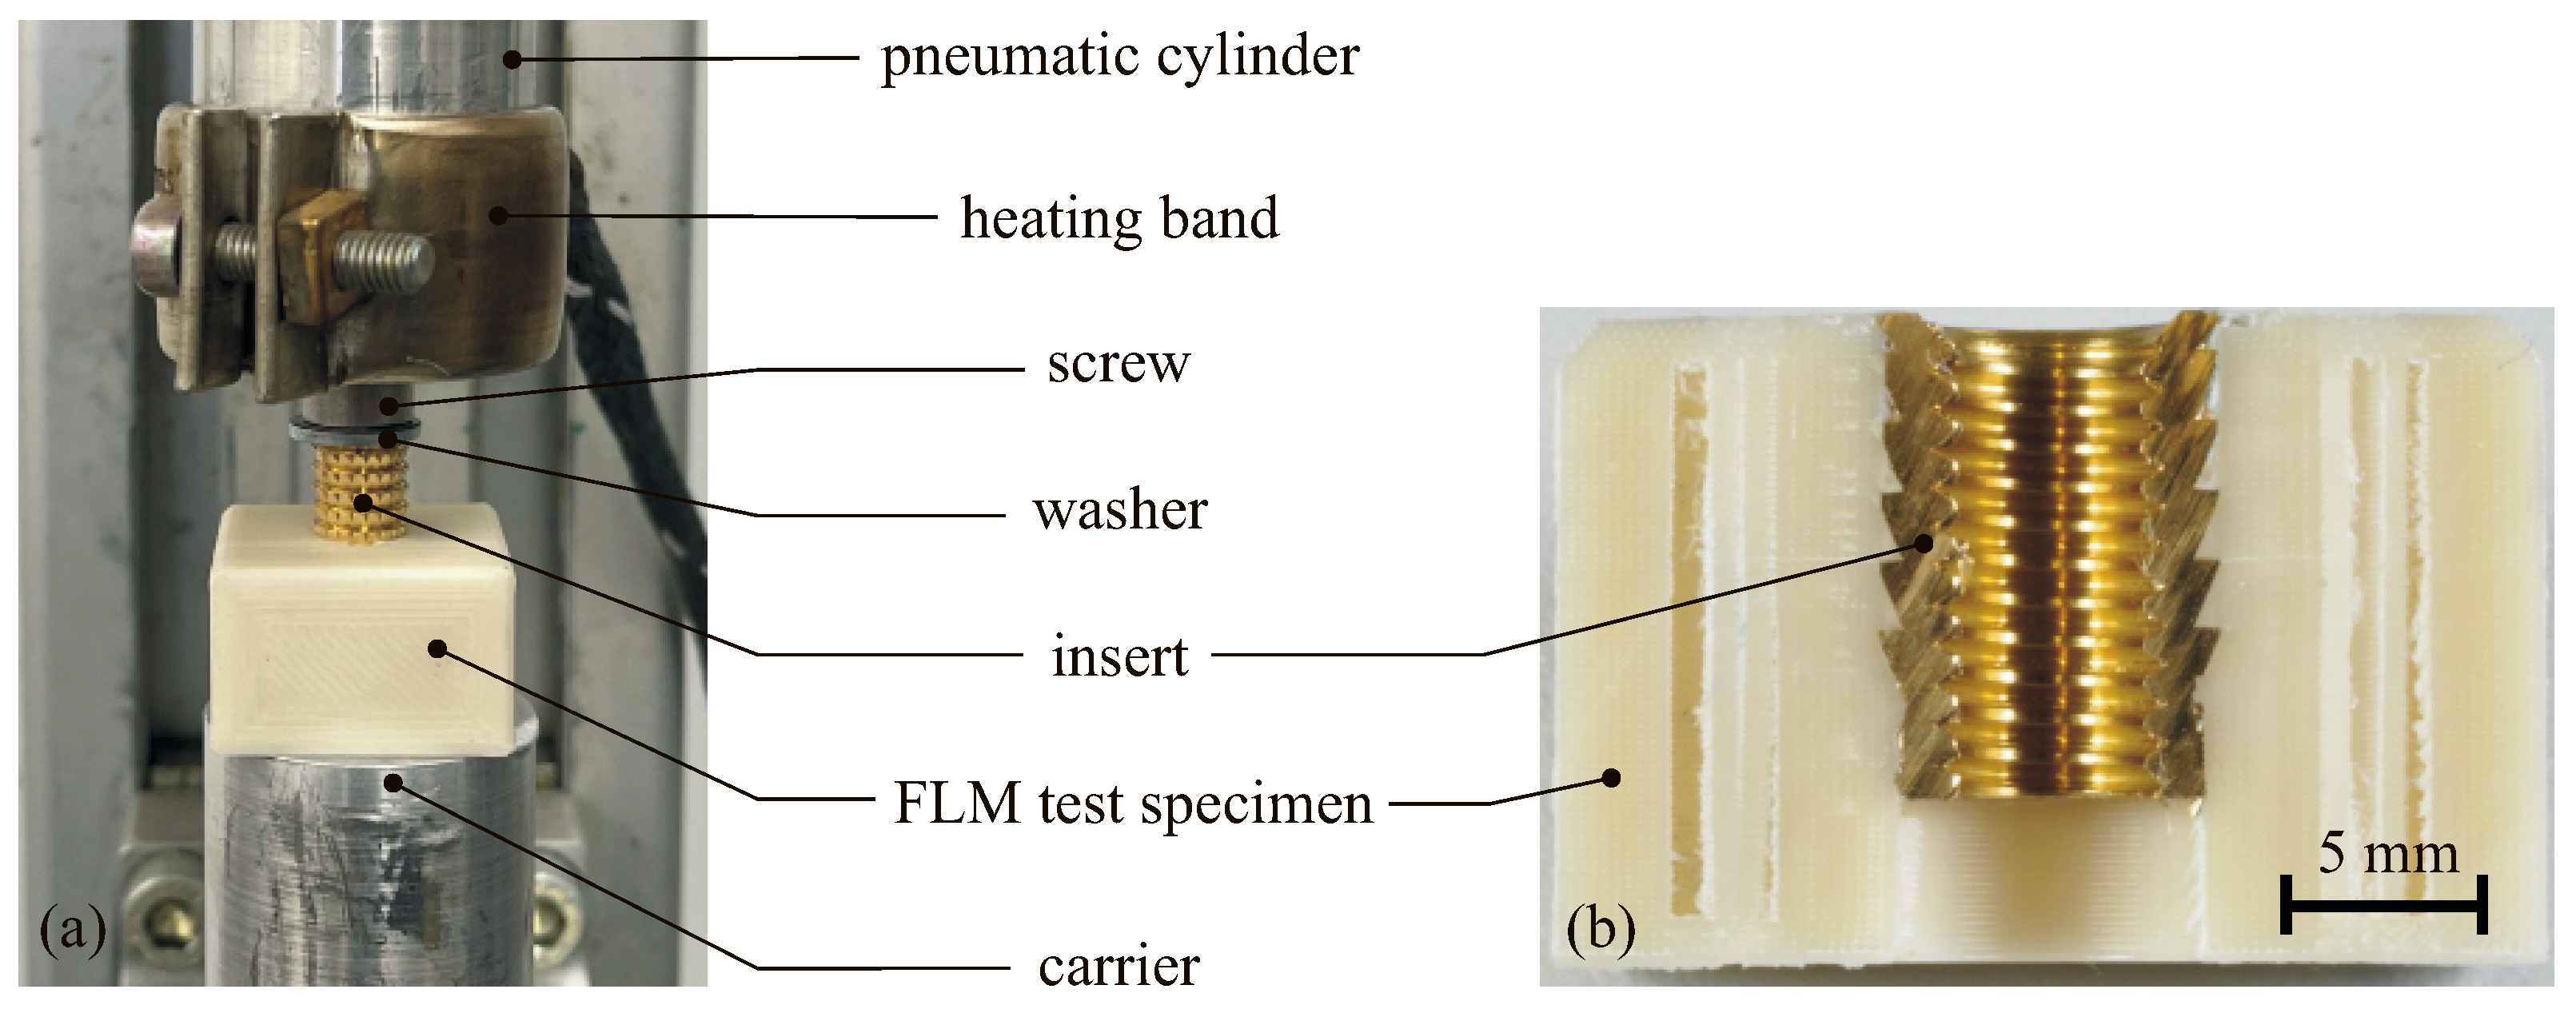
2.2. Embedding of Threaded Inserts
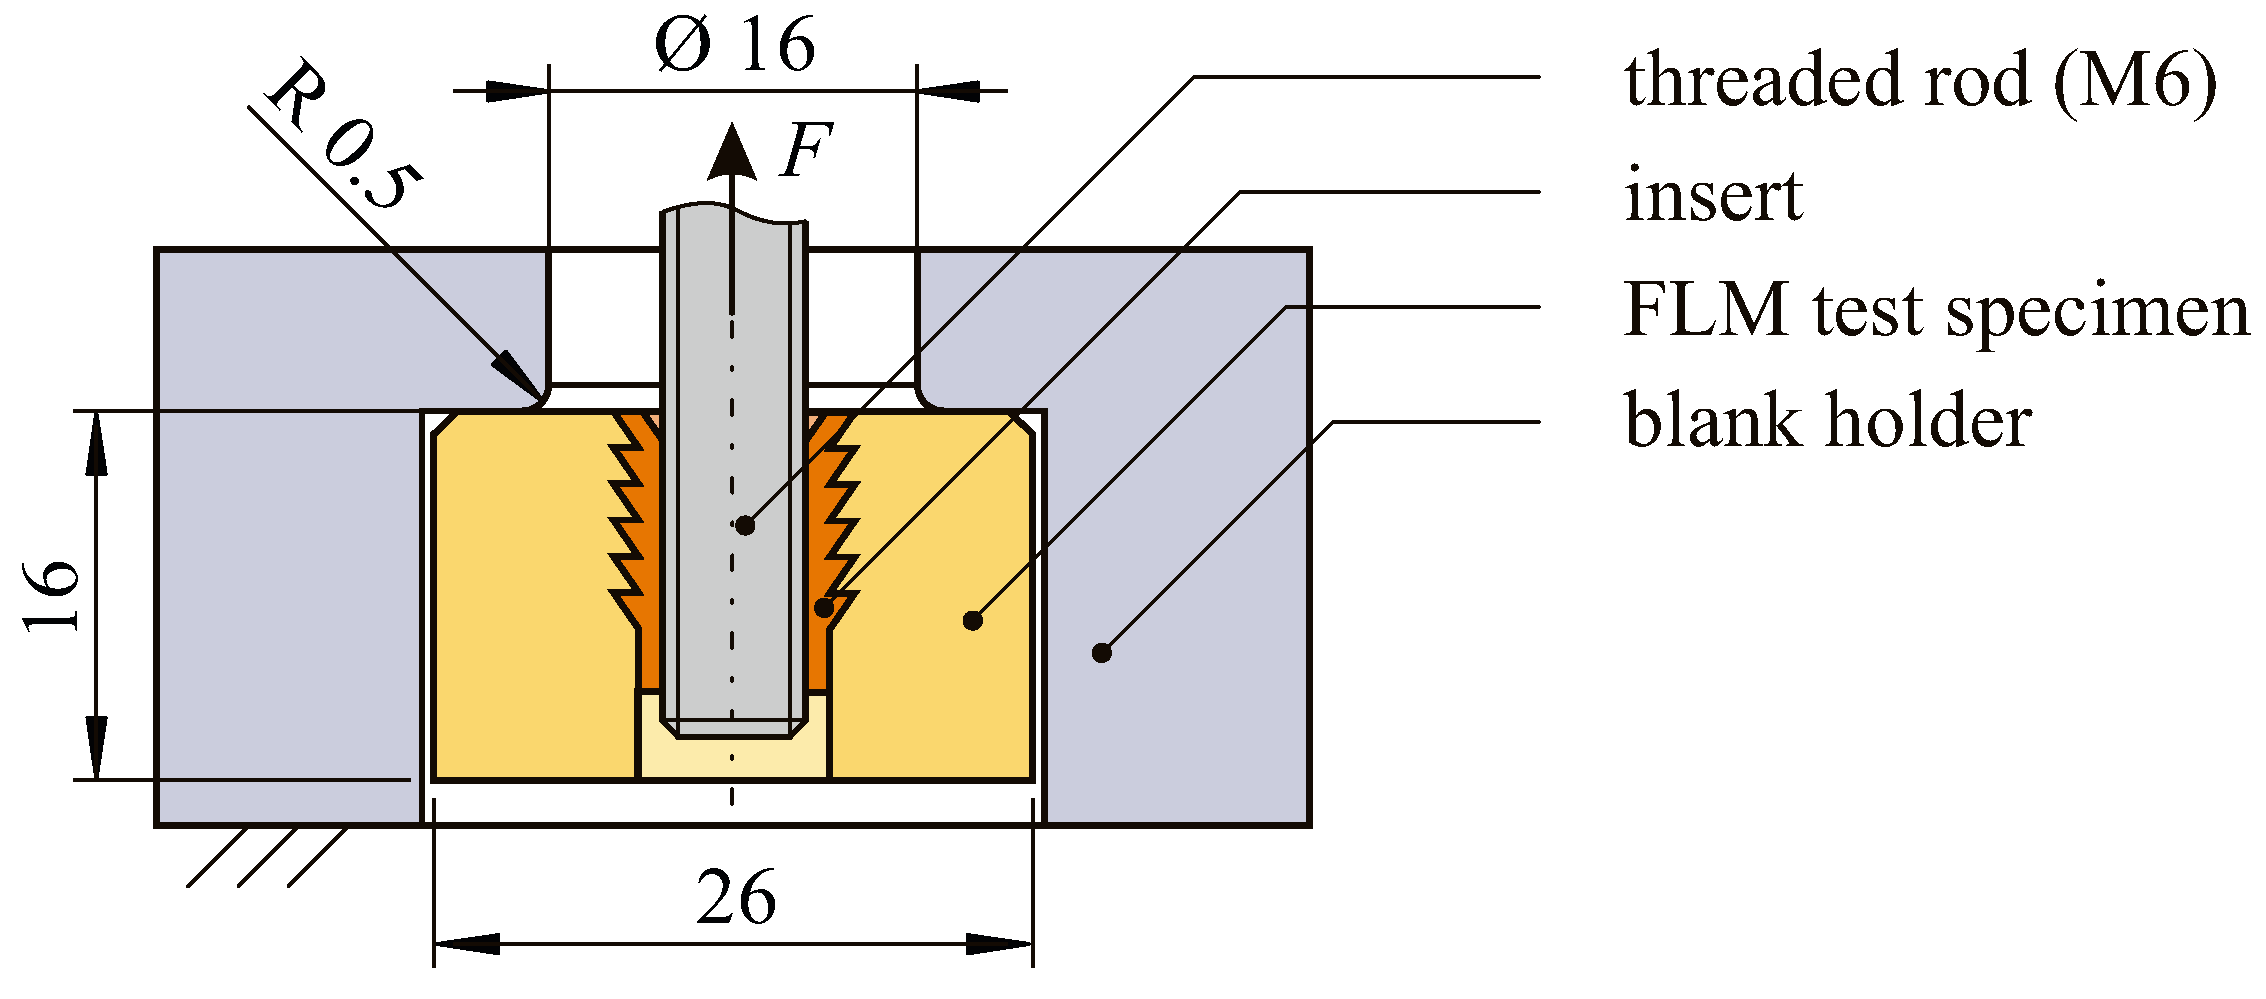
2.3. Test Set-Up
3. Results and Discussion
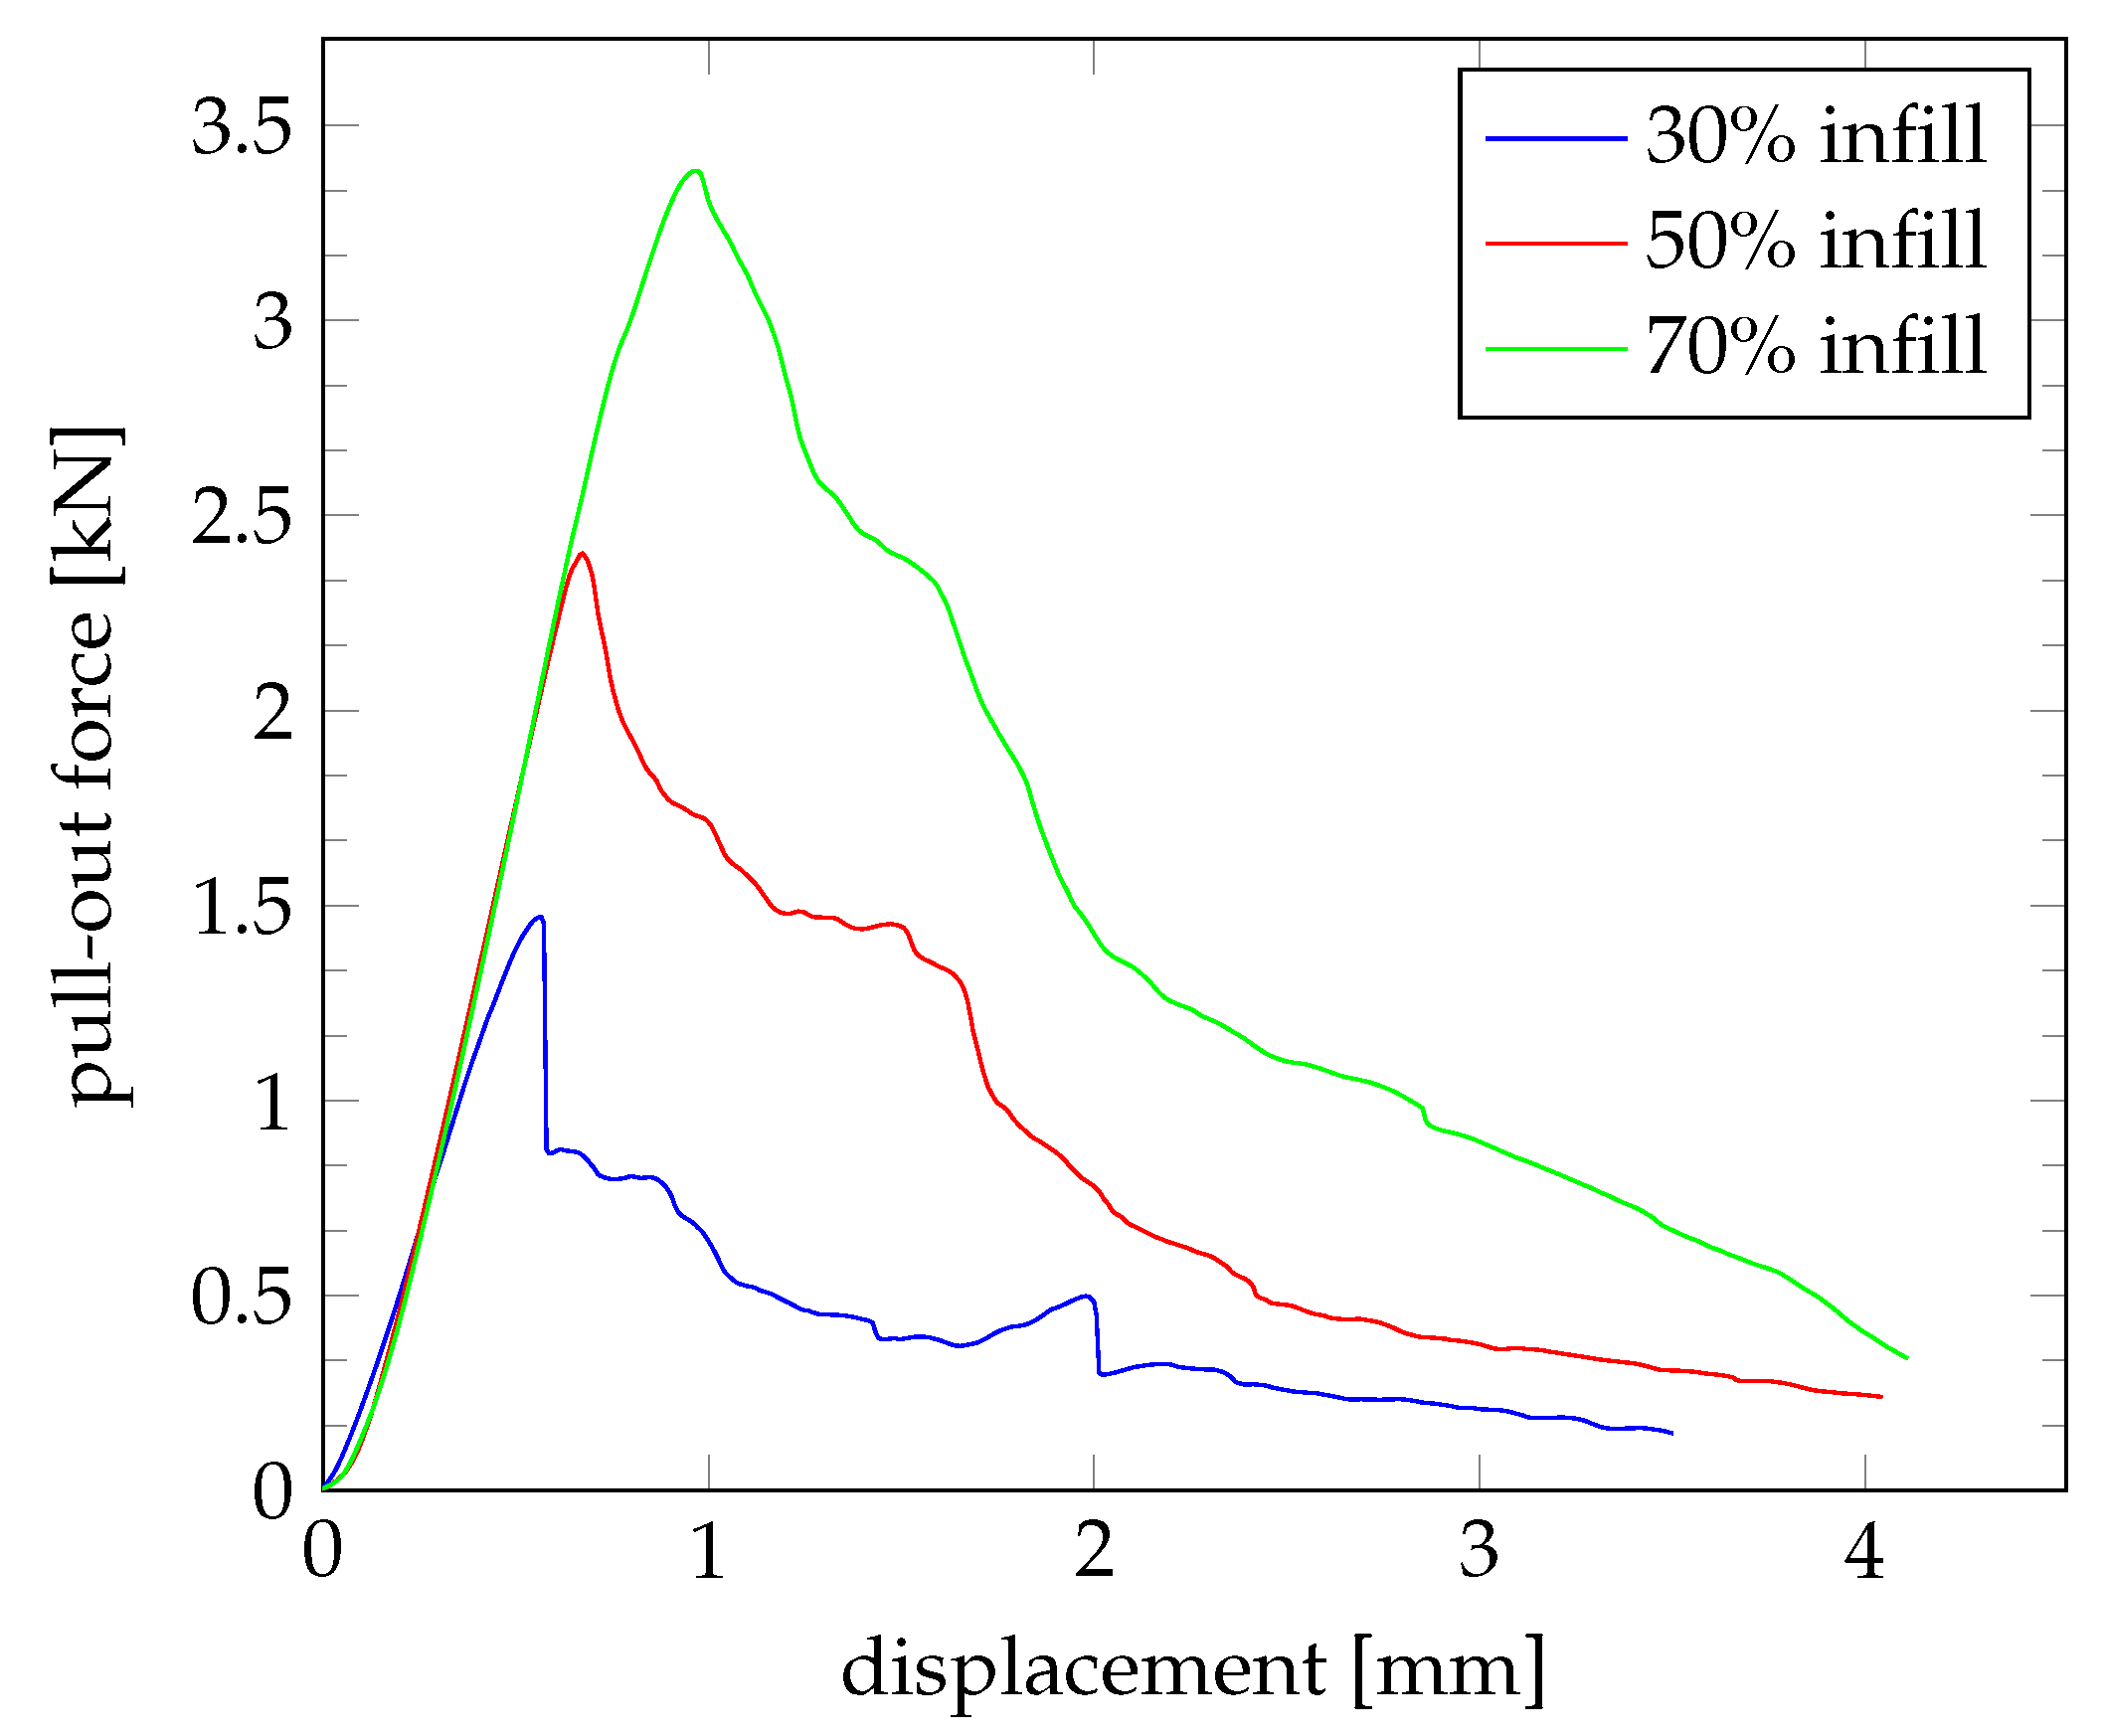
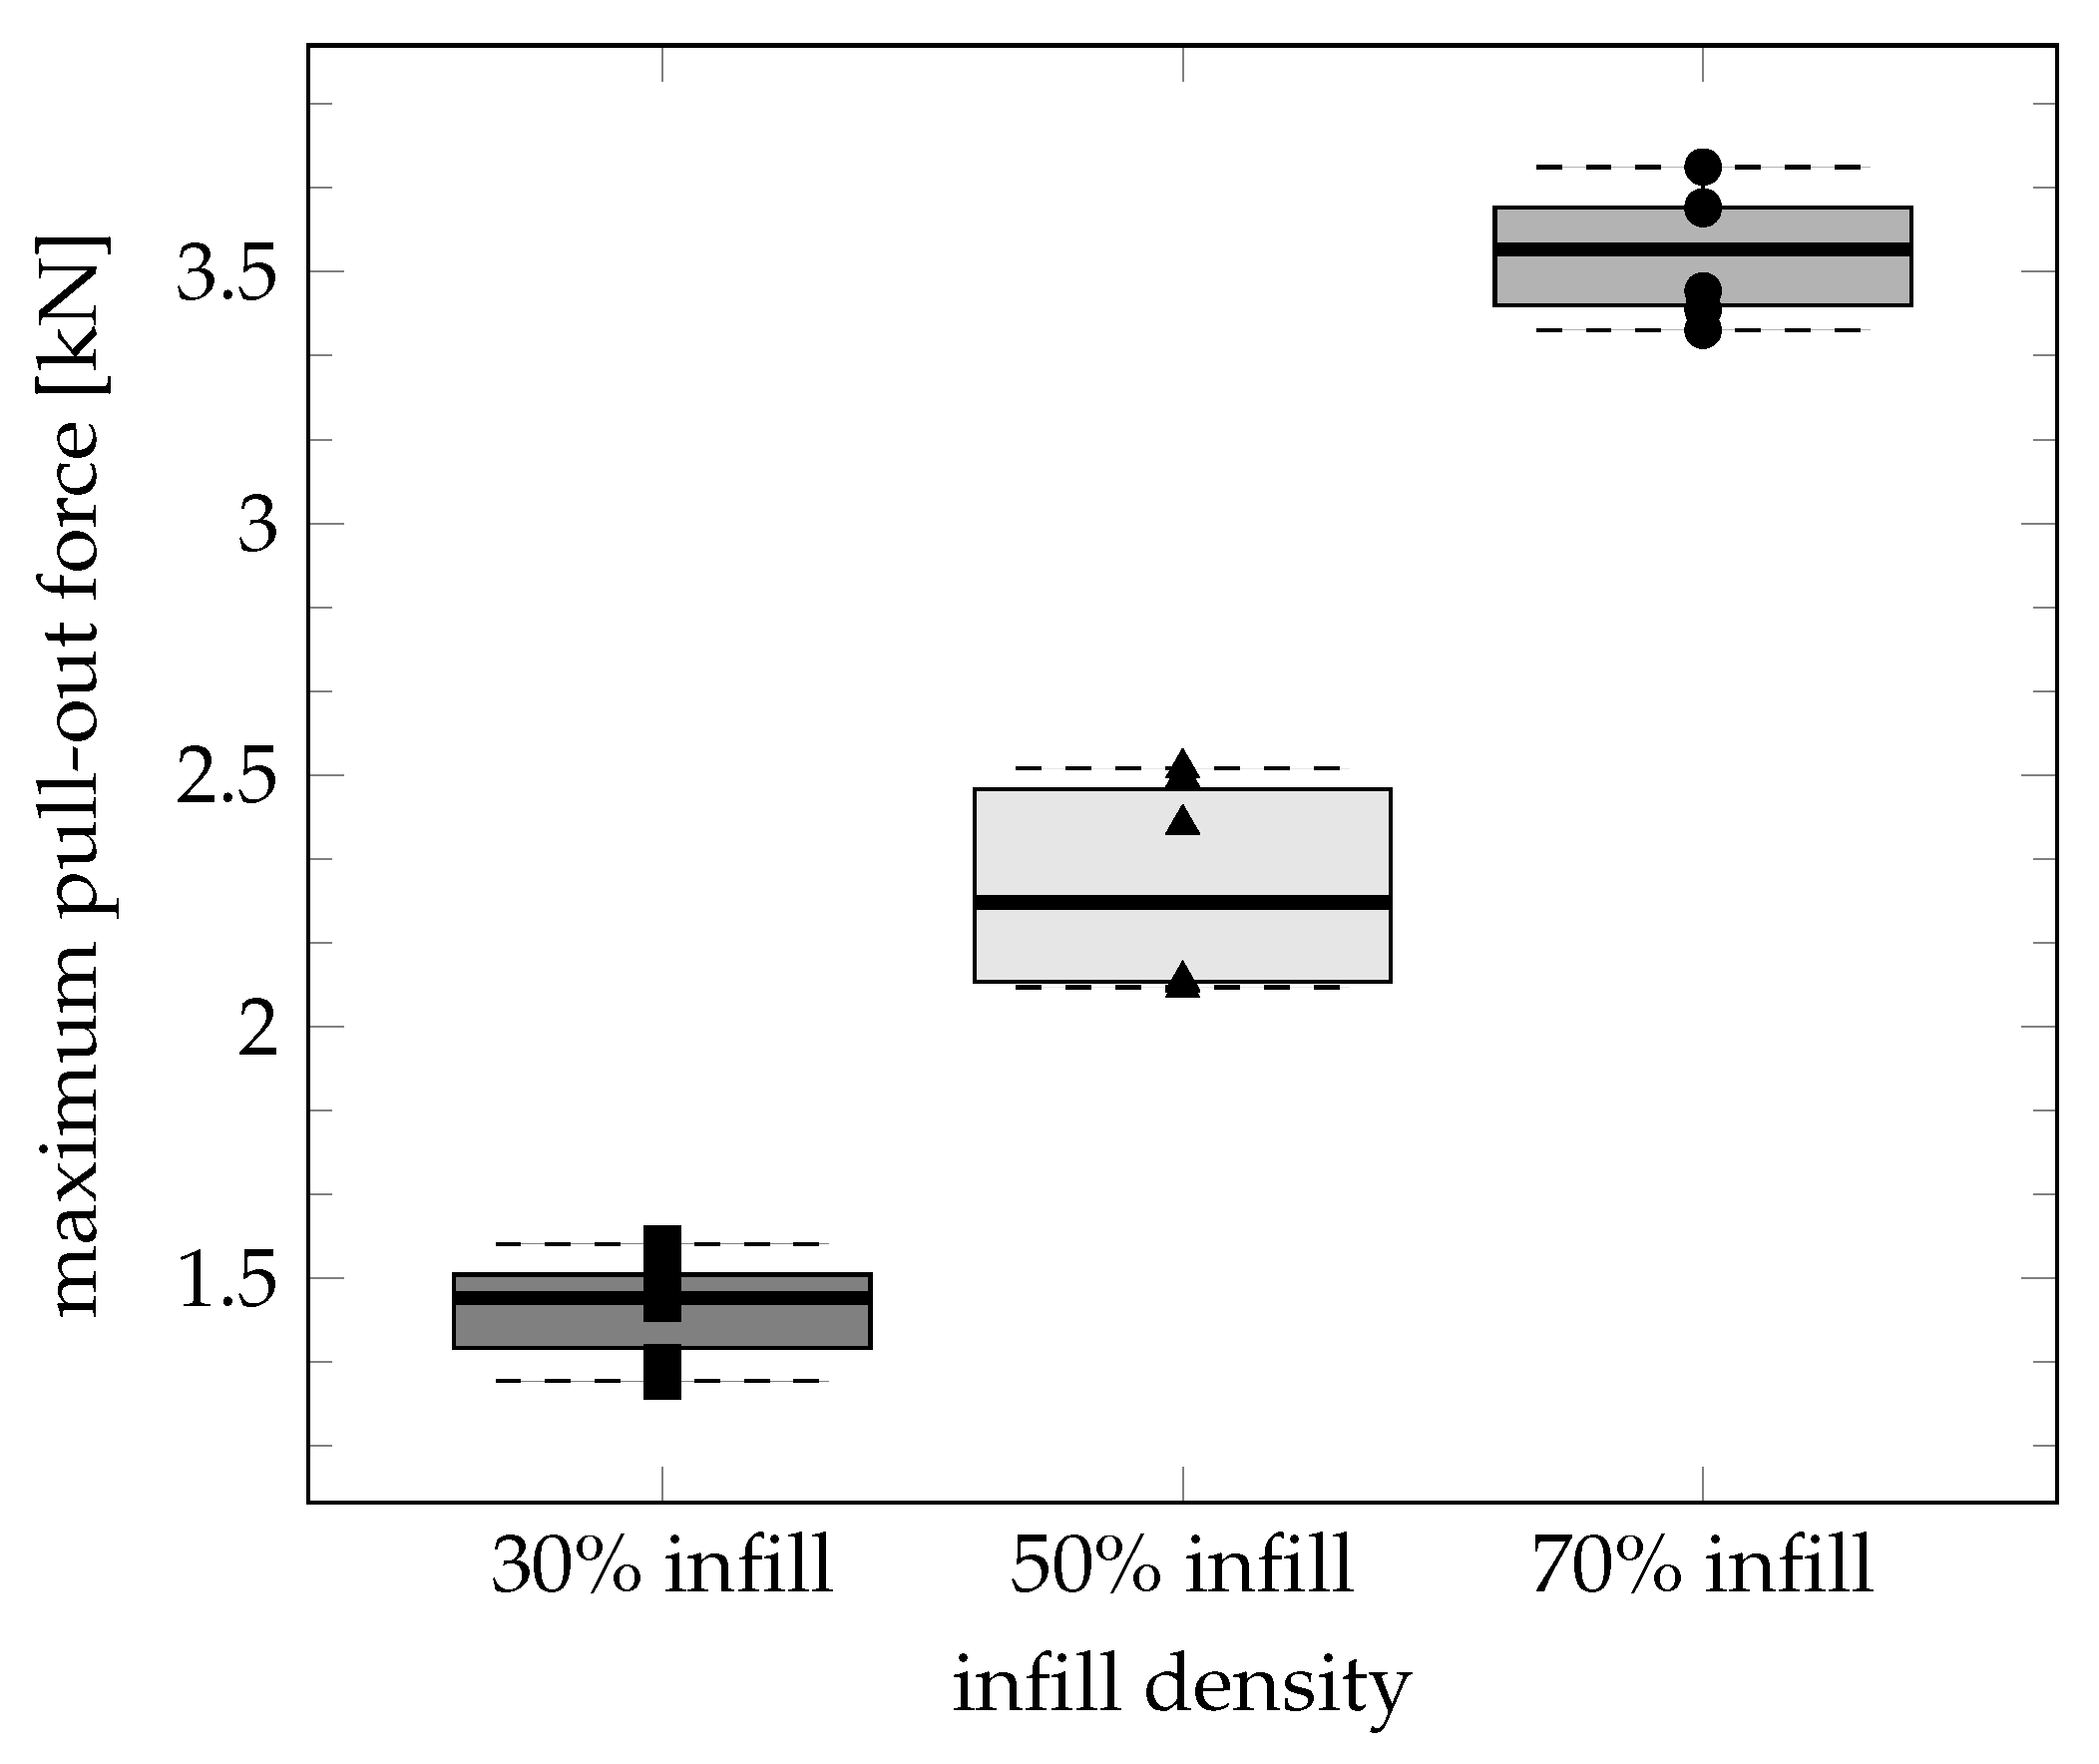
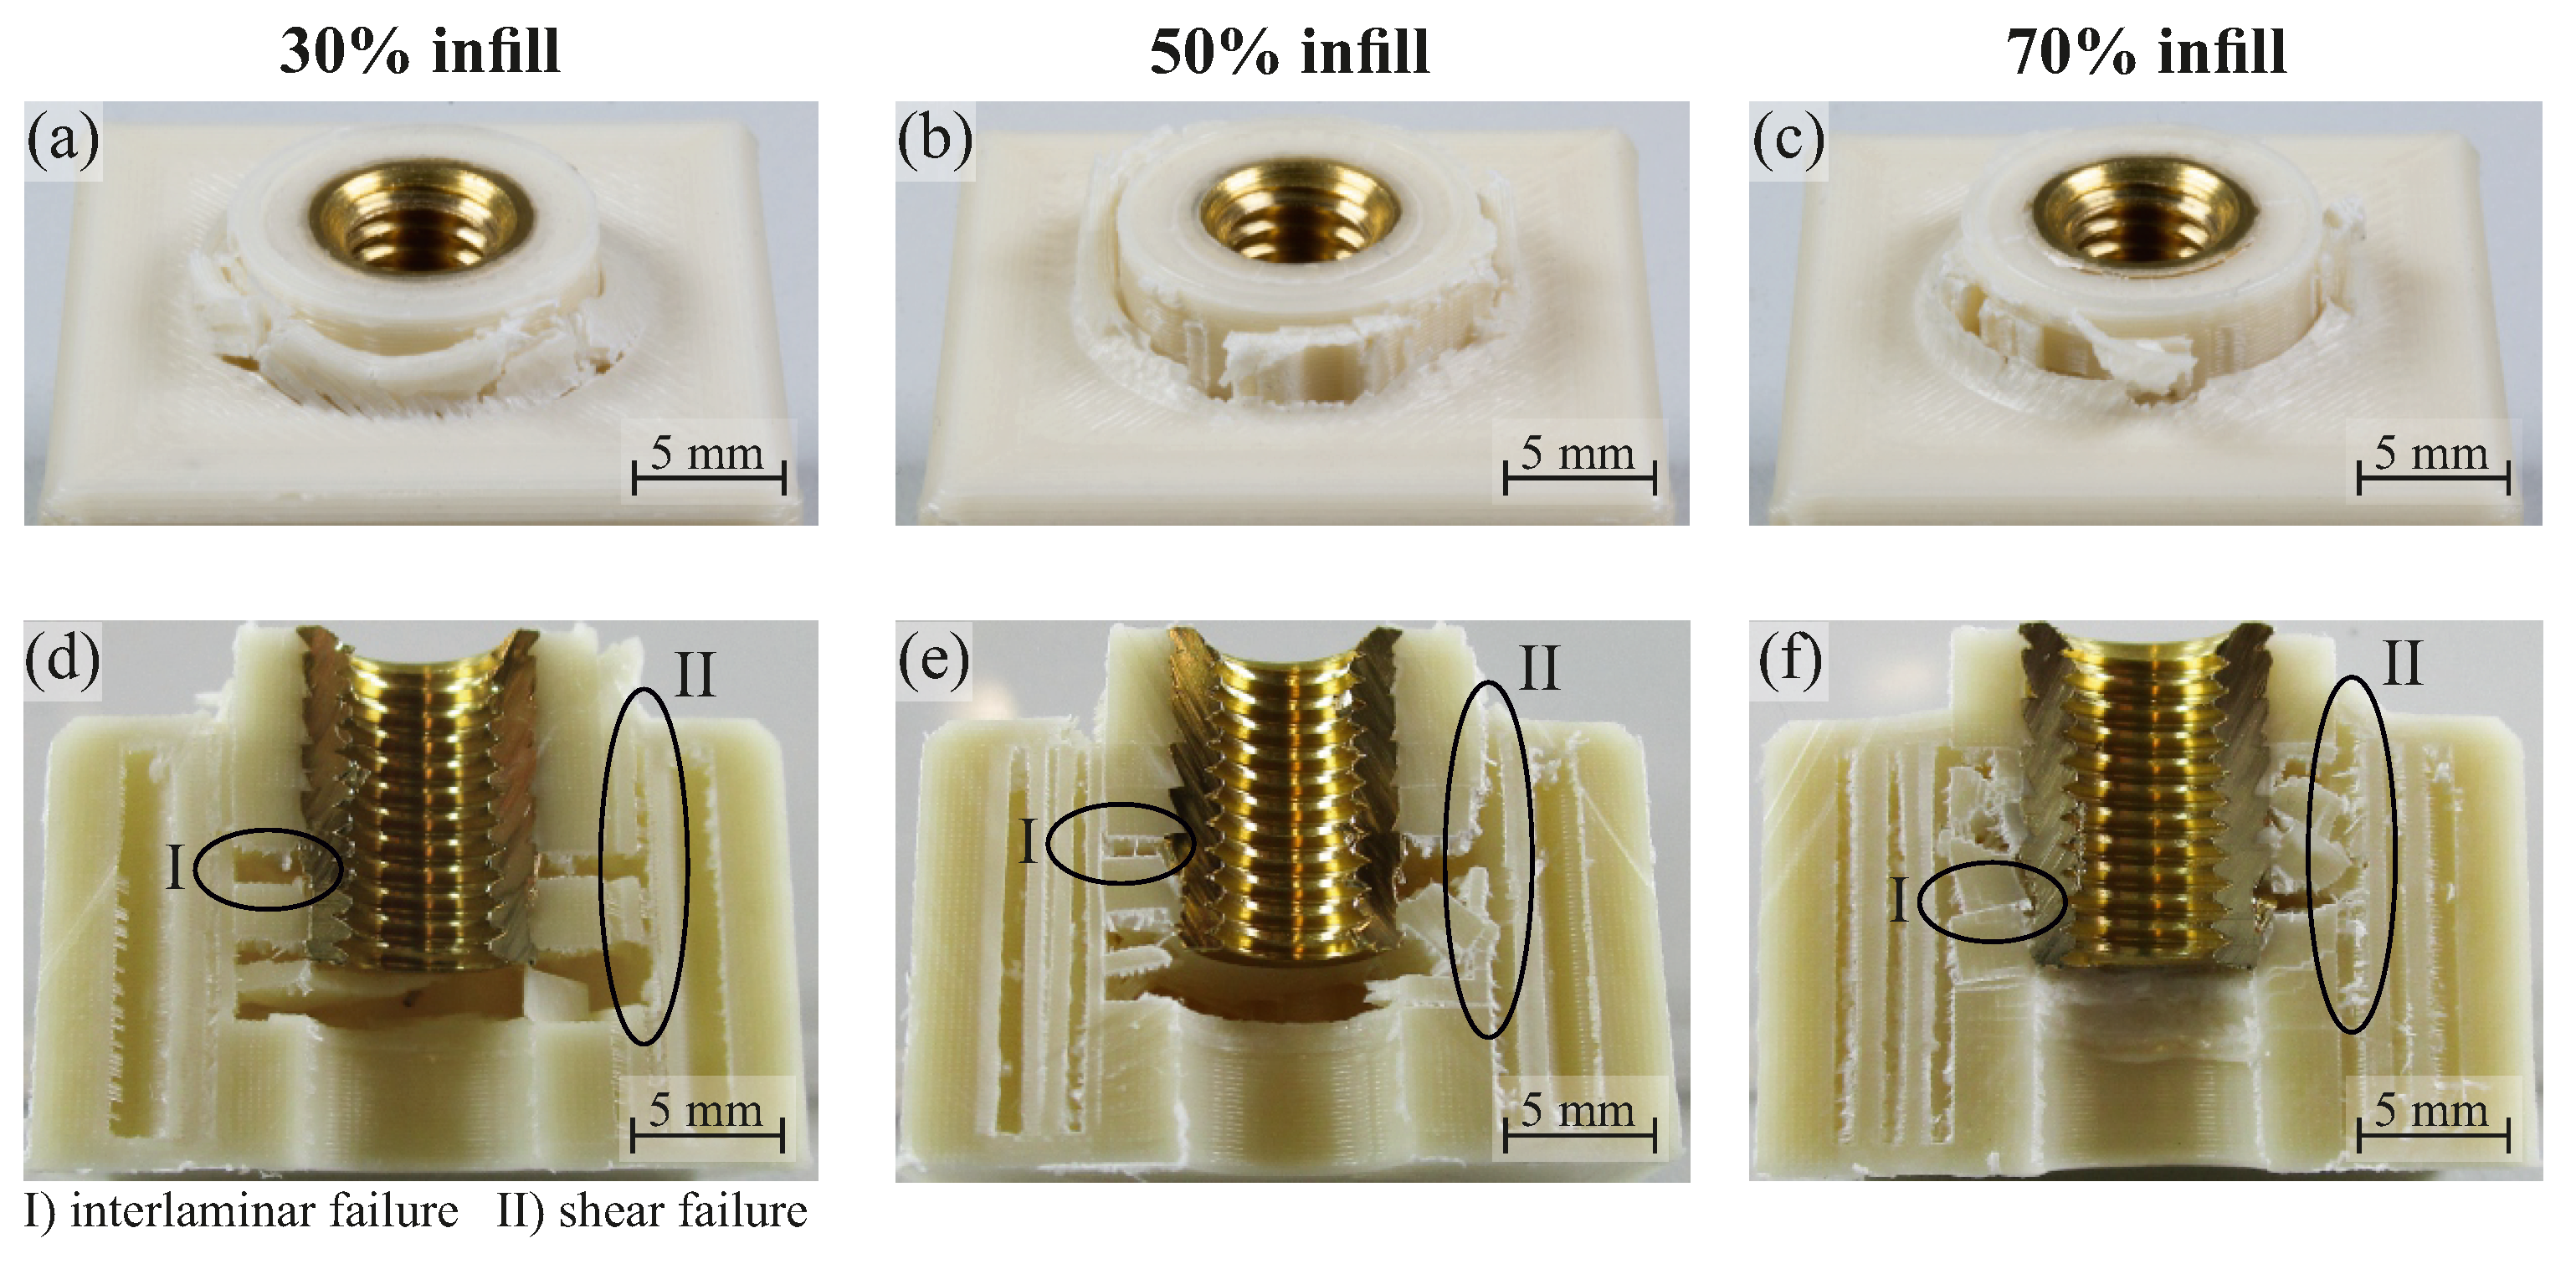
3.1. Infill Density
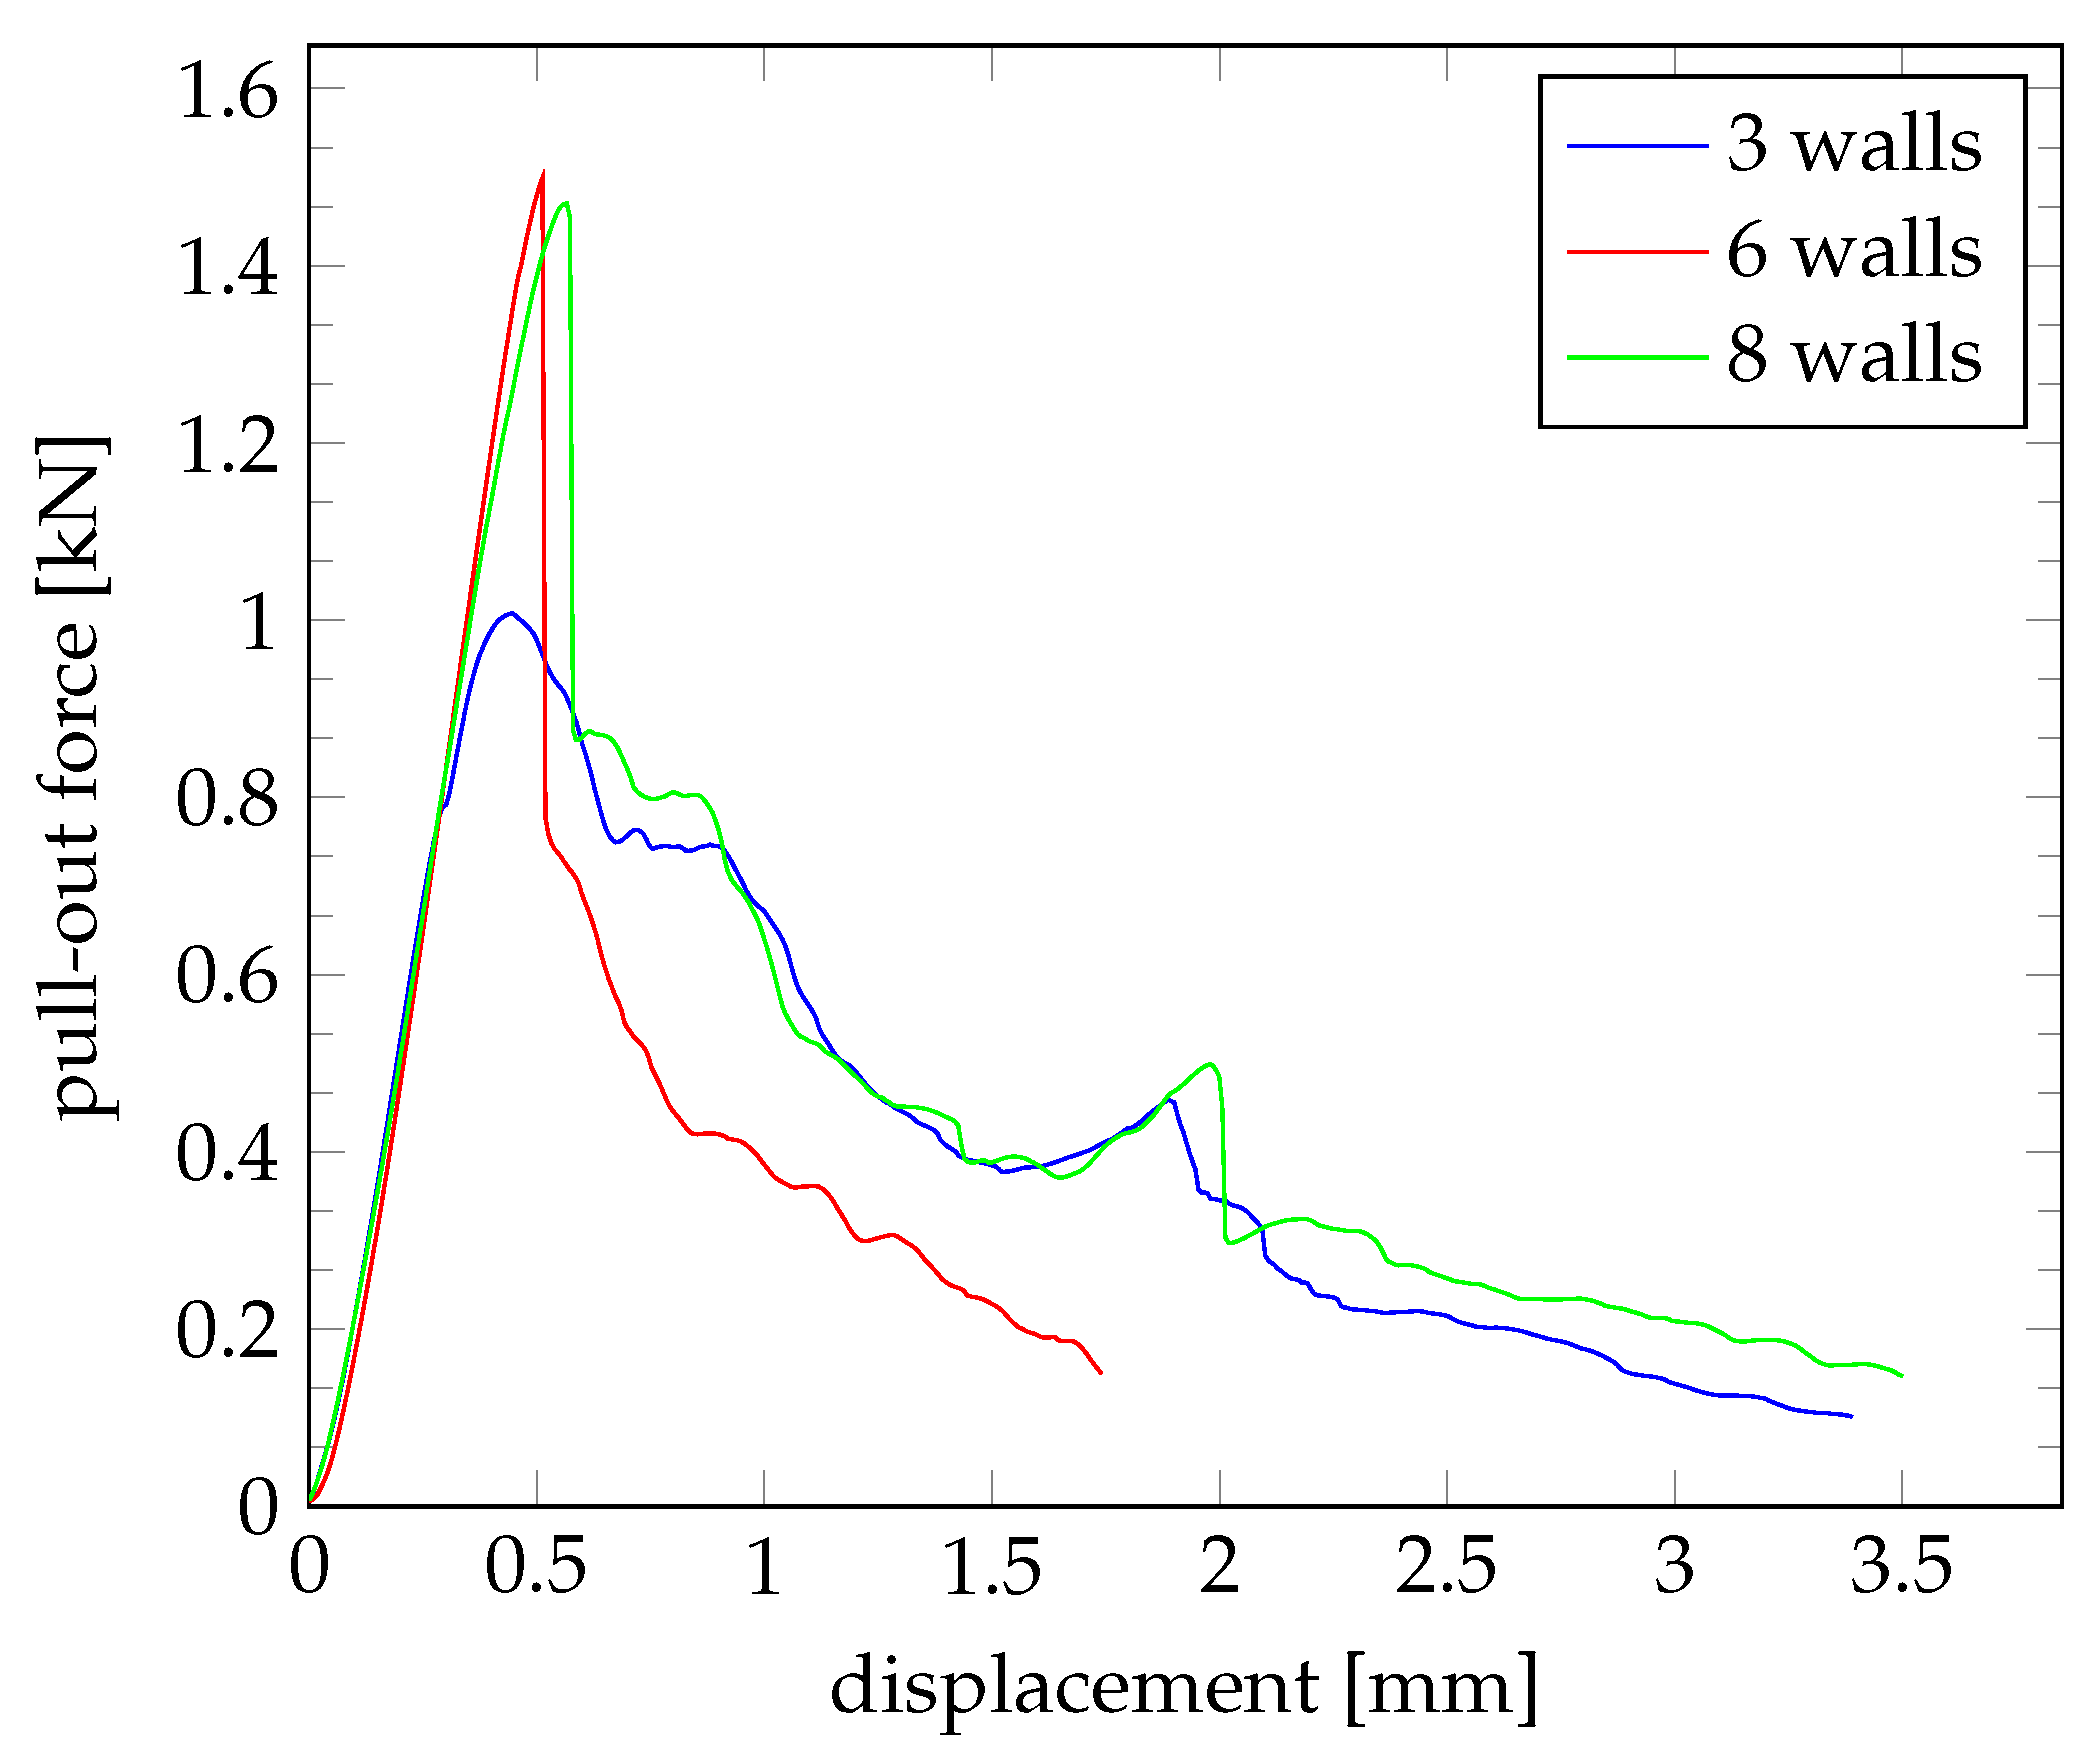
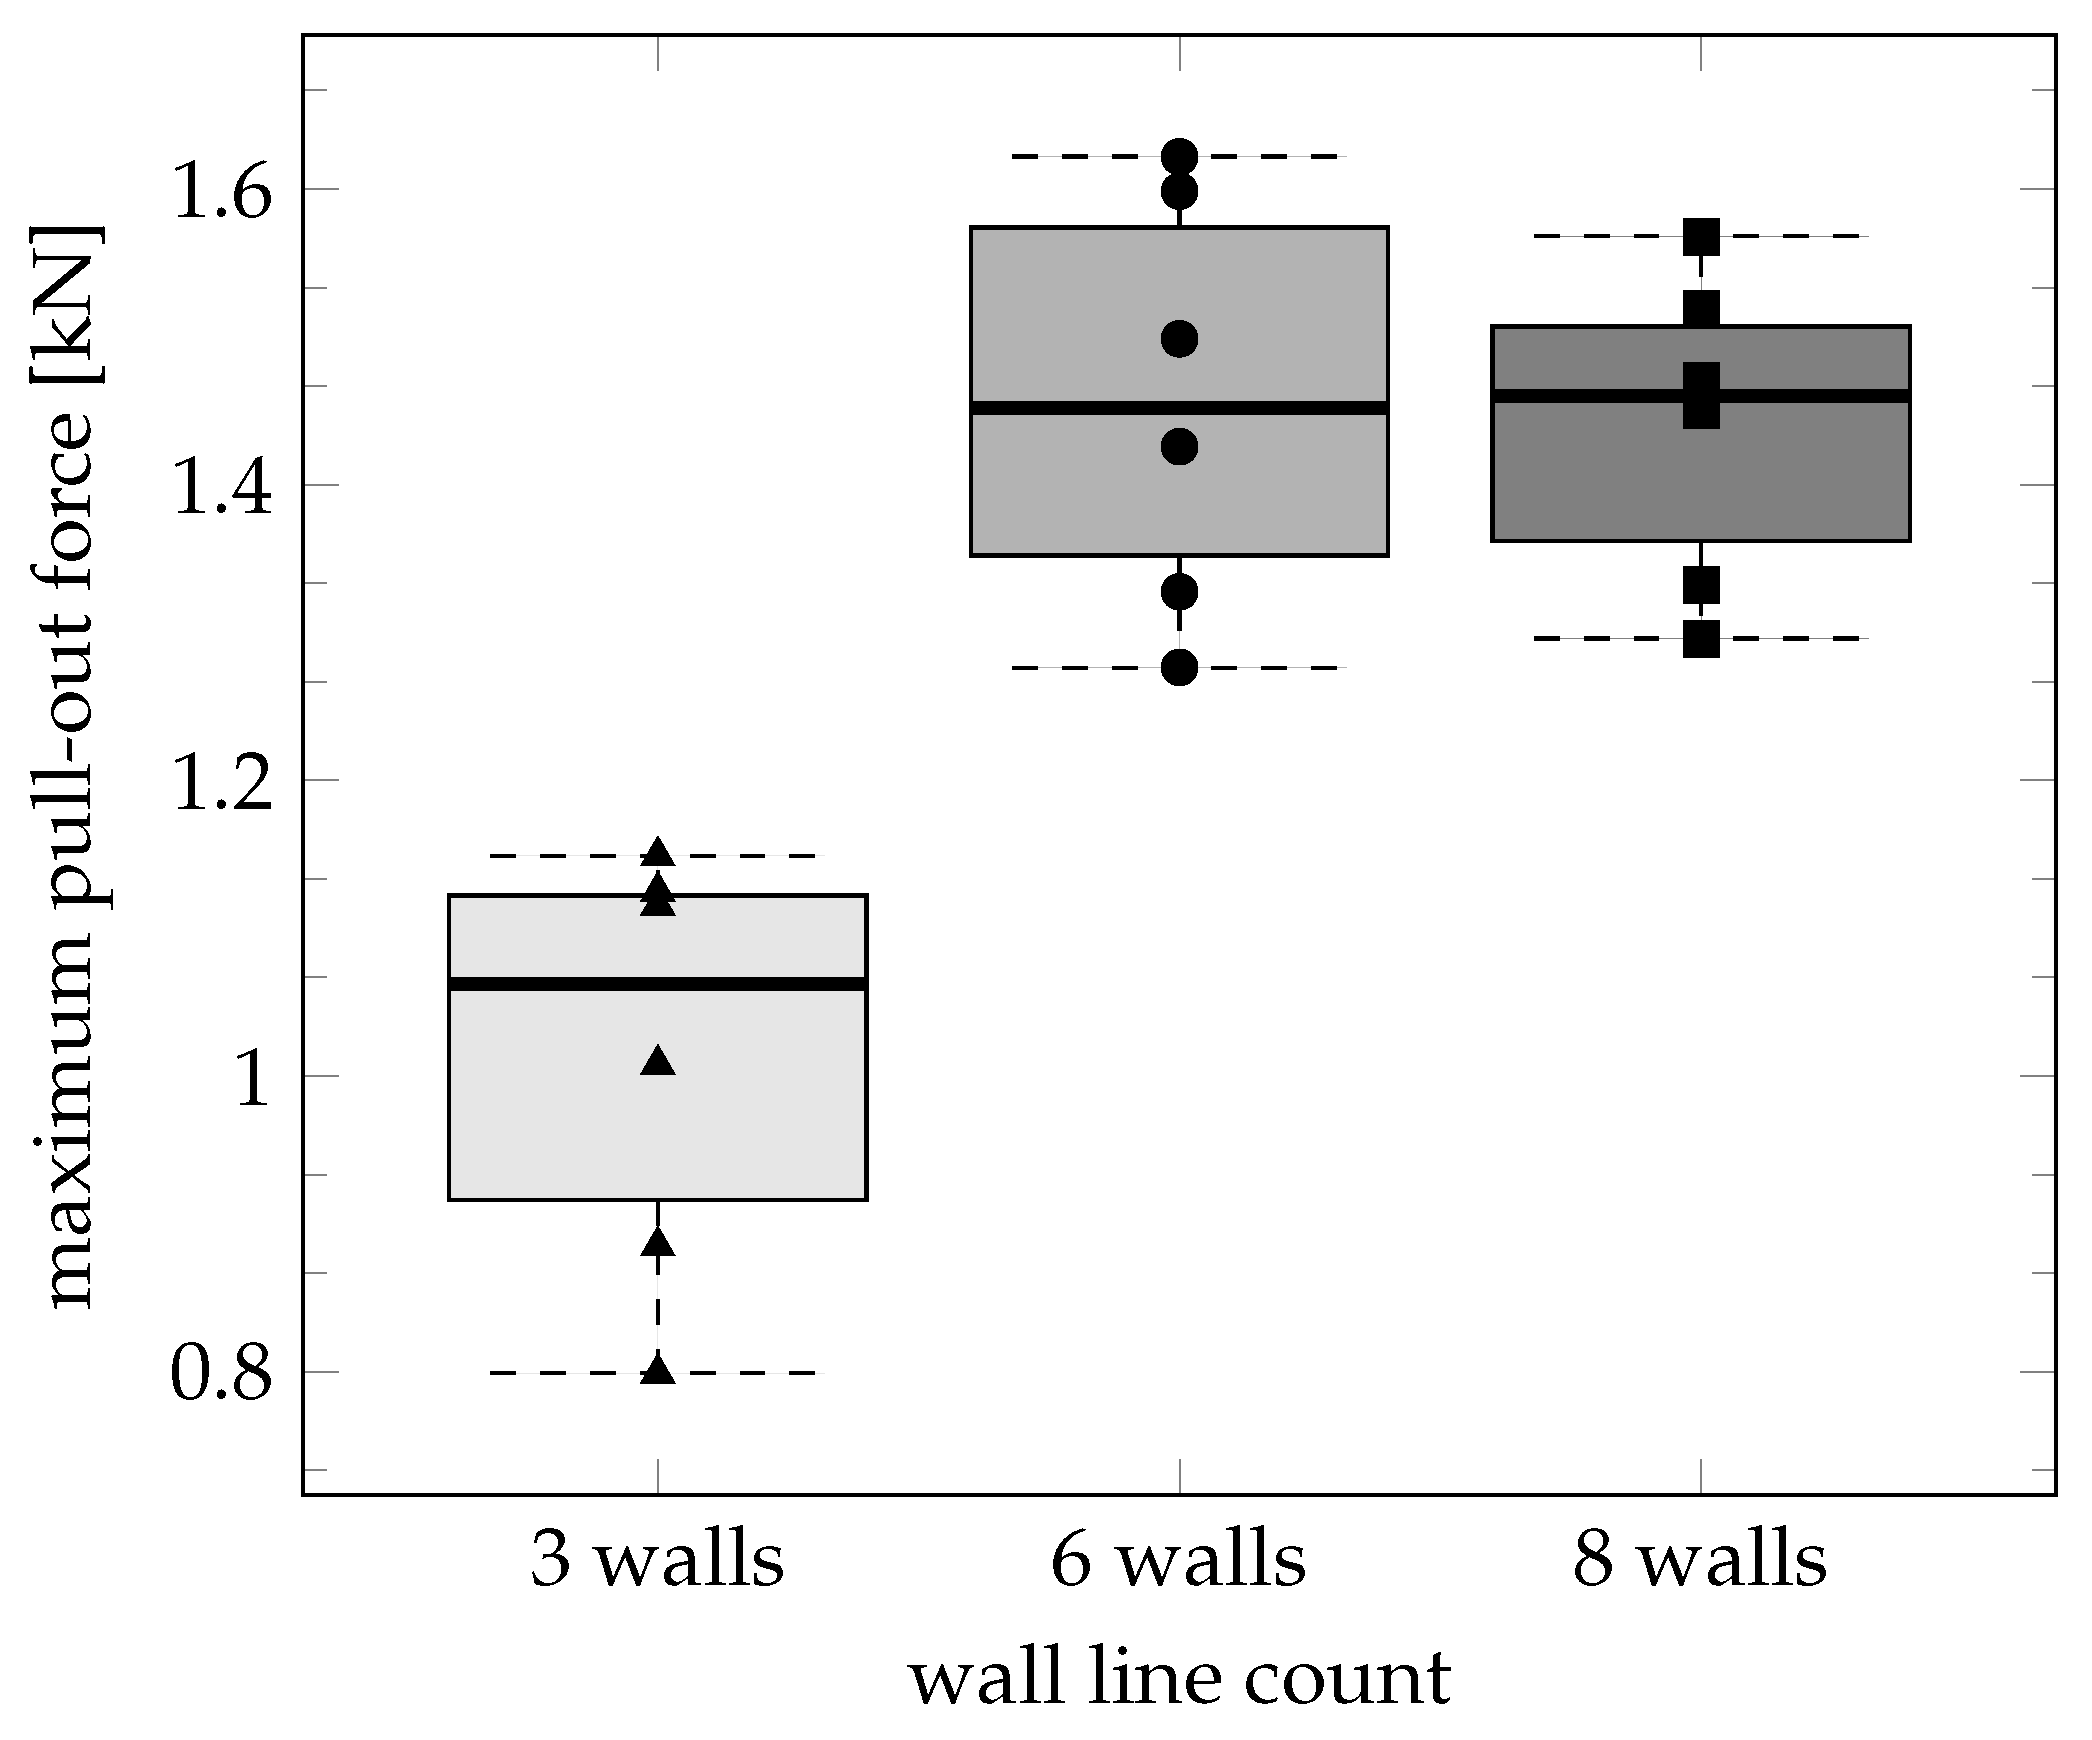
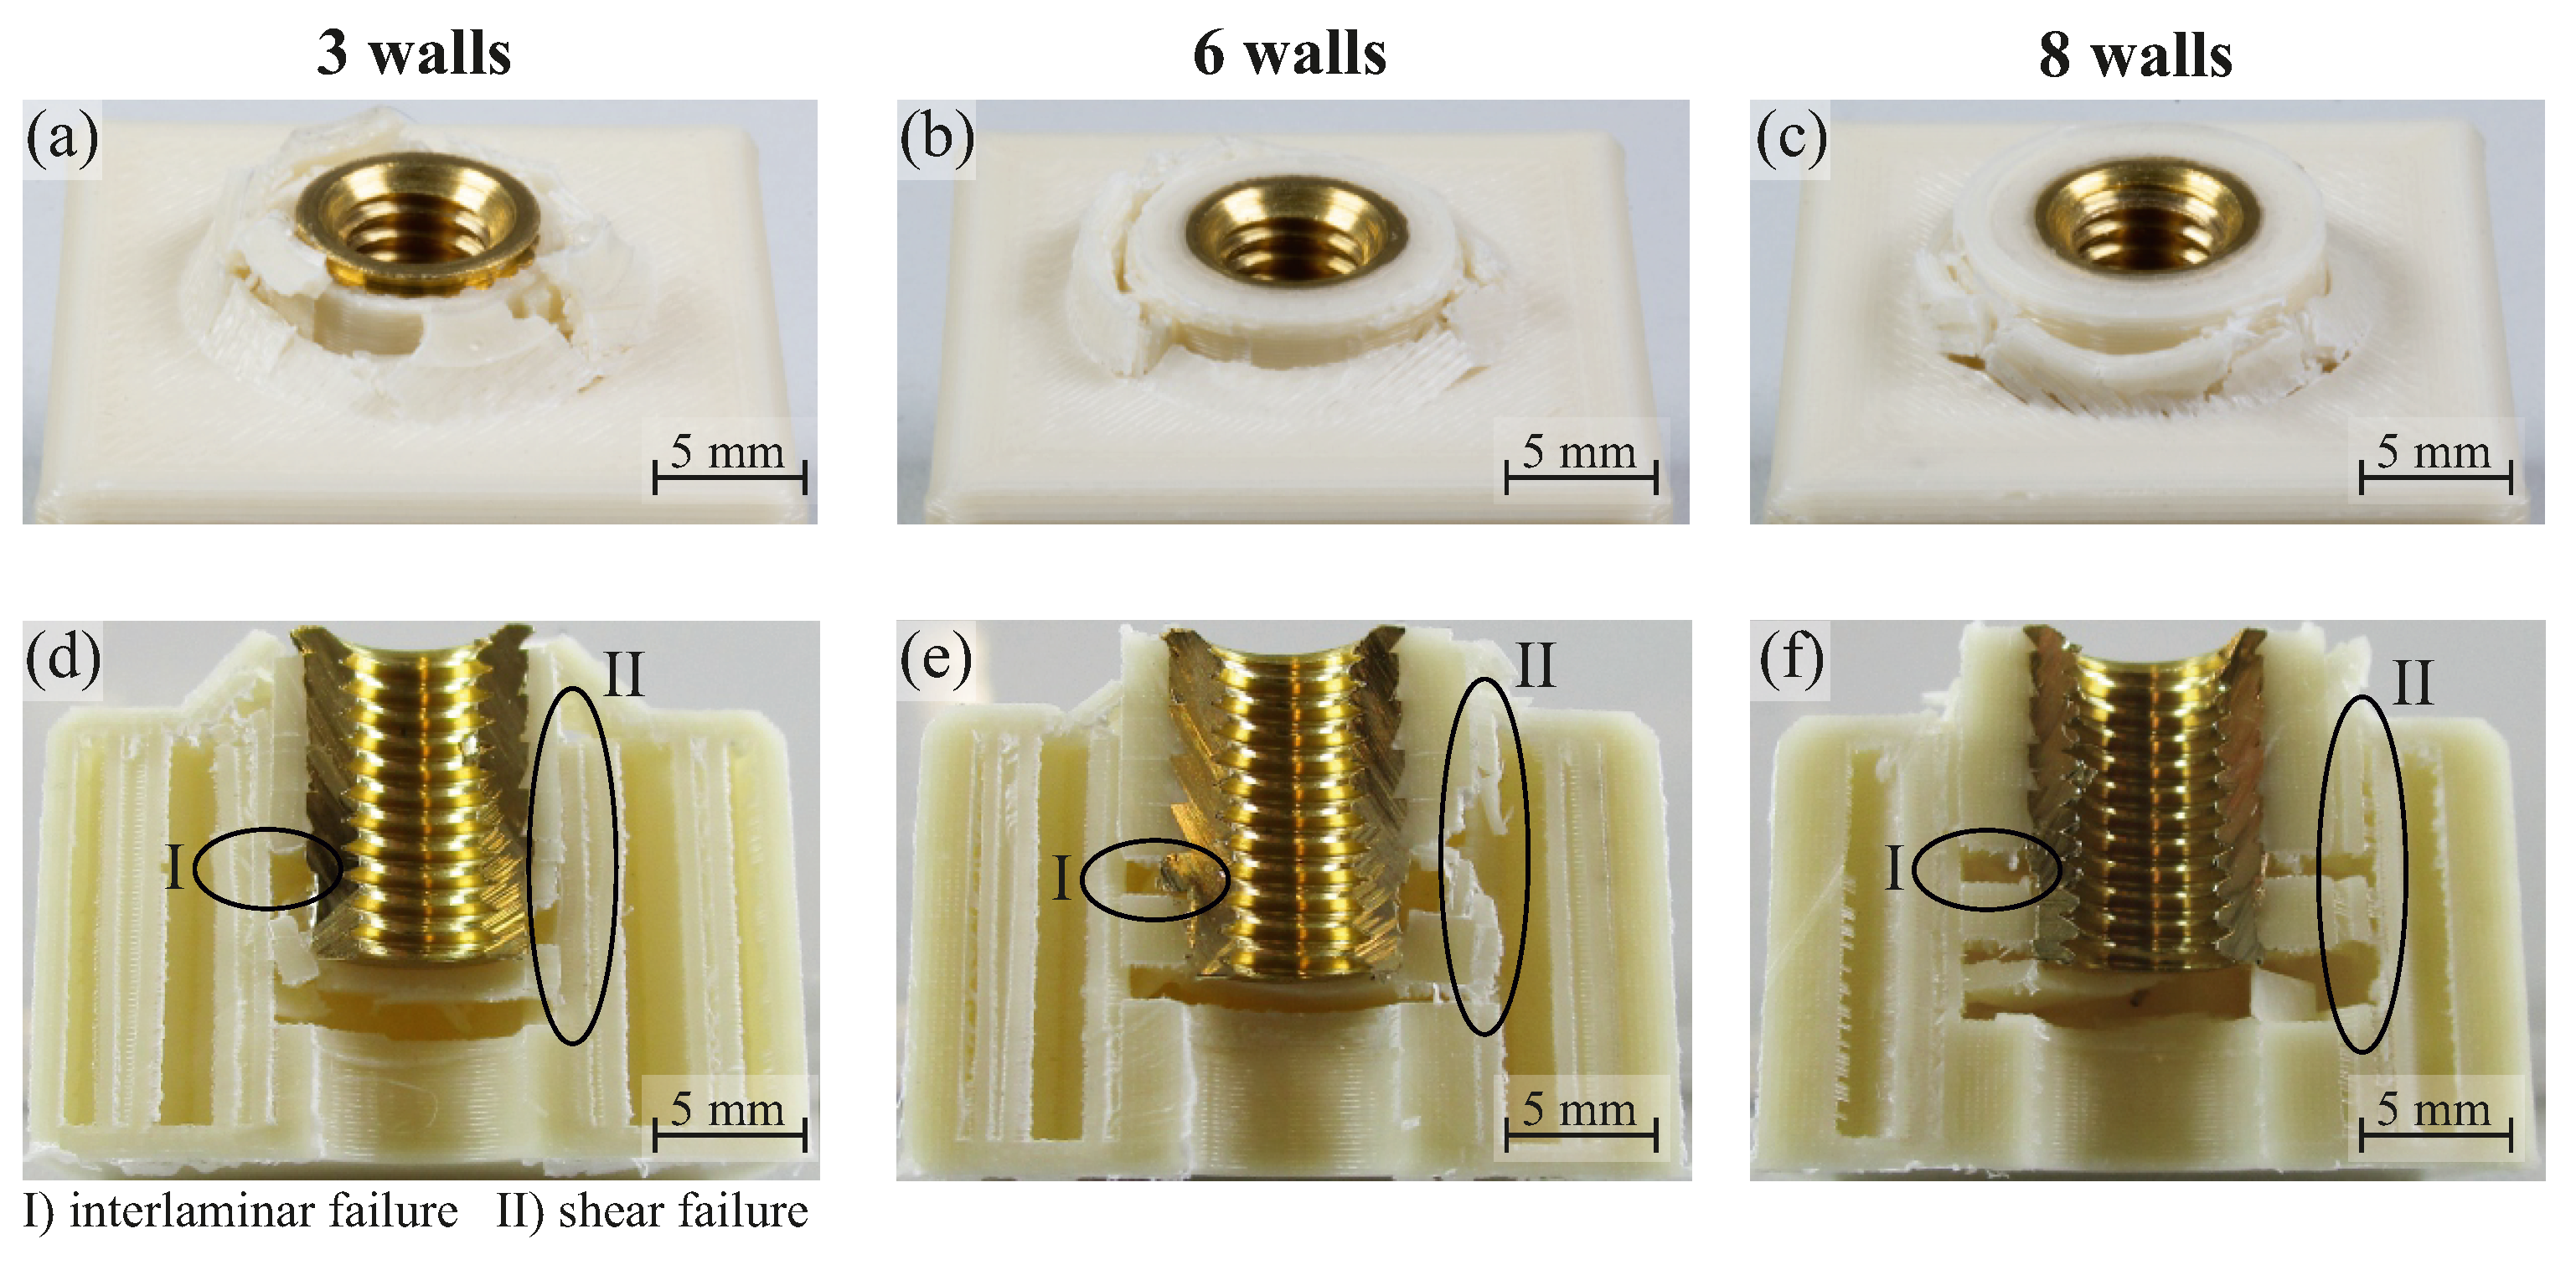
3.2. Wall Thickness
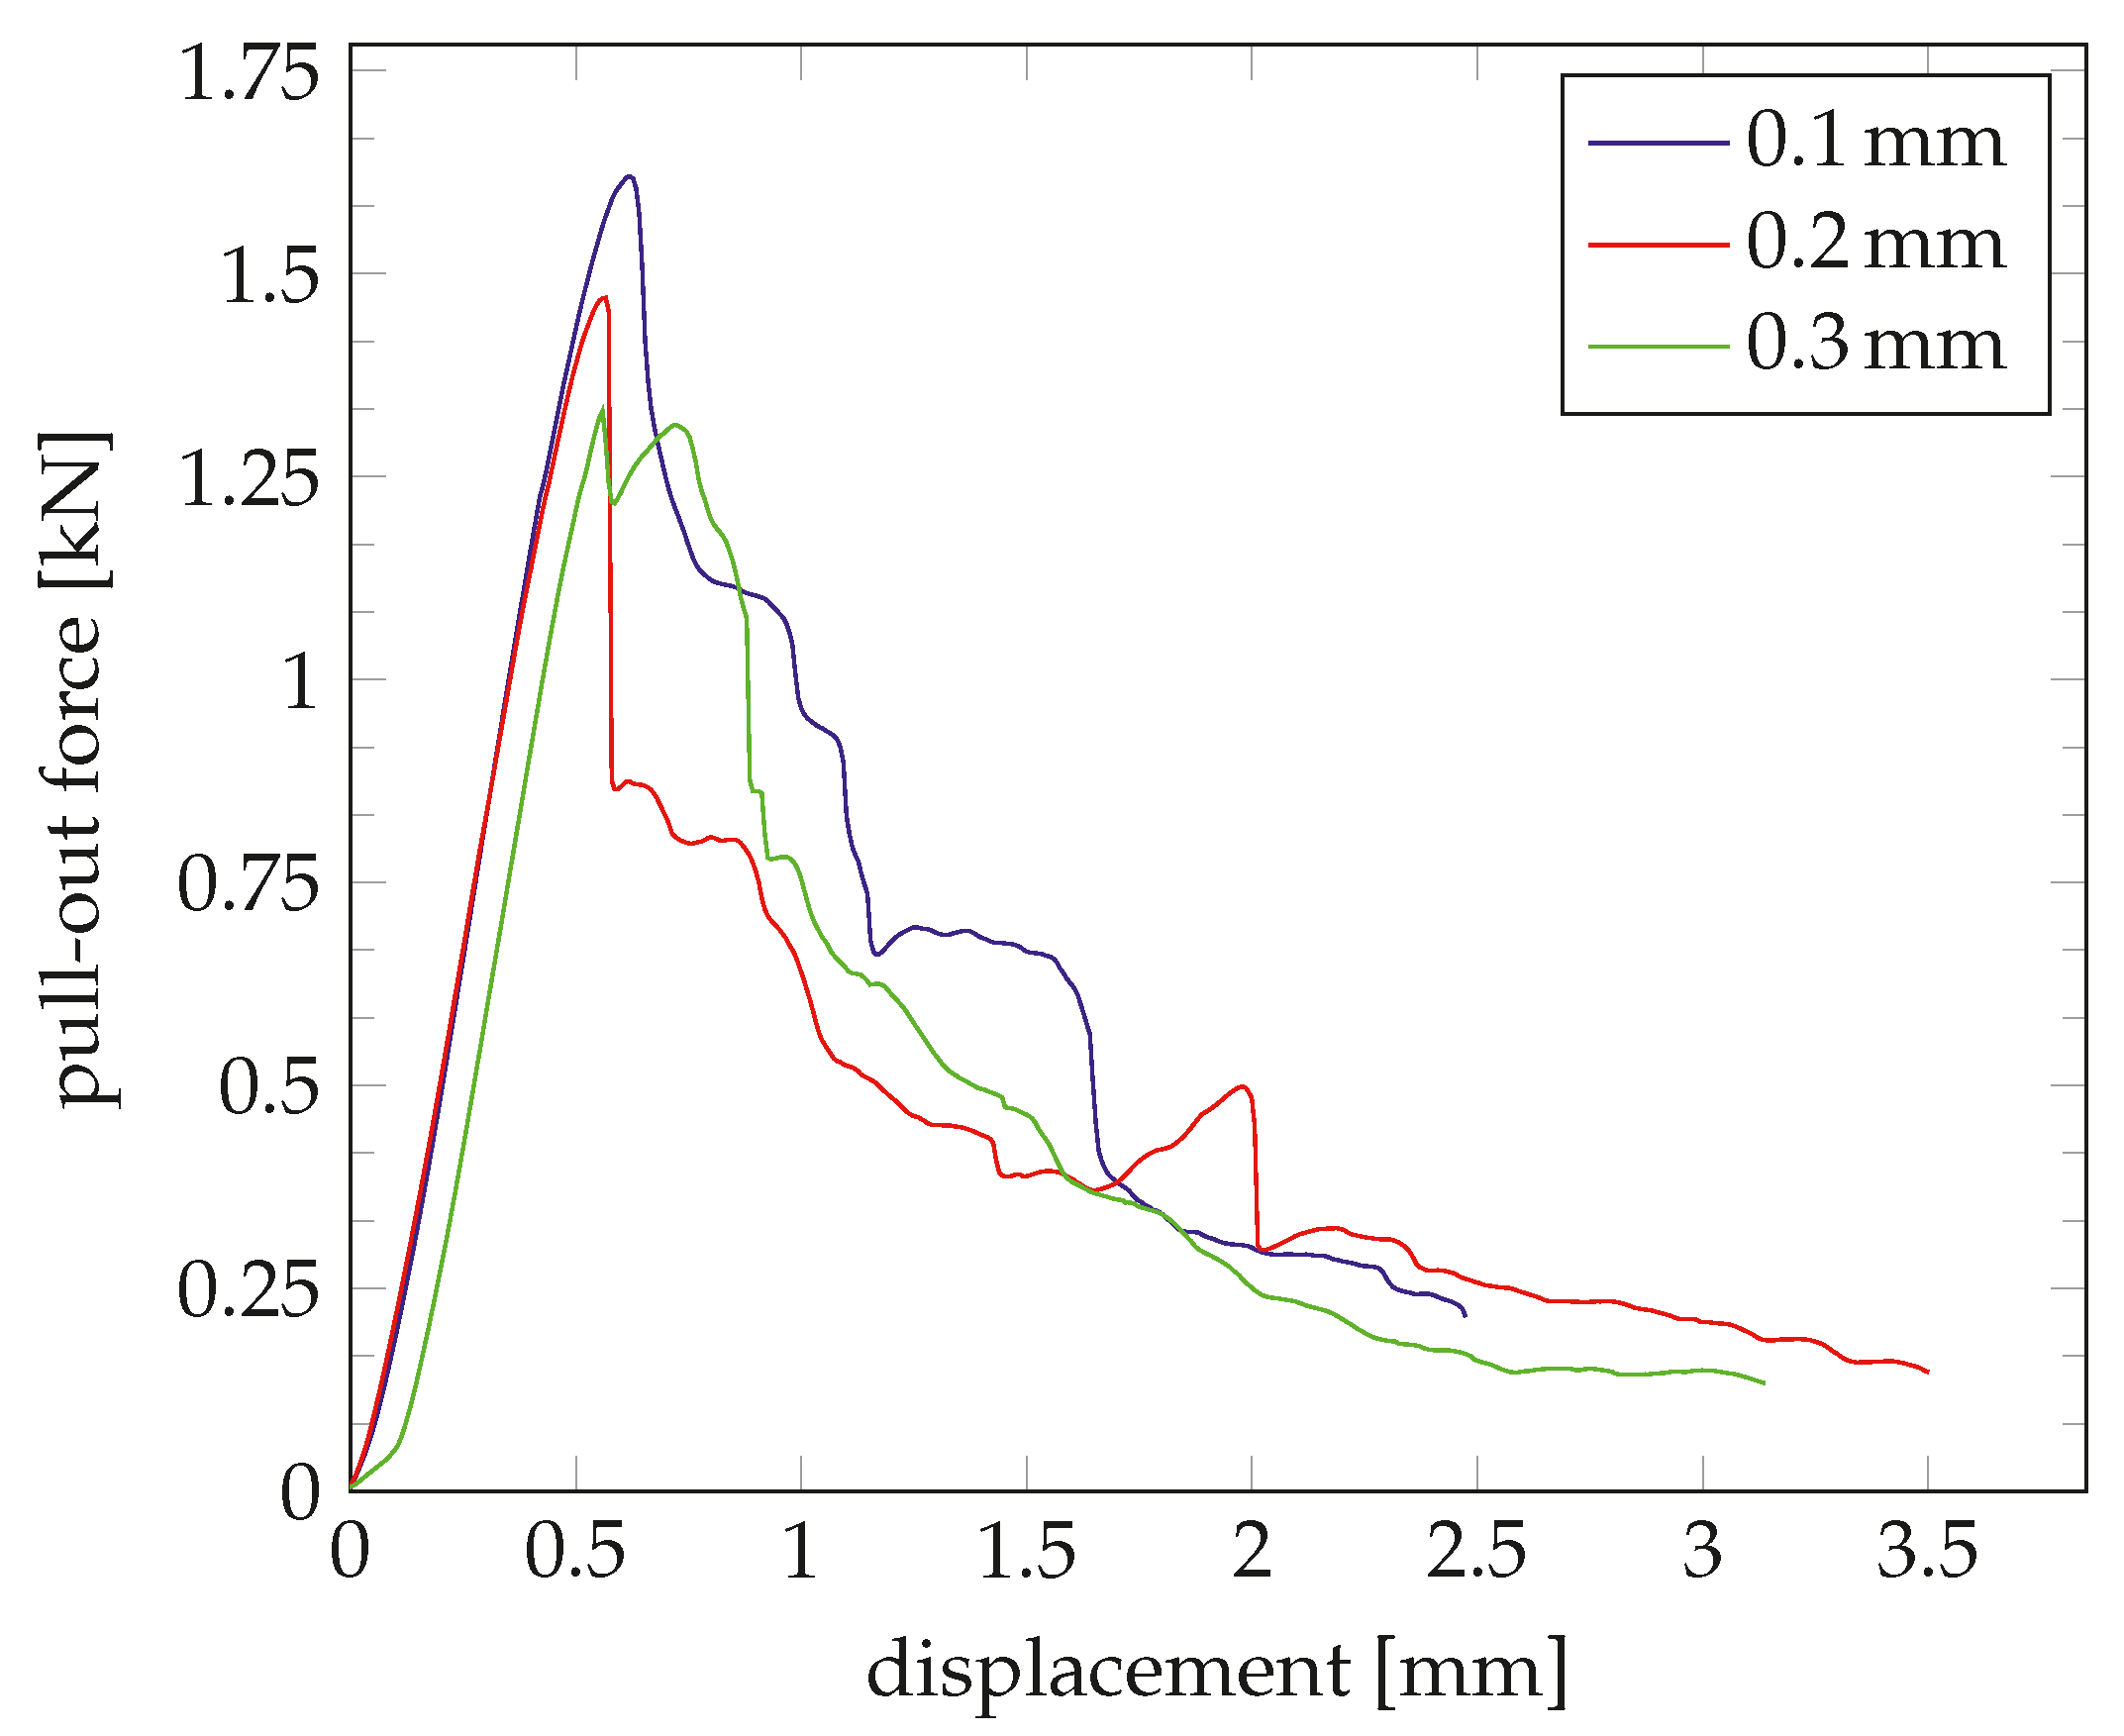
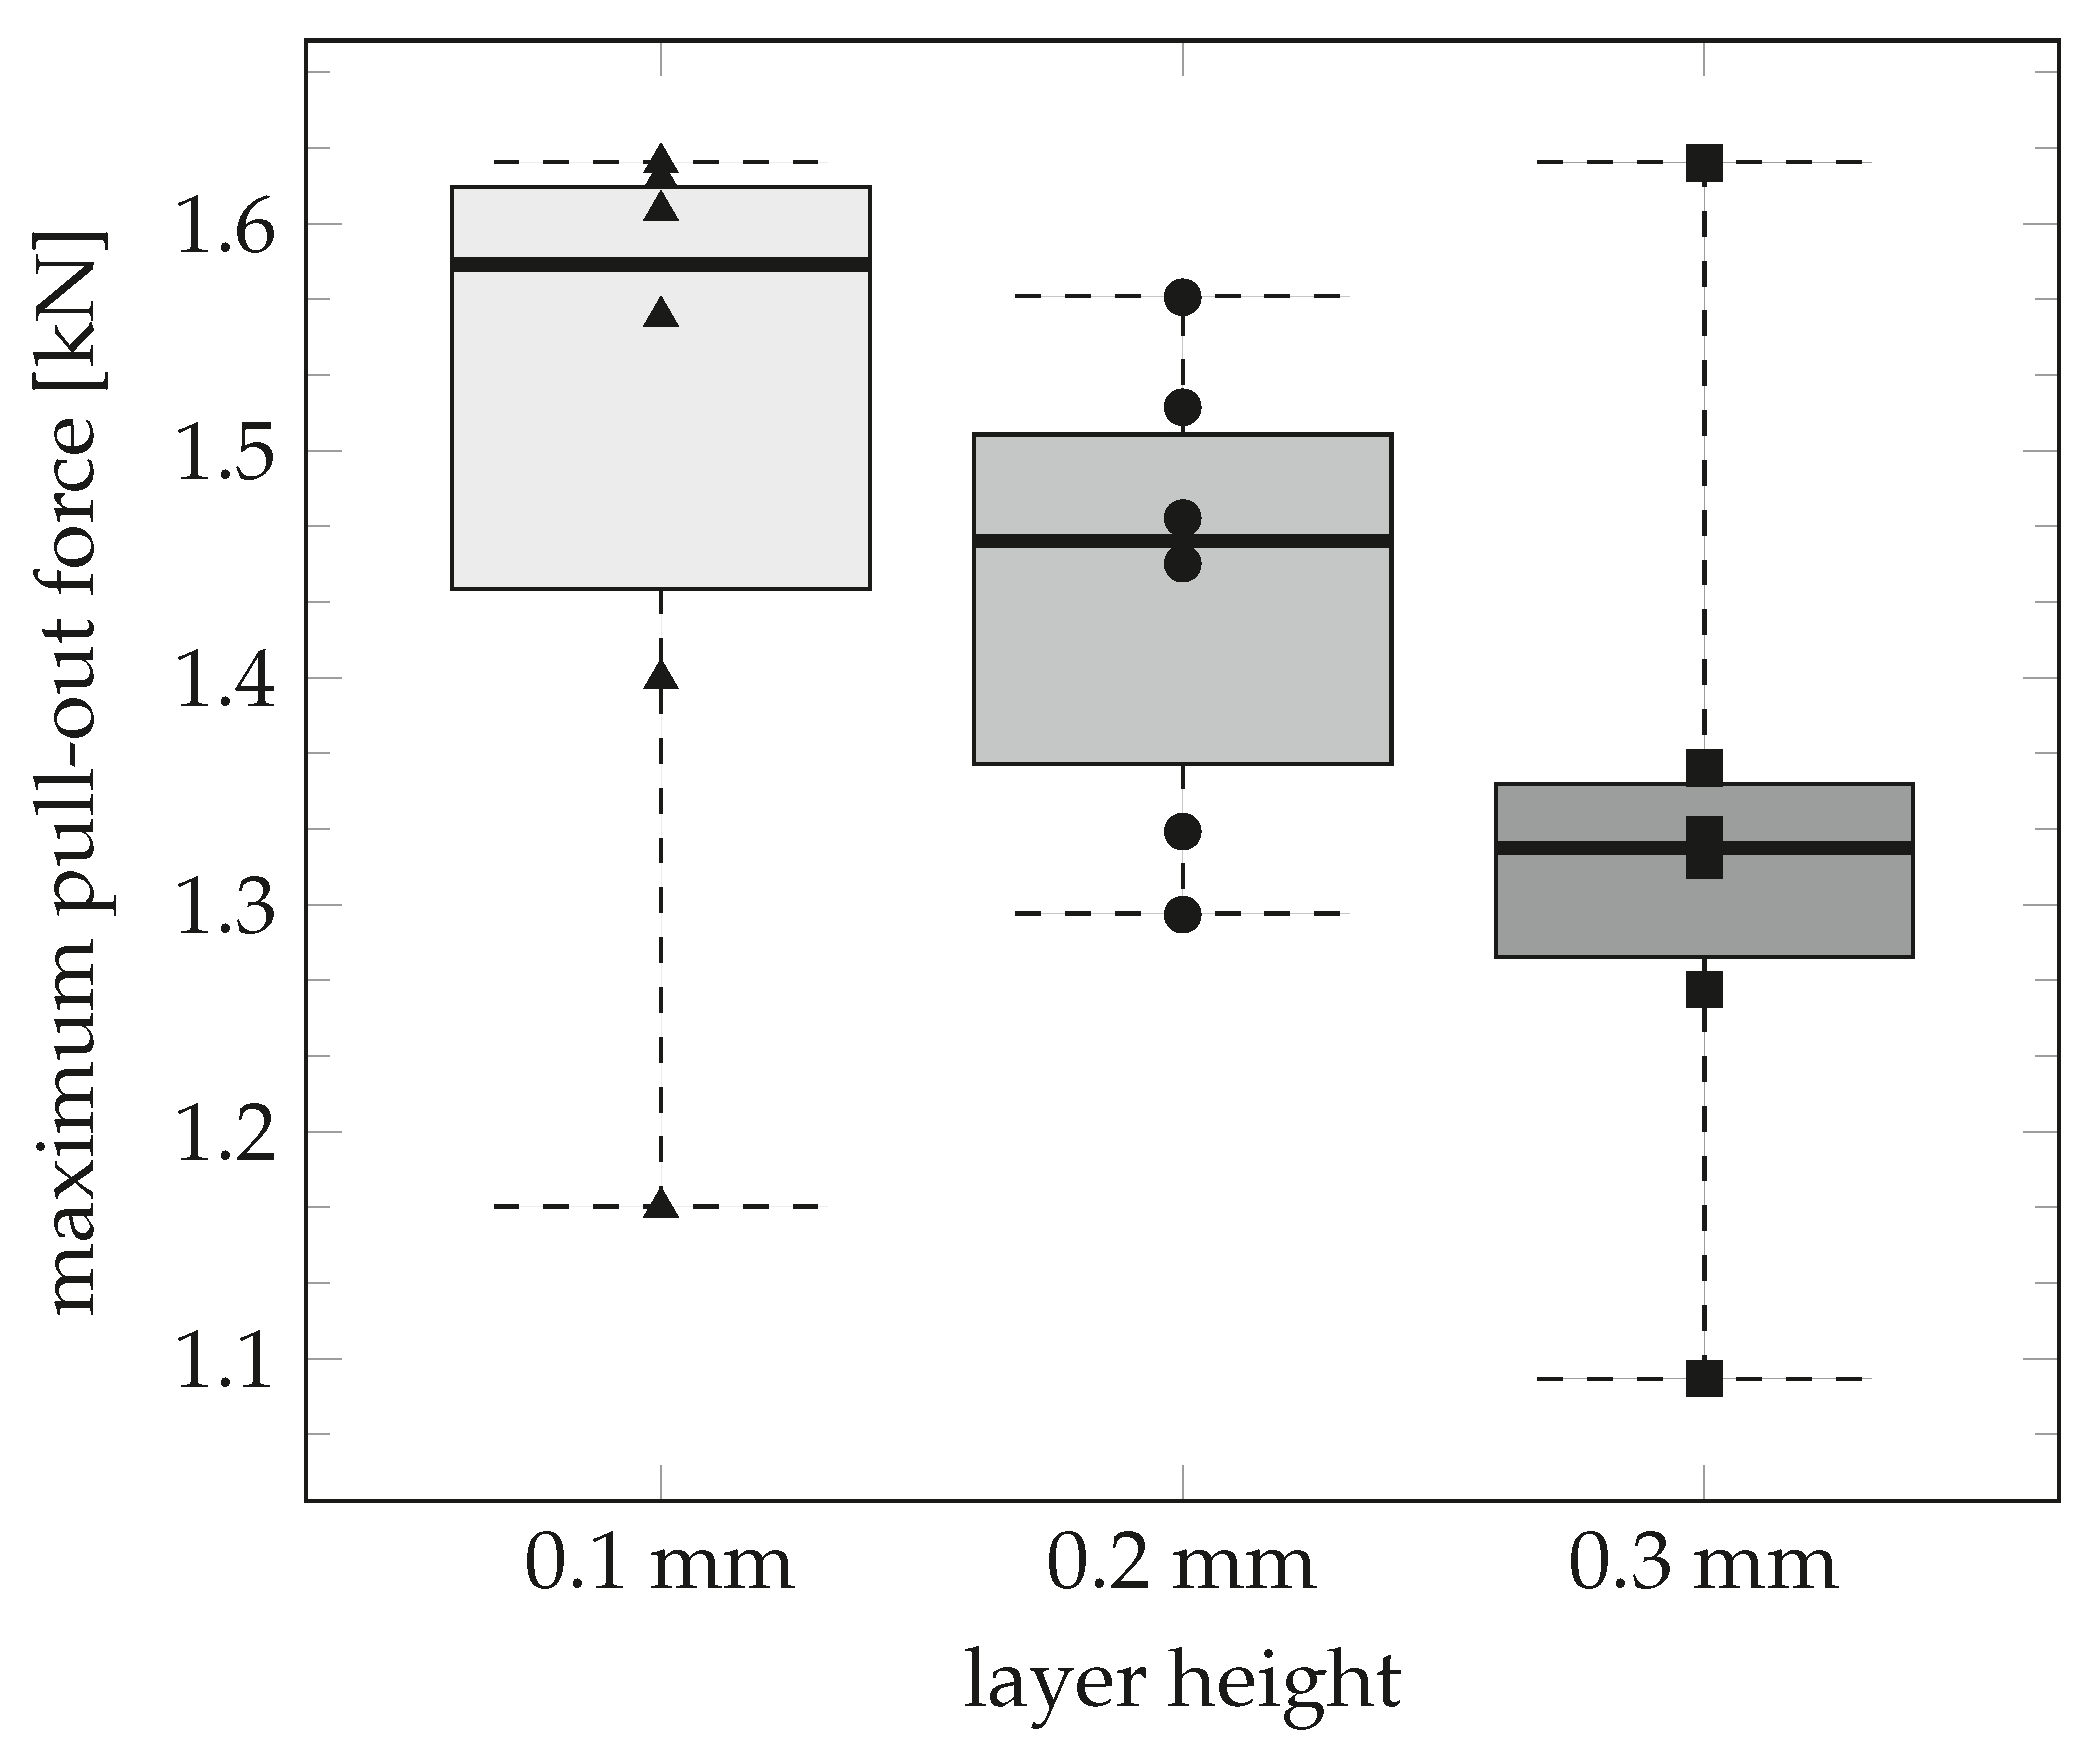
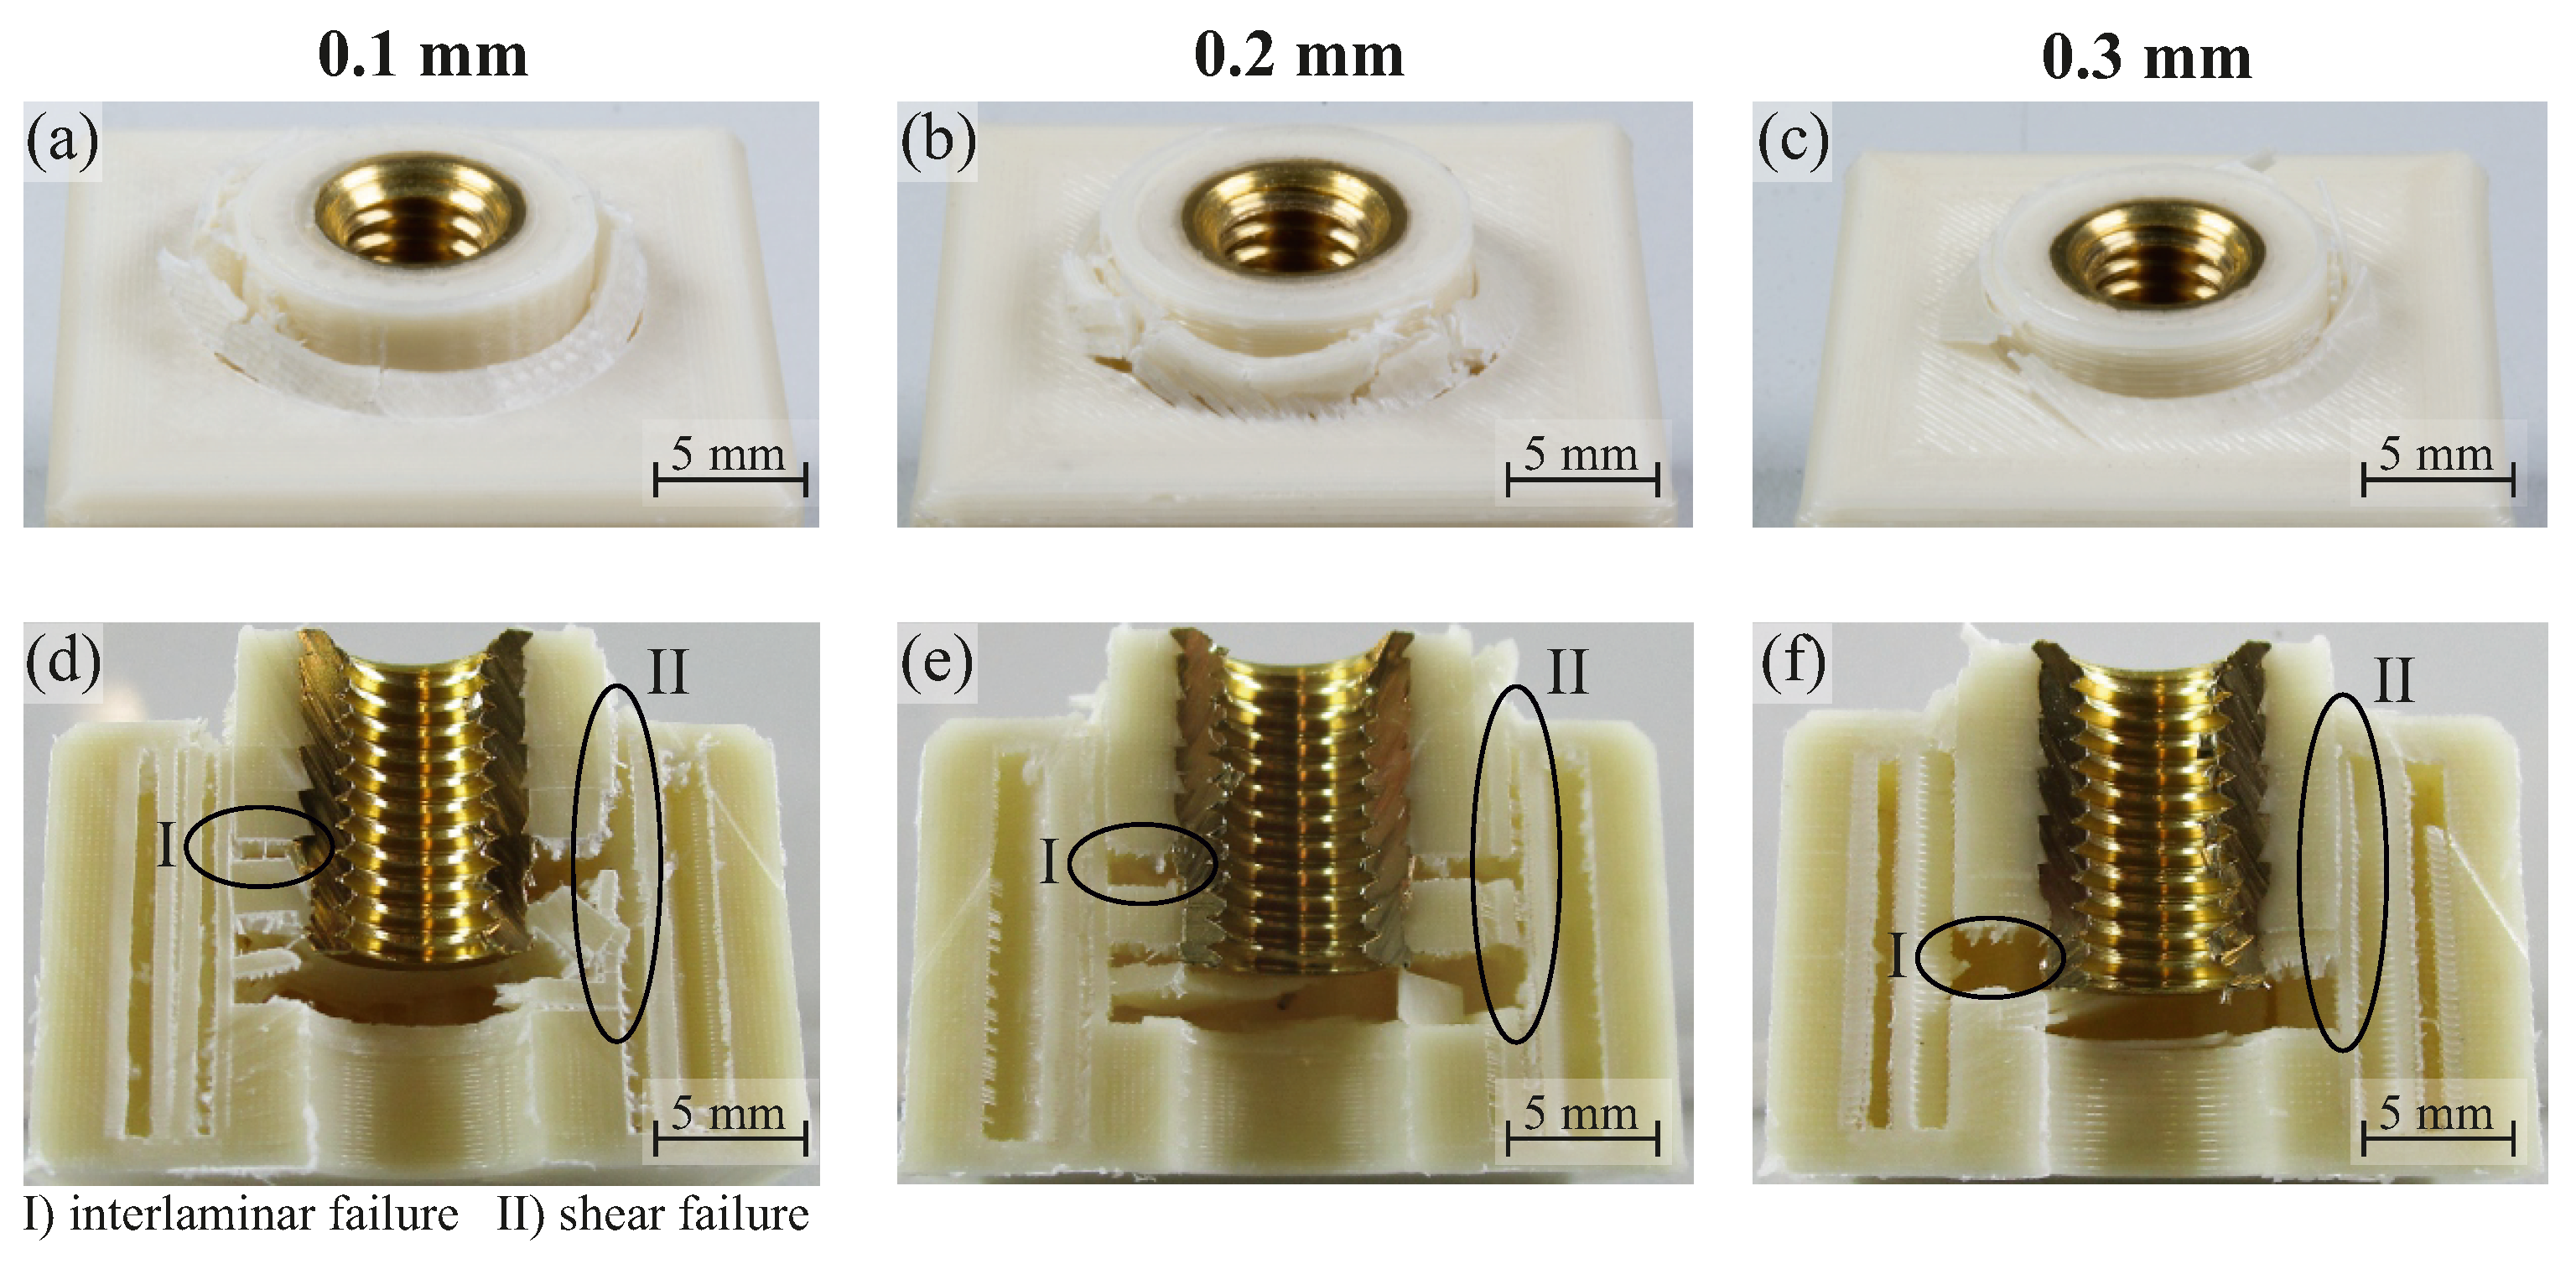
3.3. Layer Height
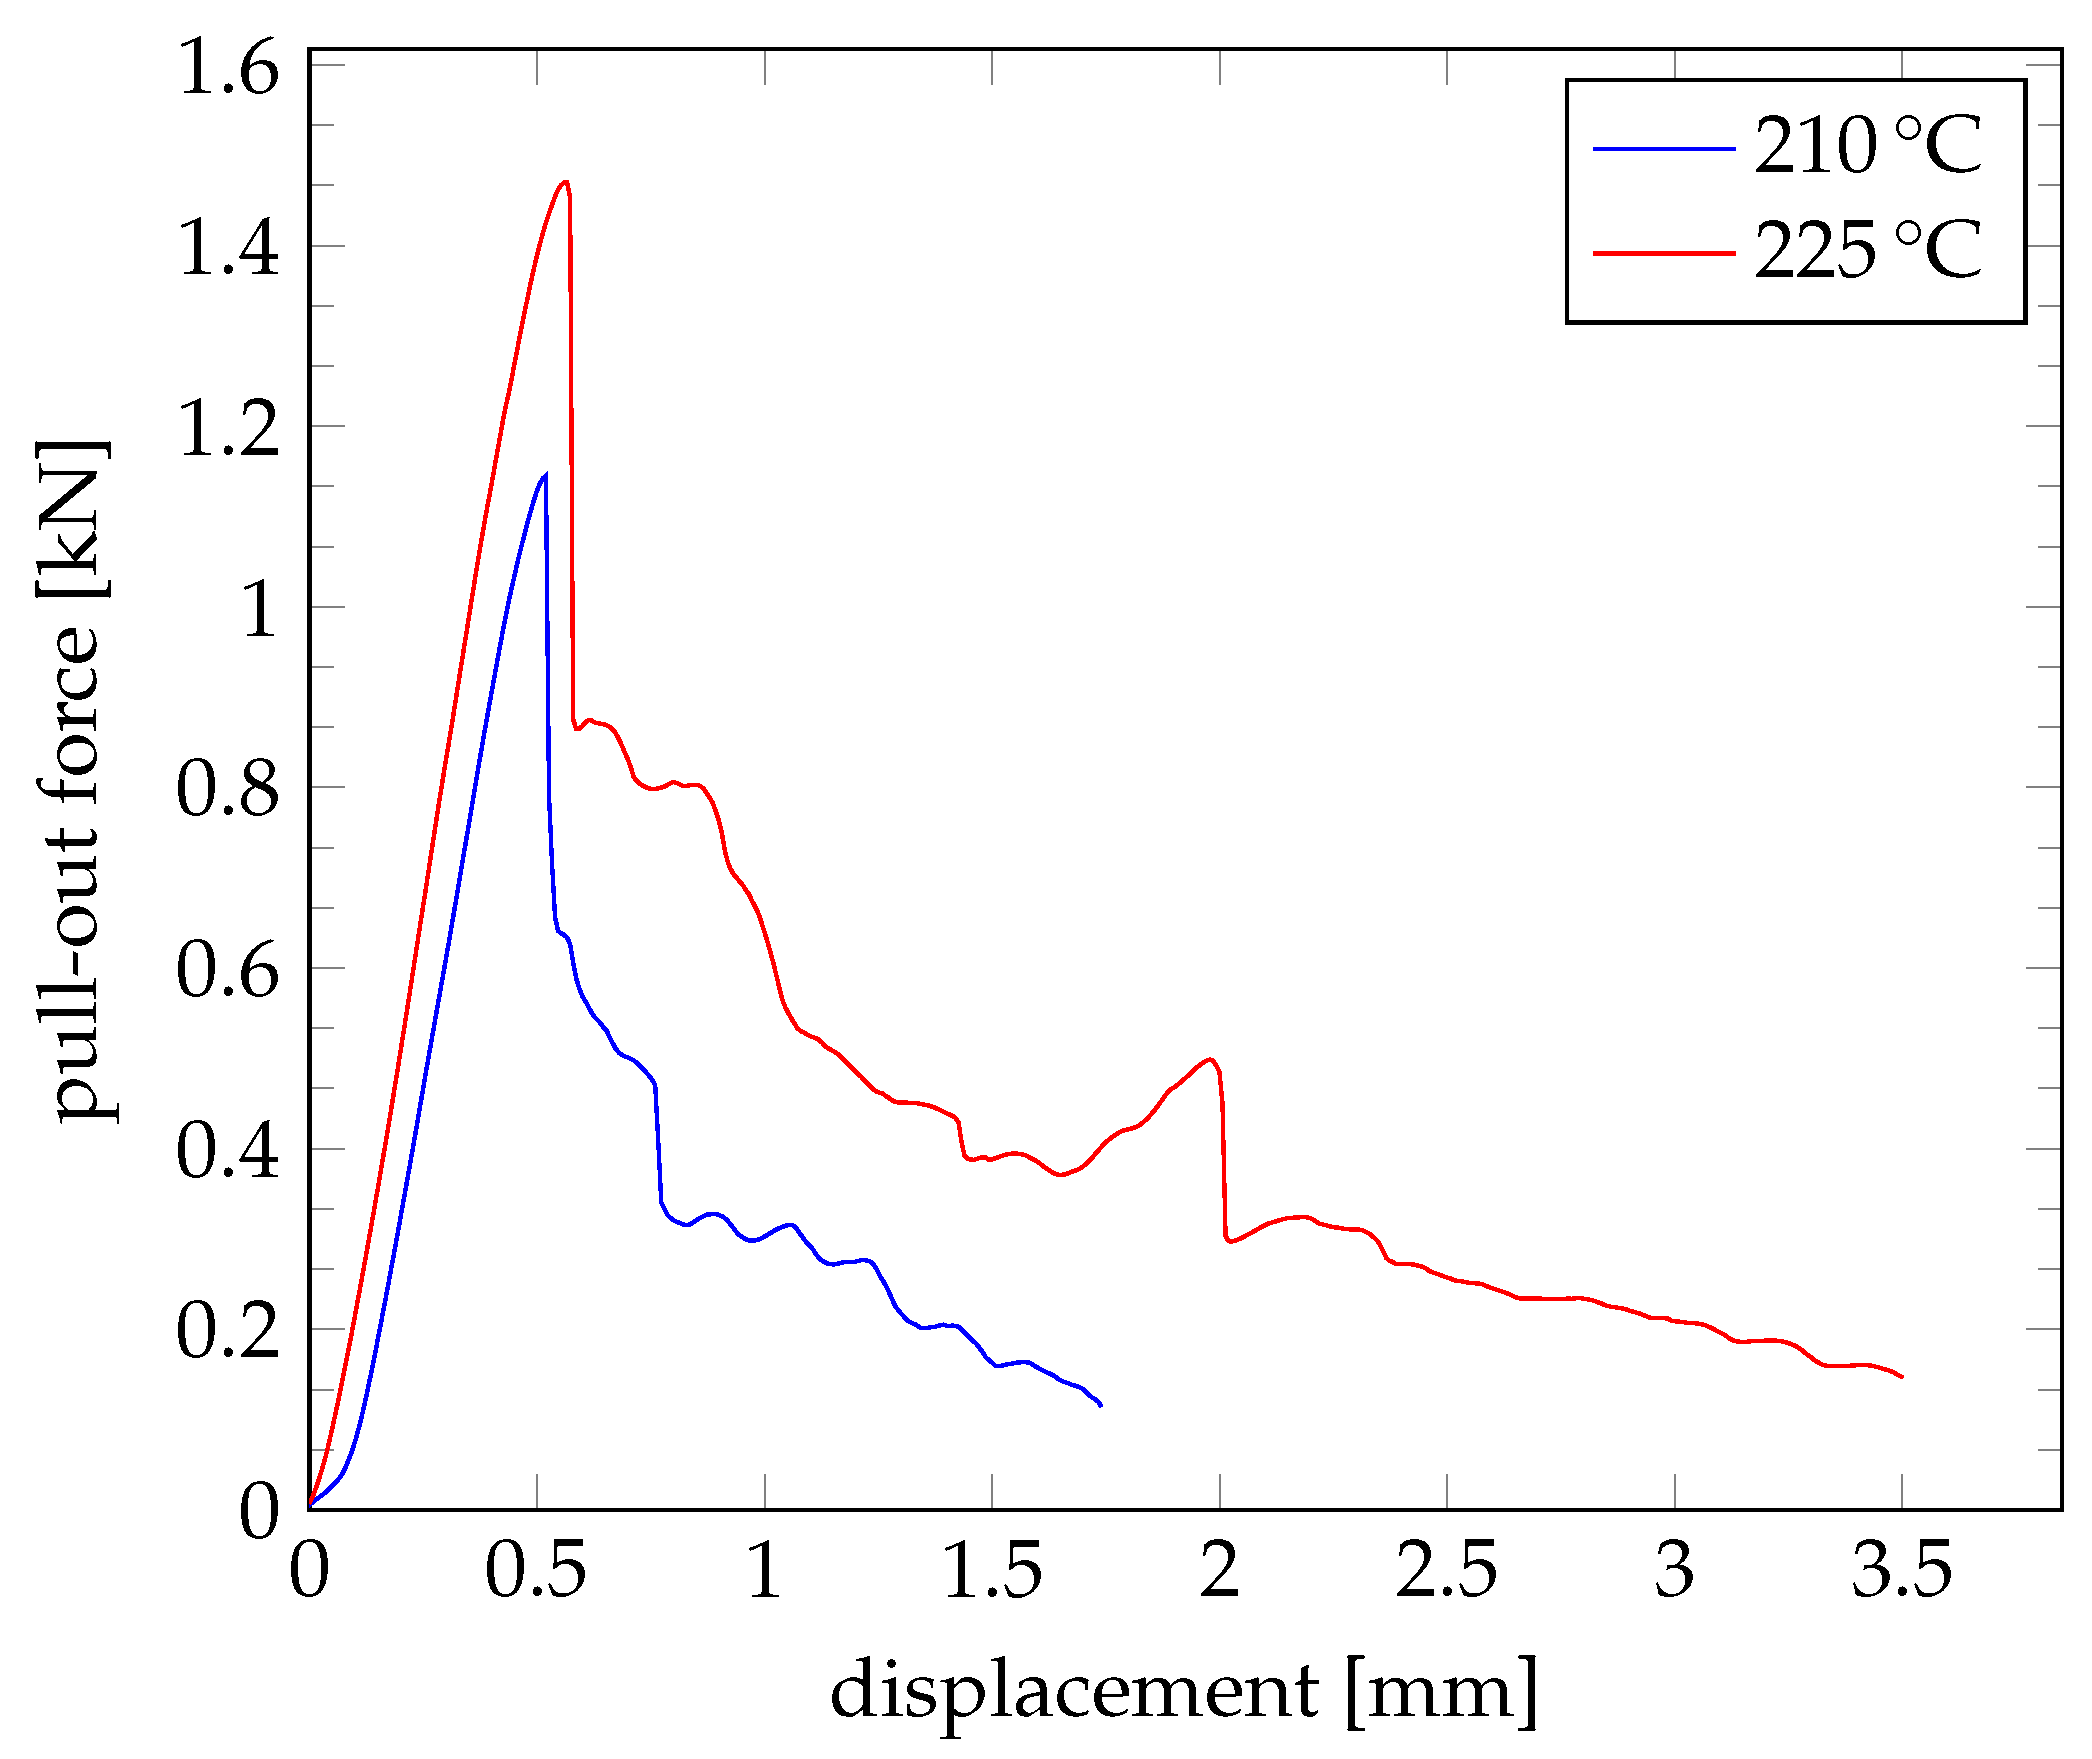
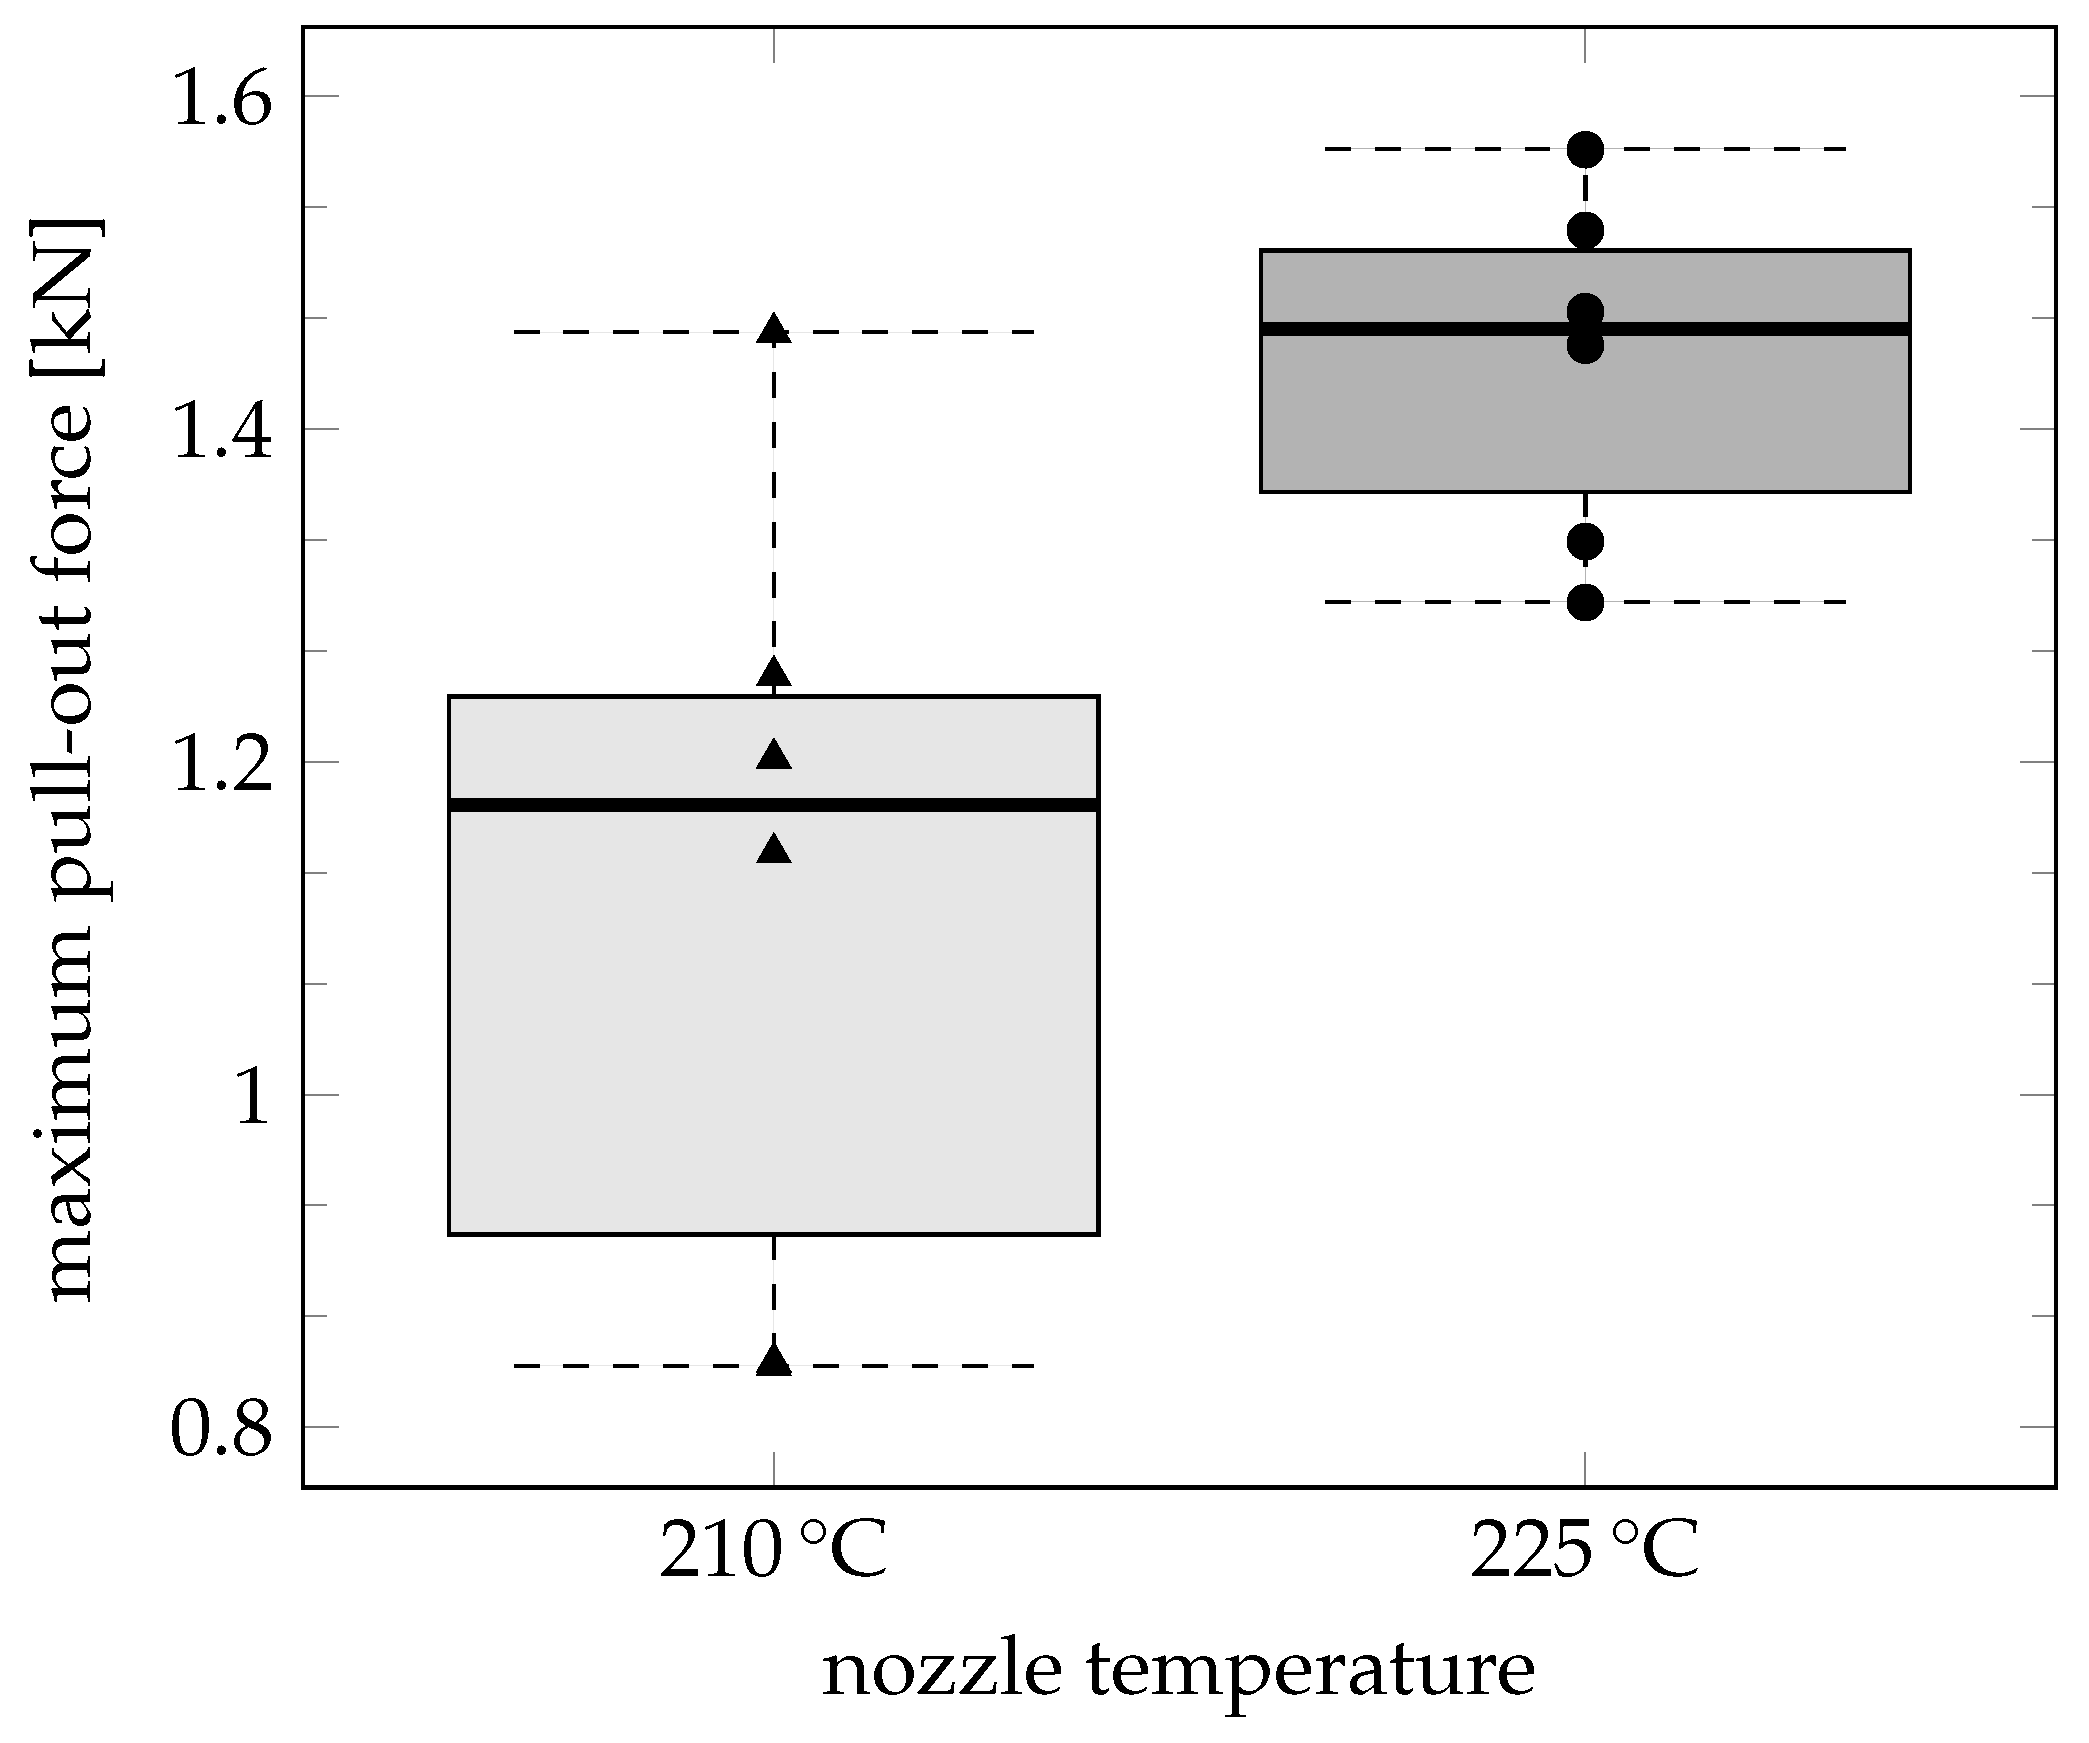
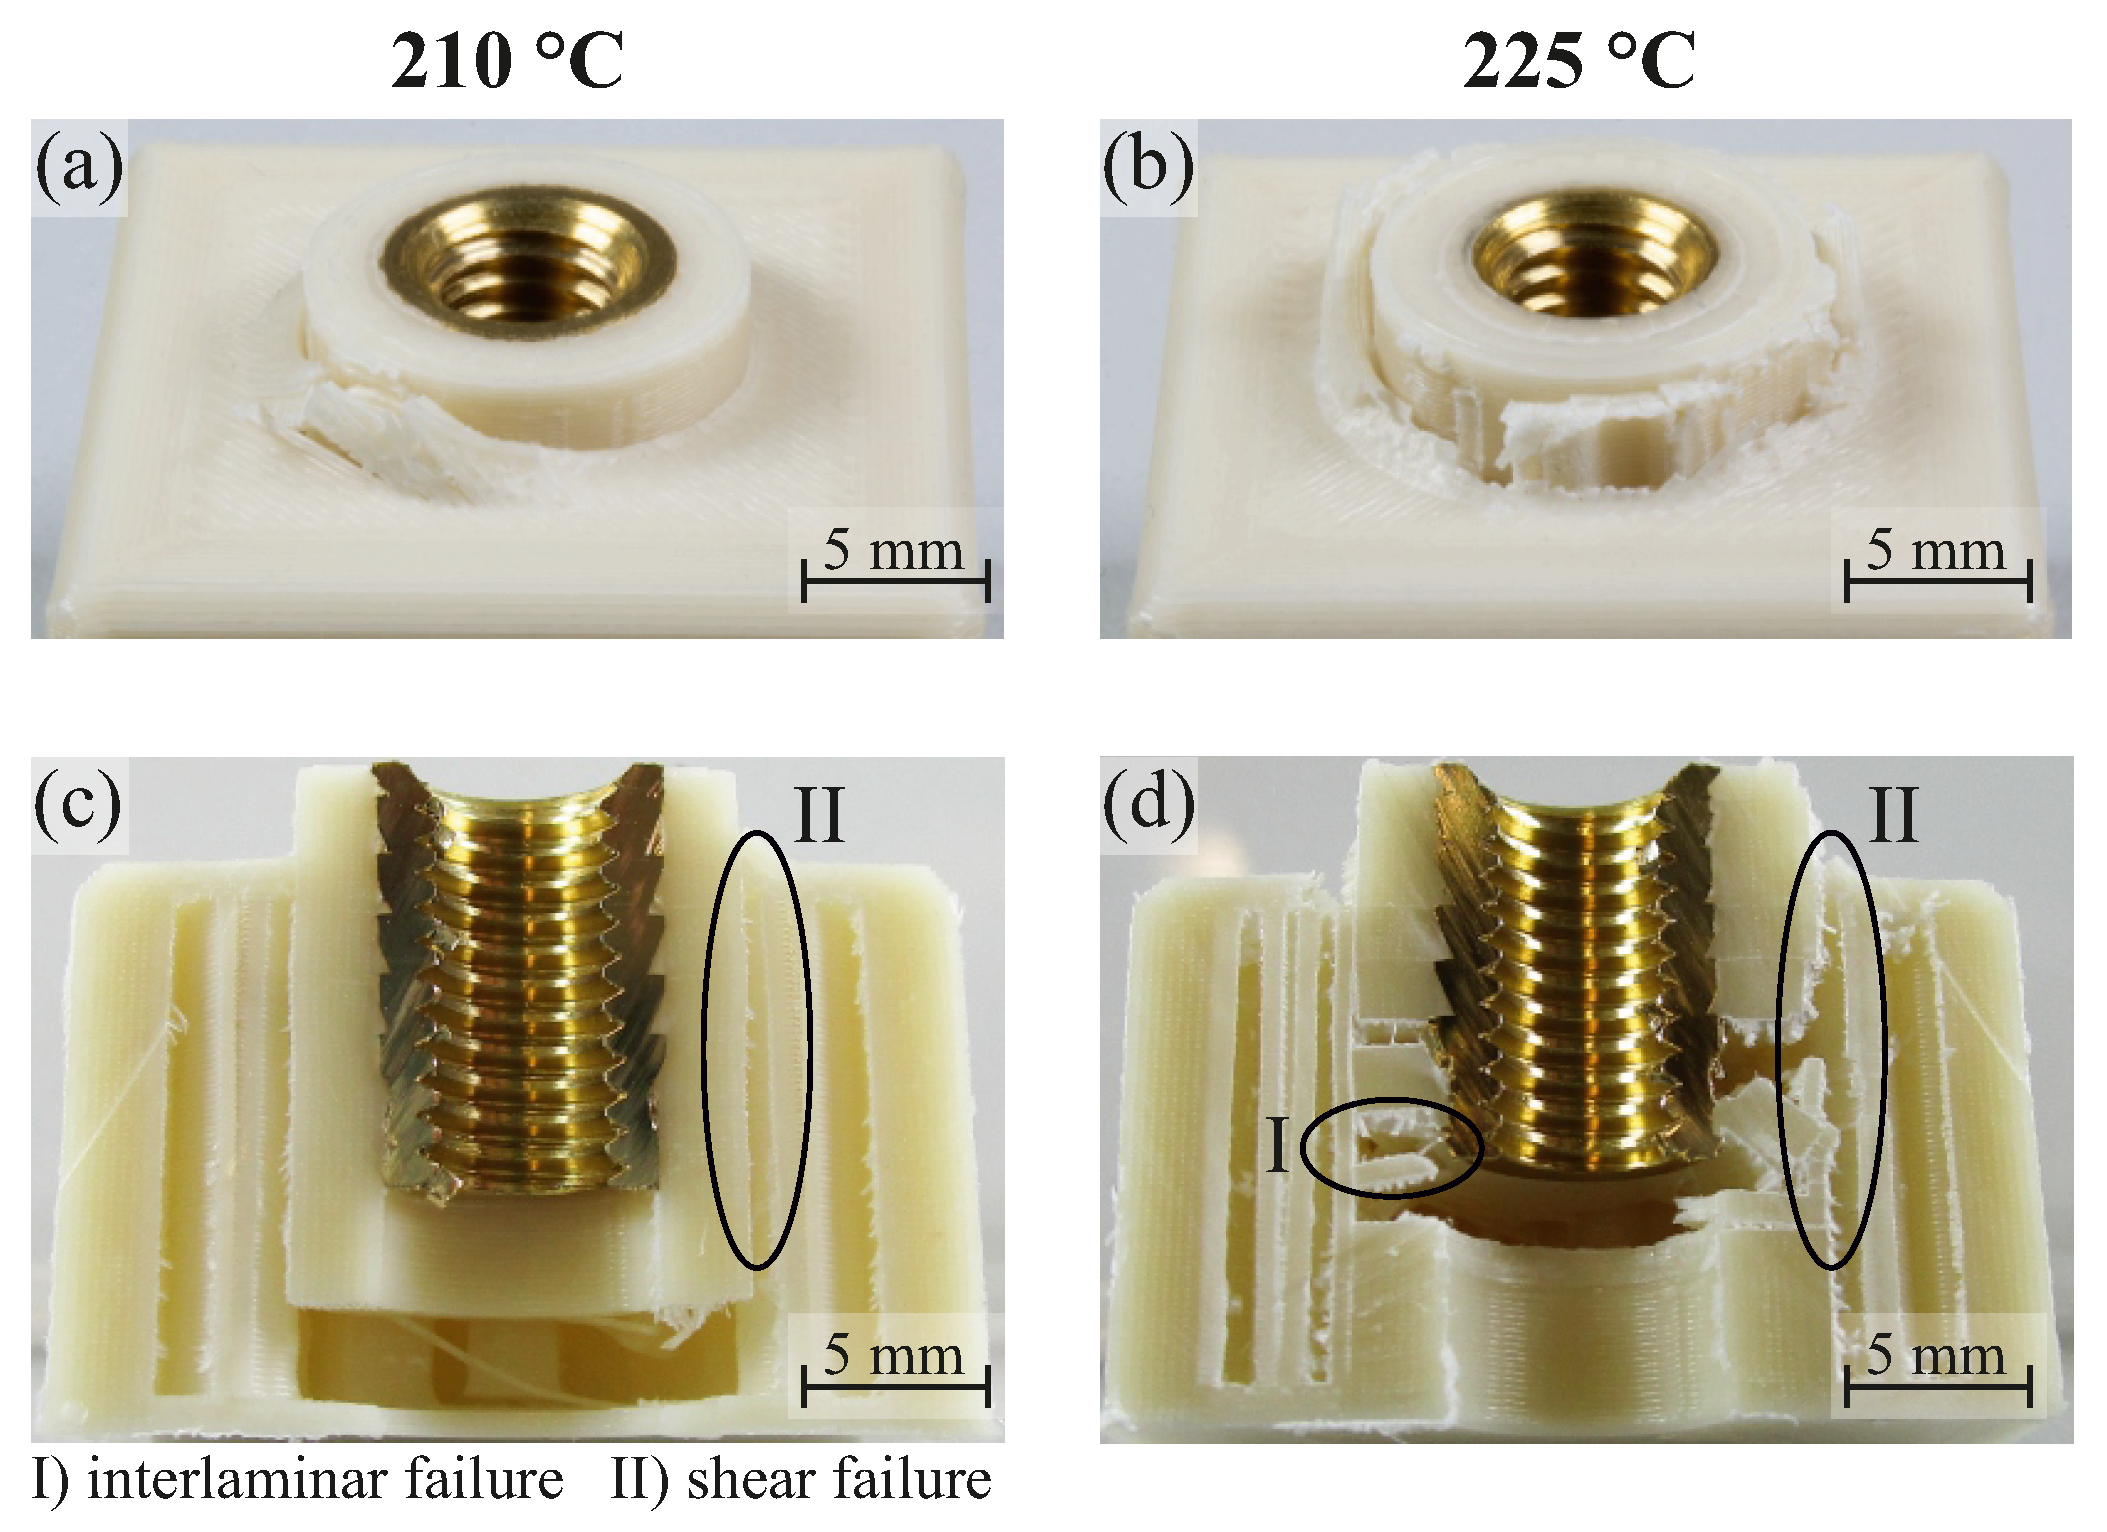
3.4. Nozzle Temperature
4. Conclusions and Outlook
- the infill density should be 70% or higher;
- the minimum wall thickness should be m;
- the layer height should be m or smaller;
- the printing temperature should be 225 °C.
Author Contributions
Funding
Data Availability Statement
Acknowledgments
Conflicts of Interest
Abbreviations
| AM | Additive Manufacturing |
| FLM | Fused-Layer Modelling |
References
- Drummer, D.; Wudy, K.; Drexler, M. Modelling of the aging behavior of polyamide 12 powder during laser melting process. AIP Conf. Proc. 2015, 1664, 160007. [Google Scholar]
- Gibson, I.; Rosen, D.; Stucker, B. Additive Manufacturing Technologies; Springer: New York, NY, USA, 2015. [Google Scholar]
- Roberts, T.; Varotsis, A. 3D Printing Trends 2020: Industry Highlights and Market Trends; Hubs Manufacturing LLC: Amsterdam, The Netherlands, 2021. [Google Scholar]
- Safavi, M.S.; Bordbar-Khiabani, A.; Khalil-Allafi, J.; Mozafari, M.; Visai, L. Additive Manufacturing: An Opportunity for the Fabrication of Near-Net-Shape NiTi Implants. J. Manuf. Mater. Process. 2022, 6, 65. [Google Scholar] [CrossRef]
- Gebhardt, A.; Hötter, J. Additive Manufacturing: 3D Printing for Prototyping and Manufacturing; Hanser Publishers: Munich, Germany; Cincinnati, OH, USA, 2016. [Google Scholar]
- Gebhardt, A. Understanding Additive Manufacturing: Rapid Prototyping, Rapid Tooling, Rapid Manufacturing; Hanser Publishers: Munich, Germany; Cincinnati, OH, USA, 2012. [Google Scholar]
- Thiesse, F.; Wirth, M.; Kemper, H.-G.; Moisa, M.; Morar, D.; Lasi, H.; Piller, F.; Buxmann, P.; Mortara, L.; Ford, S.; et al. Economic Implications of Additive Manufacturing and the Contribution of MIS. Bus. & Inf. Syst. Eng. 2015, 57, 139–148. [Google Scholar]
- Hertle, S.; Kleffel, T.; Wörz, A.; Drummer, D. Production of polymer-metal hybrids using extrusion-based additive manufacturing and electrochemically treated aluminum. Addit. Manuf. 2020, 33, 101135. [Google Scholar] [CrossRef]
- Troschitz, J.; Gröger, B.; Würfel, V.; Kupfer, R.; Gude, M. Joining Processes for Fibre-Reinforced Thermoplastics: Phenomena and Characterisation. Materials 2022, 15, 5454. [Google Scholar] [CrossRef] [PubMed]
- Meschut, G.; Merklein, M.; Brosius, A.; Drummer, D.; Fratini, L.; Füssel, U.; Gude, M.; Homberg, W.; Martins, P.A.F.; Bobbert, M.; et al. Review on mechanical joining by plastic deformation. J. Adv. Join. Process. 2022, 5, 100113. [Google Scholar] [CrossRef]
- Troschitz, J.; Kupfer, R.; Gude, M. Experimental investigation of the load bearing capacity of inserts embedded in thermoplastic composites. In Proceedings of the fourth International Conference Hybrid Materials and Structures, Online, 28–29 April 2020. [Google Scholar]
- Troschitz, J.; Kupfer, R.; Gude, M. Process-integrated embedding of metal inserts in continuous fibre reinforced thermoplastics. Procedia CIRP 2019, 85, 84–89. [Google Scholar] [CrossRef]
- Troschitz, J.; Vorderbrüggen, J.; Kupfer, R.; Gude, M.; Meschut, G. Joining of Thermoplastic Composites with Metals Using Resistance Element Welding. Appl. Sci. 2020, 10, 7251. [Google Scholar] [CrossRef]
- Gebhardt, J.; Fleischer, J. Experimental investigation and performance enhancement of inserts in composite parts. Procedia CIRP 2014, 23, 7–12. [Google Scholar] [CrossRef]
- Troughton, M. Handbook of Plastics Joining: A Practical Guide, 2nd ed.; William Andrew: Norwich, NY, USA, 2008. [Google Scholar]
- Herrera-Franco, P.J.; Cloud, G.L. Strain-Relief Inserts for Composite Fasteners—An Experimental Study. J. Compos. Mater. 1992, 26, 751–768. [Google Scholar] [CrossRef]
- Kajzer, W.; Gieracka, K.; Pawlik, M.; Basiaga, M.; Kajzer, A.; Szewczenko, J. Tests of threaded connections made by additive manufacturing technologies. In Innovations in Biomedical Engineering; Tkacz, E., Gzik, M., Paszenda, Z., Piętka, E., Eds.; Springer International Publishing: Cham, Switzerland, 2019; Volume 925, pp. 329–337. [Google Scholar]
- Omidvarkarjan, D.; Balicki, P.; Baumgartner, H.; Rosenbauer, R.; Fontana, F.; Meboldt, M. The AM Dowel—A Novel Insert for the Integration of Threads into Additive Manufactured Polymer Components. In Industrializing Additive Manufacturing; Meboldt, M., Klahn, C., Eds.; AMPA 2020; Springer: Cham, Switzerland, 2021. [Google Scholar]
- Ultrasonic Joining of Moulded Parts and Semi-Finished Parts of Thermoplastic Polymers in Mass Production—Insertion of Metal Parts and Other Materials with Ultrasonic; DVS 2216-4; DVS Media: Düsseldorf, Germany, 2020.
- Tome, A.; Wilhelm, G.; Dratschmidt, F. Threaded inserts in plastic. Kunststoffe Plast Eur. 1999, 89, 16–18. [Google Scholar]
- Tome, A.; Ehrenstein, G.W.; Dratschmidt, F. Joint Performance of Mechanical Fasteners under Dynamic Load—Self-Tapping Screws in Comparison with Threaded Inserts in Brass and Plastic. In Plastics Design Library, Plastics Failure Analysis and Prevention; Moalli, J., Ed.; William Andrew Publishing: Norwich, NY, USA, 2001; pp. 53–61. [Google Scholar]
- Threaded Inserts for Plastics. Available online: https://www.mouser.com/datasheet/2/974/sidata-1901160.pdf (accessed on 21 December 2022).
- Therad Inserts for the Joining of Mouldings Made of Plastics; DVS 2240-1; DVS Media: Düsseldorf, Germany, 2005.
- Maier, J.; Vogel, C.; Lebelt, T.; Geske, V.; Behnisch, T.; Modler, N.; Gude, M. Adhesion Studies during Generative Hybridization of Textile-Reinforced Thermoplastic Composites via Additive Manufacturing. Materials 2021, 14, 3888. [Google Scholar] [CrossRef] [PubMed]
- Borowski, A.; Vogel, C.; Behnisch, T.; Geske, V.; Gude, M.; Modler, N. Additive Manufacturing-Based In Situ Consolidation of Continuous Carbon Fibre-Reinforced Polycarbonate. Materials 2021, 14, 2450. [Google Scholar] [CrossRef] [PubMed]
- Bembenek, M.; Kowalski, Ł.; Kosoń-Schab, A. Research on the Influence of Processing Parameters on the Specific Tensile Strength of FDM Additive Manufactured PET-G and PLA Materials. Polymers 2022, 14, 2446. [Google Scholar] [CrossRef] [PubMed]
- Wang, L.; Gramlich, W.; Gardner, D. Improving the impact strength of Poly(lactic acid) (PLA) in fused layer modeling (FLM). Polymer 2017, 114, 242–248. [Google Scholar] [CrossRef]
- Kain, S.; Ecker, J.V.; Haider, A. Effects of the infill pattern on mechanical properties of fused layer modeling (FLM) 3D printed wood/polylactic acid (PLA) composites. Eur. J. Wood Prod. 2020, 78, 65–74. [Google Scholar] [CrossRef]
- Material Datasheet Extrudr, GreenTec Pro. Available online: https://www.extrudr.com/filerpool/download/datei/762/ (accessed on 23 December 2022).
- Pandžić, A.; Hodzic, D.; Milovanović, A. Effect of Infill Type and Density on Tensile Properties for FDM Prozess. In Proceedings of the 30th DAAAM International Symposium on Intelligent Manufacturing and Automation, Zadar, Croatia, 23–26 October 2019; pp. 7–10. [Google Scholar]
- Kuznetsov, V.E.; Solonin, A.N.; Urzhumtsev, O.D.; Schilling, R.; Tavitov, A.G. Strength of PLA Components Fabricated with Fused Deposition Technology Using a Desktop 3D Printer as a Function of Geometrical Parameters of the Process. Polymers 2018, 10, 313. [Google Scholar] [CrossRef] [Green Version]


| Property | Unit | Value |
|---|---|---|
| Tensile Modulus | [MPa] | 4300 |
| Tensile Strength | [MPa] | 58 |
| Elongation at Strength | [%] | 2.8 |
| Melting Temperature | [°C] | 180–200 |
| Density | [g/cm−3] | 1.35 |
| Test Series | |||||
|---|---|---|---|---|---|
| Property | Unit | Infill Density | Wall Thickness | Layer Height | Nozzle Temperature |
| Bed Temperature | [°C] | 60 | 60 | 60 | 60 |
| Nozzle Diameter | [mm] | 0.4 | 0.4 | 0.4 | 0.4 |
| Count of Top Layers | [-] | 5 | 5 | 5 | 5 |
| Fill Pattern | [-] | Grid | Grid | Grid | Grid |
| Infill Density | [%] | 30–70 | 30 | 30 | 30 |
| Wall Thickness | [mm] | 3.2 | 1.2–3.2 | 3.2 | 3.2 |
| Layer Height | [mm] | 0.2 | 0.2 | 0.1–0.3 | 0.2 |
| Nozzle Temperature | [°C] | 225 | 225 | 225 | 210–225 |
Disclaimer/Publisher’s Note: The statements, opinions and data contained in all publications are solely those of the individual author(s) and contributor(s) and not of MDPI and/or the editor(s). MDPI and/or the editor(s) disclaim responsibility for any injury to people or property resulting from any ideas, methods, instructions or products referred to in the content. |
© 2023 by the authors. Licensee MDPI, Basel, Switzerland. This article is an open access article distributed under the terms and conditions of the Creative Commons Attribution (CC BY) license (https://creativecommons.org/licenses/by/4.0/).
Share and Cite
Kastner, T.; Troschitz, J.; Vogel, C.; Behnisch, T.; Gude, M.; Modler, N. Investigation of the Pull-Out Behaviour of Metal Threaded Inserts in Thermoplastic Fused-Layer Modelling (FLM) Components. J. Manuf. Mater. Process. 2023, 7, 42. https://doi.org/10.3390/jmmp7010042
Kastner T, Troschitz J, Vogel C, Behnisch T, Gude M, Modler N. Investigation of the Pull-Out Behaviour of Metal Threaded Inserts in Thermoplastic Fused-Layer Modelling (FLM) Components. Journal of Manufacturing and Materials Processing. 2023; 7(1):42. https://doi.org/10.3390/jmmp7010042
Chicago/Turabian StyleKastner, Tobias, Juliane Troschitz, Christian Vogel, Thomas Behnisch, Maik Gude, and Niels Modler. 2023. "Investigation of the Pull-Out Behaviour of Metal Threaded Inserts in Thermoplastic Fused-Layer Modelling (FLM) Components" Journal of Manufacturing and Materials Processing 7, no. 1: 42. https://doi.org/10.3390/jmmp7010042