1. Introduction
The welding procedure has been applied to almost all industries since it was first discovered in 1800. Welding is a manufacturing process whereby two or more metal parts are bonded through heat, pressure and both forming a joint [
1]. Commonly, the welding process is used in many industries and constructions, such as railroads, bridges, shipping, steel structures, and the automotive and maritime industries. Based on the joining process, welding can be classified into shielded metal arc welding (SMAW), submerged arc welding (SAW), gas metal arc welding (GMAW), gas tungsten arc welding (GTAW), and others. Welding based on the welded material can be divided into similar and dissimilar welding [
2].
Commonly, in the industry, for engineering and cost reduction reasons, dissimilar metal welding is unavoidable. Dissimilar metal welding can be found widely in many production lines, such as boilers, rig towers, automotive components, and nuclear power plant component manufacturing. Dissimilar metal welding combines two types of materials with different contents, for example, welding between stainless steel and carbon steel or between duplex and carbon steel [
3].
Much effort has been conducted in dissimilar welding research on weld metal composition, the influence of usage conditions, mechanical properties, and physical properties, and resistance to corrosion or oxidation. Some material pairs for dissimilar welding applications include martensite–austenite, duplex–carbon steel, austenite steel–inconel, and austenite–ferritic steel [
4,
5,
6].
Some issues are still challenging in dissimilar metal welding, such as the difference in melting point temperature, brittle phase formation and solubility of the two metals, and residual stress due to differences in thermal conductivity and expansion coefficients [
7,
8,
9]. Moreover, choosing a suitable filler wire is more challenging. Both the base materials and the filler material should be compatible. Hot cracking in the fusion zone and heat affected zone (HAZ) along with the formation of undesirable secondary phases in the weldment are the outcomes of inappropriate filler wire selection [
10]. Mechanical-metallurgical characteristics and bead quality greatly influence the quality of a dissimilar weld joint.
Furthermore, welding parameters such as current, voltage, position, speed, and many more in the welding process have an essential role in determining weld joint quality [
11,
12]. Previous authors have utilized the shielded metal arc welding (SMAW) method for dissimilar joint metals. SMAW with a welding current of 150 A and an arc voltage in the range of 13 to 15 V was utilized by Manikandan et al. (2017) to create a join between nickel-based superalloy Incoloy 800 and stainless steel AISI 316L [
13]. Verma et al. (2016) have successfully joined 316L ASS and 22% Cr DSS 2205 with welding parameters of 70–120 A and 16–25 V for current and arc voltage, respectively [
14]. Moreover, another study was performed by Verma et al. (2016), with a welding current of 120 A, a welding speed of 3.1–3.3 mm/s, and an arc voltage in the range of 25–26 V for joining A2205 and SS316L [
15].
Optimizing dissimilar welding becomes challenging because of the many factors involved in the welding process, both controllable and uncontrollable. Ghosh et al. (2017) reported the effect of welding parameters GMAW on the mechanical properties of AISI 409 and AISI 316L through the Taguchi approach [
16]. Daniyan et al. (2018) analyzed welding parameters to obtain predictive weld distortion and hardness models using the Taguchi method and response surface methodology (RSM) [
17]. Mahmood and Alwan (2019) also utilized the Taguchi method approach to discuss the welding parameters’ effect on steel’s hardness and flexural strength, and to obtain the optimized values [
18].
Stainless steels with austenitic compositions, such as SS316 and ASTM A36, are extensively utilized. SS316 is frequently used in industrial applications such as heat exchangers, dyeing equipment, and pipelines due to its corrosion resistance, high-temperature resistance, and mechanical properties. ASTM A36 generates welded and bolted metal structures for general construction and mechanical engineering applications. It has good machinability and ductility but is not corrosion resistant. Although many welded members fail because of tensile and bending failures, inappropriate hardness and poor tensile and bending strength may also cause failure. Many studies also do not consider welding parameters’ effect on hardness, tensile, and bending strength.
This research investigates the effect of SMAW welding parameters (electrode type, welding current, arc voltage, and welding speed) on the hardness, flexural strength, and bending strength of SS316 and low-carbon steel to obtain optimized values.
2. Materials and Methods
In this work, SS316 and ASTM A36 have been taken as the raw material. The chemical composition of base materials is shown in
Table 1, characterized by using metal analyzer Model PMI-Master Smart-Mobile optical emission spectrometers.
Table 1 shows that SS316 consists of chromium 18%, molybdenum 2.12%, and nickel 10.1%. The chromium content encourages passivation, while molybdenum and nickel enhance stainless steel’s corrosion, heat, and creep resistance. Commonly, austenitic stainless steel contains at least 8% nickel; however, the high-nickel alloy is required under a corrosive environment and high-temperature application.
The shielded metal arc welding was performed using a welding machine (Vantage 500 Deutz) with 30–575 A and 2.5–8 mm for the current and electrode ranges. The plate steel of size 150 mm × 100 mm × 5 mm was machined with a V-groove with a 55° inclined angle for tensile and hardness testing. All welded specimens have passed a visual examination and an X-ray radiographic test. Following visual inspections and X-ray radiographic screening, the machining process is carried out to obtain a tensile test specimen.
A Hung Ta Type HT 9502 universal testing machine was utilized to investigate tensile strength and flexural strength based on the ASTM E8-08 standard of tension testing. The hardness value on the fusion zone was analyzed based on the ASTM E10-17 standard test method for Brinell hardness using BH-3CF Type from Tokyo Testing Machine MFG Co. Ltd., Japan,. Furthermore, a measuring microscope STM6 from Olympus was used to study the microstructural of the welding joints.
The Taguchi method is based on an orthogonal array experiment, which is a matrix of some rows and columns [
19]. Each column represents certain factors or conditions that can change from one experiment to another. The arrays are called orthogonal because each level of each factor is balanced and can be separated from the influence of other factors in the experiment. The degrees of freedom are determined based on the main factors observed and the interactions observed, the number of levels of the factors observed, and the resolution of the desired experiment.
The Taguchi method offers an effective and efficient approach to improving quality design and performance. Moreover, the large number of experiments can be reduced by using Taguchi. An orthogonal array in the Taguchi method is used to investigate the interaction of entire process parameters. Taguchi’s procedure uses the
S/N ratio to improve the performance characteristics. Typically, the
S/N ratio can be characterized into three categories: the lower-the-better (Equation (1)), the larger-the-better (Equation (2)), and the nominal the-better (Equation (3)).
where
Y is the measured value of the response variable,
n is the repeated experiment number, and
σ is the standard deviation. The larger-the-better quality characteristic is employed to improve the tensile strength of weld joints through optimum process parameters in shielded metal arc welding. Furthermore, the confirmation experiment is conducted to confirm the optimal process parameters level [
20,
21].
Four welding parameters were designated, comprising electrode type, welding current, arc voltage, and welding speed, as shown in
Table 2. The parameters were chosen based on common practical welding parameters and available equipment setting. An electrode with a diameter of 2.6 mm was used during welding and uses two layers. Furthermore, the experimental layout and factors distribution of the orthogonal array (L9) can be seen in
Table 3.
The multiple responses in this study also are analyzed using a grey relational analysis (GRA). The grey relational analysis was devised to address problems associated with multiple choices, ambiguity, and discrete information [
22]. As a result of this calculation, a single numerical score represents an average of several different responses. In GRA, the factor’s function is often ignored when the standardized value and reference sequence range are both very high. Furthermore, if the intent and direction of the components conflict, the GRA results may be erroneous. For this reason, before analysis, data pre-processing is performed to normalize the original reference sequence to a comparable sequence in the range of zero to one [
23].
Grey relational generation is the phrase used to describe the process of pre-processing data via normalizing and converting it into a collection of sequences. When performing a pre-processing step with GRA, the response of the modified sequences can be divided into two quality characteristics, which are larger-the-better and smaller-the-better, respectively. Equation (4) can be used to normalize a sequence when the larger-the-better characteristic is present.
where
xi*(
k) is the sequence after pre-processing for the
ith experiment, and
yi(
k) is the sequence of the mean responses for the
ith experiment.
It is necessary to normalize the sequence before proceeding to the next stage, which is to calculate the deviation sequence of the reference sequence using Equation (5). Once the sequence has been normalized, the following steps must be completed:
where deviation, reference, and comparability sequences are denoted by
Equation (6) is then used to calculate the grey relational coefficient (GRC).
where
is the GRC of individual response variables and is derived as a function of the minimum
and maximum
variances of each response. It is common practice to set the distinguishing or identification coefficient, denoted by the symbol ζ and specified in the range [0, 1], at 0.5 to provide equal weights to each parameter in the model. A composite grey relational grade (GRG) is then calculated by averaging the grey relational coefficient (GRC) of each response variable, as indicated in Equation (7).
where
i is the value of GRG determined for the
ith experiment, and n indicates the total number of performance characteristics measured across all experiments.
Analysis of variance (ANOVA) is utilized for both Taguchi and GRA as it allows quantitative evaluation of each factor’s contribution to all response measurements. The purpose of the used analysis of variance is to discover the contribution of the components to the parameter design to determine the model’s accuracy. For ANOVA, the total number of squares, the number of squares to the mean, the sum of the factor squares, and the sum of the error squares must be calculated.
3. Results and Discussion
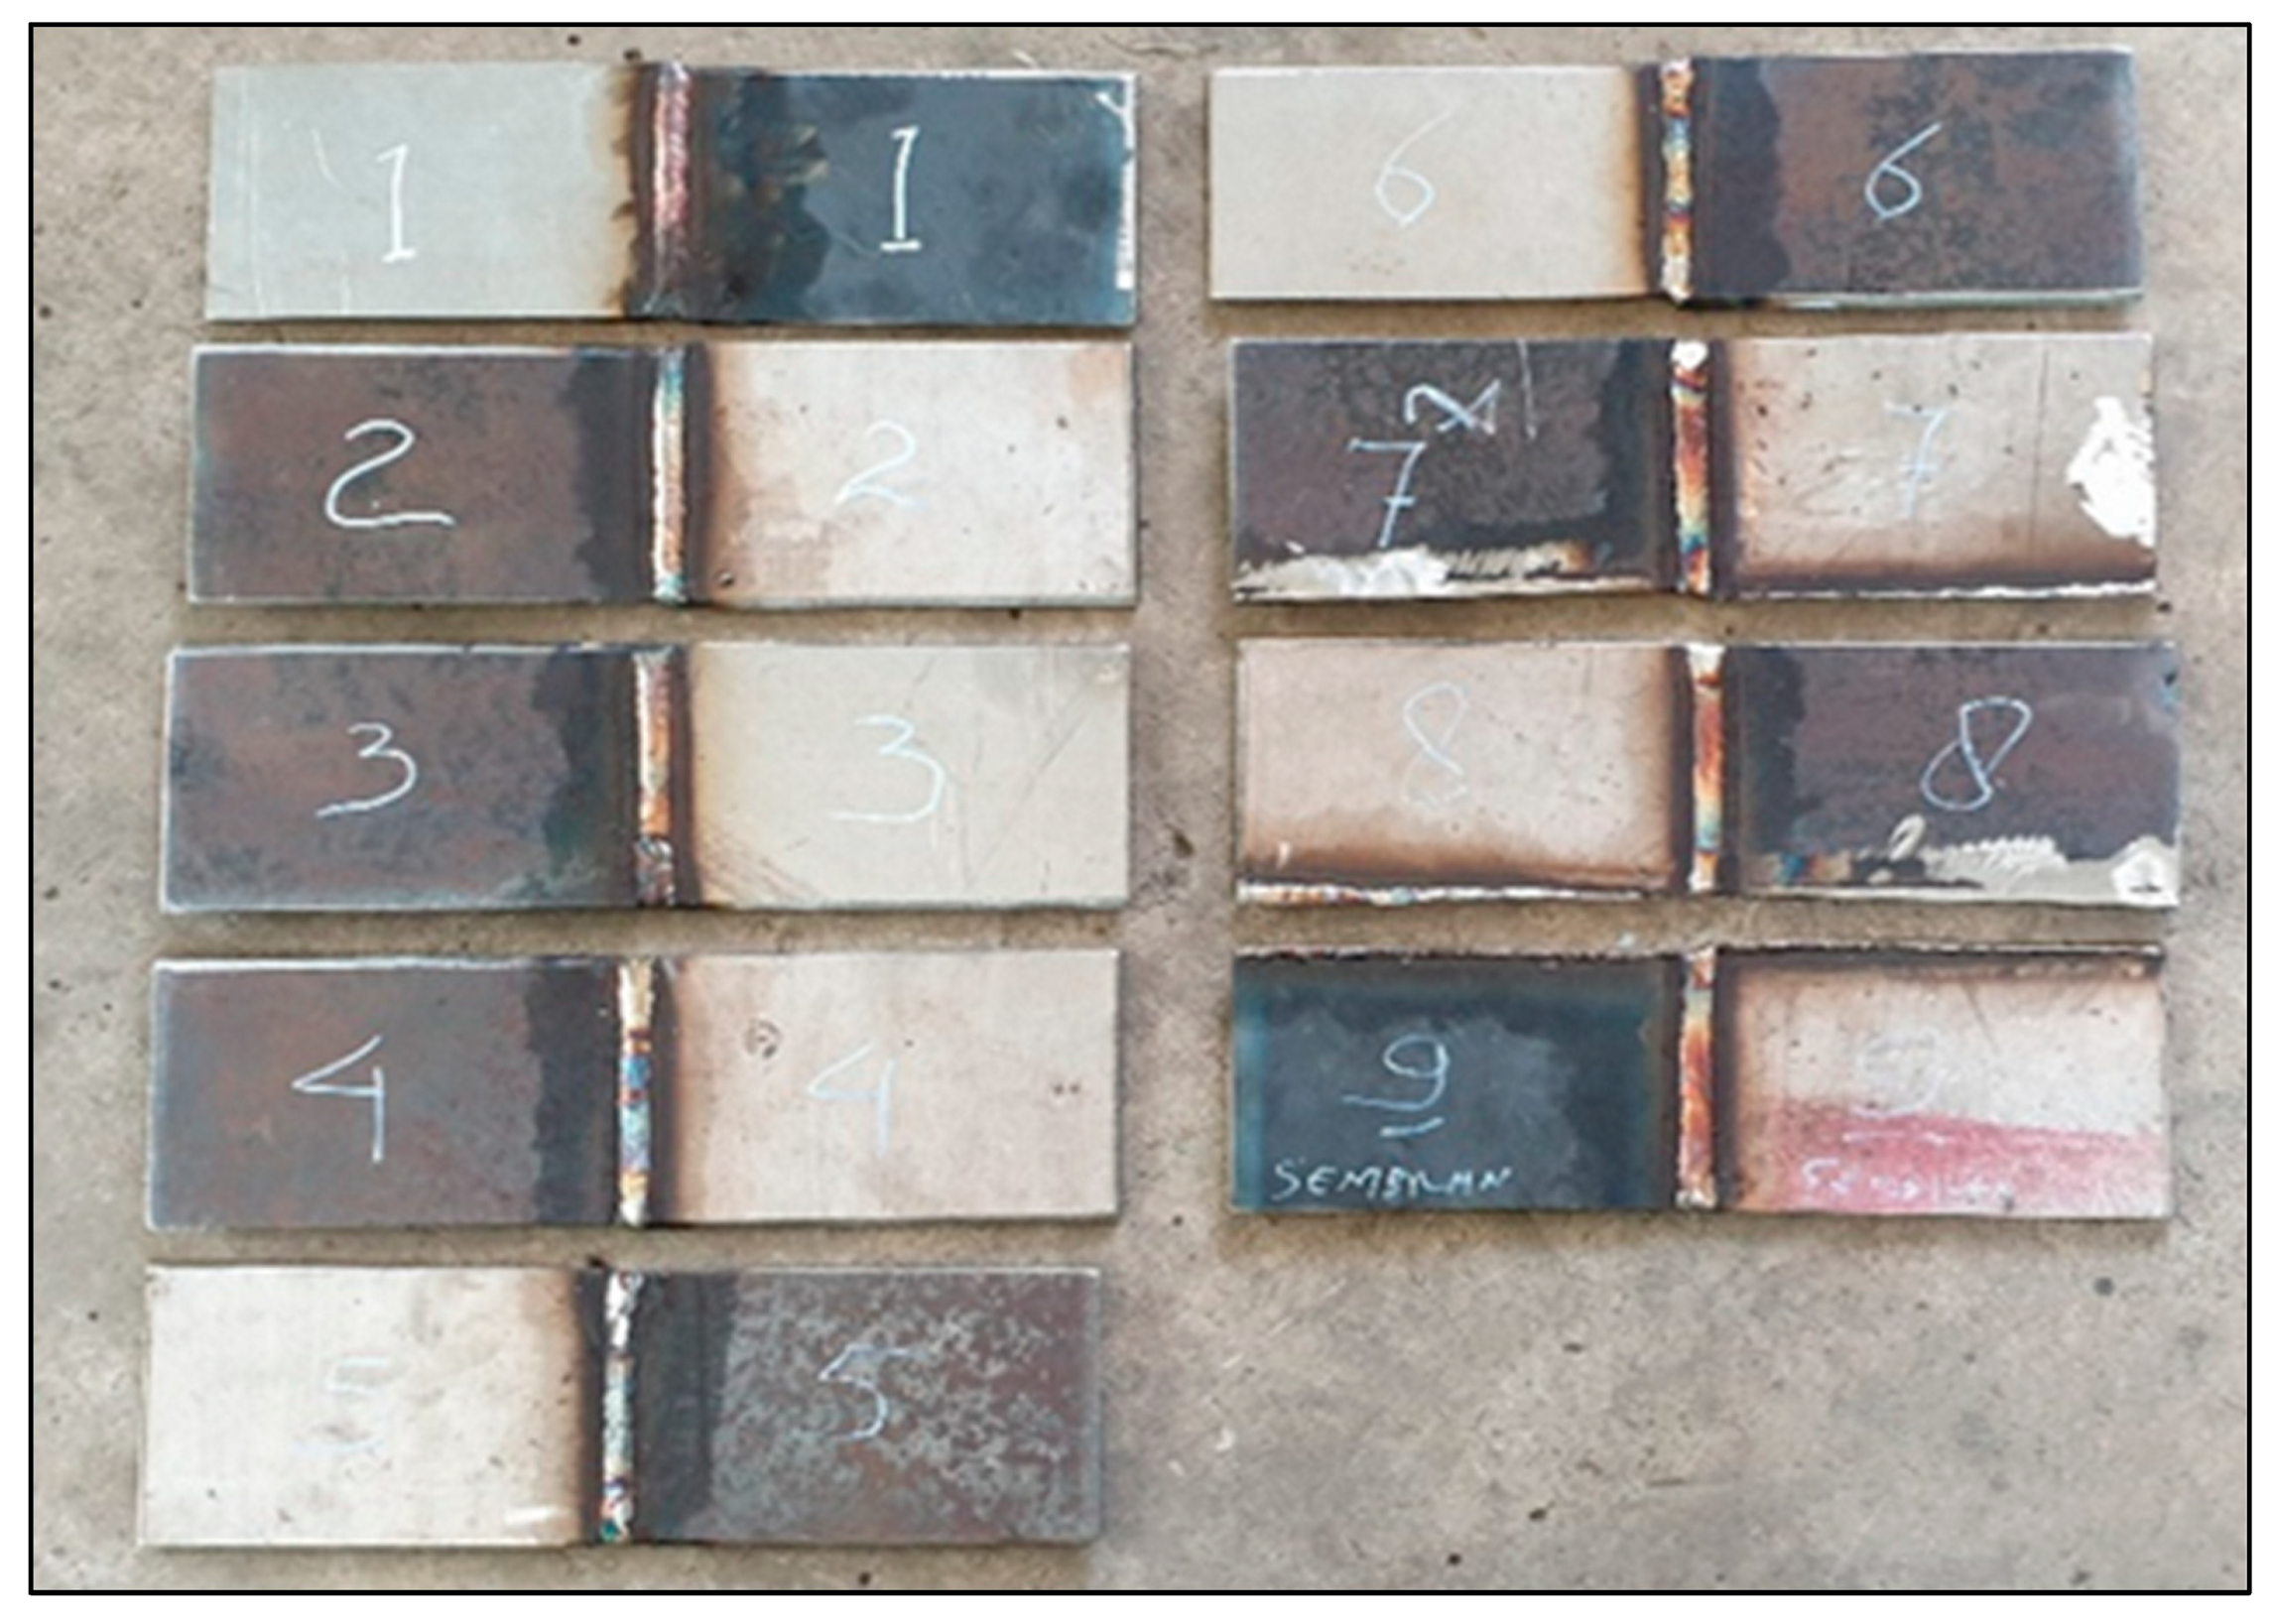
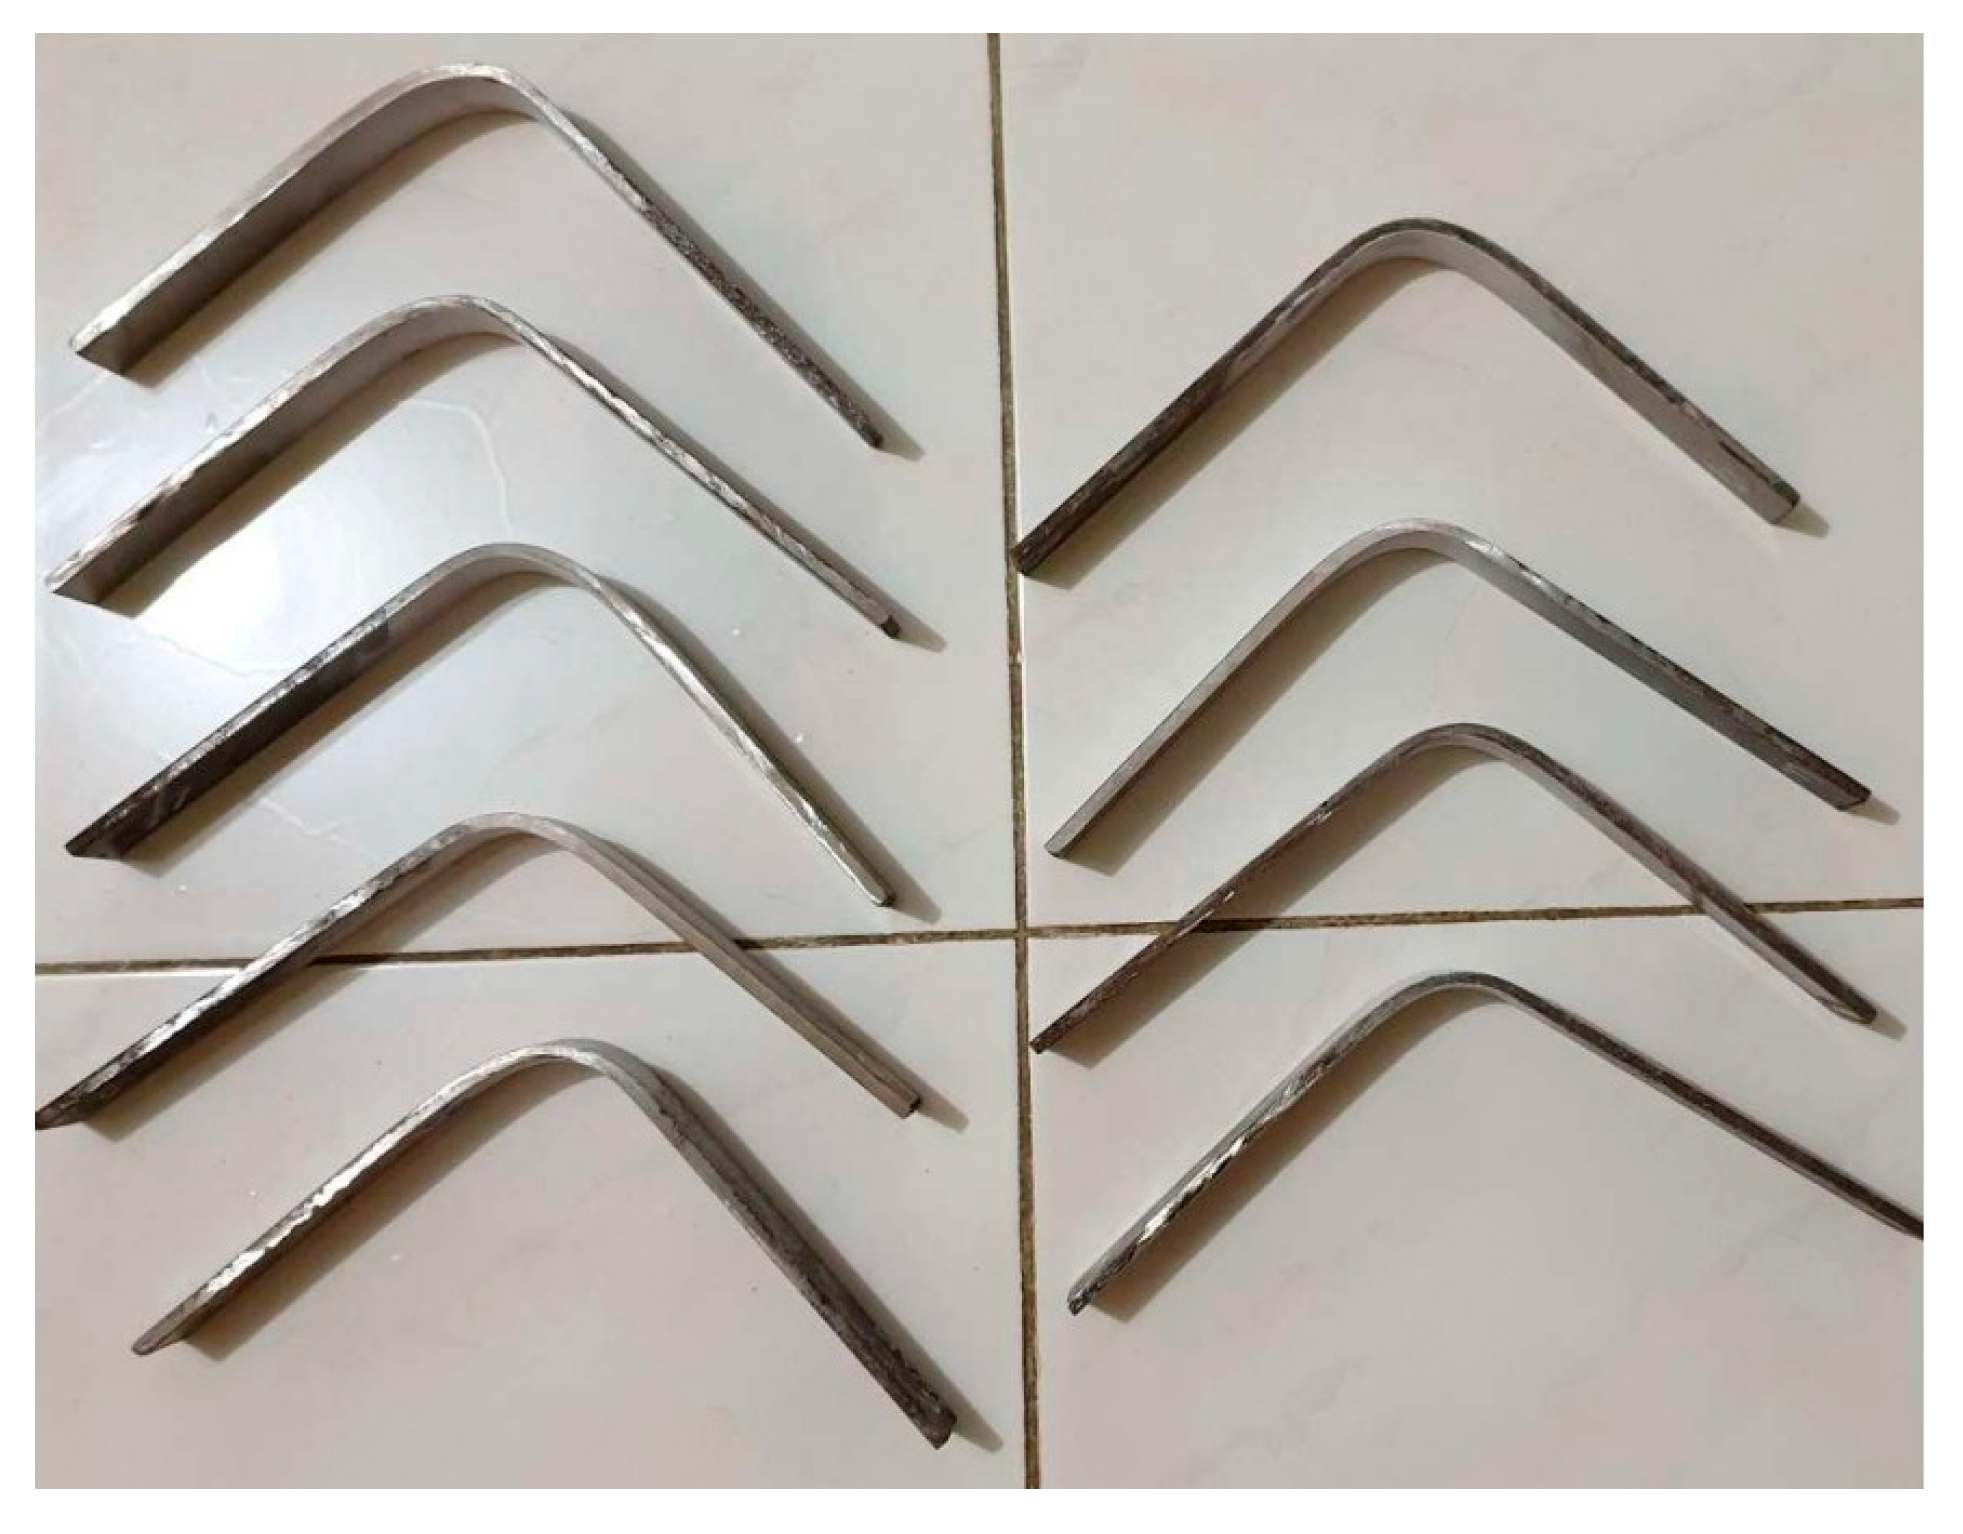
Figure 1 shows the weld joint of SS316 and ASTM A36 with nine welding parameters referred to as the L9 orthogonal array. All the weld joints have been approved by radiographic examination, proving the soundness of the weld.
Specimen parts that do not pass the screening will not be used to produce specimens. Incomplete penetration is the common defect that appears during the experiment. It occurs when the groove of the metal is not filled. Another fault, incomplete fusion, was observed in experiment No. 4. Incomplete fusion defects occur when there is a lack of proper fusion between the base metal and the weld metal. They can also appear between adjoining weld beads, creating a gap in the joint not filled with molten metal. Many factors contribute to defects during welding, including improper welding input parameters such as current, nasty filler metal and base metal, faster arc travel speed, the presence of oxides, scale, etc.
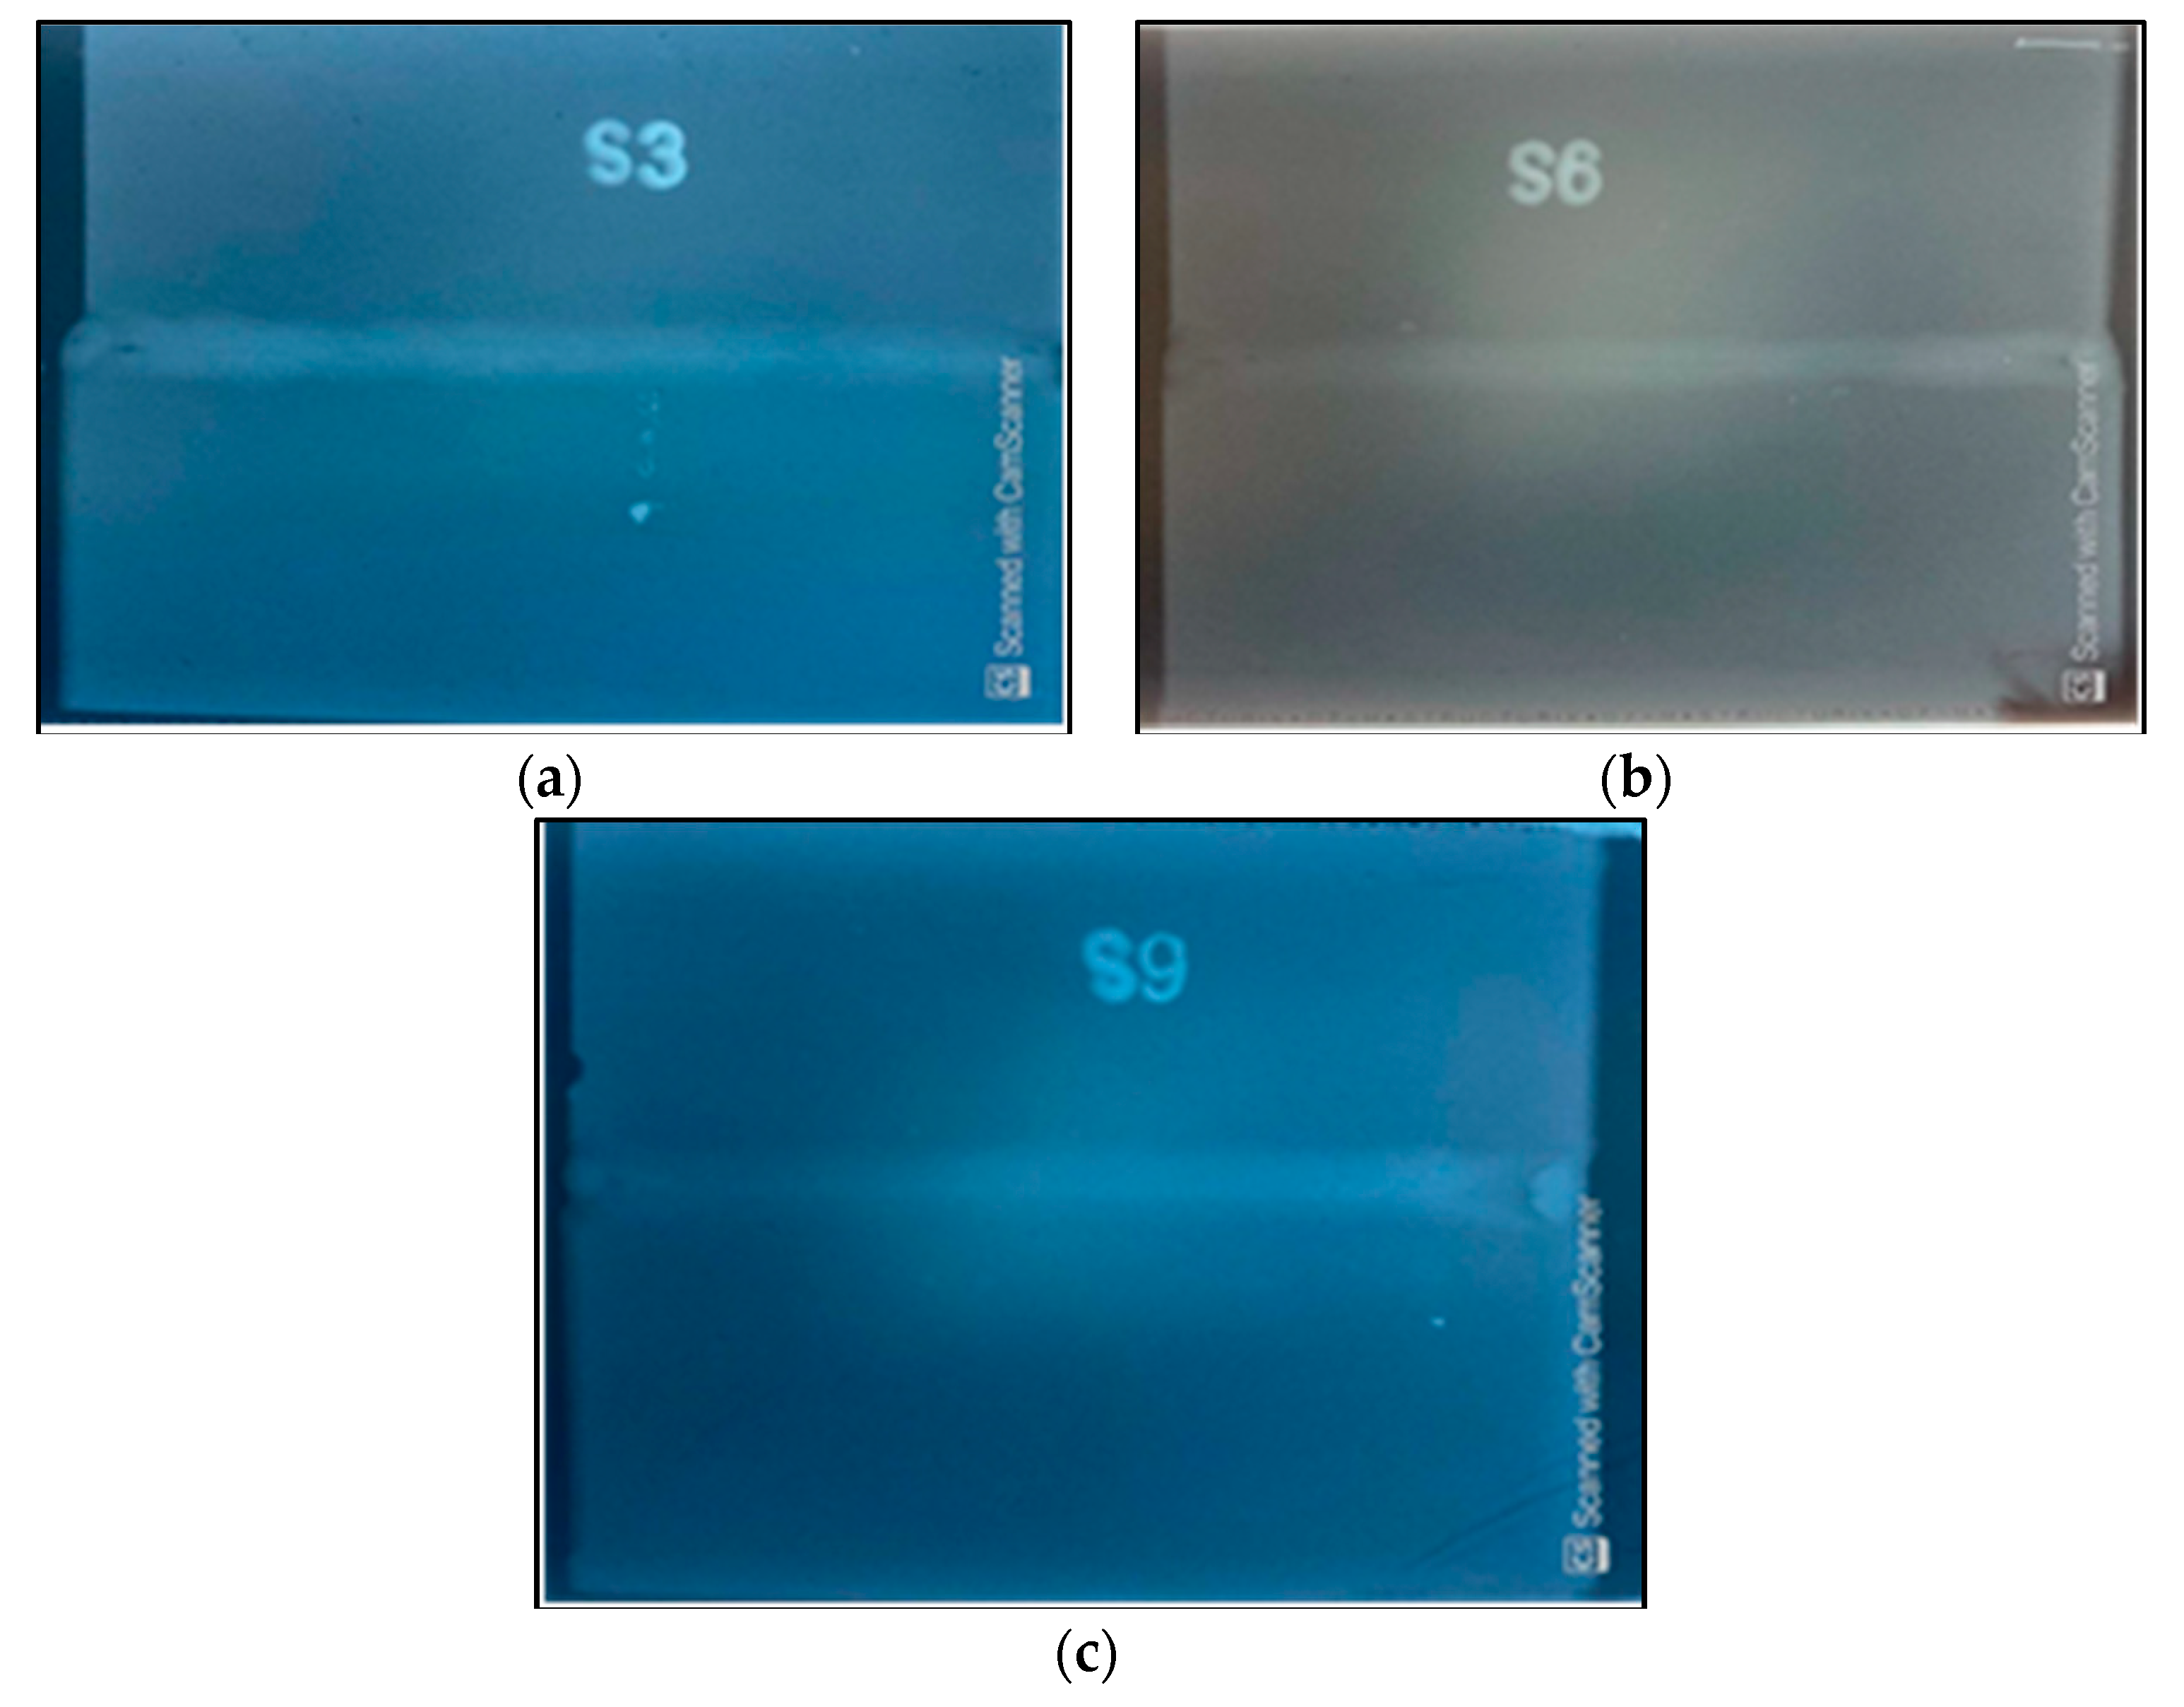
X-ray radiographic tests have been conducted for all nine samples. A few examples of typical copies of radiography film are given in
Figure 2.
Table 4 shows all design experiments’ hardness, tensile strength, and flexural strength. It is shown that the maximum hardness (275 HBW) is at E312, 110 A, 16 V, and 4 cm/min, the maximum tensile strength (433 MPa) is at E309, 100 A, 18 V, and 4 cm/min, and the maximum flexural strength (657 MPa) is at E308, 90 A, 14 V and 4 cm/min.
3.1. Hardness Results
Hardness measurements were carried out on the fusion zone of the weld using the Brinell method. The study of four parameters (electrode type, welding current, arc voltage, and welding speed) for hardness, in terms of the main effects plot for means and the main effects plot for S/N ratios for each interaction, is shown in
Figure 3. The highest yield of hardness signal to noise (S/N) ratio, based on larger-the-better, could be attained at the combined settings of A3, B3, C1, and D1, i.e., an electrode type of E 312, a welding current of 110 A, an arc voltage of 14 V and a welding speed of 4 cm/min.
Figure 3 shows that electrode type and welding current are essential in influencing hardness increase. The hardness decreased with increasing welding speed, and minimum hardness was obtained at 16 volts of arc voltage.
The hardness of metal joints is affected by the concentration of alloys, which is related to carbon equivalent. It is usually used as a reference to determine steel metal joints’ susceptibility to cold cracking. The presence of elements such as Cr, Mo, Ni, and Mn plays a vital role in forming phases that affect mechanical properties [
24]. The Schaeffler diagram can predict phase formation in the fusion zone based on the dilution ratio of both materials [
25]. The maximum hardness of the fusion zone was obtained when the E312 electrode type was utilized to join both specimens.
Table 5 shows that electrode type (A), welding current (B), and welding speed (D) significantly affect the hardness test results. The factor that has the most significant influence is the type of electrode factor of 56.63%, followed by the welding speed factor of 14.65% and the current welding factor of 10.75%. Meanwhile, arc voltages (C) do not significantly affect hardness value.
3.2. Tensile Strength Results
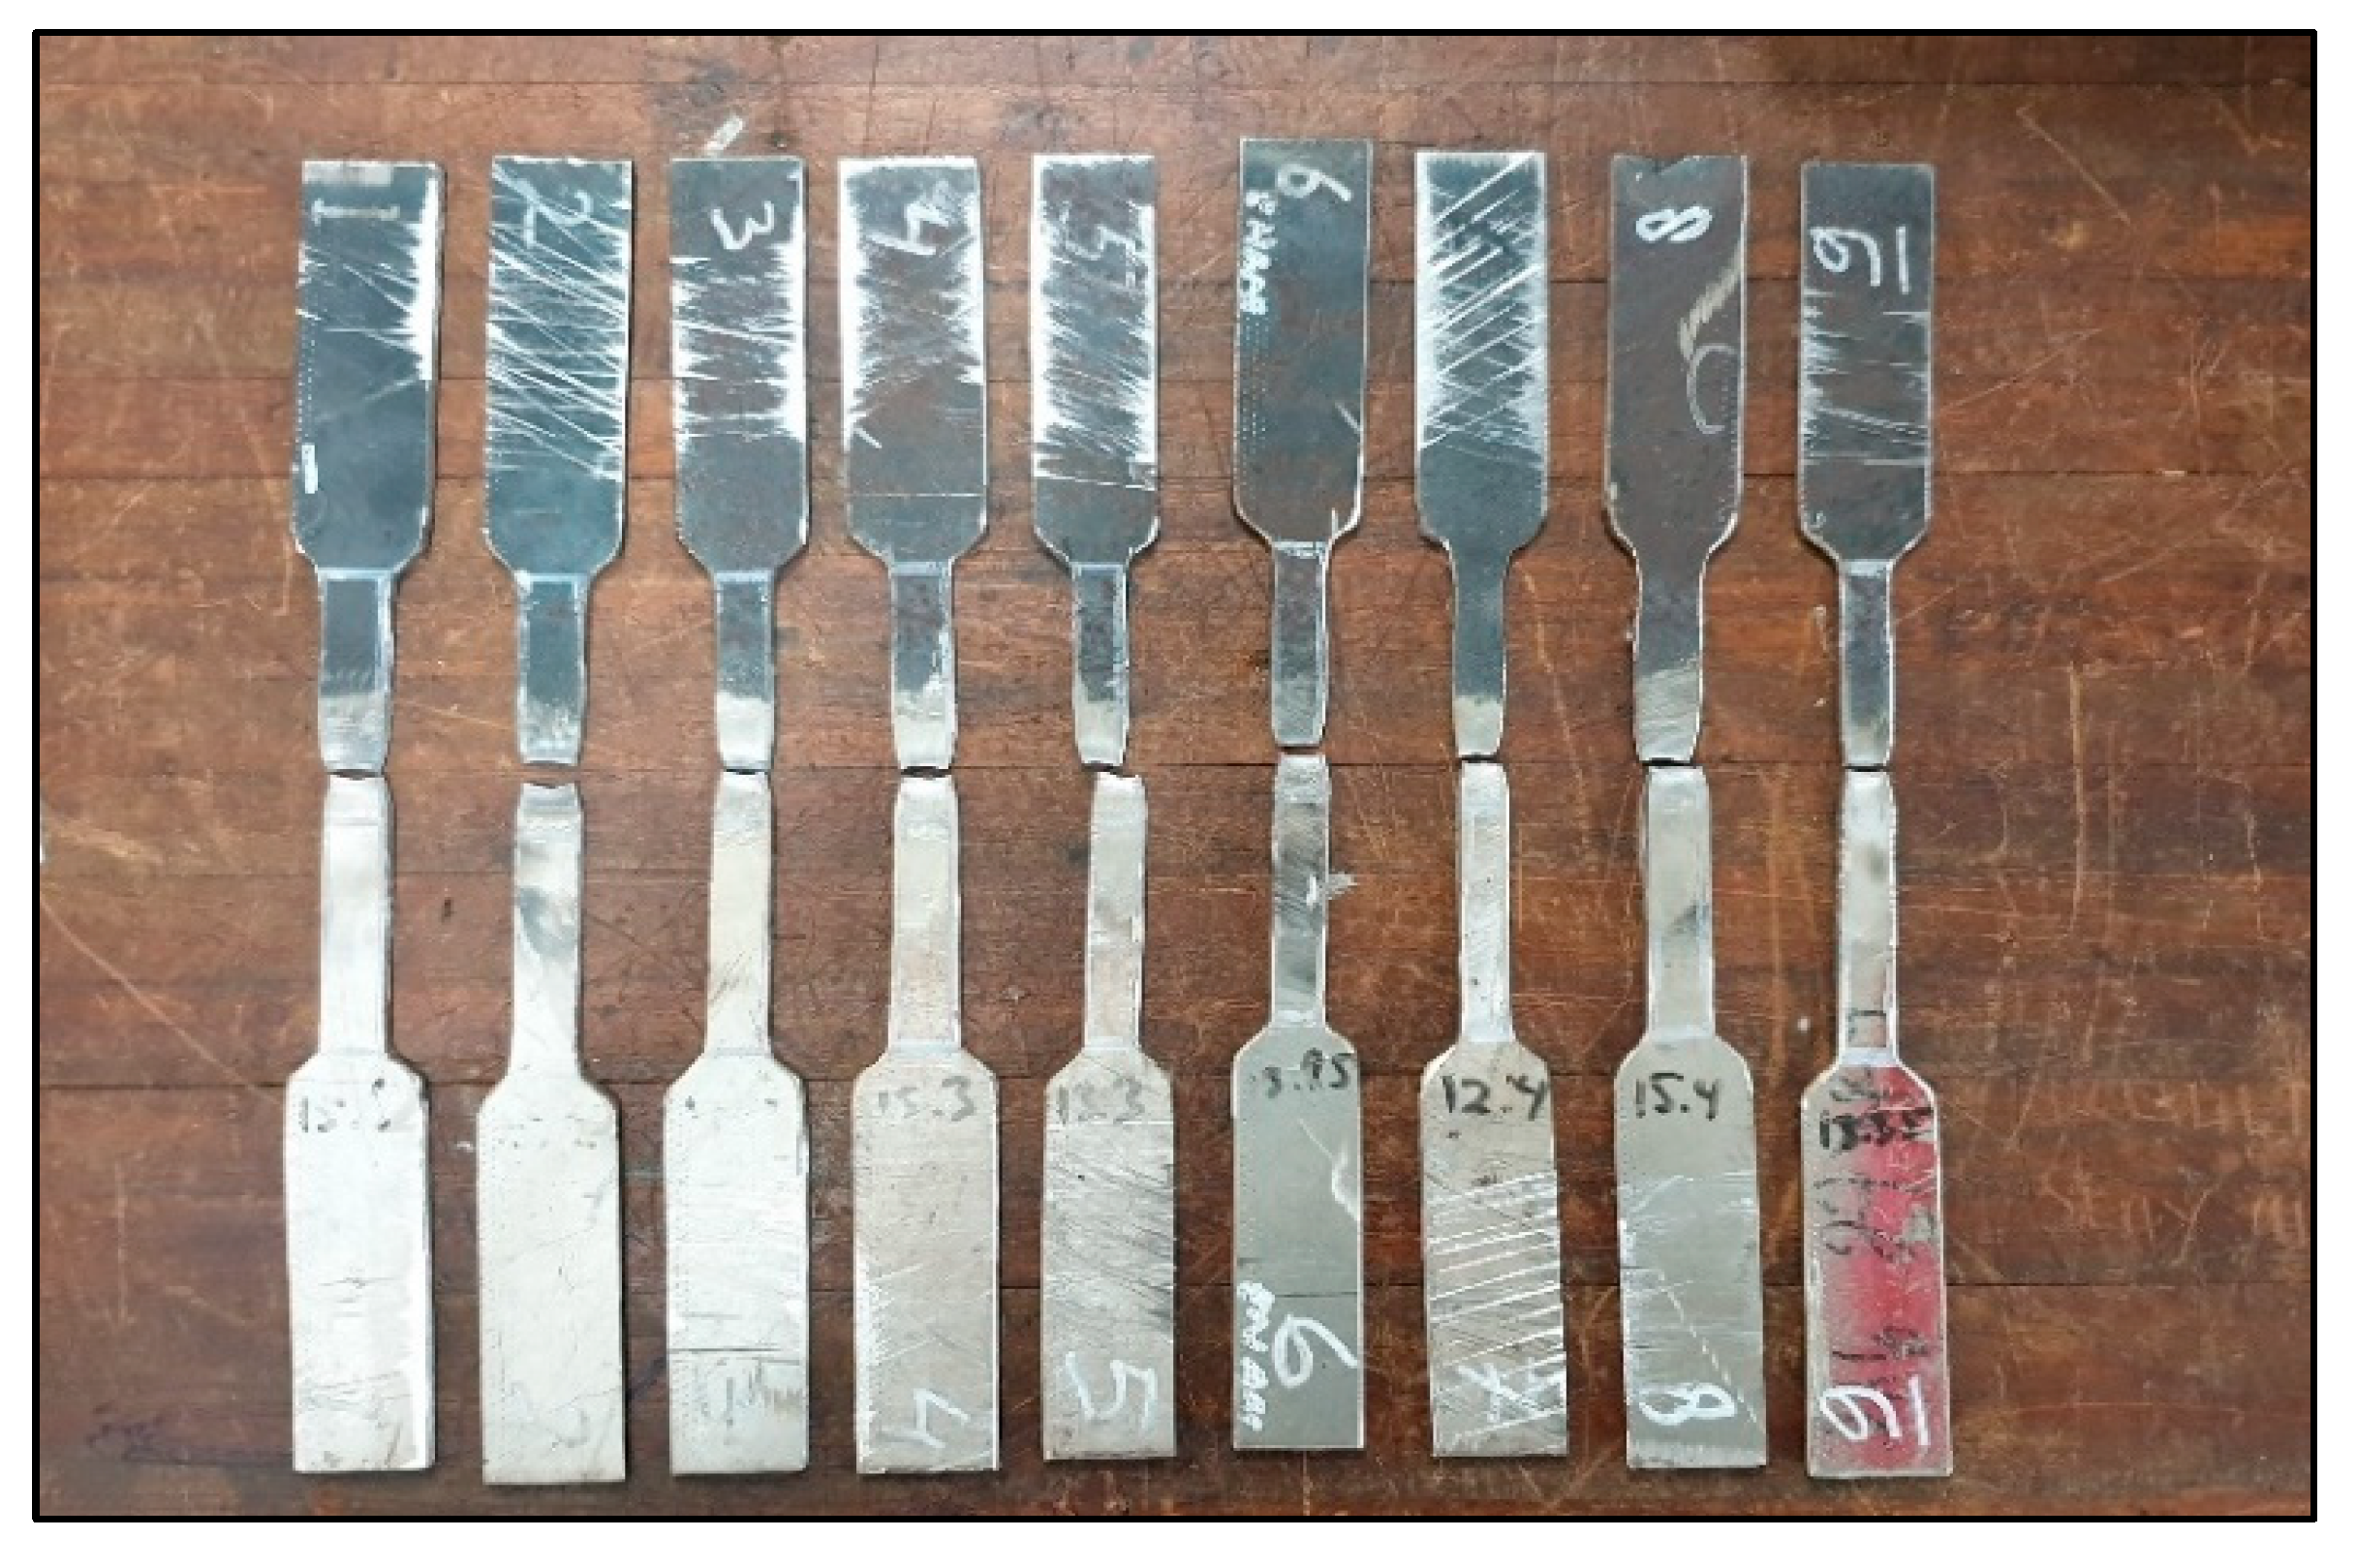
Figure 4 shows tensile test samples of SS316 and low-carbon steel with nine parameter variations based on the L9 orthogonal array. Each sample of various parameters undergoes permanent deformation in the fracture area, indicating that all joint welding tends to be ductile. The tensile test results show the fracture area on the tensile test specimen in the HAZ of the low-carbon steel side. It is indicated that the metal in the fusion zone has a higher strength than the base metal.
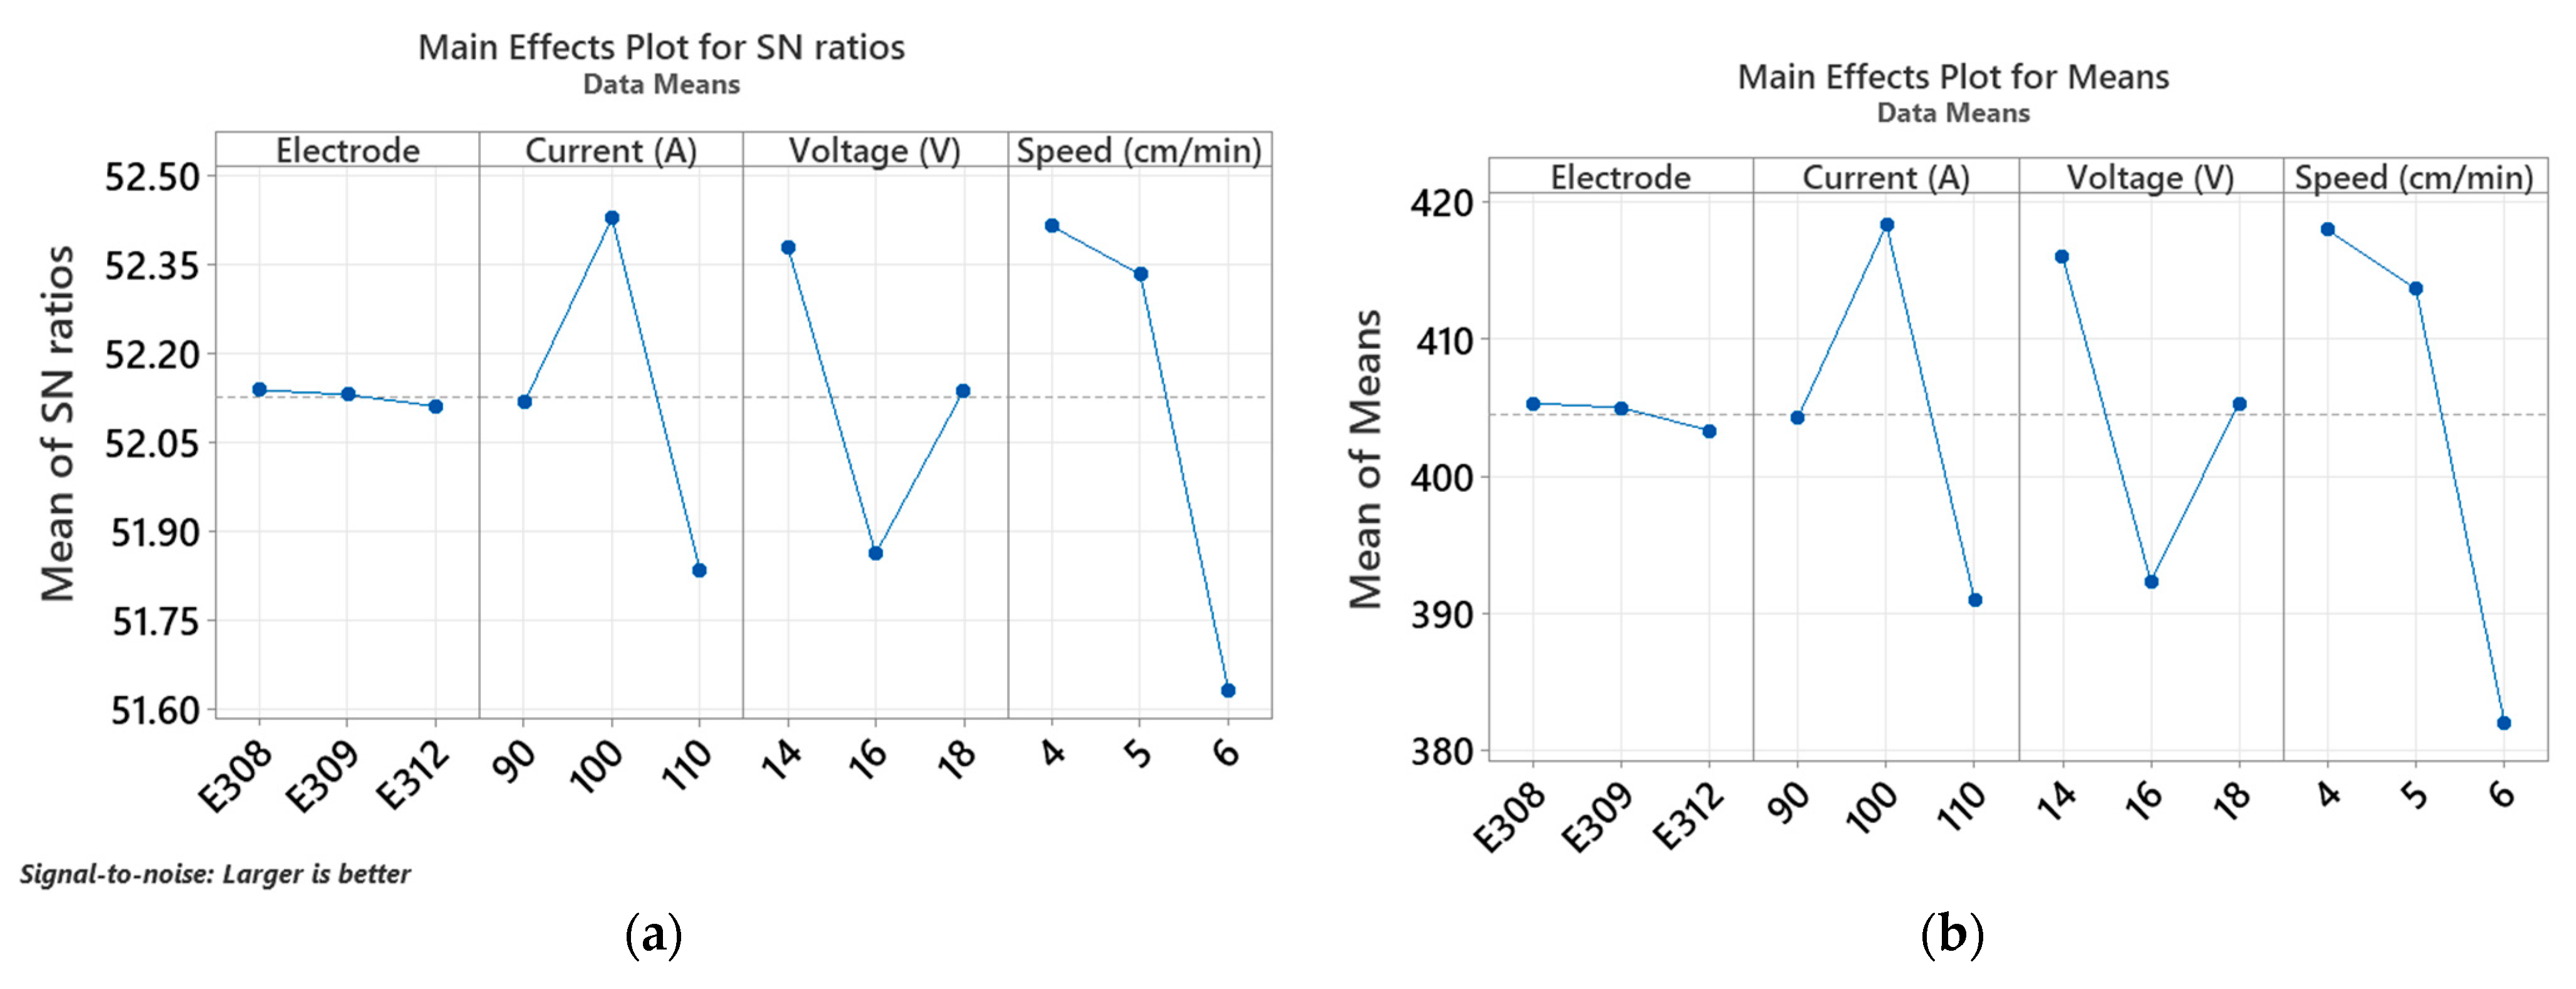
A signal-to-noise (S/N) ratio analysis of tensile strength can be shown in
Figure 5. The tensile strength decreases with the change in electrode type, although not significantly enough. Welding current increased the weld joint’s tensile strength up to 100A and then reduced it. The tensile strength of the weld joint decreases up to 16 V and then increases by 18 V. The increasing welding speed leads to the decreased tensile strength of the weld joint. The highest yield of the tensile strength signal to noise (S/N) ratio based on the larger-the-better could be attained at the combined settings of A1, B2, C1, and D1, i.e., an electrode type of E 308, a welding current of 100 A, an arc voltage of 14 V and a welding speed of 4 cm/min.
The analysis of variance procedure was used to establish the relative significance of the factors as shown in
Table 6. ANOVA is a table of information that displays the relative influences of factors and interactions assigned to the column of an orthogonal array. The ANOVA table shows that welding speed has the maximum significant contribution to determining the tensile strength of the welding joint (52.02%). On the other hand, the electrode type did not significantly contribute to determining the tensile strength of the welding joint. The type of electrode used during welding will affect the composition of the fusion zone. Deposited chemical composition has the effect of determining the resulting mechanical strength. However, in this experiment, the analysis of variance showed that the electrode type used did not make a significant contribution (0.16%) to the tensile strength of the weld joint. The E308 electrode provides maximum results in the tensile strength of the weld joint. A chemical reaction usually produces gases such as nitrogen, oxygen, and hydrogen during welding. They will interact with the molten metal and can affect the mechanical properties of the welded joint [
1].
Welding current and arc voltage are closely related to the heat transferred from the heat source to the workpiece. Heat input determines the phase of transformation, resulting in the microstructural characteristics of the weld.
Table 6 shows that welding current (26.16%) and arc voltage (18.91% C) significantly contribute to tensile strength.
The results of the ANOVA in
Table 6 reveal that welding speed has the highest significant contribution (52.02%) on the tensile strength. The welding speed will affect the amount of heat input in the welding process. The heat input is essential in determining the face and root weld [
26,
27]. Furthermore, heat input also affects the heat-affected zone and affects grain formation. Chuaiphan et al. [
28] reported that dendrite size in the fusion zone tends to be smaller at high welding speeds, and pitting corrosion potential increases on the weld metal.
3.3. Flexural Strength Results
The study of four parameters (electrode type, welding current, arc voltage, and welding speed) concerning the flexural strength, in terms of the main effects plot for means and main effects plot for S/N rations for each interaction, is elucidated in
Figure 6.
Typical samples of flexural testing are presented in
Figure 7. The flexural strength increased with the increasing welding current and arc voltage. Furthermore, the highest flexural strength was obtained at electrode type E312 and a welding speed of 5 cm/min. The larger-the-better flexural strength concerning the electrode type, welding current, arc voltage, and welding speed demonstrated the optimal input factor values (A1, B1, C1, and D2).
According to
Table 7 and the analysis of variance for the flexural strength of SS316 and low-carbon steel weld joints, the electrode type factor has the most decisive influence, accounting for 76.74 percent, followed by the welding current component, accounting for 12.20 percent.
The S/N ratio technique described above creates three sets of ideal input parameters for each of the three responses. Finding a single set of combined ideal settings for a variety of responses is crucial for real-world applications. Consequently, GRA is used in this study for multi-response optimization of the four components and three responses.
3.4. Multi-Response Optimization Using GRA
The practical application of GRA can solve problems with a limited amount of data. GRA generally uses grey assumptions, where the system’s behavior has uncertainty towards a black solution (i.e., there is not enough information data) or white only (i.e., the system has all the information).
The grey relational generation stage is carried out through experimental data on hardness, bend, and tensile strength responses, as shown in
Table 4. Normalizing the data with Equation (4) yielded the reference sequence of responses ranging from 0 to 1. The deviation sequences were then computed using Equation (5).
Table 8 shows the reference and deviation sequences produced following data pre-processing.
Using Equation (6), the GRC (ξi(k)) of each response was calculated, and the GRG (γi) was determined using the average GRC. As the results in
Table 9 show, the calculation of S/N ratio of GRG values indicates whether they are suitable for further analysis. A higher S/N ratio value is favorable and indicates that the experimental data are close to the ideal normalized value of GRG [
29].
After the determination of the GRG rank, the GRG of each level factor was selected and averaged to produce the average GRG for the individual factor and assembled to create the response table shown in
Table 10. The grades in the responses table represent the correlation between the reference sequence and the GRA comparability sequence. Higher GRG mean values imply a high association [
30]. As a result of the GRG response table in
Table 10, it is possible to arrive at the ideal parameter combination that maximizes total response.
An ANOVA was run at a 95% confidence level for the grey relational grade to evaluate each component’s relevance and percentage contribution to the multiple performance parameters of dissimilar welding of SS316 and low-carbon steel. Considering the numerous reactions of hardness, tensile and flexural strength,
Table 11 shows that the welding speed has the most significant influence on the GRG (57.21%), followed by the electrode type (11.71%), welding current (10.38%), and arc voltage (9.95%). Furthermore, because the F-values for all components are higher than F tables (3.55), it can be concluded that all factors substantially influence the dissimilar welding performance of SS316 and low-carbon steel.
The current study shows that a welding speed as low as 4 cm/min delivers the highest contribution to the results. These results are in accordance with previous reports [
1,
31]. The welding speed parameter has significant influence in determining the total heat input per unit of weld length. Due to the slower speed, larger heat-affected zones are created, which increases the melting efficiency.
3.5. Prediction of Optimum Level
Confirmation of experiments for Taguchi analysis must be carried out to ensure that the results of Taguchi analysis are truly relevant or confirmed following the results of statistical calculations. In this experiment, test confirmation was carried out for the hardness test, tensile test, and bending test results.
The calculation of the optimum condition (
OC) of the Taguchi approach is based on Equation (8).
where
T is the current grand average of performance. The confidence interval (
CI) can be calculated by Equation (9).
where
F (1,
) is the computed value of
F at a desired confidence level with
being the error DOF,
Ve being the error variance, and
Ne being the effective number of replications.
Hardness testing is carried out on the fusion zone of the specimen. The larger-the-better hardness concerning electrode type, welding current, arc voltage, and welding speed presented the optimum values of input factor (A3 = 262, B3 = 247, C1 = 245 and D1 = 252) HBW, respectively, as shown in
Table 12. Therefore, the hardness expected result in optimal conditions was 240 + (262 − 240) + (247 − 240) + (245 − 240) + (252 − 240) = 286 HBW.
The expected hardness on the fusion zone of the specimen at the optimum condition is 286. The 90% confidence interval (
CI) for the expected yield from the confirmation experiment can be calculated using Equation (9), where F(1.18) = 4.41,
Ve = 182.8,
Ne = 3.86, and the confidence level = 90%. Therefore, the expected result at optimum condition = 286 ± 14.443 or 271.557 to 300.443 HBW. Following the previously disclosed calculating technique, the validation test of hardness, tensile, and flexural strength can be seen in
Table 13.
Furthermore, grey based optimization offers a method to determine optimal parameters. The response of GRG, which is previously calculated as shown in
Table 8, states the optimum level is A2, B2, C1, and D1. The final stage is to forecast the quality features using Equation (10) after determining the best value of the components using GRG.
where
o is the maximum of the average GRG at the optimum level of factors, and
m is the mean GRG. The letter
q represents the number of factors that influence response values.
Table 14 further illustrates the expected values compared to the GRG initial experimental settings (
Table 9). Furthermore, the GRG is improved by 23.0%. This improvement in GRA outcomes over the parameters in higher GRG values justifies the Taguchi approach used in conjunction with grey relational analysis to improve joining performance.
3.6. Microstructure Evaluation
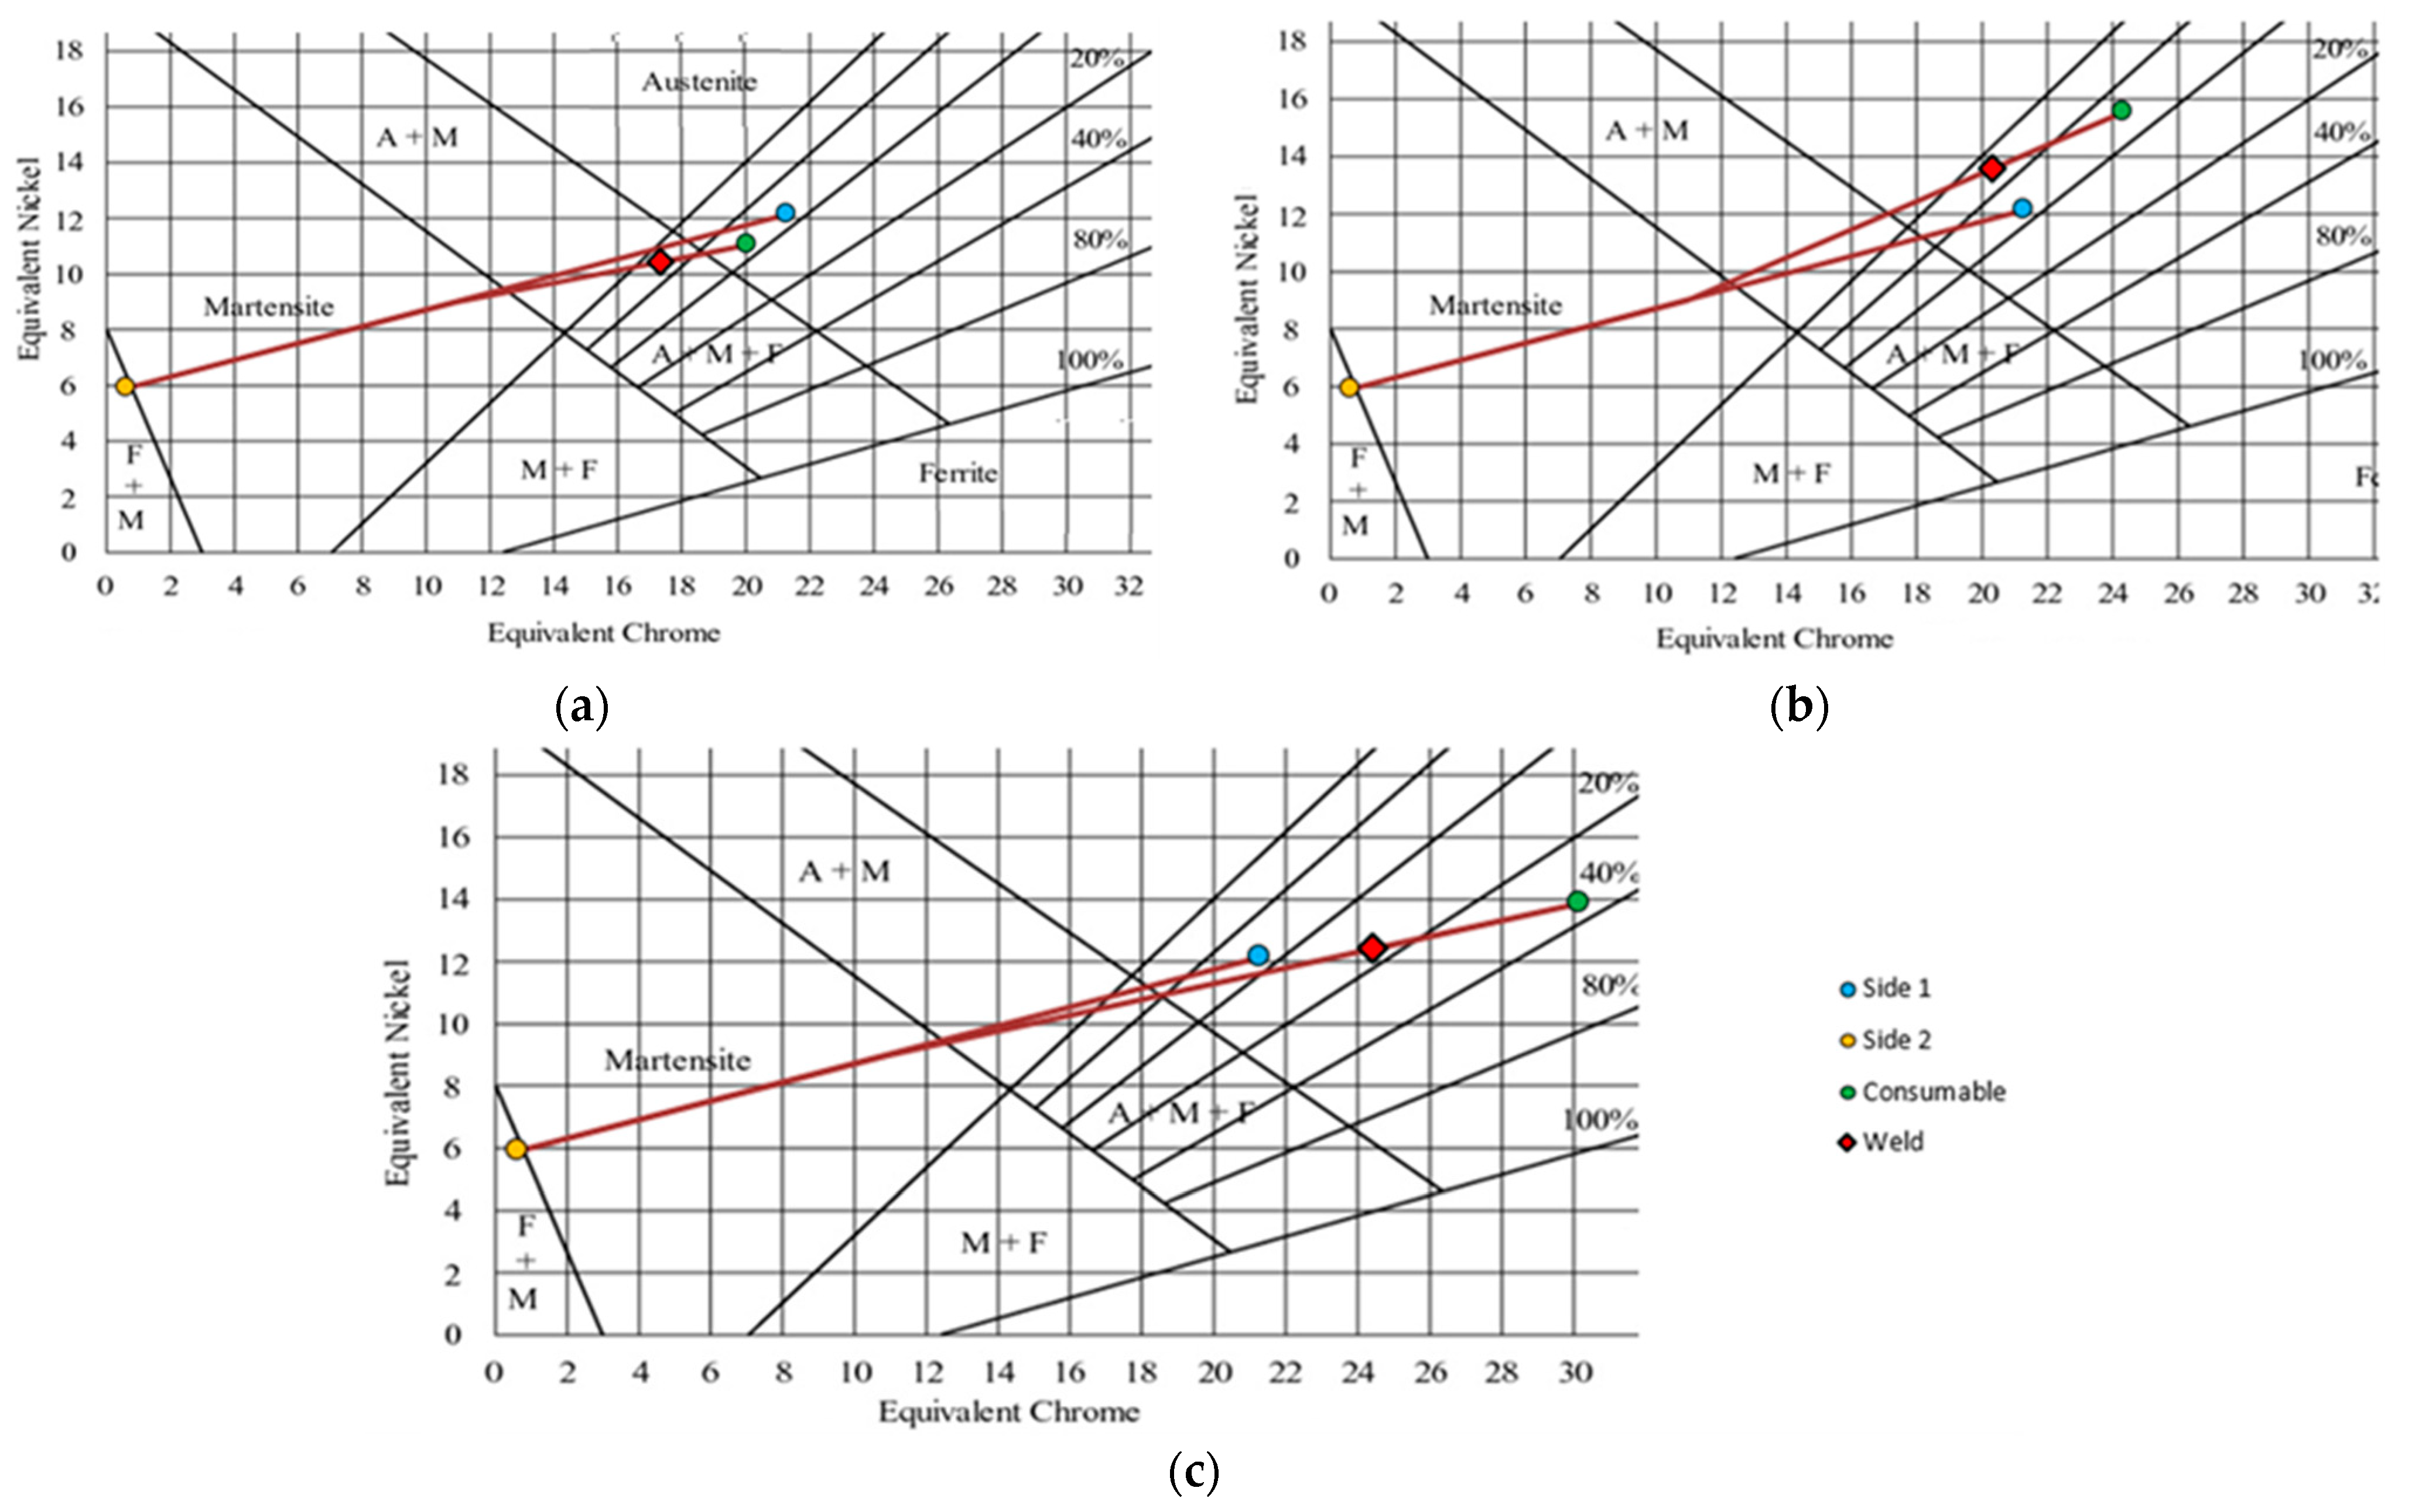
The microstructure of dissimilar welding can be predicted by constitution diagrams, e.g., the Schaeffler diagram. It estimates weldability and phase formation in the fusion zone using different electrodes [
32]. Schaeffler diagrams can predict the proportions of martensite, austenite, and ferrite, as shown in
Figure 8.
The chromium equivalent is calculated from the weight percentage of ferrite-forming elements (Cr, Si, Mo, Nb, W). The nickel equivalent is calculated from the weight percentage of austenite-forming elements (Ni, Co, Mn, Cu, N, C). Cr and Ni equivalents were obtained using the following expressions:
All concentrations are represented as a percentage of total weight. The Schaeffler diagram is an essential tool for estimating the composition of austenitic Cr-Ni steel welds with carbon concentrations as low as 0.12%.
Figure 8a shows the macrostructure of the weld using E308. In this welding condition, the dilution ratio is about 15%. According to the Schaeffler diagram and corresponding dilution ratios, it exhibits a ferrite–austinite–martensite microstructure. The hardness test results in
Table 4 show that welding using the E308 electrode produces the lowest hardness, indicating a small amount of martensitic phase.
According to the Schaeffler diagram, using the E309 electrode type for joining carbon steel and SS316 exhibits austenite–ferrite microstructure, as seen in
Figure 8b. The fusion zone with an austenite microstructure in this condition tends to be prone to hot cracking. Low-melting eutectics, such as S and P, and alloy elements, such as Ti and Nb produce hot cracking in stainless steel welds [
33]. Application of the E312 electrode for joining the carbon steel and stainless steel is predicted to prompt embrittlement when heat treatment or high-temperature service is applied. The appearance of the phase in the fusion zone is predicted by the Schaeffler diagram, as shown in
Figure 8c.
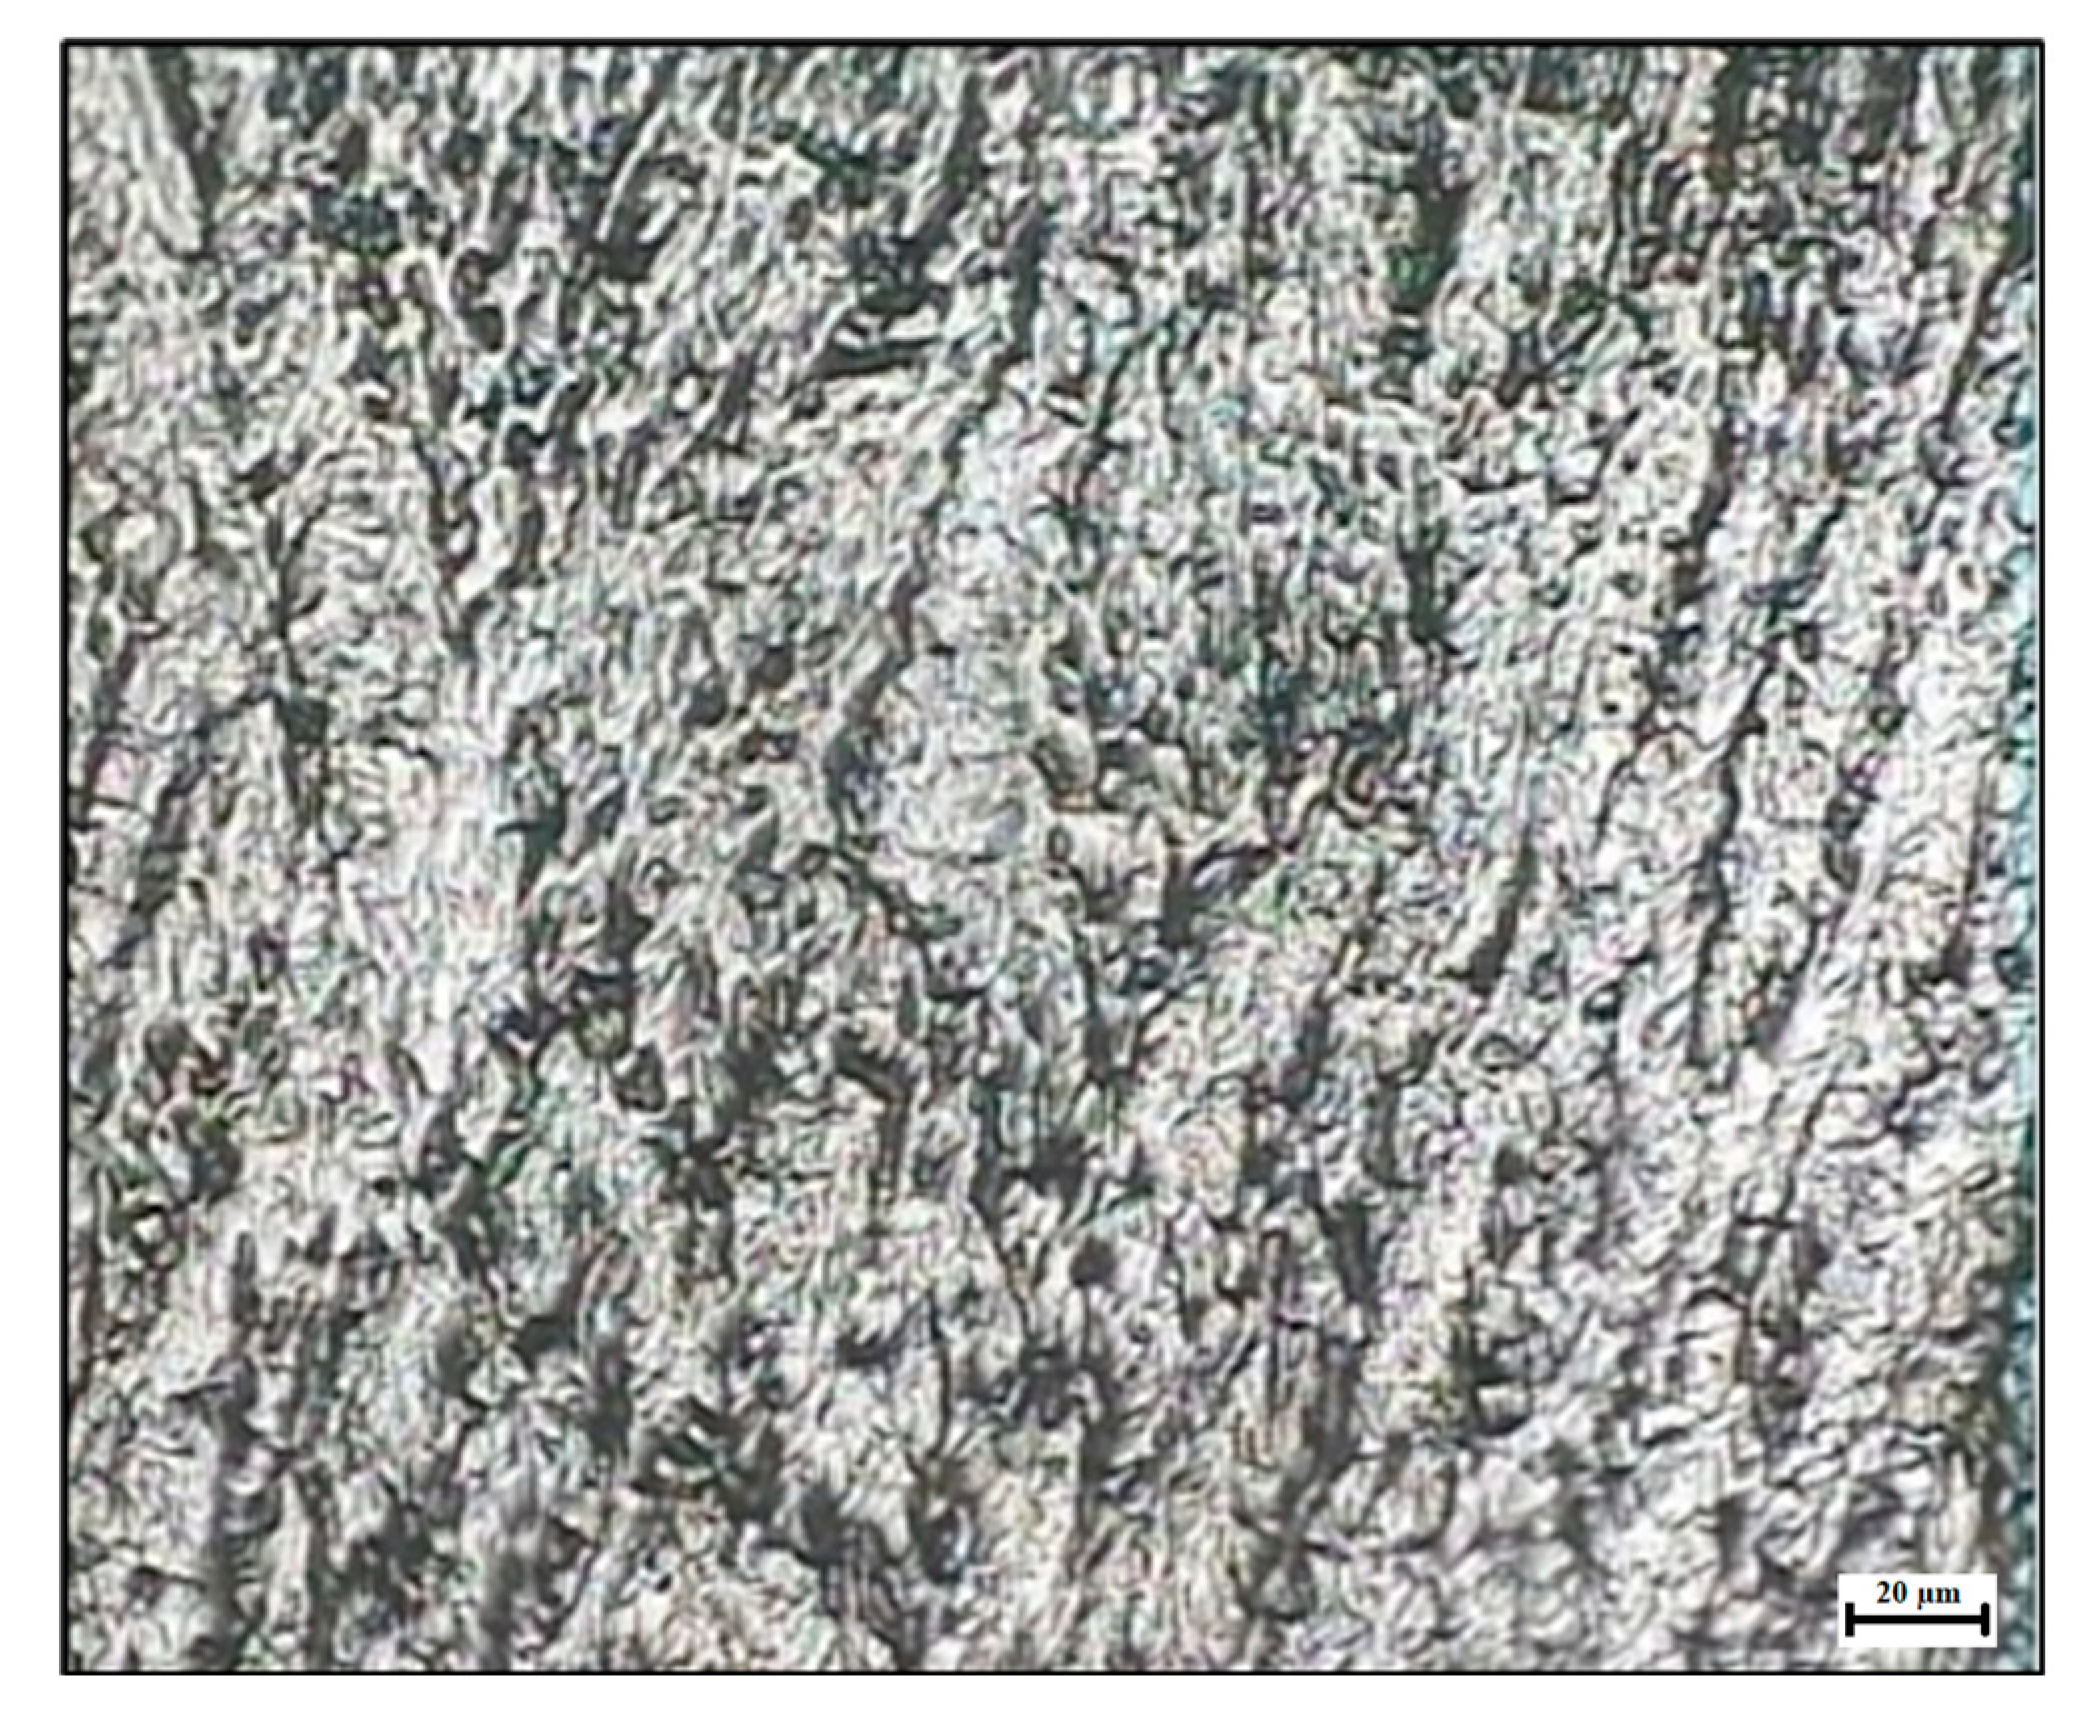
Figure 9 shows the fusion zone of the welded joint using the E308 electrode type. It can be seen that austenite and ferrite phases formed. The austenite phase is more dominant than the other phases, with a face-centered cubic (FCC) structure. The austenite phase has an essential role in determining the ductility properties. Furthermore, increasing ductility can prolong failure time under the influence of external loads and stress.


