Article

Design Optimization of Hot Isostatic Pressing Capsules

1
School of Mechanical, Industrial, and Manufacturing Engineering, Oregon State University, Corvallis, OR 97331, USA
2
Advanced Technology and Manufacturing Institute (ATAMI), Oregon State University, Corvallis, OR 97331, USA
3
Electric Power Research Institute (EPRI), Charlotte, NC 28262, USA
*
Author to whom correspondence should be addressed.
J. Manuf. Mater. Process. 2023, 7(1), 30; https://doi.org/10.3390/jmmp7010030
Submission received: 1 December 2022 / Revised: 17 January 2023 / Accepted: 20 January 2023 / Published: 25 January 2023

Abstract

:
Power metallurgy hot isostatic pressing (PM-HIP) is a manufacturing technique capable of producing net shape or near-net shape components with complicated geometries from materials that are difficult to melt and cast, mechanically deform or weld. However, the process and soundness of the outcome are extremely sensitive to the geometric design of the capsule (also known as the die or can) that is used in the process. The capsule design for each new component involves several trial–error iterations to achieve the desired geometry and shape of the component. For each iteration, costly HIP experiments need to be conducted and new capsules need be manufactured with small modifications. In this study, a robust finite element analysis (FEA) model of the HIP process is developed, then wrapped in a multi-objective genetic algorithm (MOGA) optimization framework to obtain the optimal pre-HIP capsule design, which yields the desired post-HIP component geometry in one HIP run. The FEA-based optimization algorithm is validated by HIP experiments, showing excellent agreement between the experiment and the model.

1. Introduction

Powder metallurgy hot isostatic pressing (PM-HIP) is a manufacturing process capable of producing net shape or near-net shape components with complex geometries from a wide range of metals and alloys [1]. In PM-HIP, a thin-walled capsule (also known as a can, canister or die) is filled with metal powder, degassed and sealed, then undergoes simultaneous high temperatures and pressures for relatively long durations to ultimately produce a densified net shape or near-net shape component. HIP is a fundamental methodology in PM to consolidate and compact the metallic powders into solid component, below the melting or liquidus temperature of the material [2,3]. During PM-HIP, the density of the powder compact in the capsule rises towards the bulk theorical density of the material. Accordingly, during densification, powder particles rearrange and reorder due to pressure and also sinter together (via different mechanisms) [4,5]. This means that the compact undergoes permanent shrinking (plastic deformation). Ideally, the dimensions of the post-PM-HIP component should show zero or minimal deviation from the desired specifications. However, if the PM-HIP process is not designed and implemented meticulously, uncorrectable distortions, non-uniform shrinkage, a local lack of densification and deviation from the desired post-PM-HIP dimensions may occur [6,7]. Amongst the factors determining the soundness of the PM-HIP process, the geometric design and dimensions of the pre-PM-HIP capsule are critically important in accomplishing a defect-free PM-HIP process and obtaining the desired post-PM-HIP dimensional accuracy. As PM-HIP is an expensive and time-consuming process for conducting experiments, it is extremely desirable to develop computational models and methodologies to robustly predict the post-PM-HIP compact dimensions and shapes as a function of pre-PM-HIP capsule dimensions and shape. In order to achieve this goal, it is imperative to understand the powder compaction behavior and high-temperature phenomena happening during PM-HIP. As the permanent deformation during PM-HIP is accompanied by a volume change (shrinkage), the conventional incompressible plasticity theories that are based on volume constancy during plastic deformation are not valid [2,8].
Abouaf [9] developed an incremental and implicit finite element algorithm to model the compression of metal powders. It was proposed to extend the previous porous material plasticity theories of Oyane et al. [10] and Kuhn [11] to capture the complexities of PM-HIP. In addition to the compressible plasticity, the deformation in PM-HIP is also augmented by creep, as the component is exposed to high temperatures for prolonged durations. Joen and Kim [12] studied the effects of the thickness of the capsule by implementing Abouf’s method and compared against another approach proposed by McMeeking and coworkers [13]. Both types of models showed acceptable consistency with the experiments but presented a different trend when the deviatoric stress was dominant during sintering. Additionally, it was shown that higher densities could be reached by thinner capsule walls. Jinka and Lewis [14] also modeled PM-HIP using the finite element method. It was considered that the powder behavior follows incompressible plasticity laws and only creep was considered. Non-linear transient heat transfer equations were used to capture the thermal deformation. The FEM model predicted the PM-HIP process outcome and made the process more reliable. Yuan et al. [15] worked on the final dimensions of the post-PM-HIP components made from Ti–6Al–4V powder. A CAD file was prepared and compared to experiments to validate the modeling. After using the Levy–Mises plastic deformation approach, the results showed close consistency between the achieved geometry and predicted geometry taken from the CAD model. Wickman et al. [16] focused on reducing the cost of the final parts’ extra machining. They tried to develop a numerical simulation method to predict the final shape of the PM-HIP products with regard to rate-dependent and rate-independent deformations. Based on dilatometry experiments, considerable deformation and particle rearrangement happened in the early stages of PM-HIP. Viscoelastic behavior dominates in the later stages, with higher temperatures and pressures. Accordingly, two submodels were suggested for capturing both the granular and viscoelastic behaviors. Accordingly, a range for plastic regime was defined based on the temperature and relative density values obtained from experiments. A temperature-dependent hyperbolic function that accounts for the effective stresses was used for the viscoplastic strain rates. The result led to an acceptable match between the experimentally measured and simulated values. However, due to fitting the viscoplastic deformation parameters to the entire process, the final axial deformation showed larger deformation.
Aryanpour [17] investigated the constitutive modeling of thermomechanical behavior materials during the PM-HIP process. They worked on the elastoplastic–viscoplastic deformation of PM-HIP materials. The ideal viscoplastic formulation of solids and the plastic behavior of non-porous materials at low temperatures as well as porous material were utilized. The results showed reasonable prediction results for the deformation when compared against the experiments. Furthermore, Aryanpour et al. [18] studied the inelastic behavior of powder metals by implementing viscoplastic and plastic deformation schemes. The relative density in the viscoplastic equations was based on Abouaf’s work [9]. The utilized hardening parameters were related to the relative density and plastic strain. The model captured the densification rate under hydrostatic loading during the PM-HIP process and predicted the final geometry’s acceptably as being close to the experiments. Liu et al. [19] studied the effects of the different pressure cycles using an FEA. The developed model was based on the yield criterion of porous materials. The results demonstrated that if the pressure profiles were below 100 MPa, the final relative density increased rapidly with the increase in pressure level. Furthermore, increasing the applied pressure improved the viscoplastic deformation. Abdelhafeez et al. [20] studied the different constitutive models of the compression of porous media, including Cam–Clay, modified Drucker–Prager and modified Drucker–Prager with creep. All models contained creep deformation as well. The corresponding experiments were run on 316L stainless steel. The study revealed that the Drucker–Prager model with creep, among all studied models, had the best agreement with the experiments. However, it should be noted that the study also found that non-uniform densities occur at the top and the bottom of the capsule, and named them the “canister effect”.
Deng and et al. [21] studied the HIP of AISI 318LN with rapid cooling technology to obtain the near-net shape component. This process could help to reduce the time by up to 80% and avoid brittle σ -phase precipitation in the alloy. The authors also developed a macroscopic model to capture the process. For the mechanical part, they used the viscoplasticity model by Abouaf [9] and plasticity model of Kuhn and Downey [11]. An Avrami-type equation was used for the σ -phase. They validated the model with experiments to confirm the consolidation of the compact and the volume fraction of the σ -phase during rapid-cooling HIP and showed the good agreement of the temperature rate dependency, while the accuracy in predicting the σ -phase fraction needed more refinement.
You et al. [22] studied the densification behavior of atomized and milled Ti-6Al-4V powders. A modified Shima model [23] was used with an ellipsoidal yield criterion. The goal was to model the densification behavior of the two different powders under the same conditions, with it noted that the initial relative density (RD) values were 0.62 and 0.59 for the atomized powder and ball-milled powder, respectively. To show the differences between these two compact powders, the authors chose 4 different locations in the compact. The results showed that the RD for both powders reached 0.95. Furthermore, the results illustrated that the trends for the densification of the two powders were not very different; however, the densification process of the ball-milled powder was more uniform than for the atomized powder.
Hu and et al. [24] investigated the densification process of tungsten by elevating the temperature to 1400 °C and the pressure to 140 MPa. Shima’s model [23] of continuum plasticity was used to capture the deformation behavior of tungsten, with an initial RD of 0.58. The results showed that the stress distribution at the top of the capsule was higher than in other areas. Additionally, they noticed that the density of the compact at the top of the capsule was less than in other areas, with the final overall RD reaching 0.93. The simulation output showed slightly different result than the experiments, with a 5.6% difference in the radial directions.
Van Nguyen et al. [4] studied the effects of the temperature gradients in the capsule, the thickness of the capsule walls and the density distribution of the powder of the pre-PM-HIP component on the final geometry. Abouaf’s creep model [9] had been used to simulate the PM-HIP process with FEA. The results showed that the filling process has a strong impact on the homogeneity of the density and significantly influences the final shape and dimensions of the post-PM-HIP compact. Furthermore, the temperature gradient can result in non-uniform shrinkage and highly distorted post-PM-HIP components. The results showed that although the thinner capsules could not tolerate high machining forces, they provide a better means—compared to thicker capsules—to accommodate shrinkage of the compact. They suggested developing an optimized range for the capsule wall thickness to obtain acceptable post-PM-HIP shapes and dimensions to minimize the cost of the post-process machining and waste material. Furthermore, Van Nguyen et al. [5] developed a combined model for varying temperatures and pressures. The model includes both the rate-dependent plasticity (Abouaf’s creep model [9]) and time-independent plasticity. This model represents the primary and secondary creep mechanism as well. The outcomes of the model showed good prediction of the initial creep, which acted for a short time but had a significant impact as the density increased. All of the material data for 316L stainless steel that were used in the model were temperature- and relative-density-dependent and were extracted from experiments. The combined numerical model was implemented in an FEA program by writing user-defined subroutines. Abouaf’s creep model [9], Kuhun’s plasticity model [11] and the developed combined model were compared in this research. The result emphasized that the combined model can express the physical mechanism of the material during the PM-HIP process better than the other models and showed a good agreement with the experimental result.
According to the literature reports that are summarized above, the effects of the pre-HIP capsule dimensions on the geometrical soundness of the post-HIP compact are poorly studied. Additionally, the open literature lacks a robust and validated optimization framework to avoid trials and errors in determining the pre-HIP capsule dimensions to achieve the desired post-HIP compact dimensions. The current work addresses this shortcoming with an innovative approach. A FORTRAN script based on the combined model mentioned above [5] is developed to account for the elastoplastic behavior of the compacted powder with respect to the relative density, temperature and pressure profiles during PM-HIP. Then, the FORTRAN script is fed into the commercial FEA code, ANSYS(r), to calculate the shrinkage and deformation of the compact during the PM-HIP cycle. The FEA results are wrapped in an optimization framework based on a multiple objective genetic algorithm that provides the optimal pre-HIP dimensions for the desired post-HIP components. The input to the modeling framework, as shown in Figure 1, is the geometry and shape of the desired net shape or near-net shape component (post-HIP) in the form of a CAD file. The output of the optimization procedure is the optimal pre-HIP dimensions of the capsule. The ultimate outcome is validated by running independent PM-HIP experiments, showing excellent consistency.

2. Methodology

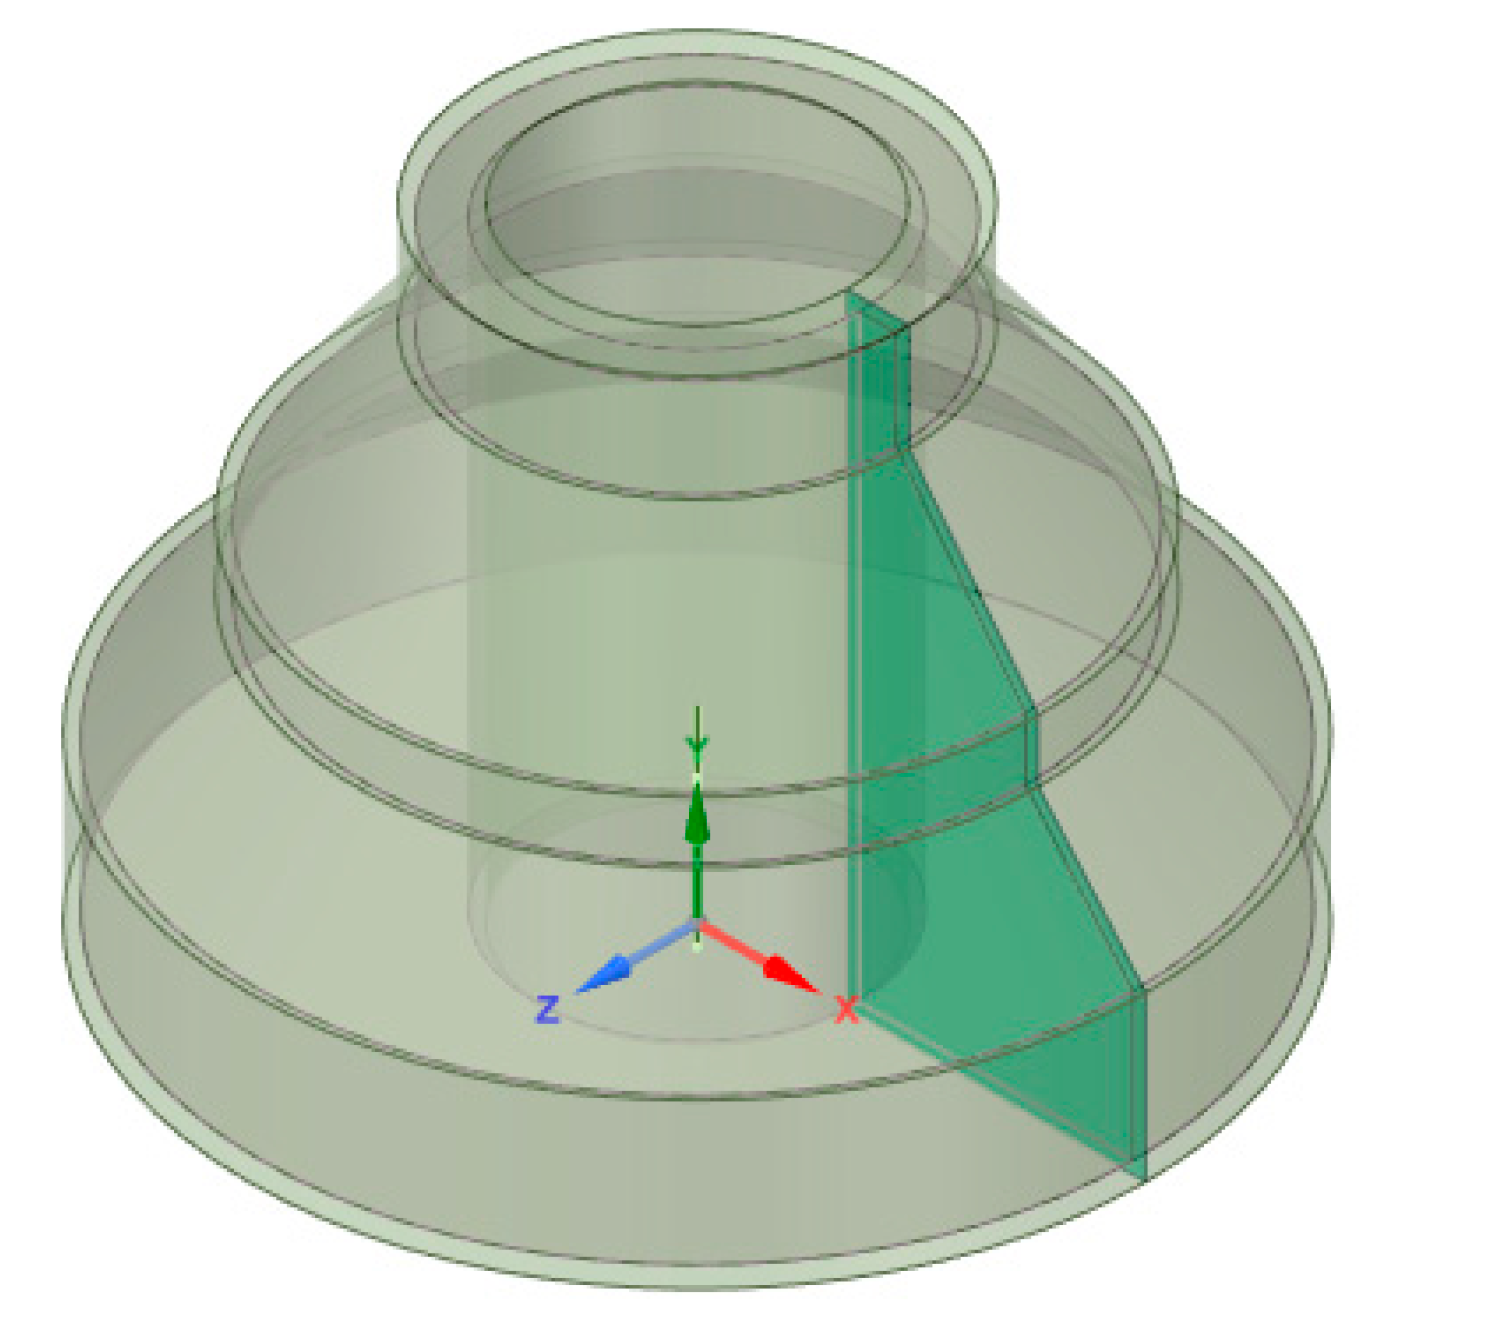
2.1. The Desired Component

In order to validate the model developed for this work, independent PM-HIP experiments were run. The geometry of the objective post-HIP component is shown in Figure 2. As the component is rotationally symmetric around the Z axis, a 2D axisymmetric (Figure 3) approach was used, which provides the same results as a full 3D model, but is much less computationally demanding [25]. Figure 3a shows the 2D axisymmetric cross-section with the desired post-HIP dimensions annotated. The goal is to manufacture the part with dimensions as close as possible to the desired dimensions to minimize, or if possible, eliminate the post-manufacturing machining. In order to the accomplish the defined optimization goal, we used the procedure outlined below in Section 2.2 to obtain the pre-HIP dimensions of the four geometrical parameters shown in Figure 3b. These four parameters represent the geometry well and are sufficient to validate the approach of this work, although there is theoretically no limit to the number or nature of geometrical parameters that can be used for optimization.

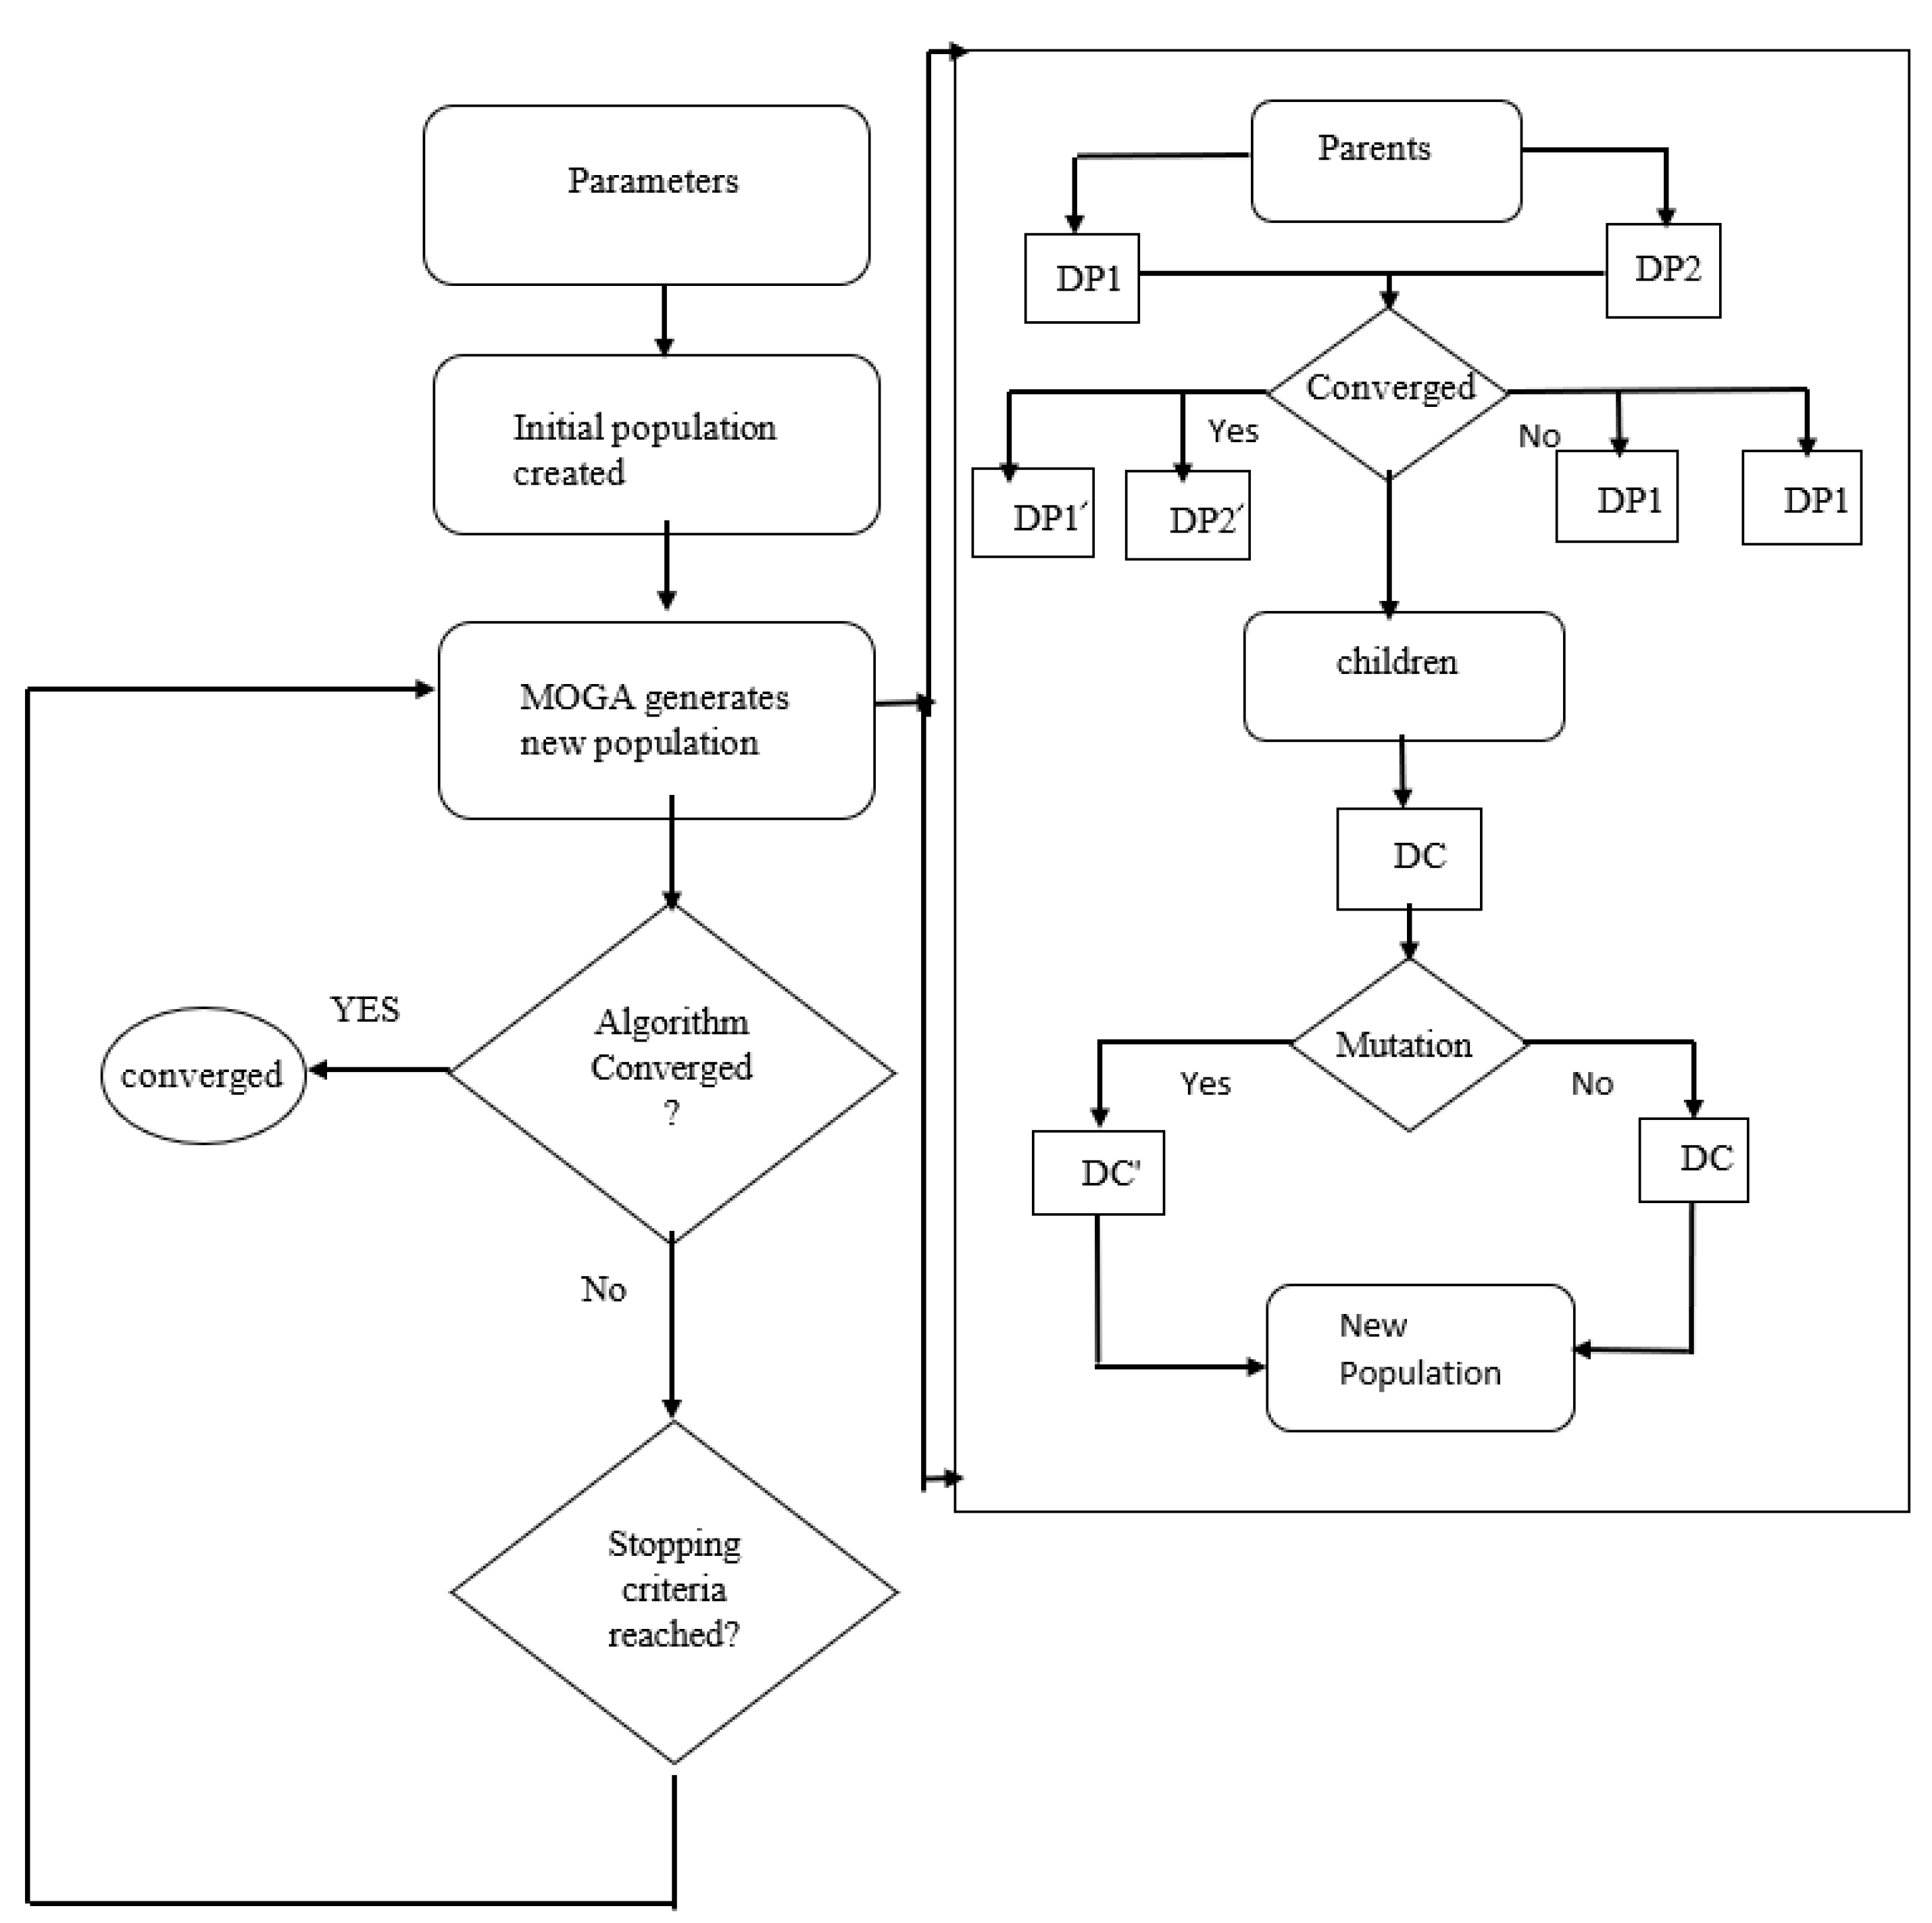
2.2. The Optimization Procedure

A goal-driven optimization (GDO) approach was used in this work to obtain the most appropriate dimensions for the pre-HIP capsule for the geometry presented in Figure 3. GDO involves a set of multiple objectives and constrained optimization techniques that allows the user to set the objectives and obtain the finest possible design point to satisfy the desired constraints. Every topology optimization procedure requires input parameters that are defined from a CAD file to serve as the analyzed values in the optimization process [1]. The design point will create and update the output parameter as the FEA simulations continue, and will stop when it reaches and converges to the desired and best dimensions. A multi-objective genetic algorithm (MOGA) was used for the GDO approach, as the MOGA has the ability to optimize multiple parameters simultaneously and find the best possible solutions that have the least conflict between objectives [26]. These best solutions are provided in a set of solutions that is identified as the non-dominant solution set or Pareto set. The goal of the MOGA is to find one or multiple suitable solutions among the presented solutions in the Pareto set. The optimal Pareto set, or equivalently the MOGA, can be presented in the form of the following equation [27,28,29]:
min F x = f 1 x ,   f 2 x , ,   f n x s t                                 H x i 0       i = 1 , 2 , , m x X   ,     X R
where F x is a multi-objective vector function, x is an input vector, f i x is the i th objective function and H x i is a group of non-linear inequation constraints. If x X exists, for all objective functions x * is meant to be the optimal Pareto set if and only if [28,29,30]:
F x * F x i
In this work, first the FEA simulation started with an initial population to run the MOGA. Next, through mutation and after the first iteration, each population would reach the user-given number of samples of the inputs per iteration. In the context of the algorithm, the MOGA workflow is shown in Figure 4. As mentioned above, the design variables in the current model are the pre-HIP capsule dimensions.

2.3. Constitutive Model

During PM-HIP, metal powders undergo several micromechanical phenomena, including particle rearrangement due to particle sliding at low pressures and time-independent plastic deformation in particle contact zones [5,18]. On the other hand, at high temperatures and pressures, viscoplastic deformation is dominant. The combined constitutive model presented by Van Nguyen et al. [5] that can acceptably capture the complexities of the various active mechanisms is used in this work. This combined model is based on the rate-dependent model by Abouaf [9] and Kuhn and Downey‘s time-independent plasticity model [11]. In this model, plastic yielding, linear isotropic hardening and viscoplastic deformation lead to volume shrinkage and densification. The total strain developed in the powder is decomposed as follows:
ε i j = ε i j e l + ε i j i n e l + ε i j t h .  
ε i j i n e l = ε i j p l + ε i j c r
where ε i j is total strain and ε i j e l ,   ε i j i n e l , and ε i j t h are respectively the elastic strain, inelastic strain and thermal strain. The inelastic strain is then decomposed into ε i j p l and ε i j c r , which respectively represent the plastic and creep strains. Both the primary and secondary creep mechanisms are considered in the creep strain term. Based on Kuhn and Downey’s work [11], an ellipsoidal yield surface was used in the combined model, which is a modified form of the Von Mises criterion with isotropic linear hardening. The yield function f is described by the following equations:
f ( σ i j ,   ρ , ε p ) = σ e q - r 1 ρ , p σ y ρ = A ρ   J 2 + B ρ I 1 2 1 / 2 h ρ m σ 0 ρ k
A ρ = 2 1 + v p l ρ                                                   B ρ = 2 1 + v p l ρ 3
where σ e q is the equivalent plastic stress, which is a function of Cauchy stress components and the relative density via the A ρ and B ρ , which are themselves functions of the relative density and the plastic Poisson ratio v p l . In linear isotropic hardening, r 1 ρ , p , the relative density ( ρ ) and equivalent plastic strain ε p [6] are the two parameters that impact linear hardening for porous materials. The tangential modulus h and exponent m are obtained via uniaxial compression experiments. Here, σ y ρ is the initial yield stress, which is a function of the relative density, ρ ; σ 0 is the yield stress in the fully dense material; k is a parameter obtained from the experiments. Plastic deformation occurs when the yield surface is equal to or smaller than zero. With the combined model, the plastic deformation is calculated based on an associated flow rule, the principle of mass conservation and the consistency condition [3,5,26,31]:
d ε i j p = d λ f σ i j
d λ = f σ i j · C i j k l e l   d ε i j   f σ i j · C i j k l e l   f σ i j + f ρ · ρ f σ i j   δ k k f ρ 2 3   f σ i j · f σ i j 1 2  
f σ ij = A ρ   S ij + B ρ   2   I 1   δ ij   2   σ eq 0.5
f ρ = f σ i j · ρ n 1   J 2   1 3   f σ i j   ρ n 1   I 1 2 2   σ e q 0.5 h · m · ρ m 1 σ 0 · k · ρ k 1
where d λ is the plastic multiplier and   C i j k l e l is the elastic stiffness matrix. I , J 2 , δ i j , S i j and σ i j are respectively the first invariant of the Cauchy tensor, the second invariant of the deviatoric Cauchy stress tensor, the Kronecker delta, the deviatoric stress tensor and the stress tensor.
Time-independent inelastic deformation via creep is calculated based on Abouaf et al.’s [9] creep model. In this model, the creep rate ( ε ˙ i j c r ) for porous materials is represented in the form of:
    ε ˙ i j c r = A T σ e q 2 N T 1 3 2 c ρ S i j + f ρ I 1 δ i j
where   A ( T) is a function of the temperature, N T is Dorn’s constant parameter and c ρ and f ρ are experimental values measured as functions of the relative density, while σ e q represents the equivalent stress due to creep deformation [3]:
σ e q 2 = 3 c ρ J 2 + f ρ I 1 2
The thermal strain increment is calculated as follows:
Δ ε i j t h = α t h . Δ T . δ i j
where α t h , Δ T and δ i j are respectively the thermal expansion coefficient that depends on the relative density and temperature, the change in temperature and Kronecker’s delta [3,4,5].
The comprehensive density-dependent compressible plastic deformation model that incorporates both creep and thermal strains was coded in FORTRAN and applied to the commercial finite element analysis software ANSYS, through the user-programmable feature (UPF) capability of ANSYS. The FORTRAN code defines the material properties and the constitutive laws explained above as functions of the temperature and relative density. The ANSYS calculation engine solves the location-dependent stresses and strains [32] for every timestep via Newton–Raphson iterations and updates the density,   ρ , accordingly based on Equation (13):
ρ t + Δ t = ρ t   exp Δ ε k k i n e

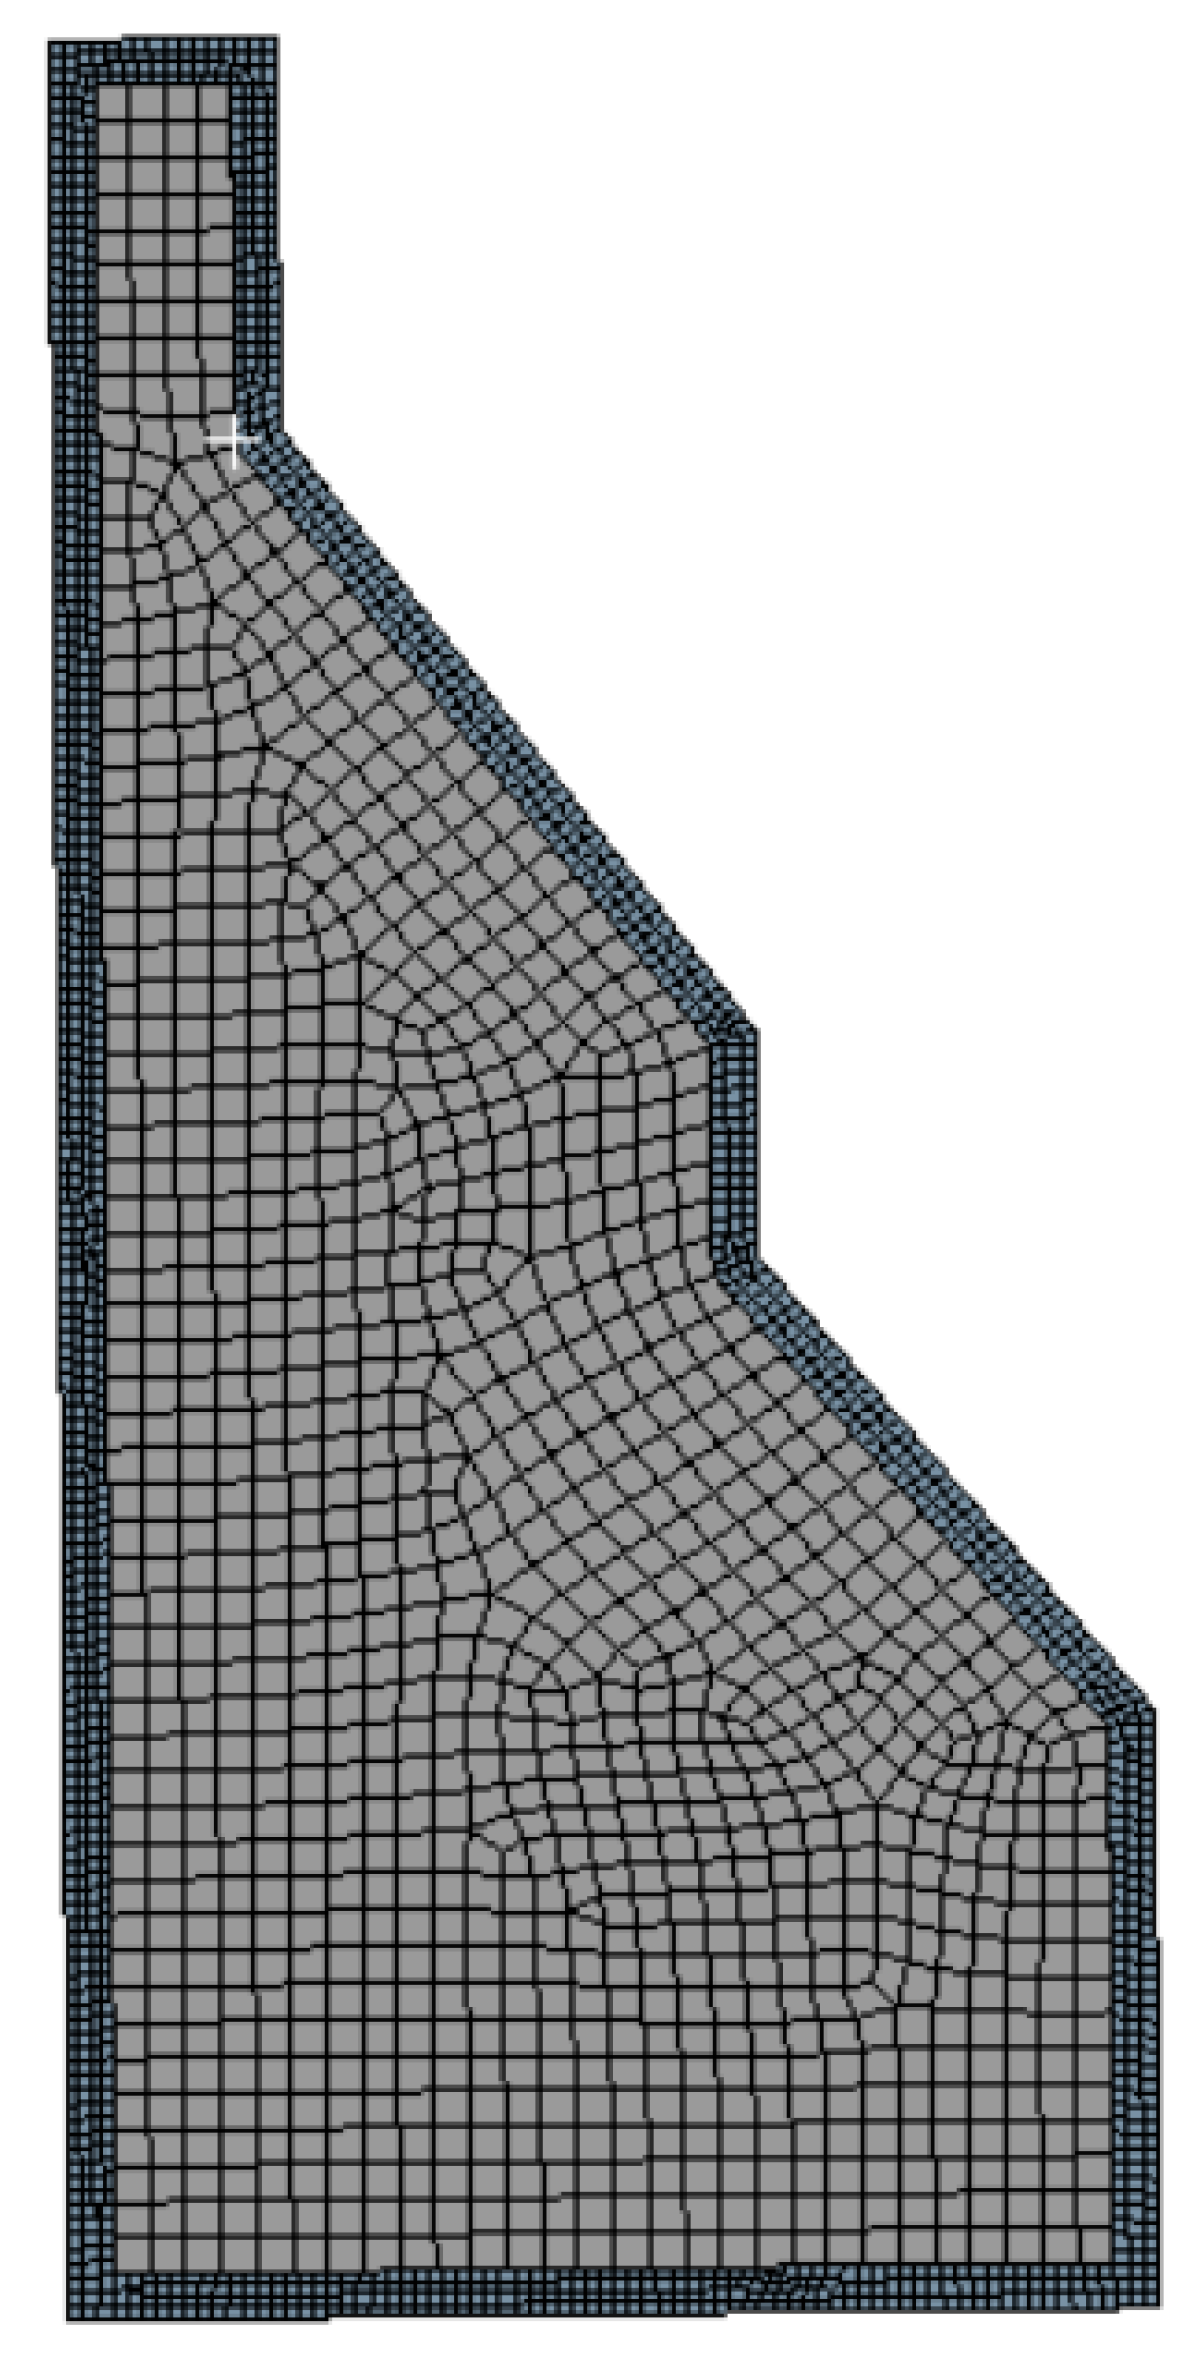
2.4. Simulation Setup

In this work, ANSYS 2020 R2 was used for both PM-HIP modeling and capsule optimization. Figure 5 shows the simulation setup flowchart from the beginning to the end of the optimization process. The dimensions of the desired geometry are shown in Figure 2, with an exterior capsule wall thickness of 6.35 mm. The material of the capsule is mild carbon steel and the powder is 316L stainless steel (presented in Table 1). Non-linear mechanical elements with a maximum size of 2 mm for the capsule and 5 mm for the powder were chosen with the total mesh nodes of 3057 and 2564 elements (Figure 6). A mesh convergence study was carried out and confirmed that the abovementioned element size provides accurate results. The temperature and pressure HIP cycle is shown in Figure 7, with a soaking pressure and temperature of 103 MPa and 1060 °C, respectively. The total time of the process is 8 h. As explained in Section 2.1, four parameters P1, P2, P3 and P4 (Figure 3b), were chosen and investigated to find the optimized and desired dimensions. Design points (i.e., capsule design dimensions) between the given upper and lower ranges were chosen automatically using ANSYS and gave the after-HIP dimensions of the component. The candidate points were suggested by the ANSYS software after choosing the best solution for the optimized and net shape or near-net shape component.
As depicted in Figure 3, four parameters (namely P1 to P4) were set to optimize the pre-HIP capsule geometry input parameters based on the desired post-HIP compact dimensions ( P 1 P 4 ), set as the targets to seek with a tolerance of 6 mm. Five candidate points (sets of optimized pre-PM-HIP capsule design dimensions) were chosen from the 461 design points generated randomly through the user-given ranges by the algorithm through the direct optimization procedure that is used for this study.

2.5. Experiment

A physical PM-HIP component was fabricated to determine the accuracy of the compaction simulation process developed within Section 2 of this report to validate the ability to predict the post-HIP geometry. The objective of the experiment was to make sure the FEA part of the modeling approach described above works correctly, and one experiment is sufficient for this purpose. Accordingly, the experimental consisted of the following steps:
(1)
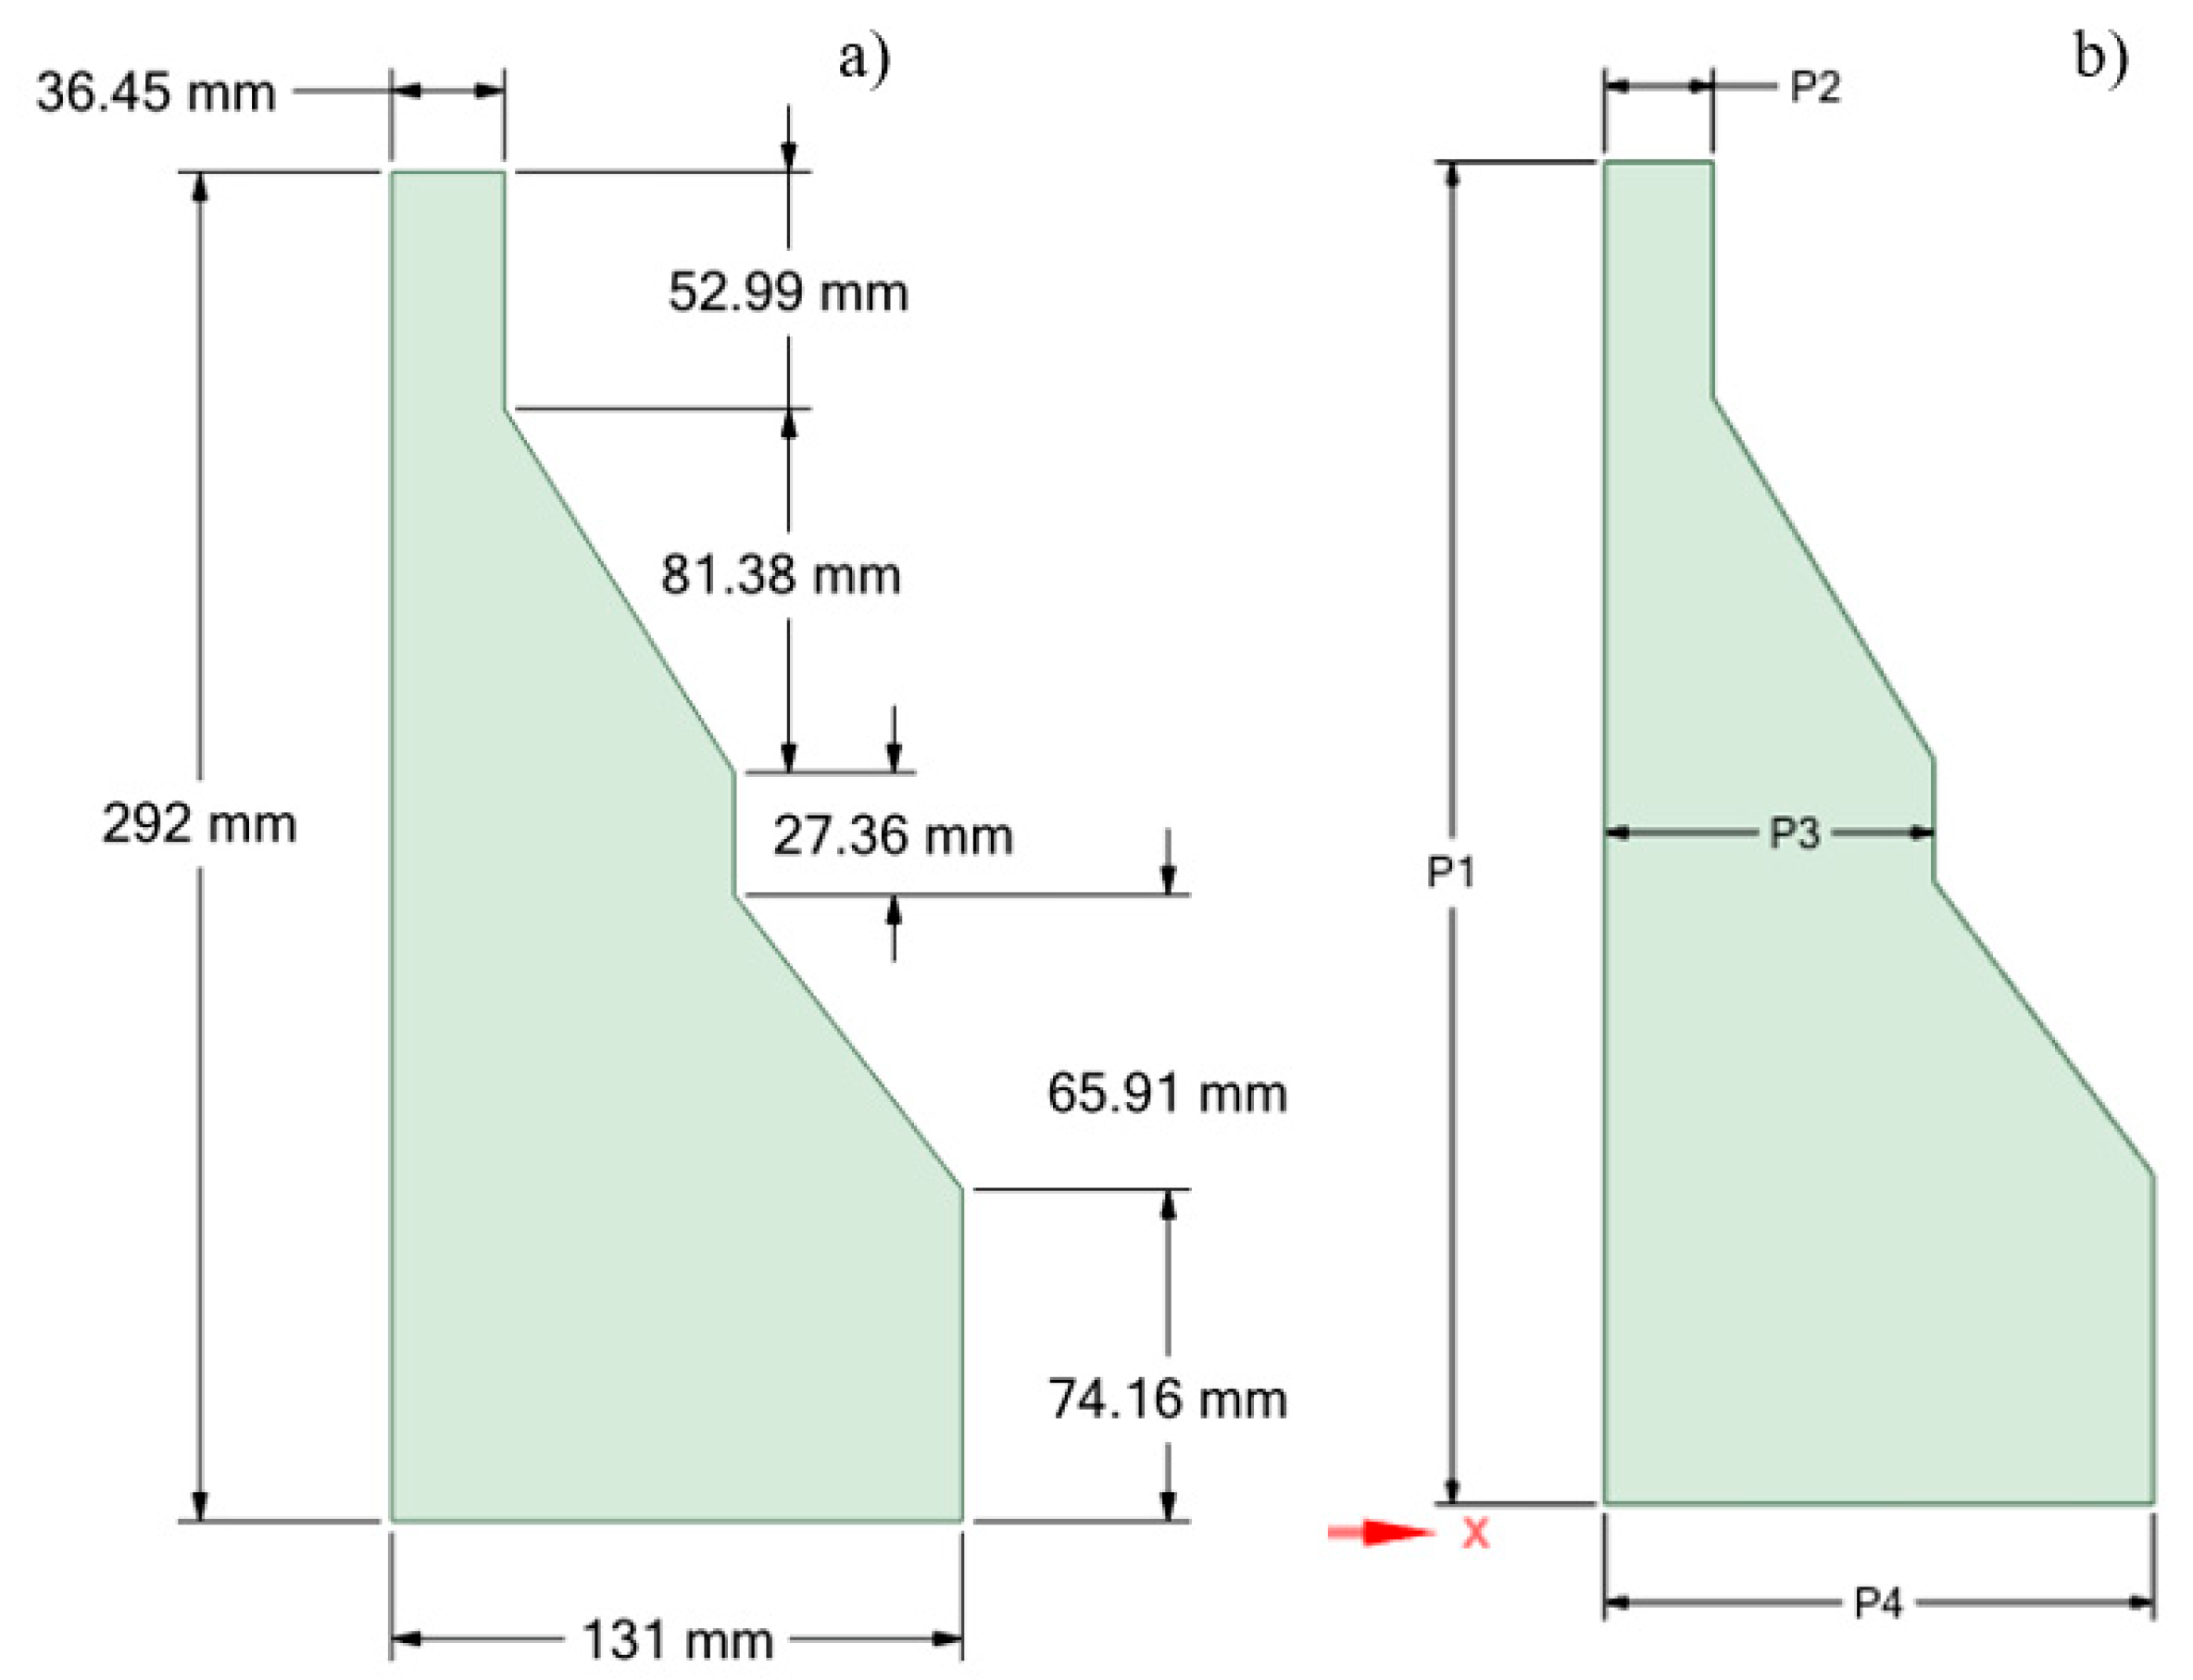
The pre-HIP capsule design dimensions arbitrarily chosen for a prototypic component shown in Figure 3a;
(2)
A physical capsule was fabricated from 6.35-mm-thick mild carbon steel according to the pre-HIP capsule design dimensions chosen in Step 1) above;
(3)
The fabricated pre-HIP capsule physical dimensions were 3D-scanned;
(4)
The 3D-scanned data (point cloud data) were converted to a 3D CAD model and imported into ANSYS;
(5)
The compaction simulation was run on the imported pre-HIP 3D physical scan dimensions to determine the FEM post-HIP dimensions;
(6)
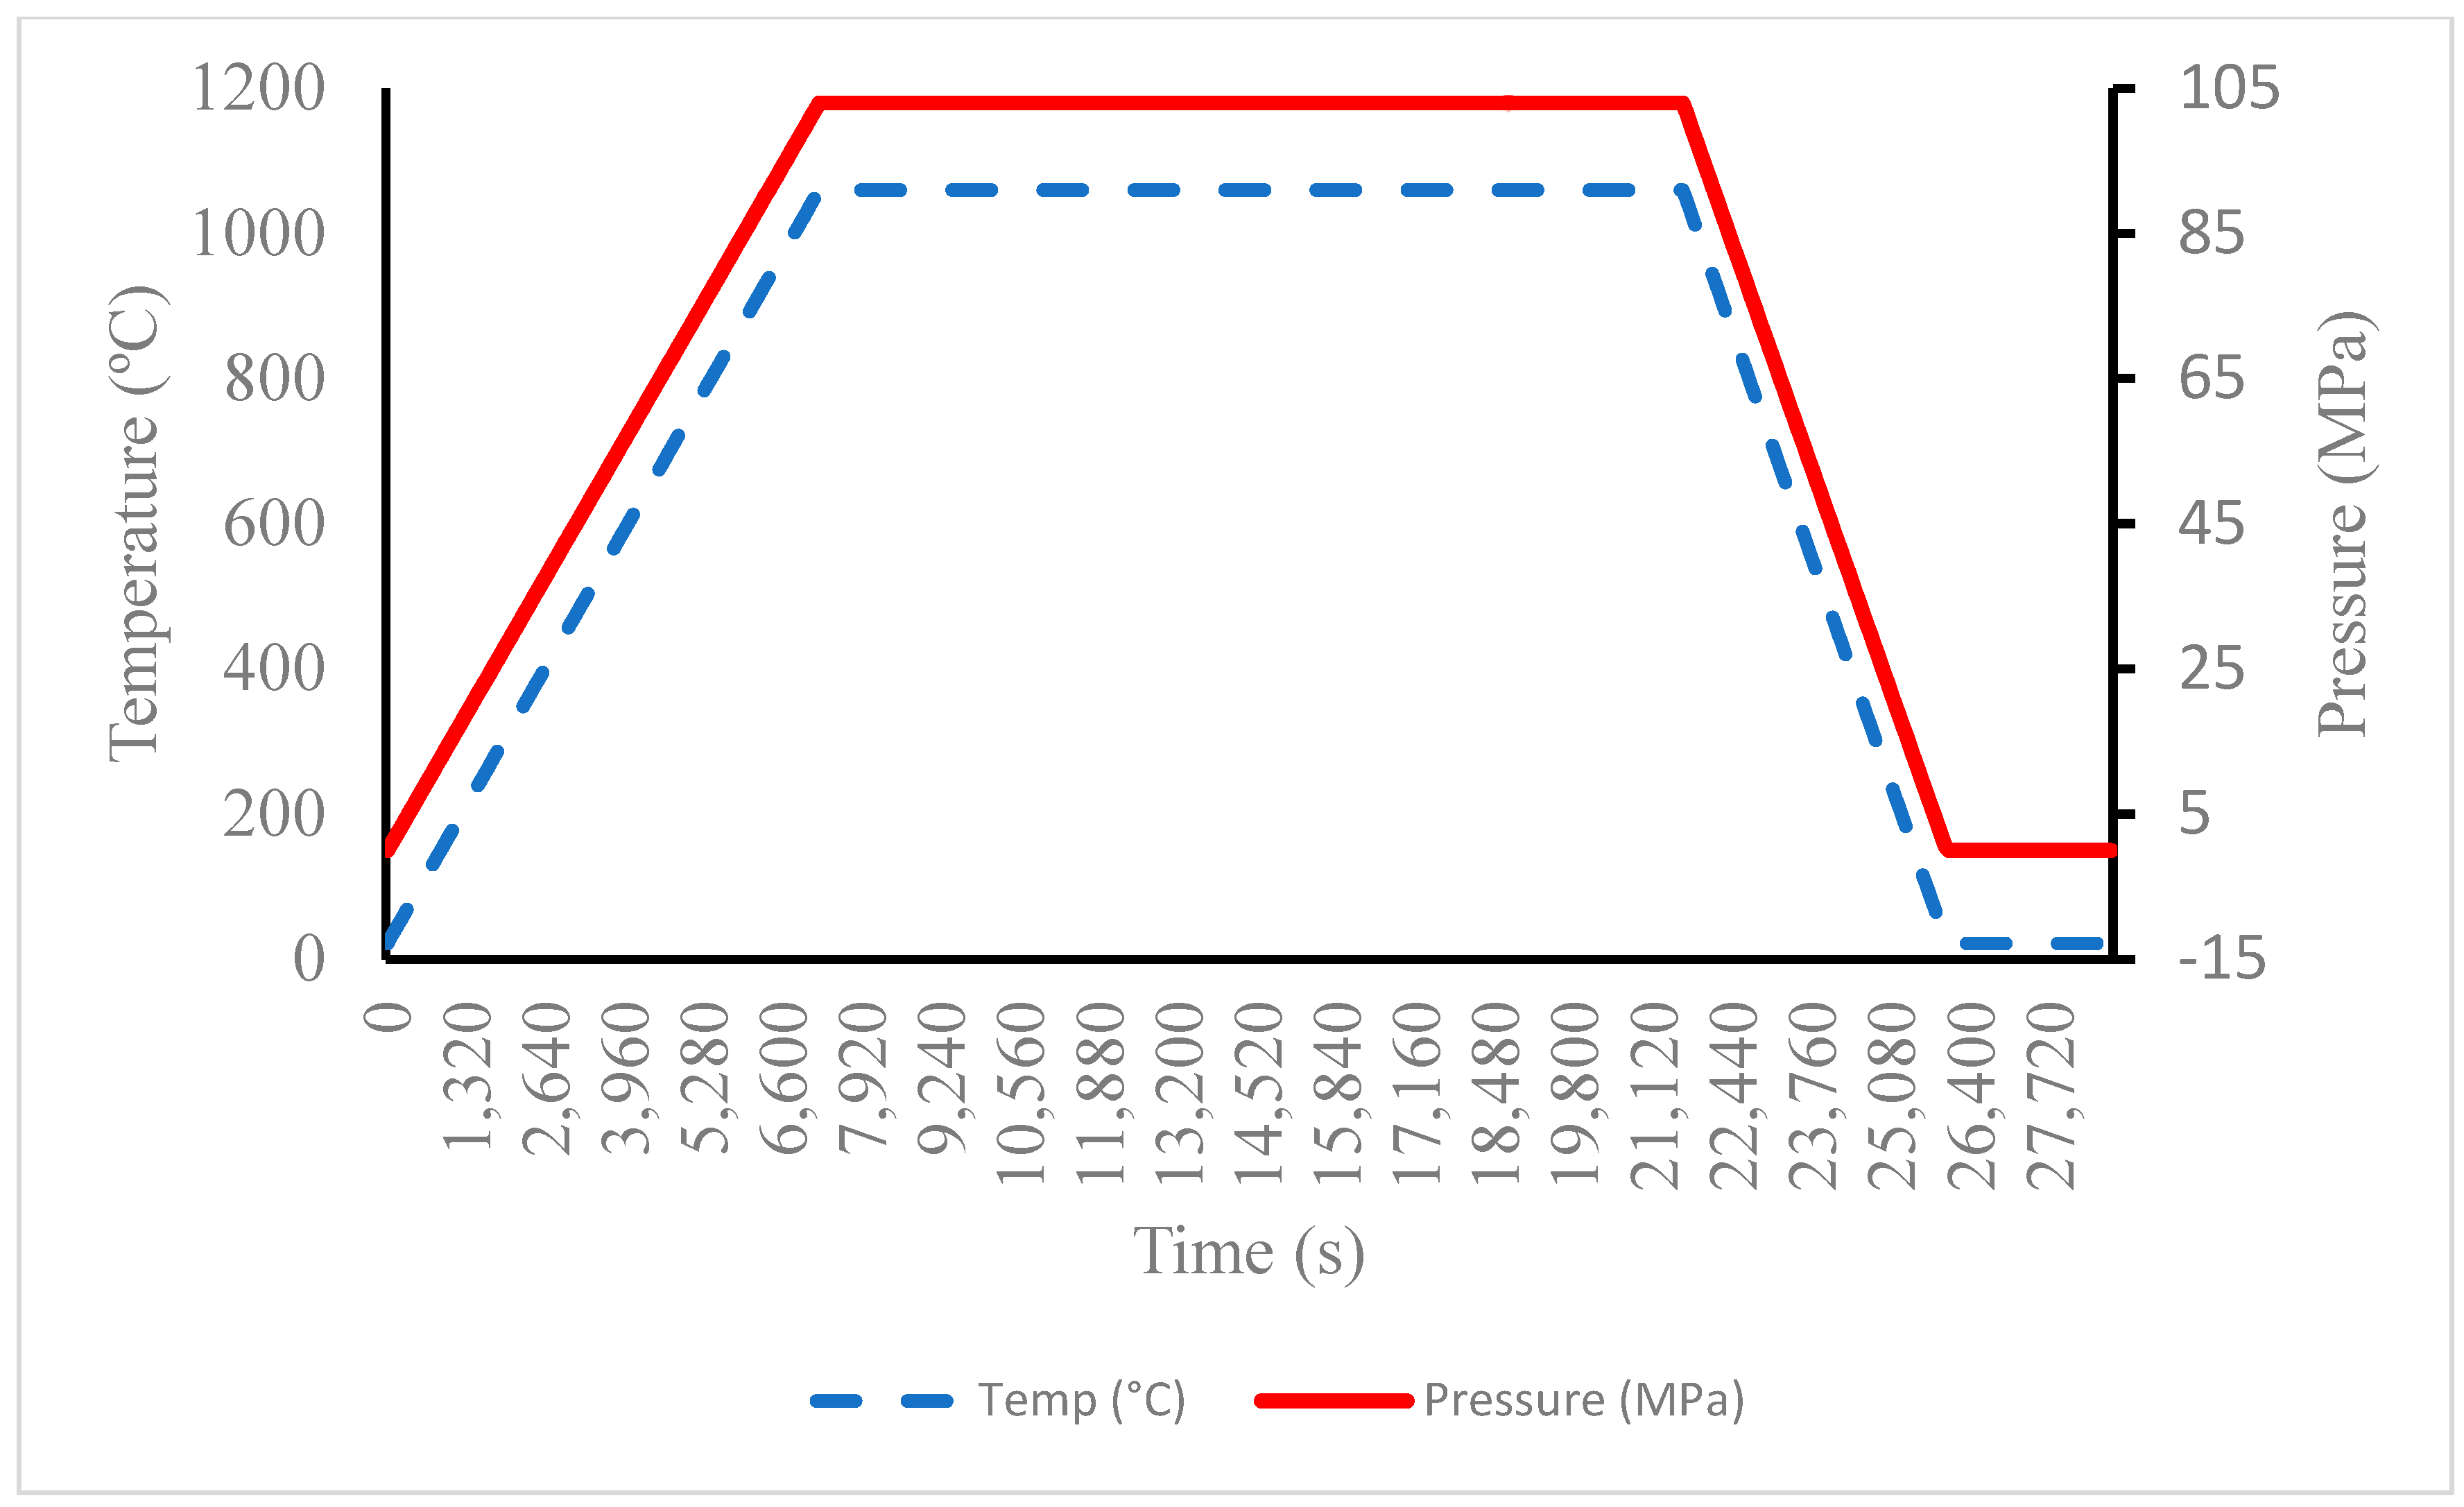
The physical capsule was filled with 316L powder and consolidated via the HIP cycle shown in Figure 7;
(7)
The physical post-HIP consolidated component (with the capsule shell still on) was 3D-scanned and converted to 3D CAD.
The 3D-scanned geometry of the physical post-HIP part was then compared to the post-HIP FEM dimensions predicted by the compaction simulation software.

3. Results and Discussion

3.1. Densification Behavior

Figure 8 shows that the relative density of the PM-HIP compaction simulation converged to one from the initial average of 0.675, meaning that full densification of the part was achieved. The sharp corners and small-dimension sections show slight deviations from full densification, due to the constrained deformation and shrinkage in those areas. As mentioned, the same phenomenon (i.e., lack of densification at the sharp corners) happens in PM-HIP experiments as well, and the phenomenon is called the “canister effect” [20]. As Figure 8b shows, in the first stage, the material is in the elastic region and the relative density is constant without any changes. Then, the relative density increases rapidly caused by the beginning of plasticity and accumulation of creep strains, in addition to the thermal and elastic strains. By the time the pressure and temperature reach soaking values (respectively 103 MPa and 1060 °C, as shown Figure 7), the relative density reaches one. Since the pressure is constant at the highest temperature, no more plastic deformation occurs at soaking pressure, and the creep plays an important load to homogenize the relative density over the compact.

3.2. Optimization Results

Five candidate points (sets of optimized pre-PM-HIP design dimensions) out of 461 simulations were selected and are represented in the Table 1, which shows that all of the recommended points are close to the target (shown in Figure 3), with small deviations.
The convergence criteria chart (Figure 9) demonstrates the standard deviation and mean of the output parameters, showing the stability percentage (2) of the population of simulations that reached the desired level of the stability at the 10th iteration. This means that the optimization procedure was successful and converged to the presented result. As Table 2 shows, the pre-HIP capsule dimensions P1, P2, P3 and P4 are varied in the small range of 1 mm, which is a small amount. These small deviations prove that to obtain the desired post-HIP targets, the pre-HIP dimensions should be in this range.
Figure 10 represents the sensitivity levels of the output parameters to the input parameters. The results show that all input parameters, P1 to P4, have an impact on the post-HIP compact dimensions. As the bar chart shows, the P 1 output is impacted by changing not only input parameter P1, but is also significantly impacted by changing input parameter P3. Additionally, the sensitivity chart shows that P3 pre-HIP has the highest impact on P3′ (post-HIP compact). The P 4 output parameter is more sensitive to the P2 and P4 parameters.
The trade-off chart (Figure 11) illustrates the generated samples, ranked by non-dominated Pareto fronts. The red points are the worst results and the blue points represent the best results. The candidate points in Table 2 provide information on the final choices of the solutions. The trade-off study was performed based on a MOGA sample set that was representative of feasible points for each objective. As an example, the feasible points of P3 are shown in Figure 4. The possible solution points out that P3 can change between 80.36 mm to 80.42 mm, which results in P3′ ending up in the range of 78.5 mm to 78.61 mm. This range is remarkably close to 78.59 mm, which is the target dimension for the desired post-HIP compact, which is also confirmed by the experiments.
As in all optimization schemes with multiple objectives and multiple constraints, there are non-dominant points that can be chosen as the solution. All feasible points are presented in Figure 12. These points are equally good but for other objectives. The green lines are the selected candidate points, while the red lines show the feasible points that are close to the candidate points. These feasible points are non-dominated points and are dominated by the selected solution points, meaning they were not selected as the final candidates. The MOGA algorithm sets the priority to the solutions that are dominant, which is the condition that all objectives have satisfied the constraint and become candidate points. The non-dominated solutions shown in Figure 12 compromise between all objectives without degrading any of them with respect to all other solutions.
Figure 13 demonstrates all target values for post-HIP compact dimensions. These target values are highlighted by the blue dashed lines in Figure 13. The candidates for P 3 in most of the points have almost the same dimensions, which means that the dimensions should be as close as possible to 80.4 mm to 80.5 mm. Almost 500 points were examined, which resulted in the ranges presented in Figure 14. Based on the candidate points results for the input parameters, the P1 candidate values varied from 302 to 308 mm. The P2 candidates fell between 29.4 and 29.5 mm, which is again a very narrow range. For P4, the range of the selected design candidates was between 128 and 135 mm. The post-HIP dimensions of the P 4 candidate points were between 128.6 and 129.9 mm, which was also a small range and close to the desired point.

3.3. Experimental Results

Figure 15 shows the HIP component in Figure 2. A comparison between the optimized experimental post-HIP dimensions (Figure 15) and simulated post-HIP dimensions (Figure 16) is presented in Table 3. For both the model and experiment, the parts shrank in all directions as the pressure and temperature were applied (Figure 16). Moreover, the results demonstrate that the dimensions obtained from the model (i.e., optimization + FEA) were remarkably close to the experimental results, with an acceptably small deviation of less than 6 mm (Figure 17). This outcome fully serves the fundamental purpose of running one experiment—to make sure that the proposed framework (Figure 1) works. As shown in Table 3, the largest deviations belong to P2 and P3 (refer to Figure 3b), which are more complex than the other sections of the geometry.

4. Conclusions

In this study, the geometric design of the capsule for hot isostatic pressing was optimized with a multi-objective genetic algorithm and the process was subsequently simulated with a finite element analysis. The backbone of the simulations was a numerical compressible plasticity scheme.
1.
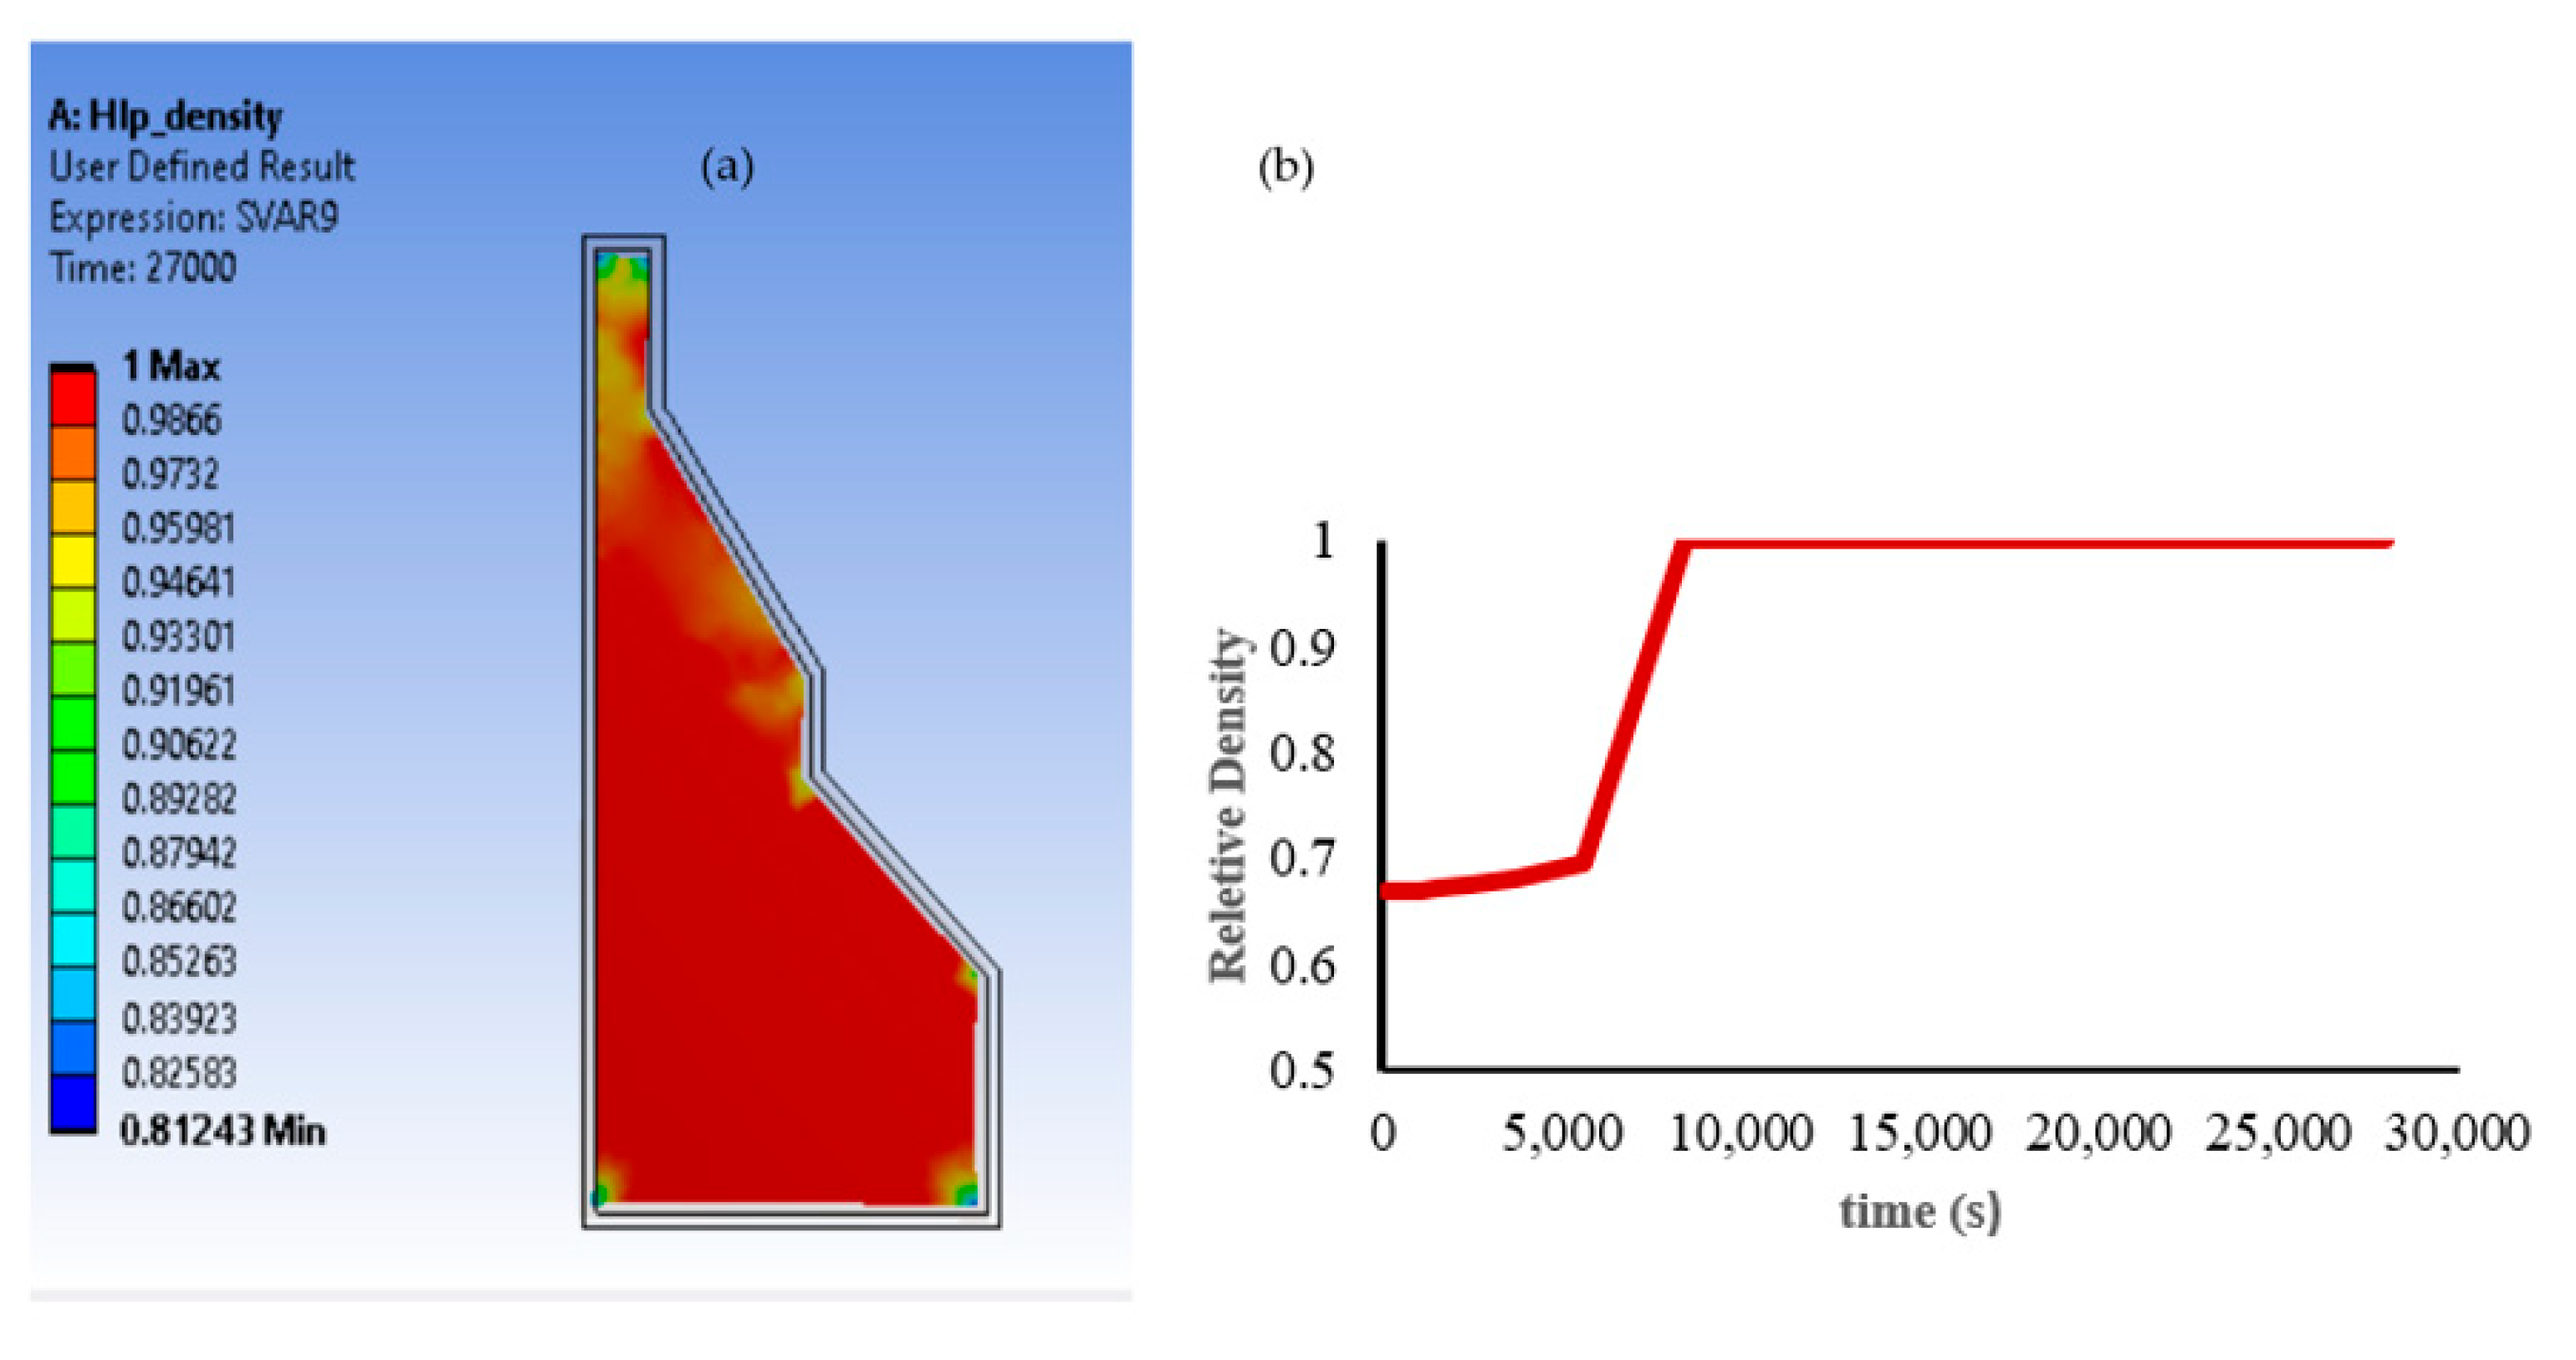
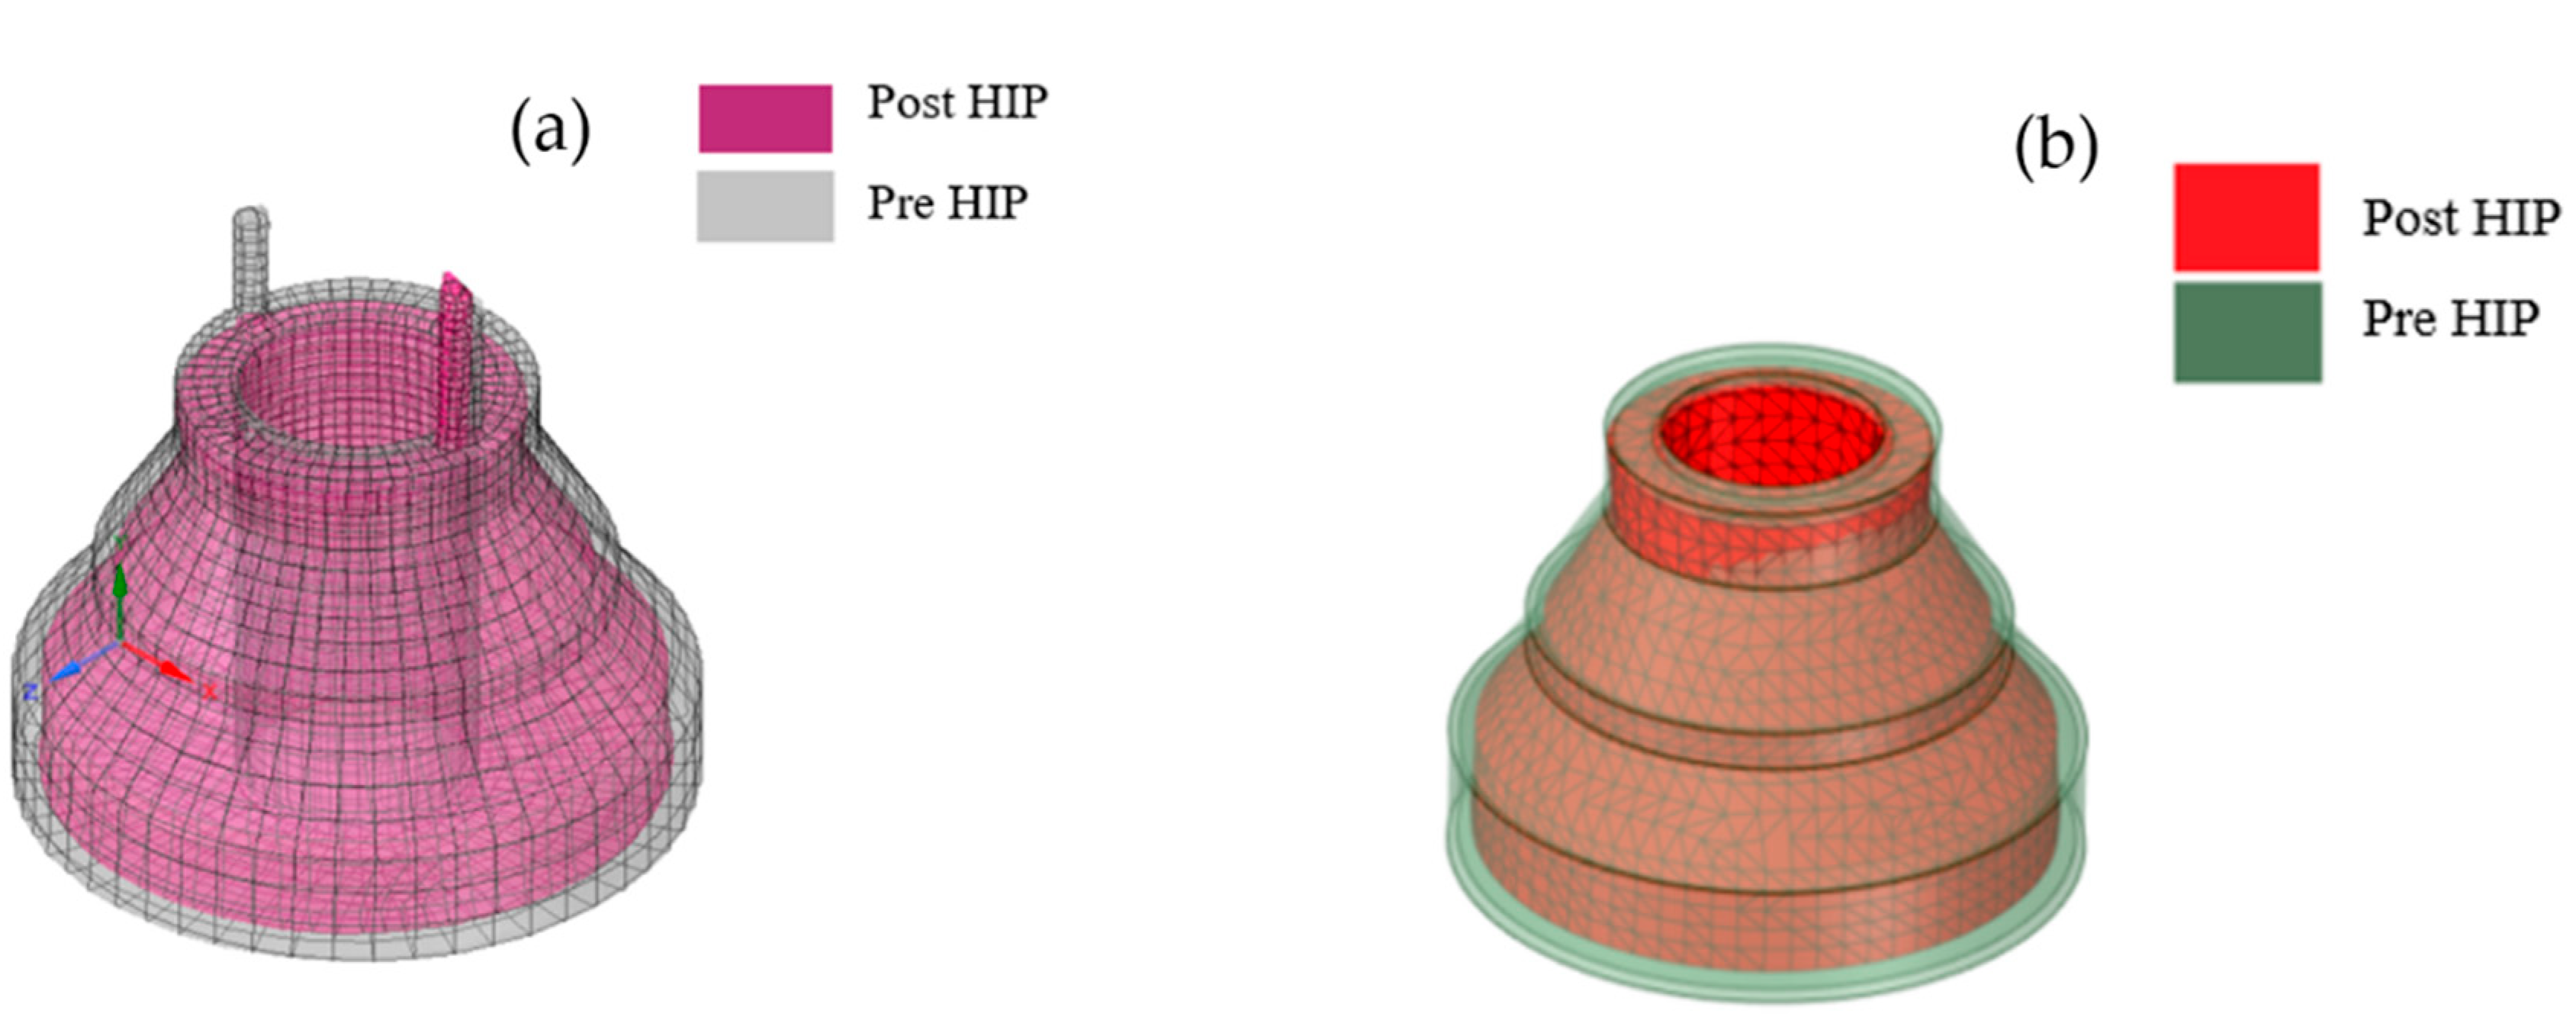
The combined constitutive model, which includes time-independent plasticity, creep and thermal strain, was used here to predict the densification process of the powder. The model was incorporated into FEA software using the USERMAT Fortran code. The compact and capsule shrank uniformly, while the relative density harmoniously reached 1 in the majority of the volume.
2.
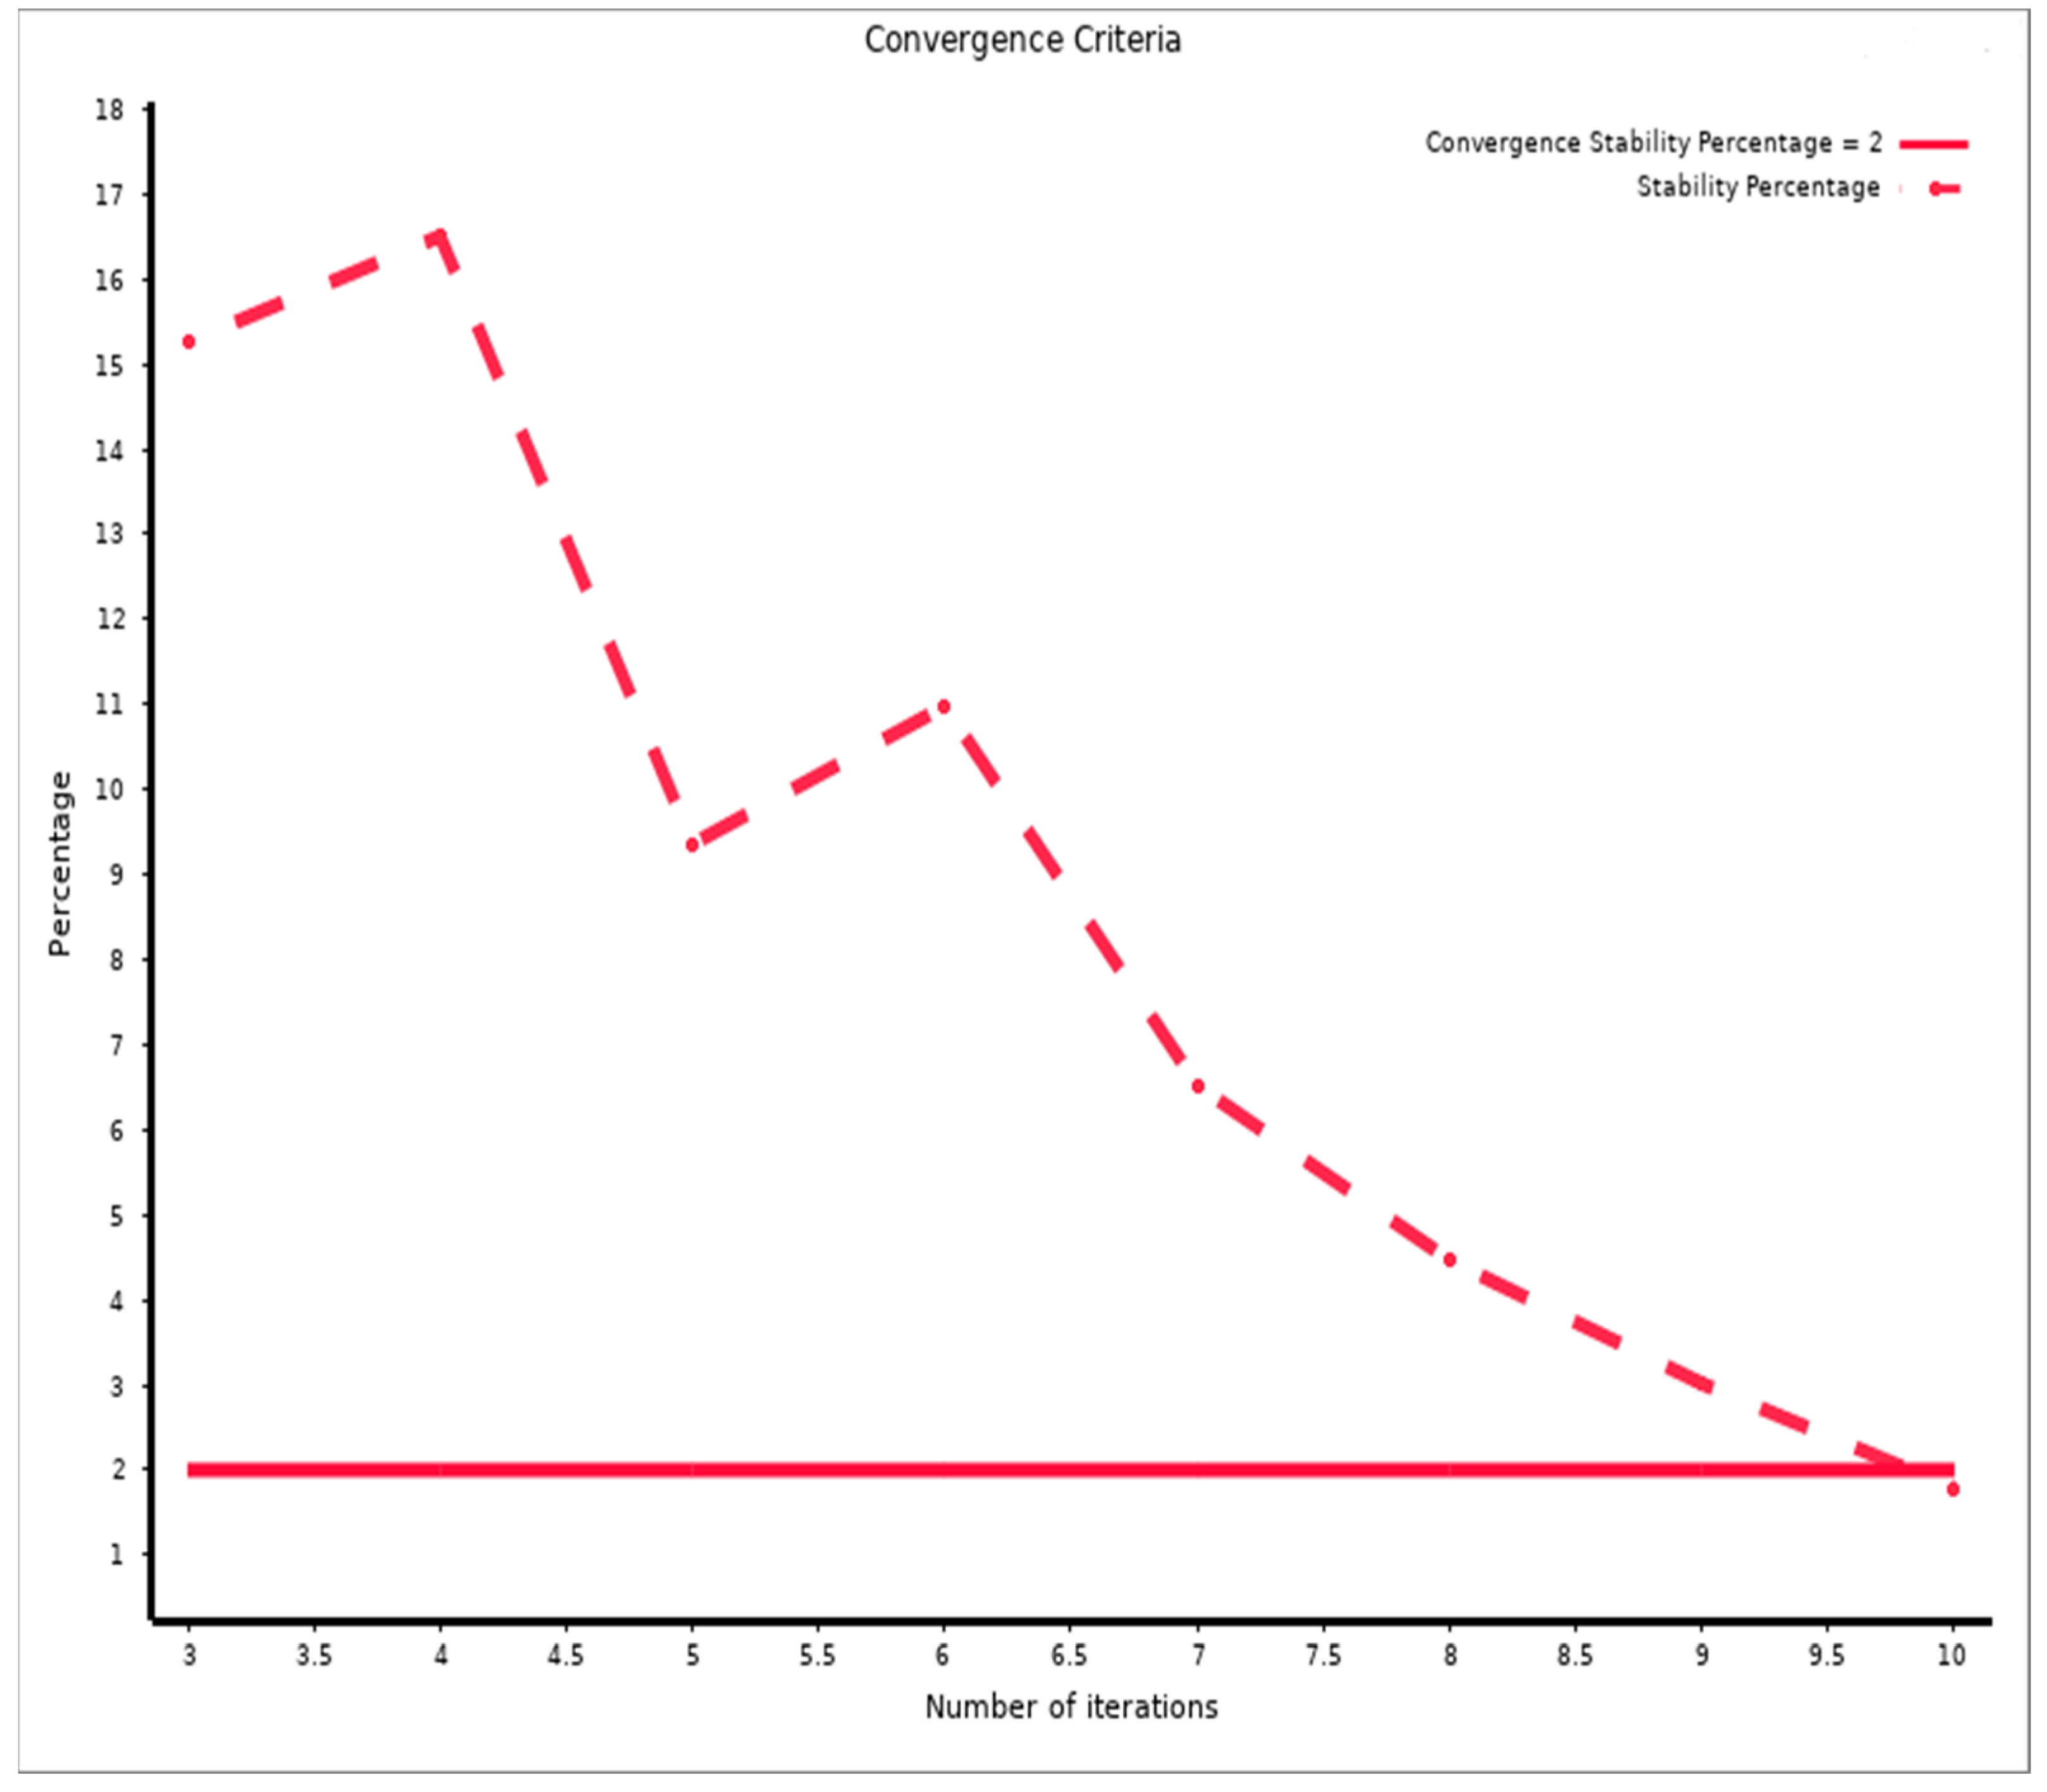
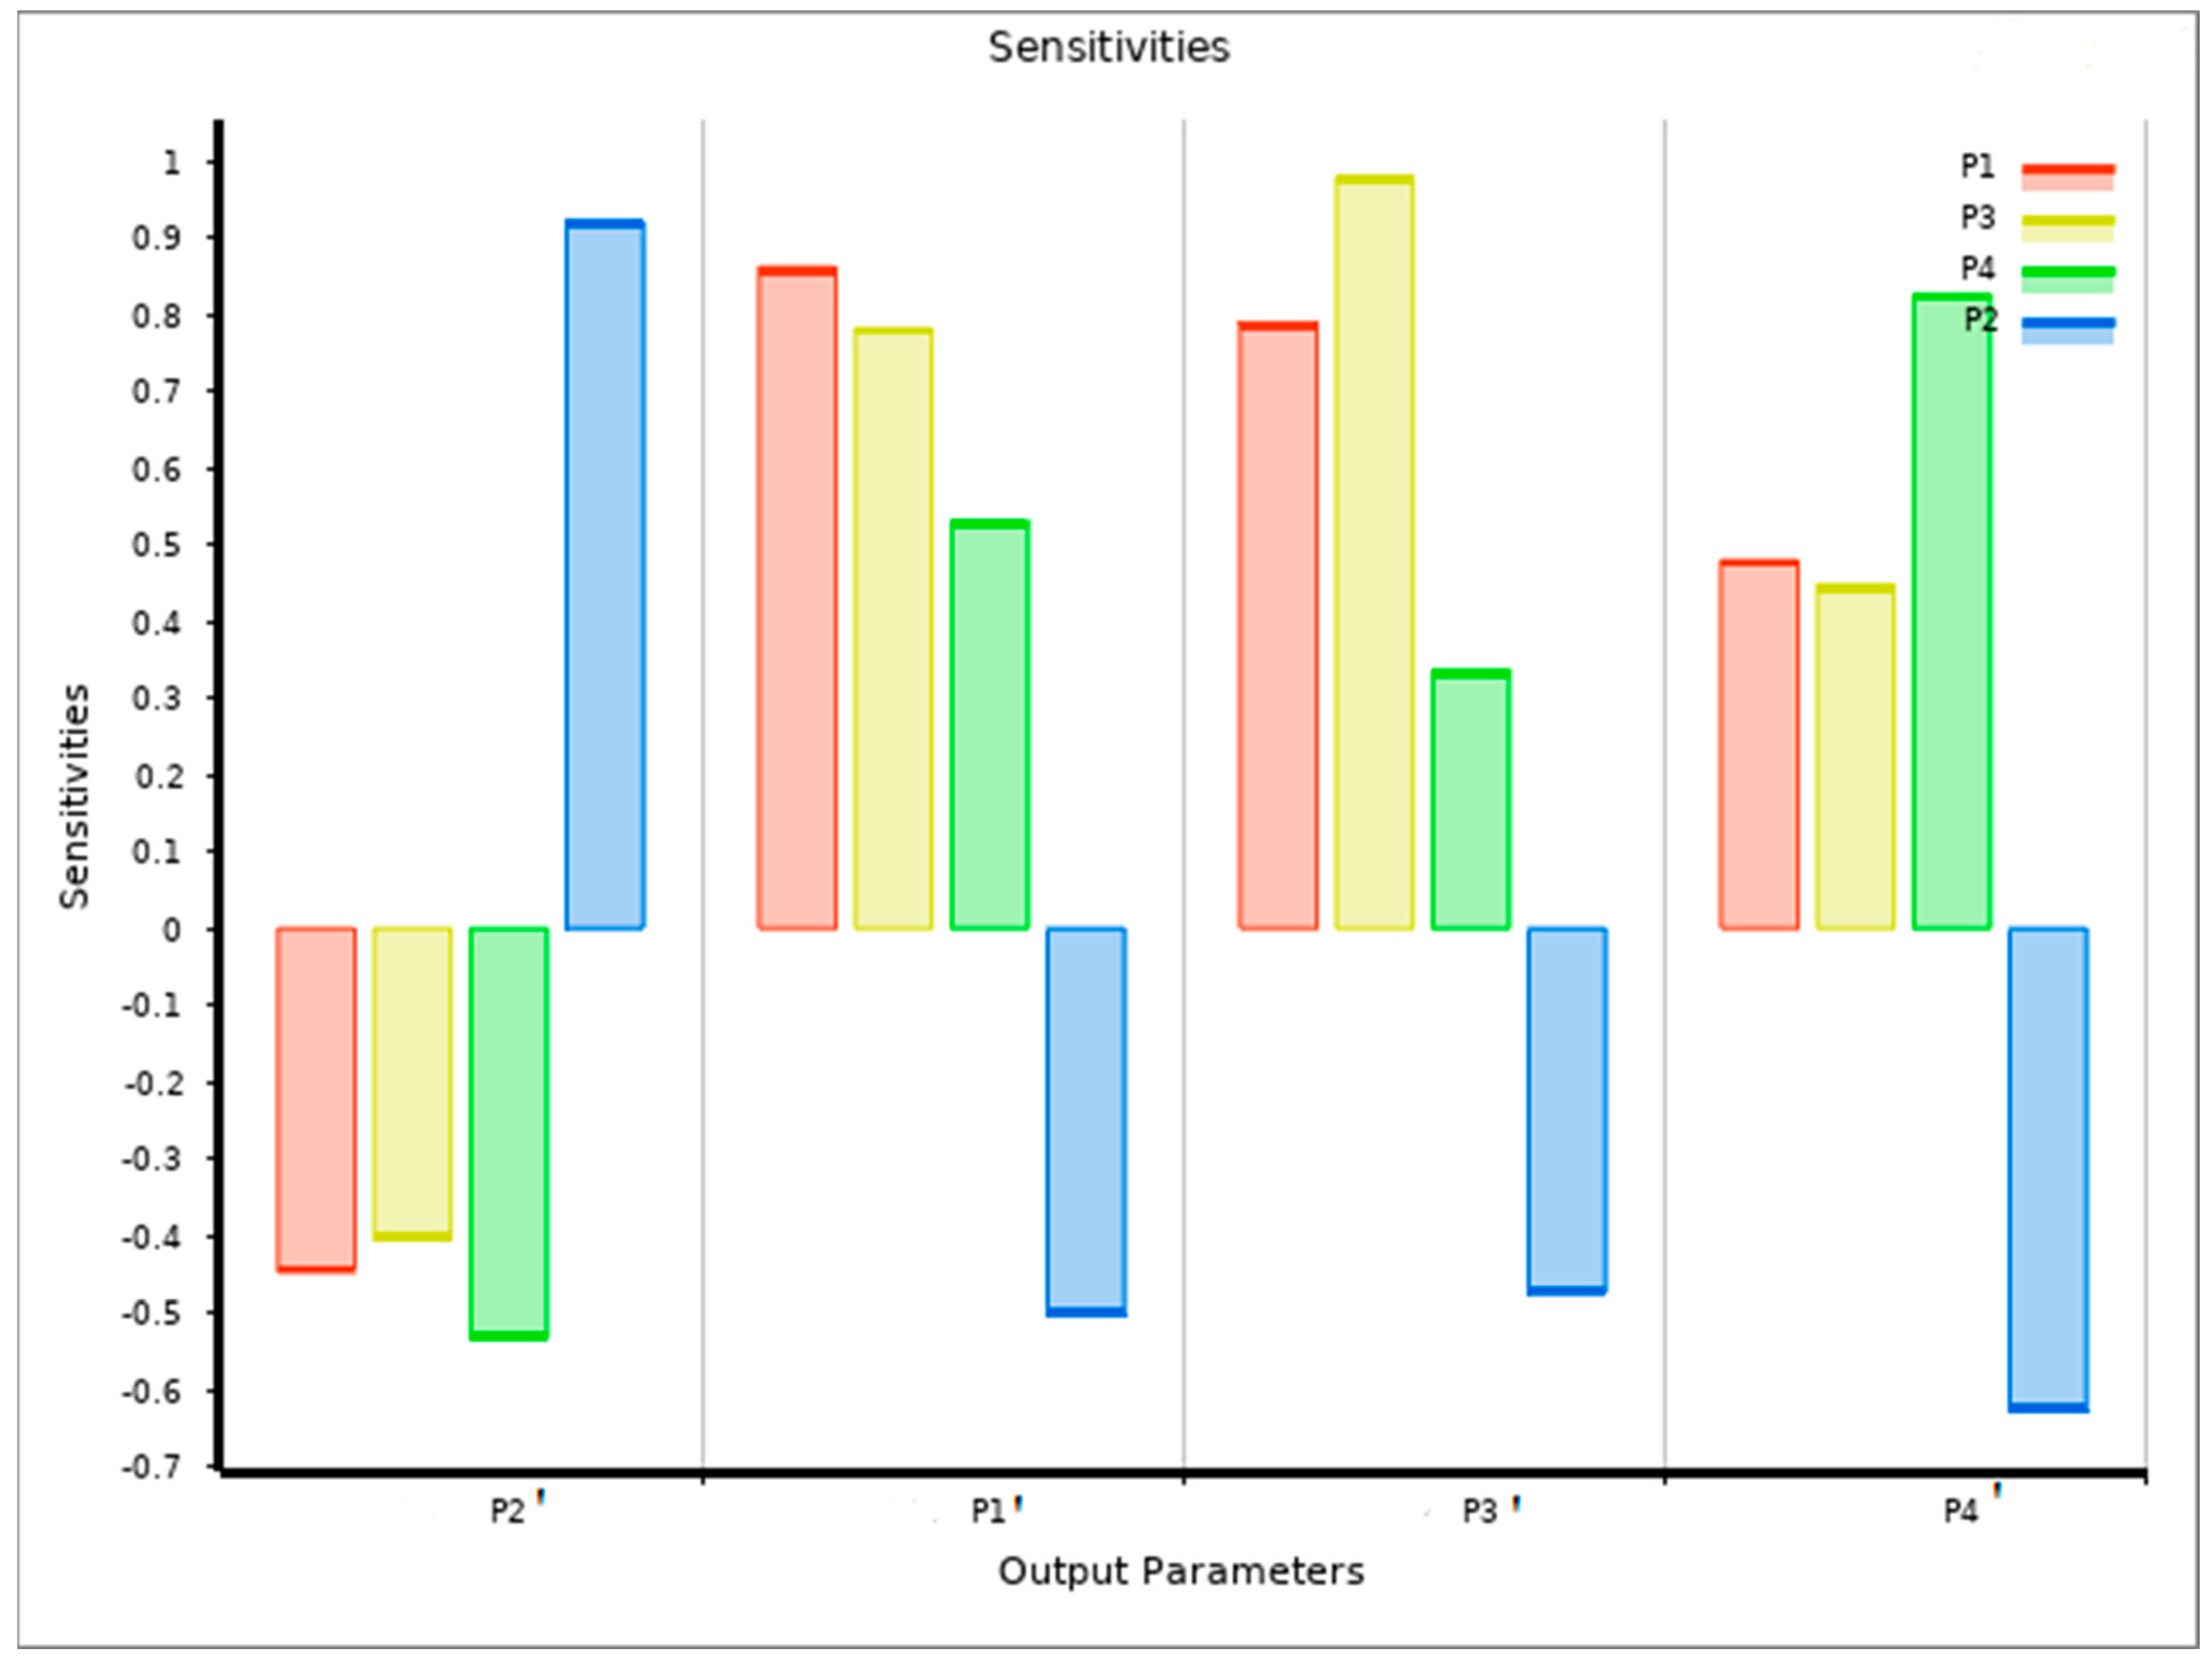
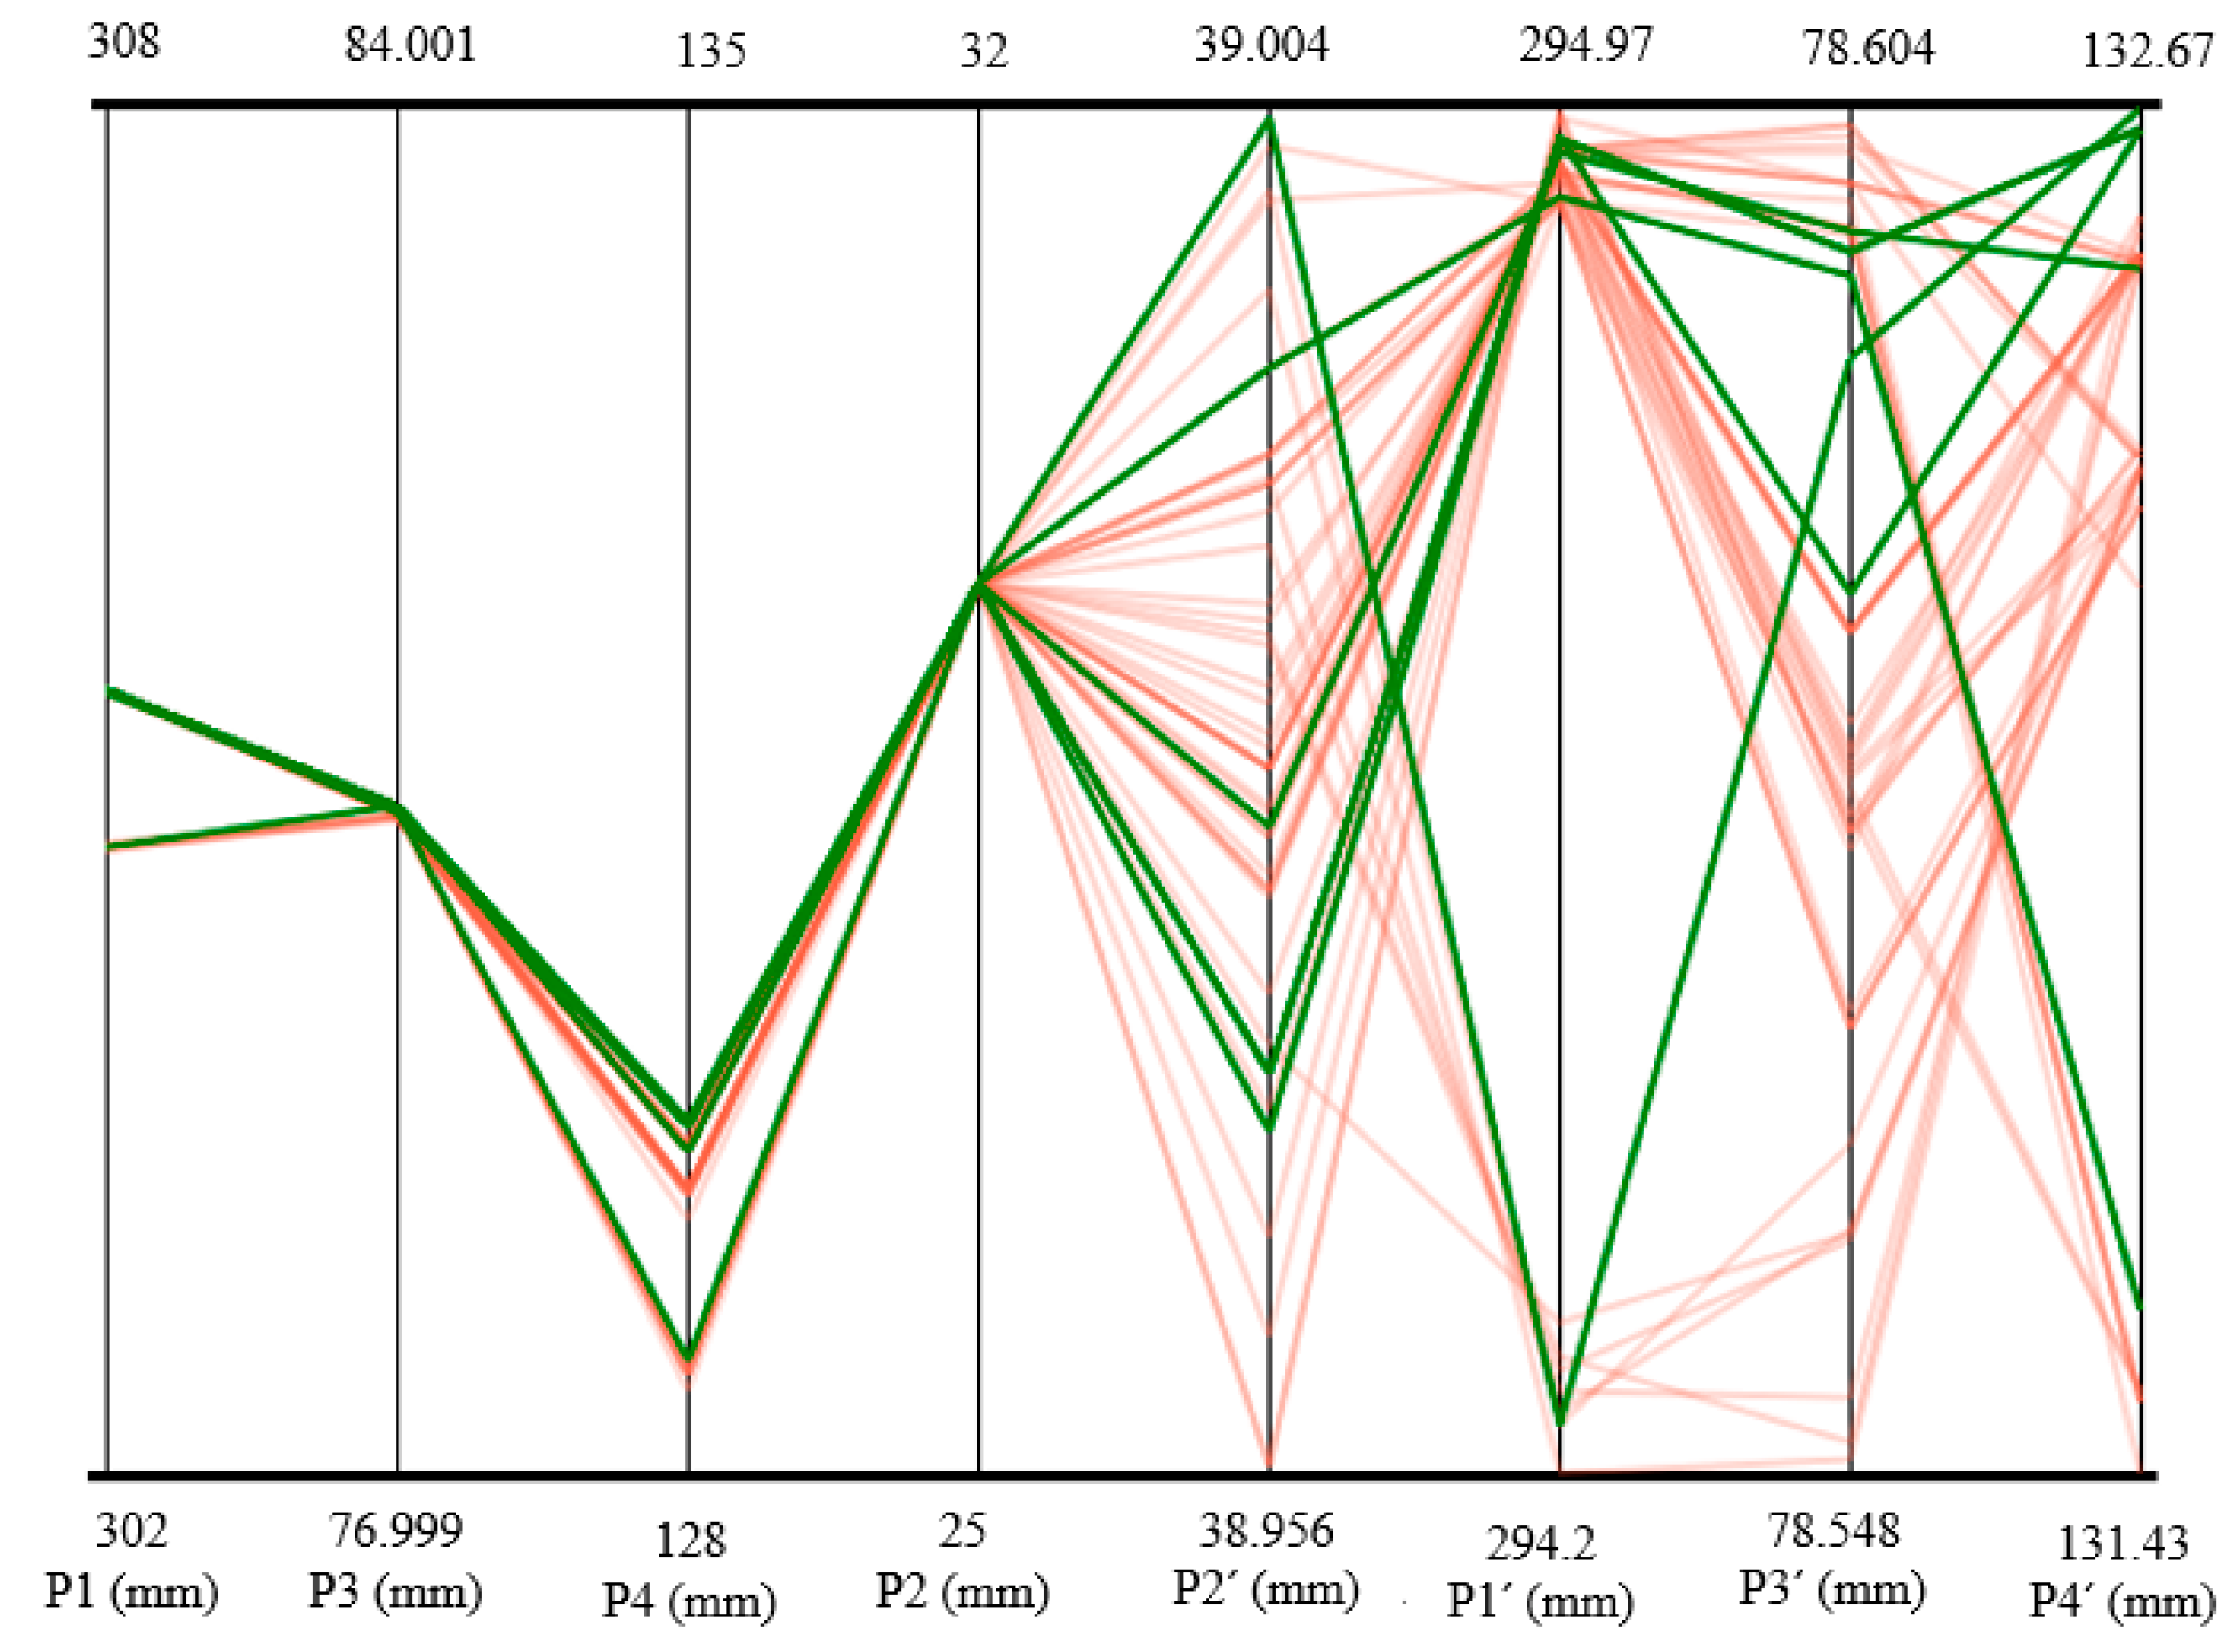
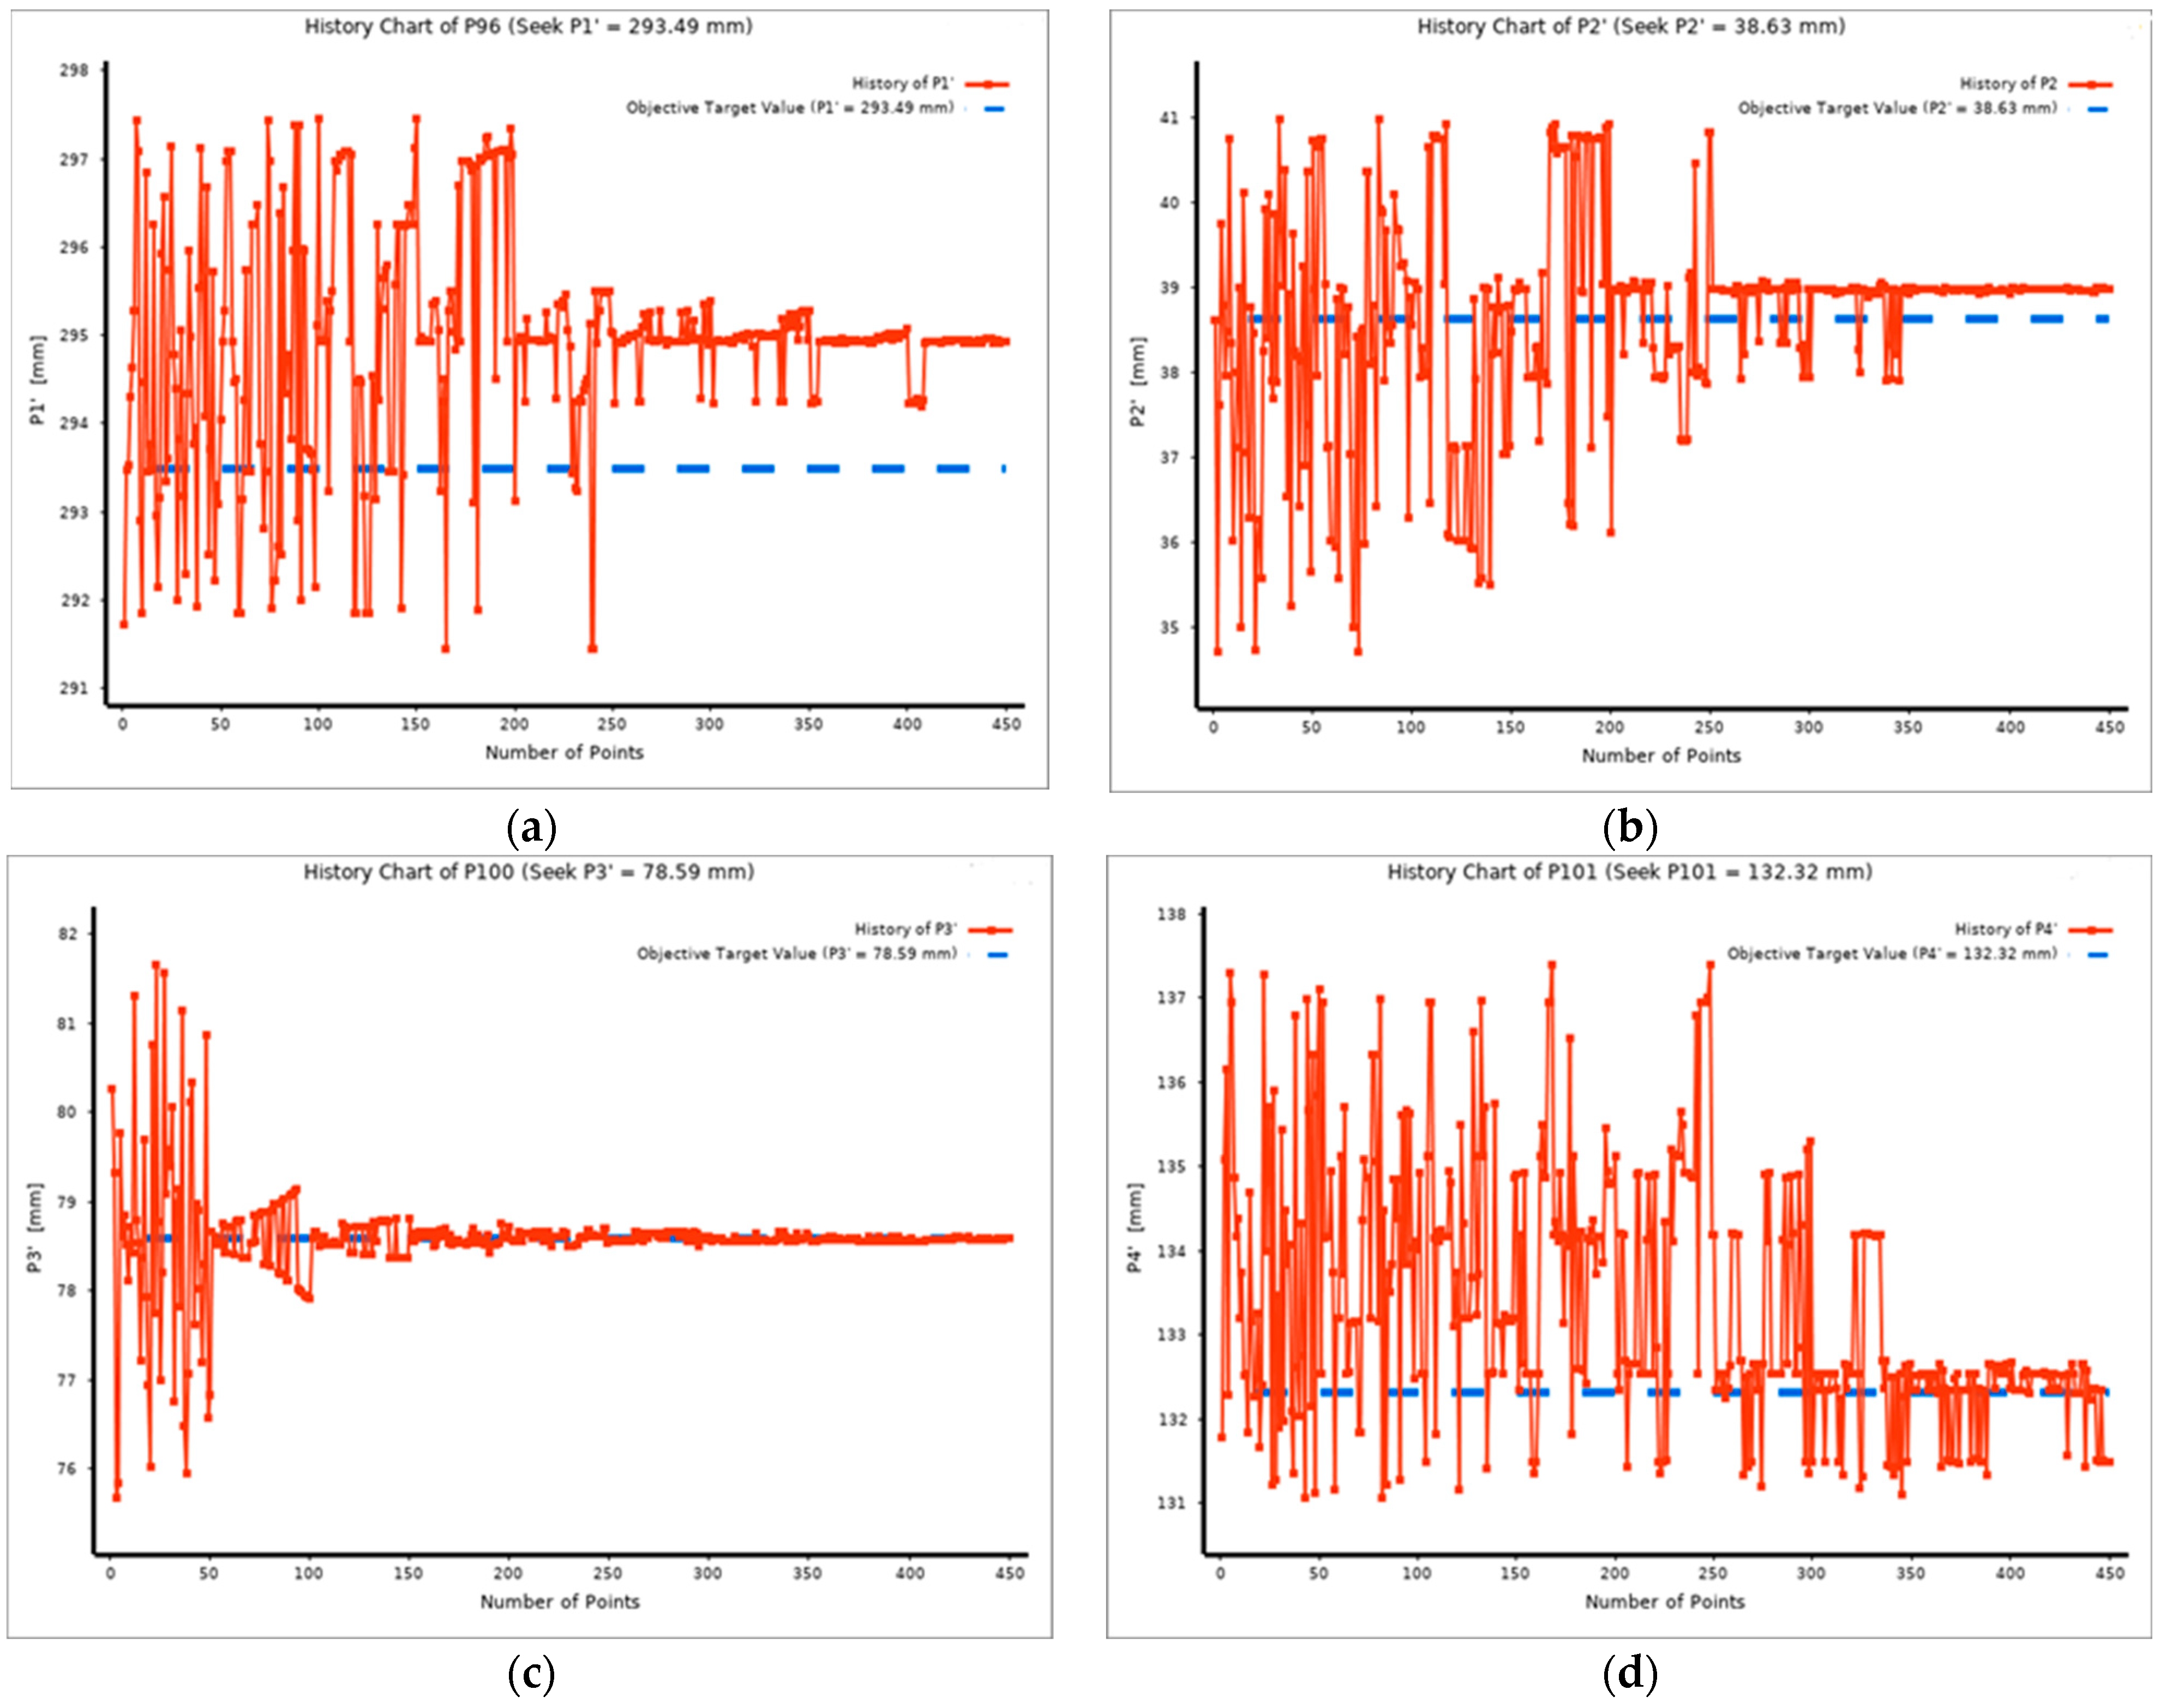
The optimization procedure based on a multi-objective genetic algorithm (MOGA) was aimed at obtaining the desired pre-PM-HIP capsule dimensions, such that the post-HIP compact required minimal or no post-machining and dimensioning adjustments. The desired post-HIP compact dimensions were set as targets and the pre-HIP dimensions were calculated over almost 500 points. Five candidate points that met all the constraints were selected.
3.
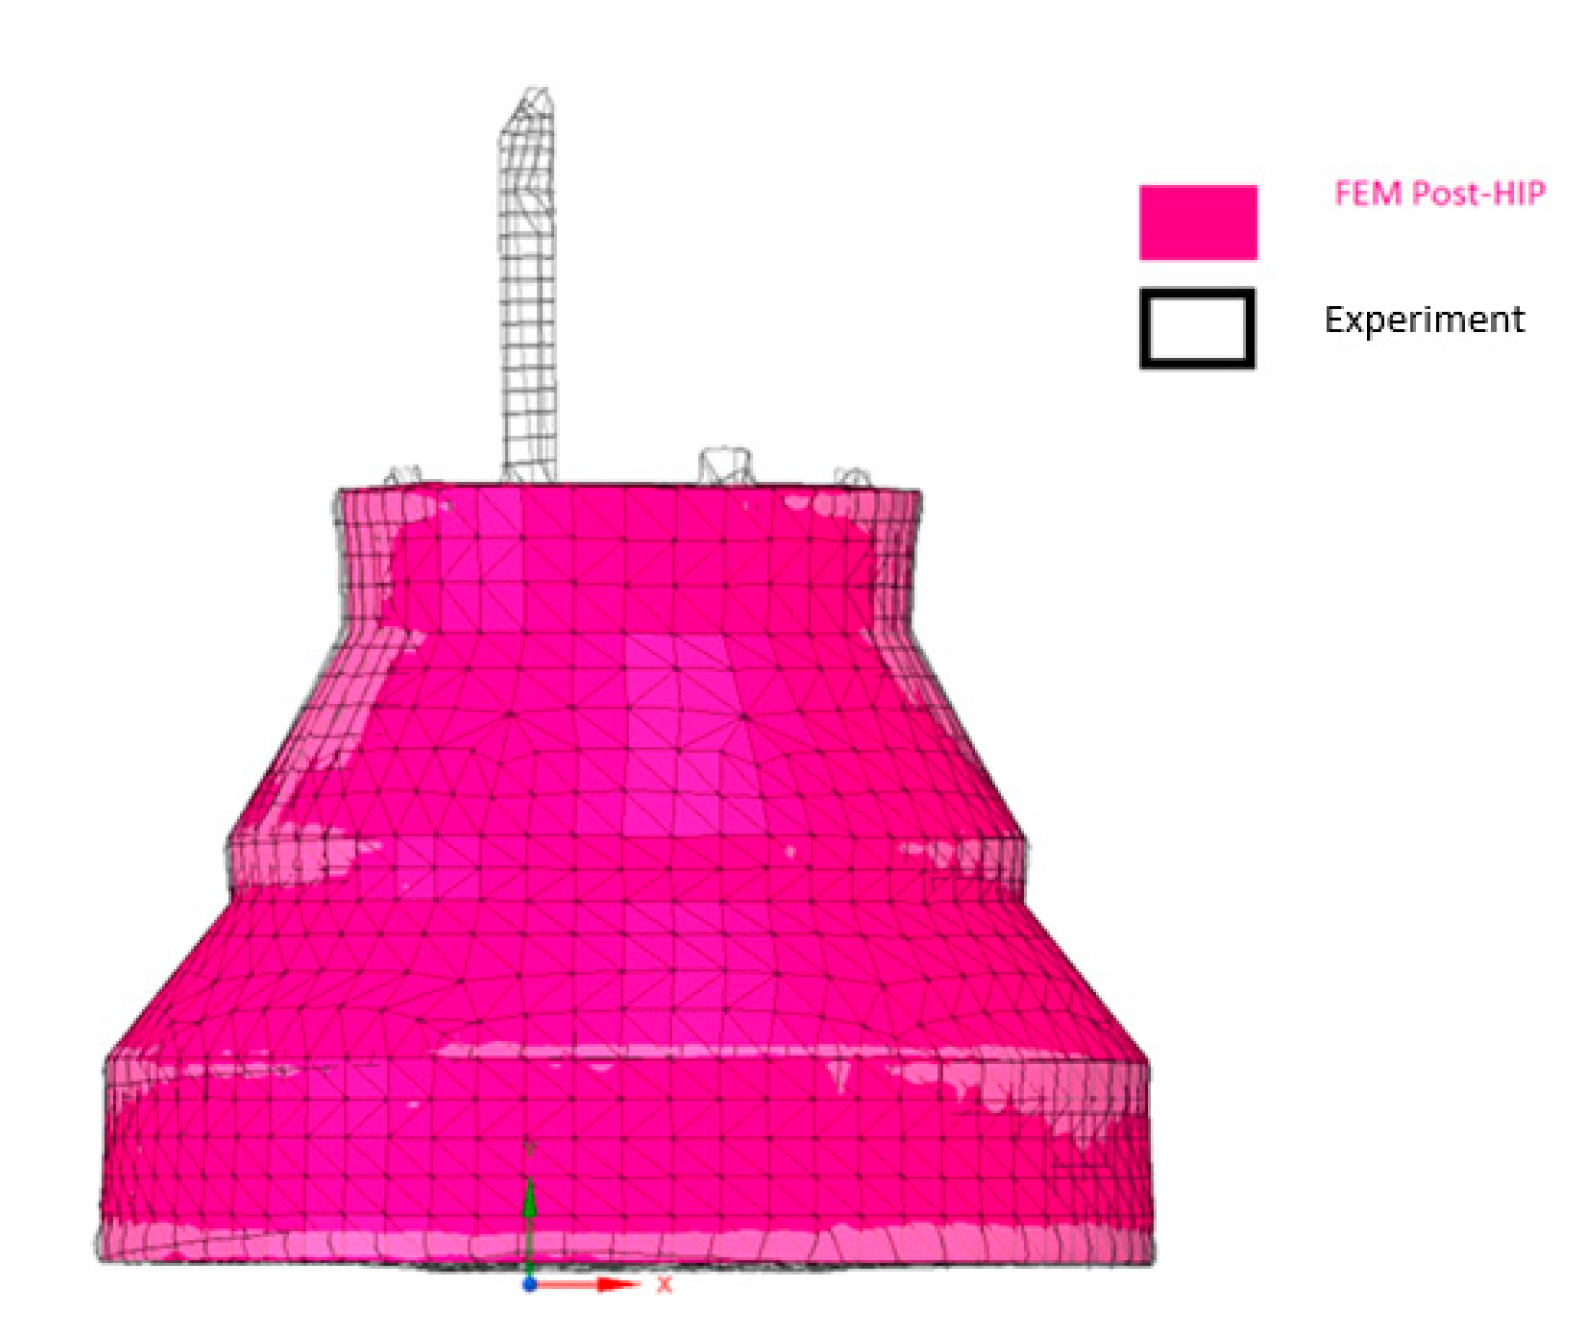
An HIP experiment was conducted to confirm the modeling outcome. The results showed that the simulation and experiment had the same target and their results closely matched, ending in a post-HIP part that was less than 3% deviation or approximately 1.0 to 1.5 mm deviation from target.
The presented method can be used for a variety powder metals material to predict the pre-HIP capsule necessary to obtain a desired post-HIP compact geometry.

Author Contributions

Writing—original draft preparation, S.S.; Writing—review and editing, M.A., D.G., A.T. and Z.F. All authors have read and agreed to the published version of the manuscript.

Funding

This research received no external funding.

Conflicts of Interest

The authors declare no conflict of interest.

References

  1. Deng, Y.; Kaletsch, A.; Bezold, A.; Broeckmann, C. Precise Prediction of Near-Net-Shape HIP Components through DEM and FEM Modelling. In Proceedings of the Conference on Hot Isostatic Pressing: HIP’17, Sydney, Australia, 5–8 December 2017; Volume 10, pp. 182–189. [Google Scholar] [CrossRef] [Green Version]
  2. Khoei, A.R.; Molaeinia, Z.; Keshavarz, S. Modeling of hot isostatic pressing of metal powder with temperature-dependent cap plasticity model. Int. J. Mater. Form. 2012, 6, 363–376. [Google Scholar] [CrossRef]
  3. Kohar, C.P.; Martin, É.; Connolly, D.S.; Patil, S.; Krutz, N.; Wei, D.; Inal, K. A new and efficient thermo-elasto-viscoplastic numerical implementation for implicit finite element simulations of powder metals: An application to hot isostatic pressing. Int. J. Mech. Sci. 2019, 155, 222–234. [Google Scholar] [CrossRef]
  4. Nguyen, C.V.; Bezold, A.; Christoph, B. Anisotropic shrinkage of hot isostatically pressed components. In Proceedings of the 11th International Conference on Hot Isostatic Pressing, Stockholm, Sweden, 9–13 June 2014; pp. 369–382. [Google Scholar]
  5. Van Nguyen, C.; Deng, Y.; Bezold, A.; Broeckmann, C. A combined model to simulate the powder densification and shape changes during hot isostatic pressing. Comput. Methods Appl. Mech. Eng. 2017, 315, 302–315. [Google Scholar] [CrossRef]
  6. Deng, Y.; Birke, C.; Rajaei, A.; Kaletsch, A.; Broeckmann, C. Numerical Study of Hot Isostatic Pressing with Integrated Heat Treatment of PM-HIP Cold Work Steel D7. In Proceedings of the WorldPM 2018, Peking, China, 16–20 September 2018; pp. 442–453. [Google Scholar]
  7. Van Nguyen, C.; Bezold, A.; Broeckmann, C. Modelling of HIP: Influence of Initial Powder Distribution after Pre-Densification on the Consolidation of Stainless Steel 316L during HIP. In European PM Conference Proceedings, Proceedings of the European Congress and Exhibition on Powder Metallurgy, Gothenburg, Sweden, 5–18 September 2013; The European Powder Metallurgy Association: Brussels, Belgium, 2013; p. 1. [Google Scholar]
  8. Chung, S.H.; Park, H.; Jeon, K.D.; Kim, K.T.; Hwang, S.M. An Optimal Container Design for Metal Powder Under Hot Isostatic Pressing. J. Eng. Mater. Technol. Trans. ASME 2001, 123, 234–239. [Google Scholar] [CrossRef]
  9. Abouaf, M.; Chenot, J.L.; Raisson, G.; Bauduin, P. Finite element simulation of hot isostatic pressing of metal powders. Int. J. Numer. Methods Eng. 1988, 25, 191–212. [Google Scholar] [CrossRef]
  10. Oyane, M.; Shima, S.; Kono, Y. Thoery of Plasticity for Porous Metals. Bull. JSME 1973, 16, 1254–1262. [Google Scholar] [CrossRef]
  11. Kühn, H.A.; Downey, C.L. Material Behavior in Powder Preform Forging. J. Eng. Mater. Technol. 1972, 95, 41–46. [Google Scholar] [CrossRef]
  12. Jeon, Y.; Kim, K. Near-net-shape forming of 316L stainless steel powder under hot isostatic pressing. Int. J. Mech. Sci. 1999, 41, 815–830. [Google Scholar] [CrossRef]
  13. Sofronis, P.; Mcmeeking, R.M. Creep of Power-Law Material Containing Spherical Voids. J. Appl. Mech. Trans. ASME 1992, 59, S88–S95. [Google Scholar] [CrossRef]
  14. Jinka, A.G.; Lewis, R.W. Finite element simulation of hot isostatic pressing of metal powders. Comput. Methods Appl. Mech. Eng. 1994, 114, 249–272. [Google Scholar] [CrossRef]
  15. Yuan, W.; Mei, J.; Samarov, V.; Seliverstov, D.; Wu, X. Computer modelling and tooling design for near net shaped components using hot isostatic pressing. J. Mater. Process. Technol. 2007, 182, 39–49. [Google Scholar] [CrossRef]
  16. Wikman, B. Modelling and Simulation of Powder Pressing with Consideration of Friction Modelling and Simulation of Powder Pressing with Consideration of Friction. Ph.D. Thesis, Luleå University of Technology, Luleå, Sweden, 1999. [Google Scholar]
  17. Aryanpour, G. Constitutive Modeling for Hot Isostatic Pressing of Metal Powders. J. Porous Media 2006, 9, 15–34. [Google Scholar] [CrossRef]
  18. Aryanpour, G.; Mashl, S.; Warke, V. Elastoplastic–viscoplastic modelling of metal powder compaction: Application to hot isostatic pressing. Powder Metall. 2013, 56, 14–23. [Google Scholar] [CrossRef]
  19. Liu, G.-C.; Shi, Y.-S.; Wei, Q.-S.; Xue, P.-J. Simulation of pressure effects on hot isostatic pressing of stainless steel powder. J. Cent. South Univ. 2012, 19, 55–62. [Google Scholar] [CrossRef]
  20. Abdelhafeez, A.; Essa, K. Influences of Powder Compaction Constitutive Models on the Finite Element Simulation of Hot Isostatic Pressing. Procedia CIRP 2016, 55, 188–193. [Google Scholar] [CrossRef] [Green Version]
  21. Deng, Y.; Zhang, J.-L.; Kaletsch, A.; Broeckmann, C. Modelling and simulation of densification and σ-phase precipitation in PM duplex steel AISI 318LN during hot isostatic pressing. Mater. Today Commun. 2021, 29, 102901. [Google Scholar] [CrossRef]
  22. You, D.; Wang, Y.; Yang, C.; Li, F. Comparative analysis of the hot-isostatic-pressing densification behavior of atomized and milled Ti6Al4V powders. J. Mater. Res. Technol. 2020, 9, 3091–3108. [Google Scholar] [CrossRef]
  23. Shima, S.; Oyane, M. Plasticity theory for porous metals. Int. J. Mech. Sci. 1976, 18, 285–291. [Google Scholar] [CrossRef]
  24. Hu, B.; Cai, G.; Fu, J.; Xin, Y.; Zhang, D.; Yuan, Y.; Guo, S. Densification behavior of tungsten alloy powders during hot isostatic pressing. Mater. Today Commun. 2022, 31, 103576. [Google Scholar] [CrossRef]
  25. Reddy, J. Introduction to the Finite Element Method; McGraw-Hill Education: New York, NY, USA, 2019. [Google Scholar]
  26. Wikman, B.; Svoboda, A.; Häggblad, H. A combined material model for numerical simulation of hot isostatic pressing. Comput. Methods Appl. Mech. Eng. 2000, 189, 901–913. [Google Scholar] [CrossRef]
  27. Ishibuchi, H. MOGA: Multi-objective genetic algorithms n.d. In Proceedings of the 1995 IEEE International Conference on Evolutionary Computation, Perth, Australia, 29 November–1 December 1995. [Google Scholar]
  28. Huang, B.; Wang, Z.; Xu, Y. Multi-Objective Genetic Algorithm for Hybrid Electric Vehicle Parameter Optimization. In Proceedings of the 2006 IEEE/RSJ International Conference on Intelligent Robots and Systems, Beijing, China, 9–15 October 2006; pp. 5177–5182. [Google Scholar]
  29. Keshavarz, S.; Khoei, A.R.; Molaeinia, Z. Genetic algorithm-based numerical optimization of powder compaction process with temperature-dependent cap plasticity model. Int. J. Adv. Manuf. Technol. 2013, 64, 1057–1072. [Google Scholar] [CrossRef]
  30. Gao, Y.; Shi, L.; Yao, P. Study on multi-objective genetic algorithm. In Proceedings of the World Congress on Intelligent Control and Automation (WCICA), Hefei, China, 28 June–2 July 2000; Volume 1, pp. 646–650. [Google Scholar] [CrossRef]
  31. Chou, S.-H.; Song, Y.-L.; Hsiau, S.-S. A Study of the Mixing Index in Solid Particles. KONA Powder Part. J. 2017, 34, 275–281. [Google Scholar] [CrossRef] [Green Version]
  32. Mechanics Group. ANSYS USER Material Subroutine USERMAT Technology; ANSYS, Inc.: Canonsburg, PA, USA, 1999; pp. 1–22. [Google Scholar]
  33. Essa, K.; Khan, R.; Hassanin, H.; Attallah, M.M.; Reed, R. An iterative approach of hot isostatic pressing tooling design for net-shape IN718 superalloy parts. Int. J. Adv. Manuf. Technol. 2016, 83, 1835–1845. [Google Scholar] [CrossRef] [Green Version]
Figure 1. The developed modeling framework.
Jmmp 07 00030 g001
Figure 2. The 3D geometry and 2D axisymmetric section.
Jmmp 07 00030 g002
Figure 3. (a) The dimensions of the desired geometry and (b) the input optimized parameters.
Jmmp 07 00030 g003
Figure 4. The MOGA workflow [28,31], DP new population that MOGA generates.
Jmmp 07 00030 g004
Figure 5. The simulation setup [33].
Jmmp 07 00030 g005
Figure 6. Meshed 2D axisymmetric section, capsule and compact.
Jmmp 07 00030 g006
Figure 7. HIP temperature and pressure profiles.
Jmmp 07 00030 g007
Figure 8. Contour plot of location-dependent relative density (a) for the part at the end of the HIP cycle and (b) during the HIP cycle.
Jmmp 07 00030 g008
Figure 9. Convergence chart of the optimization processing, showing the stability percentage (2) of the population that reached the desired level of the stability by the 10th iteration.
Jmmp 07 00030 g009
Figure 10. Sensitivity chart of selected parameters showing the sensitivity and inter-dependency levels of the four output parameters (Figure 3b).
Jmmp 07 00030 g010
Figure 11. Trade off chart for the P3 parameter. Red points present the worst cases, while the blue points are the best-chosen results.
Jmmp 07 00030 g011
Figure 12. All feasible possibilities for the non-dominated solutions (red lines), selected candidate points (green).
Jmmp 07 00030 g012
Figure 13. Post-HIP dimensions for each point during optimization (for mentioned parameters from Figure 3a): (a) P1 parameter; (b) P2 parameter; (c) P3 parameter; (d) P4 parameter.
Jmmp 07 00030 g013
Figure 14. Range of parameters and place of candidate points.
Jmmp 07 00030 g014
Figure 15. Experimental capsule post-HIP (dots for 3D scanning).
Jmmp 07 00030 g015
Figure 16. Pre-HIP and post-HIP geometries: (a) experiment; (b) FEM.
Jmmp 07 00030 g016
Figure 17. Post-HIP FEM model geometry overlayed with the post-HIP physical experimental geometry.
Jmmp 07 00030 g017
Table 1. The material properties [3,4].
Material PropertiesStainless Steel 316LMild Carbon Steel
Young modulus (MPa) ( 199510 65.63 T 0.0276   T 2 1.754 * 10 6   T 3 )   RD 9.95 200273 61.7   T 0.039   T 2
Poisson ratio ( 0.237 + 3.9   T + 9.17 * 10 8   T 2 )   RD 1.51 0.24 + 5.22   * 10 5   T + 2.16   * 10 8   T 2
Yield stress (MPa) 440 0.7173   T + 0.0008   T 2 4.058 * 10 7   T 3 RD 5.34 702.8 0.1942   T 0.0003194   T 2
Thermal conductivity (w/mmk) 1.55   * 10 2   + 1.26   * 10 5   T 9.26   * 10 12     T 2 1.55 * 10 2 + 1.26 * 10 5   T 9.26   * 10 12     T 2
Specific heat (J/kgk) 465.49 + 0.21   T + 8.6 * 10 7   T 2   488 + 0.1358   T 2.102 * 10 5   T 2
Coefficient   of   thermal   expansion   ( 10 5 / k ) 1.87 3.09 * 10 5   T + 1.21 * 10 7   T 2 1.89 + 1.687   * 10 5   T + 3.241 * 10 7   T 2
Table 2. Candidate points (all numbers are in mm).
Input and OutputCandidate Point 1DeviationCandidate Point 2 DeviationCandidate Point 3DeviationCandidate Point 4DeviationCandidate Point 5DeviationTarget
P1304.76 305.44 305.43 305.44 305.45
P229.57 29.57 29.56 29.57 29.56
P380.42 80.40 80.41 80.42 80.42
P4129.82 129.78 128.60 129.80 129.66
P1′294.20.2294.950.49294.910.48294.940.5294.940.5293.49
P2′39.000.9538.960.8538.990.9338.960.8538.970.8838.63
P3′78.59078.58078.59078.59078.59078.59
P4′132.660.3132.650.25131.58−0.55132.650.25132.520.2132.32
Table 3. Final dimensions.
Feature NoPre-HIP (mm)FEM (mm)Experiment (mm)Deviation%
P1304.97291.9293.490.54
P228.40537.5238.632.87
P379.9376.8678.892.57
P4131.07129.66132.522.15
Disclaimer/Publisher’s Note: The statements, opinions and data contained in all publications are solely those of the individual author(s) and contributor(s) and not of MDPI and/or the editor(s). MDPI and/or the editor(s) disclaim responsibility for any injury to people or property resulting from any ideas, methods, instructions or products referred to in the content.

