Article

Underlying Methodology for a Thermal Process Monitoring System for Wire and Arc Additive Manufacturing

Institute for Machine Tools and Industrial Management, Department of Mechanical Engineering, TUM School of Engineering and Design, Technical University of Munich, Boltzmannstrasse 15, 85748 Garching, Germany
*
Author to whom correspondence should be addressed.
J. Manuf. Mater. Process. 2023, 7(1), 10; https://doi.org/10.3390/jmmp7010010
Submission received: 1 November 2022 / Revised: 6 December 2022 / Accepted: 23 December 2022 / Published: 28 December 2022

Abstract

:
The Wire and Arc Additive Manufacturing (WAAM) process has a high potential for industrial applications in aviation. The interlayer temperatures influence the dimensions and geometric deviations of the part. Monitoring the absolute interlayer temperature values is necessary for quantifying these influences. This paper presents an approach for determining the absolute values of the interlayer temperatures during the process using Ti-6Al-4V. The emissivity and transmittance are determined and calibrated, enabling precise thermographic measuring during the WAAM process. The recorded thermographic data are then compared to signals of thermocouples so that the absolute temperature values can be aligned. The methodology is validated by its transfer to measure the interlayer temperature at different regions of interest. The effect of a heat accumulation using Ti-6Al-4V in WAAM was determined. The methodology enables a reproducible and non-tactile measurement of the interlayer temperature during the WAAM process. The results show that with an interlayer temperature of 200 °C, a heat accumulation occurs within a layer. The heat accumulates in the center of the layer because the free ends of the layer cool down faster than the center of the layer.

1. Introduction

Additive Manufacturing has gained much importance in lightweight construction in recent years [1]. In the aviation industry, large-volume structural parts such as carrier components are still manufactured from raw materials in blocks using conventional machining processes. In particular, titanium alloys that are difficult to machine cause high tool wear, leading to high tooling costs [2]. Although a small amount of the raw material can be recycled, the stringent aviation requirements on recycling result in increased costs [3]. The Buy-to-Fly-ratio (BTF-ratio) is a typical key figure that reflects the relationship of the raw part mass to the finished part mass. In conventional machining manufacturing, BTF-ratios of 20:1 are quoted [4]. Wire and Arc Additive Manufacturing (WAAM) enables the production of near-net-shape parts, resulting in a low BTF-ratio [5]. Compared to other metal-based Additive Manufacturing processes, WAAM is characterized by a high build rate, an in principle unlimited build space, and access to various materials [5]. Welding techniques used in WAAM [6] are gas metal arc welding, gas tungsten arc welding, and plasma arc welding [7,8].
In the WAAM process, weld beads are deposited on top of each other to form three-dimensional multi-layer parts. The temperature balance between individual layers influences the geometric deviation of the parts [9]. The heat input of the arc is conducted over the entire part. The low thermal conductivity of Ti-6Al-4V [10] favors heat accumulation, resulting in increased temperatures in higher layers than in lower layers or the substrate [11]. Due to the varying temperatures in every layer, monitoring the interlayer temperature is a promising approach to ensure the reproducible manufacturing of parts. The interlayer temperature is defined as the temperature on the surface of a part immediately before the welding of the next layer starts (DIN EN ISO 13916).

1.1. State of the Art

Wu et al. [12] found that the different temperatures along the layers lead to geometric deviations. They observed that the heat accumulation significantly impacts the process stability with Ti-6Al-4V. This deviation resulted in a discontinuity in the distance between the molten pool and the contact tip. As a result, an influence on the arc properties was identified. An active cooling system presented by Da Silva et al. [10] helps to mitigate the heat accumulation within the part. Controlling the temperatures of the part during WAAM led to a more uniform geometry of the part [10].
Various studies have shown that thermographic measurements are suitable for determining temperature fields [12,13,14]. The multitude of variables affecting the thermographic signal challenge the acquisition of absolute temperatures without a defined methodology. The thermographic measurement signal is affected by two parameter categories in the WAAM process. The first category includes the choice of a suitable emissivity ε. The second category consists of the choice of a transmittance τ and the influencing welding conditions. The latter are the gas atmosphere in the build chamber and the partially occurring fumes from the welding process. The welding fumes and gases have an additional effect on the measurement robustness of the thermographic camera during the WAAM process [15].
For determining the emissivity coefficient, a camera calibration in the WAAM process was performed by Yang et al. [16] for steel. An infrared camera and thermocouples were used to record the temperature during the process. A study specifically related to the spectral emissivity of Ti-6Al-4V was published by González-Fernández et al. [17]. The polished titanium plates were thermally investigated using a pyrometer. The emissivity was measured for different wavelengths. Thereby, the emissivity for wavelengths of 5 μm was in the range of 0.15 to 0.3. Coppa and Consorti [18] studied the emissivity of steel and titanium plates. They recognized sources of errors in their measurements, such as the calibration of the measuring instruments, the limited resolution of the pyrometer, the temperature dependence of the emissivity, and the influences of the welding conditions. Yang et al. [19] determined the emissivity of Ti-6Al-4V parts using an infrared camera and thermocouples positioned at the back of the substrate plate heated by laser radiation. They found emissivity coefficients for the temperature range 150–1000 °C, and the emissivity below 760 °C ranged from 0.25 to 0.29. For higher temperatures, the emissivity increased significantly, which the authors explained by the occurring oxidation. Li et al. [20] determined the spectral emissivity of the Ti-6Al-4V alloy during oxidation. An oscillation in the emissivity of the part due to the growth of the oxidation film on the surface was observed. Bradshaw [21] and Hagqvist et al. [22] investigated the emissivity of the same alloy. For a wall without oxidation, emissivity coefficients between 0.25 and 0.6 were measured depending on the temperature and the wavelength. Richter et al. [23] showed that measuring the heat distribution with quotient pyrometers in the molten weld pool is possible during the WAAM process. The feasibility of masking out the arc and thus measuring while the arc is active was demonstrated. It was mentioned that reflections influence the measurement and should be covered or avoided directly.
An overview of the values for the emissivity coefficients of Ti-6Al-4V given in the literature is shown in Figure 1. As McIntosh and Huff [24] stated, the varying emissivity in different studies shows that table values cannot be used directly for a specific application. For the transmittance and the influencing welding conditions, Pixner et al. [25] showed that measurements outside a build chamber are subject to uncertainties in WAAM.
Rodriguez et al. [26] used a blackbody to determine the transmittance of the ZnSe protective window used. They measured the temperature with and without the external protective window and calculated the transmittance by comparing both temperature values. They found a transmittance of 93% for their protective window. Raplee et al. [27] identified the metallization of the protective window as a source of error for the transmittance during manufacturing. They stated that the jamming of the film due to metallization changes the transmittance of the protective layer. As a consequence, it reduces the intensity of infrared radiation reaching the sensor of the camera, resulting in lower temperature values.
The literature review identified the experimental investigations for determining the emissivity and transmittance for the thermographic measuring application in WAAM. In summary, there is no uniform methodology for determining absolute temperature values during the WAAM process using Cold Metal Transfer (CMT), which is a gas metal arc welding process.

1.2. Approach and Structure of the Work
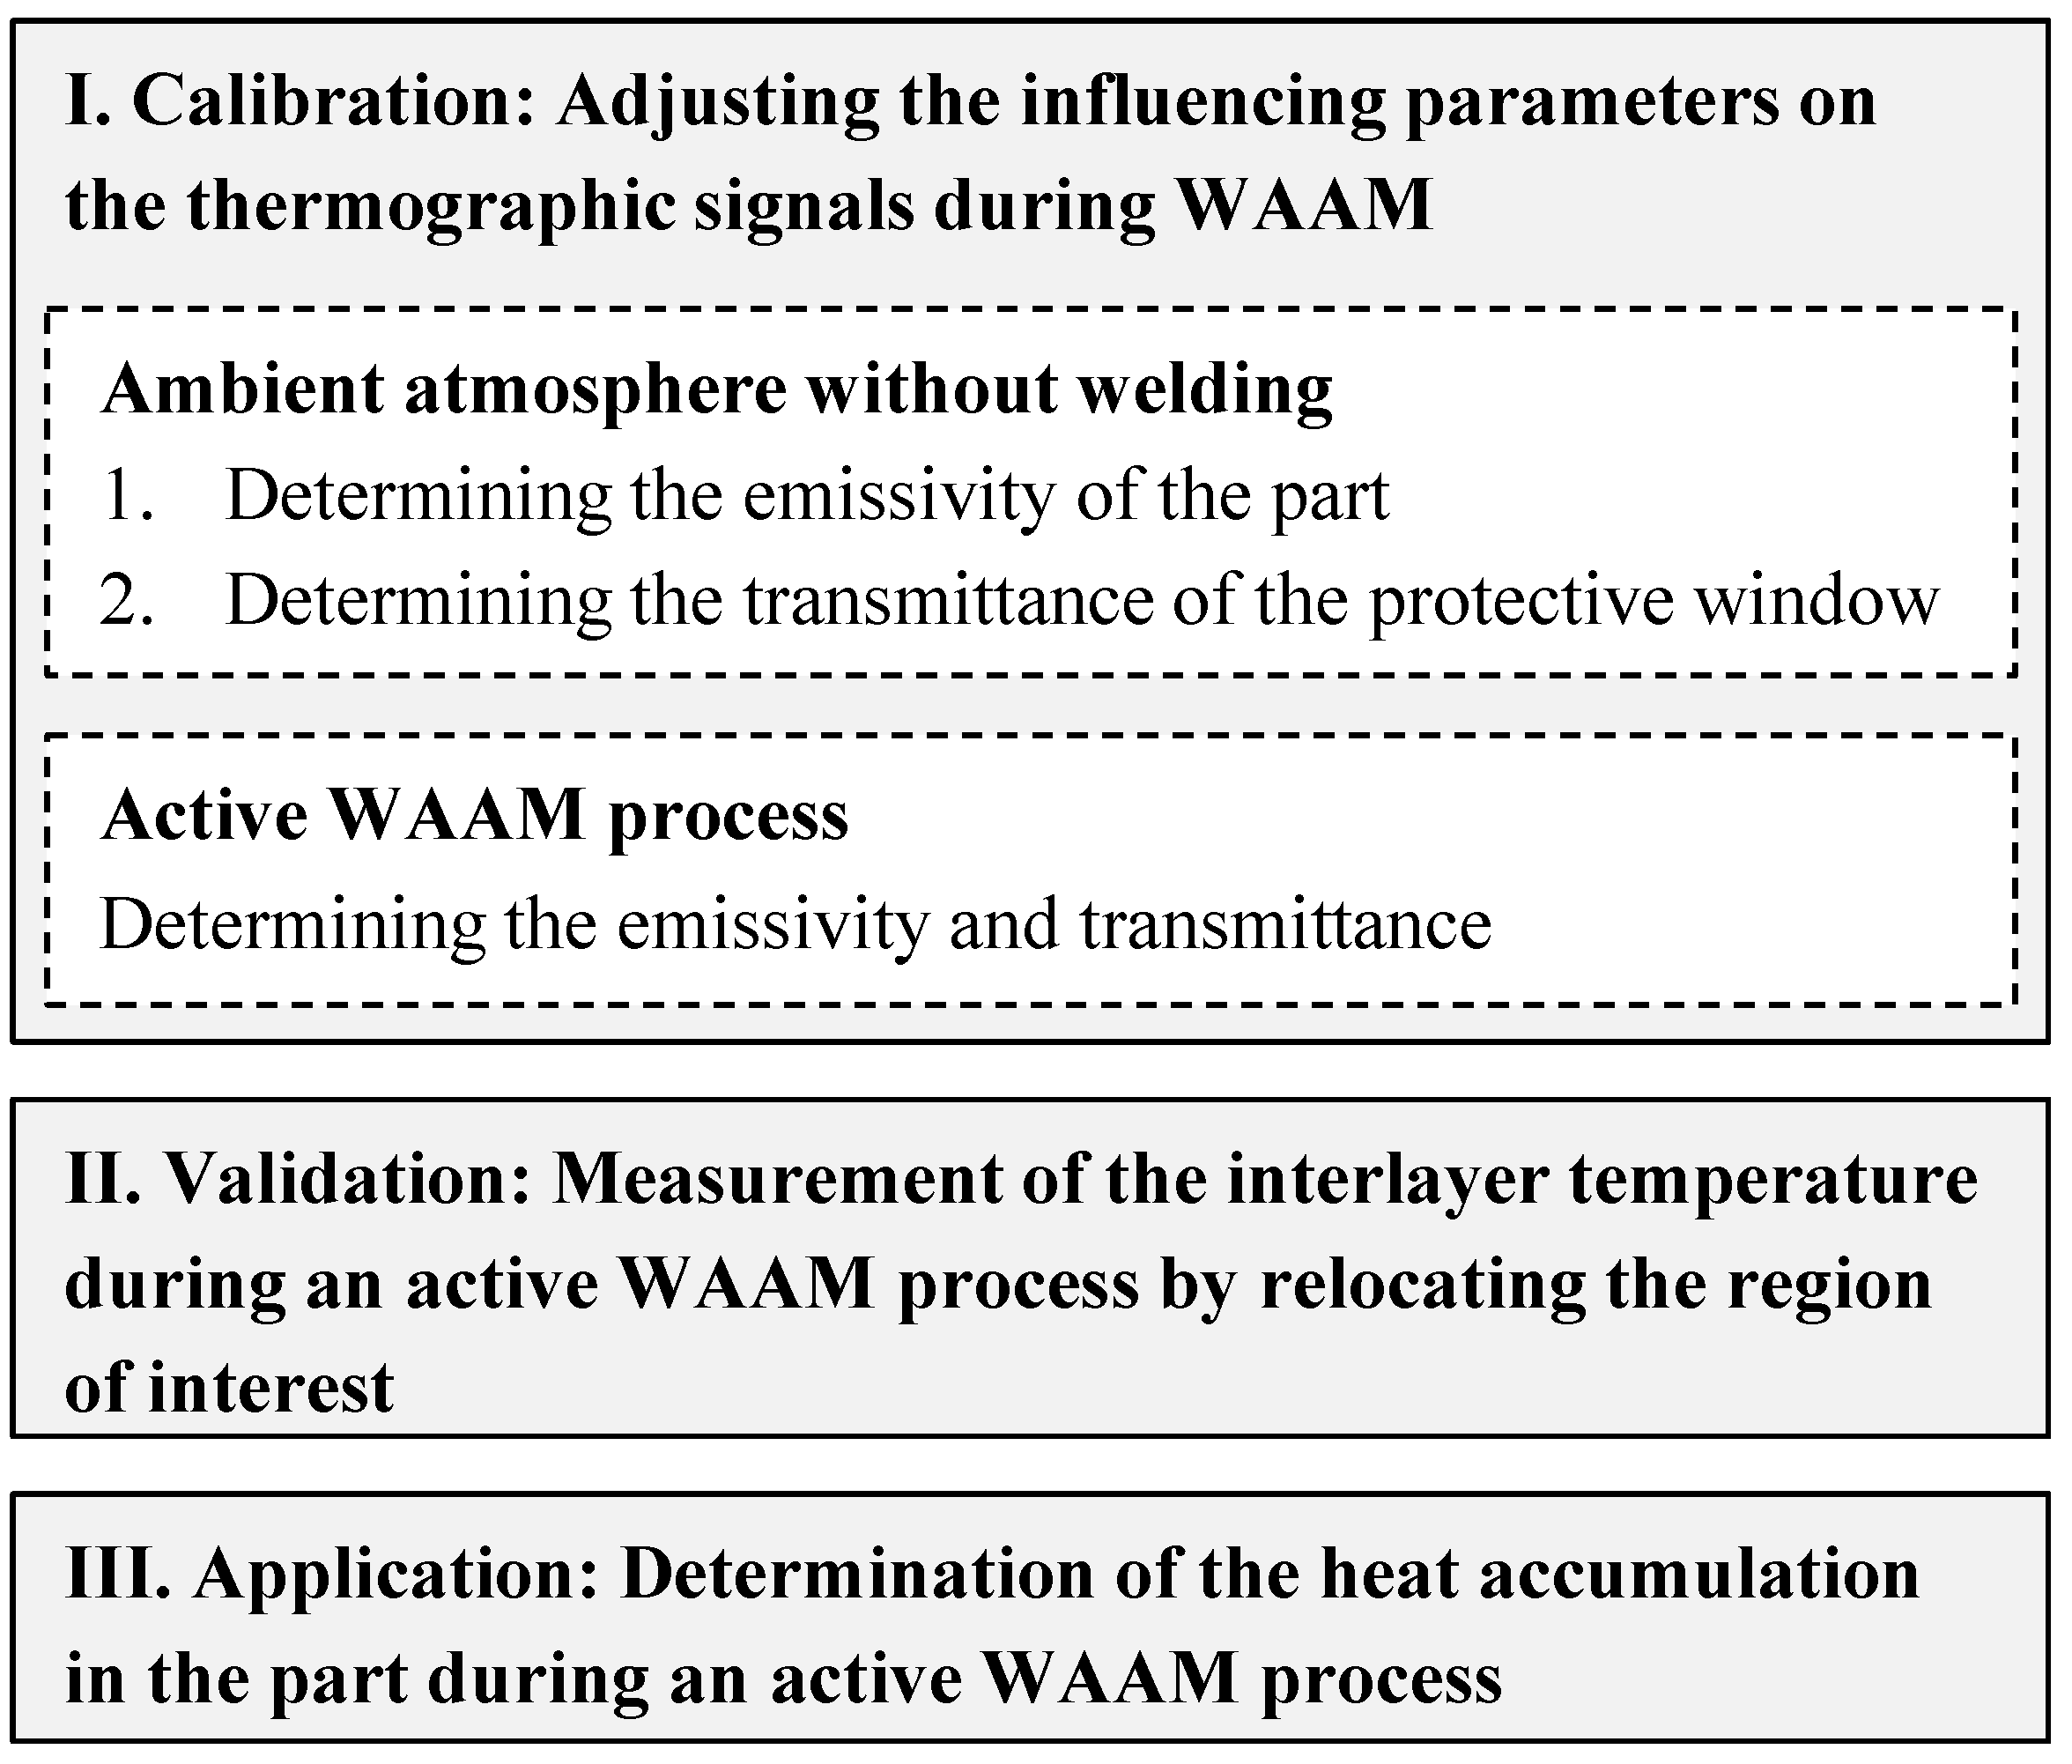
This paper presents a methodology that allows a reproducible measurement of absolute temperature values during the WAAM process. The methodology was used to measure the interlayer temperature, and it enables a heat accumulation analysis. Figure 2 shows the three experimental steps conducted in this work. First, the thermographic measuring system was calibrated. Second, the measuring methodology was validated by measuring the interlayer temperature. Third, the heat accumulation within a layer of the part was determined.

2. Methodology

2.1. Calibration: Adjusting the Influencing Parameters on the Thermographic Signals during WAAM

In the first step (see Figure 2), the emissivity ε of the part material and the transmittance τ of the protective window were determined. Temperature values of the thermographic camera were compared with temperature values of thermocouples in the build chamber in an ambient atmosphere without welding. This atmosphere excluded the welding-related influencing fumes and gas. The experimental setup for the measurement is illustrated in Figure 3. To protect the camera optics and to ensure a sealed process chamber, a partially transparent protective window was mounted between the camera and the part. A sealed process chamber is necessary when an inert gas atmosphere is required. The protective window was attached to the welding enclosure, and the camera was placed at the window. The values of the emissivity ε of the part material and the transmittance τ of the protective window were then determined during an active WAAM process. In this context, the active WAAM process was considered as terminated (extinguished arc) in an inert gas atmosphere before the measurements were performed (see Figure 3).
The infrared thermography camera measures the radiation emitted by a part. The exitance M is the quotient of the radiant power Φ and the emitted surface A and is described by the Stefan-Boltzmann law [15] as
M = d Φ d A = σ · T 4
where σ is the Stefan–Boltzmann constant at 5.67·10−8 W/(m2·K4), and T part is the temperature of the part.
Considering the transmittance τ atm of the atmosphere and the emissivity ε part of the part material, the amount of radiant power Φ det detected by the sensor of the camera is [15]
Φ det = τ atm · ε part · Φ ( T part ) + τ atm · ( 1 ε part ) · Φ ( T amb ) + ( 1 τ atm ) · Φ ( T atm )
where T amb is the ambient temperature in the welding enclosure and T atm is the temperature of the atmosphere. Equation (2) has three addends. The first addend ( τ atm · ε part · Φ ( T part ) ) of the equation is related to the radiant power Φ of the part itself, the second addend ( τ atm · ( 1 ε part ) · Φ ( T amb ) ) describes the radiant power of the ambient reflected on the part, and the third addend ( ( 1 τ atm ) · Φ ( T atm ) ) is the radiant power of the atmosphere itself. Equation (2) shows that the first addend includes the temperature T part of the part. For the second addend, the ambient temperature was measured and entered into the software of the camera. The transmittance of the atmosphere was approximated: τ atm = 1 . Therefore, the third addend equaled zero. The unknown variable in Equation (2) was the emissivity of the part. The first step in the calibration was to adjust the emissivity to the temperature of the part.
The emissivity of a part depends on variables such as the temperature of the part, the angle of the camera in relation to the surface to be investigated, and the coloration of the part (such as that caused by oxidation) [15,20,21]. The transmittance of the atmosphere is dependent on variables such as the atmospheric temperature in the build chamber, the distance of the camera to the part, and the relative humidity in the build chamber [15].
Due to the temperature dependency of the emissivity and transmittance, it was necessary to define a specific temperature value to determine and calibrate the emissivity and transmittance in the WAAM process. In this work, all calibration measurements were carried out at 200 °C. This temperature was chosen because Ti-6Al-4V has a high affinity to react with oxygen at higher temperatures in ambient atmospheres [20]. The thermal conductivity for Ti-6Al-4V is 6.6 W/(m·K) at 20 °C [28], which is significantly lower than that of other metals (e.g., aluminum with 195.0 W/(m·K) [29]). Furthermore, the cooling curves were captured to determine the temperature dependencies of ε and τ.
For the experiments in an ambient atmosphere without welding, the emissivity of the part was initially determined and calibrated. For this purpose, a WAAM-manufactured wall of Ti-6Al-4V (AMS 4954 and ASTM B265 certified) was heated up in a furnace (WT-TM 18-S from WENDEL-TEC GmbH, Grasberg, Germany) and placed in the welding enclosure (from Huntingdon Fusion Techniques HFT, Burry Port, United Kingdom) of the WAAM machine (see Figure 3). Details of the dimensions of the wall are shown in Table A1.
For the temperature measurements, a thermocouple (type N) was placed in the center of a layer, and the cooling curve was recorded with a thermocouple (see Figure 5). A thermographic camera (VarioCAM® hr head from InfraTec GmbH, Dresden, Germany) also captured the temperature T Camera at the same position using a region of interest (ROI). The camera was placed at a defined angle to the surface and distance to the measuring spot to guarantee a reproducible measurement.
In this work, the ROIs consisted of more than one pixel (140 pixels) to average the temperature measurement over the pixels. Compared to a flat surface, notches increase, and elevations of the surface decrease the intensity of the radiation from the part reaching the lens of the camera [27]. With the defined ROIs, the influence of these slight deviations (e.g., waviness) on the temperature measurement result was minimized.
The signals of the thermographic camera were compared to the signal of the thermocouple. Different emissivity values were set to adjust to the signal of the thermocouple. The minimal offset of the absolute temperature values ΔT between T Camera and T Thermocouple was determined for calibrating the thermographic camera. To quantify this offset, the relevant Equation is given by
Δ T = | T Thermocouple T Camera |
The atmospheric temperature in the build chamber, the relative humidity in the build chamber, and the distance of the camera to the part are listed in Table A2. The set emissivity coefficients were selected based on the values from the literature review (see Figure 1): ε = 0.30, 0.35, 0.40, 0.45, and 0.50.
Following the same procedure as for the emissivity determination, the transmittance determination of the protective window involved heating up a WAAM-manufactured wall in the furnace. Subsequently, the wall was placed in the build chamber. The protective window (from Edmund Optics GmbH, Mainz, Germany) has a transmission coefficient τ, which was determined during the experiments. The already-determined emissivity coefficient was used, and the transmittance coefficient was calibrated. Following the same experimental measuring routine, the offset of the absolute temperature values ΔT was determined. The value with the minimal difference between T Camera and T Thermocouple was selected. An iterative approach to determine the minimal ΔT was conducted, and all cooling curves were compared. The transmittances were set to τ = 0.35, 0.40, 0.45, 0.50, 0.55, 0.60, and 1.00.
The objective of the calibration during an active WAAM process was to identify the influence of the welding fumes and gas on the thermographic signal. The identified values of ε and τ were used to quantify this influence of the welding fumes and gas on the emissivity during an active WAAM process. The electric arc was inactive during the measurements of the temperatures, avoiding the influence of the arc on the thermographic signal.
The welding enclosure was filled with argon 4.6 as a shielding gas. The welding torch was connected to a welding power source (CMT Advanced 4000 R from Fronius International GmbH, Wels, Austria). The welding torch was moved by an industrial robot (KR15/2 from Kuka AG, Augsburg, Germany). A wall was manufactured using an alternating build-up strategy to generate a mostly uniform energy input in the part. The wall was welded employing a welding wire with a diameter of 1.2 mm up to the 8th layer (see Figure 4). An overview of the welding parameters is shown in Table A3. After welding the 8th layer, the temperature was measured with the thermographic camera and the thermocouple in the center of the 8th layer.
As in the previous investigations, the absolute temperature values of the thermographic measuring signals were compared with the signals of the thermocouple. If ΔT deviates from the offset, the thermographic signal was influenced by the welding fumes and gas in the build chamber. The emissivity coefficient was adjusted based on the previous findings (whether ε needs to be increased or decreased) to align T Camera with T Thermocouple . This adjustment compensated the influence of the welding fumes and gas. As was the case for the previous investigations, ΔT should be minimal (see Equation (3)). The result of the adjustment led to the conclusion that a change of the emissivity was necessary for the considered part size.

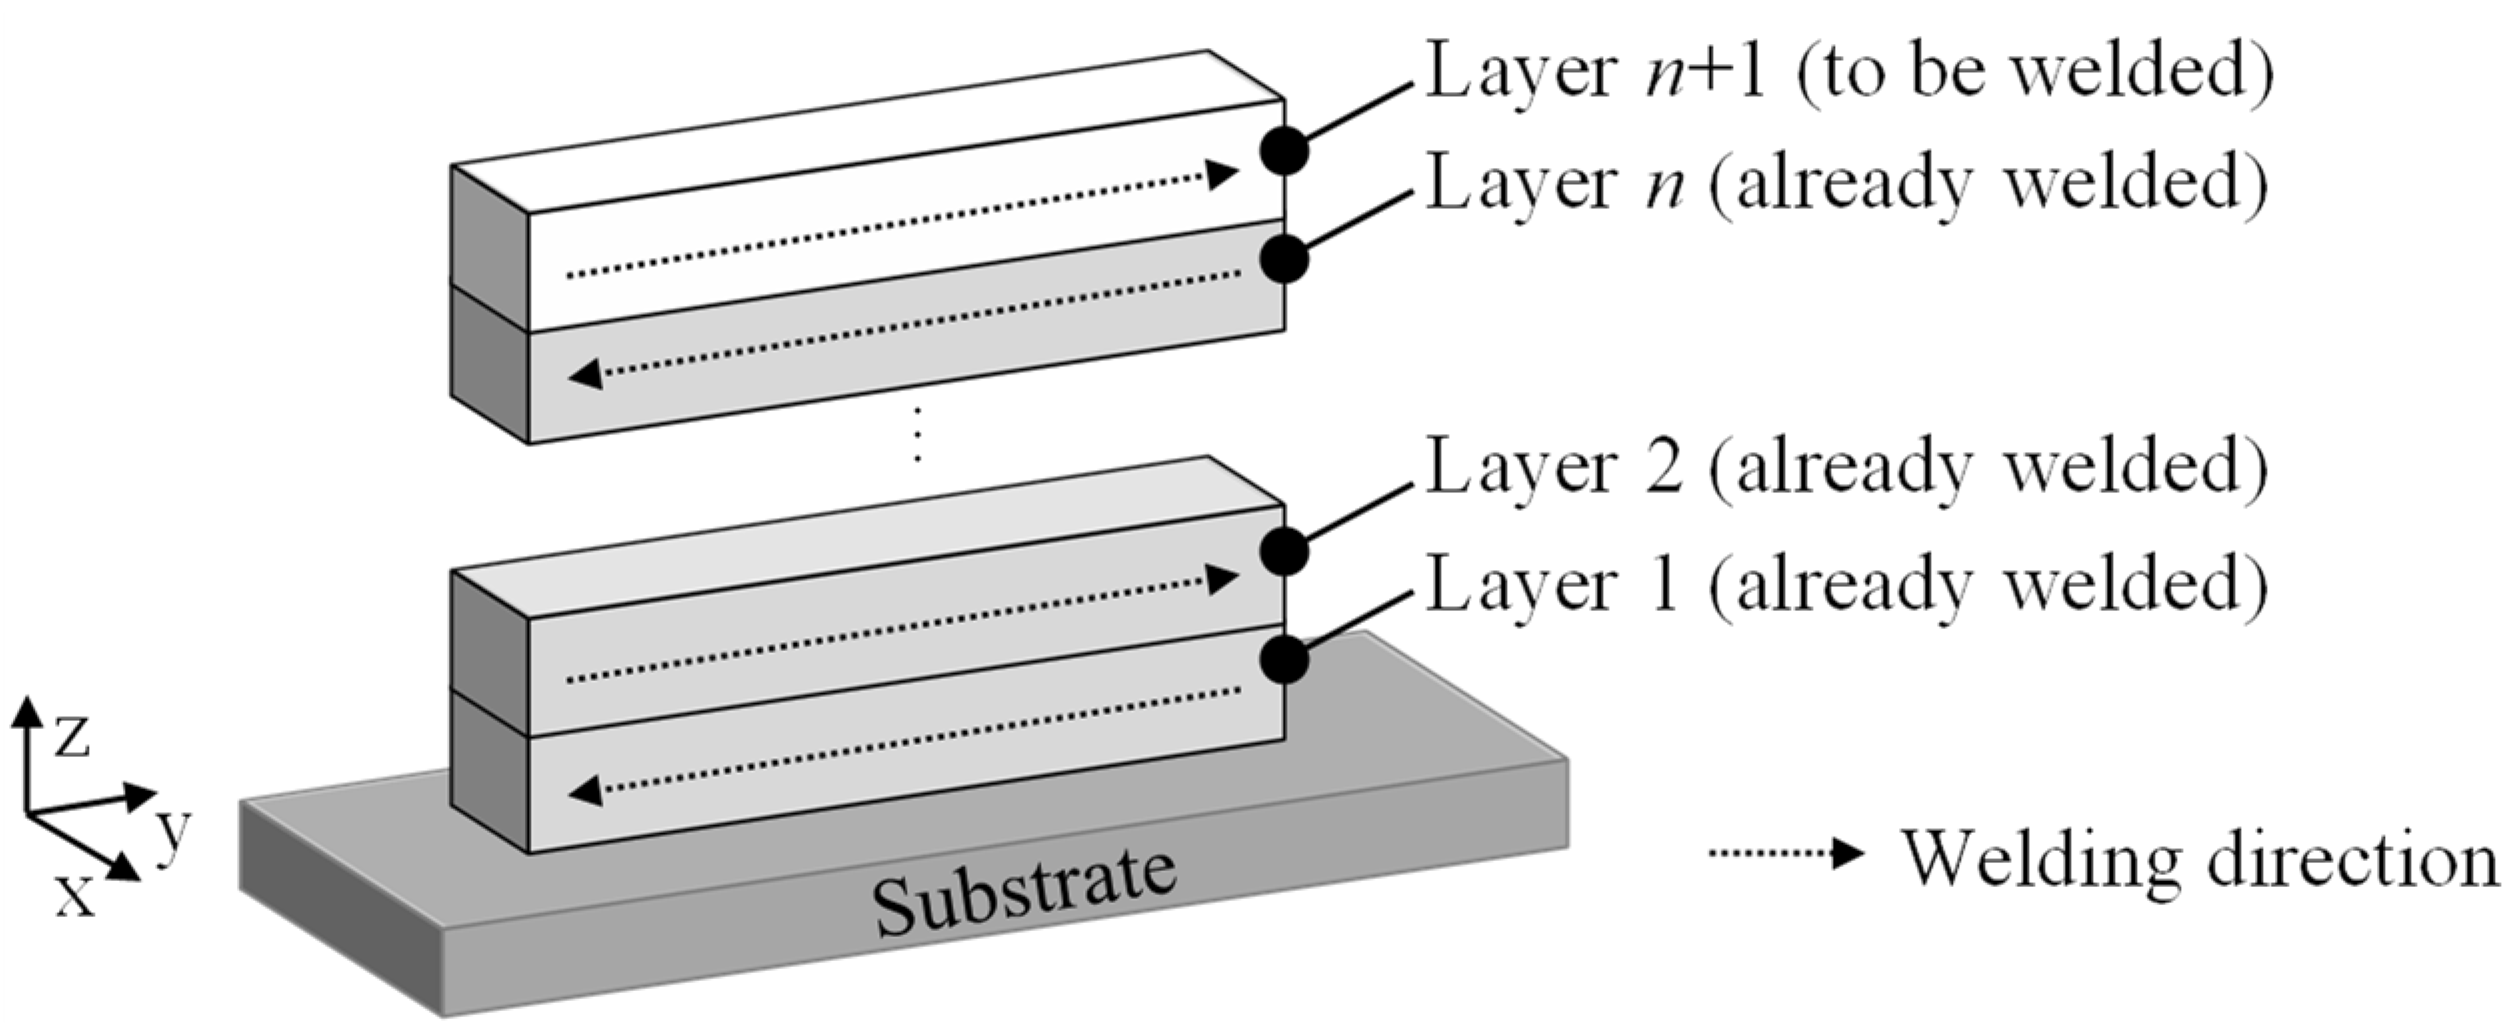
2.2. Validation: Measurement of the Interlayer Temperature during an Active WAAM Process by Relocating the Region of Interest

The measuring methodology was validated by comparing the temperature from above with the temperature of a different region of interest during an active WAAM process.
The measurement was taken at the starting position of layer n + 1 (see Figure 8). For the experimental procedure, a wall was manufactured according to the procedure in an active WAAM process. As described in the previous investigations, ΔT was determined (see Equation (3)). The ΔT from above at ROI in the 8th layer ( ROI 8 ) was compared to ΔT at the relocated ROI Interlayer ,   8 to validate the presented methodology.

2.3. Application: Determination of the Heat Accumulation in the Part during an Active WAAM Process

In the third step (see Figure 2), multiple measuring positions were placed on the part to analyze the occurring heat accumulation via the thermographic measuring system.
As a post-process investigation of the experiment from Section 2.2, three separate ROIs ( ROI a , ROI b , and ROI c ) were distributed over the surface of the part at layer 8 (see Figure 9). The thermographic signals of the three ROIs were analyzed and compared. The time between the ROIs reaching the calibrated temperature value of 200 °C was determined. This allowed a quantification of the time-dependent temperature gradient (correlating with a heat accumulation) along layer 8.

3. Results

3.1. Calibration

The methodology was first calibrated in the ambient atmosphere without welding and then during the active WAAM process.
Figure 5 shows the cooling curve of the part with absolute temperatures using various emissivity coefficients compared to the values captured by the thermocouple.
The temperature value captured by the thermographic camera comes closest to the measured temperature from the thermocouple with a set emissivity of ε = 0.35 for T Thermocouple = 200 °C. The temperature offset ΔT is < 1 K with a set emissivity of ε = 0.35 at T Thermocouple = 200 °C. For ε = 0.50, the temperature offset ΔT increased at T Thermocouple = 200 °C to 37 K. At T Thermocouple = 200 °C, the emissivity ε = 0.30 resulted in the temperature T Camera = 219 °C, and ε = 0.50 at T Camera = 163 °C. The comparison between the emissivity ε = 0.30 and ε = 0.50 delivered a difference between both camera signals of 56 K. At a measured temperature value of T Thermocouple = 100 °C, T Camera = 109 °C was determined for ε = 0.30 and T Camera = 82 °C for ε = 0.50, resulting in a difference between both camera signals of 27 K. The effect of decreasing temperature values resulting in decreasing emissivity values was also observed by González-Fernández et al. [17] at higher temperatures. An increasing temperature value resulting in increasing emissivity values was recognized by Yang et al. [19] and vice versa. This indicates the temperature dependence of ε, also mentioned by Vollmer and Möllmann [15]. The distance between the measured temperatures of individual emissivity curves changed depending on the temperature. At higher temperatures, the distance increased, whereas at lower temperatures, it decreased. The first addend ( τ atm · ε part · Φ ( T part ) ) in Equation (2) can describe this phenomenon. The results indicate that a calibration must be performed for individually defined temperature values. It is essential to determine a value at the beginning, which will be used for the further methodology.
The different cooling curves for determining the transmittance measured by the thermographic camera and the thermocouple are shown in Figure 6. The determined emissivity was set constant at ε = 0.35 for T Camera = 200 °C while calibrating τ to align with T Thermocouple = 200 °C.
The transmittance of τ = 0.50 resulted for T Camera in the minimal temperature offset of ΔT < 1 K from T Thermocouple = 200 °C. At τ = 0.35, the temperature offset to the thermocouple rose to ΔT = 46 K. At τ = 1.00, ΔT was maximum at T Thermocouple = 200 °C at 70 K. Furthermore, the temperature dependence of the transmittance coefficient is indicated between 200 °C and 100 °C. At T Thermocouple = 100 °C, the transmittance of τ = 0.45 showed the minimal temperature offset of ΔT = 2 K compared to τ = 0.50 with ΔT = 7 K. The temperature dependency of τ was also shown by Vollmer and Möllmann [15] and Sernelius [30]. A similar finding as in the determination of the emissivity could be observed in the determination of the transmittance. The offset between the measured temperatures of individual transmittance curves changed depending on the temperature. The findings align with the results from Rodriguez et al. [26], who calibrated their thermographic camera with and without the use of a protective window. They also aligned their thermographic signals with the signals from thermocouples.
For the active WAAM process, the temperature curves of the cooling process captured by the thermocouple and the thermographic camera at different values ε while holding τ = 0.50 constant are shown in Figure 7.
At T Thermocouple = 200 °C, the curve of T Camera with an emissivity of ε = 0.30 aligned with T Thermocouple with a temperature offset ΔT < 1 K. At ε = 0.25 and ε = 0.35, the temperature offset ΔT increased to 22 K and 17 K, respectively. At T Thermocouple = 300 °C, the temperature offset to T Camera at ε = 0.30 reached ΔT = 8 K. At T Thermocouple = 300 °C, the emissivity of ε = 0.28 resulted in the minimal temperature offset of ΔT = 7 K. At T Thermocouple = 125 °C, the emissivity of ε = 0.25 resulted in ΔT < 1 K. The different ΔT of the cooling curves of the camera confirmed the temperature dependency of the emissivity during an active WAAM process. It can be assumed that the performed methodology can be transferred to other materials. Although the emissivity is material-dependent, it is subject to the same physical laws (e.g., temperature dependency) independent of the material. Using contactless thermal measuring devices, it is necessary to implement them with defined angles and distances to the surface; otherwise, the measurements will not be repeatable [23]. The welding fumes and gas had a minor influence on the thermographic signal. This result is consistent with the findings of Coppa and Consorti [18], who identified sources of errors in their measurements (e.g., influence of the welding conditions). The influence could be compensated for the calibrated temperature value of 200 °C by adjusting the emissivity from 0.35 to 0.30. Raplee et al. [27] described a jamming of the protective window during the manufacturing process. A metallization of the protective window was not present during the studies. The authors assume that the jamming could form during the manufacturing of larger parts. The influence of welding fumes and gas increases with the part size. Larger parts lead to a longer welding duration and to more welding fumes. More occurring welding fumes could interfere more significantly with the thermographic signal.

3.2. Validation

The temperature measurement results over time are shown in Figure 8. The previously calibrated emissivity and transmittance of ε = 0.30 and τ = 0.50 were used.
The results at T Thermocouple = 200 °C show that the offset ΔT remained at the same value of <1 K after relocating the ROI. At T Thermocouple = 345 °C and T Thermocouple = 130 °C, for example, the temperature offset increased to ΔT = 6 K and ΔT = 9 K, respectively. In the range from 140 °C to 336 °C, the absolute value of the interlayer temperature could be measured with a ΔT ≤ 5 K (meaning a 2.5% measuring accuracy in the range from 140 °C to 336 °C with the calibrated camera for 200 °C) in this work. The validity was demonstrated for the thermographic signal calibrated for 200 °C. There was no significant influence on the calibrated thermographic signal at T Thermocouple = 200 °C by relocating the ROI. This shows that it is possible to measure the absolute temperature values at different positions on the layer of the part. Consequently, a single calibration of the thermographic signal is sufficient for the presented experimental setup to maintain the temperature offset of < 1 K. The different temperature fields with high gradients occurring during the part manufacturing do not influence the measurement from the previously calibrated signals. Wu et al. [12] measured the interlayer temperature using a pyrometer by comparing the signals with signals from thermocouples. They calibrated the pyrometer in their experimental setup and reached a temperature offset of less than 10 K. Yang et al. [16] calibrated a thermographic camera by using steel material with a high accuracy. They found that a single emissivity coefficient could be used for a temperature range from 0 °C to 1200 °C. The results of this work show that the validity of the emissivity coefficient for a large temperature range cannot be confirmed when using Ti-6Al-4V material. The emissivity of Ti-6Al-4V material seems to be more influenced by the temperature than the emissivity of steel.

3.3. Application

The heat accumulation in the part during an active WAAM process was determined by applying the calibrated and validated thermal measuring system. Figure 9 shows the absolute temperature values captured in the ROIs.
The comparison of the three ROIs showed that a temperature gradient prevailed in the 8th layer of the wall. The ROI a reached the validated 200 °C first compared to ROI b and ROI c . The ROI b , the center of the part, adjusted 40 s later than the ROI a to 200 °C. The ROI c , where the welding ended, showed a delay of 5 s to reach 200 °C after the ROI a .
ROI a reaching 200 °C first can be explained by the welding direction. The welding started at ROI a , meaning that the part began to cool down at this position first. The close temporal proximity of ROI a and ROI c to reach the 200 °C was due to the positioning of both ROIs symmetrically on the free ends of the wall. Both ROIs show a similar cooling rate after reaching 200 °C. The convection is the dominating effect that determines the cool-down at the free ends of the wall. Therefore, both ROIs at the free ends of the wall had similar conditions in cooling down.
A heat accumulation in the center of the part could be determined by comparing ROI a and ROI c to ROI b . This can be explained by the heat transfer from the part to the atmosphere by convection. The low thermal conductivity of Ti-6Al-4V favors this effect since the heat dissipated slowly within the whole part. At the free ends of the part, there is more part surface area towards the atmosphere. Therefore, there is increased convection due to the continuous shielding gas flow in the welding enclosure. The increased thermal radiation at the free ends of the part also favors a higher heat transfer to the atmosphere than in the center of the part. ROI a and ROI c are located near the free ends of the part, which helped detecting a cooling of the part to 200 °C in a shorter amount of time than ROI b . The heat transfer to the atmosphere occurred at approximately the same rate at ROI a and ROIc after the start and end of the welding process. Weger et al. [31] addressed the thermal behavior and cooling rates of WAAM-manufactured steel parts considering different thermal measuring positions. They also recognized the heat accumulation over time. One approach towards mitigating the heat accumulation was investigated by Da Silva et al. [10]. They implemented an active cooling system to influence the heat distribution within the part. The observed heat accumulation had no influence on the process stability along the layer. Wu et al. [12] determined a changing process characteristic which they explain by occured heat accumulations in gas-tungsten-arc welding-based WAAM. It can be assumed that the measured heat accumulation in this layer was not significant enough to lead to variations in the process stability. Larger parts could show higher heat accumulations than the walls investigated in this work. The presented methodology allows the comparison of calibrated temperature fields in a quantitative way. The numerical values of the emissivity and the transmittance determined in this work cannot be directly applied to other experimental setups. It is essential that this methodology is performed on each experimental setup to determine numerical values appropriate for the individual setup and the individual component. Bagavathiappan et al. [13] described the use of thermographic cameras in the field of condition monitoring. The methodology applied to the determination of the heat accumulation can be enlarged to an in-situ monitoring system of the part.

4. Conclusions and Outlook

In this work, a methodology for the reproducible measurement of the interlayer temperature was presented. The first step was calibrating the influencing parameters on the thermographic signals during WAAM. The calibration made it possible to measure the surface temperature of a part in an ambient atmosphere without welding and subsequently in an active WAAM process. The second step validated the calibration procedure by measuring the interlayer temperature by relocating the ROI. The third step included the application of the methodology to determine the occurring heat accumulation within one layer. The application limit of the methodology depends primary on the experimental setup by ensuring a defined position of the thermographic camera. The main findings of this work can be summarized as follows:
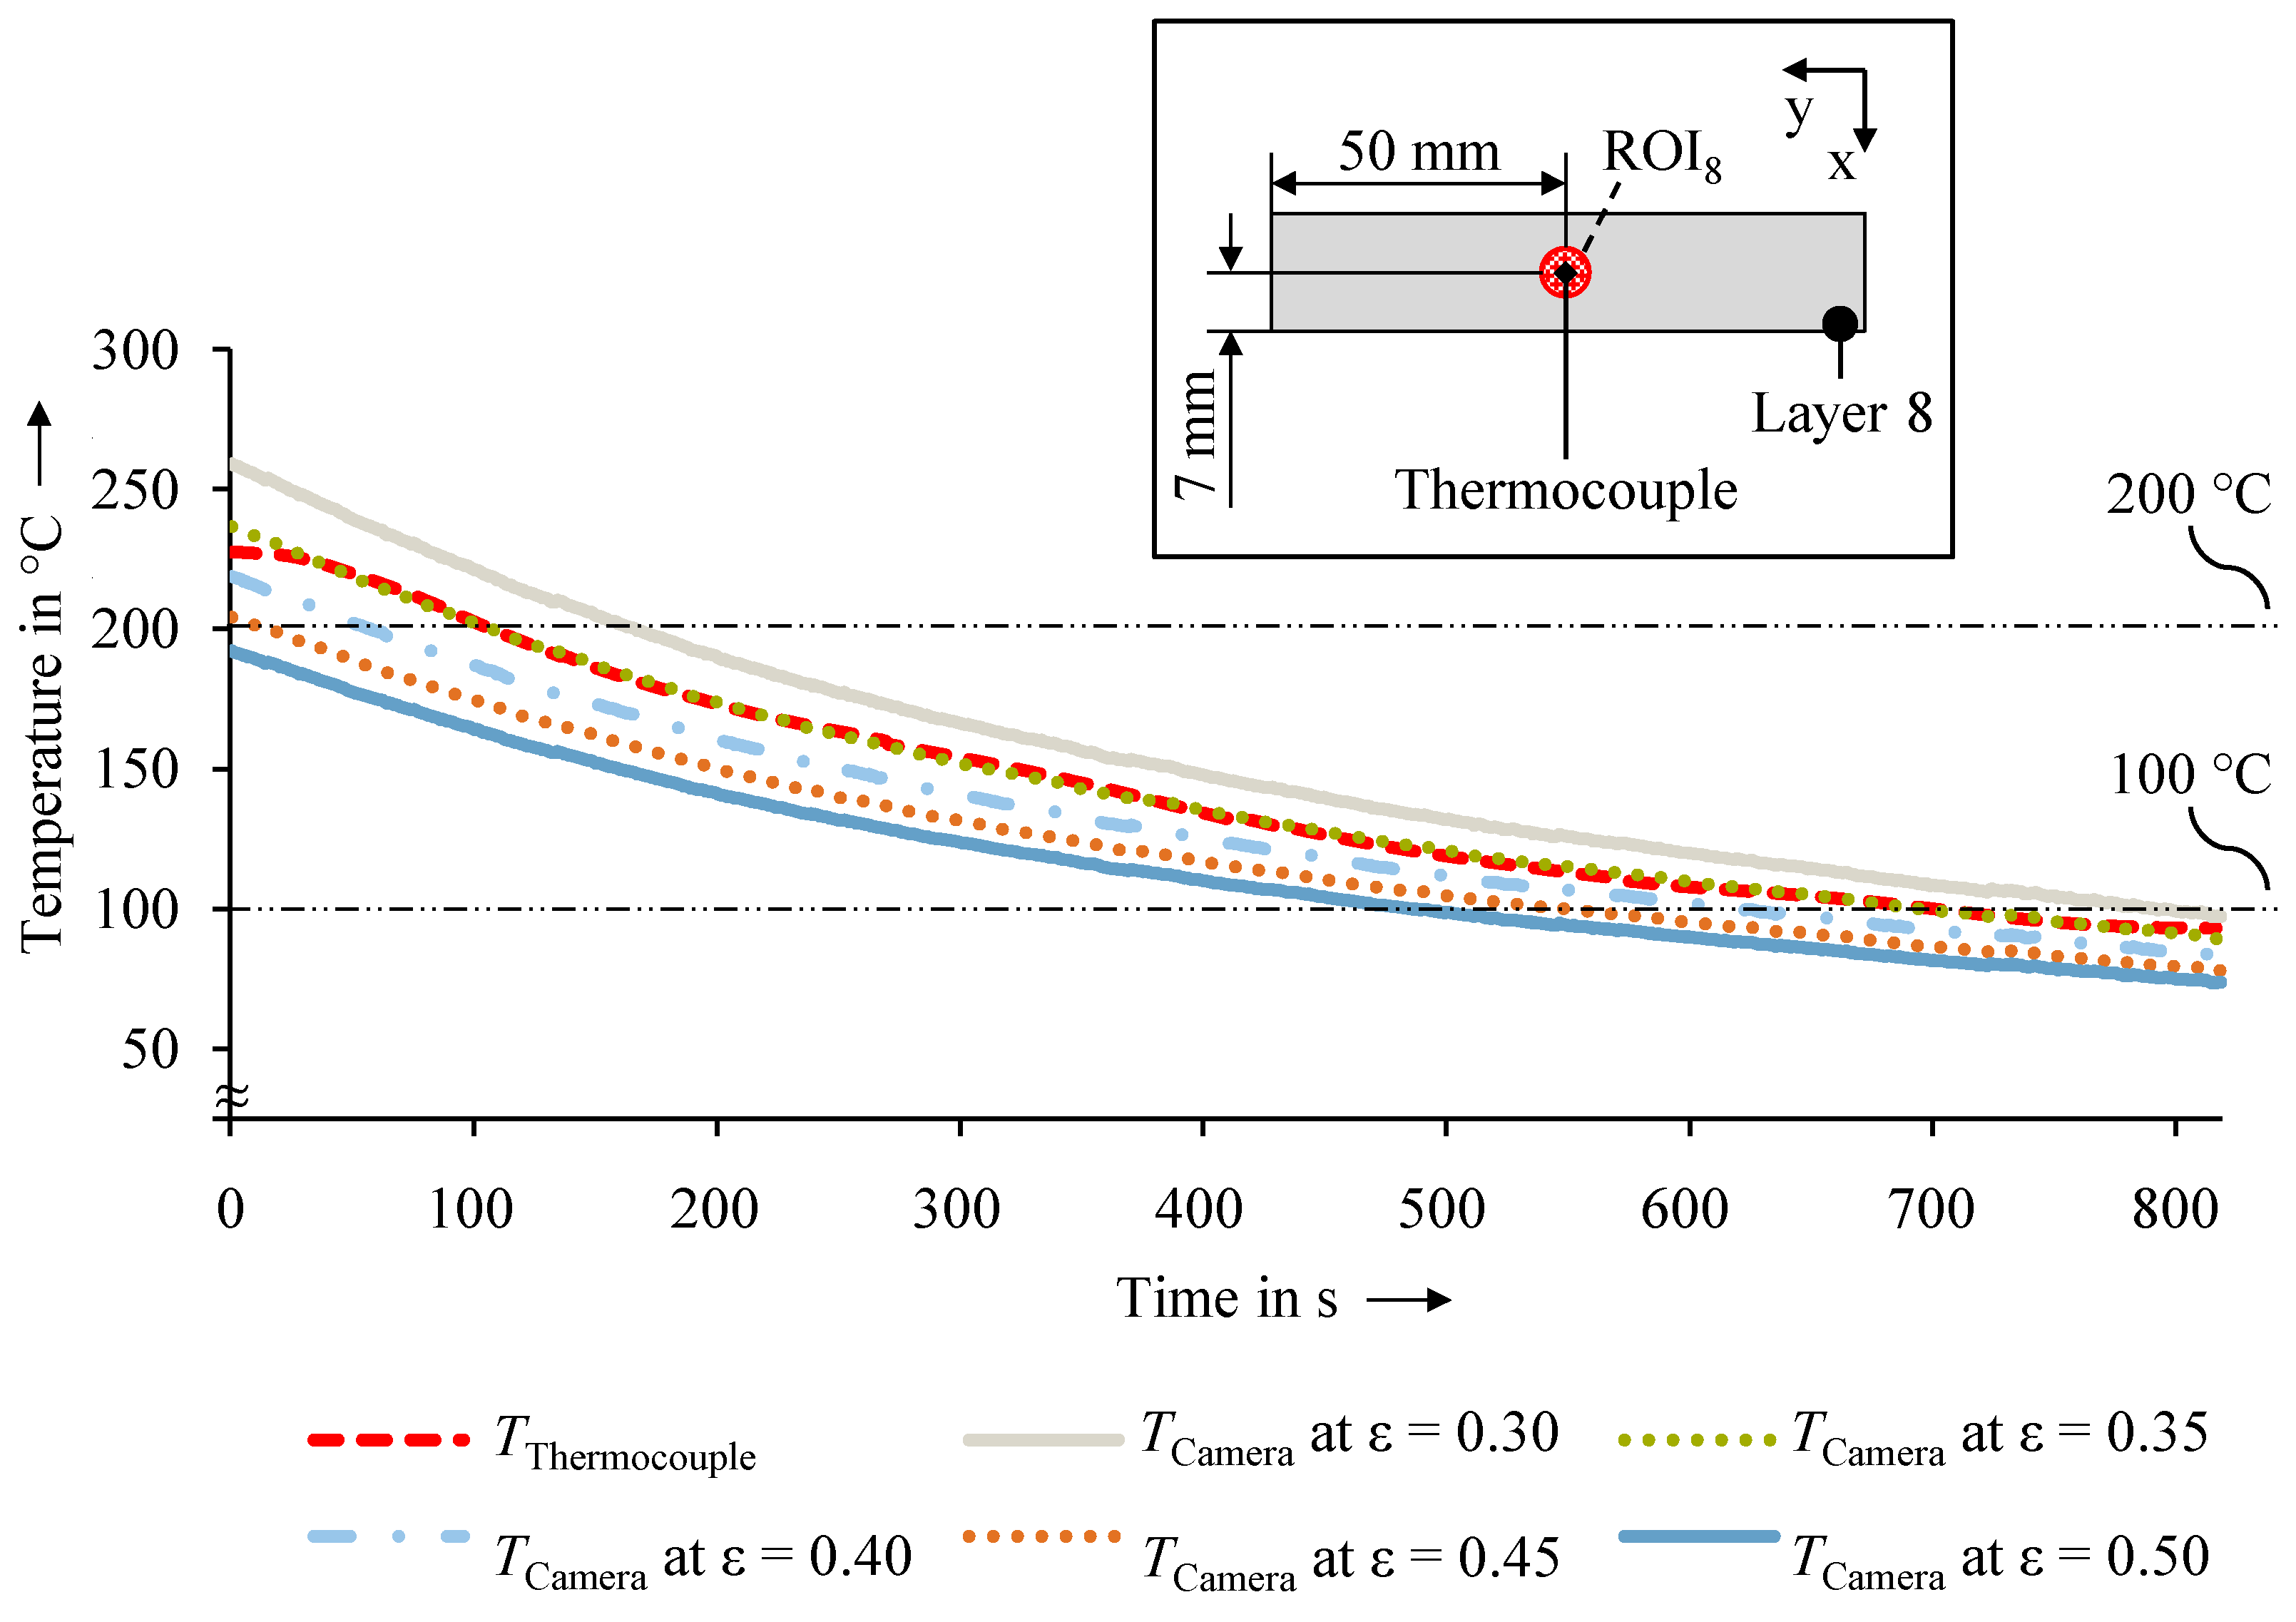
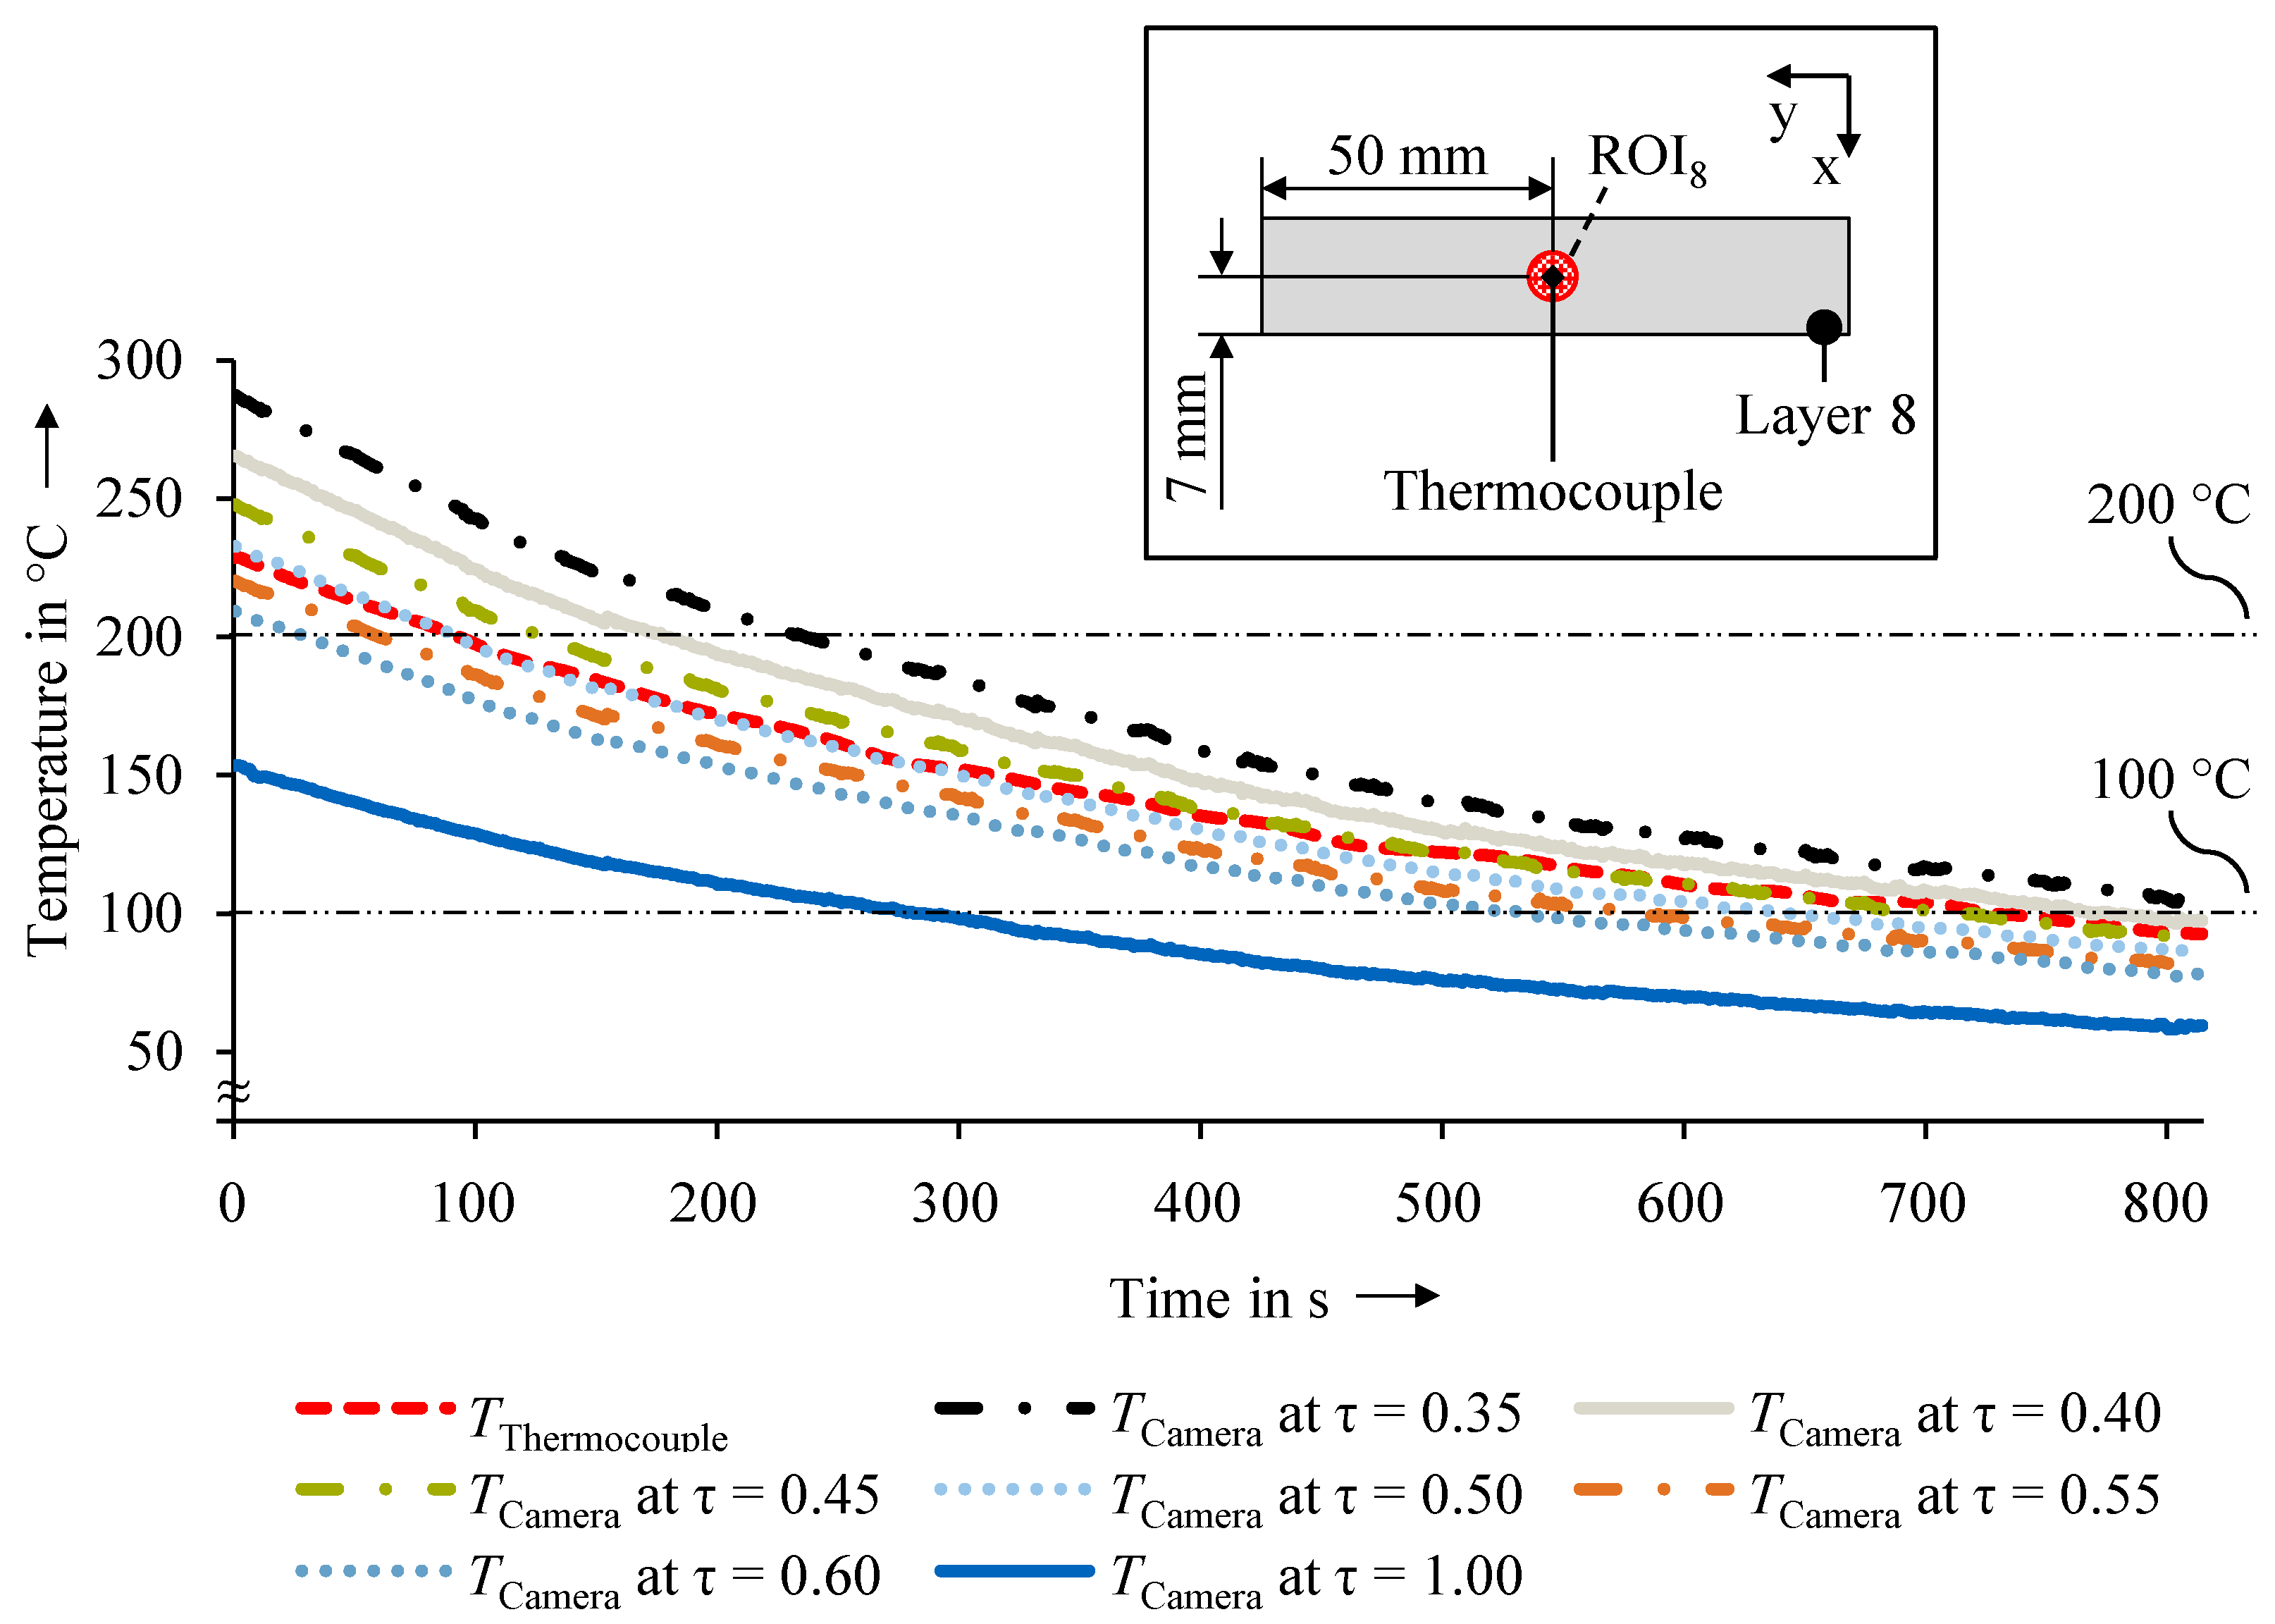
  • The emissivity needs to be calibrated to measure a surface temperature in an ambient atmosphere without welding. An ε = 0.35 was suitable for the presented experimental conditions and setup to align the thermal signals T Thermocouple and T Camera with a temperature offset ΔT that is < 1 K at 200 °C.
  • The transmittance needs to be calibrated when using a protective window during WAAM. In the presented experimental setup, the transmittance of τ = 0.50 was suitable for a temperature offset ΔT < 1 K between T Thermocouple and T Camera .
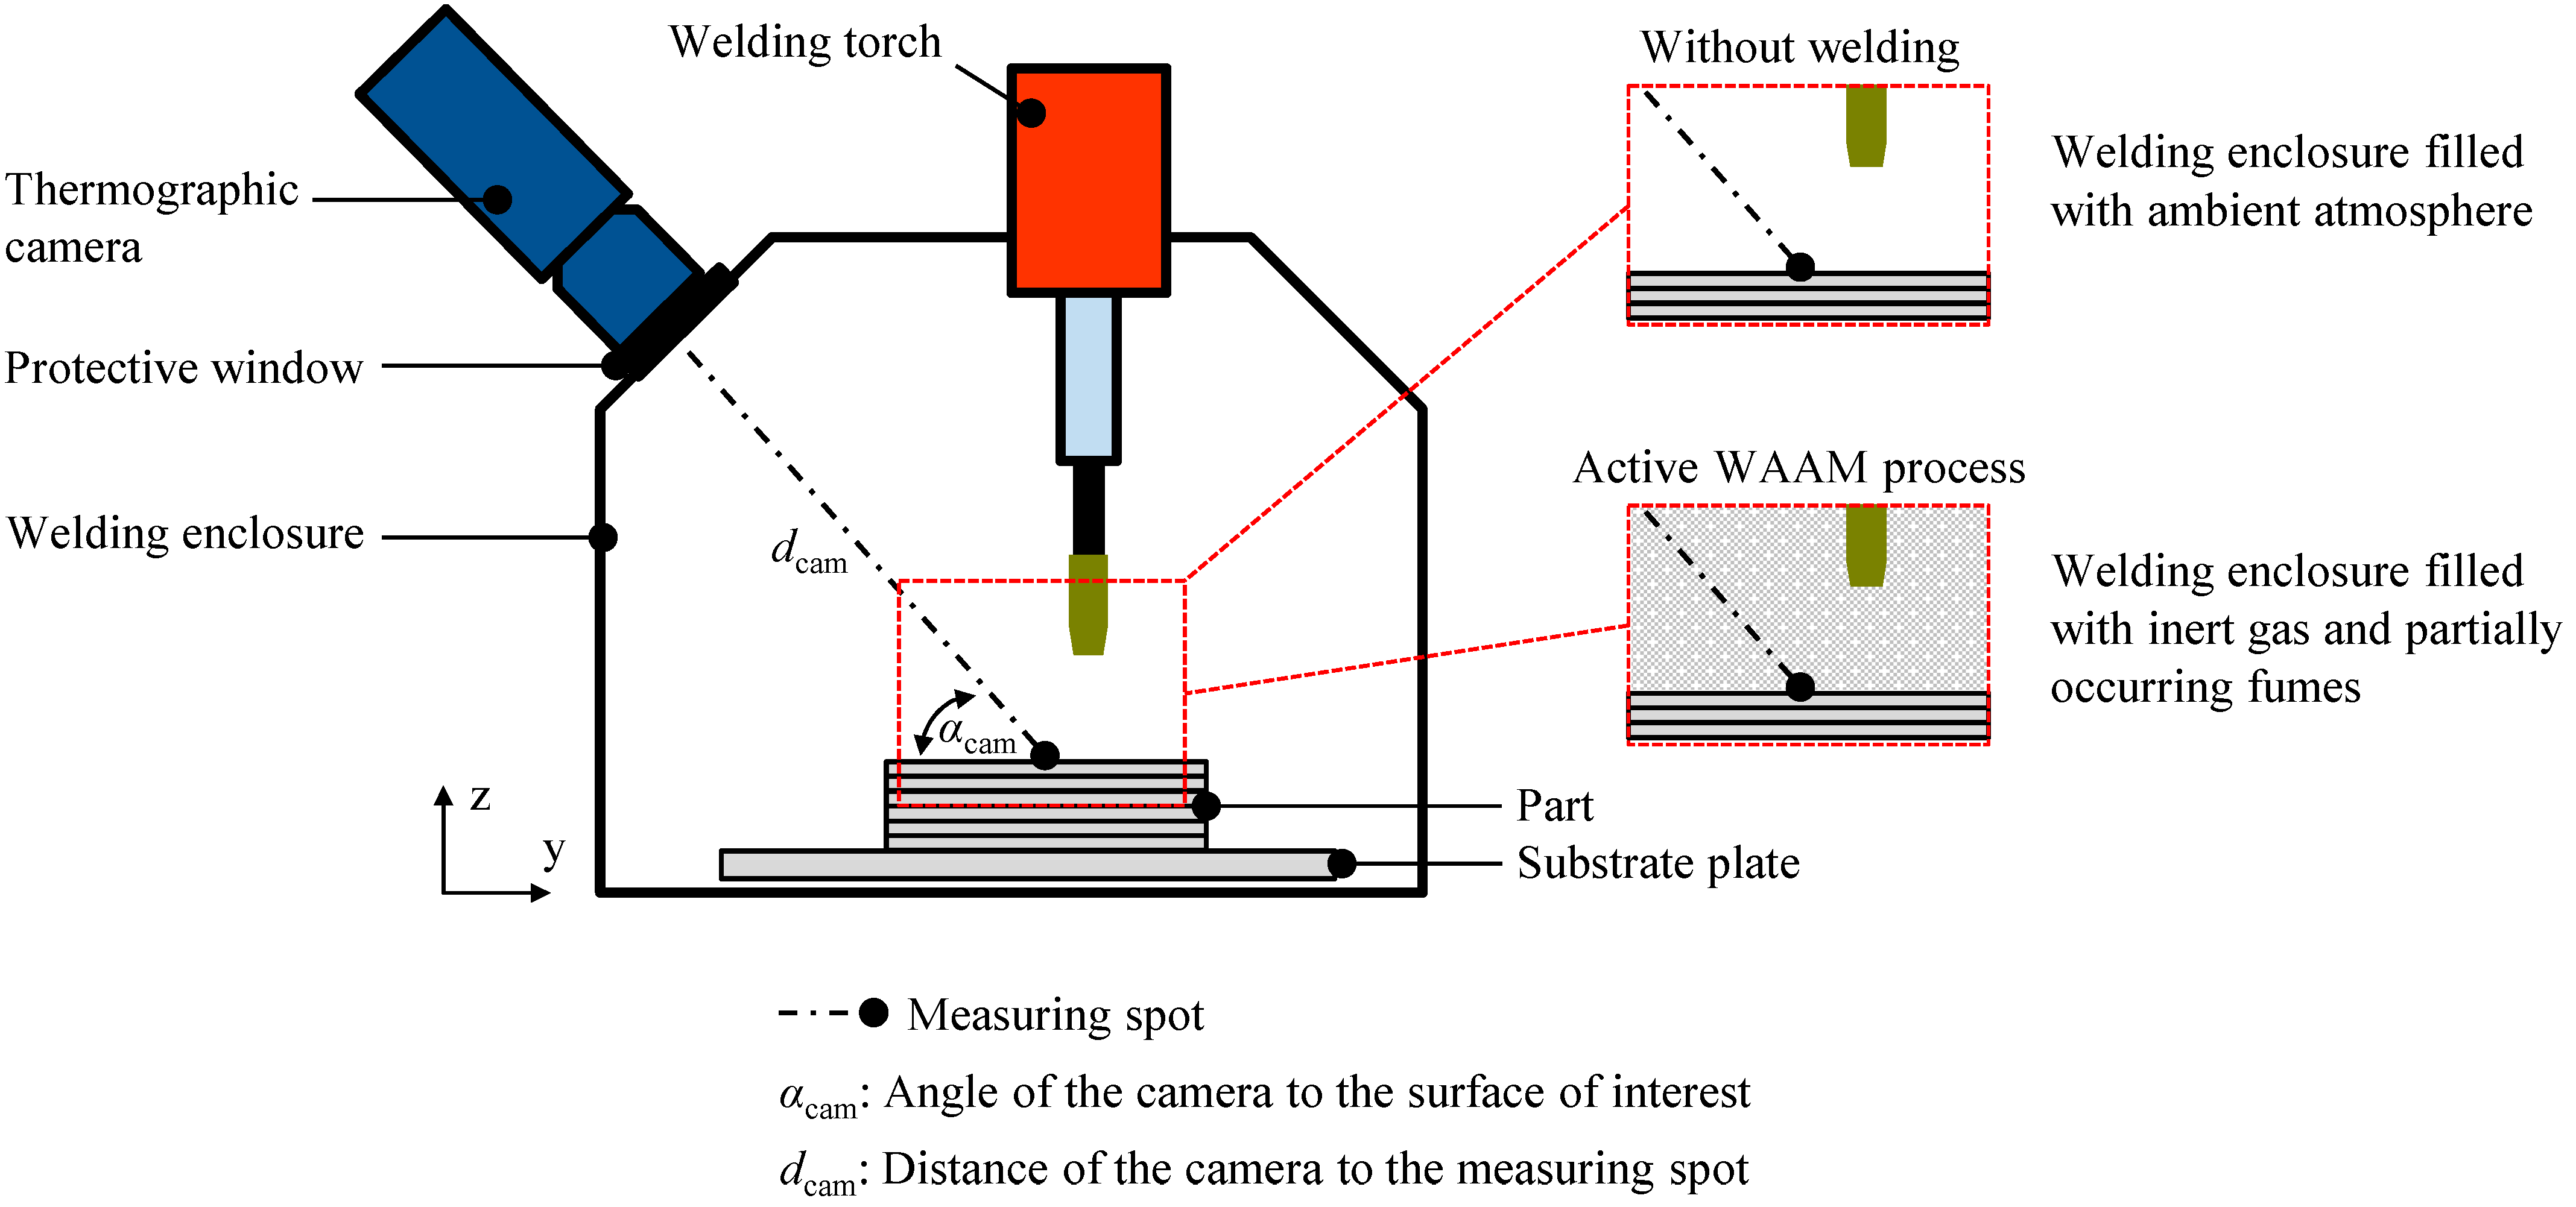
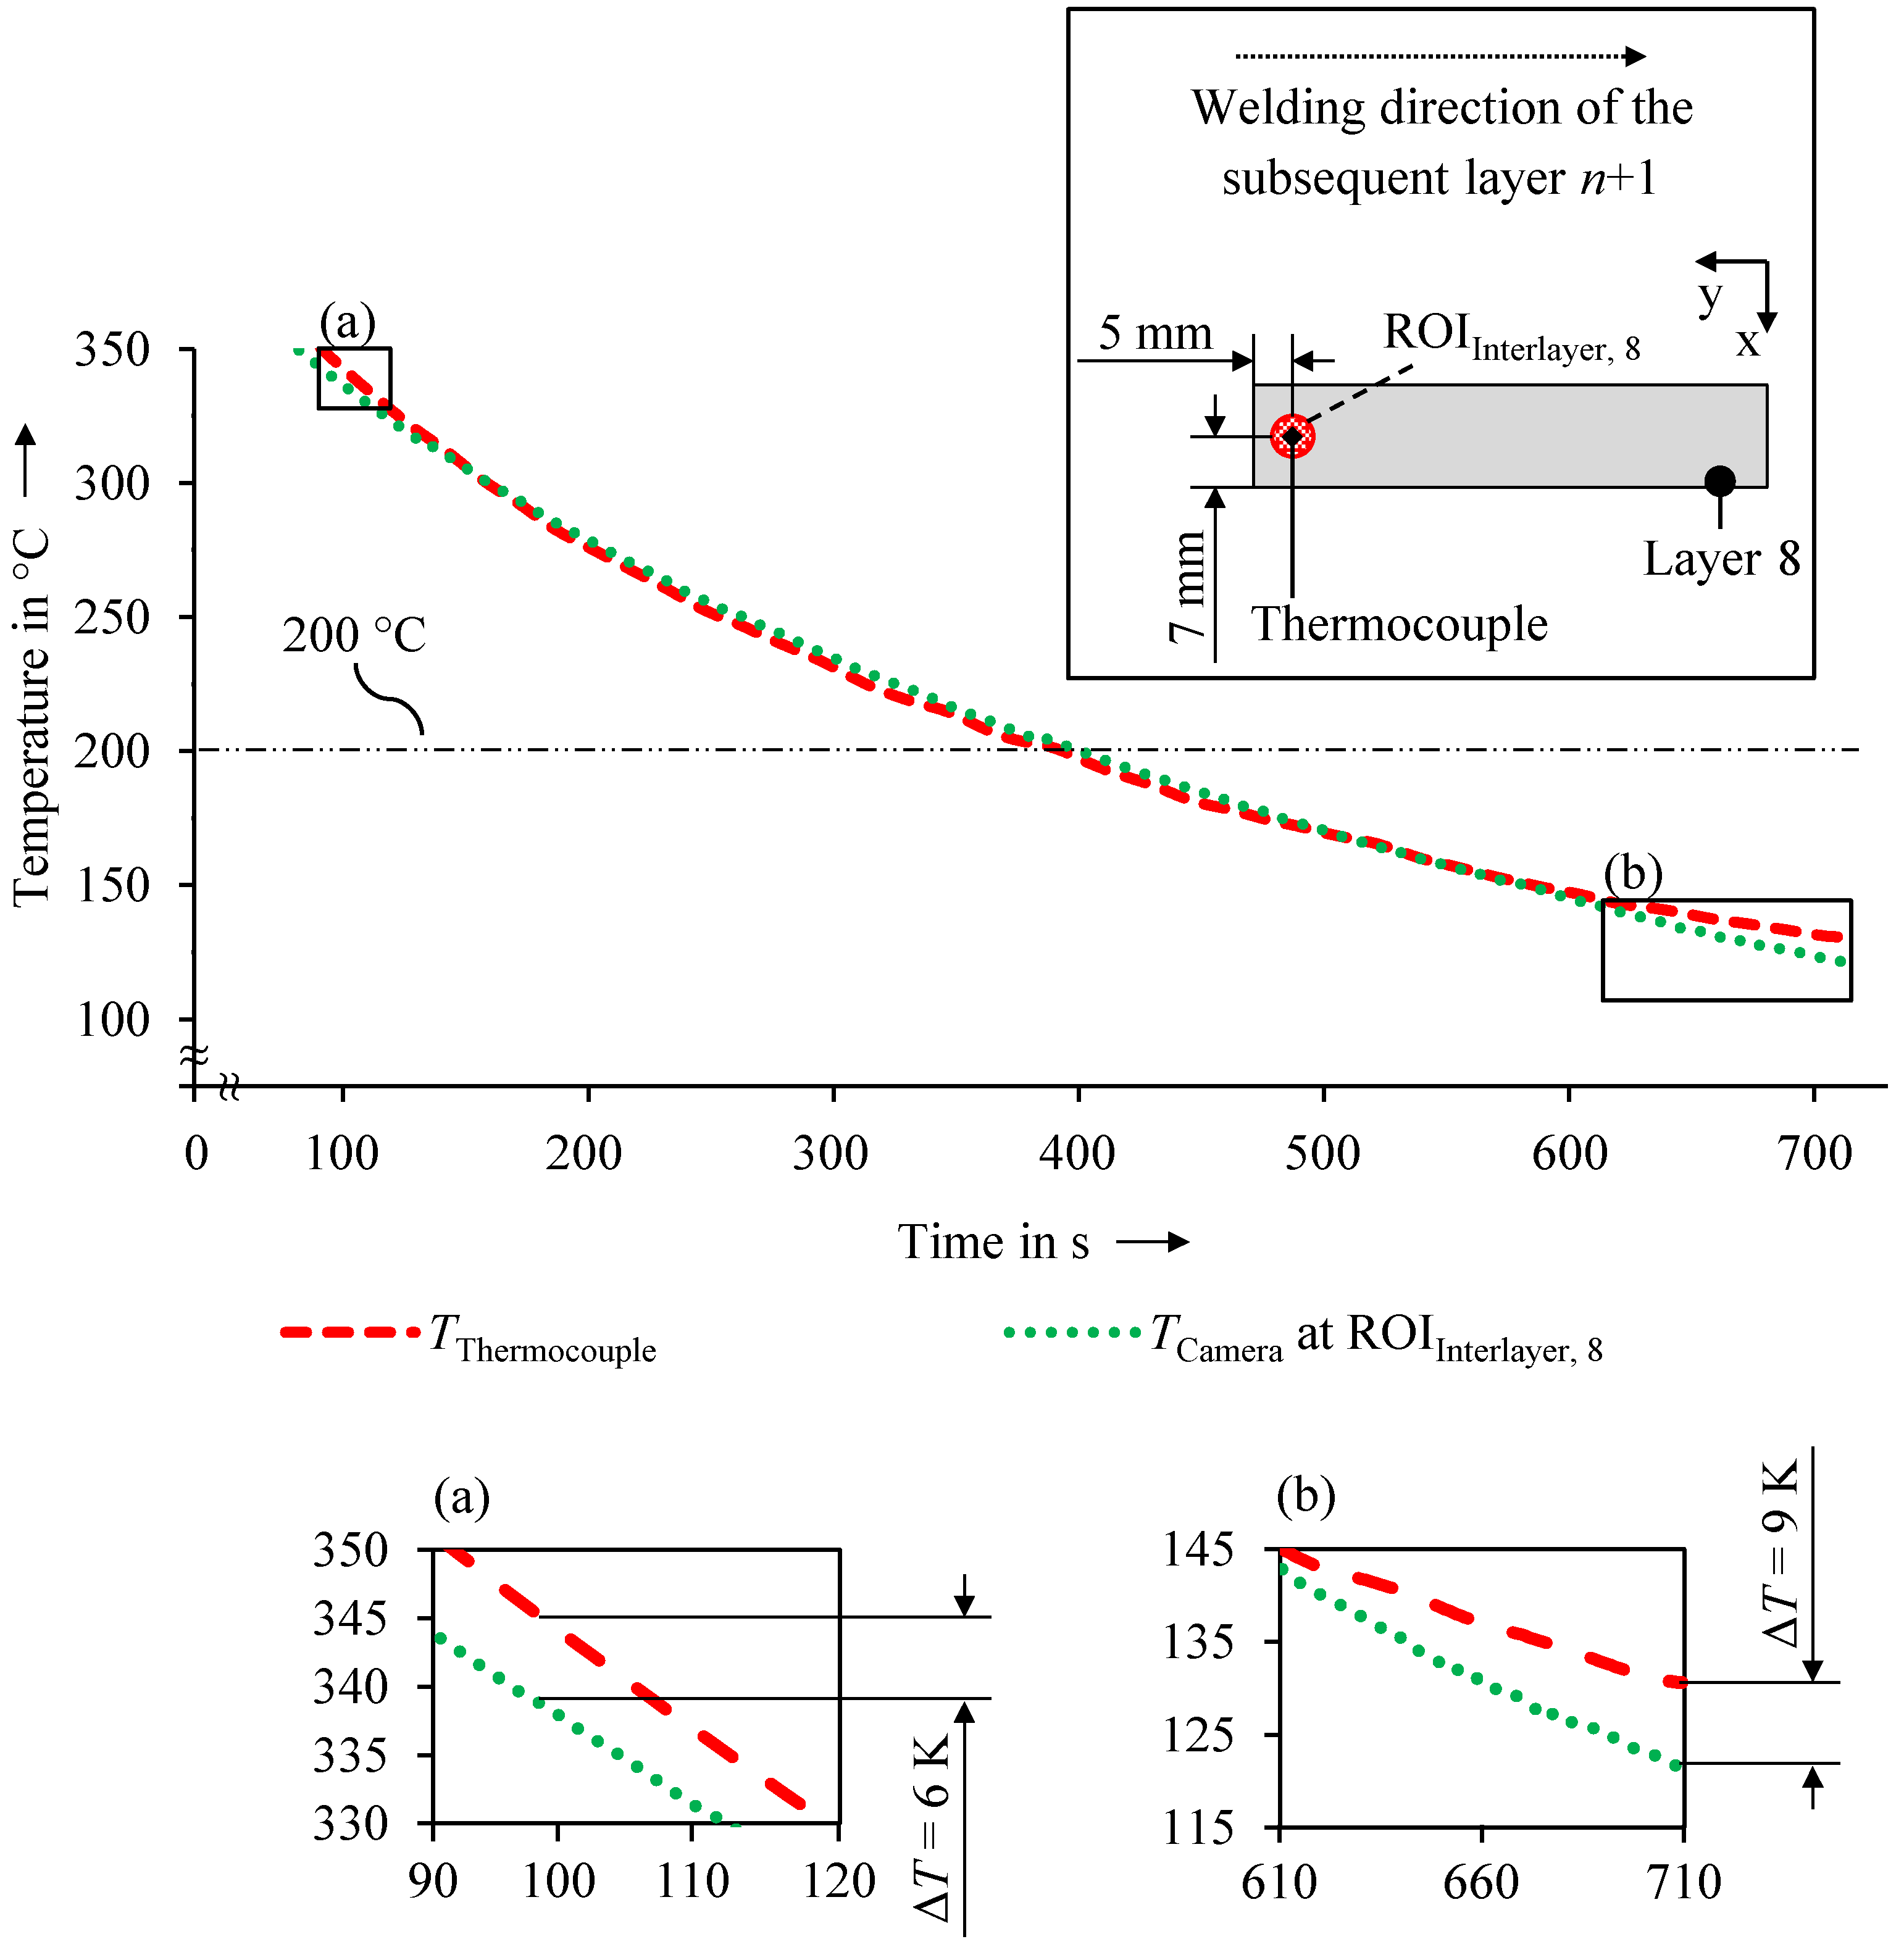
  • In an active WAAM process, the welding fumes and gas in the build chamber influence the thermographic signal. This influence led to an emissivity adjustment from ε = 0.35 to ε = 0.30 to align the signal T Camera to T Thermocouple .
  • The experimental setup allowed the robust thermographic measurement after the calibration for relocating the ROI over the layer. The validation of the presented methodology was successful. During the process, the temperature of T Thermocouple = 200 °C could be measured with a temperature offset of ΔT < 1 K.
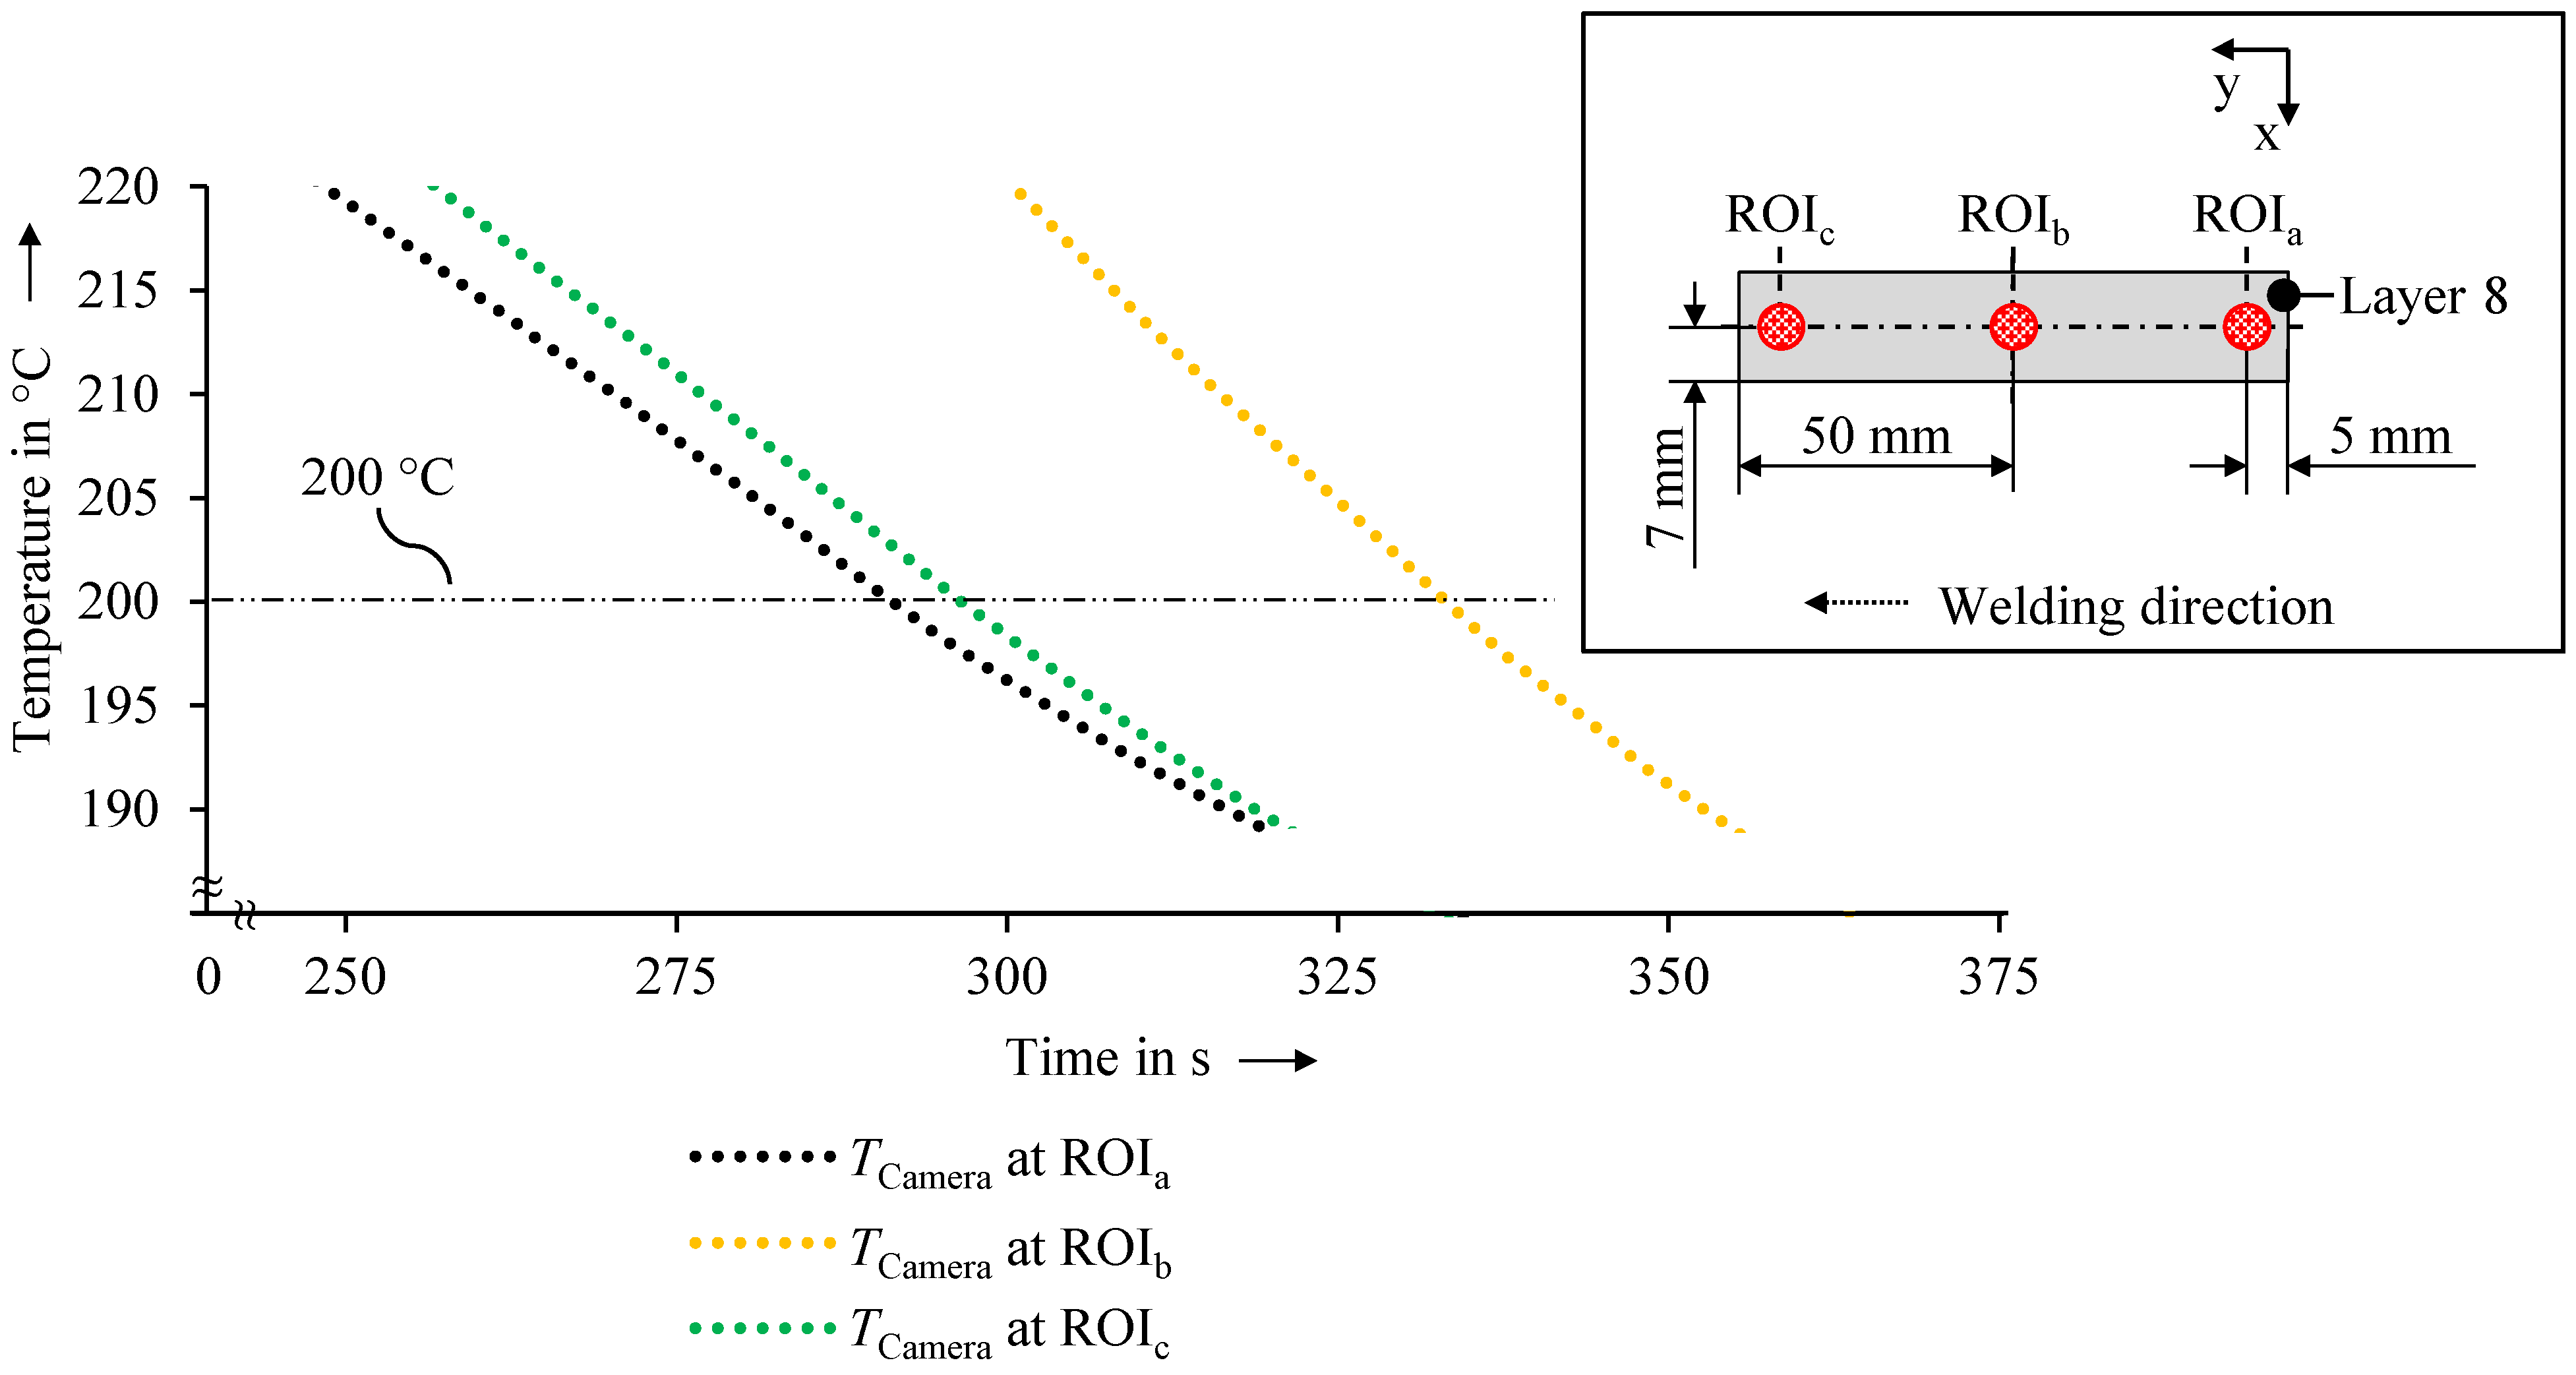
  • The range of validity for the thermographic signal is temperature-dependent. For 200 °C, the validity was identified between 140 °C and 336 °C.
  • A heat accumulation was shown by comparing the thermographic signals in a WAAM-manufactured wall. Due to the lower heat transfer from the part to the atmosphere, the center of the layer needed 40 s more to cool down to 200 °C compared to the free ends of the wall.
The analysis of temperature gradients and the measurement of the interlayer temperature with the calibrated experimental setup was thus enabled. With the presented methodology, a thermographic camera can measure absolute values of the interlayer temperature during the WAAM process. Furthermore, this methodology can be applied to other experimental setups since the emissivity and the transmittance can be calibrated with this investigative approach. Future investigations will include a sensitivity analysis to determine the threshold values of the interlayer temperature depending on the achievable part geometry. In addition, an automated signal interpretation system will be set up as an extension towards a quality assurance system.

Author Contributions

Conceptualization, D.B.; methodology, D.B.; validation, D.B. and T.W.; formal analysis, D.B.; investigation, D.B., T.W. and F.W.; data curation, D.B., T.W. and F.W.; writing—original draft preparation, D.B.; writing—review and editing, D.B., A.W. and M.F.Z.; visualization, D.B.; supervision, A.W. and M.F.Z.; project administration, D.B., A.W. and M.F.Z.; funding acquisition, M.F.Z. All authors have read and agreed to the published version of the manuscript.

Funding

The findings of this research activities were achieved within the scope of the research project “REGULUS” (grant reference 20W1709D). We hereby express our gratitude to the German Federal Ministry of Economic Affairs and Climate Action for its funding.

Institutional Review Board Statement

Not applicable.

Informed Consent Statement

Not applicable.

Data Availability Statement

Not applicable.

Conflicts of Interest

The authors declare no conflict of interest.

Appendix A

Table A1. Dimensions of the WAAM-manufactured wall.
ParameterSymbolValue and Unit
Length of the wall l wall 100 mm
Width of the wall w wall 14 mm
Height of the wall h wall 49 mm
Table A2. Overview of the set and determined parameters for the camera calibration.
ParameterSymbolValue and Unit
Distance of the camera to the measuring spot d cam 0.6 m
Angle of the camera to the surface of interest α cam 78°
Relative humidity in the build chamberφ<0.02%
Atmospheric temperature in the build chamber T atm 40 °C
Frame rate of the camera during measurementsf10 Hz
Table A3. Overview of the welding parameters during the active WAAM process.
ParameterSymbolValue and Unit
Welding currentI148 A
Welding voltageU16.1 V
Wire feed speed of the electrode v WFS 8 m/min
Travel speed of the welding torch v TS 800 mm/min
Arc length correction factor k l −14%
Dynamic control factor k d 3.7
Displacement in z direction between each layerz6.1 mm

References

  1. Yusuf, S.M.; Cutler, S.; Gao, N. Review: The Impact of Metal Additive Manufacturing on the Aerospace Industry. Metals 2019, 9, 1286. [Google Scholar] [CrossRef] [Green Version]
  2. Lütjering, G.; Williams, J.C. Titanium: With 51 Tables, 2nd ed.; Springer: Berlin/Heidelberg, Germany, 2007; ISBN 978-3540713975. [Google Scholar]
  3. Denkena, B.; Jacob, S. Approach for Increasing the Resource Efficiency for the Production Process of Titanium Structural Components. Procedia CIRP 2015, 35, 45–49. [Google Scholar] [CrossRef] [Green Version]
  4. Allen, J. An Investigation into the Comparative Costs of Additive Manufacture vs. Machine from Solid for Aero Engine Parts; Rolls-Royce plc.: Derby, UK, 2006. [Google Scholar]
  5. Williams, S.W.; Martina, F.; Addison, A.C.; Ding, J.; Pardal, G.; Colegrove, P. Wire + Arc Additive Manufacturing. Mater. Sci. Technol. 2016, 32, 641–647. [Google Scholar] [CrossRef] [Green Version]
  6. Wu, B.; Pan, Z.; Ding, D.; Cuiuri, D.; Li, H.; Xu, J.; Norrish, J. A review of the wire arc additive manufacturing of metals: Properties, defects and quality improvement. J. Manuf. Process. 2018, 35, 127–139. [Google Scholar] [CrossRef]
  7. Ding, J.; Colegrove, P.; Mehnen, J.; Ganguly, S.; Sequeira Almeida, P.M.; Wang, F.; Williams, S. Thermo-mechanical analysis of Wire and Arc Additive Layer Manufacturing process on large multi-layer parts. Comput. Mater. Sci. 2011, 50, 3315–3322. [Google Scholar] [CrossRef] [Green Version]
  8. Spencer, J.D.; Dickens, P.M.; Wykes, C.M. Rapid prototyping of metal parts by three-dimensional welding. Proc. Inst. Mech. Eng. Part B J. Eng. Manuf. 1998, 212, 175–182. [Google Scholar] [CrossRef]
  9. Geng, H.; Li, J.; Xiong, J.; Lin, X. Optimisation of interpass temperature and heat input for wire and arc additive manufacturing 5A06 aluminium alloy. Sci. Technol. Weld. Join. 2017, 22, 472–483. [Google Scholar] [CrossRef]
  10. Da Silva, L.J.; Souza, D.M.; de Araújo, D.B.; Reis, R.P.; Scotti, A. Concept and validation of an active cooling technique to mitigate heat accumulation in WAAM. Int. J. Adv. Manuf. Technol. 2020, 107, 2513–2523. [Google Scholar] [CrossRef]
  11. Michaleris, P. Modeling metal deposition in heat transfer analyses of additive manufacturing processes. Finite Elem. Anal. Des. 2014, 86, 51–60. [Google Scholar] [CrossRef]
  12. Wu, B.; Ding, D.; Pan, Z.; Cuiuri, D.; Li, H.; Han, J.; Fei, Z. Effects of heat accumulation on the arc characteristics and metal transfer behavior in Wire Arc Additive Manufacturing of Ti6Al4V. J. Mater. Process. Technol. 2017, 250, 304–312. [Google Scholar] [CrossRef]
  13. Bagavathiappan, S.; Lahiri, B.B.; Saravanan, T.; Philip, J.; Jayakumar, T. Infrared thermography for condition monitoring—A review. Infrared Phys. Technol. 2013, 60, 35–55. [Google Scholar] [CrossRef]
  14. Baier, D.; Bachmann, A.; Zaeh, M.F. Towards Wire and Arc Additive Manufacturing of High-Quality Parts. Procedia CIRP 2020, 95, 54–59. [Google Scholar] [CrossRef]
  15. Vollmer, M.; Möllmann, K.-P. Infrared Thermal Imaging: Fundamentals, Research and Applications, 2nd ed.; Wiley-VCH Verlag GmbH & Co. KGaA: Weinheim, Germany, 2018; ISBN 9783527693306. [Google Scholar]
  16. Yang, D.; Wang, G.; Zhang, G. Thermal analysis for single-pass multi-layer GMAW based additive manufacturing using infrared thermography. J. Mater. Process. Technol. 2017, 244, 215–224. [Google Scholar] [CrossRef]
  17. González-Fernández, L.; Risueño, E.; Pérez-Sáez, R.B.; Tello, M.J. Infrared normal spectral emissivity of Ti–6Al–4V alloy in the 500–1150K temperature range. J. Alloys Compd. 2012, 541, 144–149. [Google Scholar] [CrossRef]
  18. Coppa, P.; Consorti, A. Normal emissivity of samples surrounded by surfaces at diverse temperatures. Measurement 2005, 38, 124–131. [Google Scholar] [CrossRef]
  19. Yang, J.; Sun, S.; Brandt, M.; Yan, W. Experimental investigation and 3D finite element prediction of the heat affected zone during laser assisted machining of Ti6Al4V alloy. J. Mater. Process. Technol. 2010, 210, 2215–2222. [Google Scholar] [CrossRef]
  20. Li, L.; Yu, K.; Zhang, K.; Liu, Y. Study of Ti–6Al–4V alloy spectral emissivity characteristics during thermal oxidation process. Int. J. Heat Mass Transf. 2016, 101, 699–706. [Google Scholar] [CrossRef]
  21. Bradshaw, F.J. The Optical Emissivity of Titanium and Zirconium. Proc. Phys. Soc. B 1950, 63, 573–577. [Google Scholar] [CrossRef]
  22. Hagqvist, P.; Sikström, F.; Christiansson, A.-K. Emissivity estimation for high temperature radiation pyrometry on Ti–6Al–4V. Measurement 2013, 46, 871–880. [Google Scholar] [CrossRef]
  23. Richter, A.; Rembe, C.; Gehling, T.; Treutler, K.; Wesling, V. Echtzeittemperaturmessung bei additivem Lichtbogenschweißen/Real-time temperature measurement at wire arc additive welding. Tech. Mess. 2019, 86, 112–116. [Google Scholar] [CrossRef]
  24. McIntosh, G.; Huff, G. Emissivity considerations for thermographic fieldwork: Why table values don’t work. In Thermosense: Thermal Infrared Applications XL; SPIE: Orlando, FL, USA, 2018; ISBN 9781510618336. pp. 22–36. [Google Scholar]
  25. Pixner, F.; Buzolin, R.; Schönfelder, S.; Theuermann, D.; Warchomicka, F.; Enzinger, N. Contactless temperature measurement in wire-based electron beam additive manufacturing Ti-6Al-4V. Weld World 2021, 65, 1307–1322. [Google Scholar] [CrossRef]
  26. Rodriguez, E.; Mireles, J.; Terrazas, C.A.; Espalin, D.; Perez, M.A.; Wicker, R.B. Approximation of absolute surface temperature measurements of powder bed fusion additive manufacturing technology using in situ infrared thermography. Addit. Manuf. 2015, 5, 31–39. [Google Scholar] [CrossRef]
  27. Raplee, J.; Plotkowski, A.; Kirka, M.M.; Dinwiddie, R.; Okello, A.; Dehoff, R.R.; Babu, S.S. Thermographic Microstructure Monitoring in Electron Beam Additive Manufacturing. Sci. Rep. 2017, 7, 43554. [Google Scholar] [CrossRef] [Green Version]
  28. Boyer, R.; Welsch, G.; Collings, E.W. Materials Properties Handbook: Titanium Alloys, 4th ed.; ASM International: Materials Park, OH, USA, 2007; ISBN 0871704811. [Google Scholar]
  29. Mills, K.C. Al-6061-T6. In Recommended Values of Thermophysical Properties for Selected Commercial Alloys; Elsevier: Amsterdam, The Netherlands, 2002; pp. 64–67. ISBN 9781855735699. [Google Scholar]
  30. Sernelius, B.E. Temperature dependence of the transmittance, reflectance and absorption of optical films. Thin Solid Film. 1992, 208, 96–99. [Google Scholar] [CrossRef]
  31. Weger, D.; Baier, D.; Straßer, A.; Prottung, S.; Kränkel, T.; Bachmann, A.; Gehlen, C.; Zaeh, M.F. Reinforced Particle-Bed Printing by Combination of the Selective Paste Intrusion Method with Wire and Arc Additive Manufacturing—A First Feasibility Study. In Second RILEM International Conference on Concrete and Digital Fabrication; Bos, F.P., Lucas, S.S., Wolfs, R.J., Salet, T.A., Eds.; Springer International Publishing: Cham, Switzerland, 2020; pp. 978–987. ISBN 978-3-030-49915-0. [Google Scholar]
Figure 1. Overview of the emissivity coefficients of Ti-6Al-4V parts from the literature as a function of the temperature [12,17,18,19,20,22].
Jmmp 07 00010 g001
Figure 2. Methodology for enabling a reproducible monitoring of the interlayer temperature during the WAAM process.
Jmmp 07 00010 g002
Figure 3. Schematic representation of a thermographic measurement during the WAAM process.
Jmmp 07 00010 g003
Figure 4. Welding strategy of the part.
Jmmp 07 00010 g004
Figure 5. Measured absolute temperature values T Thermocouple and T Camera with different values ε set on the thermographic camera against the time.
Jmmp 07 00010 g005
Figure 6. Measured absolute temperature values T Thermocouple and T Camera with different values τ set on the thermographic camera and a constant emissivity of ε = 0.35 against the time.
Jmmp 07 00010 g006
Figure 7. Measured absolute temperature values T Thermocouple and T Camera with different ε set on the thermographic camera and a constant transmittance of τ = 0.5 against the time.
Jmmp 07 00010 g007
Figure 8. Measured absolute temperature values T Thermocouple and T Camera with the identified values ε and τ set on the thermographic camera and the relocated ROI Interlayer ,   8 against the time; (a,b) show more details about ΔT.
Jmmp 07 00010 g008
Figure 9. Measured absolute temperature values T Camera at ROI a , ROI b , and ROI c at layer 8 against the cooling time after welding.
Jmmp 07 00010 g009
Disclaimer/Publisher’s Note: The statements, opinions and data contained in all publications are solely those of the individual author(s) and contributor(s) and not of MDPI and/or the editor(s). MDPI and/or the editor(s) disclaim responsibility for any injury to people or property resulting from any ideas, methods, instructions or products referred to in the content.

