Review

Machine Learning for Precision Agriculture Using Imagery from Unmanned Aerial Vehicles (UAVs): A Survey

Department of Computer Science and Engineering, American University of Sharjah, Sharjah P.O. Box 26666, United Arab Emirates
*
Author to whom correspondence should be addressed.
Drones 2023, 7(6), 382; https://doi.org/10.3390/drones7060382
Submission received: 1 May 2023 / Revised: 26 May 2023 / Accepted: 31 May 2023 / Published: 6 June 2023

Abstract

:
Unmanned aerial vehicles (UAVs) are increasingly being integrated into the domain of precision agriculture, revolutionizing the agricultural landscape. Specifically, UAVs are being used in conjunction with machine learning techniques to solve a variety of complex agricultural problems. This paper provides a careful survey of more than 70 studies that have applied machine learning techniques utilizing UAV imagery to solve agricultural problems. The survey examines the models employed, their applications, and their performance, spanning a wide range of agricultural tasks, including crop classification, crop and weed detection, cropland mapping, and field segmentation. Comparisons are made among supervised, semi-supervised, and unsupervised machine learning approaches, including traditional machine learning classifiers, convolutional neural networks (CNNs), single-stage detectors, two-stage detectors, and transformers. Lastly, future advancements and prospects for UAV utilization in precision agriculture are highlighted and discussed. The general findings of the paper demonstrate that, for simple classification problems, traditional machine learning techniques, CNNs, and transformers can be used, with CNNs being the optimal choice. For segmentation tasks, UNETs are by far the preferred approach. For detection tasks, two-stage detectors delivered the best performance. On the other hand, for dataset augmentation and enhancement, generative adversarial networks (GANs) were the most popular choice.

1. Introduction

The rapid growth of the world’s population is putting growing demands on food production. A large percentage of the world’s population is facing food insecurity today [1]. According to the Food and Agriculture Organization of the United Nations (FAO), the demand for food production will continue to rise, reaching a staggering 70% increase by the year 2050 [2]. Such high demand cannot be sustained using conventional farming practices today. The problem is exacerbated by the continuously diminishing natural resources used as inputs for farming. The use of traditional farming practices has also played a significant role in environmental degradation, including the spread of water and atmospheric pollutants [3], the degradation and erosion of soil [4], the evolution of pesticide-resistant pests, and the endangerment of human health due to excessive use of pesticides and agricultural chemicals [5]. Hence, new sustainable food production methods that maximize yield and minimize environmental impact must be developed. Using technology to support agricultural processes can potentially help reach this goal [6].
Precision agriculture, as defined by the International Society of Precision Agriculture (ISPA), is an agricultural management strategy that relies on the use of technology and agricultural data to improve the quality, sustainability, and yield of agricultural production [7]. Precision agriculture uses a wide array of sensors and monitoring devices to measure farming parameters such as vegetation greenness, water content, nutrient status, and soil health [8]. These metrics help farmers make better decisions on how to manage their fields, reduce resource waste, and increase yield and production [9]. The use of precision agriculture also conserves farmers’ time and reduces manual labor. For example, precision agriculture can replace farmers manually surveying and assessing vegetation in their fields, which is a tiresome, time-consuming, and error-prone task [10]. Unmanned ground vehicles (UGVs) provide a less expensive alternative to UAVs. Nonetheless, UGVs are limited in terms of applications as they are slower than UAVs and capture a smaller area in each frame. Hence, UAVs provide a good alternative for satellites and UGVs, with comparatively low cost.
The use of unmanned aerial vehicles (UAVs) in precision agriculture has grown rapidly in the last few years. This growth is a result of their ability to gather large amounts of information quickly, which can then be used to guide and enhance agronomic decision making. In the early days of precision agriculture, most image data from fields were collected using ground cameras either mounted on unmanned ground vehicles (UGVs) or fixed next to vegetation patches. Later, satellites were used for image capturing. More recently, UAVs have been used in precision agriculture because of their ability to capture images at lower altitudes, allowing them to be used in problems that require higher-resolution images such as pest/disease detection and fertilization, at different angles, allowing them to capture better images of otherwise occluded objects, with a higher speed than satellites, making them fit for real-time use [11]. Recently, agricultural datasets have become available; hence, it is now possible to build a variety of machine learning models using these datasets [12].
This paper provides a survey of current research on applying machine learning to UAV image data for precision agriculture. While precision agriculture can use a variety of sensors [13], this paper limits itself to those studies that primarily used UAV image data. There are many previous survey papers related to this topic. For example, Kamilais et al. [14] covered various topics, including disease detection, land-cover classification, crop type classification, plant recognition, and fruit counting. The solutions discussed included various types of convolutional neural network (CNN) backbones such as AlexNet and variations of VGG16. Since this paper appeared in 2018, many new deep learning models and architectures introduced after 2018 are not covered in this review. Ren et al. [15] contained comparable material but also discussed newer models and backbones such as YOLO detectors and fine-tuned AlexNet models. This paper classified models on the basis of the backbone being used but did not cover a wider variety of problems requiring newer architectures. Meshram et al. [16] only focused on problems regarding disease and pest detection. Similarly, Shin et al. [17] exclusively discussed papers that dealt with the problems of disease and stress detection in vegetation, where stress detection includes detection of water stress, nutrient deficiency, and pest stress, and disease detection includes detection of diseases on leaves and diseases on fruits and vegetables. Radoglou-Grammatikis et al. [18] provided a broad, nontechnical overview of UAVs for precision agriculture with an emphasis on applications. Lastly, Aslan et al.’s [19] recent survey paper covered the use of UAVs in both indoor and outdoor spaces but did so primarily in a nontechnical manner.
The contributions of this paper are as follows:
  • The paper discusses a wide variety of precision agriculture problems that can be addressed using image data acquired from UAVs.
  • The paper provides a technical discussion of the most recent papers using image data from UAVs to address agricultural problems.
  • The paper evaluates the effectiveness of the various machine learning and deep learning techniques used that use UAV image data to address agricultural problems.
  • The paper points out some fruitful future research directions based on the work conducted to date.
The remainder of the paper is organized as follows: firstly, the key challenges tackled by precision agriculture are discussed; next, the types of images collected using UAVs and evaluation techniques for models built using these images are presented; then, survey design is described, followed by a detailed presentation of the survey results; lastly, the paper ends with a discussion and a conclusion.

2. Challenges in Agriculture

Farmers face a variety of challenges, many of which may be addressed using precision agriculture. This section briefly describes some agricultural challenges that can be addressed using precision agriculture techniques with image data from UAVs.

2.1. Plant Disease Detection and Diagnosis

The spread of plant diseases and the resulting loss in crop yield is a key problem for many farmers. According to the Food and Agriculture Organization of the United Nations (FAO), plant diseases have been the cause of around 220 billion USD of annual loss to the global economy [20]. To control the spread of diseases and, hence, the yield loss, farmers must detect plant diseases at an early stage and then take appropriate remedial measures. To detect diseases, farmers survey their fields to find obvious signs of infection. Once found, samples are taken from the infected plants to be observed under a microscope or similar instruments in a laboratory for a more reliable diagnosis [21]. Various laboratory assessments can also be performed for disease identification, including polymerase chain reaction (PCR) and fluorescence in situ hybridization (FISH). Using such methods is laborious and time-consuming, which requires access to experts in plant pathology. In addition, since these methods require plant sampling, they are damaging in nature [22].

2.2. Pest Detection and Control

Pests such as insects and weeds can result in significant crop yield loss. Insects cause yield loss by feeding on plants or by spreading plant diseases [23]. Weeds cause yield loss by consuming crop-growth resources, including water and nutrients [24]. Detecting and curbing the spread of pests by applying pest control mechanisms is essential for ensuring a good yield. Like plant disease detection, traditional pest detection is a manual time-consuming expert-reliant process. Once detected, a control mechanism must be applied to halt the spread of pests. One popular method of pest control is spraying a field with agrochemicals, where herbicides are sprayed to eradicate weeds, and insecticides are sprayed to control insects. Traditionally, agrochemicals are not sprayed on the affected areas of the fields only. Rather, chemicals are applied across a field because detecting specific areas requiring agrochemicals is time-consuming [25]. As a result, current pest control methods are wasteful and unnecessarily expensive. Moreover, research has shown the dangers of agrochemical use on the environment and human health. For example, pesticides have been found to pollute water and air and cause significant changes to soil ecosystems by causing harm to soil microorganisms. In addition, pesticide use has been found to cause adverse health effects, including weakening immunity and causing cancer [26]. Excessive use of pesticides also results in the cultivation of pesticide-resistant populations of pests. Currently, more than 500 species of insects are resistant to insecticides, and around 270 species of weeds are resistant to herbicides [27]. The use of pesticides will become an ineffective pest control mechanism if farmers continue to use traditional pesticide application methods. Excessive use, however, is not the only problem that makes traditional methods of pesticide use inefficient and ineffective. For pesticides to be most effective, correct identification of pests must be done to select the right type of pesticides. Subsequently, an accurate estimation of pests’ vulnerability phase timings must be made to apply pesticides. Accuracy in time estimation is also required because early or late application of pesticides has little to no effect on the mitigation of pest spread. In order to choose the correct pesticides to use and determine the timing of application, an entomologist must survey the field, identify the pest types in the field, and predict the timing of their vulnerability phase [28]. Hence, for traditional pesticide-reliant pest control mechanisms to work, farmers also require expert help. Taking everything into account, traditional pest detection and control methods are not sustainable, especially with the growing demand for crop production.

2.3. Urban Vegetation Classification

Urban vegetation plays a vital role in facing global climate change challenges. The dominance of a single type of tree results in rapid temporal changes in ecosystem functions such as carbon storage [29]. Machine learning can be used to classify different tree species within heterogeneous urban environments. UAV imagery with spectral information allows more accurate classification results that can be used later to create a better distribution of plants on the landscape. Furthermore, improving the mapping capacities in spatial, spectral, and geometric domains in agriculture enables better analysis of urban landscapes and efficient resolutions to encounter the increasing thermal changes [30].

2.4. Crop Yield Estimation

Accurate crop yield estimation helps create realistic plans for labor employment and agricultural produce storage [31]. Yield estimation is also important for making changes to crop management practices to improve the final crop yield [32]. Traditionally, crop yield is estimated by finding the yield in a small sample area of a field and then generalizing the results to the entire field’s area [33]. While seeming simple enough, in addition to being inaccurate, this method requires time-consuming manual work [34]. Manual crop counting is also an inefficient method of crop yield estimation with larger fields and more varied crop types. In addition, an obvious drawback of this method is that the estimation inaccuracies can lead to suboptimal plans for crop yield, labor, and storage.

2.5. Over- and Under-Irrigation

The postharvest quality of crops depends on preharvest practices [35]. Appropriate irrigation is one of these preharvest practices that play a crucial role in determining crop quality. Several crops are not drought-resistant; therefore, yields decrease considerably after short periods of water deficiency during production. For example, a study conducted by Mitchell et al. [36] found that deficit irrigation reduced fruit water accumulation and fresh fruit yield. In addition, Atay et al. [37] hypothesized that over-irrigation could have a negative impact on total yield and fruit quality. Lastly, with water being a scarce resource in most production areas, an efficient water management scheme that maintains crop yield but has a moderate and controlled level of moisture stress on their crops is required [29]. Multispectral images acquired from a UAV for water irrigation level recognition can potentially be used to help address over- and under-irrigation [38]. This can be achieved by capturing the canopy temperature of the crops using infrared thermometers to estimate the irrigation levels and the required irrigation scheduling methods.

2.6. Seed Quality and Germination

Seed germination is the most critical stage of crop growth and development, which includes complex physiological, cellular, and metabolic events that can influence crop yield and quality [39]. Typically, these events are divided into three phases, during which cell membrane transformation and cell structure reorganization, metabolic reorganization and regulation, and cell and root elongation take place [40]. Selecting seeds with high germination rates and quality, and cultivating optimal environmental conditions for rapid and uniform seed germination can increase crop yield and ensure the growth of high-quality crops [41]. To achieve that, real-time monitoring of the process of seed germination becomes imperative for ensuring the growth of healthy, high-quality seedlings, which in turn would later produce healthy, high-quality crops. Given that the traditional methods of manual seed and seedling monitoring lack efficiency, these monitoring methods can be replaced with more efficient and less labor-intensive UAV-based methods [42].

2.7. Soil Quality and Composition

Soil quality and composition are critical for maximizing a crop’s output and for increasing yield. The potential root zone in the soil should be well tilled and fertilized with the needed minerals [35]. Balanced levels of nitrogen, water, and calcium improve crop quality and reduce post-harvest decay and vice versa. UAVs equipped with multispectral cameras may detect useful geospatial data such as water stress, nitrogen level, and other existing supplements [43]. Appropriate soil treatments can then be performed at the right time through foliar sprays.

2.8. Fertilizer Usage

The use of fertilizers increases the yield of crops by providing plants with the nutrients necessary to accelerate growth. The type of fertilizer used depends on many factors, including the crop type, the quality required, the purpose of use, and the diseases prevalent among the crop type. Underuse of fertilizers usually results in a reduction in the quality of the crop because it may lower the crop’s sugar content and reduce its firmness. Meanwhile, over-fertilizing may result in multiple quality traits impairments such as total soluble solids, glucose, fructose, and pH issues [44]. Hence, a balanced fertilization level is necessary for crops. UAVs can be used to spray crops’ leaves or root soil with different combinations of nutrients needed in an effective and controlled manner to enhance the crops’ quality and resistance to bacterial infections.

2.9. Quality of the Crop Output

Farmers aspire to produce crops with the highest possible quality by designing quality-ensuring preharvest, harvest, and postharvest plans tailored to the crop. In the preharvest stage, farmers are concerned with designing irrigation, fertilization, pesticide mitigation, and crop drainage plans that produce crops with the required quality traits [45]. With these plans, crops are watered with a proper irrigation schedule, fertilized with the correct type of fertilizer and with the correct amount, and sprayed with the right kind and amount of pesticides [44,45]. The harvesting stage also plays a role in the quality of the crop output. Farmers must harvest their crops during the correct time window to ensure that they adhere to their expected color, size, taste, and maturity characteristics. Traditionally, this is achieved using a variety of tests, including color, size, firmness, and acidity measurement. Lastly, in the postharvest stage, farmers must design storage plans that ensure the quality of their harvest. Such plans must regard such important crop-specific factors as the harvested crops’ storage time and temperature and humidity requirements. Two examples of quality-ensuring storage plans include dynamic controlled atmosphere (DCA) storage and heat treatments [35]. Since crop preharvest, harvesting, and postharvest plans require attention to crop types and careful assessment of their needs, farmers can leverage computer vision technology to perform these assessments and produce optimal plans, thereby reducing the need for manual labor and increasing the quality of the yield.
Table 1 shows a summary of the challenges in agriculture that potentially lend themselves to being addressed using image data from UAVs. As the table shows, UAVs can be potentially used to address all stages of the agriculture cycle.

3. Survey Design

Journal articles and conference papers were collected using IEEE Xplore, arXiv, MDPI, ResearchGate, and ScienceDirect. “Deep learning”, “precision farming”, and “agriculture” were the primary search terms utilized. The keywords “crops” and “segmentation” were added to other searches. From the search results, only articles published between 2017 and 2023 were included, and, when applicable, the results were sorted by relevance and citation count. Figure 1 shows the distribution of resulting publications. The exclusion and inclusion of research articles were decided firstly by a preliminary abstract analysis, and then by a full review of the article. The research papers which did not utilize UAV/aerial image datasets were excluded. In addition, the primary inclusion criteria for our research were as follows:
  • The study must include a clear report on the performance of the models.
  • The study must present an in-depth description of the model architecture.
  • The study carries out detection/classification/segmentation tasks or a combination of these using UAV image datasets.
Figure 1. Sources distribution of the surveyed papers.
Drones 07 00382 g001
The exclusion criteria of our research were as follows:
  • The study is not indexed in a reputable database.
  • The study does not propose any significant addition or change to previously existing deep learning or machine learning solutions in its domain.
  • The study presents vague descriptions of the experimentation and classification results.
  • The study proposes irrelevant or unsatisfactory results.
On the basis of these criteria, 70 papers were chosen for the survey. The papers were studied carefully to address the following major research questions:
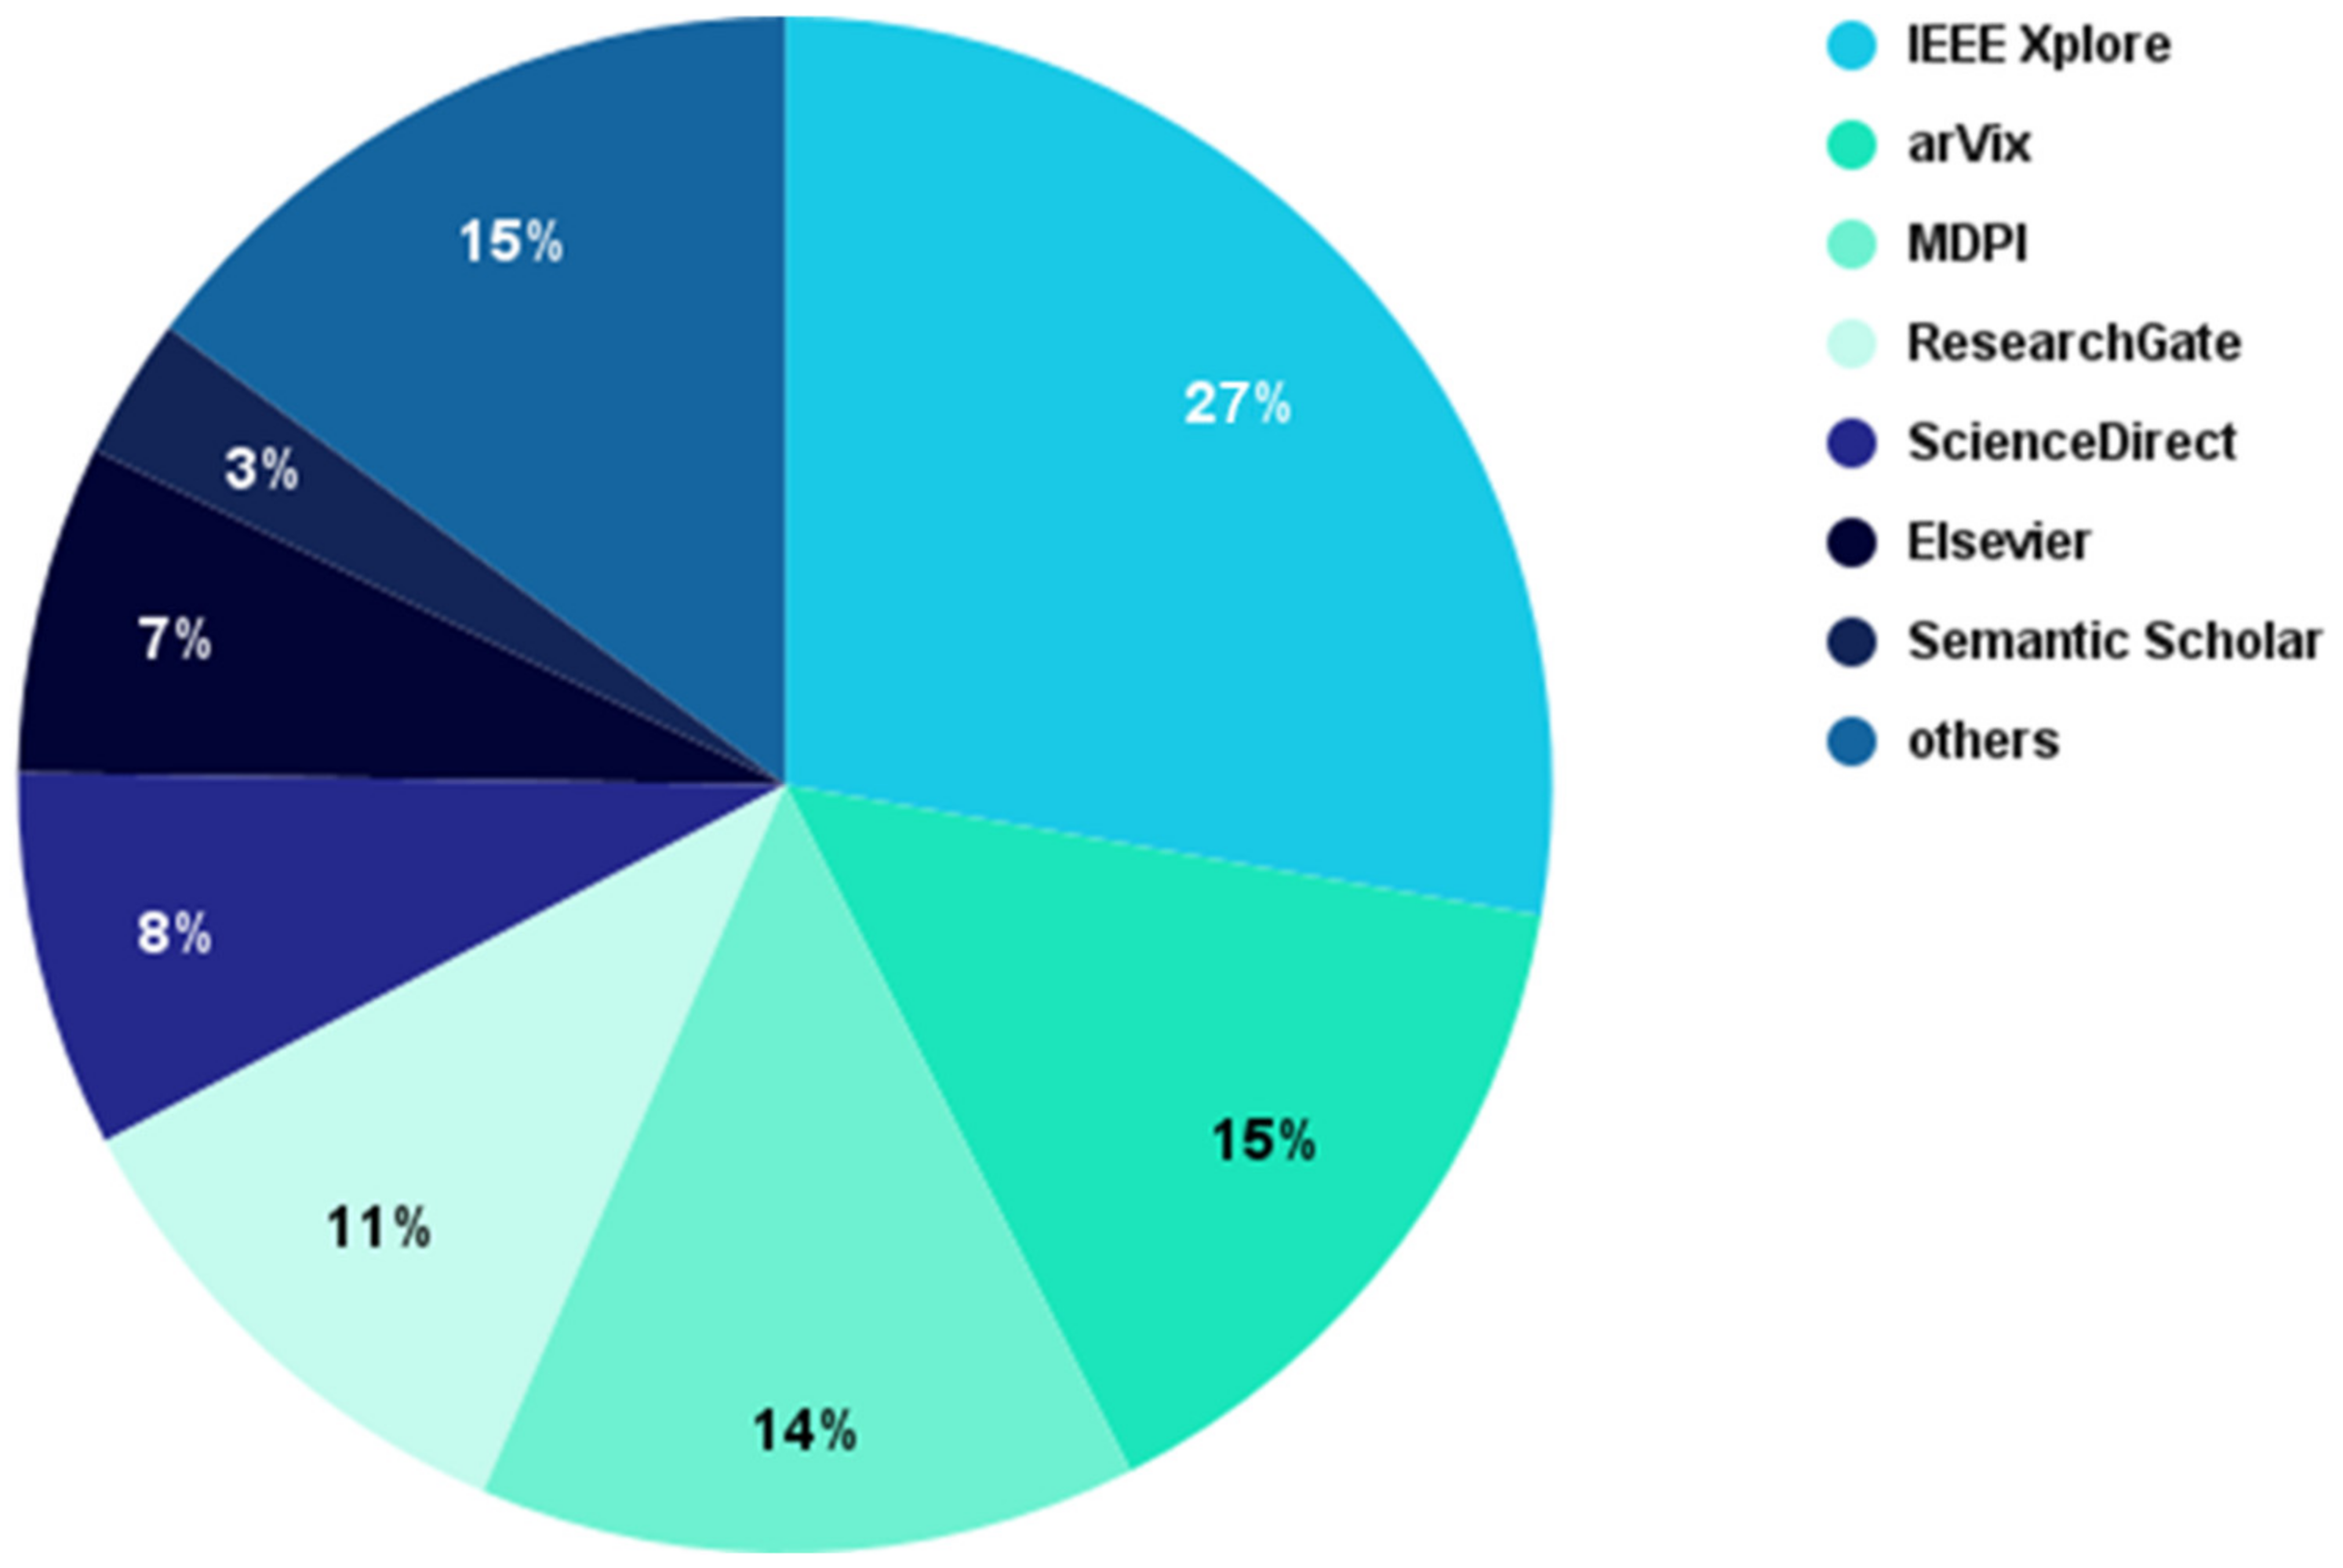
  • What data sources and image datasets were used in the paper?
  • What type of preprocessing, data cleaning, and augmentation methods were utilized?
  • What type of machine learning or deep learning architectures were used?
  • What overall performance was achieved, and which metrics were used to report the performance?
  • Which architectures and techniques performed best for a class of agricultural problems?

4. Background

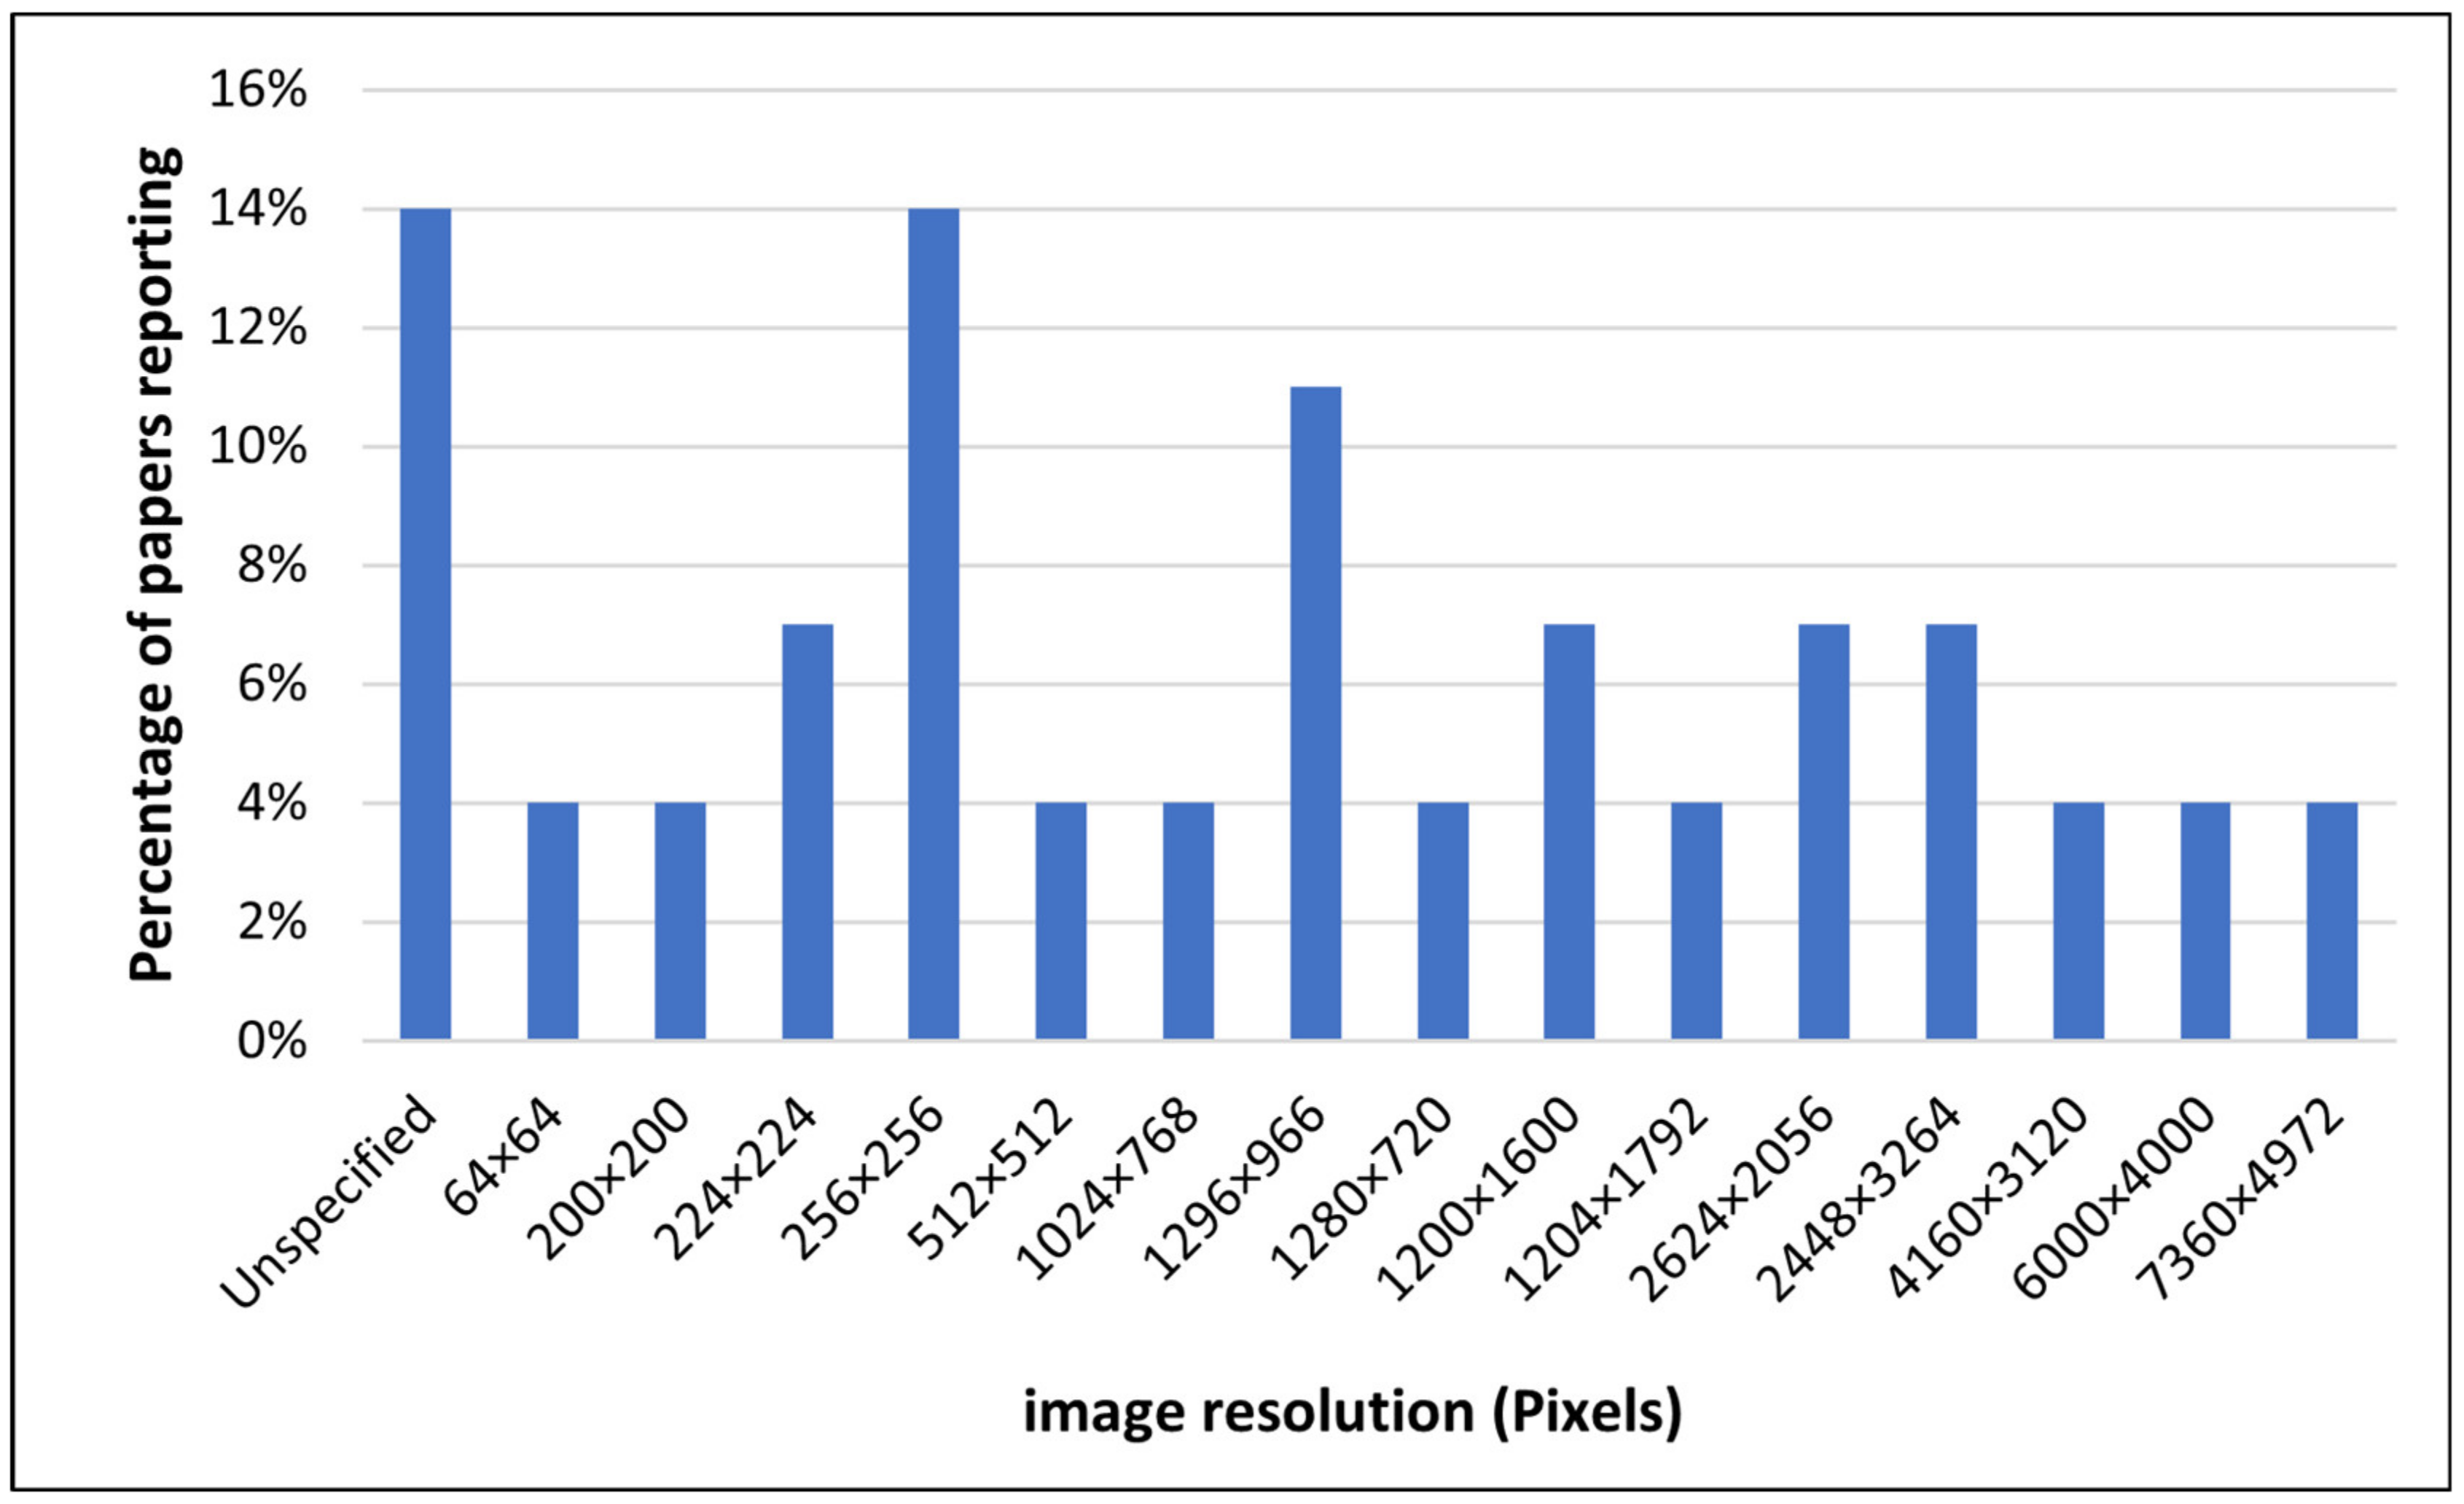
4.1. Image Data from UAVs

Raw images from a UAV are typically first corrected for displacements and distortions caused by terrain relief, camera tilt, etc., to create orthophoto images. The resulting images can be normal RGB images that define red, green, and blue color components for each individual pixel in an image. The RGB images are acquired using the standard visible light-sensitive cameras that usually only give surface-level information about the target data [46]. In addition to traditional imaging, UAVs for agricultural applications use multispectral images that capture different wavelength ranges across the electromagnetic spectrum. Multispectral data can be used to assess variations in plant/crop health that may be useful information for early treatment. Deep learning models using multispectral imaging have been developed [47]. The near-infrared (NIR) spectral band images are acquired at 750–900 nm wavelength bands and are primarily used for vegetation applications. NIR imaging provides additional, beyond-surface-level information about the target data [48]. In such images, the red edge refers to the region in the NIR range where a rapid change in the reflectance of vegetation is observed [49]. Similarly, color-infrared (CIR) imagery also uses a portion of the NIR range. The invisible NIR light of CIR can be seen by the human eye by shifting it and the primary colors over. On CIR imagery, vegetation appears red, water generally appears black, and urban structures such as buildings and roads appear in a light-blue/green tint [50].

4.2. Image Features Used in UAV Data

Many machine learning models use derived features from images acquired from a UAV. Examples of commonly used features include hue–saturation–value (HSV) channels and vegetation indices (VIs) from RGBs such as excess green index (ExG), excess green minus red (ExGR), and the color index of vegetation extraction (CIVE). Other VIs are crop-sensitive and can be derived from NIR and red-edge (RE) spectra, such as NDVI, ratio vegetation index (RVI), and perpendicular vegetation index (PVI) [51]. Table 2 illustrates some of the possible vegetation indices that can be derived. Edge detectors can also be useful and are commonly used, such as Gaussian, Laplacian, and Canny filters [52]; Gabor filters, gray-level co-occurrence matrix (GLCM) [53], and geometric and statistical features [54] are among other useful features used in precision farming.

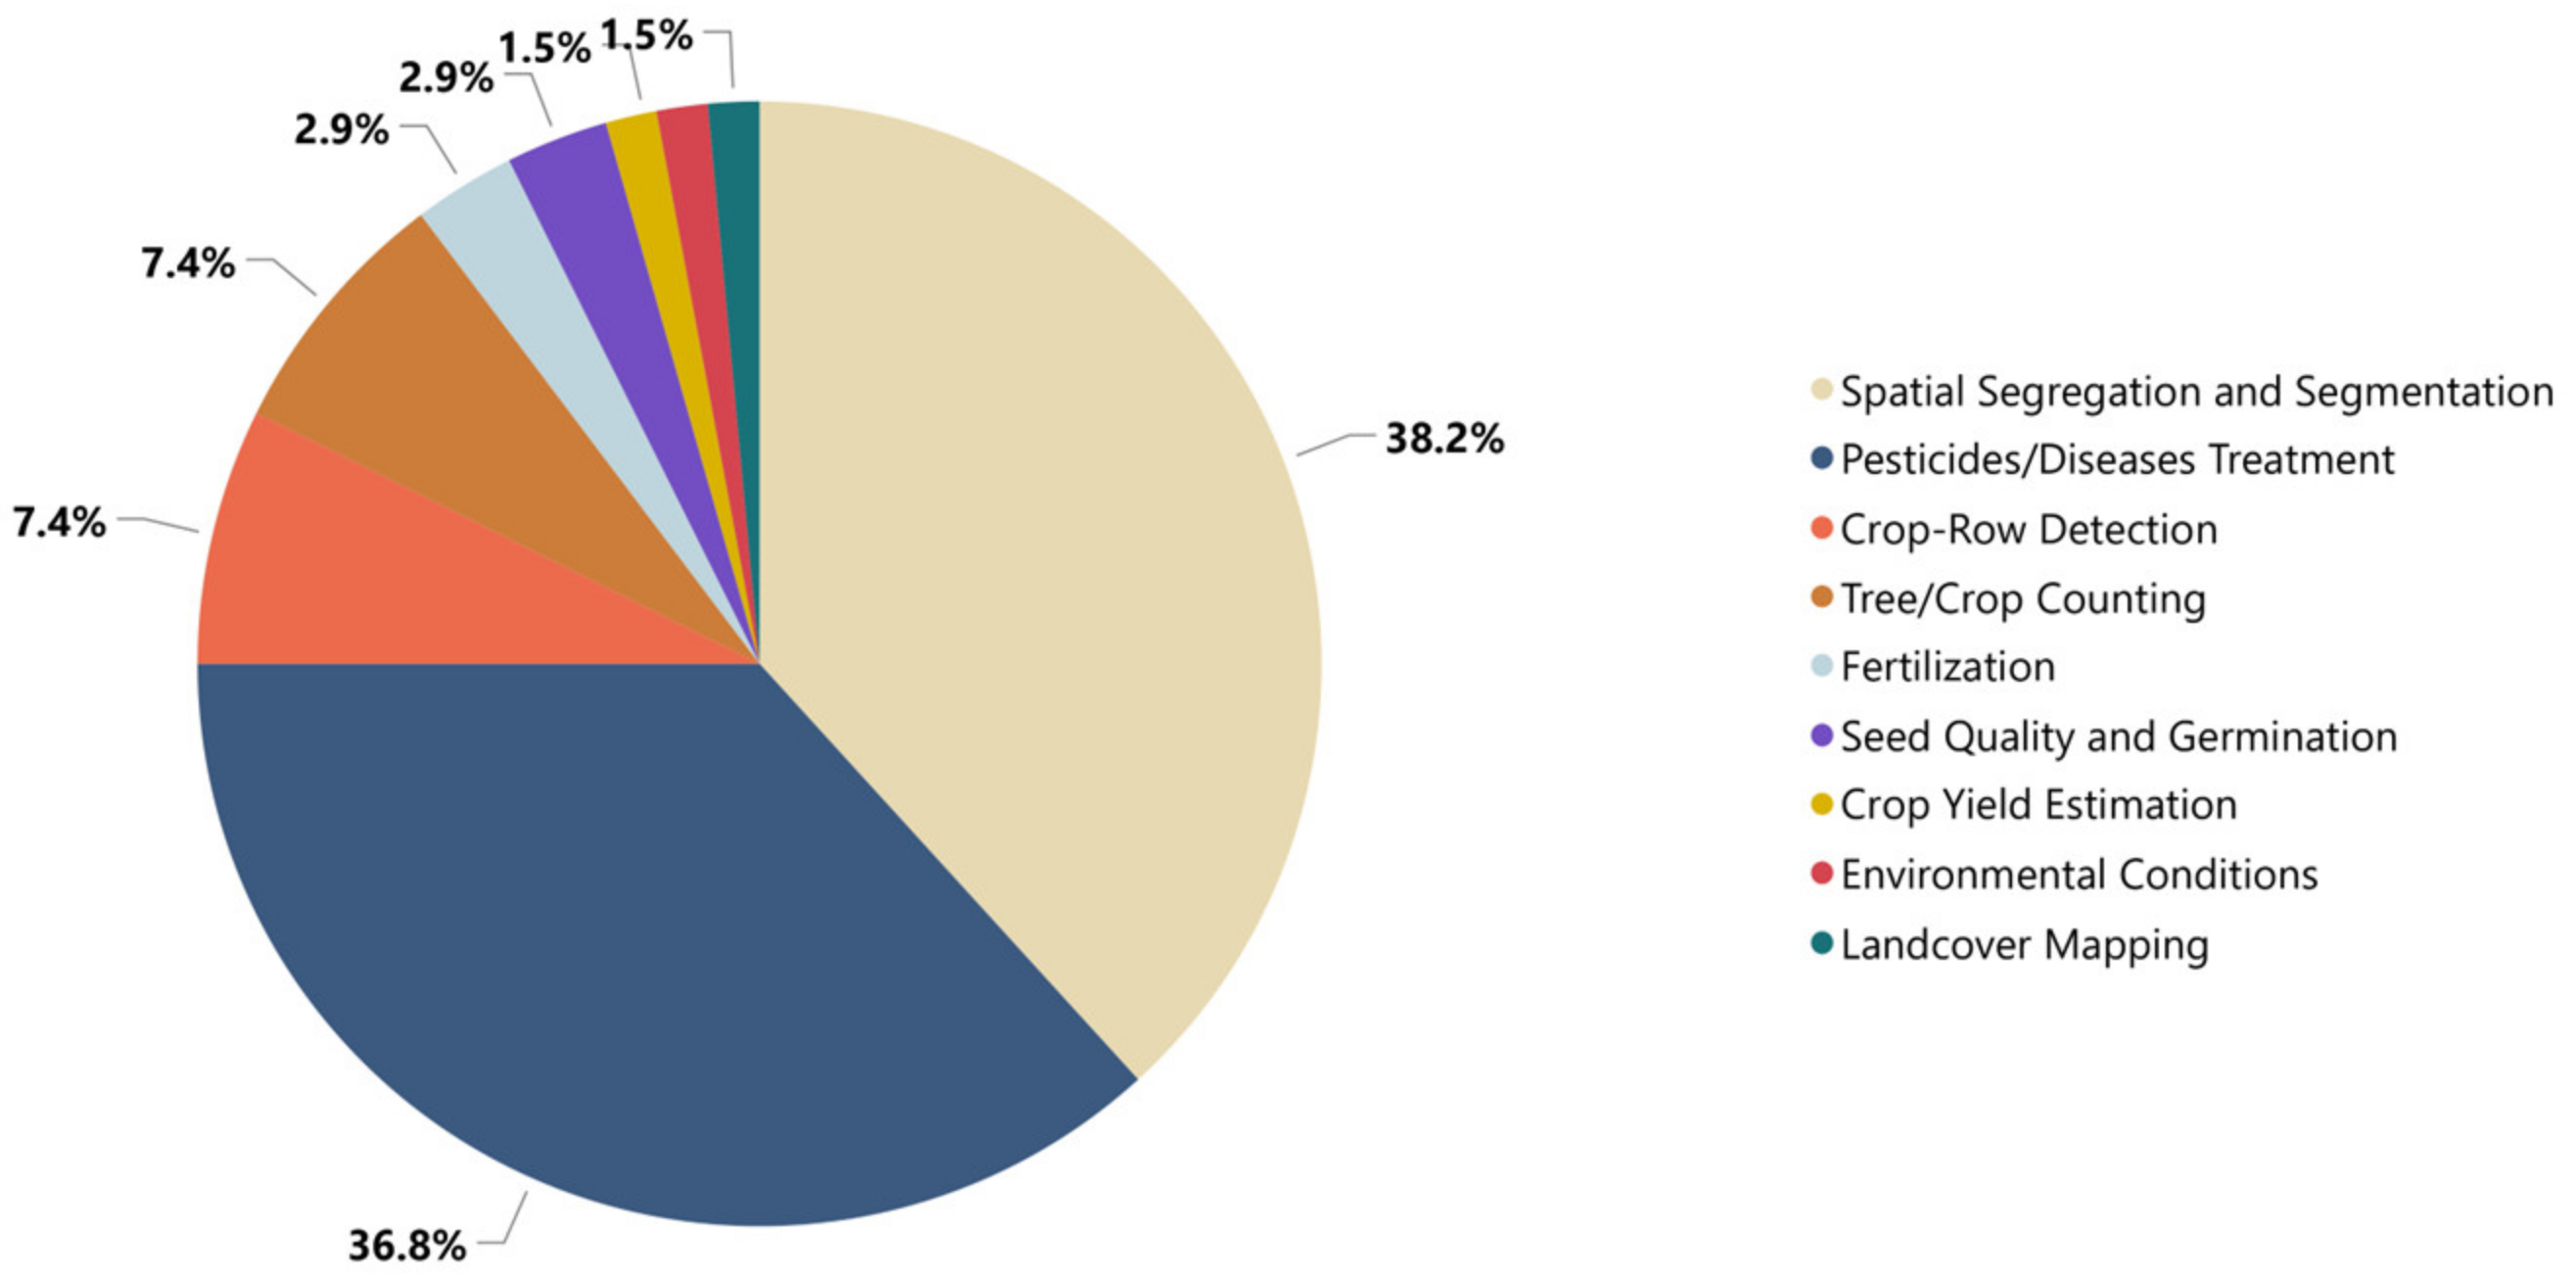
4.3. Vision Tasks Using UAV Data

Precision agriculture applications using UAV image data are based on several computer vision tasks [55]. Image classification is the task of identifying which class the image of an object belongs to. Identification of weeds, for example, can be treated as an image classification task (given the image of a weed, identifying the image as a weed or non-weed). Another example is using image classification to identify different crops [56]. Image classification generally does not require isolating a particular object (e.g., a weed) but is based on observing general features in an image.
Object detection [57] is a related vision task that consists of identifying the location and labels of objects in an image. This task involves creating bounding boxes around objects and then labeling them. For example, for weed counting, one can detect all the weeds in an image and draw bounding boxes around them.
Another vision task is semantic segmentation which tries to identify objects that look similar or different from each other (e.g., weeds, ground, and crops) at the pixel level [58]. For example, Zhang et al. [59] used segmentation to label pixels corresponding to purple rapeseeds to detect nitrogen stress using UAV RGB data.
Lastly, the instance segmentation task combines semantics segmentation and object detection to not only create a bounding box around an object but also to then label each of the pixels of the object to belong to that specific instance. For example, in addition to identifying a weed, instance segmentation would also label each of the pixels of the weed and, hence, would also identify the shape of the weed.

4.4. Evaluation Metrics

Several evaluation metrics have been used to assess and compare the machine learning methods used for the various vision tasks described earlier. This section provides a brief explanation of the most frequently used metrics. Any additional metrics used in a paper are explained in the summary of the respective paper.
  • Accuracy, as shown in Equation (1), is a measure of an algorithm’s ability to make correct predictions. Accuracy is described as the ratio of the sum of true-positive ( T P ) and true-negative ( T N ) predictions to the algorithm’s total number of predictions including false predictions ( F P + F N ) .
    A c c u r a c y = T P + T N T P + T N + F P + F N .
  • Precision, as shown in Equation (2), is a measure of an algorithm’s ability to make correct positive predictions. Precision is described as the ratio of true-positive ( T P ) predictions to the sum of true-positive ( T P ) and false-positive ( F P ) predictions.
    P r e c i s i o n = T P T P + F P .
  • Recall, as shown in Equation (3), measures an algorithm’s ability to identify positive samples. Recall is the ratio of true-positive ( T P ) predictions made by the algorithm to the sum of its true-positive ( T P ) and false-negative ( F N ) predictions.
    R e c a l l = T P T P + F N .
  • F1-score, as shown in Equation (4), is the harmonic mean of precision and recall. A high algorithm F1-score value indicates high accuracy. F1-score is calculated as follows:
    F 1 = 2 × P r e c i s i o n × R e c a l l P r e c i s i o n + R e c a l l .
  • Area under the curve (AUC) is the area under an ROC curve which is a plot of an algorithm’s true-positive rate (TPR) (Equation (5)) vs. its false-positive rate (FPR) (Equation (6)). An algorithm’s true-positive rate can be defined as the ratio of positive samples an algorithm correctly classifies to the total actual positive samples. The false-positive rate, on the other hand, can be defined as the ratio of an algorithm’s false-positive sample classifications to the total actual negative samples.
    T P R = T P T P + F N .
    F P R = F p F p + T N .
  • Intersection over union (IoU), as shown in Equation (7), is an evaluation metric used to assess how accurate a detection algorithm’s output bounding boxes around an object of interest in an image (e.g., a weed) are compared to the ground truth boxes. IoU is the ratio of the intersection area between a bounding box and its associated ground-truth box to their area of union.
    I o U = A r e a   o f   o v e r l a p A r e a   o f   i n t e r s e c t i o n .
  • Mean average precision (mAP), as shown in Equation (8), is used to assess the quality of object detection models. This metric requires finding a model’s average AP across its classes. The calculation of AP requires calculating a model’s precision and recall, followed by drawing its precision–recall curve, and finally, finding the area under the curve.
    AP = 0 1 P R d R       mAP = 1 n k = 1 k = n A P k .
  • Average residual, as shown in Equation (9), is used to assess how erroneous a model is. Average residual displays the average difference between a model’s predictions and ground-truth values.
    Average   Residual = 1 n 1 n p r e d i c t i o n r e a l _ v a l u e .
  • Root-mean-square error (RMSE), as shown in Equation (10), is used to assess an algorithm’s ability to produce numeric predictions that are close to ground-truth values. RMSE is calculated by finding the square root of the average distance between an algorithm’s predictions and their associated truth values.
    R M S E = 1 n p r e d i c t i o n r e a l _ v a l u e 2 n .
  • Mean absolute error (MAE), as shown in Equation (11), is an error metric used to assess how far off an algorithm’s numeric predictions are from truth values. MAE is calculated by finding the average value of the absolute difference between predictions and truth values.
    M A E = 1 n p r e d i c t i o n r e a l _ v a l u e n .
  • Frames per second (FPS) is a measure used to assess how fast a machine learning model is at analyzing and processing images.

5. Survey Results

A total of 70 papers were shortlisted on the basis of the filtering methodology described earlier. These papers used a variety of cameras to capture images from UAVs. The cameras used ranged from low-end cameras such as the Raspberry Pi NoIR camera module to commercial UAV cameras such as the DJI FC6310 with high-resolution imaging capabilities. In addition, consumer cameras such as the 36.4 MP Sony A7R (RGB) camera were also deployed on larger UAVs. As Figure 2 shows, a wide image resolution was used in the papers reviewed here, with image size ranging from 64 × 64 to 7000 × 5000 pixels.
Figure 3 shows the percentage of papers addressing the various precision agriculture issues described in the taxonomy of Liliane and Charles [60]. As Figure 3 shows, spatial segmentation, and pesticide and disease treatment were the primary areas of interest in the reviewed papers.
The results of the filtered papers are organized according to the various machine learning techniques used. Papers using traditional machine learning techniques are discussed first, followed by those utilizing neural networks and deep learning methods.

5.1. Traditional Machine Learning

5.1.1. Support Vector Machines (SVM)

Support vector machines (SVM) were used for classifying vegetation by health status [52], classifying trees by type [61], identifying and classifying weeds to generate weed maps [62], and lastly, segmenting crop rows [53].
Tendolkar et al. [52] proposed the use of an Agrocopter, a multipurpose farming drone, to assess and evaluate plant health status and to take corrective actions. The system assessed plant health on the basis of the NVDI index, texture, and color features of the individual pixels. These features were extracted utilizing a filter bank of 17 Gaussian and Laplacian filters. SVM was then used to perform semantic segmentation on the image pixels and to classify the pixels as healthy or unhealthy. Lastly, a segmented mask was generated and used to find the health ratio of the images according to the ratio of the area of healthy pixels to the total area of the image. The health ratio was then used to classify images into healthy, moderately healthy, and unhealthy. The trained model had 85% precision, 81% recall, and an F1-score of 79%.
Natividade et al. [61] proposed a pattern recognition system (PRS) to identify and classify vegetation using the NDVI scale as a segmentation threshold. An SVM was trained on two datasets: a tree dataset with five classes and a vineyard dataset with three classes. The best models achieved an accuracy of around 72% on the two datasets.
Pérez-Ortiz et al. [62] introduced a UAV-based weed mapping system for the early detection of weeds in crop fields. They used a semi-supervised SVM (SSVM) which aims to find an optimal labeling for the test portion of the data using both labeled and unlabeled data. The system used crop-row detection, vegetation indices, and spectral features to classify pixels in field images as belonging to one of three classes of crop, weed, or soil. Crop-row detection was introduced to improve classifier performance in differentiating crops and weeds because their spectral features were similar. The proposed system took UAV-captured images, partitioned them into 1000 × 1000 pixel images, and then calculated the vegetation index of all image pixels. NDVI was used for multispectral images, and the excess green index (ExG) was employed for visible images. The Otsu thresholding procedure was then applied to the vegetation indices to create thresholds that divided the indices into three classes where the highest vegetation index (VI) pertaining to crops, lower values to weeds, and the lowest values to soil. The image was then binarized by taking crop pixels as 1s and weed and soil pixels as 0s. The binarized image was then fed into the Hough transform (HT) method to detect crop rows in the images. Lastly, a crop-row data feature, along with VI and spectral features, was used to train different machine learning models to classify pixels as soil, crop, or weed. The SSVM returned an MAE of 12.68%.
César Pereira et al. [53] compared the performance of multiple machine learning algorithms for the problem of crop-row segmentation. Their study used a single image of a sugar cane field as its dataset and compared the segmentation results of running this image through different classifiers to a manually labeled image. The manually segmented image’s pixels were classified into the two classes of crop row and background. Spectral features were extracted using ExG and VI, and textural features were extracted through a four-filter Gabor filter bank and a gray-level co-occurrence matrix (GLCM). The feature vectors and color features (RGB) were used to train SVM models. For the linear SVM model, the best combination of features was RGB, EXG, and Gabor filters. This combination yielded an F1-score of 88.01% and an IoU percentage of 78.86%. The worst feature combination was RGB and GLCM. This combination yielded an F1-score of 62.48% and an IoU percentage of 46.08%.
Table 3 shows a summary of the use of SVM with drone image data. Some similarities can be observed. Many (e.g., [52,61,62]) used the NDVI scale to perform pixel-wise classification, while others (e.g., [53,62]) used the ExG index for classification. The authors of [53,61] used a radial basis function kernel to find the optimal hyperplane for separating the dataset classes.

5.1.2. K-Nearest Neighbors (KNN)

The K-nearest neighbor algorithm (KNN) has been used extensively in precision agriculture in land-cover classification [63], sugarcane planting line detection/fault studies [64], and crop-row segmentation [53].
Rodríguez-Garlito and Paz-Gallardo [63] proposed a KNN-based land-cover classification system. This system classified land cover into olive trees, soil, weeds, and shadow. In this system, high-resolution, multispectral images of the studied field were first captured using a UAV. These images went through spatial partitioning to reduce the memory costs of the machine learning algorithm. As a result, processing windows were formed, with each window holding the spectral information of a row of image pixels. The KNN algorithm was then applied to one processing window at a time to perform land-cover classification, and to classify individual pixels into the classes to which they belonged. The trained KNN model had a precision of 95.5%, an accuracy of 91.8%, and an accuracy score of 90.9% on an equally balanced dataset. Similarly, Rocha et al. [64] used KNN to detect gaps in curved sugarcane planting lines from aerial images. The training and test sets were created using RGB images and classified using decision tree, linear discriminant analysis, and KNN. KNN had the best results with a relative error of 1.65%, and it effectively evaluated the planting conditions.
Pereira Júnior et al. [53] studied the use of the KNN algorithm in crop-row segmentation. Two KNN models with two different K values of 3 and 11 were used. Constructing a KNN model with a K value of either 3 or 11 yielded similar results. The models used Euclidean distance and RGB, ExG, and Gabor filters as features, and both models achieved an IoU score of about 76% and an F1-score of about 86%. Results for applying K-NN are summarized in Table 4.

5.1.3. Decision Trees (DT) and Random Forests (RF)

Decision tree classifiers were used in precision agriculture to classify vegetation like trees and vineyards [61]. Similarly, the random forest algorithm was used to classify sugar beet crops and weeds [54].
Natividade et al. [61] used decision trees to detect and classify trees and vineyards in a field, where trees were classified into five distinct types and vineyards into three types. On the tree data set, the best model resulted in 87% precision, 88% recall, and 74% accuracy. On the vineyard data, 87% precision, 90% recall, and 79% accuracy were achieved.
Lottes et al. [54] proposed a crop and weed detection, feature extraction, and classification system that could identify and classify sugar beets and several types of weeds. NDVI and ExG were used as features. A segmented mask based on the VI threshold was then used to extract a spectral feature vector per segmented object in the image and a feature vector per key point in the image. These feature vectors, along with geometric and statistical features, were used to train a random forest model. The Phantom and Matrice-graining datasets contained UAV-captured images of crops and weeds, while the JAI training dataset contained ground-captured images. The Phantom dataset was used to test how well the model could classify vegetation into sugar beet crops, saltbush weeds, chamomile weeds, and other weeds. The model yielded a precision of 85% for both saltbush and chamomile weeds. The recall values were 95% and 87% for saltbush weeds and chamomile weeds, respectively. Lastly, a recall of only 45% was attained for other weeds. The overall accuracy of the model was 86%. When weed-type classification was ignored, and vegetation was classified into two classes, 99% recall and 97% precision were achieved. Table 5 summarizes the two studies that used decision trees.

5.2. Neural Networks and Deep Learning

5.2.1. Convolutional Neural Networks (CNN)

Convolutional neural networks (CNN) have been used extensively in analyzing images for precision agriculture. Specifically, transfer learning has often been used successfully using a variety of pretrained models, including Inception V3 and VGG. For example, Crimaldi et al. [65] used the Inception V3 model and achieved 78.1% accuracy for classifying a crop into one of 14 crop types using data consisting of 54,309 images. Milioto et al. [66] built a CNN model using RGB and NIR camera images. The model had 97.3% accuracy for images of early crop growth and 89.2% accuracy for images of crops in later stages. However, both models had the same recall percentage, with the early stage scoring 98% and the later stage scoring 99%. Similarly, Bah et al. [67] used the AlexNet model on spinach, beet, and beans datasets and achieved precision of 93%, 81%, and 69%, respectively. The authors claimed that the bad results were primarily due to leaves overlapping between crops and weeds. Reddy et al. [68] used a customized CNN model for their work on plant species identification and achieved 99.5% precision for Flavia, Swedish leaf, and UCI leaf datasets. Sembiring et al. [69] focused on tomato plant disease detection. Their proposed model achieved 97.15% validation accuracy using the tomato leaf dataset from Plant Village. However, their model did not achieve the highest validation accuracy among all four trained models. The highest accuracy score of 98.28% was achieved by the VGG16 model. Geetharamani et al. [70] achieved a classification accuracy of 96.46% using a customized nine-layer CNN model. The authors of [71] used a residual learning CNN with an attention mechanism. The goal was to perform real-time corn leaf disease recognition. They also used the Plant Village disease classification challenge dataset [72]. An overall accuracy of 98% was achieved. Nanni et al. [73] used different combinations of CNNs, including ResNet50, GoogleNet, ShuffleNet, MobileNetv2, and DenseNet201, with different Adam optimization methods. These CNN models were trained on three datasets of insect images: the Deng dataset, the IP102 dataset, and the Xie2 dataset. The best-performing CNN achieved state-of-the-art accuracy on both insect datasets: 95.52% on Deng, a score that competed with human expert classifications, and 73.46% on IP102.
Atila et al. [74] proposed using the EfficientNet architecture for plant disease classification on the Plant Village dataset and achieved 99.91% and 99.97% accuracy on original and augmented datasets, respectively. Prasad et al. [75] proposed a two-step machine learning approach that analyzed low-fidelity and high-fidelity images from drones in sequence, preserving the efficiency and accuracy of plant diagnosis. The Pathology 2020 dataset and a set of synthetically generated images were used. A semi-supervised model derived from EfficientNet called EfficientDet was used. The end goal was to perform segmentation and classification. The model scored 75.5% for the average accuracy of the identifier model. Albattah et al. [76] proposed a customized model of using EfficientNet called EfficientNetV2-B4 backbones to address plant disease classification. The Plant Village dataset and additional UAV images were used to train the model. The results were 99.63%, 99.93%, 99.99%, and 99.78% for precision, recall, accuracy, and F1-score, respectively.
Mishra et al. [77] developed a standard CNN model to detect corn plant diseases in real time. The model was deployed on an Intel Movidius NCS and a Raspberry Pi 3b+ module. The authors used the Plant Village disease classification challenge dataset and divided the images into three classes: rust, northern leaf blight, and healthy. The system achieved an accuracy of 98.40% using a GPU and 88.56% on the NCS chip. Bah et al. [78] used unsupervised data labeling for weed detection from UAV images. The dataset consisted of two fields: beans and spinach. Each dataset was divided into the two classes of crop and weed. Two-thirds of the data were labeled in a supervised manner, while one-third were labeled using unsupervised methods. The ResNet18 model was used to perform the classification. ResNet18 significantly outperformed SVM and RF methods in the bean field as it achieved an average AUC of 91.7% on both supervised and unsupervised labeled data in comparison to 52.68% using SVM and 66.7% using RF. On the other hand, RF resulted in a slightly better average AUC% in the spinach field compared to that achieved using ResNet18.
Zheng et al. [79] proposed multiple CNN models to estimate percentage canopy cover and vineyard leaf area index in each field. The authors compared the estimation performance of five different models, including a CNN–ConvLSTM model, a vision transformer model, a joint Model, a CNN model of 71 layers (Xception model), and a ResNet50 model. The five models were trained on a dataset containing approximately 840 images extracted from UAV videos taken of vineyard fields at Alcorn State University. The five models were evaluated using the RMSE of both leaf area index (LAI) and percentage canopy cover. For the prediction of leaf area index, Xception, CNN-ConvLSTM, vision transformer, ResNet50, and the joint model had RMSEs of 0.28, 0.32, 0.34, 0.41, and 0.43, respectively. For predicting percentage canopy cover, Xception, CNN-ConvLSTM, vision transformer, ResNet50, and the joint model had RMSEs of 4.01, 4.50, 4.56, 5.98, and 6.08, respectively. Clearly, Xception performed best in both LAI estimation and percentage canopy cover estimation.
Yang et al. [80] proposed a method of multisource data fusion for disease and pest detection of grape foliage using the ShuffleNet V2 model. The dataset consisted of 834 groups of grape foliage images. Each group contained three types of images of grape foliage: RGB image (RGBI) (2592 × 1944, three channels), multispectral image (MSI) (409 × 216, 25 channels), and thermal infrared image (TIRI) (640 × 512, three channels). The accuracy of MSI was 82.4%, that of RGB was 93.41%, and that of TIRI was 68.26%.
Briechle et al. [81] used multispectral images to classify tree species and standing dead trees. They used the PointNet++ model. The data used were UAV-based light detection and ranging, including laser echo pulse width (LIDAR) data and five-channel MS imagery. They also applied segmentation to the images during the preprocessing of the data. Their model achieved an accuracy of 90.2%.
Aiger et al. [82] proposed a method of image classification based on multi-view image projections. Their method used projections of multiple images at multiple depth planes near the reconstructed surface. This enabled the classification of categories whose most noticeable aspect was appearance change under different viewpoints, such as water, trees, and other materials with complex reflection/light response properties. They obtained the best accuracy of 96.3% on their proposed 3D CNN.
Weinstein et al. [83] developed a semi-supervised model for individual tree detection from UAV imagery. The model used an existing LIDAR algorithm to generate RGB trees that could be used for training as a starting point. The model was then retained using a small number of manual labels to correct errors from the unsupervised detection. Then a pretrained ResNet50 backbone was used to classify the images. The model was tested on the NEON public dataset and achieved the best performance among existing LIDAR-based models (+2%) in comparison to that achieved by Silva et al. [84]. Table 6 shows a summary of convolutional neural networks literature review.

5.2.2. U-Net Architecture

The U-Net architecture was originally introduced in the medical domain by Ronneberger et al. [86] and is commonly used for image segmentation. U-Net follows an encoder–decoder architecture. Many factors, such as the density of the crops, their growth stage, and the flight height of the drone, have an impact on how well a U-Net will perform. According to Kitano et al. [87], U-Net did not perform well when the plants were remarkably close together. However, some techniques could be used to solve this problem, such as using the opening morphological operator [88]
Lin et al. [89] used U-Net to achieve an accuracy of 95.5% and an RMSE of 2.5% with 1000 manually labeled training images. Arun et al. [25] achieved an accuracy of 95.34% and an RMSE of 7.45 using reduced U-Net by designing an efficient pixel-wise classifier for weeds and crops in agricultural field images. Hoummaidi et al. [90] used the U-Net model to perform vegetarian extraction and achieved an overall accuracy of 89.7%. However, palm trees and Ghaf trees had higher detection rates of 96.03% and 94.54%, respectively. The authors justified their results with the fact that trees were obstructed by other trees. Palm trees also caused some errors due to their physical characteristics and the small crown sizes of some trees. The authors suggested that including young palms in the training data could improve the crown size error rate. Doha et al. [91] used the U-Net architecture to detect crop rows by performing semantic segmentation on vertical aerial images. Zhang et al. [92] used the dual-flow U-Net (DF-U-Net) to detect yellow rust severity in farmlands. The dataset was from the Yangling experiment field, which used a red-edge camera on board a DJI M100 UAV with a sensor size of 1336 × 2991. The F1-score, accuracy, and precision scores were 94.13%, 96.93%, and 94.02%, respectively. Sparse channel attention (SCA) was designed to increase the receptive field of the network and improve the ability to distinguish each category. Using U-Net, Lin et al. [89] achieved high accuracy with a small dataset. Similarly, with only 48 images, Tsuichihara et al. [93] achieved an accuracy of about 80% in detecting broad-leaved weeds. Table 7 provides a summary of studies using the U-Net architecture.

5.2.3. Other Segmentation Models

Efficient dense modules of asymmetric convolution (EDANet) is another model that works well for real-time semantic segmentation. Therefore, EDANet can be useful for real-time applications such as UAVs. Yang et al. [94] proposed an EDANet that performs semantic segmentation for detecting rice lodging. Lodging occurs when the stem weakens and the plant falls over. EDANet outperformed many systems because of its efficiency, low computational cost, and model size. The model identified normal rice at 95.28% and lodging at 86.17% accuracy. The model accuracy was improved to 99.25% when less than 2.5% of rice lodging was neglected.
Weyler et al. [95] proposed an ERFNet-based instance segmentation model that segments individual crop leaves in plant imagery to extract relevant phenotyping information and then groups the instances that belong to one crop together. This model made use of two decoders, one of which was used to predict the offset of image pixels from leaf regions, while the other was used to predict the offset of image pixels from plant regions. The two decoder outputs were then used to generate one image with leaf clusters and another with plant clusters. The model was trained on a dataset of 1316 RGB images of sugar beet fields captured by a camera onboard a UAV. The model was evaluated on its ability to perform crop leaf segmentation, as well as full crop segmentation. In crop leaf segmentation, the model was able to achieve an average precision of 48.7% and an average recall of 57.3%. The model achieved an average precision of 60.4% and an average recall of 68% for crop segmentation.
Guo et al. [96] developed a three-stage model to perform plant disease identification for smart farming. The model located the diseased leaves using a region proposal network (RPN) algorithm trained on a leaf dataset in complex environments, after which regression and classification neural networks were used to locate and retrieve the diseased leaves. Later, the Chan-Vese algorithm [97] was used to perform segmentation according to the set zero level set and minimum energy function. Lastly, the diseases were identified using a pretrained transfer learning model. The proposed model outperformed the traditional ResNet101 model significantly, with an accuracy of 83.75% in comparison to 42.5% by the latter.
Sanchez et al. [98] used a multilayer perceptron (MLP) neural network for the early detection of broad-leaved weeds and grass weeds in wide-row crops from UAV imagery. The data were manually collected using a UAV quadcopter equipped with a low-cost RGB camera. Image segmentation was done using the multiresolution segmentation algorithm (MRSA). The model achieved an average overall accuracy of 80.9% on two classes of crops.
Zhang et al. [99] proposed a unified CNN called UniStemNet for joint crop recognition and stem detection in real time. The architecture of UniStemNet is similar to that of Mask-RCNN. The architecture consists of a backbone and two subnets, among which the first performs crop recognition, while the other performs stem detection simultaneously. The backbone consists of five convolutional stages, where the first is a standard CNN with batch normalization, while the other four contain two MobileNet2 inverted residual modules (IRMs). The subnets follow a varied-span feature fusion structure, as each has different detection targets. The evaluation was performed on the open-source CWF-788 dataset, and labels were manually annotated. The model obtained an F1-score of 97.4% and an IoU score of 94.5 in segmentation, which were slightly lower than those achieved by CR-DSS [100]. Nonetheless, the model achieved the best-known results in stem detection with an SDR of 97.8%. A summary of the segmentation models described above is presented in Table 8.

5.2.4. You Only Look Once (YOLO)

You Only Look Once (YOLO) is a real-time object detection neural network model where a single-stage neural network is applied to the full image. The network divides the image into regions and predicts bounding boxes along with probabilities for each region. The use of YOLO in agricultural disease and crop detection has recently been gaining popularity. For example, Chen et al. [101] proposed a UAV to photograph and detect pests and employed a Tiny-YOLOv3 model built on NVIDIA Jetson TX2 to recognize their position in real time. The detected pest positions could later be used to plan optimal pesticide spraying routes, which agricultural UAVs would later follow. The model attained the best mAP score of 95.33% and 89.72% on 640 × 640 pixel test images.
Similarly, Qin et al. [102] proposed a solution for precision crop protection based on a light deep neural network (DNN) called Ag-YOLO consisting of a modified version of ShuffleNet-v2 backbone, a ResBlock neck, and a YOLOv3 head. This model enabled the crop protection UAV to perform embedded real-time pest detection and autonomous spraying of pesticides. The model was tested on the Intel NCS2 hardware accelerator owing to its low weight and low power consumption. The detection system achieved an average F1-score of 92.05%.
Parico et al. [103] proposed YOLO-WEED, a weed detection system trained with 720 annotated UAV images to detect instances of weeds, based on YOLOv3 using NVIDIA GeForce GTX 1060 for green onion crops. They obtained an mAP score of 93.81% and an F1-score of 94%.
Rui et al. [104] proposed a novel comprehensive approach that combined transfer learning based on simulation data and adaptive fusion using YOLOv5 for improved detection of small objects. Their transfer learning and adaptive fusion mechanism led to a 7.1% improvement as compared to the original YOLOv5 model.
Parico et al. [105] proposed a robust real-time pear fruit counter for mobile applications using only RGB data. Various variants of YOLOv4 (YOLOv4, YOLOv4-tiny, and YOLOv4-CSP) were compared. In terms of accuracy, YOLOv4-CSP was the best model, with an AP of 98%. In terms of speed and computational cost, YOLOv4-tiny showed a promising performance at a comparable rate with YOLOv4 at lower network resolutions. If considering the balance in terms of accuracy, speed, and computational cost, YOLOv4 was found to be the most suitable with AP >96%, inference speed of 37.3 FPS, and FN rate of 6%. Thus, YOLOv4-512 was chosen as the detection model for the pear counting system with Deep SORT.
Jintasuttisak et al. [106] exploited the effective use of YOLO-V5 in detecting date palm trees in images captured by a UAV flying above farmlands in the Northern Emirates of the United Arab Emirates (UAE). The results of using YOLO-V5 for date palm tree detection in drone imagery were compared with those obtainable with other popular CNN architectures, YOLOv3, YOLOv4, and SSD300, both quantitatively and qualitatively. The results showed that, for the training data used, the YOLO-V5m (medium depth) model had the highest accuracy, resulting in an mAP of 92.34%. Furthermore, it provided the ability to detect and localize date palm trees of varied sizes in crowded, overlapped environments and areas where the date palm tree distribution was sparse.
Tian et al. [107] proposed an anthracnose lesion detection method based on deep learning. Cycle GAN was used for data augmentation. DenseNet was then utilized to optimize the feature layers of the YOLO-V3 model, which had a lower resolution. The improved model exceeded faster RCNN with VGG16 and the original YOLO-V3 model and could realize real-time detection. The model obtained an F1-score of 81.6% and 91.7% IoU on the entire dataset.
Table 9 presents a summary of methods using YOLO. As the table shows, it is possible to get results above 90% from most YOLO models in a variety of domains.

5.2.5. Single-Shot Detector (SSD)

The single-shot detector (SSD) is a one-stage object detection network that can detect objects in one feed-forward pass with low-resolution input images [108]. The model consists of three different modules. The first is a feature extraction module. This module is made up of a truncated base CNN model that is followed by convolutional layers used for the extraction of features at various scales. The second module is the object detection module which takes in feature maps and runs a set of default bounding boxes on their cells. The result is a defined number of box predictions, all of which have a shape offset and a class confidence score associated with them. The last module is the nonmaximal suppression module which chooses the best predictions out of the set presented by the detection module using a specific value of IoU and confidence score as a threshold. Lately, SSDs have made an appearance in precision agriculture for their ability to perform fast inference and work with low-resolution input images. These two features of SSDs make them desirable in real-time precision agriculture applications.
Veeranampalayam Sivakumar et al. [109] proposed using a single-shot detector to detect mid-to-late season weeds in soybean fields for weed-spread suppression. The authors used a feature extractor from the Inception V2 network and a stack of four extra convolutional layers to extract features at varying scales. The output of this feature extraction module was six feature maps that were then fed into the SSD’s detection module. A set of bounding boxes with five different aspect ratios and six different scales were used on all locations in all six feature maps, resulting in several box-bounded detection predictions, each with its own shape offset and class confidence score. An RMS prop optimizer was used. After training the model over 25,000 epochs, the model achieved a precision of 66%, a recall of 68%, an F1-score of 67%, a mean IoU of 84%, and an inference time of 21 s over 1152 × 1152 image test data.
Ridho and Irwan [110] proposed a strawberry-picking robot that could detect strawberries of different health states in real time. The robot ran an SSD-MobileNet architecture on a single-board computer (SBC) to perform real-time inference. The network used a feature extraction module built with a MobileNet backbone. The choice of MobileNet was prompted by computational power and time restrictions associated with running a real-time inference model on a low-computational power single-board computer. Using transfer learning, the SSD-MobileNet V1 model was previously trained on 91 classes from the COCO dataset. The model was then retrained on two new datasets containing a total of 250 training images of strawberries in good and bad condition. The result of the training returned an accuracy of 90% in detecting good and bad strawberries on image input extracted from a real-time-streamed video. Table 10 presents a summary of SSD methods.

5.2.6. Region-Based Convolutional Neural Networks

The region-based convolutional neural network (RCNN) is a two-stage object detection system that extracts many region proposals from input images, uses a CNN to perform forward propagation on each region proposal to extract its features, and then uses these features to predict the class and bounding box of this region proposal.
Sivakumar et al. [109] proposed an approach where object detection-based CNN models were trained and evaluated using low-altitude UAV images to detect weeds in middle and late seasons in soybean fields. Faster RCNN and SSD were both evaluated and compared in terms of weed detection performance. When faster RCNN was configured with 200 box proposals, its weed detection performance was like the SSD model. The faster RCNN model with 200 box proposals returned a precision of 0.65, a recall of 0.68, an F1-score of 0.66, and an IoU of 0.85. On the other hand, the SSD model returned 0.66, 0.68, 0.67, and 0.84 for precision, recall, F1-score, and IoU, respectively. The performance of a patch-based CNN model was also evaluated and compared to the previous models. The faster RCNN model performed better than the patch-based CNN model. In conclusion, faster RCNN was found to be the best model in terms of weed detection performance and inference time among the different models compared in this study.
Ammar et al. [111] proposed an original deep-learning framework for the automated counting and geolocation of palm trees from aerial images. They applied several recent convolutional neural network models (faster RCNN, YOLOv3, YOLOv4, and EfficientDet) to detect palm trees and other trees and conducted a complete comparative evaluation in terms of average precision and inference speed. YOLOv4 and EfficientDet-D5 yielded the best tradeoff between accuracy and speed (up to 99% mAP and 7.4 FPS).
Su et al. [112] used the Mask-RCNN model for identifying Fusarium head blight disease in wheat spikes and its degree of severity. To perform this task, two Mask-RCNNs performed instance segmentation on the input images, one of which segments individual spikes in the images and the other segments diseased areas of spikes. Thereafter, the severity of the infection on the spikes was evaluated by calculating the ratio of infected spike pixels in the images to the total number of spike pixels. The backbone of this model for feature map extraction was composed of a combination of a ResNet101 model and an FPN model. The model returned a prediction accuracy of 77.19% after comparing the results to a set of manually labeled images.
Yang et al. [113] used an FCN-AlexNet model to perform real-time crop classification using edge computing. The authors collected 224 images using a UAV during the growing period of rice and corn. The quantitative analysis showed that the SegNet model slightly outperformed FCN-AlexNet by 1% in the overall recall rate of object classification.
Menshchikov et al. [114] proposed an approach for fast and accurate detection of hogweed. The approach includes a UAV with an embedded system on board running various fully convolutional neural networks (FCNNs). They proposed an optimal architecture of FCNN for the embedded system relying on the tradeoff between the detection quality and frame rate. In their pilot study, they determined that different architectures could successfully solve the semantic segmentation task for the aerial hogweed detection of two classes. The SegNet model achieved the best ROC AUC with 96.9%. This model could detect hogweed, which was not initially labeled. The modified U-Net architecture was characterized by a high frame rate (up to 0.7 FPS) and a reasonable recognition quality (ROC AUC > 0.938). Along with the low power consumption, the U-Net architecture demonstrated its applicability for real-time scenarios and running on edge-computing devices. One of the U-Net modifications could achieve 0.46 FPS on the NVIDIA Jetson Nano platform with an ROC AUC of 0.958.
Bah et al. [85] proposed a model that combined CNN and the Hough transform to detect crop rows in images taken by a UAV. The model called CRowNet was a combination of SegNet (S-SegNet) and a CNN Hough transform (HoughCNet). The model achieved an accuracy of 93.58% and an IoU of 70%, respectively.
Hosseiny et al. [10] proposed a model with the framework’s core based on a faster regional CNN (RCNN) model with a backbone of ResNet101 for object detection. The proposed framework’s primary idea was to generate unlimited simulated training data from an input image automatically. The authors proposed a fully unsupervised model for plant detection in UAV-acquired pictures of agricultural fields. Two datasets were used with 442 and 328 field patches, respectively. The precision, recall, and F1-score were 0.868, 0.849, and 0.855, respectively. Table 11 shows a summary of papers using two-stage detectors.

5.2.7. Autoencoders

Weyner et al. [115] addressed the problem of automated, instance-level plant monitoring in agricultural fields and breeding plots. They proposed a vision-based approach to perform a joint instance segmentation of crop plants and leaves in breeding plots. They developed a CNN-based encoder–decoder network with lateral skip connections that follows a two-branch architecture with two task-specific decoders to determine the position of specific plant key points and group pixels to detect individual leaf and plant instances. Lastly, they conducted pixel-wise instance segmentation of each crop and its associated leaves based on orthorectified RGB images captured by UAVs. Their method outperformed state-of-the-art instance segmentation approaches such as Mask-RCNN on this task. They achieved the highest score of 0.94 for AP50 at intermediate growth stages compared to 0.71 by Mask-RCNN with respect to the instance segmentation of sugar beet plants.
Lottes et al. [116] presented a novel approach for joint stem detection and crop–weed segmentation using a fully convolutional network (FCN) integrating sequential information. Their proposed architecture enables the sharing of feature computations in the encoder while using two distinct task-specific decoder networks for stem detection and pixel-wise semantic segmentation of the input images. All their experiments were conducted using different generations of the BoniRob platform. BoniRob was built by BOSCH DeepField Robotics as a multipurpose field robot for research and development applications in precision agriculture, such as weed control, plant phenotyping, and soil monitoring. The system achieved the best mAP scores of 85.4%, 66.9%, 42.9%, and 50.1% for Bonn, Stuttgart, Ancona, and Eschikon datasets, respectively, for stem detection and 69.7%, 58.9%, 52.9% and 44.2% mAP scores for Bonn, Stuttgart, Ancona, and Eschikon datasets, respectively, for segmentation.
Su et al. [117] proposed a deep neural network (DNN) that exploits the geometric location of ryegrass for the real-time segmentation of inter-row ryegrass weeds in a wheat field. Their proposed method introduced two subnets in a conventional encoder–decoder style DNN to improve segmentation accuracy. The two subnets treat inter-row and intra-row pixels differently and provide corrections to preliminary segmentation results of the conventional encoder–decoder DNN. A dataset captured in a wheat farm by an agricultural robot at different time instances was used to evaluate the segmentation performance, and the proposed method performed the best among various popular semantic segmentation algorithms (Bonnet, SegNet, PSPNet, DeepLabV3, and U-Net). The proposed method ran at 48.95 FPS with a consumer-level graphics processing unit and, thus, is real-time deployable at a camera frame rate. Their proposed model achieved the best mean accuracy and IoU scores of 96.22% and 64.21%, respectively. Table 12 summarizes the recent works using autoencoders.

5.2.8. Transformers

Vaswani et al. [118] proposed the transformer architecture based on the attention mechanism. A transformer is a sequence transduction model initially designed to tackle natural language processing (NLP) problems. Using transformers for computer vision tasks was limited initially due to the high computational cost of training. To address this issue, Dosovitskiy et al. [119] proposed the vision transformer (ViT) that requires fewer resources while outperforming convolutional networks (CNNs). Other notable contributions include utilizing detection transformers (DETR) targeting the same problem. [120].
Thai et al. [121] used ViTs for the early detection of infected cassava leaves and the classification of their diseases. Initially, they used the ImageNet pretrained ViT model published by the Google Research Team [122]. The model was then tuned using the cassava leaf disease dataset [123]. Later, the model was quantized to reduce its size and accelerate the inference step (FPS) before deploying it on a Raspberry Pi 4 Model B. Their model achieved a 90.3% F1-score in comparison to the best CNN score of 89.2% achieved by the Resnet50 model. Furthermore, they proposed a smart solution powered by the Internet of Things (IoT) that can be used in the agriculture industry for real-time detection of leaf diseases. The system consists of a drone that captures the leaf images, including the exact position of the spot in the field. The ViT model installed on the Drones Pi classifies the images and clusters the infected leaves. The results are then combined with the spot’s position and sent to a server via a 4G network to create a survey map of the field. Farmers and rescue agencies can obtain the map on their mobile phones and prevent the loss of crops beforehand.
Reedha et al. [24] used two different models of ViT for plant classification of UAV images. Images were collected using a drone mounted with a high-resolution camera and deployed in a crop field of beet, parsley, and spinach located in France. The camera captured RGB orthorectified images at regular intervals in the field. The data were manually labeled into five classes: weeds, beet, parsley, spinach, and off-type green leaves. They also employed data augmentation to help improve the robustness of the model and the generalization capabilities of the training dataset. Later, they used ViT-B32 and ViTB16 models. They also tested the training data on EfficientNet and ResNet CNN architectures for comparison purposes. The results showed that ViT models outperformed the CNN models, as F1-scores of 99.4% and 99.2% were obtained from ViT-B16 and ViT-B32, respectively. In comparison, CNN models achieved slightly lower scores of 98.7% for EfficientNet B0, 98.9% for B1, and a close 99.2% using ResNet50. The authors pointed out that although all techniques obtained high accuracy and F1-scores, the classification of crops and weed images using ViTs yielded the best prediction performance. However, the inefficiency of ViT as compared with CNNs is another consideration if the model is to be deployed for real-time processing on a UAV.
Karila et al. [124] used ViT models to estimate grass sward (i.e., short grass) quality and quantity in a field. The datasets were captured in the spring “primary growth phase”, and the same dataset was captured again in the summer “regrowth phase” using a quadcopter drone equipped with two cameras. The first captured RGB images, while the second captured Fabry–Pérot (FPI) images. The results showed that ViT RGB models performed the best on different datasets. Similarly, VGG CNN models provided equally satisfactory results in most cases.
Dersch et al. [125] used a detection transformer (DETR) to detect single trees in high-resolution RGB true orthophotos (TDOPs) and compared it to a YOLOv4 single-stage detector. The multispectral images were collected by a 10-channel camera system with a horizontal field of view. Later, the images were post-processed using structure-from-motion (SFM) software. The data were later manually labeled with a split of 80% training and 20% validation. DETR outperformed YOLOv4 in mixed and deciduous plots with a 20% difference in F1-score in mixed plots and 4% in the latter plots: 86% to 65% and 71% to 67%, respectively. Across all three test plots, both methods had problems with over-segmentation. Furthermore, DETR failed to detect smaller trees far worse than YOLOv4 in multiple cases. The authors justified these poor results by the fact that DETR uses lower-resolution feature maps than that of YOLOv4.
Chen et al. [126] proposed a new efficient deep learning model called the density transformer (DENT) for automatic tree counting from aerial images. The model’s architecture contains four stages: a multi-receptive field CNN (Multi-RF CNN) to compute a feature map over the input images, followed by a standard transformer encoder, and a density map generator (DMG) to predict the density distribution over the input images. They also introduced a benchmark dataset that contains aerial images for tree counting called the Yosemite tree dataset and released it to the public [126]. The model outperformed most state-of-the-art methods with an MAE of 10.7 and an RMSE of 13.7 in comparison to 17.3 and 22.6, respectively, using YOLOv3. It is worth mentioning that the CANNet model [127] achieved the closest values of 10.8 and 13.8, respectively, and achieved a better MAE score in one of four regions than the DENT models.
Lastly, Zhang et al. [128] developed a spectral–spatial attention-based transformer (SSVT) to estimate crop nitrogen status from UAV imagery. The model is an improved version of the standard vision transformer (ViT) that can extract the spatial information of images. The newly proposed model can predict the spectral information which contains most of the features in agricultural applications. The model also tackles the computational complexity of large images that ViT suffers from by adopting a self-supervised learning (SSL) technology to allow models to train with unlabeled data. The results showed that the model with 96.2% accuracy outperformed the ViT model with 94.4% accuracy. However, this model required four million additional parameters compared to those required for a ViT model. Table 13 presents a summary of methods using transformers.

5.2.9. Semi-Supervised Convolutional Neural Networks

Bosilj et al. [130] used the fundamental SegNet architecture to perform pixel-level classification and segmentation of three classes of soil. The input comprised RGB and near-infrared (NIR) images. The authors used a median frequency weighting to avoid unbalanced labeling, as soil pixels are dominant in any given field with respect to crops or weeds. The input data were directly taken in the form of RGB and NIR channels because NDVI preprocessing typically results in minimal differences. The model was trained on three different datasets of sugar beets, carrots, and onions (SB16, CA17, and ON17) in which there were fully labeled examples in one, and partially labeled examples in the other, with pixel-level and object-level training. Object-based detection performed better than pixel-based detection precision-wise. However, pixel-based detection performed better in terms of recall. It is worth noting that the partially labeled ON17 dataset with SB16 weights outperformed the fully labeled dataset. The partially labeled CO17 dataset performed significantly worse than the fully labeled dataset, with a difference of almost 20% on weeds and 5% on crops.

5.2.10. Miscellaneous

Coletta et al. [129] used a semi-supervised classification algorithm that can aggregate information from clusters with those provided by a supervised algorithm such as SVM to discover new classes in an active learning manner. According to the authors, such an ability is largely convenient for inconsistent agricultural environments. The data were collected through a SenseFly eBee equipped with an RGB camera. The model consisted of two blocks: a classification block (ClaB) representing an area of 0.16 m2 to be classified and a contextual block (ConB) providing supplementary context information. Both blocks formed a concentric pair that generates feature vectors to be classified. These vectors were manually labeled as belonging to one of three classes. Then a semi-supervised classifier was used to quantify the uncertainty of classification, and a density measure evaluated the importance of a classified feature vector. If the instances resulted in highly uncertain labels, they were denoted as novelties to be learned, which were labeled later by an entropy- and density-based selection (EDS) domain expert and incorporated into the training set. The results showed that the all-class accuracy and recall improved iteratively.
Li et al. [131] used a radial basis function neural network (RBFNN) to predict farmland moisture accurately. In their work, they deployed a high-precision infrared sensor mounted on a UAV to collect discrete-time images of farmland for later analysis and used 20 uniformly distributed soil moisture sensors to extract ground-truth data. To extract relevant information from the images, the authors used an image preprocessing pipeline that included adaptive median filtering, mean filtering, and edge information extraction using the Canny edge detection algorithms. Principal component analysis (PCA) was thereafter used for dimensionality reduction, and its effect was studied by comparing the original model trained on the full dataset with the model trained on the dataset resulting from PCA. The evaluation results showed that the performance of the two models was similar, with the original achieving an R-squared score of 0.92176 and a mean percentage error (MPE) of 0.063, and the PCA-RBFNN model achieving an R-squared of 0.90157 and an MPE of 0.061. Ultimately, it could be concluded that applying PCA helped reduce the model’s workload while maintaining similar accuracy.

6. Discussion and Future Work

6.1. Machine Learning Techniques

In general, SVMs did not work well in comparison to deep learning approaches. The authors of [52,53,61,62,132] used SVMs to classify crops/weeds in agricultural fields. Most of the results showed low accuracies. This can be because SVMs underperform when there is no clear margin of difference between the different classes, which is usually the case in agricultural imagery, even with the images being preprocessed. In addition, SVMs are more likely to fail when classes are noisy and overlapping. KNN suffers from similar limitations. The authors of [53,63,64] showed that KNNs performed slightly better than SVMs. Nonetheless, they were still sensitive to noisy data. Random forests (RF) were used in [54,61] and performed better than SVM and KNN in this limited context. However, RF requires a higher computational cost as the algorithm involves multiple decision trees, which makes it challenging to implement on a UAV for real-time predictions. Decision trees and RF also have the problem of overfitting. It is worth mentioning that Coletta et al. [129] used active learning to discover new classes through an SVM technique on semi-labeled data, and the results were promising and reliable. The light detection and learning algorithm was used by Weinstein [83] with a ResNet backbone and also achieved decent results.
CNNs represent a good candidate for solving image-based classification and detection problems in precision agriculture. U-Net models performed well with fewer training samples and provided better performance for segmentation tasks [133]. The authors of [25,89,90,91,92,93,99] showed that U-Net outperformed other CNN models. In addition, Arun et al. [25] showed that U-Net can be further optimized without compromising performance. Other architectures included ResNet, ShuffleNet, ShuffleNetV2, and MobileNet, which all require higher computational costs and are less suitable for real-time UAV applications.
Single-stage detectors such as the YOLO series, CornerNet, and CenterNet improved the detection speed while maintaining high accuracy. Tiny-YOLOv3 worked well in real-time applications due to a small number of parameters, high speed, and efficient computation. The authors of [101,102,103,107] showed that YOLOv3 performed the best among all YOLO models. Using Tiny-YOLOv3 resulted in a slight tradeoff with accuracy, especially in detecting smaller objects. Nonetheless, the overall accuracy remained high. Two-stage detectors such as R-CNN, FPN, and Mask-RCNN performed better than single-stage detectors. The authors of [82,109,110,112,115,116,117] showed that these models outperformed single-stage detectors in terms of recall and accuracy. However, many authors argued that region proposal modules required higher computation and runtime memory footprint, thus making detection slow even on high-end GPUs [102].
Transformers represent a viable approach in agricultural classification tasks using UAV image data. In specific, the ViT model showed promising results. The authors of [24,121,124] compared ViT models with current CNN architectures and showed that both approaches achieved similar results, with ViTs enjoying a slight edge. The DETR model [125] was compared to the YOLO series of models, and both approaches also achieved similar results. However, it was evident that DETR models fell short in detecting smaller trees and crops due to their encoder–decoder nature. DENT was used in [126] and outperformed most current methods. However, the CNN model CANNet achieved better results on the same data.
Generative adversarial networks (GANs) were primarily used to enhance the training process by adding to the manually labeled data in a semi-supervised manner. The authors of [134,135] used semi-supervised GANs (SGAN) and cGAN, respectively. In both studies, GAN architectures were outperformed by CNNs for higher labeling rates.

6.2. Best Techniques for Agricultural Problems

Table 14 shows the current best solutions for each problem and the respective type of learning architecture used. Because of the unavailability of appropriate benchmarks, it is difficult to compare the proposed approaches. However, Table 14 represents the best results achieved using specific datasets. The results generally show that machine learning and deep learning can yield reasonable results for a variety of problems. There is clearly room for improvement in most cases, as the results were sometimes in the range of 80% accuracy.
To put things into perspective, the choice of the technique to be used is highly dependent on the precision agriculture problem at hand. The survey results show that problems that would typically require semantic segmentation from high altitudes such as spatial segregation, crop-row segmentation, or weed detection are usually tackled using an encoder–decoder architecture such as U-Net. On the other hand, problems that can be addressed without excessive features extraction (bounding boxes level) such as pest detection, tree counting, or fertilization can be solved by utilizing single- or two-stage detectors such as YOLO, RCNNs, or other transformer-based techniques. The choice between these options relies on the power consumption and memory footprint limitations. GANs can be employed for enhancement purposes mainly such as obtaining super-resolution images or synthesizing data.
Table 15 shows an overall summary of machine learning techniques using UAV image data for precision agriculture. As the figure shows, supervised, semi-supervised, and unsupervised techniques have been used for a variety of problems.

6.3. Future Work

The current state of practice in deploying UAVs in an agricultural field typically consists of using multiple UAVs or stages. One smaller UAV is used to collect images from the field. Once the images are collected, machine learning algorithms are applied, and the results are used to program another typically larger delivery UAV that applies pesticides, fertilizer, or similar in a smarter fashion. A future vision is to have autonomous agricultural UAVs that can process images onboard and take appropriate actions as necessary. However, current UAVs are resource-constrained, and their performance is limited by energy consumption, memory size, and latency. As a result, it is not practical to use high-resource algorithms to perform detection and classification tasks. Such issues can be addressed by using low-bit architectures, by compressing a dense model, by using an effective model with a small number of parameters, or by using a hardware accelerator that can be deployed on an embedded system-on-chip (SoC) that includes graphic processing units (GPUs) or field-programmable gate arrays (FPGAs) [136].
As the survey showed, many generic CNN backbones (e.g., ResNet18) have been used to address various agricultural problems. However, these backbones are typically pretrained on nonagricultural data and are only fine-tuned on agricultural data. The availability of agricultural benchmarking datasets will help make progress toward creating pretrained backbones for agricultural problems.
Many agricultural problems require semantic segmentation, object recognition, and instance segmentation. As Table 14 shows, single-stage detectors such as YOLOv3 have performed well for object recognition. In addition, two-stage detectors such as FRCNN and specialized architectures such as DENT have relatively better performance. Transformers such as ViT have been used. However, one issue with transformer-based architectures is the higher computational inefficiency as compared to CNNs. Many new approaches to optimize transformers for a more efficient footprint have been proposed [137]. This work is highly relevant for autonomous UAVs that need to perform the inference onboard the UAV. In addition, entirely new architectures such as Hyena [138] that claim sub-quadratic performance when compared with transformers have been proposed. Such new architectures also carry promise when combined with the current object recognition and instance segmentation approaches.
Many surveyed UAV studies used multispectral data as opposed to using just the RGB data. Multispectral data represent a special challenge for UAVs because using a higher number of channels in the input significantly increases the memory requirements, which is not ideal for autonomous UAVs. Building efficient CNNs for multispectral data is a well-researched problem [139]. Transformers are also being used with multispectral data (e.g., [140]). Approaches for segmentation using multispectral data (e.g., [141,142]) have also recently been proposed. The efficient handling of multispectral data when using transformers represents another important research problem for UAV image data.
Lastly, a significant amount of work has been conducted in agriculture using satellite imagery [143]. The appearance of multimodal agricultural data, including synced and UAV images (e.g., [144]) raises the interesting possibility of multimodal systems on a UAV utilizing UGV, UAV, and satellite data in tandem to solve the various agricultural problems more effectively.
From the agricultural problem perspective, many of the problems identified in Table 1 have been addressed using image data from UAVs. However, some problems in the postharvest stage, such as fruit grading, quality retention, and storage environments, may require additional attention.

7. Conclusions

In this survey, over 70 recent papers using UAV agricultural imagery to classify, detect, and segment crops and trees using machine learning algorithms and deep learning models were discussed. Deep learning models such as U-Net, YOLOv3, and ViT performed the best among state-of-the-art approaches. The primary challenges include detecting small trees and interleaved crops, as well as the high-power consumption of complex models. Future work includes developing low-power-consuming and less expensive models that could be deployed on the UAVs to perform real-time or on-edge tasks that can provide faster and more sufficient solutions in the field of precision farming.

Author Contributions

Conceptualization, I.Z.; methodology, I.Z.; software, D.A.A. and M.H.H.; validation, I.Z. and D.A.A.; formal analysis, D.A.A., M.H.H., M.E. and J.K.; investigation, I.Z.; resources, D.A.A., M.H.H., M.E. and J.K.; data curation, D.A.A., M.H.H., M.E. and J.K.; writing—original draft preparation, D.A.A., M.H.H., M.E. and J.K.; writing—review and editing, I.Z., D.A.A., M.H.H., M.E. and J.K.; visualization, D.A.A., M.H.H. and M.E.; supervision, I.Z.; project administration, I.Z. All authors have read and agreed to the published version of the manuscript.

Funding

The work in this paper was supported, in part, by the Open Access Program from the American University of Sharjah. This paper represents the opinions of the author(s) and does not mean to represent the position or opinions of the American University of Sharjah.

Data Availability Statement

No new data were created or analyzed in this study. Data sharing is not applicable to this article.

Conflicts of Interest

The authors declare no conflict of interest.

References

  1. World Food Programme. 2022 Global Report on Food Crises; World Food Programme: Rome, Italy, 2022; p. 277. [Google Scholar]
  2. Ayoub Shaikh, T.; Rasool, T.; Rasheed Lone, F. Towards leveraging the role of machine learning and artificial intelligence in precision agriculture and smart farming. Comput. Electron. Agric. 2022, 198, 107119. [Google Scholar] [CrossRef]
  3. Mylonas, I.; Stavrakoudis, D.; Katsantonis, D.; Korpetis, E. Chapter 1—Better farming practices to combat climate. In Climate Change and Food Security with Emphasis on Wheat; Academic Press: Cambridge, MA, USA, 2020; pp. 1–29. [Google Scholar] [CrossRef]
  4. Wolińska, A. Metagenomic Achievements in Microbial Diversity Determination in Croplands: A Review. In Microbial Diversity in the Genomic Era; Das, S., Dash, H.R., Eds.; Academic Press: Cambridge, MA, USA, 2019; pp. 15–35. ISBN 978-0-12-814849-5. [Google Scholar]
  5. Mohamed, Z.; Terano, R.; Sharifuddin, J.; Rezai, G. Determinants of Paddy Farmer’s Unsustainability Farm Practices. Agric. Agric. Sci. Procedia 2016, 9, 191–196. [Google Scholar] [CrossRef] [Green Version]
  6. Krishna, K.R. Push Button Agriculture: Robotics, Drones, Satellite-Guided Soil and Crop Management; CRC Press: Boca Raton, FL, USA, 2017. [Google Scholar]
  7. ISPA. Precision Ag Definition. International Society of Precision Agriculture. Available online: https://www.ispag.org/about/definition (accessed on 14 July 2022).
  8. Singh, P.; Pandey, P.C.; Petropoulos, G.P.; Pavlides, A.; Srivastava, P.K.; Koutsias, N.; Deng, K.A.K.; Bao, Y. 8—Hyperspectral remote sensing in precision agriculture: Present status, challenges, and future trends. In Hyperspectral Remote Sensing; Pandey, P.C., Srivastava, P.K., Balzter, H., Bhattacharya, B., Petropoulos, G.P., Eds.; Earth Observation; Elsevier: Amsterdam, The Netherlands, 2020; pp. 121–146. ISBN 978-0-08-102894-0. [Google Scholar]
  9. Cisternas, I.; Velásquez, I.; Caro, A.; Rodríguez, A. Systematic literature review of implementations of precision agriculture. Comput. Electron. Agric. 2020, 176, 105626. [Google Scholar] [CrossRef]
  10. Hosseiny, B.; Rastiveis, H.; Homayouni, S. An Automated Framework for Plant Detection Based on Deep Simulated Learning from Drone Imagery. Remote Sens. 2020, 12, 3521. [Google Scholar] [CrossRef]
  11. Aburasain, R.Y.; Edirisinghe, E.A.; Albatay, A. Palm Tree Detection in Drone Images Using Deep Convolutional Neural Networks: Investigating the Effective Use of YOLO V3. In Digital Interaction and Machine Intelligence, Proceedings of the MIDI’202—8th Machine Intelligence and Digital Interaction Conference, Warsaw, Poland, 9–10 December 2020; Biele, C., Kacprzyk, J., Owsiński, J.W., Romanowski, A., Sikorski, M., Eds.; Springer International Publishing: Cham, Switzerland, 2021; pp. 21–36. [Google Scholar]
  12. Lu, Y.; Young, S. A survey of public datasets for computer vision tasks in precision agriculture. Comput. Electron. Agric. 2020, 178, 105760. [Google Scholar] [CrossRef]
  13. Shafi, U.; Mumtaz, R.; García-Nieto, J.; Hassan, S.A.; Zaidi, S.A.R.; Iqbal, N. Precision Agriculture Techniques and Practices: From Considerations to Applications. Sensors 2019, 19, 3796. [Google Scholar] [CrossRef] [PubMed] [Green Version]
  14. Kamilaris, A.; Prenafeta-Boldú, F.X. A review of the use of convolutional neural networks in agriculture. J. Agric. Sci. 2018, 156, 312–322. [Google Scholar] [CrossRef] [Green Version]
  15. Chengjuan Ren, D.-K.K.; Jeong, D. A Survey of Deep Learning in Agriculture: Techniques and Their Applications. J. Inf. Process. Syst. 2020, 16, 1015–1033. [Google Scholar] [CrossRef]
  16. Meshram, V.; Patil, K.; Meshram, V.; Hanchate, D.; Ramkteke, S.D. Machine learning in agriculture domain: A state-of-art survey. Artif. Intell. Life Sci. 2021, 1, 100010. [Google Scholar] [CrossRef]
  17. Shin, J.; Mahmud, M.S.; Rehman, T.U.; Ravichandran, P.; Heung, B.; Chang, Y.K. Trends and Prospect of Machine Vision Technology for Stresses and Diseases Detection in Precision Agriculture. AgriEngineering 2023, 5, 3. [Google Scholar] [CrossRef]
  18. Radoglou-Grammatikis, P.; Sarigiannidis, P.; Lagkas, T.; Moscholios, I. A compilation of UAV applications for precision agriculture. Comput. Netw. 2020, 172, 107148. [Google Scholar] [CrossRef]
  19. Aslan, M.F.; Durdu, A.; Sabanci, K.; Ropelewska, E.; Gültekin, S.S. A Comprehensive Survey of the Recent Studies with UAV for Precision Agriculture in Open Fields and Greenhouses. Appl. Sci. 2022, 12, 1047. [Google Scholar] [CrossRef]
  20. FAO. News Article: New Standards to Curb the Global Spread of Plant Pests and Diseases. Available online: https://www.fao.org/news/story/en/item/1187738/icode/ (accessed on 21 July 2022).
  21. Khakimov, A.; Salakhutdinov, I.; Omonlikov, A.; Utagnov, S. Traditional and Current-Prospective Methods of Agricultural Plant Diseases Detection: A Review. IOP Conf. Ser. Earth Environ. Sci. 2022, 951, 012002. [Google Scholar] [CrossRef]
  22. Fang, Y.; Ramasamy, R.P. Current and Prospective Methods for Plant Disease Detection. Biosensors 2015, 5, 537–561. [Google Scholar] [CrossRef] [Green Version]
  23. Ecological Understanding of Insects in Organic Farming Systems: How Insects Damage Plants. eOrganic. Available online: https://eorganic.org/node/3151 (accessed on 21 July 2022).
  24. Reedha, R.; Dericquebourg, E.; Canals, R.; Hafiane, A. Transformer Neural Network for Weed and Crop Classification of High Resolution UAV Images. Remote Sens. 2022, 14, 592. [Google Scholar] [CrossRef]
  25. Arun, R.A.; Umamaheswari, S.; Jain, A.V. Reduced U-Net Architecture for Classifying Crop and Weed Using Pixel-Wise Segmentation. In Proceedings of the 2020 IEEE International Conference for Innovation in Technology (INOCON), Bangluru, India, 6–8 November 2020; pp. 1–6. [Google Scholar]
  26. Sharma, A.; Kumar, V.; Shahzad, B.; Tanveer, M.; Sidhu, G.P.S.; Handa, N.; Kohli, S.K.; Yadav, P.; Bali, A.S.; Parihar, R.D.; et al. Worldwide pesticide usage and its impacts on ecosystem. SN Appl. Sci. 2019, 1, 1446. [Google Scholar] [CrossRef] [Green Version]
  27. Rai, M.; Ingle, A. Role of nanotechnology in agriculture with special reference to management of insect pests. Appl. Microbiol. Biotechnol. 2012, 94, 287–293. [Google Scholar] [CrossRef]
  28. Pest Control Efficiency in Agriculture—Futurcrop. Available online: https://www.futurcrop.com/en/es/blog/post/efficacy-of-plant-protection-products/ (accessed on 28 July 2022).
  29. Tigges, J.; Lakes, T.; Hostert, P. Urban vegetation classification: Benefits of multitemporal RapidEye satellite data. Remote Sens. Environ. 2013, 136, 66–75. [Google Scholar] [CrossRef]
  30. Weng, Q.; Quattrochi, D.A.; Carlson, T.N. Remote sensing of urban environments: Special issue. Remote Sens. Environ. 2021, 117, 1–2. [Google Scholar] [CrossRef]
  31. IowaAgLiteracy. Why Do They Do That?—Estimating Yields; Iowa Agriculture Literacy: West Des Moines, IA, USA, 2019. [Google Scholar]
  32. Horie, T.; Yajima, M.; Nakagawa, H. Yield forecasting. Agric. Syst. 1992, 40, 211–236. [Google Scholar] [CrossRef]
  33. Crop Yield. Investopedia. Available online: https://www.investopedia.com/terms/c/crop-yield.asp (accessed on 21 July 2022).
  34. Altalak, M.; Ammad uddin, M.; Alajmi, A.; Rizg, A. Smart Agriculture Applications Using Deep Learning Technologies: A Survey. Appl. Sci. 2022, 12, 5919. [Google Scholar] [CrossRef]
  35. Prange, R.K. Pre-harvest, harvest and post-harvest strategies for organic production of fruits and vegetables. Acta Hortic. 2012, 933, 43–50. [Google Scholar] [CrossRef]
  36. Mitchell, J.P.; Shennan, C.; Grattan, S.R.; May, D.M. Tomato Fruit Yields and Quality under Water Deficit and Salinity. J. Am. Soc. Hortic. Sci. 1991, 116, 215–221. [Google Scholar] [CrossRef] [Green Version]
  37. Atay, E.; Hucbourg, B.; Drevet, A.; Lauri, P.-E. Investigating effects of over-irrigation and deficit irrigation on yield and fruit quality in pink ladytm “rosy glow” apple. Acta Sci. Pol. Hortorum Cultus 2017, 16, 45–51. [Google Scholar] [CrossRef]
  38. Li, X.; Ba, Y.; Zhang, M.; Nong, M.; Yang, C.; Zhang, S. Sugarcane Nitrogen Concentration and Irrigation Level Prediction Based on UAV Multispectral Imagery. Sensors 2022, 22, 2711. [Google Scholar] [CrossRef] [PubMed]
  39. Tuan, P.A.; Sun, M.; Nguyen, T.-N.; Park, S.; Ayele, B.T. 1—Molecular mechanisms of seed germination. In Sprouted Grains; Feng, H., Nemzer, B., DeVries, J.W., Eds.; AACC International Press: Washington, DC, USA, 2019; pp. 1–24. ISBN 978-0-12-811525-1. [Google Scholar]
  40. El-Maarouf-Bouteau, H. The Seed and the Metabolism Regulation. Biology 2022, 11, 168. [Google Scholar] [CrossRef]
  41. Vidak, M.; Lazarević, B.; Javornik, T.; Šatović, Z.; Carović-Stanko, K. Seed Water Absorption, Germination, Emergence and Seedling Phenotypic Characterization of the Common Bean Landraces Differing in Seed Size and Color. Seeds 2022, 1, 27. [Google Scholar] [CrossRef]
  42. Lin, Y.; Chen, T.; Liu, S.; Cai, Y.; Shi, H.; Zheng, D.; Lan, Y.; Yue, X.; Zhang, L. Quick and accurate monitoring peanut seedlings emergence rate through UAV video and deep learning. Comput. Electron. Agric. 2022, 197, 106938. [Google Scholar] [CrossRef]
  43. Aden, S.; Bialas, J.; Champion, Z.; Levin, E.; McCarty, J.L. Low cost infrared and near infrared sensors for UAVS. Int. Arch. Photogramm. Remote Sens. Spat. Inf. Sci. 2014, XL-1, 1–7. [Google Scholar] [CrossRef] [Green Version]
  44. Arah, I.K.; Amaglo, H.; Kumah, E.K.; Ofori, H. Preharvest and Postharvest Factors Affecting the Quality and Shelf Life of Harvested Tomatoes: A Mini Review. Int. J. Agron. 2015, 2015, 478041. [Google Scholar] [CrossRef] [Green Version]
  45. What Methods Can Improve Crop Performance? Royal Society. Available online: https://royalsociety.org/topics-policy/projects/gm-plants/what-methods-other-than-genetic-improvement-can-improve-crop-performance/ (accessed on 29 July 2022).
  46. Takamatsu, T.; Kitagawa, Y.; Akimoto, K.; Iwanami, R.; Endo, Y.; Takashima, K.; Okubo, K.; Umezawa, M.; Kuwata, T.; Sato, D.; et al. Over 1000 nm Near-Infrared Multispectral Imaging System for Laparoscopic In Vivo Imaging. Sensors 2021, 21, 2649. [Google Scholar] [CrossRef]
  47. Sellami, A.; Tabbone, S. Deep neural networks-based relevant latent representation learning for hyperspectral image classification. Pattern Recognit. 2022, 121, 108224. [Google Scholar] [CrossRef]
  48. Multispectral Image—An Overview. ScienceDirect Topics. Available online: https://www.sciencedirect.com/topics/earth-and-planetary-sciences/multispectral-image (accessed on 13 December 2022).
  49. Seager, S.; Turner, E.L.; Schafer, J.; Ford, E.B. Vegetation’s Red Edge: A Possible Spectroscopic Biosignature of Extraterrestrial Plants. Astrobiology 2005, 5, 372–390. [Google Scholar] [CrossRef] [PubMed]
  50. Color-Infrared (CIR) Imagery.MN IT Services. Available online: https://www.mngeo.state.mn.us/chouse/airphoto/cir.html (accessed on 13 December 2022).
  51. Jang, G.; Kim, J.; Yu, J.-K.; Kim, H.-J.; Kim, Y.; Kim, D.-W.; Kim, K.-H.; Lee, C.W.; Chung, Y.S. Review: Cost-Effective Unmanned Aerial Vehicle (UAV) Platform for Field Plant Breeding Application. Remote Sens. 2020, 12, 998. [Google Scholar] [CrossRef] [Green Version]
  52. Tendolkar, A.; Choraria, A.; Manohara Pai, M.M.; Girisha, S.; Dsouza, G.; Adithya, K.S. Modified crop health monitoring and pesticide spraying system using NDVI and Semantic Segmentation: An AGROCOPTER based approach. In Proceedings of the 2021 IEEE International Conference on Autonomous Systems (ICAS), Montreal, QC, Canada, 11–13 August 2021; pp. 1–5. [Google Scholar]
  53. Júnior, P.C.P.; Monteiro, A.; Ribeiro, R.D.L.; Sobieranski, A.C.; Wangenheim, A.V. Comparison of Supervised Classifiers and Image Features for Crop Rows Segmentation on Aerial Images. Appl. Artif. Intell. 2020, 34, 271–291. [Google Scholar] [CrossRef]
  54. Lottes, P.; Khanna, R.; Pfeifer, J.; Siegwart, R.; Stachniss, C. UAV-based crop and weed classification for smart farming. In Proceedings of the 2017 IEEE International Conference on Robotics and Automation (ICRA), Singapore, 29 May–3 June 2017; pp. 3024–3031. [Google Scholar]
  55. Lakshmanan, V.; Görner, M.; Gillard, R. Practical Machine Learning for Computer Vision; O’Reilly Media, Inc.: Sebastopol, CA, USA, 2021. [Google Scholar]
  56. Bouguettaya, A.; Zarzour, H.; Kechida, A.; Taberkit, A.M. Deep learning techniques to classify agricultural crops through UAV imagery: A review. Neural Comput. Appl. 2022, 34, 9511–9536. [Google Scholar] [CrossRef] [PubMed]
  57. Zaidi, S.S.A.; Ansari, M.S.; Aslam, A.; Kanwal, N.; Asghar, M.; Lee, B. A survey of modern deep learning based object detection models. Digit. Signal Process. 2022, 126, 103514. [Google Scholar] [CrossRef]
  58. Tian, D.; Han, Y.; Wang, B.; Guan, T.; Gu, H.; Wei, W. Review of object instance segmentation based on deep learning. JEI 2021, 31, 041205. [Google Scholar] [CrossRef]
  59. Zhang, J.; Xie, T.; Yang, C.; Song, H.; Jiang, Z.; Zhou, G.; Zhang, D.; Feng, H.; Xie, J. Segmenting Purple Rapeseed Leaves in the Field from UAV RGB Imagery Using Deep Learning as an Auxiliary Means for Nitrogen Stress Detection. Remote Sens. 2020, 12, 1403. [Google Scholar] [CrossRef]
  60. Liliane, T.N.; Charles, M.S. Factors Affecting Yield of Crops; IntechOpen: London, UK, 2020; ISBN 978-1-83881-223-2. [Google Scholar]
  61. Natividade, J.; Prado, J.; Marques, L. Low-cost multi-spectral vegetation classification using an Unmanned Aerial Vehicle. In Proceedings of the 2017 IEEE International Conference on Autonomous Robot Systems and Competitions (ICARSC), Coimbra, Portugal, 26–28 April 2017; pp. 336–342. [Google Scholar]
  62. Pérez-Ortiz, M.; Peña, J.M.; Gutiérrez, P.A.; Torres-Sánchez, J.; Hervás-Martínez, C.; López-Granados, F. A semi-supervised system for weed mapping in sunflower crops using unmanned aerial vehicles and a crop row detection method. Appl. Soft Comput. 2015, 37, 533–544. [Google Scholar] [CrossRef]
  63. Rodríguez-Garlito, E.C.; Paz-Gallardo, A. Efficiently Mapping Large Areas of Olive Trees Using Drones in Extremadura, Spain. IEEE J. Miniat. Air Space Syst. 2021, 2, 148–156. [Google Scholar] [CrossRef]
  64. Rocha, B.M.; da Silva Vieira, G.; Fonseca, A.U.; Pedrini, H.; de Sousa, N.M.; Soares, F. Evaluation and Detection of Gaps in Curved Sugarcane Planting Lines in Aerial Images. In Proceedings of the 2020 IEEE Canadian Conference on Electrical and Computer Engineering (CCECE), London, ON, Canada, 30 August–2 September 2020; pp. 1–4. [Google Scholar]
  65. Crimaldi, M.; Cristiano, V.; De Vivo, A.; Isernia, M.; Ivanov, P.; Sarghini, F. Neural Network Algorithms for Real Time Plant Diseases Detection Using UAVs. In Innovative Biosystems Engineering for Sustainable Agriculture, Forestry and Food Production, Proceedings of the International Mid-Term Conference 2019 of the Italian Association of Agricultural Engineering (AIIA), Matera, Italy, 12–13 September 2019; Coppola, A., Di Renzo, G.C., Altieri, G., D’Antonio, P., Eds.; Springer International Publishing: Cham, Switzerland, 2020; pp. 827–835. [Google Scholar]
  66. Milioto, A.; Lottes, P.; Stachniss, C. Real-Time Blob-Wise Sugar Beets vs Weeds Classification for Monitoring Fields Using Convolutional Neural Networks. ISPRS Ann. Photogramm. Remote Sens. Spat. Inf. Sci. 2017, IV-2/W3, 41–48. [Google Scholar] [CrossRef] [Green Version]
  67. Bah, M.D.; Dericquebourg, E.; Hafiane, A.; Canals, R. Deep Learning Based Classification System for Identifying Weeds Using High-Resolution UAV Imagery. In Intelligent Computing; Arai, K., Kapoor, S., Bhatia, R., Eds.; Advances in Intelligent Systems and Computing; Springer International Publishing: Cham, Switzerland, 2019; Volume 857, pp. 176–187. ISBN 978-3-030-01176-5. [Google Scholar]
  68. Reddy, S.R.G.; Varma, G.P.S.; Davuluri, R.L. Optimized convolutional neural network model for plant species identification from leaf images using computer vision. Int. J. Speech Technol. 2023, 26, 23–50. [Google Scholar] [CrossRef]
  69. Sembiring, A.; Away, Y.; Arnia, F.; Muharar, R. Development of Concise Convolutional Neural Network for Tomato Plant Disease Classification Based on Leaf Images. J. Phys. Conf. Ser. 2021, 1845, 012009. [Google Scholar] [CrossRef]
  70. Geetharamani, G.; Arun Pandian, J. Identification of plant leaf diseases using a nine-layer deep convolutional neural network. Comput. Electr. Eng. 2019, 76, 323–338. [Google Scholar]
  71. Karthik, R.; Hariharan, M.; Anand, S.; Mathikshara, P.; Johnson, A.; Menaka, R. Attention embedded residual CNN for disease detection in tomato leaves. Appl. Soft Comput. 2020, 86, 105933. [Google Scholar] [CrossRef]
  72. Mohanty, S.P. PlantVillage-Dataset. 19 May 2023. Available online: https://github.com/spMohanty/PlantVillage-Dataset (accessed on 30 April 2023).
  73. Nanni, L.; Manfè, A.; Maguolo, G.; Lumini, A.; Brahnam, S. High performing ensemble of convolutional neural networks for insect pest image detection. Ecol. Inform. 2022, 67, 101515. [Google Scholar] [CrossRef]
  74. Atila, Ü.; Uçar, M.; Akyol, K.; Uçar, E. Plant leaf disease classification using EfficientNet deep learning model. Ecol. Inform. 2021, 61, 101182. [Google Scholar] [CrossRef]
  75. Prasad, A.; Mehta, N.; Horak, M.; Bae, W.D. A two-step machine learning approach for crop disease detection: An application of GAN and UAV technology. Remote Sens. 2022, 14, 4765. [Google Scholar] [CrossRef]
  76. Albattah, W.; Javed, A.; Nawaz, M.; Masood, M.; Albahli, S. Artificial Intelligence-Based Drone System for Multiclass Plant Disease Detection Using an Improved Efficient Convolutional Neural Network. Front. Plant Sci. 2022, 13, 808380. [Google Scholar] [CrossRef]
  77. Mishra, S.; Sachan, R.; Rajpal, D. Deep Convolutional Neural Network based Detection System for Real-Time Corn Plant Disease Recognition. Procedia Comput. Sci. 2020, 167, 2003–2010. [Google Scholar] [CrossRef]
  78. Bah, M.D.; Hafiane, A.; Canals, R. Deep Learning with Unsupervised Data Labeling for Weed Detection in Line Crops in UAV Images. Remote Sens. 2018, 10, 1690. [Google Scholar] [CrossRef] [Green Version]
  79. Zheng, Y.; Sarigul, E.; Panicker, G.; Stott, D. Vineyard LAI and canopy coverage estimation with convolutional neural network models and drone pictures. In Sensing for Agriculture and Food Quality and Safety XIV, Proceedings of the SPIE Defense + Commercial Sensing, Orlando, FL, USA, 3 April–13 June 2022; SPIE: Bellingham, WA, USA, 2022; Volume 12120, pp. 29–38. [Google Scholar]
  80. Yang, R.; Lu, X.; Huang, J.; Zhou, J.; Jiao, J.; Liu, Y.; Liu, F.; Su, B.; Gu, P. A Multi-Source Data Fusion Decision-Making Method for Disease and Pest Detection of Grape Foliage Based on ShuffleNet V2. Remote Sens. 2021, 13, 5102. [Google Scholar] [CrossRef]
  81. Briechle, S.; Krzystek, P.; Vosselman, G. Classification of tree species and standing dead trees by fusing UAV-based LiDAR data and multispectral imagery in the 3D deep neural network pointnet++. ISPRS Ann. Photogramm. Remote Sens. Spat. Inf. Sci. 2020, V-2–2020, 203–210. [Google Scholar] [CrossRef]
  82. Aiger, D.; Allen, B.; Golovinskiy, A. Large-Scale 3D Scene Classification with Multi-View Volumetric CNN. arXiv 2017. [Google Scholar] [CrossRef]
  83. Weinstein, B.G.; Marconi, S.; Bohlman, S.; Zare, A.; White, E. Individual Tree-Crown Detection in RGB Imagery Using Semi-Supervised Deep Learning Neural Networks. Remote Sens. 2019, 11, 1309. [Google Scholar] [CrossRef] [Green Version]
  84. Silva, C.; Hudak, A.; Vierling, L.; Louise Loudermilk, E.; O’Brien, J.; Kevin Hiers, J.; Jack, S.; Gonzalez-Benecke, C.; Lee, H.; Falkowski, M.; et al. Imputation of Individual Longleaf Pine (Pinus palustris Mill.) Tree Attributes from Field and LiDAR Data. Can. J. Remote Sens. 2016, 42, 554–573. [Google Scholar] [CrossRef]
  85. Bah, M.D.; Hafiane, A.; Canals, R. CRowNet: Deep Network for Crop Row Detection in UAV Images. IEEE Access 2020, 8, 5189–5200. [Google Scholar] [CrossRef]
  86. Ronneberger, O.; Fischer, P.; Brox, T. U-Net: Convolutional Networks for Biomedical Image Segmentation. arXiv 2022. [Google Scholar] [CrossRef]
  87. Kitano, B.T.; Mendes, C.C.T.; Geus, A.R.; Oliveira, H.C.; Souza, J.R. Corn Plant Counting Using Deep Learning and UAV Images. IEEE Geosci. Remote Sens. Lett. 2019, 1–5. [Google Scholar] [CrossRef]
  88. Sreedhar, K. Enhancement of Images Using Morphological Transformations. IJCSIT 2012, 4, 33–50. [Google Scholar] [CrossRef]
  89. Lin, Z.; Guo, W. Sorghum Panicle Detection and Counting Using Unmanned Aerial System Images and Deep Learning. Front. Plant Sci. 2020, 11, 534853. [Google Scholar] [CrossRef] [PubMed]
  90. El Hoummaidi, L.; Larabi, A.; Alam, K. Using unmanned aerial systems and deep learning for agriculture mapping in Dubai. Heliyon 2021, 7, e08154. [Google Scholar] [CrossRef] [PubMed]
  91. Doha, R.; Al Hasan, M.; Anwar, S.; Rajendran, V. Deep Learning based Crop Row Detection with Online Domain Adaptation. In Proceedings of the 27th ACM SIGKDD Conference on Knowledge Discovery & Data Mining, Singapore, 14–18 August 2021; pp. 2773–2781. [Google Scholar]
  92. Zhang, T.; Yang, Z.; Xu, Z.; Li, J. Wheat Yellow Rust Severity Detection by Efficient DF-UNet and UAV Multispectral Imagery. IEEE Sens. J. 2022, 22, 9057–9068. [Google Scholar] [CrossRef]
  93. Tsuichihara, S.; Akita, S.; Ike, R.; Shigeta, M.; Takemura, H.; Natori, T.; Aikawa, N.; Shindo, K.; Ide, Y.; Tejima, S. Drone and GPS Sensors-Based Grassland Management Using Deep-Learning Image Segmentation. In Proceedings of the 2019 Third IEEE International Conference on Robotic Computing (IRC), Naples, Italy, 25–27 February 2019; pp. 608–611. [Google Scholar]
  94. Yang, M.-D.; Boubin, J.G.; Tsai, H.P.; Tseng, H.-H.; Hsu, Y.-C.; Stewart, C.C. Adaptive autonomous UAV scouting for rice lodging assessment using edge computing with deep learning EDANet. Comput. Electron. Agric. 2020, 179, 105817. [Google Scholar] [CrossRef]
  95. Weyler, J.; Magistri, F.; Seitz, P.; Behley, J.; Stachniss, C. In-Field Phenotyping Based on Crop Leaf and Plant Instance Segmentation. In Proceedings of the 2022 IEEE/CVF Winter Conference on Applications of Computer Vision (WACV), Waikoloa, HI, USA, 3–8 January 2022; pp. 2968–2977. [Google Scholar]
  96. Guo, Y.; Zhang, J.; Yin, C.; Hu, X.; Zou, Y.; Xue, Z.; Wang, W. Plant Disease Identification Based on Deep Learning Algorithm in Smart Farming. Discret. Dyn. Nat. Soc. 2020, 2020, 2479172. [Google Scholar] [CrossRef]
  97. Getreuer, P. Chan-Vese Segmentation. Image Process. On Line 2012, 2, 214–224. [Google Scholar] [CrossRef]
  98. Torres-Sánchez, J.; Mesas-Carrascosa, F.J.; Jiménez-Brenes, F.M.; de Castro, A.I.; López-Granados, F. Early Detection of Broad-Leaved and Grass Weeds in Wide Row Crops Using Artificial Neural Networks and UAV Imagery. Agronomy 2021, 11, 749. [Google Scholar] [CrossRef]
  99. Zhang, X.; Li, N.; Ge, L.; Xia, X.; Ding, N. A Unified Model for Real-Time Crop Recognition and Stem Localization Exploiting Cross-Task Feature Fusion. In Proceedings of the 2020 IEEE International Conference on Real-time Computing and Robotics (RCAR), Asahikawa, Japan, 28–29 September 2020; pp. 327–332. [Google Scholar]
  100. Li, N.; Zhang, X.; Zhang, C.; Guo, H.; Sun, Z.; Wu, X. Real-Time Crop Recognition in Transplanted Fields with Prominent Weed Growth: A Visual-Attention-Based Approach. IEEE Access 2019, 7, 185310–185321. [Google Scholar] [CrossRef]
  101. Chen, C.-J.; Huang, Y.-Y.; Li, Y.-S.; Chen, Y.-C.; Chang, C.-Y.; Huang, Y.-M. Identification of Fruit Tree Pests With Deep Learning on Embedded Drone to Achieve Accurate Pesticide Spraying. IEEE Access 2021, 9, 21986–21997. [Google Scholar] [CrossRef]
  102. Qin, Z.; Wang, W.; Dammer, K.-H.; Guo, L.; Cao, Z. A Real-time Low-cost Artificial Intelligence System for Autonomous Spraying in Palm Plantations. arXiv 2021. [Google Scholar] [CrossRef]
  103. Parico, A.I.B.; Ahamed, T. An Aerial Weed Detection System for Green Onion Crops Using the You Only Look Once (YOLOv3) Deep Learning Algorithm. Eng. Agric. Environ. Food 2020, 13, 42–48. [Google Scholar] [CrossRef]
  104. Rui, C.; Youwei, G.; Huafei, Z.; Hongyu, J. A Comprehensive Approach for UAV Small Object Detection with Simulation-based Transfer Learning and Adaptive Fusion. arXiv 2021. [Google Scholar] [CrossRef]
  105. Parico, A.I.B.; Ahamed, T. Real Time Pear Fruit Detection and Counting Using YOLOv4 Models and Deep SORT. Sensors 2021, 21, 4803. [Google Scholar] [CrossRef] [PubMed]
  106. Jintasuttisak, T.; Edirisinghe, E.; Elbattay, A. Deep neural network based date palm tree detection in drone imagery. Comput. Electron. Agric. 2022, 192, 106560. [Google Scholar] [CrossRef]
  107. Tian, Y.; Yang, G.; Wang, Z.; Li, E.; Liang, Z. Detection of Apple Lesions in Orchards Based on Deep Learning Methods of CycleGAN and YOLOV3-Dense. J. Sens. 2019, 2019, 7630926. [Google Scholar] [CrossRef]
  108. Liu, W.; Anguelov, D.; Erhan, D.; Szegedy, C.; Reed, S.; Fu, C.-Y.; Berg, A.C. SSD: Single Shot MultiBox Detector. In Lecture Notes in Computer Science, Proceedings of the Computer Vision—ECCV 2016, Amsterdam, The Netherlands, 11–14 October 2016; Leibe, B., Matas, J., Sebe, N., Welling, M., Eds.; Springer International Publishing: Cham, Switzerland, 2016; pp. 21–37. [Google Scholar]
  109. Veeranampalayam Sivakumar, A.N.; Li, J.; Scott, S.; Psota, E.; Jhala, A.J.; Luck, J.D.; Shi, Y. Comparison of Object Detection and Patch-Based Classification Deep Learning Models on Mid- to Late-Season Weed Detection in UAV Imagery. Remote Sens. 2020, 12, 2136. [Google Scholar] [CrossRef]
  110. Ridho, M.F.; Irwan. Strawberry Fruit Quality Assessment for Harvesting Robot Using SSD Convolutional Neural Network. In Proceedings of the 2021 8th International Conference on Electrical Engineering, Computer Science and Informatics (EECSI), Semarang, Indonesia, 20–21 October 2021; pp. 157–162. [Google Scholar]
  111. Ammar, A.; Koubaa, A.; Benjdira, B. Deep-Learning-Based Automated Palm Tree Counting and Geolocation in Large Farms from Aerial Geotagged Images. Agronomy 2021, 11, 1458. [Google Scholar] [CrossRef]
  112. Su, W.-H.; Zhang, J.; Yang, C.; Page, R.; Szinyei, T.; Hirsch, C.D.; Steffenson, B.J. Automatic Evaluation of Wheat Resistance to Fusarium Head Blight Using Dual Mask-RCNN Deep Learning Frameworks in Computer Vision. Remote Sens. 2021, 13, 26. [Google Scholar] [CrossRef]
  113. Yang, M.D.; Tseng, H.H.; Hsu, Y.C.; Tseng, W.C. Real-time Crop Classification Using Edge Computing and Deep Learning. In Proceedings of the 2020 IEEE 17th Annual Consumer Communications Networking Conference (CCNC), Las Vegas, NV, USA, 10–13 January 2020; pp. 1–4. [Google Scholar]
  114. Menshchikov, A.; Shadrin, D.; Prutyanov, V.; Lopatkin, D.; Sosnin, S.; Tsykunov, E.; Iakovlev, E.; Somov, A. Real-Time Detection of Hogweed: UAV Platform Empowered by Deep Learning. IEEE Trans. Comput. 2021, 70, 1175–1188. [Google Scholar] [CrossRef]
  115. Weyler, J.; Quakernack, J.; Lottes, P.; Behley, J.; Stachniss, C. Joint Plant and Leaf Instance Segmentation on Field-Scale UAV Imagery. IEEE Robot. Autom. Lett. 2022, 7, 3787–3794. [Google Scholar] [CrossRef]
  116. Lottes, P.; Behley, J.; Chebrolu, N.; Milioto, A.; Stachniss, C. Robust joint stem detection and crop-weed classification using image sequences for plant-specific treatment in precision farming. J. Field Robot. 2020, 37, 20–34. [Google Scholar] [CrossRef]
  117. Su, D.; Qiao, Y.; Kong, H.; Sukkarieh, S. Real time detection of inter-row ryegrass in wheat farms using deep learning. Biosyst. Eng. 2021, 204, 198–211. [Google Scholar] [CrossRef]
  118. Vaswani, A.; Shazeer, N.; Parmar, N.; Uszkoreit, J.; Jones, L.; Gomez, A.N.; Kaiser, Ł.; Polosukhin, I. Attention is all you need. In Proceedings of the 31st Conference on Neural Information Processing Systems (NIPS 2017), Long Beach, CA, USA; 2017; Volume 30. [Google Scholar]
  119. Dosovitskiy, A.; Beyer, L.; Kolesnikov, A.; Weissenborn, D.; Zhai, X.; Unterthiner, T.; Dehghani, M.; Minderer, M.; Heigold, G.; Gelly, S.; et al. An Image is Worth 16x16 Words: Transformers for Image Recognition at Scale. arXiv 2021. [Google Scholar] [CrossRef]
  120. Carion, N.; Massa, F.; Synnaeve, G.; Usunier, N.; Kirillov, A.; Zagoruyko, S. End-to-End Object Detection with Transformers. arXiv 2020. [Google Scholar] [CrossRef]
  121. Thai, H.-T.; Tran-Van, N.-Y.; Le, K.-H. Artificial Cognition for Early Leaf Disease Detection using Vision Transformers. In Proceedings of the 2021 International Conference on Advanced Technologies for Communications (ATC), Ho Chi Minh City, Vietnam, 14–16 October 2021; pp. 33–38. [Google Scholar]
  122. Deng, J.; Dong, W.; Socher, R.; Li, L.-J.; Li, K.; Li, F.-F. ImageNet: A Large-Scale Hierarchical Image Database. In Proceedings of the 2009 IEEE Conference on Computer Vision and Pattern Recognition, Miami, FL, USA, 20–25 June 2009; p. 8. [Google Scholar]
  123. Cassava Leaf Disease Classification. Available online: https://kaggle.com/competitions/cassava-leaf-disease-classification (accessed on 18 June 2022).
  124. Karila, K.; Alves Oliveira, R.; Ek, J.; Kaivosoja, J.; Koivumäki, N.; Korhonen, P.; Niemeläinen, O.; Nyholm, L.; Näsi, R.; Pölönen, I.; et al. Estimating Grass Sward Quality and Quantity Parameters Using Drone Remote Sensing with Deep Neural Networks. Remote Sens. 2022, 14, 2692. [Google Scholar] [CrossRef]
  125. Dersch, S.; Schottl, A.; Krzystek, P.; Heurich, M. Novel Single Tree Detection By Transformers Using Uav-Based Multispectral Imagery. ProQuest. Available online: https://www.proquest.com/openview/228f8f292353d30b26ebcdd38372d40d/1?pq-origsite=gscholar&cbl=2037674 (accessed on 15 June 2022).
  126. Chen, G.; Shang, Y. Transformer for Tree Counting in Aerial Images. Remote Sens. 2022, 14, 476. [Google Scholar] [CrossRef]
  127. Liu, W.; Salzmann, M.; Fua, P. Context-Aware Crowd Counting. arXiv 2019. [Google Scholar] [CrossRef]
  128. Zhang, X.; Han, L.; Sobeih, T.; Lappin, L.; Lee, M.; Howard, A.; Kisdi, A. The self-supervised spectral-spatial attention-based transformer network for automated, accurate prediction of crop nitrogen status from UAV imagery. arXiv 2022. [Google Scholar] [CrossRef]
  129. Coletta, L.F.S.; de Almeida, D.C.; Souza, J.R.; Manzione, R.L. Novelty detection in UAV images to identify emerging threats in eucalyptus crops. Comput. Electron. Agric. 2022, 196, 106901. [Google Scholar] [CrossRef]
  130. Bosilj, P.; Aptoula, E.; Duckett, T.; Cielniak, G. Transfer learning between crop types for semantic segmentation of crops versus weeds in precision agriculture. J. Field Robot. 2020, 37, 7–19. [Google Scholar] [CrossRef]
  131. Li, W.; Liu, C.; Yang, Y.; Awais, M.; Li, W.; Ying, P.; Ru, W.; Cheema, M.J.M. A UAV-aided prediction system of soil moisture content relying on thermal infrared remote sensing. Int. J. Environ. Sci. Technol. 2022, 19, 9587–9600. [Google Scholar] [CrossRef]
  132. Khan, S.; Tufail, M.; Khan, M.T.; Khan, Z.A.; Iqbal, J.; Alam, M. A novel semi-supervised framework for UAV based crop/weed classification. PLoS ONE 2021, 16, e0251008. [Google Scholar] [CrossRef] [PubMed]
  133. Alom, Z.; Taha, T.M.; Asari, V.K. Recurrent Residual Convolutional Neural Network based on U-Net (R2U-Net) for Medical Image Segmentation. arXiv 2018. [Google Scholar] [CrossRef]
  134. Fawakherji, M.; Potena, C.; Prevedello, I.; Pretto, A.; Bloisi, D.D.; Nardi, D. Data Augmentation Using GANs for Crop/Weed Segmentation in Precision Farming. In Proceedings of the 2020 IEEE Conference on Control Technology and Applications (CCTA), Montreal, QC, Canada, 24–26 August 2020; pp. 279–284. [Google Scholar]
  135. Fawakherji, M.; Potena, C.; Pretto, A.; Bloisi, D.D.; Nardi, D. Multi-Spectral Image Synthesis for Crop/Weed Segmentation in Precision Farming. Robot. Auton. Syst. 2021, 146, 103861. [Google Scholar] [CrossRef]
  136. Mazzia, V.; Khaliq, A.; Salvetti, F.; Chiaberge, M. Real-Time Apple Detection System Using Embedded Systems with Hardware Accelerators: An Edge AI Application. IEEE Access 2020, 8, 9102–9114. [Google Scholar] [CrossRef]
  137. Tay, Y.; Dehghani, M.; Bahri, D.; Metzler, D. Efficient Transformers: A Survey. ACM Comput. Surv. 2022, 55, 1–28. [Google Scholar] [CrossRef]
  138. Poli, M.; Massaroli, S.; Nguyen, E.; Fu, D.Y.; Dao, T.; Baccus, S.; Bengio, Y.; Ermon, S.; Ré, C. Hyena Hierarchy: Towards Larger Convolutional Language Models. arXiv 2023. [Google Scholar] [CrossRef]
  139. Senecal, J.J.; Sheppard, J.W.; Shaw, J.A. Efficient Convolutional Neural Networks for Multi-Spectral Image Classification. In Proceedings of the 2019 International Joint Conference on Neural Networks (IJCNN), Budapest, Hungary, 14–19 July 2019; pp. 1–8. [Google Scholar]
  140. Yang, Z.; Li, J.; Shi, X.; Xu, Z. Dual flow transformer network for multispectral image segmentation of wheat yellow rust. In Proceedings of the International Conference on Computer, Artificial Intelligence, and Control Engineering (CAICE 2022), Zhuhai, China, 25–27 February 2022; SPIE: Bellingham, WA, USA, 2022; Volume 12288, pp. 119–125. [Google Scholar]
  141. Tao, C.; Meng, Y.; Li, J.; Yang, B.; Hu, F.; Li, Y.; Cui, C.; Zhang, W. MSNet: Multispectral semantic segmentation network for remote sensing images. GIScience Remote Sens. 2022, 59, 1177–1198. [Google Scholar] [CrossRef]
  142. López, M.; Alberto, J. The Use of Multispectral Images and Deep Learning Models for Agriculture: The Application on Agave. December 2022. Available online: https://repositorio.tec.mx/handle/11285/650159 (accessed on 12 March 2023).
  143. Victor, B.; He, Z.; Nibali, A. A systematic review of the use of Deep Learning in Satellite Imagery for Agriculture. arXiv 2022. [Google Scholar] [CrossRef]
  144. Sarigiannidis, P. Peach Tree Disease Detection Dataset. IEEE, 23 November 2022. Available online: https://ieee-dataport.org/documents/peach-tree-disease-detection-dataset (accessed on 12 March 2023).
Figure 2. Image size (pixels) used for vision tasks using UAV data.
Drones 07 00382 g002
Figure 3. Various precision agricultural issues addressed in the papers.
Drones 07 00382 g003
Table 1. Summary of challenges in agriculture.
StageChallenges
PreharvestDisease detection and diagnosis, seed quality, fertilizer application, field segmentation, and urban vegetation classification
HarvestingCrops detection and classification, pest detection and control, crop yield estimation, tree counting, maturity level, and cropland extent
PostharvestFruit grading, quality-retaining processes, storage environmental conditions,
and chemical usage detection
Table 2. Useful vegetation indices that can be derived from UAV images.
Vegetation IndexSpectrumEquation
Excess green (ExG)RGB2G − R − B
Excess red (ExR)RGB1.3R − G
Color index of vegetation (CIVE)RGB0.441R – 0.81G + 0.385B + 18.7874
Excess green minus red (ExGR)RGB3G − 2.4R − B
Normalized difference vegetation index (NDVI)RGB + NIR(NIR − R)/(NIR + R)
Normalized difference red-edge index (NDRE)RGB + NIR(NIR − RE)/(NIR + RE)
Ratio vegetation index (RVI)RGB + NIRNIR/R
Perpendicular vegetation index (PVI)RGB + NIR[(0.335NIR − 0.149R)2 + (0.335R − 0.852NIR)2]
Table 3. Summary of support vector machine models.
Paper SVM
Model/ArchitectureApplicationApproachCommentsBest Results
Tendolkar
et al. [52]
SVMPesticide/disease treatmentDual-step based approach of pixel-wise NDVI calculation and semantic segmentation helps in overcoming NDVI issuesModel was not compared to any otherPrecision: 85%
Recall: 81%
F1-score: 79%
Natividade et al. [61]SVMFertilizationPattern recognition system allows for classification of images taken by low-cost camerasAccuracy, precision, and recall values of model varied highly across datasetsDataset #1 (1st configuration):
[accuracy: 78%, precision: 93%, recall: 86%, accuracy: 72%]
Dataset #2:
[accuracy: 83%, precision: 97%, recall: 94%, accuracy: 73%]
Pérez-Ortiz et al. [62]SVMCrop-row detectionAble to detect weeds outside and within crop rows; does not require a big training datasetSegmentation process produced salt-and-pepper noise effect on images
Training images were manually selected
Model inference was influenced by training image selection
Mean average error (MAE): 12.68%
César Pereira et al. [53]LSVMCrop-row detectionModel can be trained fast with a small training setImage dataset was small and simple, containing images of sugarcane cultures onlyUsing RGB + EXG + GABOR filters:
IOU: 0.788654
F1: 0.880129
Table 4. Summary of K-nearest neighbor models.
Paper KNN
Model/ArchitectureApplicationStrengthsCommentsBest Results
César Pereira
et al. [53]
KNN3, KNN11Crop-row detectionSimplest algorithms to implement amongst implemented algorithms in the paperModels did not achieve the best results in the paperKNN3 and 11 with RGB + EXG + GABOR filters:
[IOU: 0.76, F1: 0.86]
Rodríguez-Garlito and Paz-Gallardo [63]KNNCrop-row detection/land-cover mappingUses an automatic window processing method that allows for the use of ML algorithms on large multispectral imagesModel did not achieve the best results in the paperApproximate values:
AP: 0.955
Accuracy score: 0.918
Rocha et al. [64]KNNCrop-row detectionBest-performing classifierModel could not perform sugarcane line detection and fault measurement on sugarcane fields of all growth stagesRelative error: 1.65%
Table 5. Summary of decision trees and random forests.
Paper DT and RF
Model/ArchitectureApplicationStrengthsCommentsBest Results
Natividade
et al. [61]
DTFertilizationPattern recognition system allows for classification of images taken by low-cost camerasModel did not outperform SVM on all chosen metricsDataset #2:
[accuracy: 77%, precision: 87%, recall: 90%, accuracy: 79%]
Lottes et al. [54]RFPesticide/disease treatmentModel can detect plants relying only on its shapeLow precision and recall for detecting weeds under the “other weeds” classSaltbush class recall: 95%, chamomile class recall: 87%, sugar beet class recall: 78%, recall of other weeds class: 45%
Overall model accuracy for predicted objects: 86%
Table 6. Summary of convolutional neural networks.
Paper CNN
Model/ArchitectureApplicationStrengthsCommentsBest Results
Crimaldi
et al. [65]
Inception V3Pesticide/disease treatmentThe identification time was 200 ms which is good for real-time applicationsLow accuracyAccuracy of 78.1%
Milioto et al. [66]CNN model fed with RGB + NIR camera imagesSpatial segregation and segmentationHigh accuracy for early growth stageLow accuracy for the later growth stageEarly growth stage
Accuracy: 97.3%
Recall: 98%
Later growth stage
Accuracy: 89.2%
Recall: 99%
Bah et al. [67]AlexNetPesticide/disease treatmentFewer images with high resolution from a droneOverlapping of the leaves between crops and weedsBest precision was for the spinach dataset with 93%
Reddy et al. [68]Customized CNNSpatial segregation and segmentationThe results had a high precision and recallLarge datasetPrecision of 99.5% for the leaf snap dataset; the Flavia, Swedish leaf, and UCI leaf datasets had a recall of 98%
Sembiring
et al. [69]
Customized CNNPesticide/disease treatmentLow training time compared to other models compared in the paperNot the highest-performing model compared in the paperAccuracy of 97.15%
Geetharamani
et al. [70]
Deep CNNPesticide/disease treatmentCan classify 38 distinct classes of healthy and diseased plantsLarge datasetClassification accuracy of 96.46%
Karthik et al. [71]Residual learning CNN with attention mechanismPesticide/disease treatmentProminent level of accuracy and only 600 k parameters, which is lower than the other papers compared in this paperLarge datasetOverall accuracy of 98%
Nanni et al. [73]Ensembles of CNNs based on different topologies (ResNet50, GoogleNet, ShuffleNet, MobileNetv2, and DenseNet201)Pesticide/disease treatmentUsing Adam helps in decreasing the learning rate of parameters whose gradient changes more frequentlyIP102 is a large dataset95.52% on Deng and 73.46% on IP102 datasets
Bah et al. [85]CrowNetCrop-row detectionAble to detect rows in images of several types of cropsNot a single CNN modelAccuracy: 93.58%
IoU: 70%
Atila et al. [74]EfficientNetPesticide/disease treatmentReduces the calculations by the square of the kernel sizeDid not have the lowest training time compared to the other models in the paperPlant Village dataset
Accuracy: 99.91%
Precision: 98.42%
Original and augmented datasets
Accuracy: 99.97%
Precision: 99.39%
Prasad et al. [75]EfficientDetPesticide/disease treatmentScaling ability and FLOP reductionPerformed well for limited labeled datasets; however, the accuracy was still lowIdentifier model average accuracy: 75.5%
Albattah et al. [76]EffecientNetV2-B4Pesticide/disease treatmentReally reliable results and has low time complexityLarge datasetPrecision: 99.63%
Recall: 99.93%
Accuracy: 99.99%
F1: 99.78%
Mishra et al. [77]Standard CNNPesticide/disease treatmentCan run on devices such as raspberry-pi or smartphones and drones; works in real-time with no internetNCS recognition accuracy was not good and could be improved according to the authorsAccuracy
GPU: 98.40%
NCS chip: 88.56%
Bah et al. [78]ResNet18Spatial segregation and segmentationOutperformed SVM and RF methods and uses unsupervised training datasetResults of the ResNet18 are lower than SVM and RF in the spinach fieldAUC: 91.7%
on both supervised and unsupervised labelled data
Zheng et al. [79]Multiple CNN models including: CNN joint Model, Xception model, and ResNet50 modelPesticide/disease treatmentCompares multiple modelsThe joint model had trouble with LAI estimation, and the vision transformer had trouble with percentage canopy cover estimationXception model: 0.28
CNN–ConvLSTM: 0.32
ResNet50: 0.41
Yang et al. [80]ShuffleNet V2Pesticide/disease treatmentThe total number of params was 3.785 M, which makes it portable and easy to applyNot the lowest number of params when compared to the models in the paperAccuracy
MSI: 82.4%
RGB: 93.41%
TIRI: 68.26%
Briechleet
et al. [81]
PointNet++Spatial segregation and segmentationGood score compared to the models mentioned in the paperNot yet tested for practical useAccuracy: 90.2%
Aiger et al. [82]CNNEnvironmental conditionsLarge-scale, robust, and high-accuracyLow accuracy for 2D CNN96.3% accuracy
Table 7. Summary of U-Net models.
Paper U-Net
Model/ArchitectureApplicationStrengthsCommentsBest Results
Lin et al. [89]U-NetTree/crop countingCan detect overlapping sorghum paniclesThe performance decreased with a lower number of training images (<500)Accuracy: 95.5%
RMSE: 2.5%
Arun et al. [25]Reduced U-NETSpatial segregation and segmentationReduces the total number of parameters and results in a lower error rateThe comparison was made with models that were used to problems not related to agricultureAccuracy: 95.34%
Error rate: 7.45%
Hoummaidi
et al. [90]
U-NetLand-cover mappingReal-time and uses multispectral imagesTree obstruction and physical characteristics caused it to have errors; however, it could be improved using a better datasetAccuracy: 89.7%
Palm trees
Detection rate: 96.03%
Ghaf trees
Detection rate: 94.54%
Doha et al. [91]U-NetCrop-row detectionThe method they used could refine the results of the U-Net to reduce errors, as well as do frame interpolation of the input video streamNot enough results were givenVariance: 0.0083
Zhang et al. [92]DF-U-NetPesticide/disease treatmentReduced the computation load by more than half and had the highest accuracy among other models comparedEarly-stage rust disease is difficult to recognizeF1: 94.13%
OA: 96.93%
Precision: 94.02%
Tsuichihara
et al. [93]
U-NetSpatial segregation and segmentationAccuracy was 80% for only 48 images trainedLow accuracy and that is due to the small number of images which is due to manually painting 6 colors on each imageAccuracy: ~80%
Table 8. Summary of other segmentation models.
Paper Other Segmentation Models
Model/ArchitectureApplicationStrengthsCommentsBest Results
Yang et al. [94]EDANetSpatial segregation and segmentationImproved prior work on identifying and lodging by 2.51% and 8.26%, respectivelyDrone images taken from a greater height did not perform well; however, with the method they proposed, it could have reliable resultsIdentify rice
Accuracy: 95.28%
Lodging
Accuracy: 86.17%
If less than 2.5% lodging is neglected, then the accuracy increases to 99.25%
Weyler et al. [95]ERFNet-based instance segmentationSpatial segregation and segmentationData were gathered from real agricultural fieldsComparison was made on different datasets based on average precision scores using ERFNet Crop leaf segmentation
Average precision: 48.7%
Average recall: 57.3%
Crop segmentation
Average precision: 60.4%
Average recall: 68%
Guo et al. [96]Three-stage model with RPN, Chan-Vese algorithm, and a transfer learning modelPesticide/disease treatmentOutperformed the traditional ResNet101 which had an accuracy of 42.5% and is unsupervisedThe Chan-Vese algorithm ran for a long timeAccuracy 83.75%
Sanchez et al. [98]MLPSpatial segregation and segmentationEvaluated in commercial fields and not under controlled conditionsThe dataset was captured noon to avoid shadowOverall accuracy on two classes of crops: 80.09%
Zhang et al. [99]UniSteamNetSpatial segregation and segmentationJoint crop recognition and stem detection in real time; fast and could finish processing each image within 6 msThe scores of this model were not always the best, and the differences were smallSegmentation
F1: 97.4%
IoU: 94.5
Stem detection
SDR: 97.8%
Table 9. Summary of YOLO models.
Paper YOLO
Model/ArchitectureApplicationStrengthsCommentsBest Results
Chen et al. [101]Tiny-YOLOv3Pesticide/disease treatmentResults in excellent outcomes with regard to FPS and mAP; reduces pesticide use.Has a high false identification in adult
T. papillosa
mAP score of 95.33%
Qin et al. [102]Ag-YOLO
(v3-tiny)
Pesticide/disease treatmentTested Yolov3 with multiple backbones and achieved optimum results in terms of FPS and power consumptionUses NCS2 that supports 16-bit float point values onlyF1 Score of 92.05%
Parico et al. [103]YOLO-Weed (v3)Pesticide/disease treatmentHigh speed and mAP scoreLimitations in detecting small objectsmAP score of 93.81%
F1 score of 94%
Parico et al. [105]YOLOv4
(multiple versions)
Tree/crop countingProved that YOLOv4-CSP has the lowest FPS with the highest mAPLimitations in detecting small objectsAP score of 98%
Jintasuttisak
et al. [106]
YOLOv5mTree/crop countingCompared different YOLO versions and proved that YOLOv5 with medium depth outperforms the rest even with overlapped treesYOLOv5x scored a higher detection average due to the increased number of layersmAP score of 92.34%
Tian et al. [107]YOLOv3 (modified)Pesticide/diseases treatmentTackles the lack of data by generating new images using CycleGANThe model is weak without the images generated using CycleGANF1-score of 81.6% and IoU score of 91.7%
Table 10. Summary of SSDs.
Paper SSD
Model/ArchitectureApplicationStrengthsCommentsBest Results
Veeranampalayam Sivakumar et al. [109]SSD with a feature extraction module made of an Inception v2 network and 4 convolutional layersSpatial segregation and segmentationModel is scale- and translation-invariantLow optimal confidence threshold value of 0.1; failure to detect weeds at the borders of imagesPrecision: 0.66, recall: 0.68, F1-score: 0.67, mean IoU: 0.84, inference time: 0.21 s
Ridho and Irwan [110]SSD with MobileNet as a base for the feature extraction moduleSeed quality and germinationFast detection and image processingDetection was not performed on a UAV; model did not yield the best accuracy in the paperAccuracy: 90%
Table 11. Summary of two-stage detectors.
Paper Two-Stage Detectors
Model/ArchitectureApplicationStrengthsCommentsBest Results
Sivakumar
et al. [109]
FRCNNSpatial segregation and segmentationThe optimal confidence threshold of the SSD model was found to be much lower than that of the faster RCNN modelInference time of SSD is better than that of FRCNN, but it can be improved at the cost of performance66% F1-score and 85% IoU.
Ammar
et al. [111]
FRCNNTree/crop countingLarge advantage in terms of speedVery weak in detecting trees; outperformed by Efficient-Det D5 and YOLOv387.13% and 49.41% IoU for palm and other trees, respectively
Su et al. [112]Mask-RCNNPesticide/disease treatmentSuperior in comparison to CNNInference time was not taken into consideration98.81% accuracy
Yang et al. [113]FCN-AlexNetSpatial segregation and segmentationProvides good comparison between SegNet and AlexNetOutperformed by SegNet88.48% recall rate
Menshchikov et al. [114]FCNNPesticide/diseases treatmentProposed method is applicable in real-world scenario, and the use of RGB cameras is cheaper than multispectral camerasComplex algorithms compared to the multispectral approachROC AUC in segmentation: 0.96
Hosseiny
et al. [10]
A model with the core of the framework based on the faster regional CNN (RCNN) with a backbone of ResNet101 for object detectionTree/crop countingResults are good for an unsupervised methodTested only on single object detection and automatic crop row estimation can fail due to dense plant distributionPrecision: 0.868
Recall: 0.849
F1: 0.855
Table 12. Summary of autoencoders.
Paper Autoencoder
Model/ArchitectureApplicationStrengthsCommentsBest Results
Weyler et al. [115]CNN/autoencoderSpatial segregation and segmentationPerformed joint instance segmentation of crop plants and leaves using a two-step approach of detecting individual instances of plants and leaves followed by pixel-wise segmentation of the identified instancesLow segmentation precision for smaller plants; outperformed by Mask-RCNN0.94 for AP50
Lottes et al. [116]FCN/autoencoderPesticide/disease treatmentPerformed joint stem detection and crop–weed segmentation using an autoencoder with two task-specific decoders, one for stem detection and the other for pixel-wise semantic segmentationDid not achieve best mean recall across all tested datasets. + false detections of stems in soil regionsAchieved mAP scores of 85.4%, 66.9%,42.9%, and 50.1% for Bonn, Stuttgart, Ancona, and Eschikon datasets, respectively, for stem detection and 69.7%, 58.9%, 52.9%, and 44.2% mAP scores for Bonn, Stuttgart, Ancona, and Eschikon datasets, respectively, for segmentation
Su et al. [117]AutoencoderSpatial segregation and segmentationUtilized two position-aware encoder–decoder subnets in their DNN architecture to perform segmentation of inter-row and intra-row rygrass with higher segmentation accuracyLow pixel-wise semantic segmentation accuracy for early-stage wheatMean accuracy and IoU scores of 96.22% and 64.21%, respectively.
Table 13. Summary of transformers.
Paper Transformers
Model/ArchitectureApplicationStrengthsCommentsBest Results
Thai et al. [121]ViTPesticide/diseases treatmentProposed a smart solution powered by Internet of things (IoT)The performance was not tested with the system attached to a drone90.3% F1-score in comparison to the best CNN score of 89.2% achieved by Resnet50 model
Reedha
et al. [24]
ViTSpatial segregation and segmentationThe classification of crops and weed images using ViTs yielded the best prediction performanceSlightly outperformed existing CNN modelsF1-scores of 99.4% and 99.2% were obtained from ViT-B16 and ViT-B32, respectively
Karila
et al. [124]
ViTCrop yield estimation/seed quality and germinationThe ViT RGB models performed the best on several types of datasetsVGG CNN models provided equally reliable results in most casesMultiple results shown on several types of datasets
Dersch
et al. [125]
DETRSpatial segregation and segmentationDETR clearly outperformed YOLOv4 in mixed and deciduous plotsDETR failed to detect smaller trees, far worse than YOLOv4 in multiple casesAn F1-score of 86% and 71% in mixed and deciduous plots respectively
Chen
et al. [126]
DENTTree/crop countingThe model outperformed most of the state-of-the-art methodsCANNet achieved better resultsA mean absolute error (MAE) of 10.7 and a root-mean-squared error (RMSE) of 13.7
Coletta
et al. [129]
Active LearningPesticide/disease treatmentThe model can classify unknown dataDid not test the performance of other classification modelsAn accuracy of 98% and a recall of 97%
Table 14. Best results achieved in different agricultural problems.
ProblemType of LearningPaperModel/ArchitectureDatasetBest Results
Spatial segregation and segmentationSupervisedJintasuttisak et al. [106]YOLOv5Date palm trees collected using a dronemAP score of 92.34%
Semi-supervisedFawakherji et al. [118]cGANs5400 RGB images of pears and strawberries, of which 20% were labeledAn IoU score of 83.1% on mixed data including both original and synthesized
UnsupervisedBah et al. [78]ResNet18UAV images of spinach and bean fieldsAUC: 91.7%
Pesticide/diseases treatmentSupervisedZhang et al. [73]DF-U-NetYangling UAV imagesF1: 94.13%
Accuracy: 96.93%
Precision: 94.02%
Semi-supervisedColetta et al. [129]Active learning: SVMUAV images collected from Eucalyptus plantationsAn accuracy of 98% and a recall of 97%
UnsupervisedKhan et al. [117]SGANUAV images collected from strawberry and pea fieldsAccuracy ~90%
FertilizationSupervisedNatividade et al. [61]SVMUAV images of vineyards and forests Accuracy: 83%, precision: 97%, recall: 94%
UnsupervisedZhang et al. [115]SSVTUAV images of a wheat field96.5% on 384 × 384 pixel images
Crop-row detectionSupervisedCesar Pereira et al. [47]SVMManually collected RGB images88.01% F1-Score
Semi-supervisedPérez-Ortiz et al. [62]SVMUAV images collected from a sunflower plotMAE: 12.68%
Tree/crop countingSupervisedAmmar et al. [98]FRCNNTree counting87.13% IoU on palms and 49.41% on other trees
Semi-supervisedChen et al. [113]DENTYosemite tree dataset10.7 MAE score
OthersSupervisedAiger et al. [82]CNNUAV images of various types of land cover96.3% accuracy
Table 15. A summary of the papers surveyed based on the agricultural problem and technique used.
SupervisedSemi-SupervisedUnsupervised
Agricultural ProblemSpatial Segregation and Segmentation
CNNs: [25,66,68,81,93,94,95,98,99,100,113,130,135]
SSDs: [99,109]
TSDs: [109,115,117]
Transformers: [24,125]
CNNs: [84,130,135]
GANs: [134]
CNNs: [78]
Pesticides/Diseases Treatment
Classical Methods: SVM [52,54]
CNNs: [65,67,69,70,71,73,74,76,79,80,92,96,112,114,116]
SSDs: [77,101,102,103,107]
Classical Methods: SVM [129]
Transformers: [120,121]
GANs: [75,132]
Tree/Crop Counting
CNNs: [10,89,111]
SSDs: [105,106,111]
Transformers: [126]
Crop-Row Detection
Classical Methods: SVM, KNN [53], RF [63], KNN [64]
CNNs: [85,91]
Classical Methods: SVM [62]
Fertilization
Classical Methods: SVM & DT [61]
Transformers: [128]
Others
Classical Methods: KNN [63]
CNNs: [82,90,124]
SSDs: [110]
Transformers: [124]
Disclaimer/Publisher’s Note: The statements, opinions and data contained in all publications are solely those of the individual author(s) and contributor(s) and not of MDPI and/or the editor(s). MDPI and/or the editor(s) disclaim responsibility for any injury to people or property resulting from any ideas, methods, instructions or products referred to in the content.

