Article

An Enhanced Energy-Efficient Data Collection Optimization Algorithm for UAV Swarm in the Intelligent Internet of Things

1
National Key Laboratory of Radar Signal Processing, Xidian University, Xi’an 710071, China
2
School of Computer and Information Engineering, Luoyang Institute of Science and Technology, Luoyang 471023, China
3
School of Computer Science and Information Engineering, Shanghai Institute of Technology, Shanghai 200235, China
4
School of Electromechanical and Information Engineering, Zhengzhou Business University, Zhengzhou 451200, China
5
School of Computer Science and Cyber Engineering, Guangzhou University, Guangzhou 510006, China
*
Authors to whom correspondence should be addressed.
Drones 2023, 7(6), 373; https://doi.org/10.3390/drones7060373
Submission received: 26 April 2023 / Revised: 25 May 2023 / Accepted: 30 May 2023 / Published: 2 June 2023

Abstract

:
In the case of limited endurance of unmanned aerial vehicles (UAVs), in order to further improve UAV data collection efficiency, this paper puts forward EDC-UAVIIoT: an enhanced energy-efficient data collection optimization algorithm for UAV swarm in the intelligent Internet of Things. First of all, the algorithm optimizes the UAV cruise path through the intelligent Internet of Things routing mechanism, avoids the occurrence of data errors in the packet transmission process, and uses the end-to-end transmission error probability model. The error probability of data packets in the transmission process is calculated to improve the efficiency of data collection tasks and data throughput. Secondly, considering the relationship between energy harvesting and energy consumption balance, this paper uses semi-definite programming and a convex approximation algorithm to transform the non-convex optimization problem into a convex optimization problem and realize the mapping relationship between the UAV cluster node and the target node coordinates, which reduces the computational complexity. Finally, the simulation results show that the EDC-UAVIIoT algorithm is compared with other algorithms in network energy consumption, running time, network delay, and network throughput. The numerical values are increased by 7.03%, 10.16%, 12.39%, and 8.82%, respectively, thus verifying the effectiveness and stability of the proposed EDC-UAVIIoT algorithm.

1. Introduction

A UAV’s air-to-ground link covers a wide range, its random deployment is not limited by topography and geomorphology, and it can be used flexibly [1,2,3,4]. It can quickly and efficiently complete dynamic networking [5,6,7] and realize unmanned, networked [8,9], information-based, and intelligent management [10,11], which has attracted the attention of many scholars at home and abroad. These advantages make UAV widely used in various engineering fields such as aviation monitoring, intelligent agriculture, intelligent transportation, emergency rescue and disaster relief, marine patrol, forest fire prevention, and so on [12,13,14]. A UAV cluster is an intelligent cluster composed of several UAV nodes and completes specific tasks through the communication network. Because a UAV cluster bears higher adaptability and invulnerability, compared with a single machine, its communication ability, computing ability, storage ability, and cooperation ability have the advantages of completing multi-task monitoring and data acquisition at the same time, realizing distributed self-organization, self-expansion, and complementary functions. These advantages give a UAV cluster the characteristics of multi-functional integration, flexible adaptation to dynamic scenes, higher task execution efficiency, a larger service range, and stronger robustness, which greatly improve the overall efficiency of multiple UAVs.
Large scale ground–air-to-ground communication achieves collaborative optimization of network coverage and improves communication efficiency. However, in the case of limited network coverage, it is difficult to achieve large-scale global coverage, which will lead to some data nodes becoming island nodes, which cannot be connected to the backbone network and cannot complete the real-time transmission of data. Under the role of a UAV cluster with high storage, high performance computing, and high broadband capability, the problem of island nodes can be solved smoothly. Compared to the traditional communication model, the communication model based on the drone should consider new parameters including the position of the drone, the flight speed and orientation of the drone, and the remaining power of the drone. The large-scale network based on UAVs will cause the network topology to change continuously due to its motion characteristics, and even the nodes in the scene will be disabled due to power exhaustion. Therefore, the communication model needs to have stronger robustness, it must jointly build the optimization model, and it must optimize the model to obtain the optimal solution, which can still obtain excellent performance in changing scenes. In path selection, the number of task points directly affects the energy consumption of completing the task. For UAV applications with variable task points, such as UAV-assisted Internet of Things or sensor network data collection, researchers have determined as few task points as possible according to the specific characteristics of the application and on the premise of meeting the application requirements. By optimizing the task volume, the flight distance of the UAV is further shortened, and the flight energy consumption is reduced.
In UAV-assisted Internet of Things or sensor network data collection applications, the main contributions of this paper are as follows:
1. Using the communication ability between the sensing nodes deployed in the monitoring area, the data collected by all the sensing nodes are properly concentrated on some sensing nodes, and then the unmanned aerial vehicle is used to traverse these sensing nodes with concentrated data, thus avoiding the large task of traversing all nodes. The non-cluster head nodes in the cluster first transmit the collected data to the cluster head nodes through single hop or multi-hop form and then use a path planning algorithm to determine the path traversing these cluster head nodes to complete the data collection task.
2. Based on the communication range of sensing nodes, a task point is determined in the area covered by the communication range of multiple adjacent sensing nodes. The UAV can collect data collected by multiple sensing nodes at this point to reduce the number of task points. By adjusting the path segment between two nodes with overlapping communication range, a new path point is determined, and then the data collection path is further optimized by using the sensing node replacement and update strategy to shorten the flight distance of the UAV.
3. In the aspect of energy balance, this paper transforms a multivariable nonconvex optimization problem into a convex optimization problem. An iterative algorithm under the framework of alternating optimization is designed. The original problem is decomposed into two sub-problems by alternating optimization. For the first sub-problem, semidefinite programming and a continuous convex approximation algorithm are used to solve it. For the second sub-problem, the non-convex rank constraint is transformed into a convex difference form, and then the adaptation function is added to the objective function, and then the continuous convex approximation is used to solve the problem.
4. The effectiveness and stability of the EDC-UAVIIoT algorithm in energy consumption, network energy consumption, running time, and network delay are verified by simulation experiments.

2. Related Works

Energy consumption is a very important index for UAV path planning and data collection. The energy consumption of a UAV is mainly reflected in power, so UAV path planning can effectively reduce energy consumption and improve the efficiency of data collection. At present, path optimization based on the energy consumption model has become a new research hotspot. For this reason, many experts and scholars at home and abroad have carried out in-depth and meticulous research work.

2.1. UAV Path Planning Algorithm

In UAV path planning, the planning algorithm directly affects the quality of data collection and determines the speed of energy consumption. Therefore, the path planning algorithm has become one of the focuses of researchers. In reference [15], a regular fast path planning algorithm based on grid division is proposed when unmanned aerial vehicles are used to collect data in uniformly deployed large-scale wireless sensor networks. At the same time, it can reduce the complexity of solving the traveling salesman problem (TSP) and improve the efficiency of path planning. Reference [16] proposes a new path planning algorithm that combines a flood filling algorithm with a 2-opt algorithm to re-monitor the missed test area, which can plan the polyline path with shorter flight time and fewer turns, meet the performance constraints such as safe altitude and turning radius of the UAV, and optimize the UAV path in a three-dimensional space environment. In reference [17], a path planning algorithm for a fixed-wing UAV in a multi-threat environment is proposed by combining a genetic algorithm, the Dijkstra search algorithm, and the artificial potential field method. The algorithm solves the problem of shortest distance path planning for large-scale target points. Reference [18] proposes a shortest trajectory planning algorithm for UAVs for embedded GPU by optimizing the relevant control parameters of a differential evolution algorithm, which improves the speed of path planning, reduces the computational cost, and aims at the shortest path distance to obtain a better UAV path. Reference [19] compares the performance of different computational intelligence methods to realize UAV path planning in offline and online computing and two-dimensional and three-dimensional environments, and it verifies that the obstacle avoidance path planning process of the UAV based on Dubins curve reduces network delay and improves data transmission rate. Reference [20] firstly solves the initial path of traversing the sensing node through the traveling salesman problem and then uses the communication range of the sensing node, so that the UAV does not have to fly directly above the node but only needs to be within its communication range, predetermining the task point, shortening the length of the whole data collection path, and reducing the energy consumption of the UAV. Reference [21] proposes a fast cruise path algorithm for UAVs. The algorithm starts from the specified starting point, traverses each task point once and only once, and finally reaches a flight path at the specified end point. The distance between mission points is taken as the decision variable, and the shortest flight path is taken as the optimization objective function so as to achieve the purpose of short path distance and least energy consumption. Reference [22] proposes the LMP (loss minimization problem in UAV-enabled WSNs) path planning method, which realizes a UAV to plan the path with approximate minimum energy consumption when performing multiple objectives and tasks. This scheme not only considers the energy consumption of the UAV flight, circling, and data transmission, but it also meets the energy constraints of each UAV, which minimizes the total energy consumption of multiple UAVs. Reference [23] proposes an OVTP (objective-variable tour planning strategy for mobile data gathering in partitioned WSNs), which implements the energy-saving path planning problem with full coverage constraints. This paper focuses on the relationship between the energy consumption and flight speed of a straight path of a given length. For each straight path in the planned path, the speed that optimizes the flight energy consumption is selected for UAVs to realize energy consumption optimization.

2.2. UAV Data Collection Algorithms

The number of task points in the path will directly affect the energy consumption of completing the task. Based on the premise of meeting the application requirements, as few task points as possible are determined, and the flight distance of the UAV is further shortened, and the flight energy consumption is reduced by optimizing the task quantity.
In Reference [24], cluster members are self-organized, and the collected data are periodically transmitted to the cluster head, which is responsible for communicating with the UAV and transmitting the collected data of the cluster. At the same time, in order to avoid the high energy consumption of cluster heads, the author dynamically replaces cluster heads in a rotating way, which leads to the UAV constantly updating its path with the replacement of cluster heads. In reference [25] the factors affecting cluster head selection are weighted and summed and then selected by the particle swarm optimization algorithm, but the algorithm did not give the relevant expressions for UAV flight time and distance. In order to balance the flight energy consumption of sensing nodes and the UAV in collecting sensing node data by clustering, reference [26] clusters sensing nodes according to their maximum hop count and uses the 2-opt method to plan the shortest path to reduce the flight distance and energy consumption of the UAV. By reducing the maximum hops and weighing the relationship between flight energy consumption and network energy consumption, the appropriate cluster division and path planning are realized. KKT (an iterative algorithm to solve it utilizing the Karush–Kuhn–Tucker condition) is proposed in reference [27]. Firstly, the algorithm clusters each IoT node based on the communication range of the UAV and gives the path planning algorithm with the shortest flight time. For the maximum–minimum rate problem, the nonlinear Perron–Frobenius theory is used to transform the maximum–minimum rate problem into an equivalent conditional eigenvalue problem, and an iterative algorithm is used to optimize the optimal solution of the problem. Finally, the numerical results are given. Reference [28] uses the fast circle fitting algorithm to cluster the sensing nodes and determines the center position of each cluster so that each node in the cluster can directly transmit data with the UAV located in the center of the cluster in a single hop. Then, taking the center position of the cluster as the task point, the traveling salesman problem (TSP) problem solving algorithm is used to plan the UAV path. When the UAV arrives at the cluster center, it collects the data of each sensing node in the cluster in a predetermined order. Reference [29] proposes a method to plan the shortest flight path for UAV to collect data while flying. This method firstly solves a sensing node access sequence by the conventional TSP method, and then it adjusts the path segment between two nodes with overlapping communication ranges and determines a new path point through rotation, optimization, and smoothing, thus shortening the flight distance. Reference [30] determines the path point at the communication range boundary of the sensing node, shortens the flight distance, and then further optimizes the data collection path by using the heuristic algorithm of point replacement and line replacement. Reference [31] firstly divides the area where sensing nodes are deployed into several unit partitions, collects the data of all sensing nodes in each unit partition, and proposes a path optimization algorithm combining the genetic algorithm and ant colony optimization algorithm to traverse the unit partition. Reference [32] firstly models the communication energy consumption of ground nodes and then models the flight energy consumption of fixed-wing UAV in circular and straight flights, respectively, and finally gives a Pareto optimal trade-off scheme between flight energy consumption of the UAV and communication energy consumption of ground nodes under these two trajectories. Reference [33] establishes an evaluation model of the battery performance state based on charge and discharge conditions and proposes a path planning algorithm considering battery performance degradation. According to the change of battery performance, a feasible trajectory is found to minimize the energy consumption of the UAV.

3. Materials and Methods
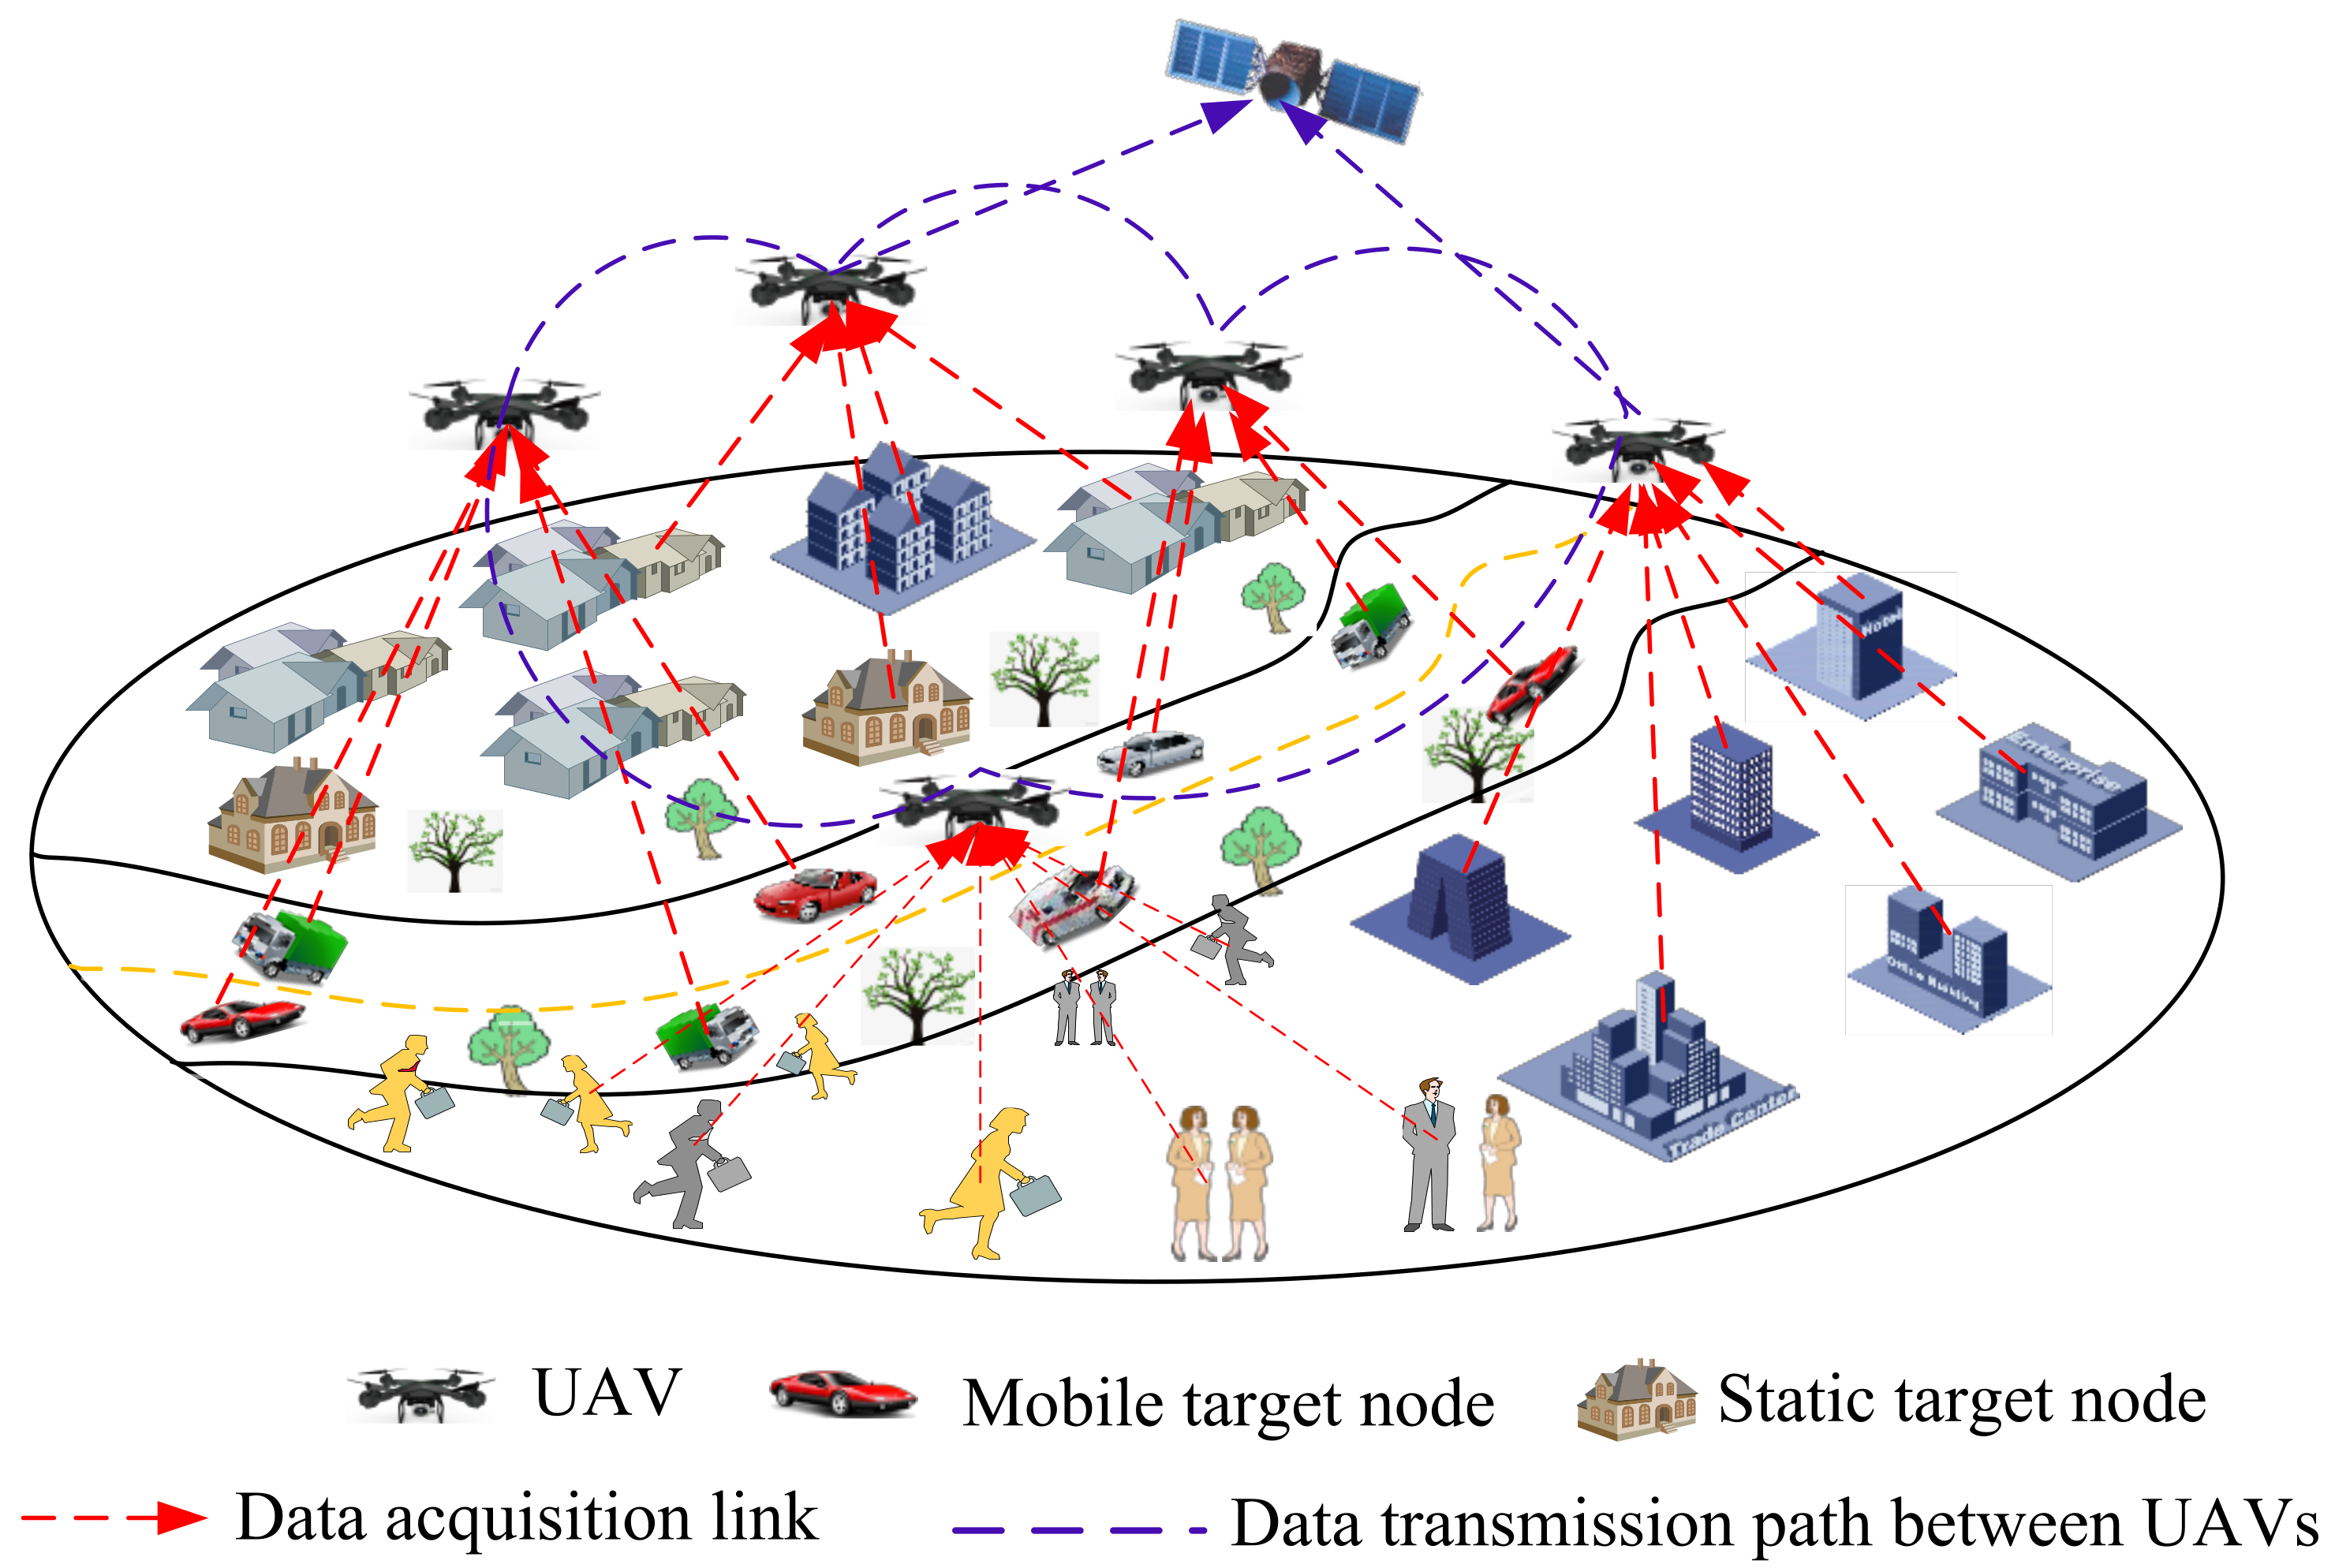
Decision variables, objective functions, and constraints are the three elements of optimization problems. According to the previous description and analysis, we can see that the three elements of the UAV energy consumption optimization path planning problem are as follows: the path is its decision variable, the relationship expression between the path and energy consumption is the objective function, and the restriction in the problem is the constraint condition. The path is described by the characteristics of the path, so the first two elements can be transformed into the following: the characteristics of the path are decision variables, and the relationship expression between the characteristics of the path and flight energy consumption is the objective function. In order to obtain accurate estimation of UAV energy consumption, a better nonlinear regression prediction model is needed. Therefore, to solve the nonlinear regression prediction model, we can directly adopt the linearization method and then optimize it by gradually approaching so as to obtain a more optimized nonlinear regression prediction model that meets the application requirements. The Gauss–Newton method is a classical step-by-step iterative approximation method, so this paper chooses this method for iterative approximation to further optimize the energy consumption estimation model and improve its estimation accuracy. The parameters used in this paper are shown in Table 1.

3.1. Network Model

As shown in Figure 1, the system model considers that the UAV, the low earth orbit (LEO) satellite, and ground infrastructure cooperate to build an air–space integrated network for UAV-assisted computing offload and to restore the mobile communication network when the infrastructure in remote areas or emergency rescue areas is unavailable.
The energy consumption generated by the UAV mainly comes from two aspects. On the one hand, the UAV calculates the energy consumption caused by sending mission data to satellites. On the other hand, it comes from the energy consumption caused by the UAV flight.
The energy consumed by the UAV to send a computational mission to the satellite is
E t r = i = 1 t r P i t r t D d s t + α t + D n d s t V d s t
where Ptr represents the power transmitted by the UAV in time slot t; Dds and Dnds respectively represent the number of collected numbers of single machine and UAV clusters in time slot t; Vds represents the average flight speed of the UAV. The UAV cluster transmission power set can be expressed as
P i t r = P t r P t r i = 1 , P t r i = 2 , P t r i = 3 , P t r i = K
The moving speed of the satellite is much greater than that of the UAV. Therefore, the conversion between the UAV and the satellite caused by the periodic motion of the satellite should be considered. The connection between the UAV and the satellite will last for at least a period of time without instantaneous change. When the satellite acts as a relay node, the link volume between the UAV and the satellite is much larger than that between the UAV and the moving target, so UAV collection and transmission calculation tasks can be carried out simultaneously.

3.2. Data Collection of EDC-UAVIIoT

During the data collection process, the sensor nodes that perceive and obtain the interested information in the monitoring environment are called source nodes. The mode in which multiple source nodes send data to a fixed base station through multi-hop transmission is called the converging data transmission mode. In the process of data transmission, the potential nodes whose energy is consumed too early in the transmission path are called energy bottleneck nodes, and the area where energy is consumed too early due to excessive communication load is called the energy bottleneck area. Due to the fixed position of the base station, the energy bottleneck area is more likely to appear in the surrounding area of the base station. In order to save energy, the source node si requests the node sj within its own communication range to forward the data, and then the node si and the node sj become neighboring nodes. Assuming the coverage range of node si is Rc, the distance between node si and node sj can be represented as dist(si, sj), and then the set of neighboring nodes of node si is represented as
S i = s j s j S , d i s t s i , s j R c
In the design of the WSNs data collection algorithm, the energy consumption model of sensor nodes is very important. In the first-order wireless communication energy consumption model widely used in many studies, the amount of energy consumption generated by wireless signal transmission depends on the size of the transmitted data and the distance of transmission, and the energy consumption calculation formula is
E T x k , d = E e l e c k + E a m p k , d
E a m p k , d = k × E e l e c + k × ε f s × d 2 d < d 0 k × E e l e c + k × ε m p × d 4 d d 0
E R x k = k × E e l e c
wherein d is the distance through which node information is transmitted, k is the number of bits of transmitted information, Eelec is the energy lost by the transmitting circuit to send or receive each bit of data, and the value of the sum of parameters of transmission amplifier model parameters εfs and εmp depends on the size of parameter d. If d < d0, it means that the energy consumption of transmitted data adopts the free space model, that is, the energy loss is proportional to the square of d. Otherwise, the path fading channel model is adopted, that is, the energy loss is proportional to the fourth power of d.
Assuming K coverage areas within T time slots have successfully collected data, the average amount of data successfully transmitted by the network can be represented by the average sum of multiple coverage areas:
D a t a s u c _ r a t e i = 1 N i = 1 I D a t a s u c _ r a t e i = 1 I i = 1 I A i
where Ai represents the area of the ith coverage area, and the area of Ai can be represented as
X i = D a t a s u c _ r a t e i + 1 D a t a s u c _ r a t e i A i = X i 2 X i 2 + X i = X i 2 + X i 2
where Xi represents the difference between the amount of data successfully transmitted at i + 1 times and the amount of data successfully transmitted at the ith time. For the convenience of studying the problem, this paper assumes that the difference of data quantity between the UAV and WSNs every two adjacent times is a fixed value; therefore, when the data transmission reaches a steady state, there are
A i = lim i A i = E A i E X = E X 2 E X + 1
From Formula (9), it can be seen that Xi is a random variable with independent distribution; the communication model between UAV and sensor nodes can be represented as
E Z i = E i = 1 I E X i + E Y i
The second-order matrix is represented as follows:
E Z i 2 = E I E X i 2 + Y i 2 + 2 X i Y i + E I 2 E I E X i + Y i 2
When the probability of packet loss is δ during data transmission, E(I) is expressed as
E I = 1 1 δ
E I 2 E I = 1 + δ 2 1 δ 2 1 1 δ = 2 δ 1 δ 2
When any UAV or satellite is used as a relay node, its distribution state obeys the Bernoulli equation; then,
i = 1 I i · x i = x 1 x 2 E Z i = i = 1 I i · 1 λ i λ = 1 + 1 λ
The first-order equation is converted into the second-order equation, and the following can be obtained:
E Z i 2 = i = 1 I i 2 1 λ 2 λ = 1 λ 2 λ λ 2
For the entire UAV cluster, the average amount of data collected is
D a t a s u c _ r a t e = E Z i 2 + 1 λ 2 λ / λ 2 + 2 E Z i 1 / λ 1 E Z i + 1 / λ 1 + 1 E δ E δ / 1 E δ 2 E Z i + 1 / λ 1
Theorem 1. 
The problem of optimizing the maximum target of a UAV cluster is an NP problem.
Proof. 
Before solving the NP problem, it is necessary to ensure that the network consumes the minimum energy while minimizing the network delay, that is, to achieve the minimum energy consumption of the entire network while satisfying the upper limit of network delay. The UAV performs data collection on the WSNs network based on spatial and temporal continuity. For a specific network, the UAV determines the energy status of the sensor nodes and the hovering position of the UAV before collecting data. When the sensor nodes send the collected data to the cluster head node in a multi-hop manner, the flight distance of the UAV can be converted into the shortest distance of the UAV flight. By aggregating the data through the cluster head node in the network and converting it into the UAV’s moving distance, and constraining the energy through Formula (31), the UAV flies to access all nodes in the WSNs in the shortest way, and minimizing the UAV’s flight distance is a combinatorial optimization problem; this problem can be transformed into the traveling salesman problem (TSP), considering that the shortest flight distance of the UAV is equivalent to the shortest path of traversing all nodes in WSNs. Therefore, the problem of minimizing the UAV’s flight distance can be modeled as a TSP combinatorial optimization problem, that is, an NP problem.
The proof is complete.□
Theorem 2. 
When there are enough nodes n in WSNs and all nodes forward data with probability p = ln n / N ln ln n 1 2 + 1 N n = 1 N p n q n , all receiving nodes complete data reception with an approximate probability of 1.
Proof. 
WSNs is a self-organizing random network, and n is large enough to make the data transition probability p. When the network nodes forward data with pnp, all the data information on the path can be received. When a network node forwards data with pn < p, only a few neighbor nodes of the source node can receive the data on this path, and other nodes cannot receive the data information. For probability p, its true value depends on the topological structure of the whole network, and the topological structure of the whole network is calculated. Probability p belongs to a global variable, which is difficult to complete for a single node. In the process of data transmission, we generally use nodes with higher energy as relay nodes, which can effectively avoid the energy consumed by multiple state transitions. When any node on the path receives the data message, it continues to forward with p = qm + χ, where qm approaches p, and its average data forwarding probability is
p a v g = n = 1 N p m + χ n N
In this paper, the energy factor χ is introduced to adjust the distribution of relay nodes, so that the nodes with higher energy always act as relay nodes and vice versa. Then the energy factor χ is expressed as
χ n = 1 N n = 1 N p n q n
From Formula (18), it can be obtained that at N → ∞, (pnqn) → 0, i.e., limχn → 0. For the connected network G, the expected value of each node si in the subgraph Gs is greater than the minimum expected value of the connected graph G, so the expected value of the subgraph Gs tends to be 1.
E G s E G
According to the proof process in reference [34], it can be concluded that
E G ln N ln ln N
For the convenience of calculation, natural logarithms are used in this article. According to the property of E(G), it can be known that
d d P d ln N ln ln N
For a connected graph G, the node distribution obeys a Poisson distribution; then,
p d = n = d n 1 p d 1 p n 1 p n
Substituting Equations (19)–(21) into Equation (22),
p 2 E d 2 + p 1 p E d d ln N ln ln N
In a connected graph G, when any two nodes remain single-hop or multi-hop connected, the expected value of their connectivity is approximately equal to the number of nodes.
E d 2 = E d 2 + E d = N 2 + N
By substituting Formula (24) into Formula (23) and simplifying it, we can obtain
p ln N N ln ln N 1 2
If all nodes can receive data with a probability of approximately 1, pqm + χ, that is,
p ln N N ln ln N 1 2 + 1 N n = 1 N p n q n
The proof is complete.□

3.3. Energy Balance of EDC-UAVIIoT

In the whole UAV cluster data collection process, the blocking fading model is followed, and the accurate channel gain value can be obtained by the feedback information of the receiving node [35,36,37]. The frequency band of the radio frequency signal received by the radio frequency circuit of the receiving node is interfered with by random Gaussian white noise. This interference signal cannot be eliminated in theory and is a characteristic of the hardware of the electronic device itself. This Gaussian white noise may come from the antenna of the receiving node or the same frequency interference generated by other unknown transmitting devices sharing the frequency band. The radio frequency signals received in the target frequency band are passed to the energy splitting unit, which distributes the energy flow in a ratio to the corresponding information processing unit and energy harvesting unit. The formula for the channel capacity between the receiving node and the transmitting node is
C i j = W log 2 1 + P i j γ i j ρ i j I
Here, Pij refers to the radio signal transmission power between the transmitting node si and the receiving node sj; Pijγij refers to the signal-to-noise ratio from the transmitting side si to the receiving side sj; and W is the channel bandwidth. For data transmission, the maximum reliable data transmission rate Rij from the transmitting end si to the receiving end sj is less than the channel capacity Cij between the two nodes, i.e.,
R i j W log 2 1 + P i j γ i j ρ i j I
The data are also subject to the law of conservation of energy during transmission, so the energy Qmax collected by the receiving node sj from the sending node si is less than the spatial RF energy captured from the receiving node antenna, and its expression is
Q max P i j ρ i j I h i j H i j 2
h i j = ω i j d i j φ
Hij represents the radio channel gain from the transmitting node to the receiving node due to signal transmission path loss and antenna occlusion. ωij is a normalized constant, and its value is affected by the radio propagation characteristics of the environment in which the transceiver node is located. φ is the link loss index. Hij is a multipath reflection loss coefficient from the transmitting node si to the receiving node sj.
Now, the energy optimization problem is transformed into a nonlinear optimization problem, and the energy optimization expression is
max R , P , ρ U P , R , ρ
s . t . C 1 : Q max + Q min Q i j t o t a l C 2 : R min R i j R max C 3 : P min P i j P max C 4 : ρ min + ρ max 1 C 5 : R min i , j = 1 N W log 2 1 + P i j γ i j ρ i j I R max
Theorem 3. 
After the energy optimization problem is transformed into a nonlinear optimization problem, the function is convex under the constraint condition C1–C5.
Proof. 
Under the constraint condition C2–C5, all variables are linearly related, and Formula (27) has second-order differentiability. Therefore, the neighborhood of the objective function at a certain point is expanded by a Hessian matrix to approximate the original function by the Taylor pole number, which shows semi-negative definite, so C2–C5 has convex properties. On the other hand, because of the convex properties of Cij, U(P,R,ρ) also has convex properties and satisfies the linear correlation of variables (P,R,ρ), so the variable U(P,R,ρ) is also convex function.
The proof is complete.□
Theorem 4. 
The energy balance problem of sink nodes is optimized as follows without considering the movement of any nodes in WSNs except the failed nodes:
f S o p t = min i = 1 I e s i E e l e c × k s i + k s j × ε f s × R c 2 min e s i e s j + E e l e c × k s j k s i + ε f s × R c 2 k s i k s j 2 ε f s × k s i + k s j
Proof. 
In this paper, d < d0 is taken as an example to prove it. When d < d0, the energy consumption of sending data adopts the free space model. From the meaning of the question, it can be seen that there is no movable node in WSNs; that is, for WSNs, the transmission and reception distances remain unchanged. Therefore, the original question can be transformed into
min f S = i = 1 I e s i E e l e c × k s i + k s j × ε f s × d 2
Because the total amount of data transmitted in the whole network WSNs is a fixed value, and the communication radius is also a fixed value Rc, at this time, an eigenvalue of the optimization problem is Rc. That is to say, when d approaches d0, one eigenvalue of its equation is Rc, that is, d = d0 = Rc, which is substituted into Formula (33) and simplified as follows:
f S o p t = min i = 1 I e s i E e l e c × k s i + k s j × ε f s × R c 2
When a data message is transmitted bi-directionally between any two nodes, the minimum value of the difference between the residual energy of the sender (receiver) and the receiver (sender) can be expressed as
Δ e = min e s i E e l e c × k s i + k s j × ε f s × R c 2 e s j E e l e c × k s j + k s i × ε f s × R c 2 2 = min e s i e s j + E e l e c × k s j k s i + ε f s × R c 2 k s i k s j 2
The energy consumed by the amount of transmission and reception is controlled by the free space attenuation coefficient and the total amount of transmission. Therefore, for the sink node, which can act as both the sender and the receiver, the optimization of the energy balance problem consumed by each data transmission can be expressed as
f S o p t = min e s i e s j + E e l e c × k s j k s i + ε f s × R c 2 k s i k s j 2 ε f s × k s i + k s j
The proof is complete.□
Theorem 5. 
When the communication radius of the WSNs node increases, the length of the shortest path of the UAV will become shorter.
Proof. 
The planning problem of the energy balance line of UAV nodes is the optimization problem of maximizing the UAV cluster set. The UAV flight line is either a round-trip loop or it is a closed loop formed when flying WSNs clusters.
  • Discussion 1. When the UAV flight path is a round-trip loop, the increase of the communication radius of the sensing node will lead to the enlargement of the coverage area of the sensing node and extend outward to the coverage area. If the wireless communication radii of several sensing nodes in close spatial position are partially overlapped, then the UAV can complete data collection for all sensing nodes as long as it enters the overlapping area. Obviously, the coincidence of the communication radius of the sensing nodes enables the UAV to access more sensing nodes without changing the energy constraint of Formula (32), and because the communication radius of the sensing nodes increases, the number of intersection points of any two nodes increases, thus forming a path scheme dominated by edge paths. Therefore, the length of the distance flown by the UAV becomes smaller.
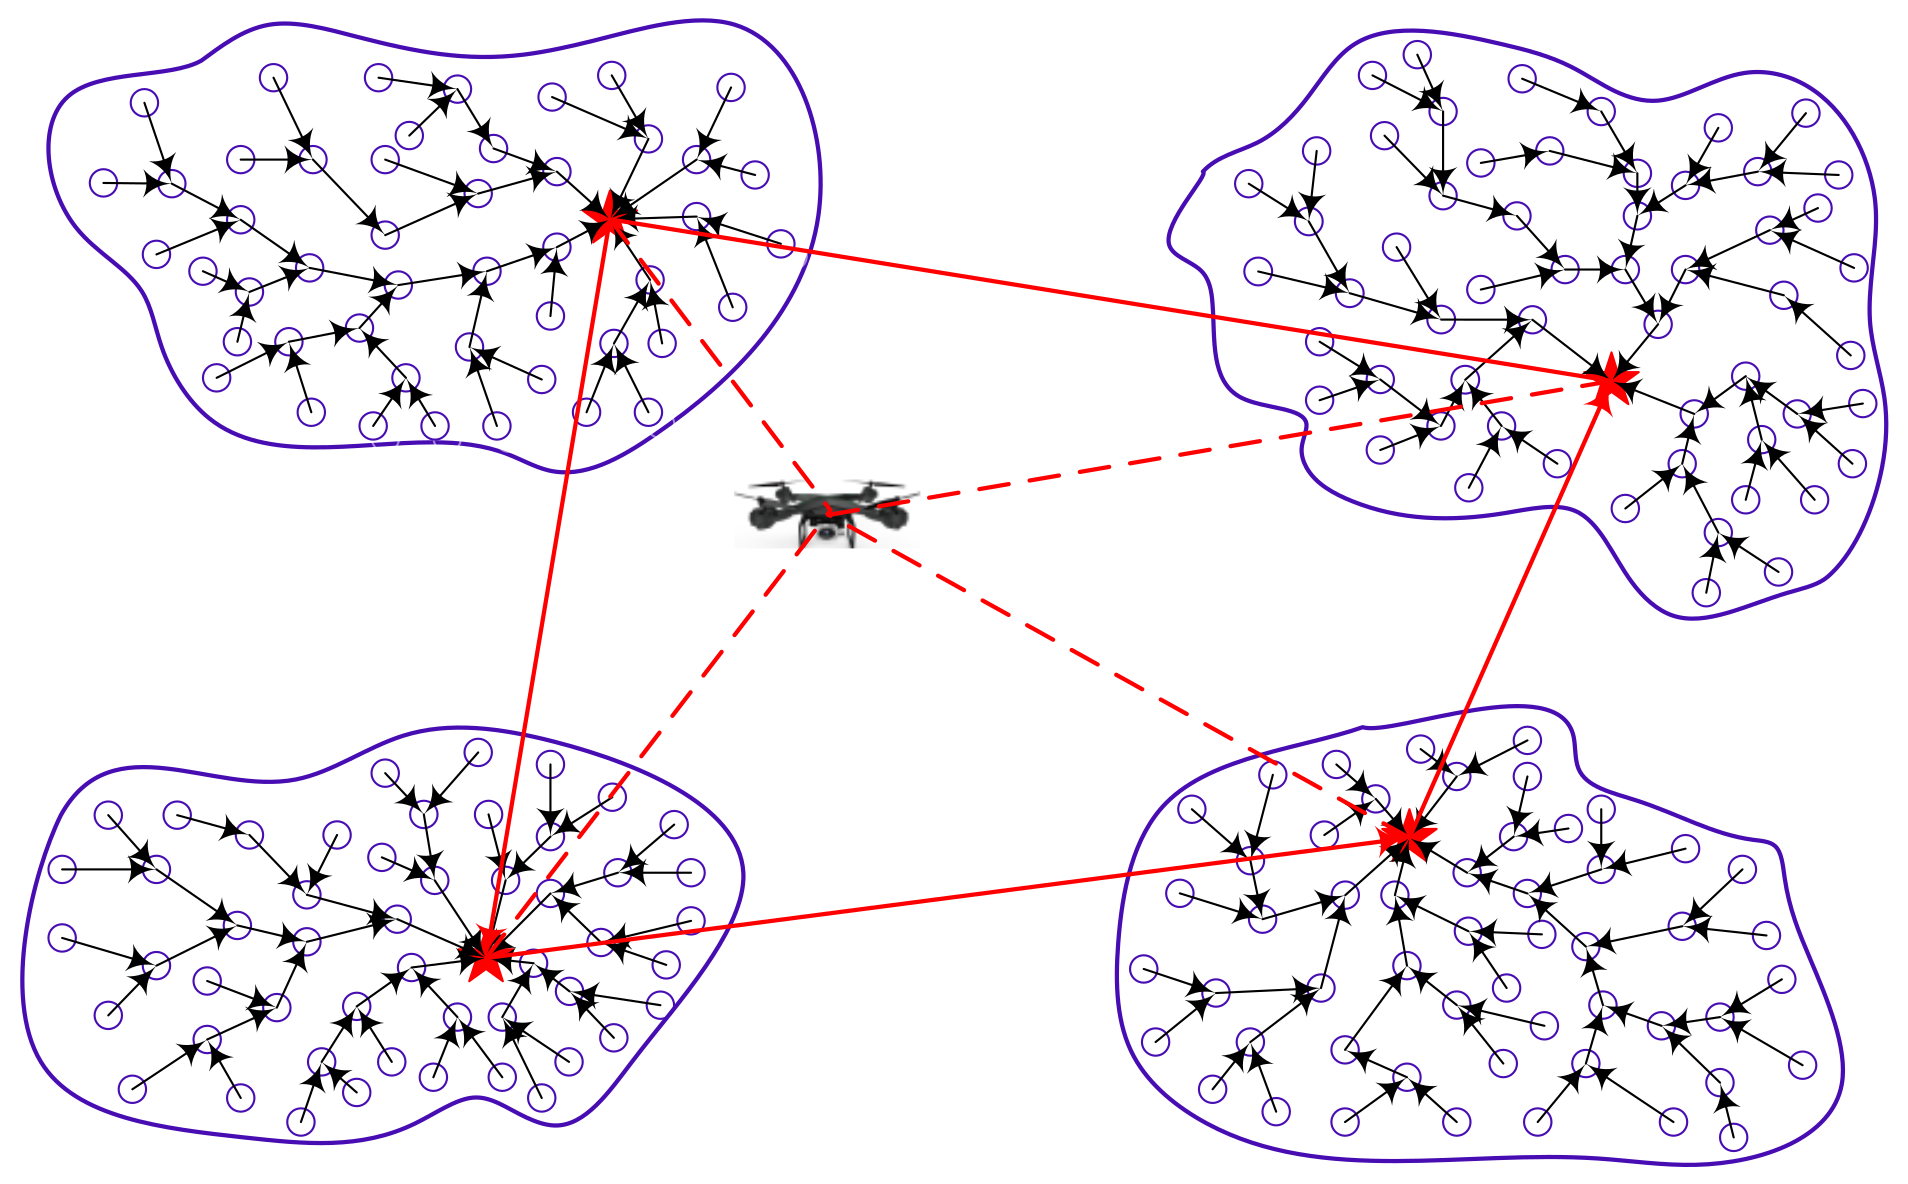
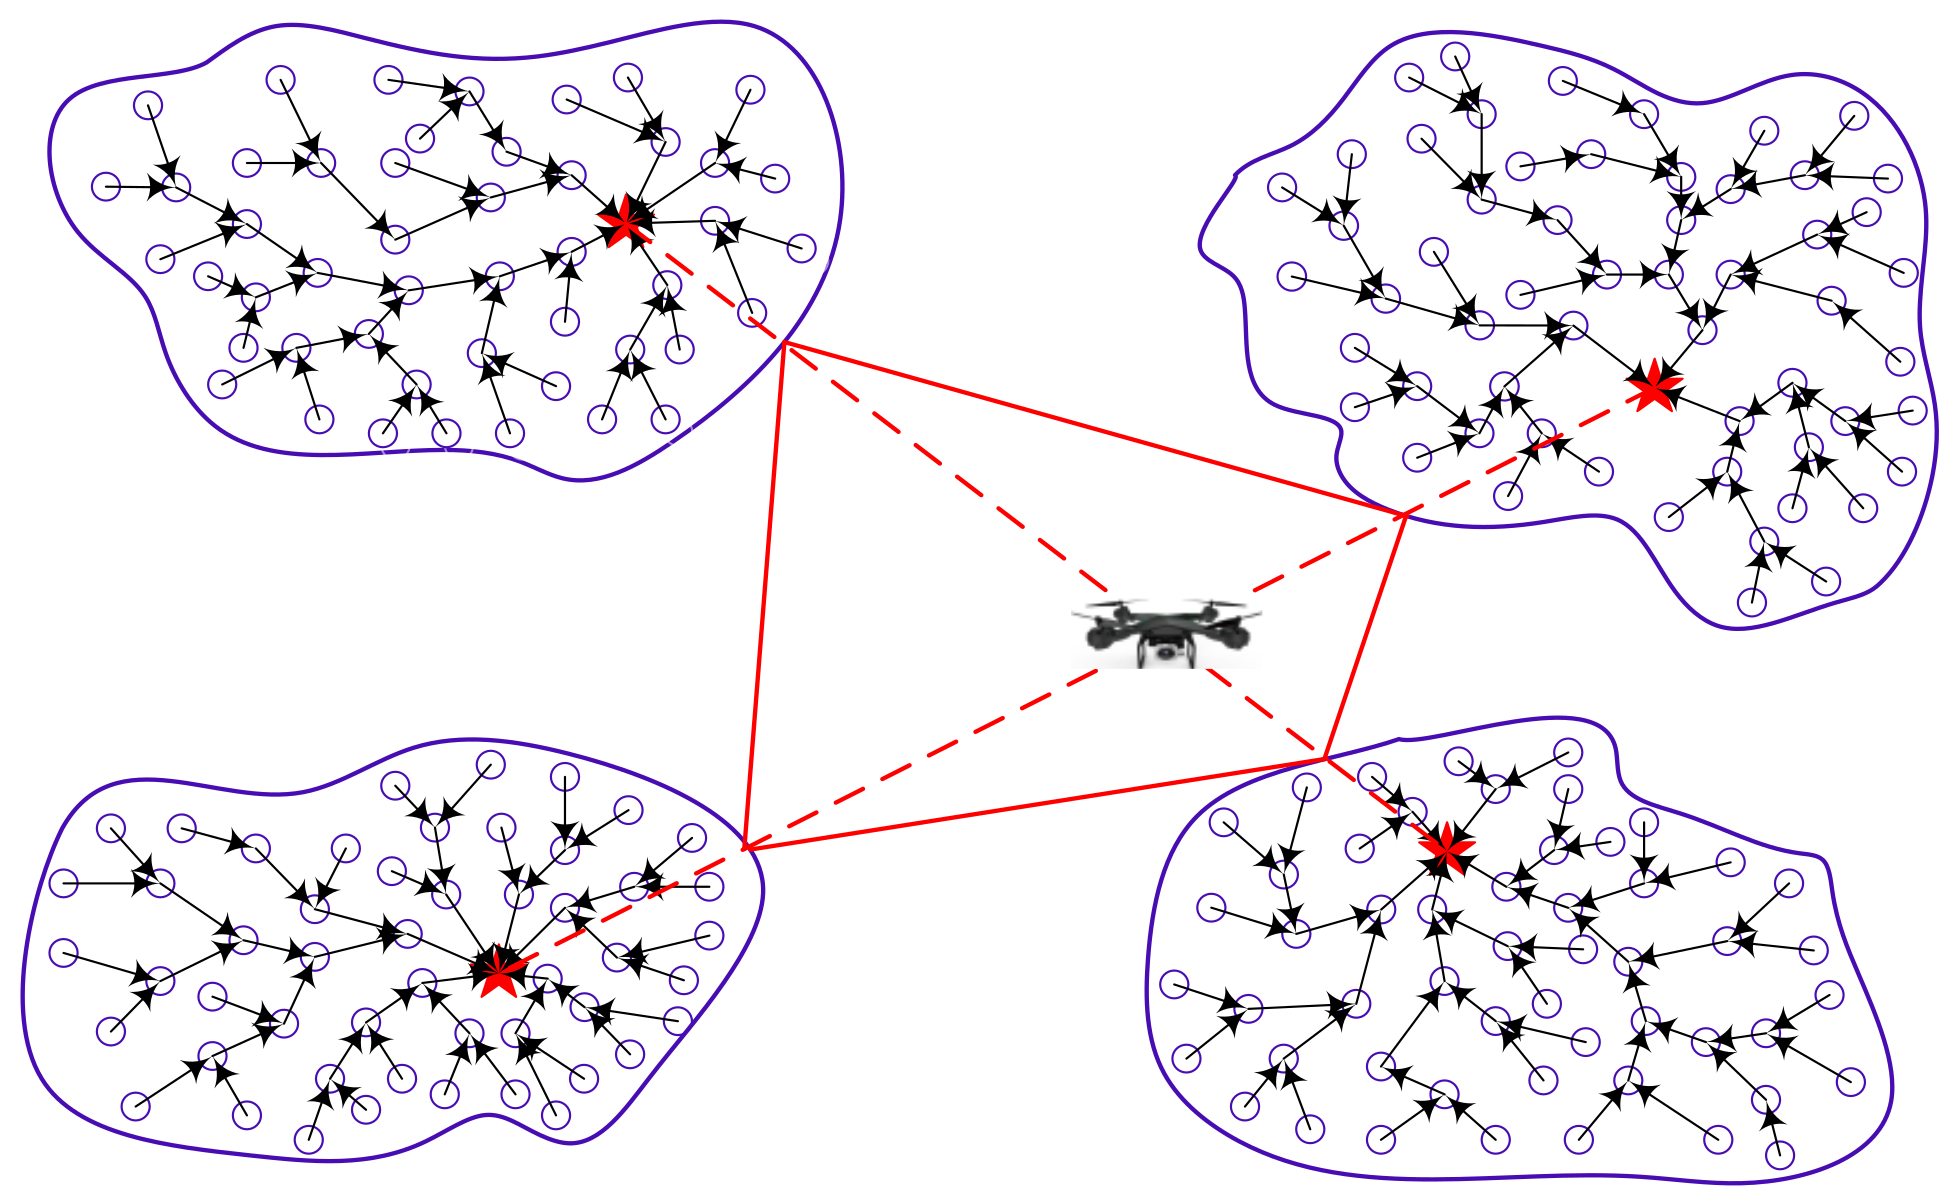
  • Discussion 2. If the line is the boundary of a closed polygon, when the communication radius of the sensing node increases, the residence point of the UAV is determined by the intersection of the perpendicular lines of the edges of any two diagonal cluster heads. According to the shortest line segment between two points, the distance between this resident point and any cluster head node is the shortest. At this time, the distance length flown by the UAV will become smaller. Figure 2 shows the path planning before optimization. Figure 3 shows the optimized path planning diagram.
The proof is complete.□

3.4. EDC-UAVIIoT Algorithm

The data collection process of the energy balance line between the UAV cluster and the mobile sink node includes the following steps: Firstly, the UAV cluster and the mobile sink node jointly plan the shortest mobile line. Secondly, the mobile sink node determines its own position information. Thirdly, the UAV cluster accesses all sensor nodes of WSNs according to the shortest path planned in advance to complete data collection. Finally, the mobile sink node is used to increase or decrease the communication radius to cover the sensing area so as to improve the UAV search ability. In the first step, under the joint action of the UAV cluster and the mobile sink node, the enumerated pruning algorithm is used to calculate the optimal path of UAV movement. In the second step, in the optimal path selection, the mobile sink node calculates its own position information through the positioning algorithm and establishes the route with balanced energy consumption. In the third step, when the mobile sink node accesses the sensing node in a multi-hop mode, the UAV collects data according to the optimal path planned in advance; at the same time, the mobile sink node completes the parameter conversion through the switching mechanism. In the fourth step, the size of the communication radius of the mobile sink node is changed to complete the coverage of the sensing area. At the same time, the UAV cluster is used to confirm whether the energy of the whole network is balanced and calculate the communication radius of the sink node in the next cycle. The process of data collection is as follows:
Step 1: Set the communication radius and other parameters of the sensing node. Before the first data collection, the communication radius of all sensing nodes is set to the maximum data transmission radius, that is, in other data collection cycles, the communication radius of sensing nodes is set by Step 5.
Step 2: Use the enumerated pruning algorithm or the variable separation algorithm to plan the route of the mobile sink node.
Step 3: Calculate the average data amount of data collection by using Formula (16), determine the communication radius of the sensing node again, and calculate the coverage area by using Formula (8).
Step 4: Use Theorem 2 to calculate whether the probability of forwarding data approaches 1. If it approaches 1, the path planned by the mobile sink node is the optimal path and vice versa; when data forwarding is finished, the sensor nodes in the whole network will send their own residual energy to the mobile sink node in a multi-hop manner.
Step 5: Using Theorem 4 to complete the calculation of the optimal energy balance of the sink node, dynamically adjust the communication radius of the sink node and return the mobile sink node to the initial position; when the residual energy of the sink node is less than Formula (36), the algorithm ends.
The EDC-UAVIIoT Algorithm is as follows:
Algorithm 1: EDC-UAVIIoT algorithm
Input: Ptr, Rc, Eelec, N, λ, φ, ρ, δ
Output: Qmin
While (i != Null)
 {
  link[i].node = calculate.RC_max
  long[i].node = calculate.node[i]
  Data_average = Datasuc_rate[i].node
  Xi = Calculate.Ai
  i = i + 1
  if (p→1)
   long[i].node = optimal.node[i]
  else
   break
   nodes[i].ms = node[i].Qmin
  }
Calculate the value of Qopt
  if (Qopt < Qmin)
      Qmin = Qopt
      Output Qmin
  else
      Output Qmin
Now we analyze the time complexity of the EDC-UAVIIoT algorithm. In Step 1, the nonlinear function of the line is transformed into a linear function, and in the least ideal case, all variables are transformed into linear relations, so the time complexity of the algorithm is O(n). In Step 2, if the enumerated pruning algorithm is adopted, its time complexity is O(n). If the variable separation algorithm is used for planning, the time complexity is O(n2). In Step 3, this paper uses a circular method to calculate the average amount of data collected. Therefore, the time complexity is O(n2). In Step 4, in the process of calculating the optimal path, this paper uses the probability of nearly 1 to calculate the probability of data collection by sensor nodes in the whole network, and its parameters are linear, so the time algorithm degree is O(n2). In Step 5, the solution process is the same as in Step 4, so the time complexity is O(n2). The time complexity of the EDC-UAVIIoT algorithm is O(n2).

4. Results

Assuming that the network is a square area with sizes of 100 × 100 m2, 300 × 300 m2, and 500 × 500 m2, there are 3500 randomly distributed nodes in the network. Nodes only wake up in one of the randomly selected time units while staying asleep in other time units. The communication radius of the node Rc = 10 m. The media access control (MAC) mechanism exists to ensure the reliability of communication between nodes; that is, if the distance between any two nodes is less than Rc, they can receive data packets sent by each other. The packet size is 1000 bits, and the initial energy of each node is 5 J. In this paper, the EDC-UAVIIoT algorithm selects the representative distributed data persistence schemes LMP, OVTP, and KKT algorithms for comparison experiments. The comparison experiments were divided into 10 groups, each group was executed 30 times, and the experimental values were averaged.

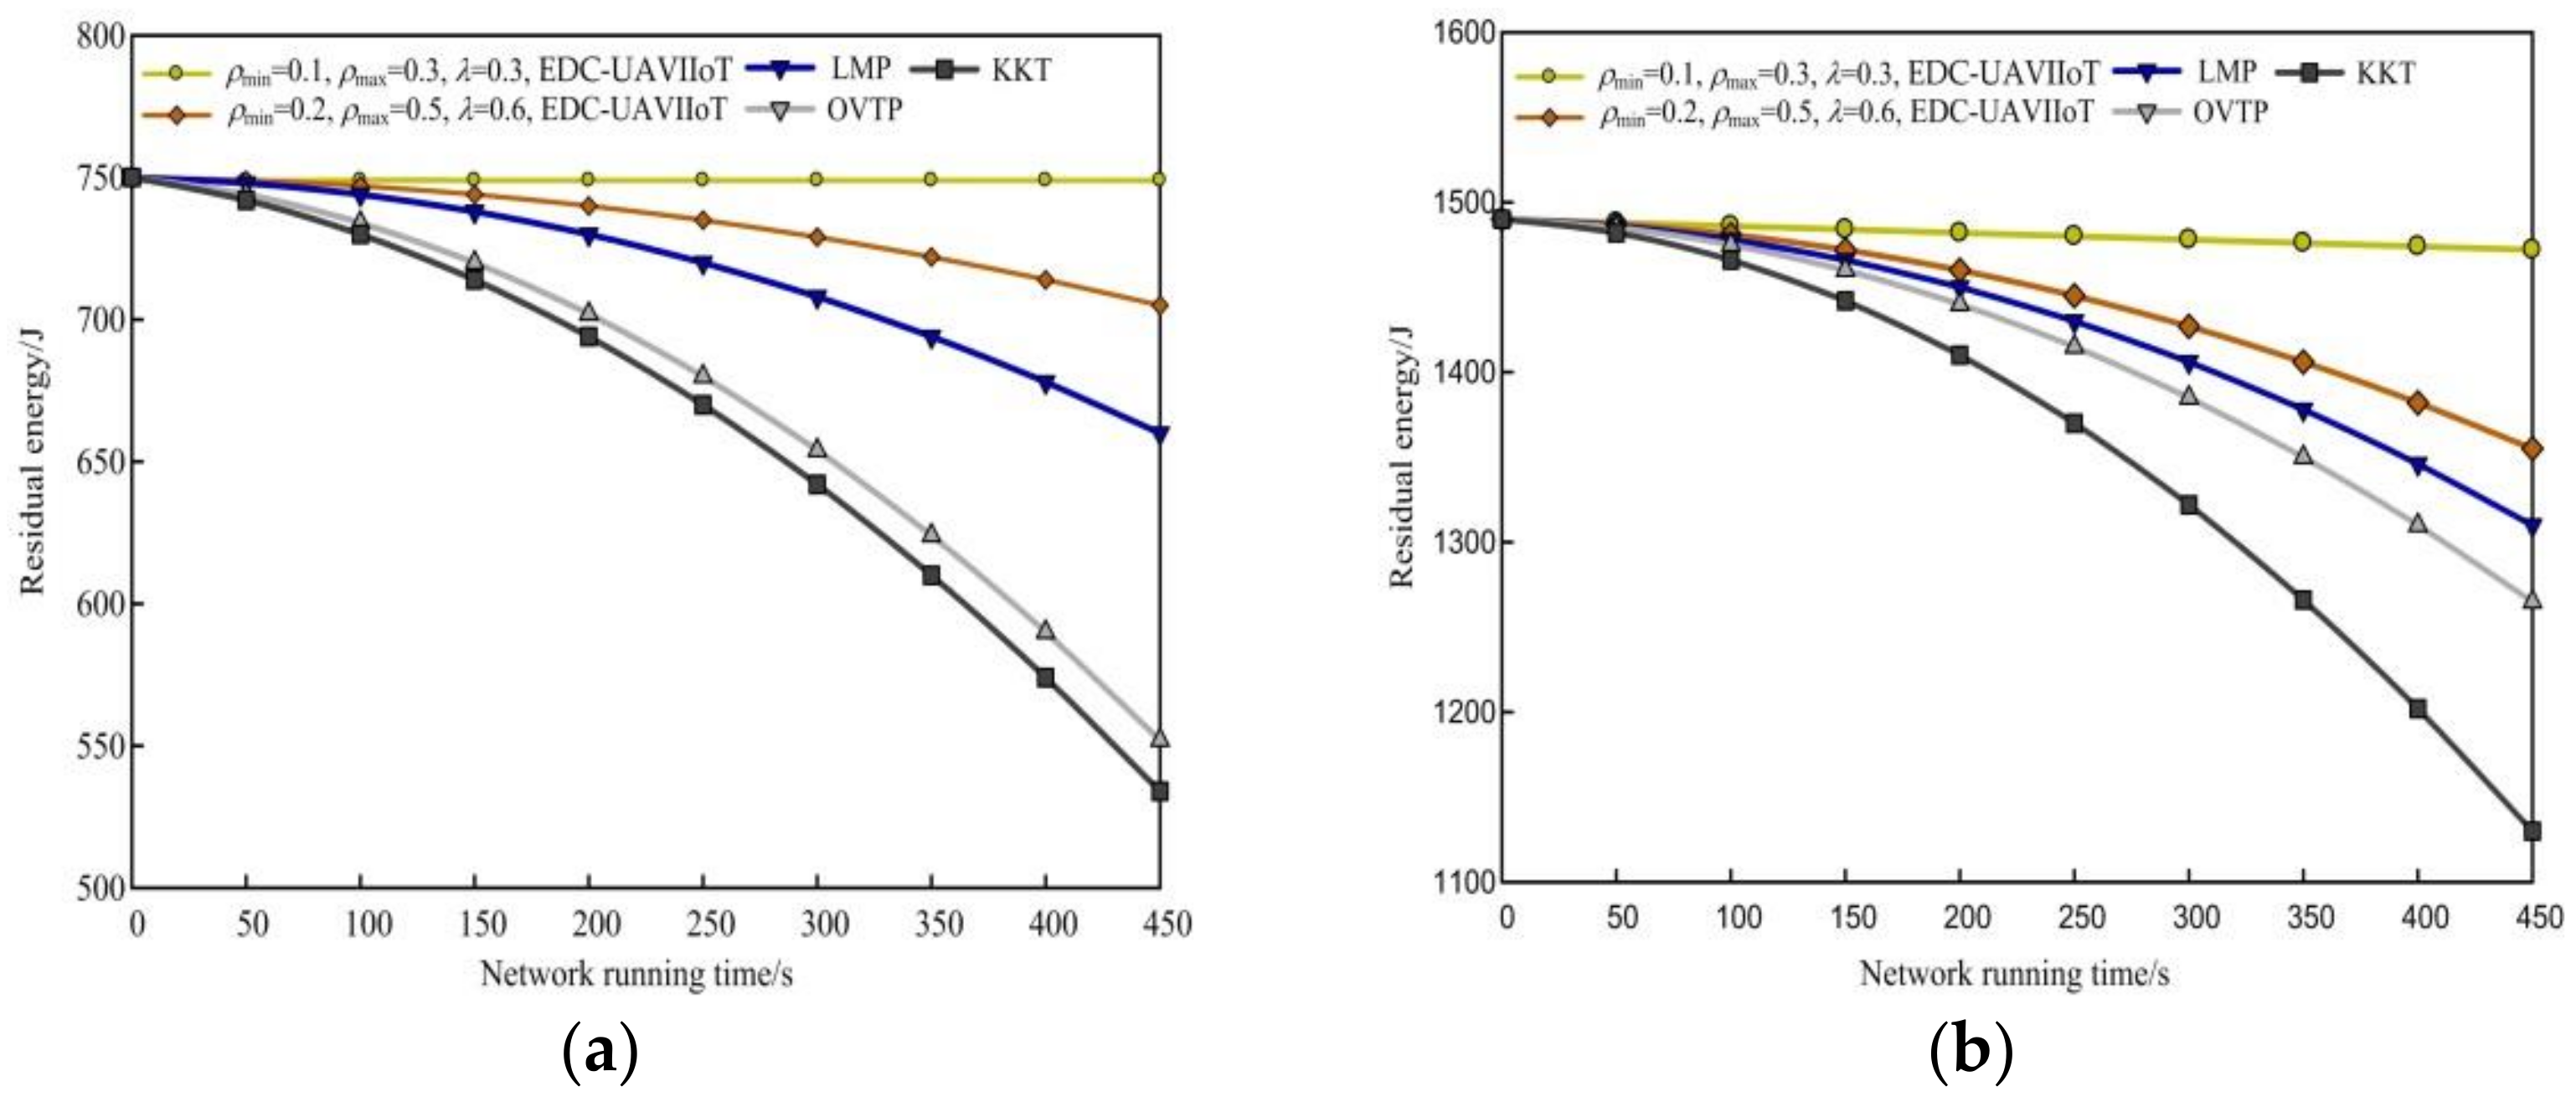
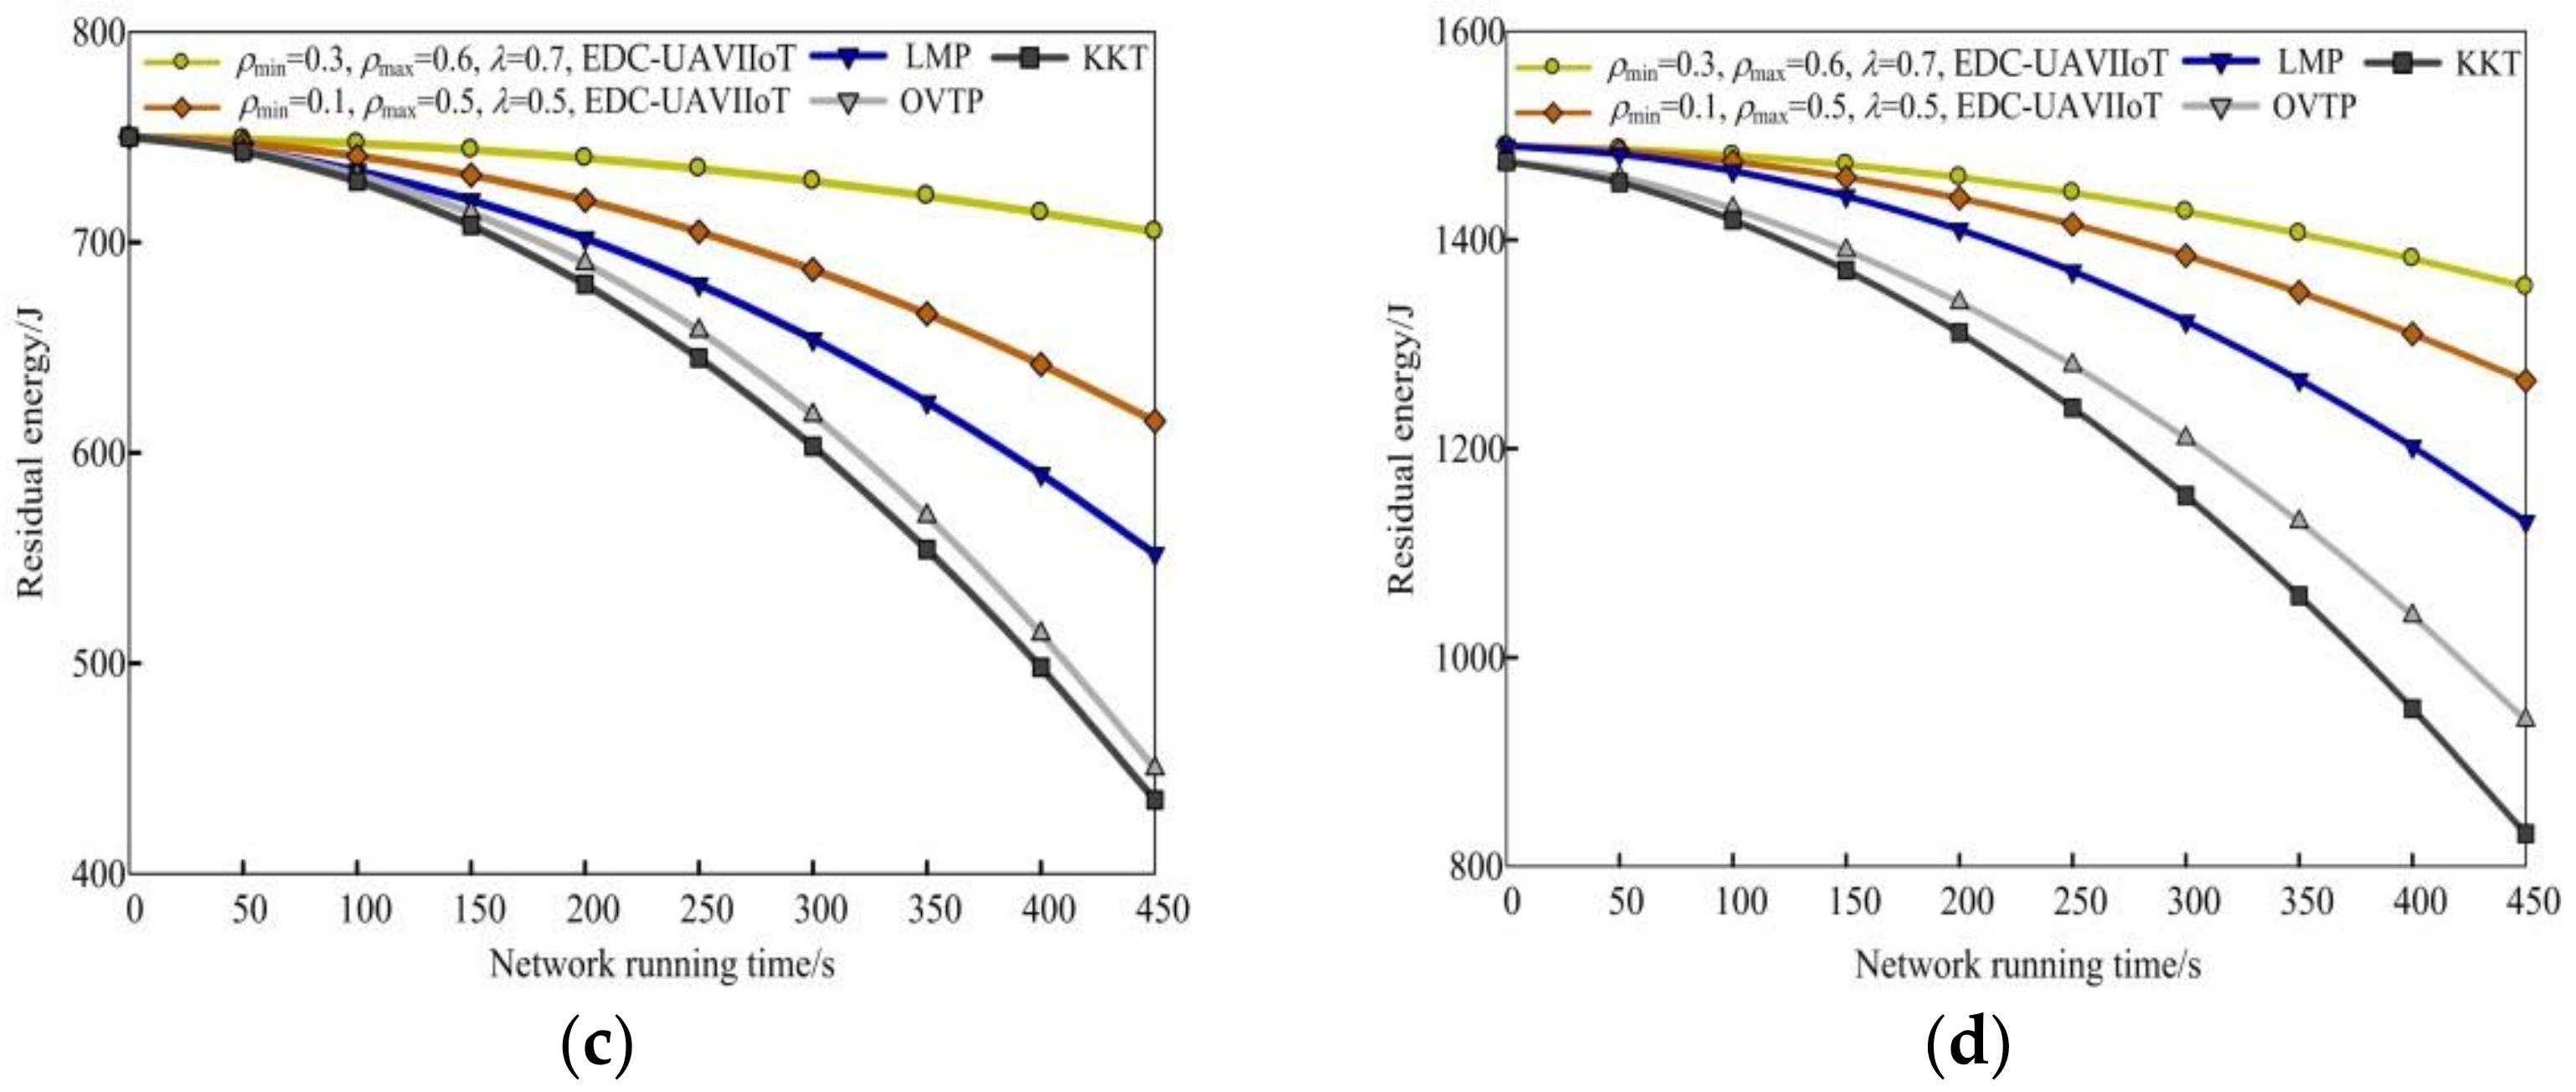
4.1. Network Energy Consumption

Figure 4 shows the schematic diagram of comparing the EDC-UAVIIoT algorithm with the other three algorithms in residual energy under different monitoring areas. The parameters used in Figure 4a,c are as follows: the first group is (ρmin = 0.1, ρmax = 0.3, λ = 0.3), (ρmin = 0.2, ρmax = 0.5, λ = 0.6); the second group is (ρmin = 0.3, ρmax = 0.6, λ = 0.7), (ρmin = 0.1, ρmax = 0.5, λ = 0.5). Taking 100 × 100 m2 as an example, it can be seen from Figure 4a that when t = 200 s, the residual energy corresponding to the four algorithms is 479 J, 740 J, 730 J, 702 J, and 694 J, respectively. When t = 400 s, the residual energy is 478 J, 714 J, 678 J, 590 J, and 574 J, respectively. It can be seen from the above residual energy values that the residual energy of the EDC-UAVIIoT algorithm in this paper is higher than of the other three algorithms. The main reason is that in the EDC-UAVIIoT algorithm in this paper, the sensing nodes use the same communication radius to send data in each round of data collection. When the amount of data sent is the same, the energy consumption of the sensing nodes is the same, and the mobile sink node can collect the data of all sensing nodes only by using one line. At the same time, when collecting data, the sensing nodes use the shortest communication radius to collect data, which uses the sensing nodes to consume inconsistent energy in the data collection process, so that some sensing nodes consume energy quickly, and the UAV needs to plan lines for many times to collect data of sensing nodes with fast energy consumption, while the other three algorithms simply use multi-hop sensor nodes to complete data transmission and collection, so the energy consumption speed is faster.

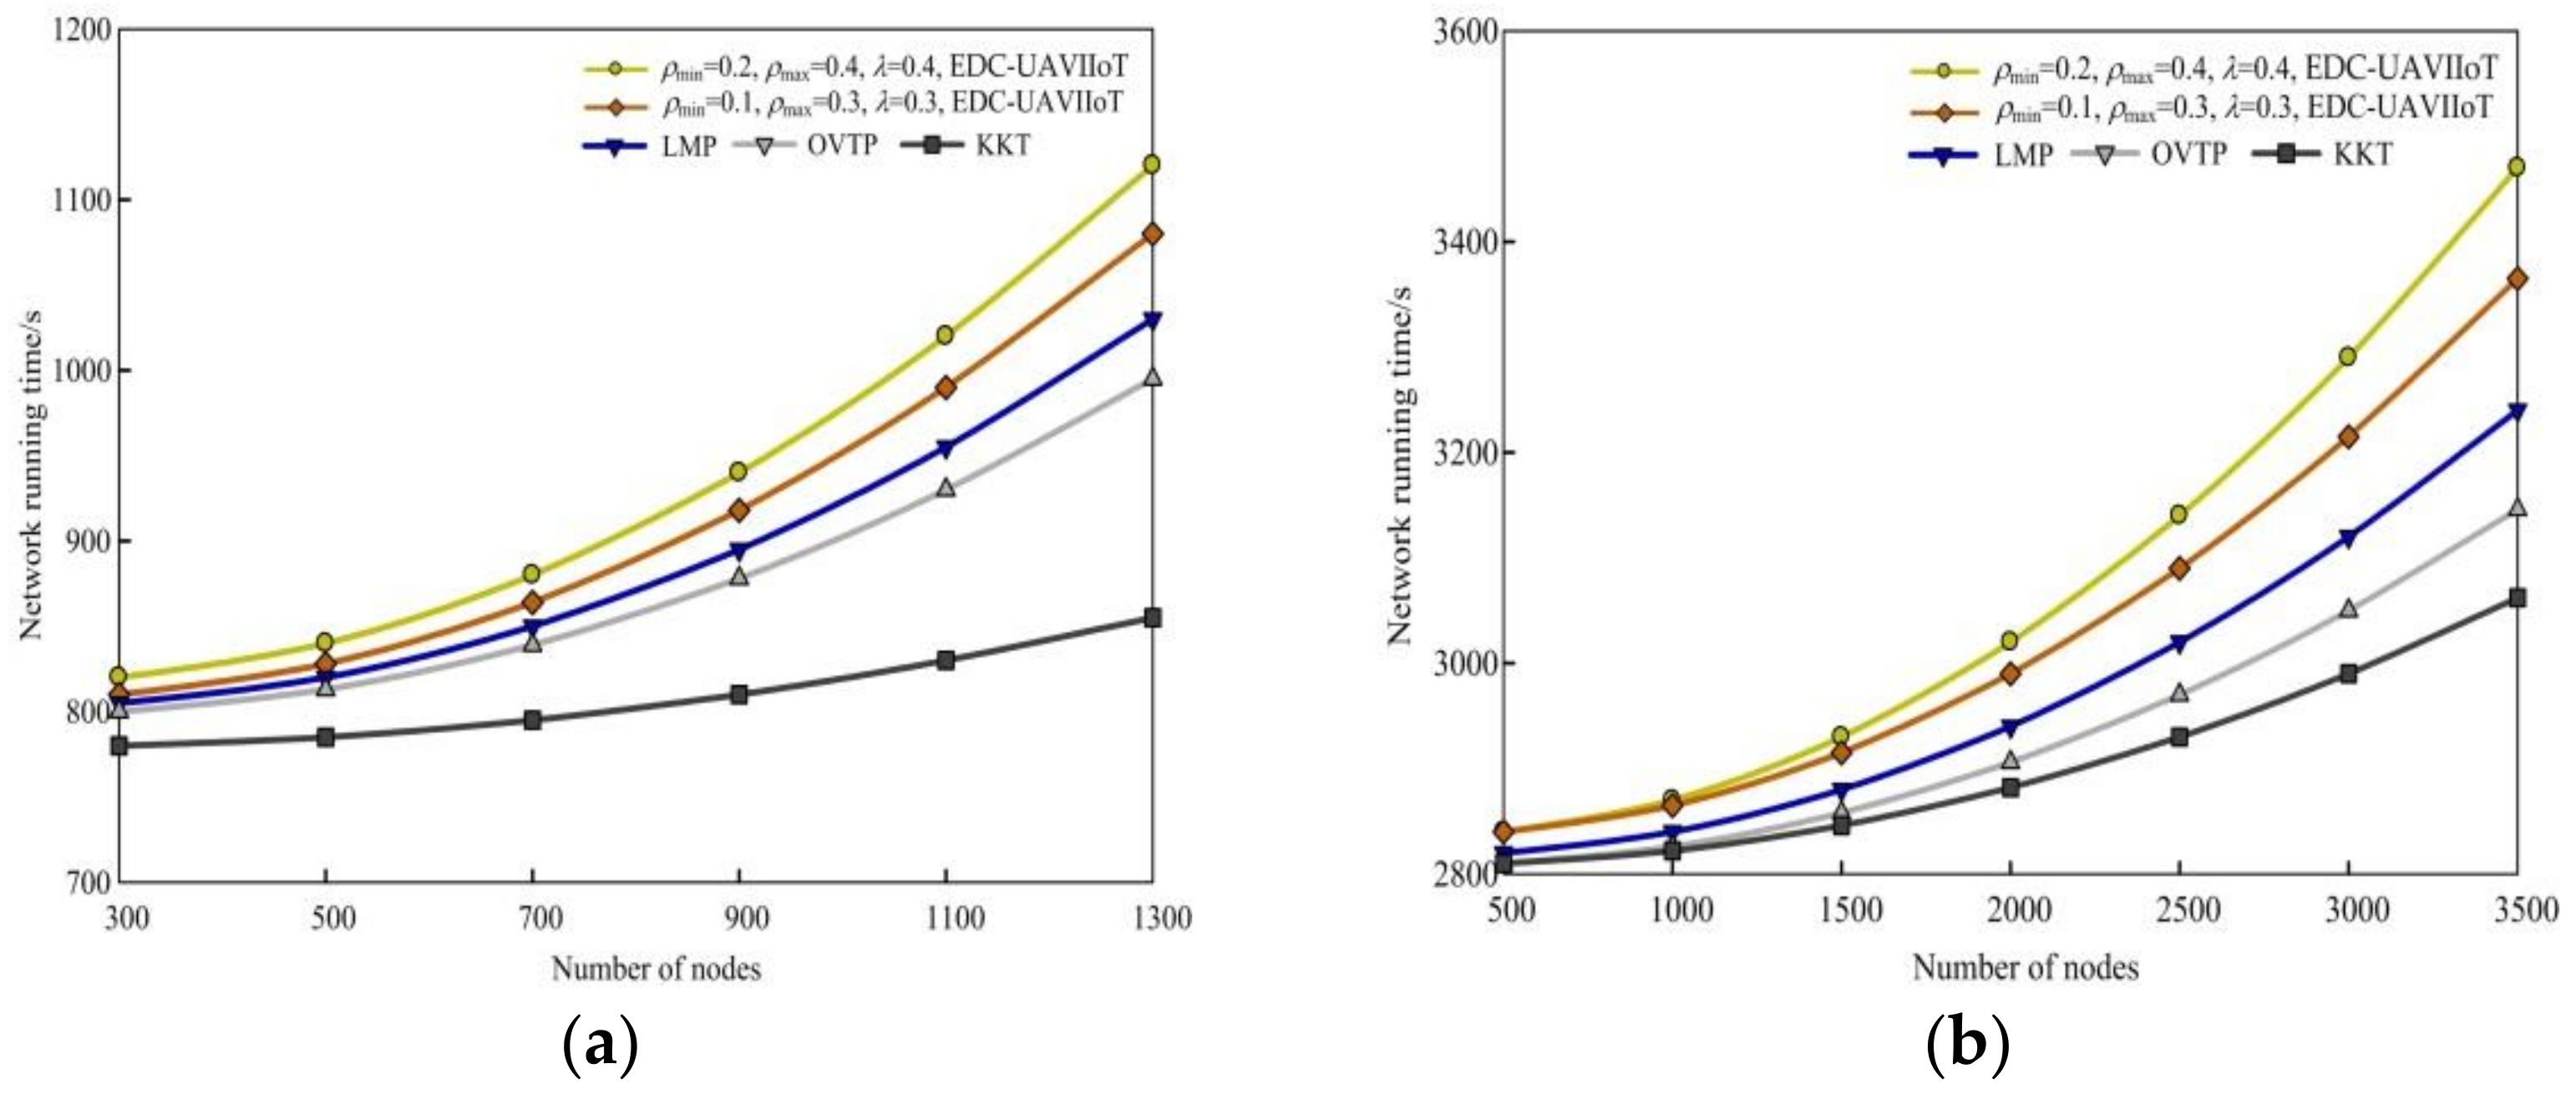
4.2. Network Running Time

Figure 5 shows the schematic diagram of comparing the EDC-UAVIIoT algorithm with the other three algorithms in network running time under different monitoring areas. The parameters used in Figure 5a,c are as follows: the first group is (ρmin = 0.2, ρmax = 0.4, λ = 0.4), (ρmin = 0.1, ρmax = 0.3, λ = 0.3); the second group is (ρmin = 0.3, ρmax = 0.6, λ = 0.7), (ρmin = 0.1, ρmax = 0.5, λ = 0.5). Taking 500 × 500 m2 as an example, it can be seen from Figure 5d that when N = 100 × 100 s and 8990 s, respectively; when N = 3000, 12,500 × 500 s, and 10,250 s. It can be seen from the above network running time values that the network running time of the EDC-UAVIIoT algorithm in this paper is higher than that of the other three algorithms. The main reason Is that the EDC-UAVIIoT algorithm in this paper distributes data by probabilistic directional broadcasting, and only a small number of sensor nodes are determined to forward data among a large number of sensor nodes, while all sensor nodes that do not participate in forwarding can turn into a dormant or listening state without forwarding data. Therefore, for the whole network, it saves the energy overhead of the whole network and delays the network life cycle, while the other three algorithms are distributed by random walking of multiple data copies, which requires a long path to complete the whole process, consumes a lot of network energy, and maximizes the delay, and the whole network runs in a short time.

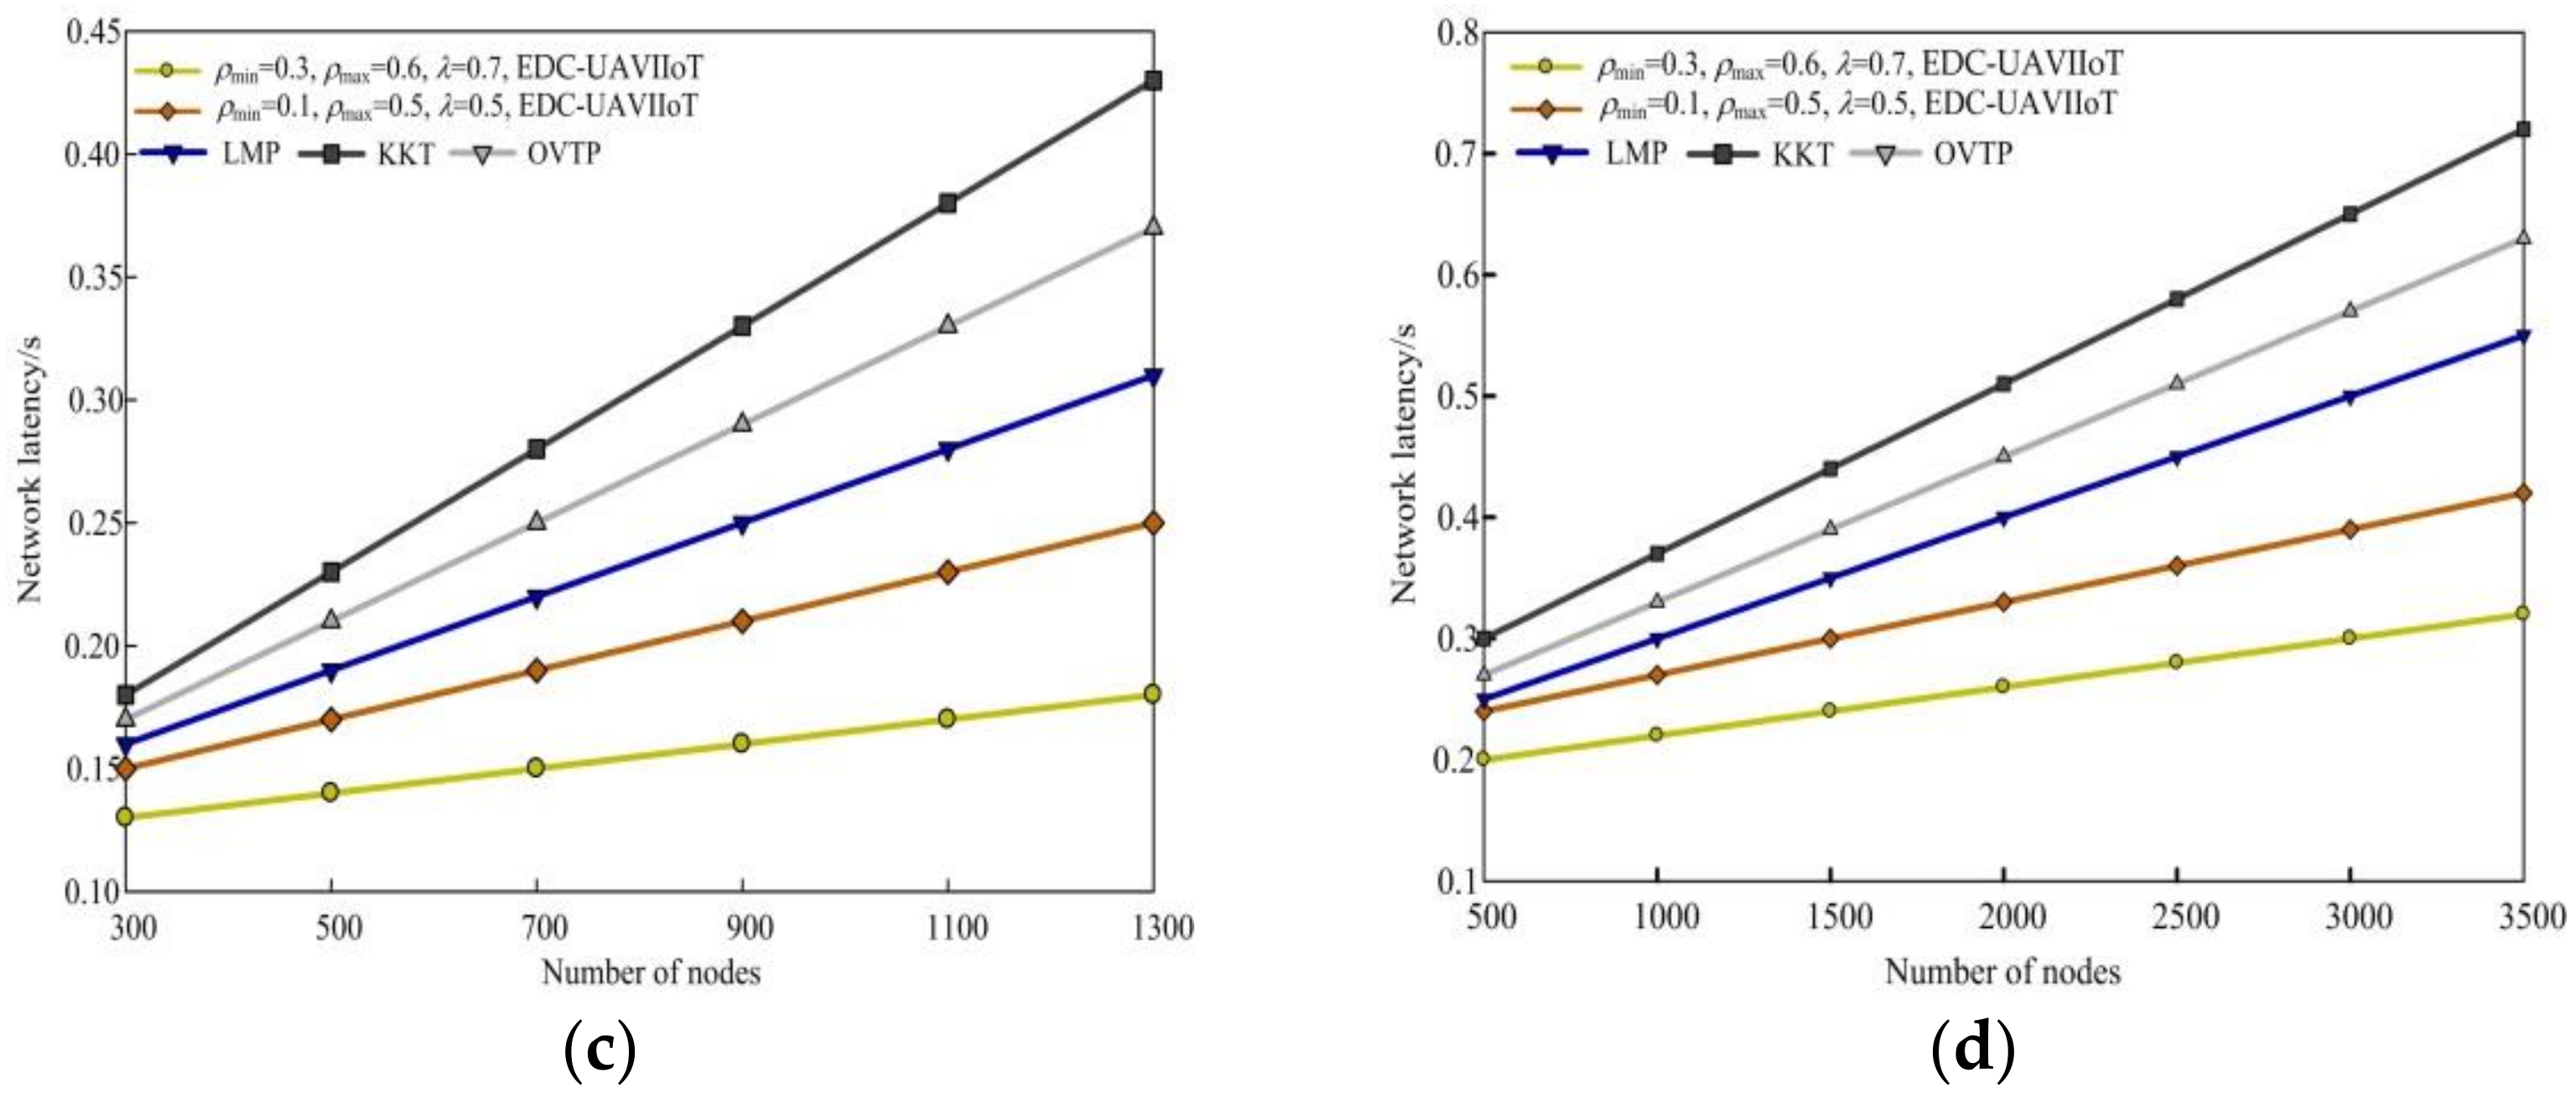
4.3. Network Latency

Figure 6 shows the comparison diagram between the EDC-UAVIIoT algorithm and the other three algorithms in network delay under different monitoring areas. The parameters used in Figure 6a,c are as follows: the first group is (ρmin = 0.2, ρmax = 0.4, λ = 0.4), (ρmin = 0.1, ρmax = 0.3, λ = 0.3); the second group is (ρmin = 0.3, ρmax= 0.6, λ = 0.7), (ρmin = 0.1, ρmax = 0.5, λ = 0.5). Taking 300 × 300 m2 as an example, it can be seen from Figure 6c that when N = 500, the network delays corresponding to the four algorithms are 0.14 s, 0.17 s, 0.19 s, 0.21 s, and 0.23 s, respectively; when N = 1300, the delays are 0.18 s, 0.25 s, 0.31 s, 0.37 s, and 0.43 s, respectively. It can be seen from the above network delay values that the network delay of the EDC-UAVIIoT algorithm in this paper is lower than that of the other three algorithms. The main reason is that the EDC-UAVIIoT algorithm in this paper uses one-time access to multiple nodes to complete data transmission and collection, thus reducing the average delay of data transmission and collection; the other three algorithms use random access to send and receive data. In each work cycle of random access, each sending node only transmits data to a randomly selected neighbor, so when the data are received by all nodes in the network, it needs to spend more transmission time, resulting in greater energy consumption and delay.

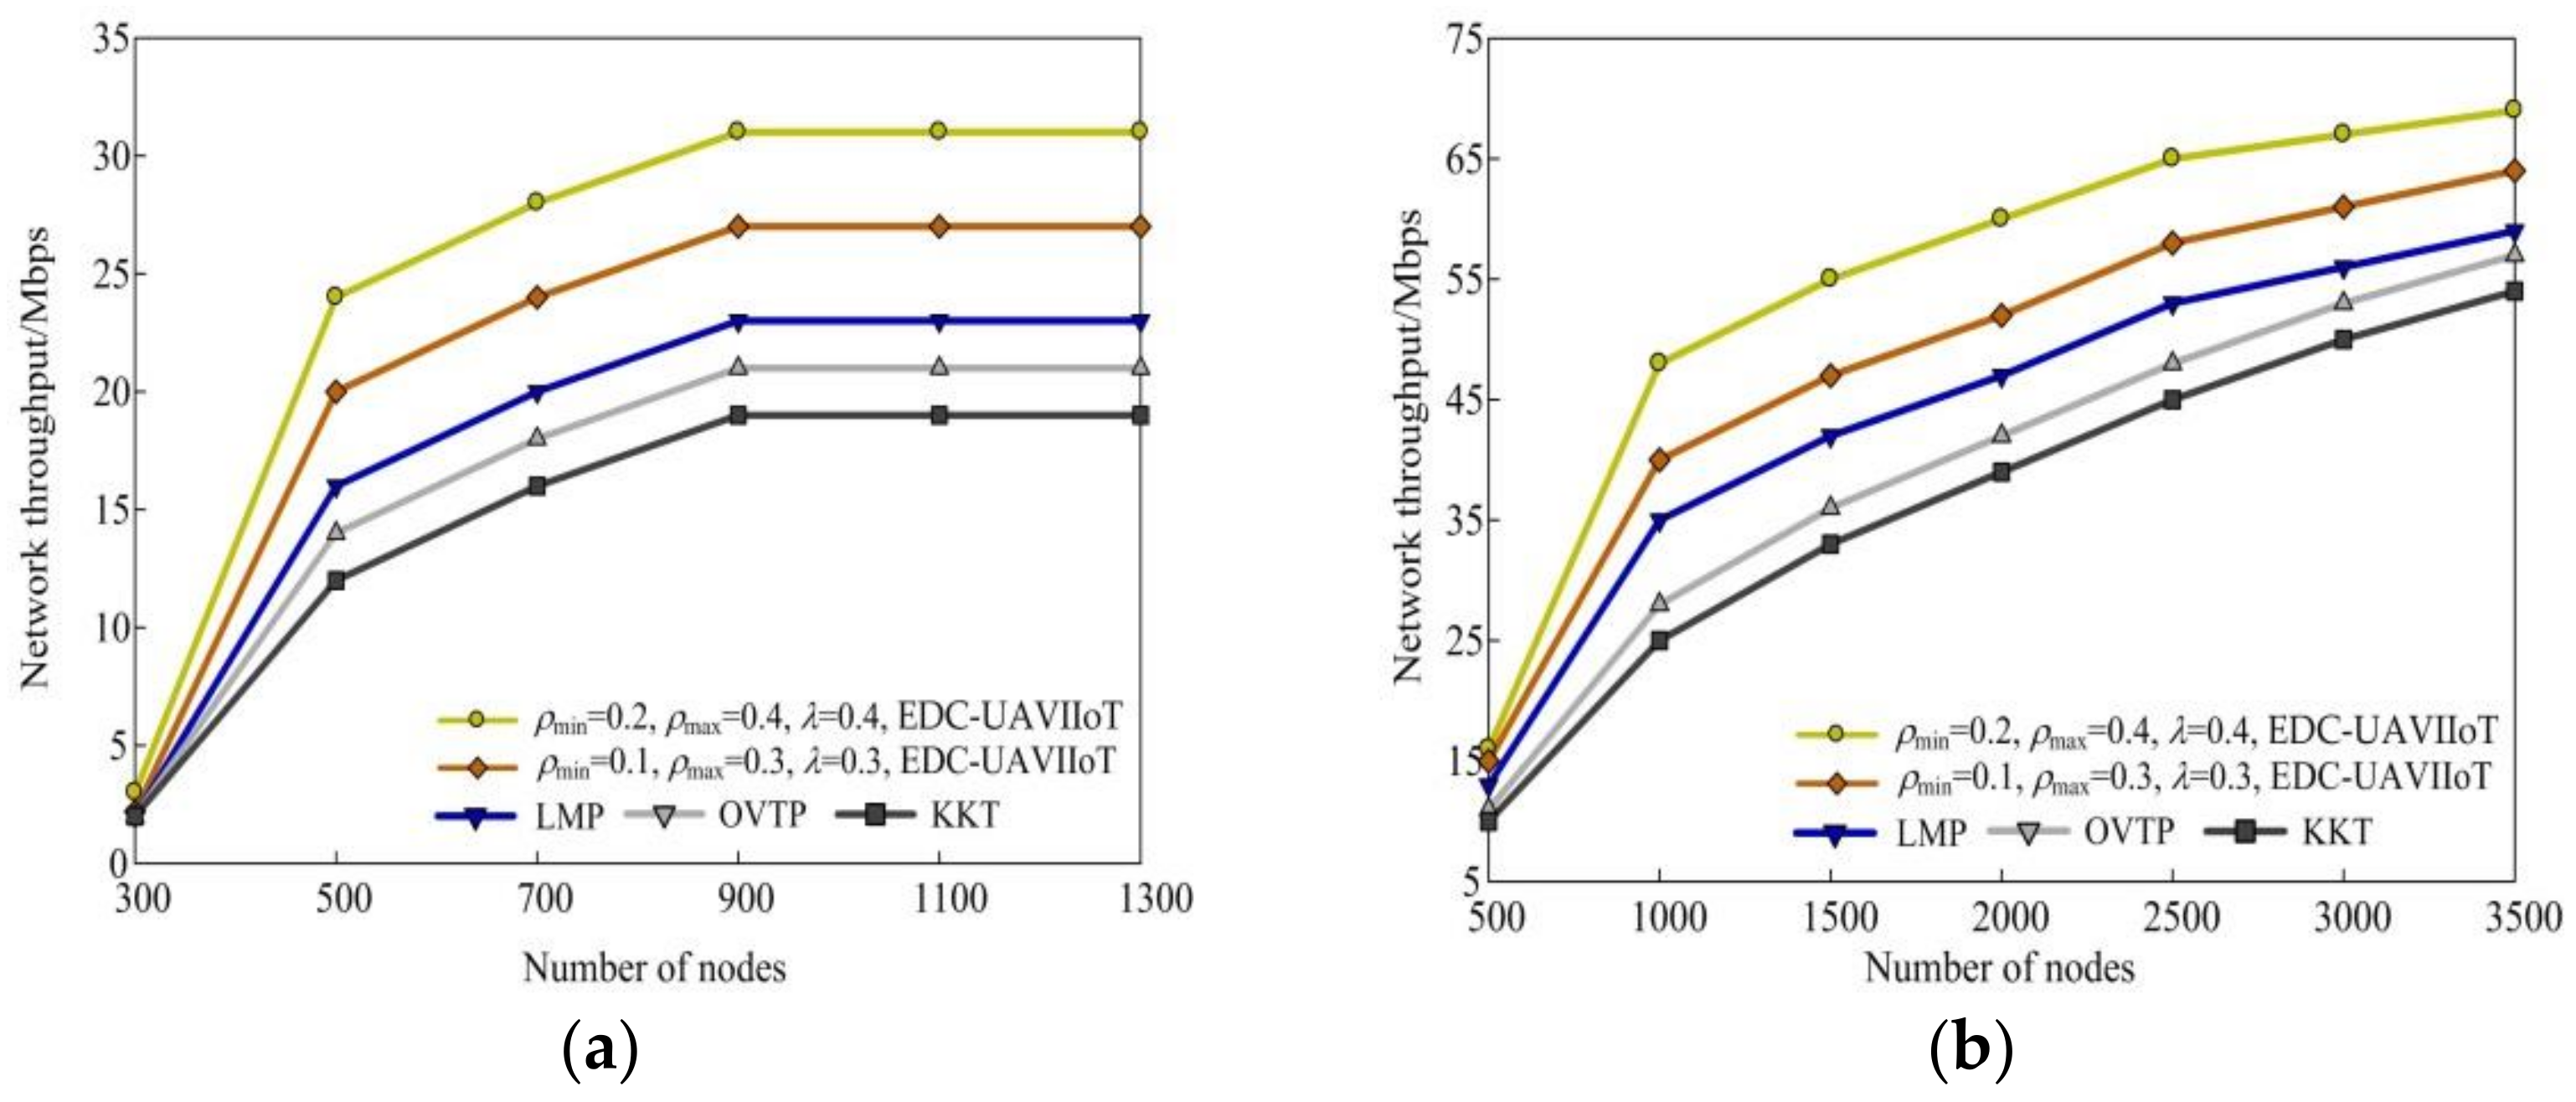
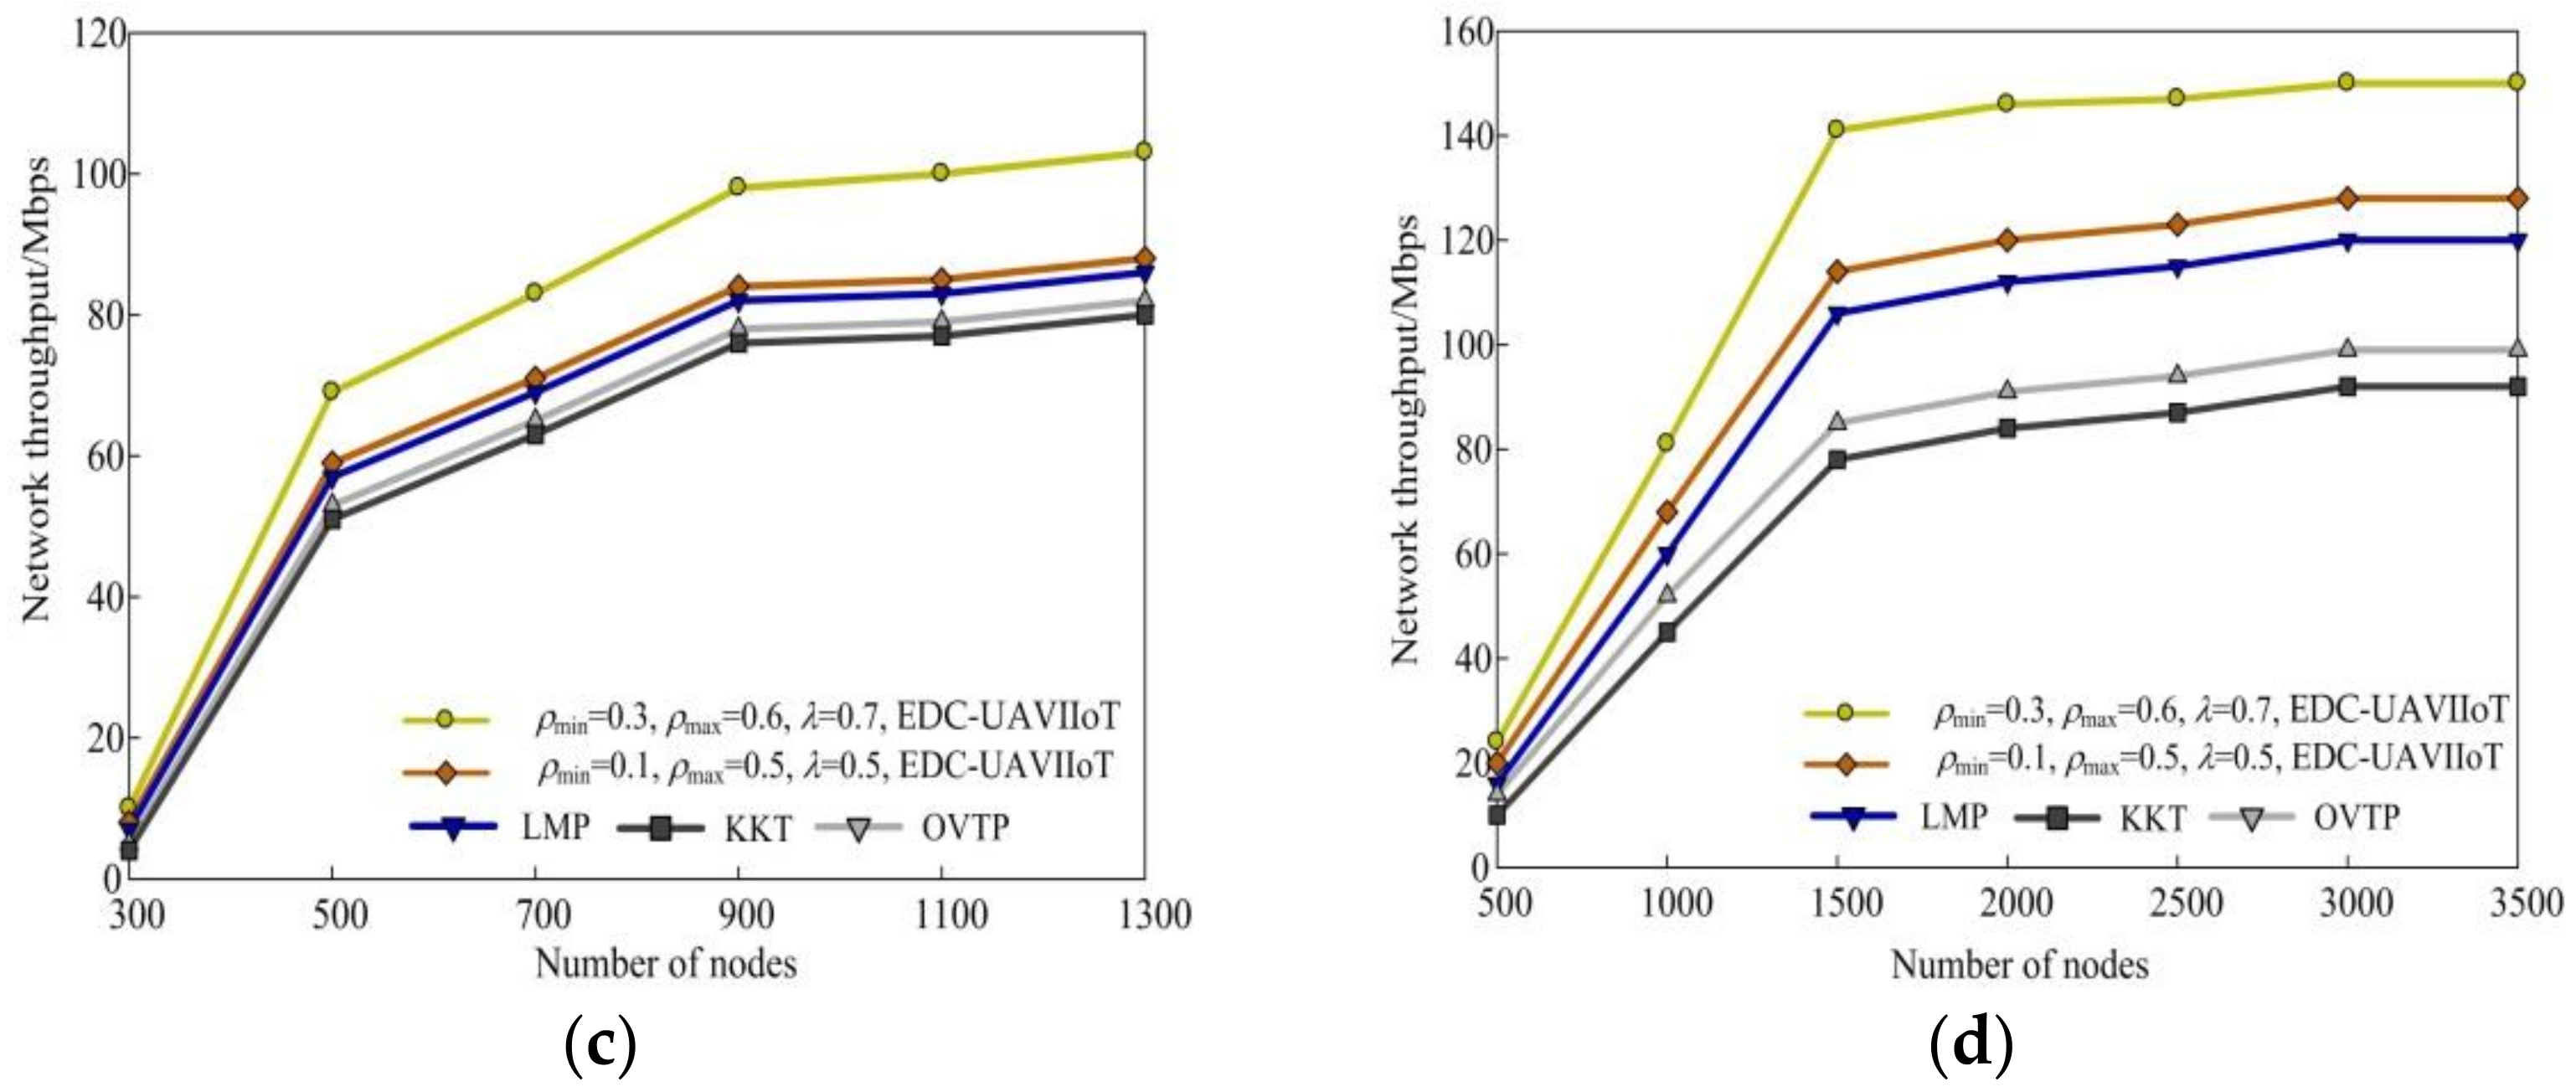
4.4. Network Throughput

Figure 7 shows a schematic comparison of the EDC-UAVIIoT algorithm with the three other algorithms in terms of network throughput under different monitoring regions. Figure 7a shows the network throughput in the 300 × 300 m2 monitoring area, while Figure 7b shows the network throughput in the 500 × 500 m2 monitoring area. It can be seen from Figure 7a that when the number of sensor nodes is 700, the network throughput corresponding to the EDC-UAVIIoT algorithm in this paper is 28 M and 24 Mbps, respectively, while the network throughput of the other three algorithms is 20.3 Mbps, 18.1 Mbps, and 15.8 Mbps, respectively. The main reason is that the EDC-UAVIIoT algorithm in this paper uses UAV multi-channel transmission mode to complete the data acquisition process, and at the same time, the channel transmission mode can be randomly changed by using the controllability of the UAV, which improves the throughput of the entire network, while the other three algorithms use single-channel mode to complete the data acquisition process. With single-channel transmission, as users compete for channels, the efficiency of data transmission will be reduced, so the throughput of the entire network will also decrease.

4.5. Scene Experiment

UAV: A self-assembled DIY small quadcopter UAV, weighing 1.027 kg, flight controller using APM8, rack is a 45 cm plastic frame, driven by four SUNNYSKYX 2212-980 kv brushless motors, ESC is HOBBYWING 30A, flying in a fully charged state. Set flight speed: 3.5 m/s–9.5 m/s; flight altitude: 30 m–40 m; wind speed: 0.5 m/s. The UAV flight path is shown in Figure 8:
The specific experimental process design is as follows: First, let the path sequence of the UAV be A → B → C and A → B → D. There is an angle θ = [0, π/6, π/3, π/2, 2π/3, 5π/6, π] at point B. In the actual pre-experimental flight, it was found that the UAV was not instantaneous when turning through the path point to continue flying and was always accompanied by a deceleration process before reaching the path point and an acceleration process after passing the path point. The speed at the path point position changes with the change of the corner, and the starting point of the deceleration before the path point and the end point of acceleration after passing the path point also changes with the change of the corner, that is, the distance between point A and C and point B will change with the angle of the turn. The corresponding instantaneous energy consumption during flight also increases in this process of deceleration and acceleration. However, when flying in a straight line at a set speed before and after the speed change process, its instantaneous energy consumption is relatively uniform and stable. It can be concluded that the entire variable speed flight process sandwiched between the front and rear straight flight state at a set speed is the process of the influence of a complete corner on energy consumption. Therefore, in the experiment, it is necessary to ensure that there are points A and C of the set flight speed in the flight path of the UAV.
Based on the measured data obtained in the experiment, the average energy consumption of the ABC path flying 900 m by the UAV is calculated at the angle θ = [0, π/6, π/3, π/2, 2π/3, 5π/6, π], and the experimental results are shown in Figure 9a,b. It can be seen from Figure 9a that with the increase of flight distance, the flight energy consumption of UAV will also increase, and it will show a nonlinear relationship. As can be seen from Figure 9b, the larger the steering angle, the higher the energy consumption. The energy consumption data for each corner in this figure actually include the energy consumption caused by distance and the energy consumption caused by the corner when flying the ABC path. The abscissa is the actual number of rotation angles corresponding to the sample data, and the abscissa is the energy consumption value corresponding to the sample data. It is not difficult to find that with the increase of the number of rotation angles, the energy consumption and the number of rotation angles generally show a monotonous upward trend, and when the number of rotation angles is small, the increase of energy consumption with the number of rotation angles is small, and as the number of rotation angles increases, the increase in energy consumption also increases. The actual angle range of the drone in flight is 0–π, that is, the minimum angle is a straight flight, and the maximum angle is a flight in the opposite direction. Therefore, there is a nonlinear relationship between the angle of rotation and the energy consumption. The energy consumption caused by the number of rotation angles without experimental sampling can be estimated from the available sampling data.

5. Conclusions

With the help of the WSNs model, this paper mainly finds that data collection can be completed quickly under the condition of UAV energy limitation. Therefore, this paper proposes the EDC-UAVIIoT algorithm. Firstly, the cruise path of the UAV is optimized, and the error probability model of end-to-end data transmission is given. At the same time, the data collection is realized by using the randomness and superposition of sensor nodes, and the optimization problem of maximizing the UAV cluster set is an NP problem. Then, it is proved that when forwarding data with a specified probability, all nodes complete data reception with a probability of approximately 1; in the aspect of energy balance, the EDC-UAVIIoT algorithm transforms the energy optimization problem into a convex function of the nonlinear optimal problem and gives the related proof process. This paper also analyzes the energy balance of sink nodes without considering any node movement in WSN and gives the calculation process. In the aspect of network delay, this paper discusses the path change process of the UAV when the communication radius increases, and the implementation process and complexity analysis process of the EDC-UAVIIoT algorithm in this paper. Finally, the EDC-UAVIIoT algorithm is compared with the LMP algorithm, the OVTP algorithm, and the KKT algorithm in terms of network energy consumption, network running time, and delay. The performance of the EDC-UAVIIoT algorithm in this paper is better than that of the other three algorithms, which further verifies the effectiveness of the EDC-UAVIIoT algorithm in this paper.
In the future, our main work will focus on data fusion technology and coverage control technology for UAV-based high-speed networks.

Author Contributions

Conceptualization, Z.S., C.X. and G.L.; methodology, Z.S., L.L. and G.L.; software, G.W., M.S. and X.X.; validation, Z.S., G.W. and X.X.; formal analysis, G.W., L.L. and M.S.; investigation, Z.S., L.L. and G.L.; writing—original draft preparation, Z.S., C.X. and M.S.; writing—review and editing, M.S., X.X. and G.L.; visualization, C.X., G.W. and L.L.; supervision, Z.S., X.X. and G.L.; funding acquisition, Z.S., C.X., G.W., L.L. and G.L. All authors have read and agreed to the published version of the manuscript.

Funding

This work is supported by the National Natural Science Foundation of China (Nos. 61931016, 62076096, 62101402, 621176113); the Key Scientific Research Project Plan of Colleges and Universities in Henan Province (No. 23A520050); the Aviation Science Foundation of China (No. 2020000108101); and the China Postdoctoral Science Foundation (No. 2021M702547).

Data Availability Statement

Not applicable.

Conflicts of Interest

The authors declare no conflict of interest.

References

  1. Xu, W.; Sun, Y.; Zou, R.; Liang, W.; Xia, Q.; Shan, F.; Wang, T.; Jia, X.; Li, Z. Throughput Maximization of UAV Networks. IEEE/ACM Trans. Netw. 2022, 30, 881–895. [Google Scholar] [CrossRef]
  2. Ouyang, W.; Obaidat, M.; Liu, X.; Long, X.; Xu, W.; Liu, T. Importance-different Charging Scheduling based on Matroid Theory for Wireless Rechargeable Sensor Networks. IEEE Trans. Wirel. Commun. 2021, 20, 3284–3294. [Google Scholar] [CrossRef]
  3. Zhao, J.; Wang, Y.; Fei, Z.; Wang, X.; Miao, Z. NOMA-aided UAV Data Collection Systems: Trajectory Optimization and Communication Design. IEEE Access 2020, 8, 155843–155858. [Google Scholar] [CrossRef]
  4. Ouamri, M.A.; Alkanhel, R.; Singh, D.; El-kenaway, E.M.; Ghoneim, S.S.M. Double deep q-network method for energy efficiency and throughput in a uav-assisted terrestrial network. Comput. Syst. Sci. Eng. 2023, 46, 73–92. [Google Scholar] [CrossRef]
  5. Jakaria, A.; Rahman, M.; Asif, M.; Khalil, A.; Kholidy, H.; Anderson, M.; Drager, S. Trajectory Synthesis for a UAV Swarm based on Resilient Data Collection Objectives. IEEE Trans. Netw. Serv. Manag. 2023, 20, 138–151. [Google Scholar] [CrossRef]
  6. Liu, T.; Zhang, G.; Cui, M.; You, C.; Wu, Q.; Ma, S.; Chen, W. Task Completion Time Minimization for UAV-enabled Data Collection in Rician Fading Channels. IEEE Internet Things J. 2023, 10, 1134–1148. [Google Scholar] [CrossRef]
  7. Zhao, Y.; Yan, L.; Dai, J.; Hu, X.; Wei, P.; Xie, H. Robust Planning System for Fast Autonomous Flight in Complex Unknown Environment Using Sparse Directed Frontier Points. Drones 2023, 7, 219. [Google Scholar] [CrossRef]
  8. Zhou, X.; Yan, S.; Shu, F.; Chen, R.; Li, J. UAV-enabled Covert Wireless Data Collection. IEEE J. Sel. Areas Commun. 2021, 39, 3348–3362. [Google Scholar] [CrossRef]
  9. Wang, X.; Liu, X.; Cheng, C.; Deng, L.; Chen, X.; Xiao, F. A Joint User Scheduling and Trajectory Planning Data Collection Strategy for the UAV-assisted WSN. IEEE Commun. Lett. 2021, 25, 2333–2337. [Google Scholar] [CrossRef]
  10. Chen, J.; Tang, J. UAV-Assisted Data Collection for Dynamic and Heterogeneous Wireless Sensor Networks. IEEE Wirel. Commun. Lett. 2022, 11, 1288–1292. [Google Scholar] [CrossRef]
  11. Li, M.; He, S.; Li, H. Minimizing Mission Completion Time of UAVs by Jointly Optimizing the Flight and Data Collection Trajectory in UAV-enabled WSNs. IEEE Internet Things J. 2022, 9, 13498–13510. [Google Scholar] [CrossRef]
  12. Xu, W.; Liang, W.; Xu, Z.; Peng, J.; Peng, D.; Liu, T.; Jia, X.; Das, S. Approximation Algorithm for the Generalized Team Orienteering Problem and its Applications. IEEE/ACM Trans. Netw. 2021, 29, 176–189. [Google Scholar] [CrossRef]
  13. Haider, S.; Zikria, Y.; Garg, S.; Ahmad, S.; Hassan, M.; Alqahtani, S. AI-based Energy-efficient UAV-assisted IoT Data Collection with Integrated Trajectory and Resource Optimization. IEEE Wirel. Commun. 2022, 29, 30–36. [Google Scholar] [CrossRef]
  14. Sinha, P.; Guvenc, I. Impact of Antenna Pattern on TOA based 3D UAV Localization Using a Terrestrial Sensor Network. IEEE Trans. Veh. Technol. 2022, 71, 7703–7718. [Google Scholar] [CrossRef]
  15. Yang, B.; Taleb, T.; Chen, G.; Shen, S. Covert Communication for Cellular and X2U-enabled UAV Networks with Active and Passive Wardens. IEEE Netw. 2022, 36, 166–173. [Google Scholar] [CrossRef]
  16. Shao, X.; Zhao, S.; Chen, G.; Shen, S.; Yang, B. Spectrum Allocation for Sum Rate Maximization in UAV-to-UAV Communication Underlaid Cellular Networks. J. Inf. Sci. Eng. 2021, 37, 917–933. [Google Scholar]
  17. Liang, Y.; Xu, W.; Liang, W.; Peng, J.; Jia, X.; Zhou, Y.; Duan, L. Nonredundant Information Collection in Rescue Applications via an Energy-constrained UAV. IEEE Internet Things J. 2019, 6, 2945–2958. [Google Scholar] [CrossRef]
  18. Mao, S.; Zhang, N.; Liu, L.; Wu, J.; Dong, M.; Ota, K.; Liu, T.; Wu, D. Computation Rate Maximization for Intelligent Reflecting Surface Enhanced Wireless Powered Mobile Edge Computing Networks. IEEE Trans. Veh. Technol. 2021, 70, 10820–10831. [Google Scholar] [CrossRef]
  19. Mu, X.; Liu, Y.; Guo, L.; Lin, J.; Ding, Z. Energy-constrained UAV Data Collection Systems: NOMA and OMA. IEEE Trans. Veh. Technol. 2021, 70, 6898–6912. [Google Scholar] [CrossRef]
  20. Li, Z.; Zhao, W.; Liu, C. Completion Time Minimization for UAV-UGV-enabled Data Collection. Sensor 2022, 22, 5839. [Google Scholar] [CrossRef]
  21. Han, S.; Zhu, K.; Zhou, M.; Liu, X. Joint Deployment Optimization and Flight Trajectory Planning for UAV Assisted IoT Data Collection: A Bilevel Optimization Approach. IEEE Trans. Intell. Transp. Syst. 2022, 23, 21492–21504. [Google Scholar] [CrossRef]
  22. Xiang, Z.; Liu, T.; Peng, J. Weighted Data Loss Minimization in UAV Enabled Wireless Sensor Networks. In Proceedings of the 17th International Conference on Wireless Algorithms, Systems, and Applications, WASA, Dalian, China, 24–26 November 2022; IEEE: New York, NY, USA, 2022; pp. 117–129. [Google Scholar]
  23. Liu, X.; Lin, P.; Liu, T.; Wang, T.; Liu, A.; Xu, W. Objective-variable Tour Planning for Mobile Data Collection in Partitioned Senson Networks. IEEE Trans. Mob. Comput. 2022, 21, 239–251. [Google Scholar]
  24. Li, Y.; Liang, W.; Xu, W.; Xu, Z.; Jia, X.; Xu, Y.; Kan, H. Data Collection Maximization in IoT-sensor Networks via an Energy- constrained UAV. IEEE Trans. Mob. Comput. 2023, 22, 159–174. [Google Scholar] [CrossRef]
  25. Guo, Q.; Peng, J.; Xu, W.; Liang, W.; Jia, X.; Xu, Z.; Yang, Y.; Wang, M. Minimizing the Longest Tour Time among a Fleet of UAVs for Disaster Area Surveillance. IEEE Trans. Mob. Comput. 2022, 21, 2451–2465. [Google Scholar] [CrossRef]
  26. Deng, L.; Xu, W.; Liang, W.; Peng, J.; Zhou, Y.; Duan, L.; Das, S. Approximation Algorithm for the Min-max Cycle Cover Problem with Neighborhoods. IEEE/ACM Trans. Netw. 2020, 28, 1845–1858. [Google Scholar] [CrossRef]
  27. Yang, B.; Dang, Y.; Taled, T.; Shen, S.; Jiang, X. Sum Rate and Max-min Rate for Cellular-enabled UAV Swarm Networks. IEEE Trans. Veh. Technol. 2023, 72, 1073–1083. [Google Scholar] [CrossRef]
  28. Tang, R.; Zhang, R.; Xu, Y.; He, J. Energy-efficient Optimization Algorithm in NOMA-based UAV-assisted Data Collection Systems. IEEE Wirel. Commun. Lett. 2023, 12, 158–162. [Google Scholar] [CrossRef]
  29. Wu, B.; Guo, D.; Zhang, B.; Zhang, X.; Wang, H.; Wang, H.; Jiang, H. Completion Time Minimization for UAV Enabled Data Collection with Communication Link Constrained. IET Commun. 2022, 16, 1025–1040. [Google Scholar] [CrossRef]
  30. Dang, Y.; Benzaid, C.; Yang, B.; Taleb, T.; Shen, Y. Deep-ensemble-learning-based GPS Spoofing Detection for Cellular- connected UAV. IEEE Internet Things J. 2022, 9, 25068–25085. [Google Scholar] [CrossRef]
  31. Xu, W.; Xiao, T.; Zhang, J.; Liang, W.; Xu, Z.; Liu, X.; Jia, X.; Das, S. Minimizing the Deployment Cost of UAVs for Delay- sensitive Data Collection in IoT Network. IEEE/ACM Trans. Netw. 2022, 30, 812–825. [Google Scholar] [CrossRef]
  32. Tang, X.; Wang, W.; He, H.; Zhang, R. Energy-efficient Data Collection for UAV-assisted IoT: Joint Trajectory and Resource Optimization. Chin. J. Aeronaut. 2022, 35, 95–105. [Google Scholar] [CrossRef]
  33. Ma, T.; Zhou, H.; Qian, B.; Cheng, N.; Shen, X.; Chen, X.; Bai, B. UAV-LEO Integrated Backbone: A Ubiquitous Data Collection Approach for B5G Internet of Remote Things Networks. IEEE J. Sel. Areas Commun. 2021, 39, 3491–3505. [Google Scholar] [CrossRef]
  34. Jiang, C.; Li, T.; Liang, J.; Wu, H. Low-latency and Energy-efficient Data Preservation Mechanism in Low-duty-cycle Sensor Networks. Sensors 2017, 17, 1051. [Google Scholar] [CrossRef] [Green Version]
  35. Wang, Z.; Zhang, G.; Wang, Q.; Wang, K.; Yang, K. Completion Time Minimization in Wireless-powered UAV-assisted Data Collection Systems. IEEE Commun. Lett. 2021, 25, 1954–1958. [Google Scholar] [CrossRef]
  36. Zhou, M.; Chen, H.; Shu, L.; Liu, Y. UAV-Assisted Sleep Scheduling Algorithm for Energy-efficient Data Collection in Agricultural Internet of Things. IEEE Internet Things J. 2022, 9, 11043–11056. [Google Scholar] [CrossRef]
  37. Wei, Z.; Zhu, M.; Zhang, N.; Wang, L.; Zou, Y.; Meng, Z.; Wu, H.; Feng, Z. UAV-assisted Data Collection for Internet of Things: A Survey. IEEE Internet Things J. 2022, 9, 15460–15483. [Google Scholar] [CrossRef]
Figure 1. Network systems model.
Drones 07 00373 g001
Figure 2. Path planning before optimization.
Drones 07 00373 g002
Figure 3. Optimized path planning.
Drones 07 00373 g003
Figure 4. Comparison of residual energy between the EDC-UAVIIoT algorithm and the other three algorithms in different monitoring areas: (a) 100 × 100 m2, N = 150, (ρmin = 0.1, ρmax = 0.3, λ = 0.3), (ρmin = 0.2, ρmax = 0.5, λ = 0.6); (b) 300 × 300 m2, N = 300, (ρmin = 0.1, ρmax = 0.3, λ = 0.3), (ρmin = 0.2, ρmax = 0.5, λ = 0.6); (c) 100 × 100 m2, N = 150, (ρmin = 0.3, ρmax = 0.6, λ = 0.7), (ρmin = 0.1,ρmax = 0.5, λ = 0.5); (d) 300 × 300 m2, N = 300, (ρmin = 0.3, ρmax = 0.6, λ = 0.7), (ρmin = 0.1, ρmax = 0.5, λ = 0.5).
Drones 07 00373 g004aDrones 07 00373 g004b
Figure 5. Comparison of network running time between the EDC-UAVIIoT algorithm and the other three algorithms in different monitoring areas: (a) 300 × 300 m2, (ρmin = 0.2, ρmax = 0.4, λ = 0.4), (ρmin = 0.1, ρmax = 0.3, λ = 0.3); (b) 500 × 500 m2, (ρmin = 0.2, ρmax = 0.4, λ = 0.4), (ρmin = 0.1, ρmax = 0.3, λ = 0.3); (c) 300 × 300 m2, (ρmin = 0.3, ρmax = 0.6, λ = 0.7), (ρmin = 0.1, ρmax = 0.5, λ = 0.5); (d) 500 × 500 m2, (ρmin = 0.3, ρmax = 0.6, λ = 0.7), (ρmin = 0.1, ρmax = 0.5, λ = 0.5).
Drones 07 00373 g005aDrones 07 00373 g005b
Figure 6. The network delay of the EDC-UAVIIoT algorithm in this paper is compared with the other three algorithms in different monitoring areas: (a) 300 × 300 m2, (ρmin = 0.2, ρmax = 0.4, λ = 0.4), (ρmin = 0.1, ρmax = 0.3, λ = 0.3); (b) 500 × 500 m2, (ρmin = 0.2, ρmax = 0.4, λ = 0.4), (ρmin = 0.1, ρmax = 0.3, λ = 0.3); (c) 300 × 300 m2, (ρmin = 0.3, ρmax = 0.6, λ = 0.7), (ρmin = 0.1, ρmax = 0.5, λ = 0.5); (d) 500 × 500 m2, (ρmin = 0.3, ρmax = 0.6, λ = 0.7), (ρmin = 0.1, ρmax = 0.5, λ = 0.5).
Drones 07 00373 g006aDrones 07 00373 g006b
Figure 7. The network throughput of the EDC-UAVIIoT algorithm in this paper is compared with the other three algorithms in different monitoring areas: (a) 300 × 300 m2, (ρmin = 0.2, ρmax = 0.4, λ = 0.4), (ρmin = 0.1, ρmax = 0.3, λ = 0.3); (b) 500 × 500 m2, (ρmin = 0.2, ρmax = 0.4, λ = 0.4), (ρmin = 0.1, ρmax = 0.3, λ = 0.3); (c) 300 × 300 m2, (ρmin = 0.3, ρmax = 0.6, λ = 0.7), (ρmin = 0.1, ρmax = 0.5, λ = 0.5); (d) 500 × 500 m2, (ρmin = 0.3, ρmax = 0.6, λ = 0.7), (ρmin = 0.1, ρmax = 0.5, λ = 0.5).
Drones 07 00373 g007aDrones 07 00373 g007b
Figure 8. UAV flight path.
Drones 07 00373 g008
Figure 9. Comparison of UAV flight energy consumption with angle and distance. (a) Comparison of UAV flight energy consumption and rotation angle. (b) Comparison of UAV flight energy consumption and distance.
Drones 07 00373 g009
Table 1. Parameter description.
ParameterRelated Description
PtrThe power transmitted by the UAV in time slot t
DdsNumbers of single machine in time slot t
DndsNumbers of UAV clusters in time slot t
si and sjith node and jth node
RcNode sensing radius
kThe number of bits of transmitted information
EelecThe energy lost by the transmitting circuit to send or receive each bit of data
εfs and εmpParameters of transmission amplifier model parameters
NThe number of nodes
δThe probability of packet loss
λ, χControllable parameter and energy factor
p, qData transition probability and approximate probability
PijThe radio signal transmission power between the transmitting node si and the receiving node sj
PijγijThe signal-to-noise ratio from the transmitting side si to the receiving side sj
ρ, ωijVariable parameters in the range [0, 1] and constant
φ, HijLink loss index and multipath reflection loss
Disclaimer/Publisher’s Note: The statements, opinions and data contained in all publications are solely those of the individual author(s) and contributor(s) and not of MDPI and/or the editor(s). MDPI and/or the editor(s) disclaim responsibility for any injury to people or property resulting from any ideas, methods, instructions or products referred to in the content.

