1. Introduction
The hand-arm vibration (HAV) database operated by the Health and Safety Executive (HSE) Science Division contained (at the start of 2020) data from 11,245 in-use vibration magnitude measurements on 1636 tools. In many cases, multiple measurements had been performed on the same model of tool being used for a variety of work activities. Data from these machines have been used to assess the statistical distributions expected for real machines in real work situations.
Understanding the statistical distributions found for real machines allows the generation of large sets of randomised simulated vibration magnitude data (Monte Carlo simulations). These data sets can then be used to determine the number of measurements required to meet a target level of statistical confidence in the reported vibration value.
The objective of this simulation was to determine the number of measured data sets that will provide an estimate of the upper quartile value that is within 10% of the true value with 95% confidence.
2. Analysis of the HSE Hand-Arm Vibration Database
The HSE HAV database was interrogated in April 2020 for those machines for which more than 20 measurements have been made. The database includes 135 machines in this group. Percentile statistics of the vibration total values were calculated for each of the 135 machines. The results of these statistics for each machine were then analysed across all machines.
The number of measurements in the data sets ranged from 21 to 216 and the median number was 30, with a 75th percentile at 11.24 m/s² and interquartile range of 0.29 m/s².
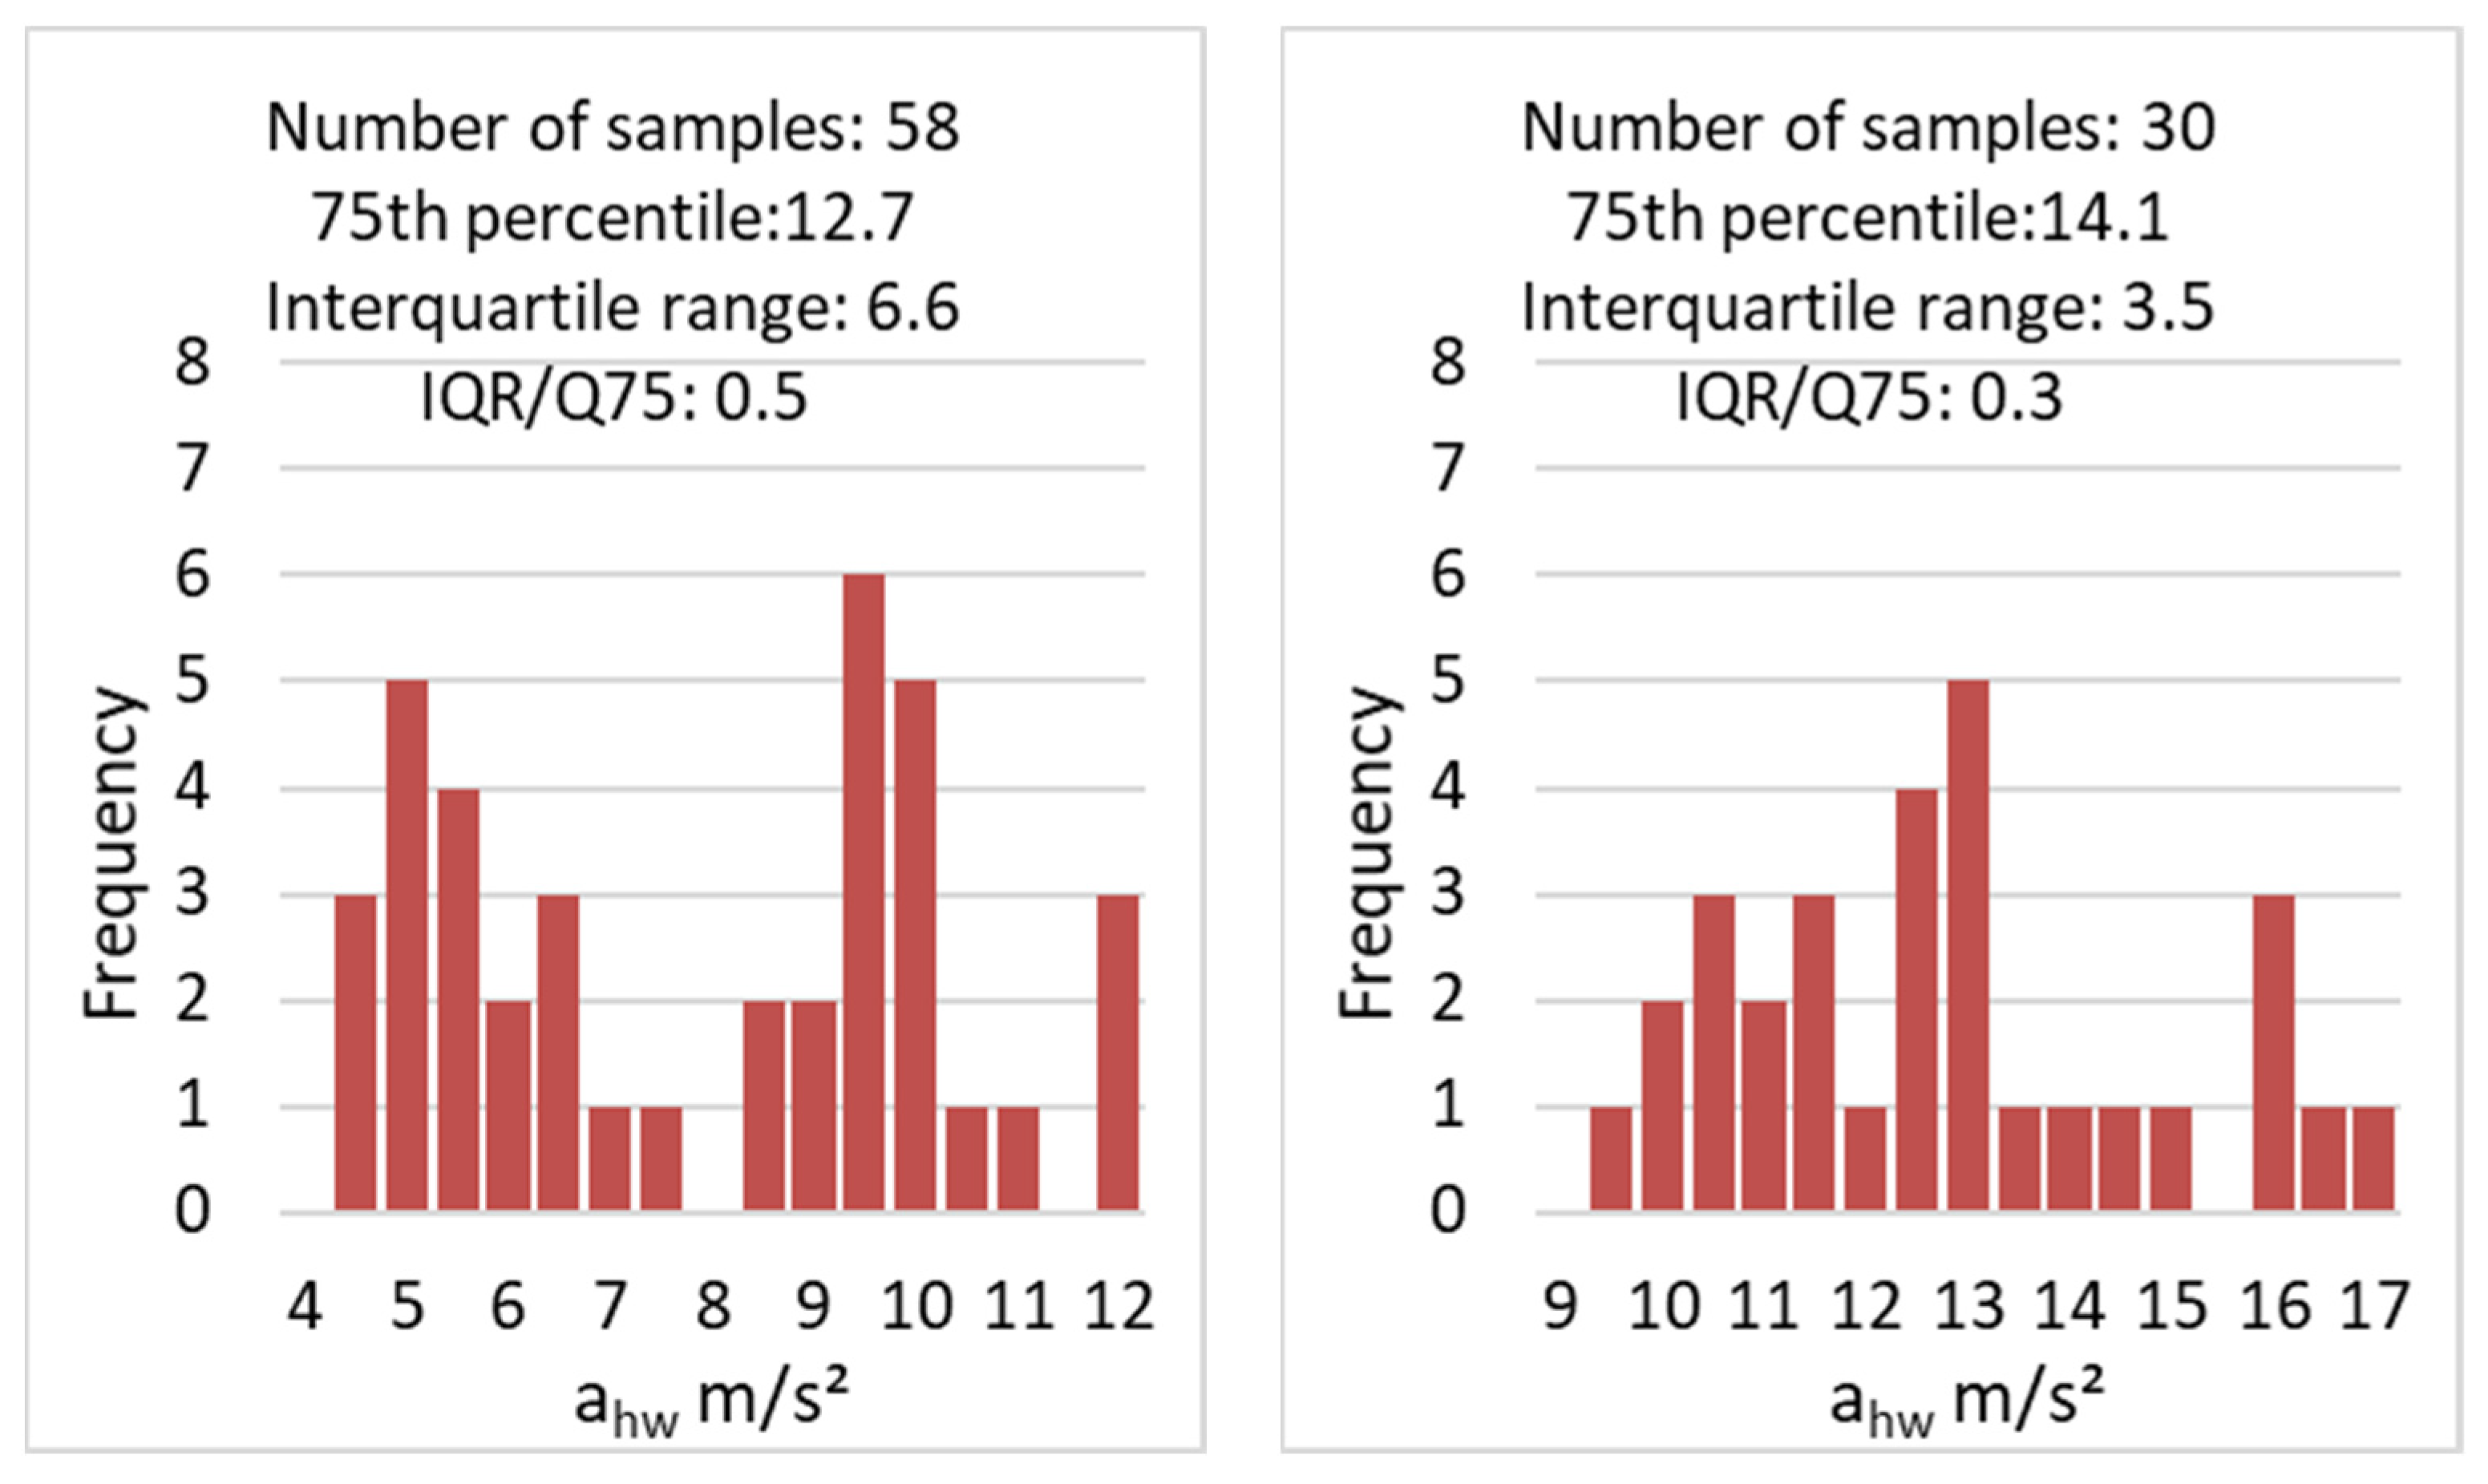
Figure 1 shows examples of vibration total value distributions for two machines, a random orbital sanderm and a demolition hammer.
The ratio of the interquartile range to 75th percentile value (IQR/Q75) was used as an indicator of the spread of data that is independent of absolute magnitudes. For the machines in the HSE database, the median IQR/Q75 was 0.31, with a spread from 0.10 to 0.63 for the 5th to 95th percentiles, respectively.
3. Monte Carlo Simulation
A Monte Carlo simulation uses random simulations of real data to analyse the likely range of potential outcomes for a real system. A uniform distribution was used, in part, for simplicity. The uniform distribution places clear bounds on the upper and lower limit of the data. Other distributions, such as log-normal, will generate many exceptionally high values that are not representative of real data.
In this analysis, many uniform random data sets were generated to represent repeated tests on a single machine. Data sets were generated containing between 5 and 50 samples. In all cases, a target upper quartile value (Q75) of 10 m/s² was used. Data sets were generated with different data ranges, as expressed by the ratio of IQR to the 75th percentile (IQR/Q75). The results from real machine data showed that IQR/Q75 values from 0.1 to 0.6 should be used for the simulations; values of 0.1, 0.2, 0.3, 0.4, and 0.6 were used.
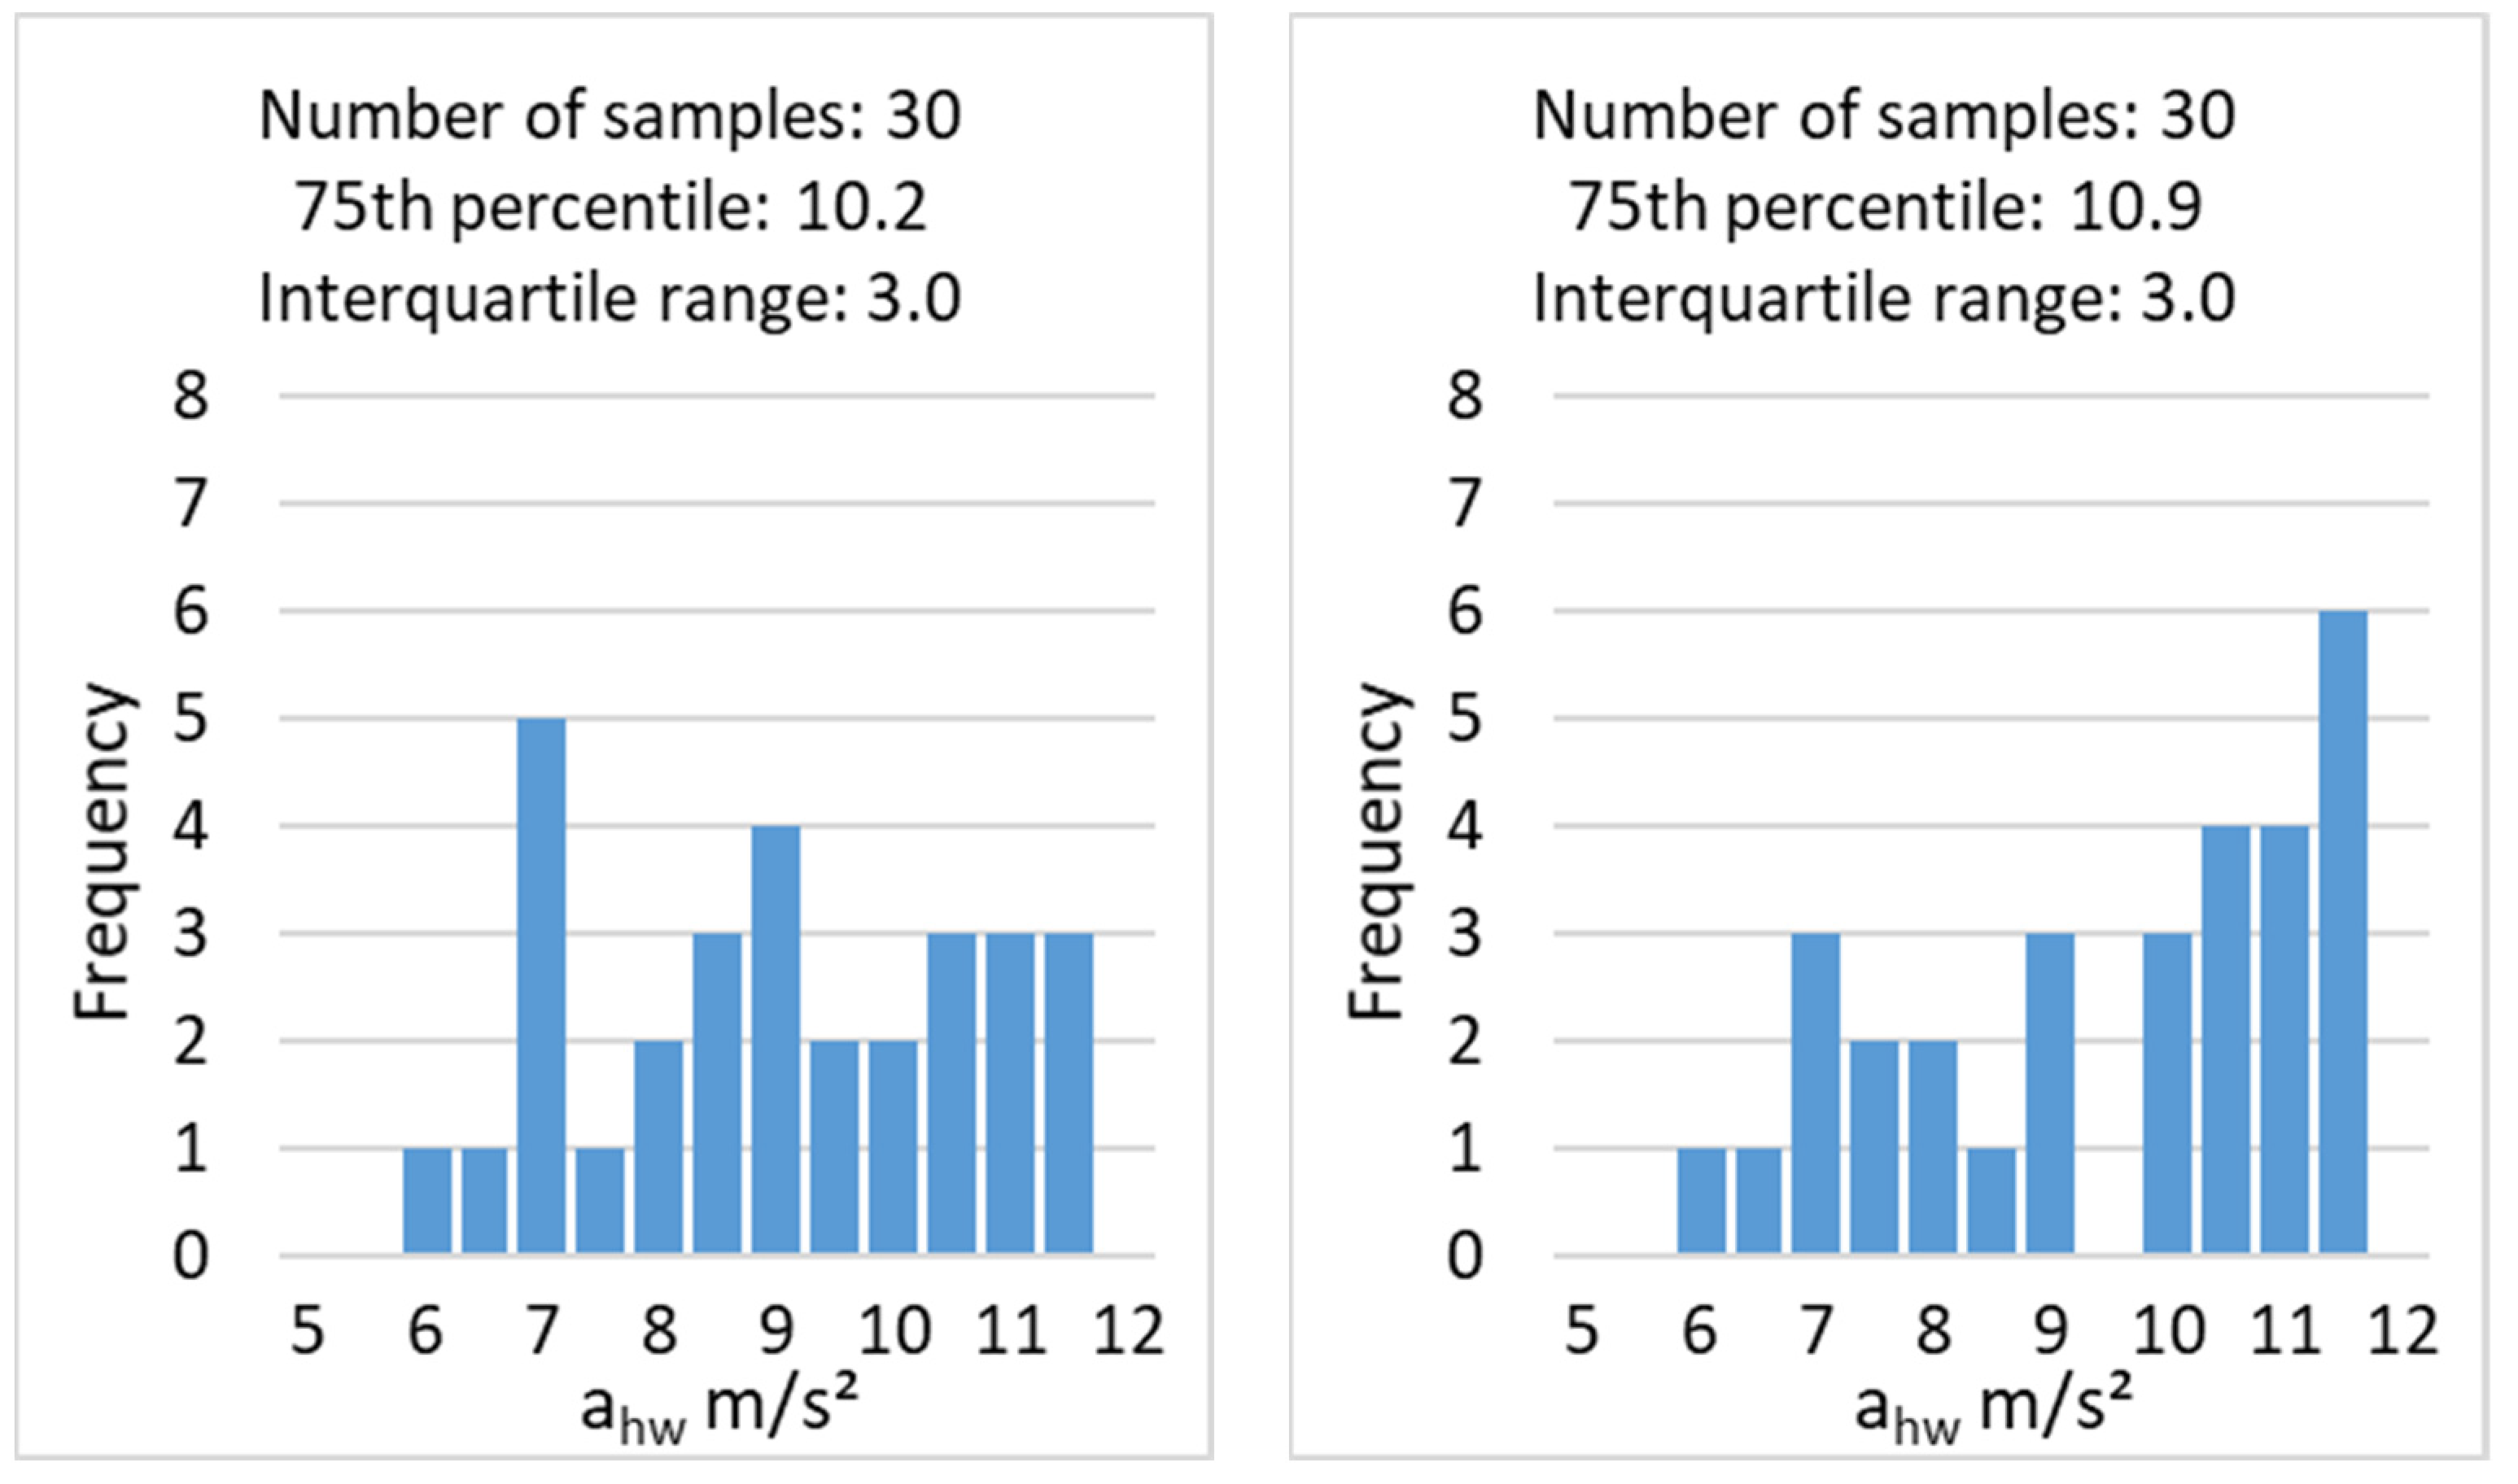
For an infinite number of values, the simulation of a uniform distribution would produce a data set with a 75th percentile equal to the Q75 target value and values ranging from Q75 to 3/2 × IQR to Q75 + 1/2 × IQR. For smaller data sets, the random data sets do not appear uniform; this is illustrated in
Figure 2, which shows two example distributions each of 30 simulated samples. When the distributions of multiple real data sets, such as those in
Figure 1, were compared with multiple simulated data sets, such as those in
Figure 2, it was concluded that the data distributions for machines in the HAV database could be represented by the simulations based on uniform data distributions.
For each combination of number of samples and the IQR/Q75 ratio, 10,000 data sets were generated. For each of the individual data sets, values for the Q75, the error in Q75 from the target Q75 value (εQ75), and the IQR were calculated.
The statistics from the 10,000 repeat sets were analysed to obtain, for each analysis combination, the 2.5th, 25th, 50th, 75th, and 97.5th percentiles of the calculated Q75 and εQ75 values, and a median value for the IQR.
4. Results
Figure 3 shows the results of the Monte Carlo simulation for the ratio IQR/Q75 target of 0.3. The figure shows the median error and the 95% coverage range, from 2.5% to 97.5%, for data sets ranging in size from 5 to 50 samples.
Figure 3 shows that for the IRQ/Q75 = 0.3 results, a value within 20% of the true 75th percentile value is likely to be achieved (with better than 95% confidence) after ten measurements.
Due to the levelling-off of the data at higher numbers of samples, even with 10,000 data sets simulated, it is difficult to judge exactly how many samples are required to achieve a result that is just within 10% of the actual 75th percentile value.
Figure 3 shows that the 10% error point is around 35 samples. However, fewer samples are still likely to achieve a result within a similar tolerance; for example, 30 measurements are likely to give a result within 11%.
Analysis was performed for five different IQR/Q75 values tested, from 0.1 to 0.6. Clearly, larger interquartile ranges led to larger error ranges.
Table 1 illustrates how the error range depends on the IQR/Q75 value for sample sizes of 20 and 30 measurements.
Table 1 shows that for between 20 and 30 data points, at IQR/Q75 of 0.4, the maximum error in the upper quartile value is 17.7%. For the very highly variable data, where IQR/Q75 is 0.6, the maximum likely error may reach 26.1% for 20 samples and 21.8% for 30 samples. Analysis of the HAV database showed that the highest IQR/Q75 ratio (with 95% coverage) was 0.6, so even in this likely worst case, 30 samples is highly likely to provide a result within 20% of the true value.
5. Conclusions
For measurements to provide an estimate of the upper quartile value that is within 10% of the true value with 95% confidence, around 35 measurements are required for data with the median variability in the data from the HAV database (where IQR/Q75 = 0.3).
For data sets with greater variability (IQR/Q75 = 0.4 and 0.6), between 20 and 30 measurements are required to achieve an estimate of the upper quartile value that is within 20% of the true value.
For practical measurements, a sample size of between 20 and 30 measurements is likely to achieve a reliable estimate of the true upper quartile value of real-use hand-arm vibration magnitude.


