Article

Cover Crop Termination Method and N Fertilization Effects on Sweet Corn Yield, Quality, N Uptake, and Weed Pressure

Stockbridge School of Agriculture, University of Massachusetts, Amherst, MA 01003, USA
*
Authors to whom correspondence should be addressed.
Nitrogen 2023, 4(1), 37-57; https://doi.org/10.3390/nitrogen4010005
Submission received: 30 December 2022 / Revised: 18 January 2023 / Accepted: 21 January 2023 / Published: 25 January 2023

Abstract

:
Cover cropping is vital for soil health. Timing and method of termination are major factors influencing the agroecological benefits of cover crops. Delay in the termination of cover crops results in greater biomass production. Likewise, incorporation of cover crops during termination often speeds residue mineralization compared to no-till systems. We used four termination strategies for a late-terminated winter rye–legume mix (in tilled and no-till systems) and four N application rates in the succeeding sweet corn crop to examine how cover crop termination affected N response in sweet corn as well as the independent effects of N application rate and cover crop termination method. The experiment was conducted using a randomized complete block design with four replications. Increasing N fertilization up to 144 kg N ha−1 promoted yield and quality in sweet corn as well as summer weed growth. The cover crop termination method did not affect sweet corn response to N fertilizer. This suggests that when rye is terminated late in the spring before planting cash crops, the incorporation of its residues may not greatly affect the soil N dynamics. This indicates that decisions to incorporate rye residues may be taken by farmers with an eye mainly towards management issues such as weed control, environmental impacts, and soil health.

1. Introduction

Integrating cover cropping into farming systems is vital for soil health and often contributes to agricultural productivity. Depending on species and time of planting, cover crops can provide a variety of agroecological benefits, including enhanced biodiversity, protecting the soil from erosion, and improving soil structure [1,2]. Agronomically, cover crops increase N availability, nutrient cycling, and overall productivity [3,4].
Timing and method of termination of cover crops are major factors influencing the agroecological benefits of cover crops [5]. Termination timing of cover crops not only affects the amount of biomass but also influences the nutrient content of the residues [6]. This is especially true for fast-growing cover crops in late spring. When winter grain cover crops are terminated early, their residues decompose faster due to lower C:N ratios [7,8]. However, early termination limits the amount of biomass and thus ecological services of cover crops. Conversely, delaying termination results in higher cover crop biomass, but the residues have a higher C:N ratio which slows down the decomposition of residues and promotes competition between the succeeding plant roots and microbial community for acquiring N from the soil. [9,10,11].
Traditionally, cover crops are terminated either by tillage, herbicides, or their combination, which can be detrimental to soil health [12,13]. The physical disturbance of soil ruins the channels created by cover crop roots, breaks the soil aggregates, increases soil erosion, disturbs the soil microbial ecosystem, and increases C loss to the atmosphere [14,15,16]. Mineralization of incorporated cover crop residue is often faster in comparison to no-till systems where cover crop residues are left on the soil surface [4,17]. The slower decomposition may support the soil microbial community over a longer timescale [18] and may provide a better synchrony between the N needs of crops and their growth stage [19]. In late termination, cover crops continue absorbing N from the soil, thus reducing the N availability to the following crops [20,21].
In selecting cover crop termination method, weed control should also be considered. In conventional tillage systems and cover crop termination, weeds are often controlled chemically or with multiple rototilling. However, significant barriers exist to weed control in no-till systems and more so in organic operations [22]. More recently, roller crimpers have been used for the termination of cover crops, especially winter grains, in no-till systems. This controls the weed populations because it creates a thick and even residue mulch [23,24,25].
The rate of cover crop decomposition is influenced by cover crop maturity, particle size, C:N, and its placement in the soil [10,26]. Higher reactive surface area leads to higher microbial activity and decomposition rate. Mowing and tillage break up cover crop residues and incorporate them in the soil. This could increase the microbial accessibility of the residues, the rate of decomposition, and subsequent mineralization of nutrients. Conversely, in no-till systems, the residues remain on the soil as a surface mulch, potentially slowing down the rate of decomposition and nutrient mineralization [26].
Sweet corn (Zea mays convar. saccharata var. rugosa) is one of the major vegetables grown in New England, generating more than 23 million dollars annually [27]. However, traditional production of sweet corn requires using large amounts of herbicides and application of relatively high amount of N fertilizer [28]. Furthermore, the quality of a sweet corn ear is highly sensitive to N availability; thus, a winter rye (Secale cereale L.) cover crop is typically terminated early with residues incorporated into the soil to promote N availability. We hypothesized that the late termination of a winter rye–legume cover crop by using roller crimper or mowing and leaving residues on the surface can reduce the N application need of the succeeding sweet corn and the use of herbicides.
To address this hypothesis, this study sought to quantify the effect of different cover crop termination strategies on subsequent sweet corn growth and ear quality. Different N application rates were used as a way to investigate the impact of these termination strategies on N availability during the cash crop growing season. The results of the current study will provide a more thorough understanding of the effect of late terminated rye management on N availability of subsequent cash crops and could allow farmers to better match their N fertilizer inputs to cash crop needs.

2. Materials and Methods

2.1. Experimental Site

The experiment was conducted at the University of Massachusetts Research Farm in South Deerfield (4230.7524′28ﹾ″ N and 7210.4892′35ﹾ″ W) from fall 2019 to summer 2021. The soil at the farm is characterized as Winooski silt loam (coarse-silty, mixed, superactive, mesic Fluvaquentic Dystrudepts) [29]. An initial base soil test for the current nutrient level was taken on late summer 2019 prior to cover crop planting. The top 15 cm of soil was analyzed and amended with mineral nutrients as recommended by the University of Massachusetts Soil and Plant Nutrient Testing Laboratory (Amherst, MA, USA) for sweet corn. Following tillage and mineral amendment, two seasons of winter rye/legume cover crop followed by summer sweet corn were grown. During the course of the experiment, irrigation was only used during sweet corn transplantation and was not used to counteract periods of drought during the growing season.

2.2. Field Management and Measurements

In this experiment, we used four termination strategies for the winter rye–legume mix and application of four N fertilization rates in the succeeding sweet corn to examine the weed status, N uptake, ear yield, and ear quality grown after a late terminated winter rye.
On 9 September 2019, 112 kg ha−1 Aroostook winter rye and 11.2 kg ha−1 Marathon red clover (Trifolium pratense L.) were planted across the entire field site using a 3P606NT Great Plains no-till drill with 19 cm between rows. The following spring, the field was divided into a split-plot randomized complete block design with four replications. Cover crop termination was the main plot, and N fertilizer rate was the subplot. Main plots were 24.4 m by 2.28 m and consisted of four 6.1 m by 2.28 m subplots.
The cover crop termination treatments were: (1) cultivation and disk tillage (CDT): termination of cover crops mechanically and in-season mechanical cultivation for weed control; (2) herbicide application and disk tillage (HDT): termination of cover crops by glyphosate, incorporating residues into the soil, and using herbicides for in-season weed control; (3) herbicide application and no-till (HNT): termination by glyphosate, no residue incorporation but mowing the standing cover crop residues, and no further herbicide for weed control; (4) use of roller crimper no-till (RCNT): termination by roller crimper, no residue incorporation, and no herbicide application for in-season weed control.
The N fertilizer application rates were proportional reductions from the recommended rate of 144 kg ha¹ for the region [30]. The N application rates to sweet corn included 0, 33, 67, and 100 percent of the recommended rates corresponding to 0, 48, 96, and 144 kg ha−1, respectively. The source of N was urea (46% N). Plots were maintained in the same locations for the duration of the experiment in both 2020 and 2021, and all plots received even application of P and K fertilizers to meet sweet corn needs. The source of P was triple superphosphate (45% P2O5), while K was supplied as potassium chloride (60% K2O).
The cover crops were terminated on 28 May 2020 and 27 May 2021 when rye was at 50% flowering stage. CDT plots were mowed and rototilled; RCNT plots were roller crimped; HDT and HNT plots were sprayed with glyphosate (1.12 kg a.i. ha¹). On 4 June 2020 and 3 June 2021, HNT plots were mowed, and HDT and CDT plots were tilled to complete field preparation for planting.
The intention had been to plant sweet corn immediately following field preparation. Unfortunately, there were two complications in June of 2020 which led to delay in corn planting. Initially, sweet corn was directly seeded on 8 June 2020 as planned. However, drought conditions led to the almost complete death of corn seedlings throughout the experiment. Since a short-season sweet corn variety (Xtra-Tender 20173) was used, the sweet corn was replanted on 7 July 2020 from seedlings started in the greenhouse. CDT and HDT plots were rototilled before transplanting to eliminate weeds which had sprouted during the month of June. The second complication was that the red clover was inadequately controlled by the roller crimper termination treatment. The sweet corn seedlings were not able to compete with vigorously growing red clover, and these plots were abandoned in 2020 in the interest of suppressing the red clover ahead of the 2021 sweet corn season. The red clover was killed using glyphosate (1.12 kg a.i. ha¹) on 11 August 2020. Thus, in 2020, only three termination treatments (CDT, HDT, and HNT) were included in this study with RCNT added in 2021.
To account for the issue of red clover persistence, the cover crop mixture was changed from rye and red clover planted in 2019 to rye and field peas (Pisum sativum L.), and 123 kg ha−1 Aroostook rye and 73 kg ha−1 4010 forage peas were planted on 22 September 2020, using the same 3P606NT Great Plains no-till drill with 19 cm between the rows. Due to these differences between the production in years 2020 and 2021, the data from each year were statistically analyzed separately.
The delay in transplanting in 2020 means that the dates associated with the sweet corn production were offset between 2020 and 2021 since the management activities depended on sweet corn growth and development rather than calendar date. Sweet corn was started in the greenhouse on 30 June 2020 and 27 May 2021 and transplanted on 7 July 2020 and 7 June 2021. The sweet corn was transplanted in rows 76 cm apart with 15 cm between plants in each row. Starter N fertilizer was applied several days after transplanting; a sidedress N fertilizer was applied at the V5 growth stage on 28 July 2020 and 30 June 2021. The sweet corn harvest was conducted on 16 September 2020 and 20 August 2021 at the milk stage. All measurements were taken from a 3 m section of the center (of three) rows in each plot, corresponding to 2.3 m2 area.
During the season SPAD chlorophyll was measured before side-dressing fertilization, during flowering, and immediately before harvest on 27 July, 18 August, and 15 September 2020 and 29 June, 24 July, and 18 August 2021. SPAD readings were measured halfway between the tip and collar of the uppermost exposed leaf and an average from three randomly selected plants per plot was recorded [31,32].
Soil samples from the top 30 cm were collected before sidedress fertilization fertilizer. Additionally, soil samples from the top 30 cm were collected after harvest in 2021 on 27 August.
In season weed control was performed before sidedress fertilization on 27 July 2020 and 6 July 2021. A multivator was used to cultivate between corn rows in CDT plots, and 2, 4–Dichlorophenoxyacetic acid (0.53 kg a.i. ha−1) was sprayed on HDT plots. No weed control was performed in either RCNT or HNT plots, as weed control in these treatments relied solely on mulching from cover crop residue. Weed biomass was measured immediately after sweet corn harvest on 18 September 2020 and 24 August 2021.
At harvest, all corn plants were cut at ground level from the 3 m row section in each plot. The fresh biomass of whole sweet corn plants and marketable ears was measured, and two randomly selected plants and ears were dried to calculate dry sweet corn biomass. Agronomic N use efficiency was calculated as the difference between each plot’s dry ear biomass and the corresponding 0 N plot divided by the amount of N fertilizer added. Mean ear fresh weight was calculated from the total fresh weight and the number of ears per plot.
Before setting aside ears for drying as part of both the whole plant and ear samples, the quality metrics of the fresh sweet corn, including ear length, circumference, and grain fill (as a percentage of total ear length) were measured.

2.3. Laboratory Analysis

Soil samples from before sidedress fertilization and after harvest in 2021 were dried for lab analysis. The extractable inorganic nitrate was measured from all treatments using the Flow Injection Analysis (FIA) method where soil samples were extracted with calcium chloride solution for colorimetric determination of nitrate [33]. The extracts were analyzed for nitrite using cadmium reduction using an Auto-analyzer with Flow Injection Analysis, [34]. Dried samples of whole corn plant and cover crop samples were ground to 1 mm and analyzed for N content with near infrared reflectance (NIR) spectroscopy using InfoStar Software version 3.10.0 on a Model 2400 RTW SpectraStar from Unity Scientific, LLC. (Milford, MA, USA).

2.4. Statistical Analysis

The data were analyzed using the lme4 [35], emmeans [36], and MuMIn [37] packages of the R statistical software [38]. Each year was analyzed separately with explanatory effects of block as a random variable, cover crop termination as a discrete fixed variable, and N fertilization rate as a continuous fixed variable. The response variables were analyzed using linear mixed effect models with both main effects and their interaction tested at a significance level of p ≤ 0.05. Where the overall effects were significant, Tukey’s HSD adjusted t tests were used to make pairwise comparisons between cover crop termination methods, and orthogonal polynomial regression was used for analyzing the effect of N fertilization and the interaction between termination and N rate.

3. Results

3.1. Weather Conditions

The temperature during the course of the experiment was fairly typical for the norm of the area (Table 1). Precipitation was more variable with the summer of 2020 being dryer than normal and the summer of 2021 being wetter. In each season, the total departure from the norm was approximately ten percent of annual total precipitation (Table 1).

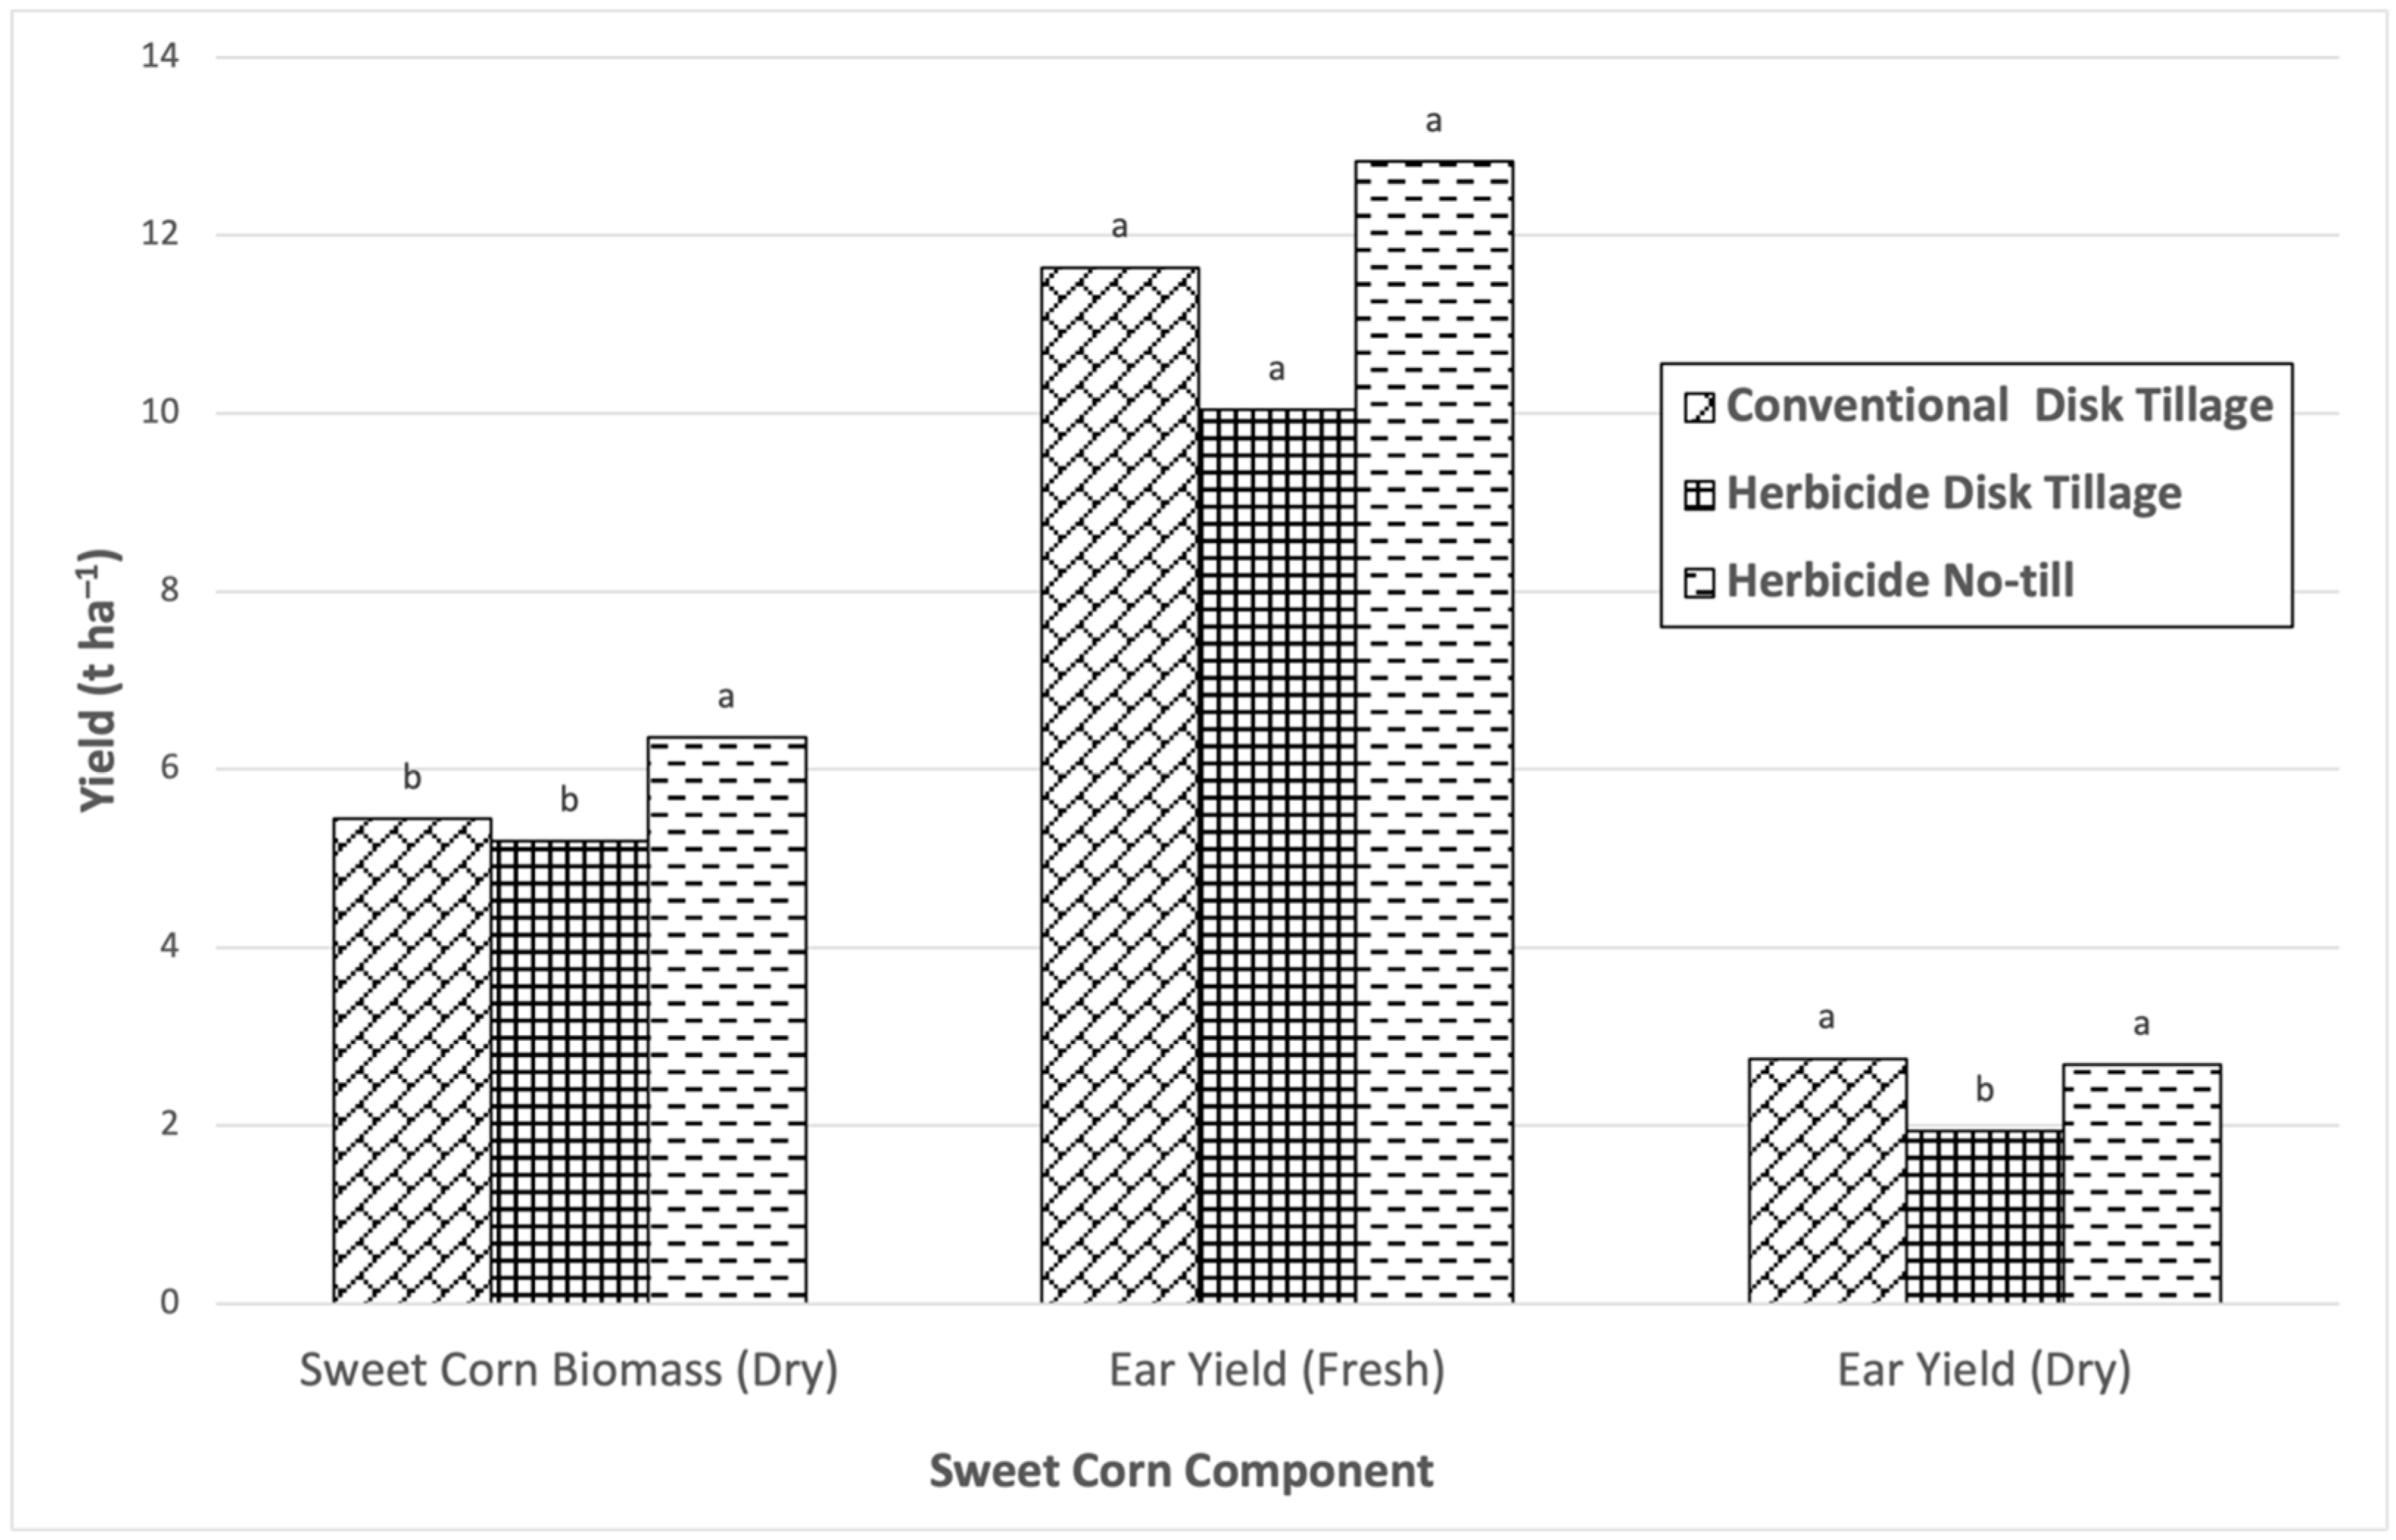
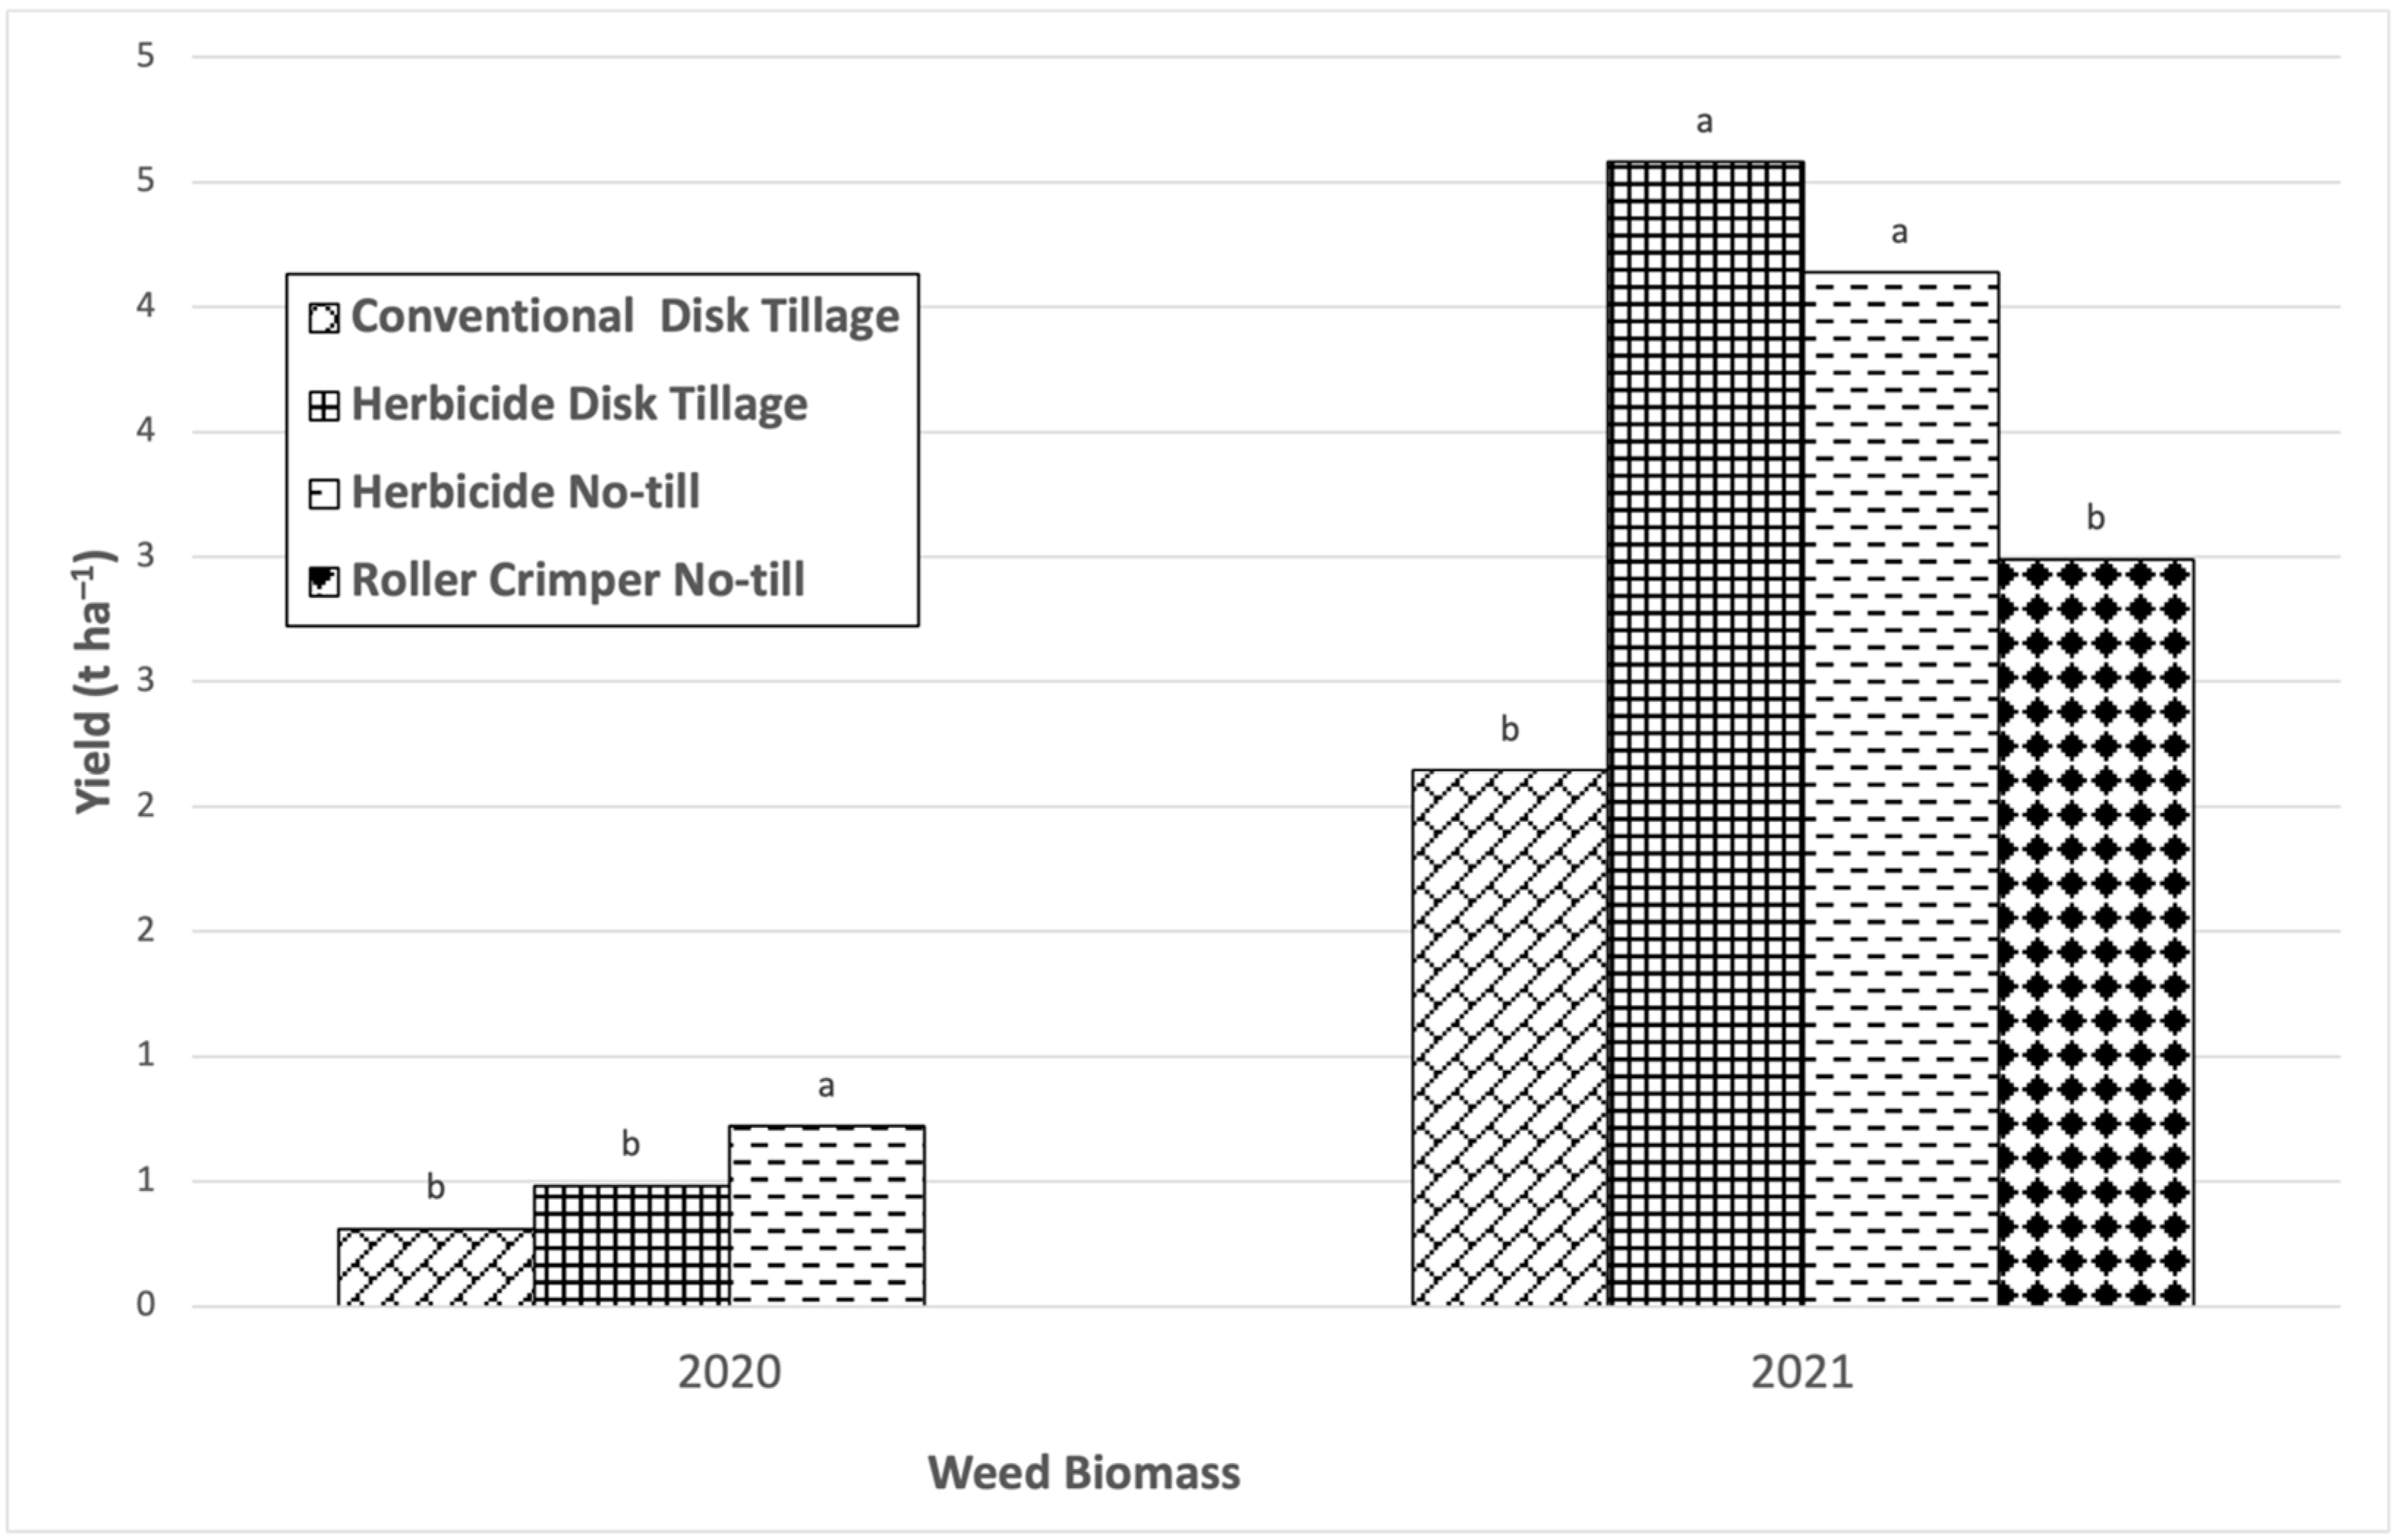
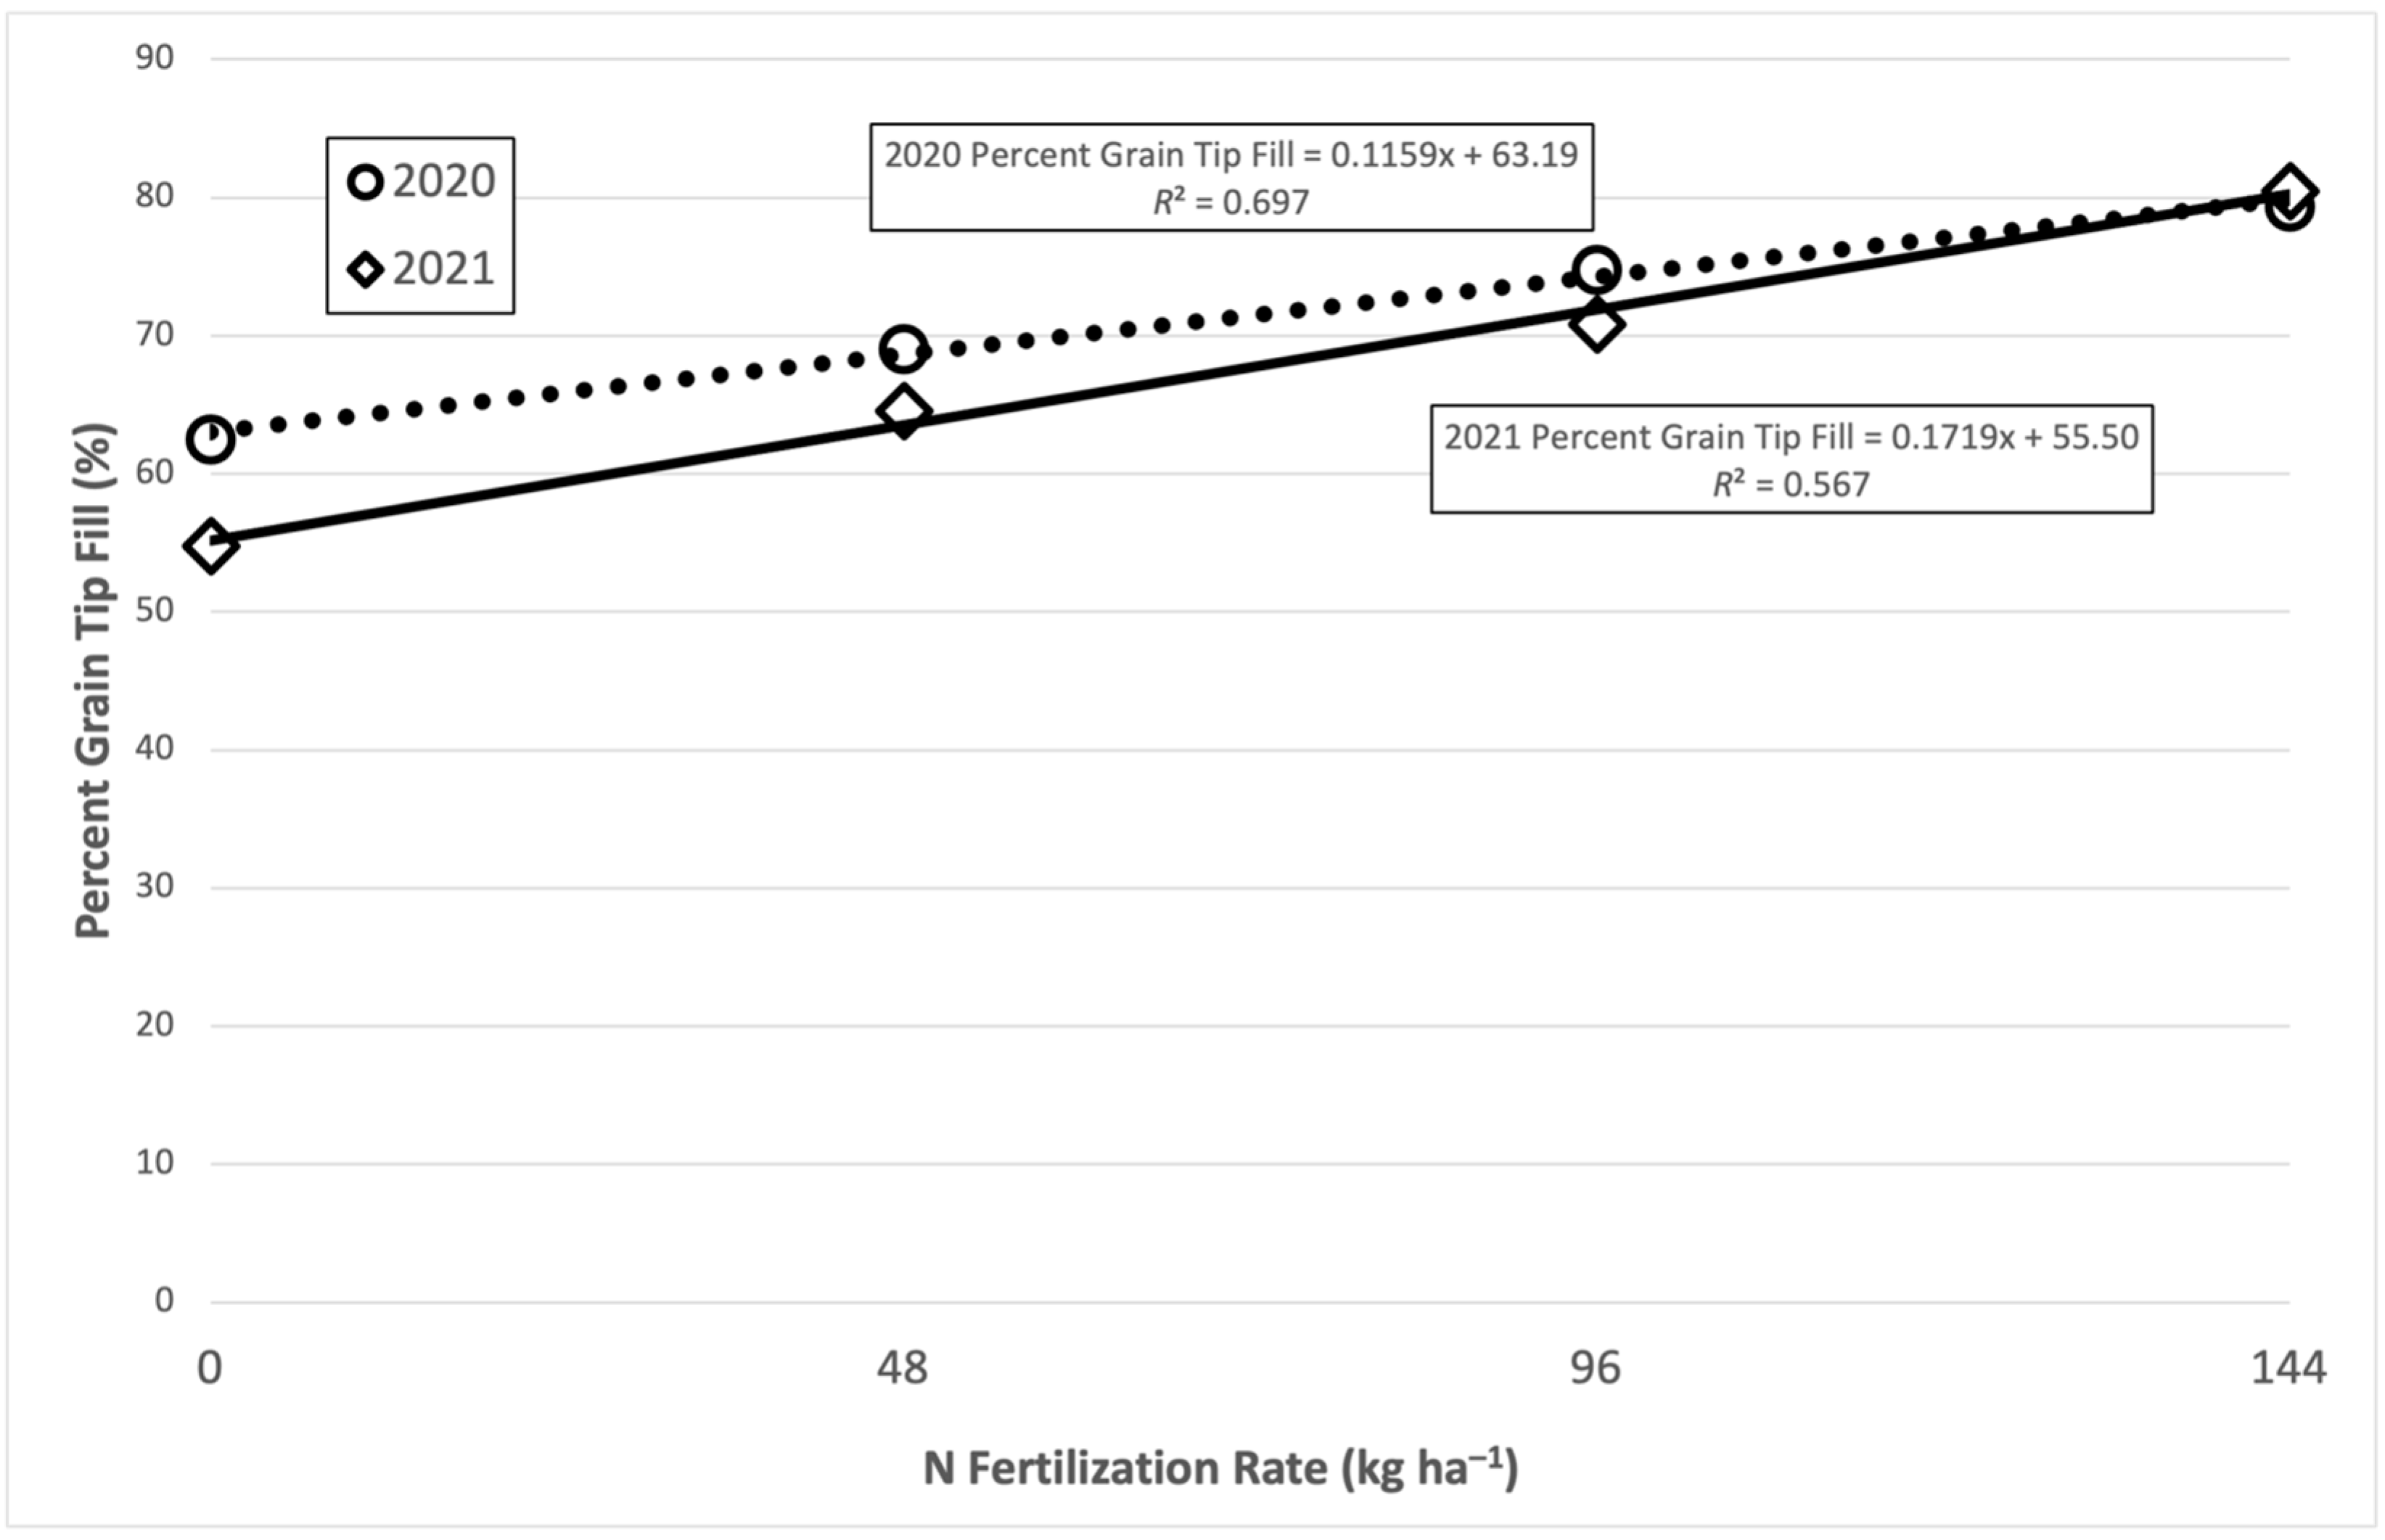
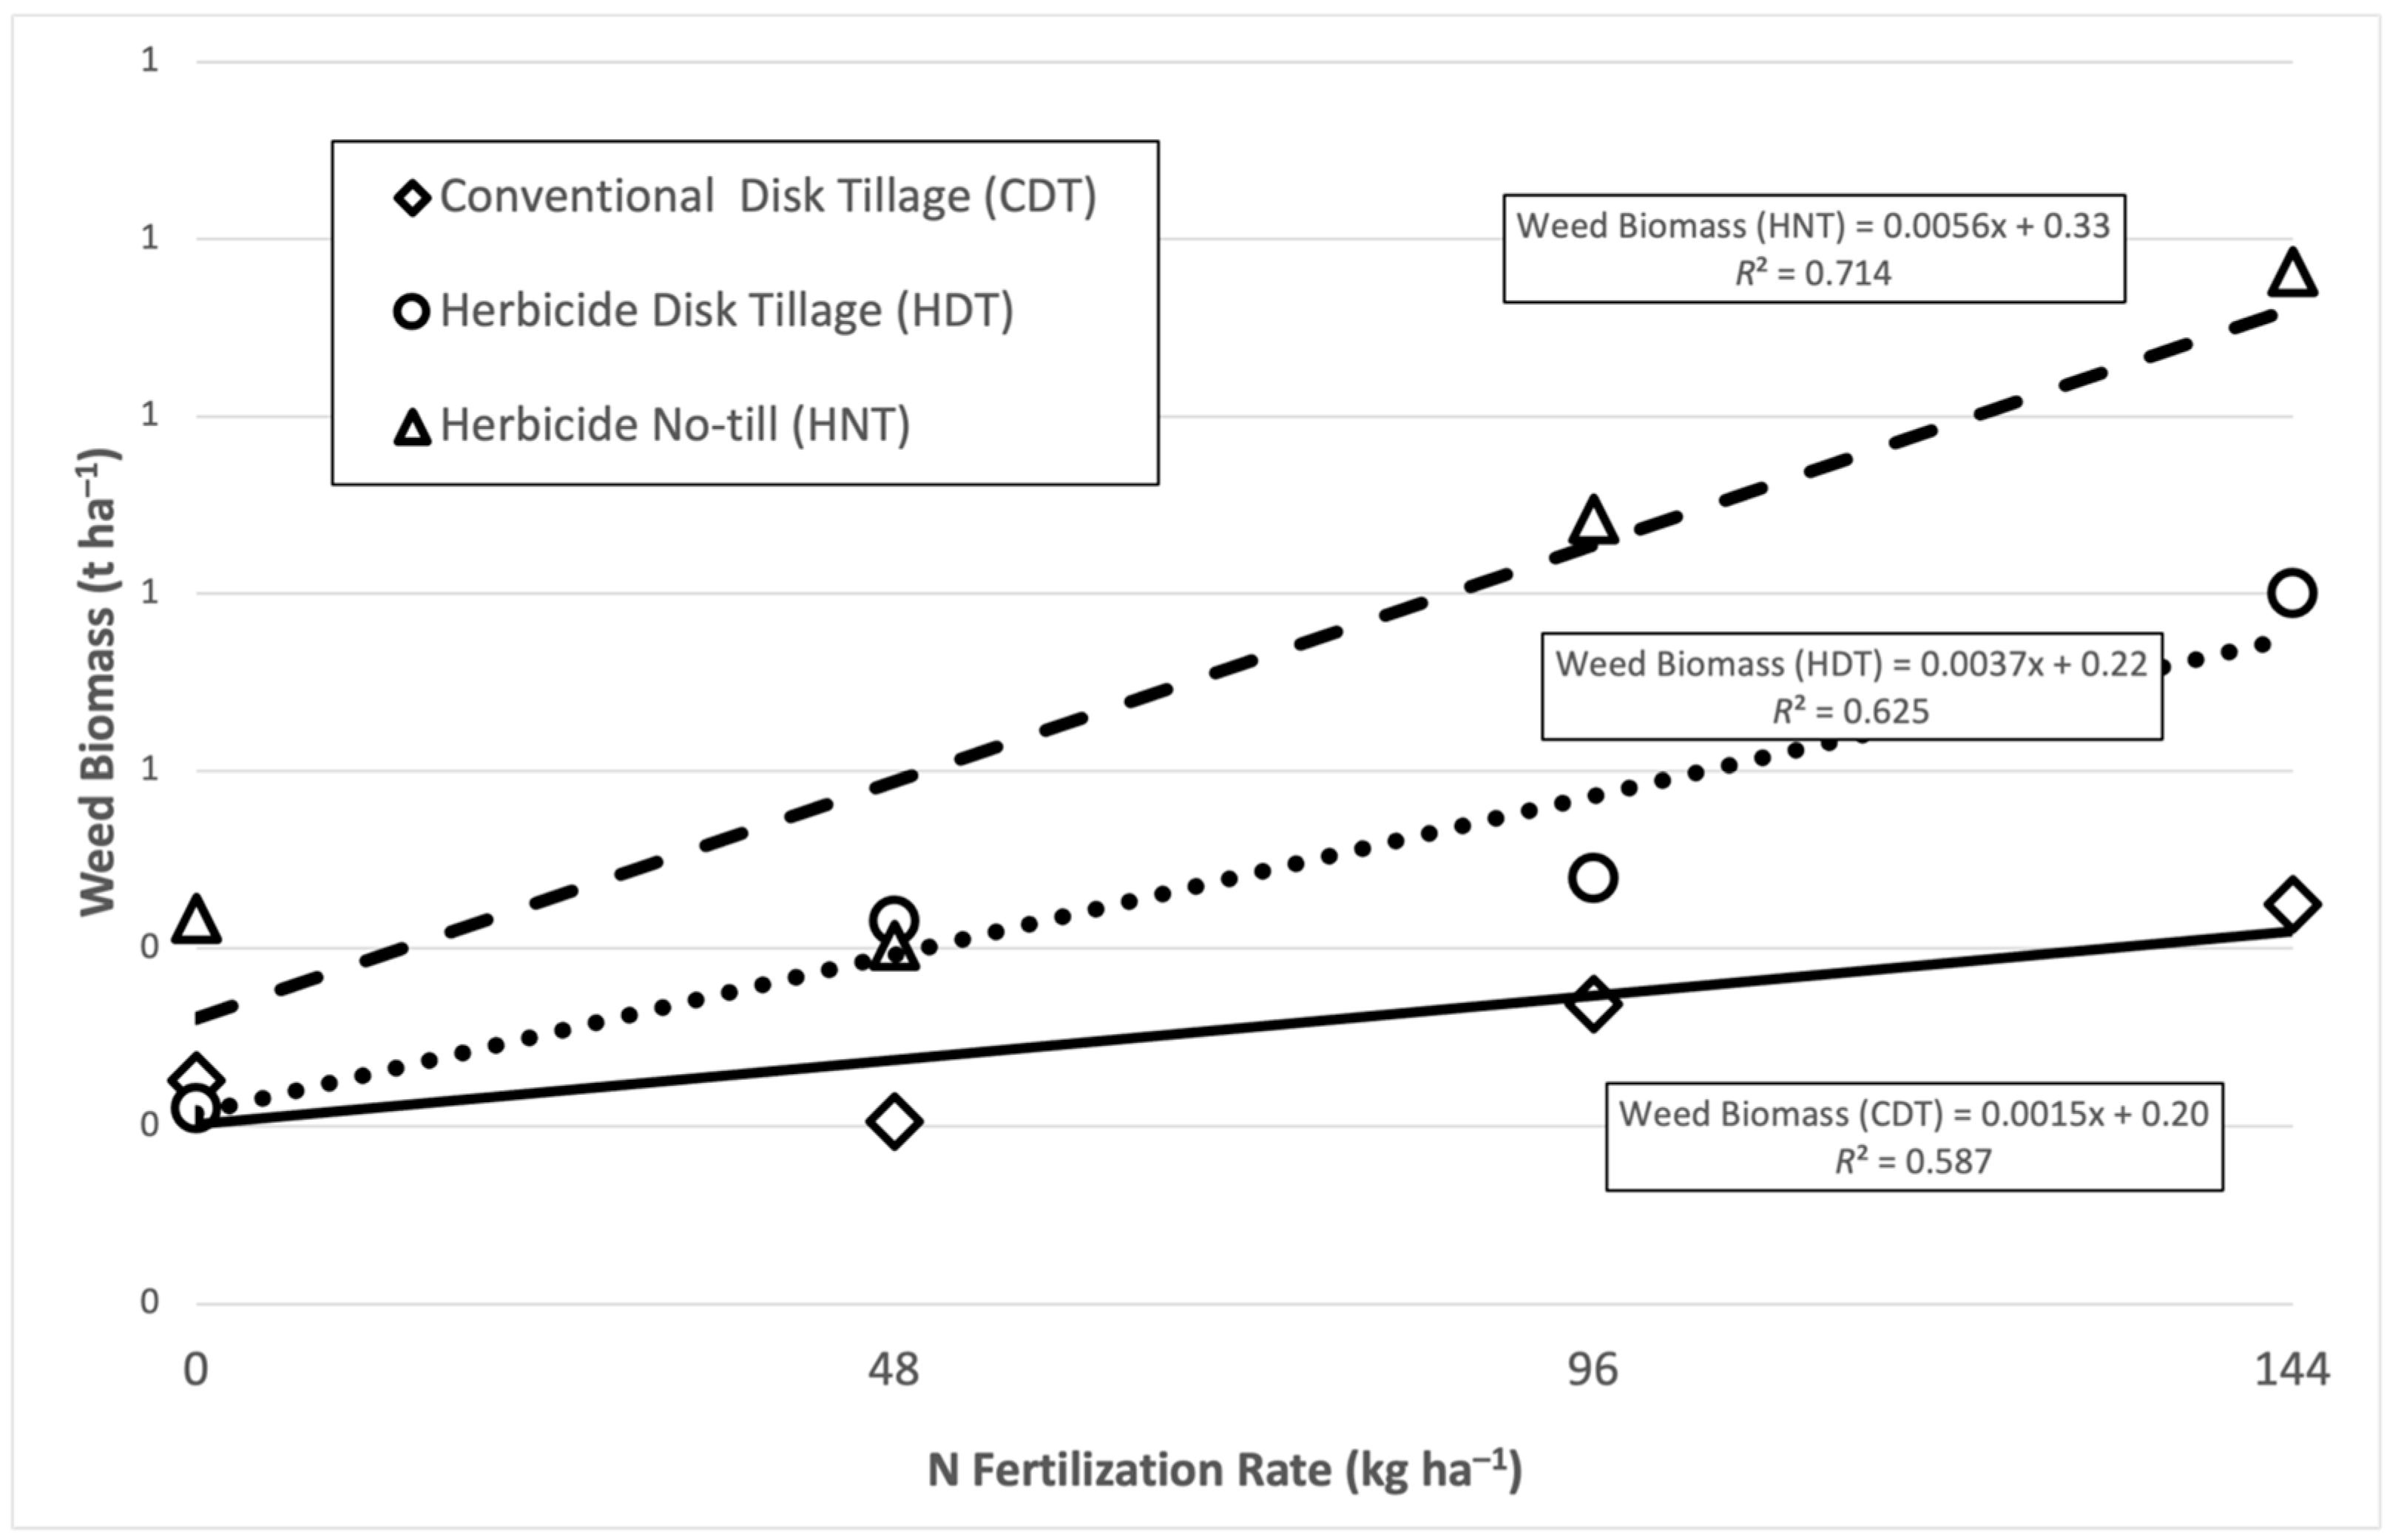
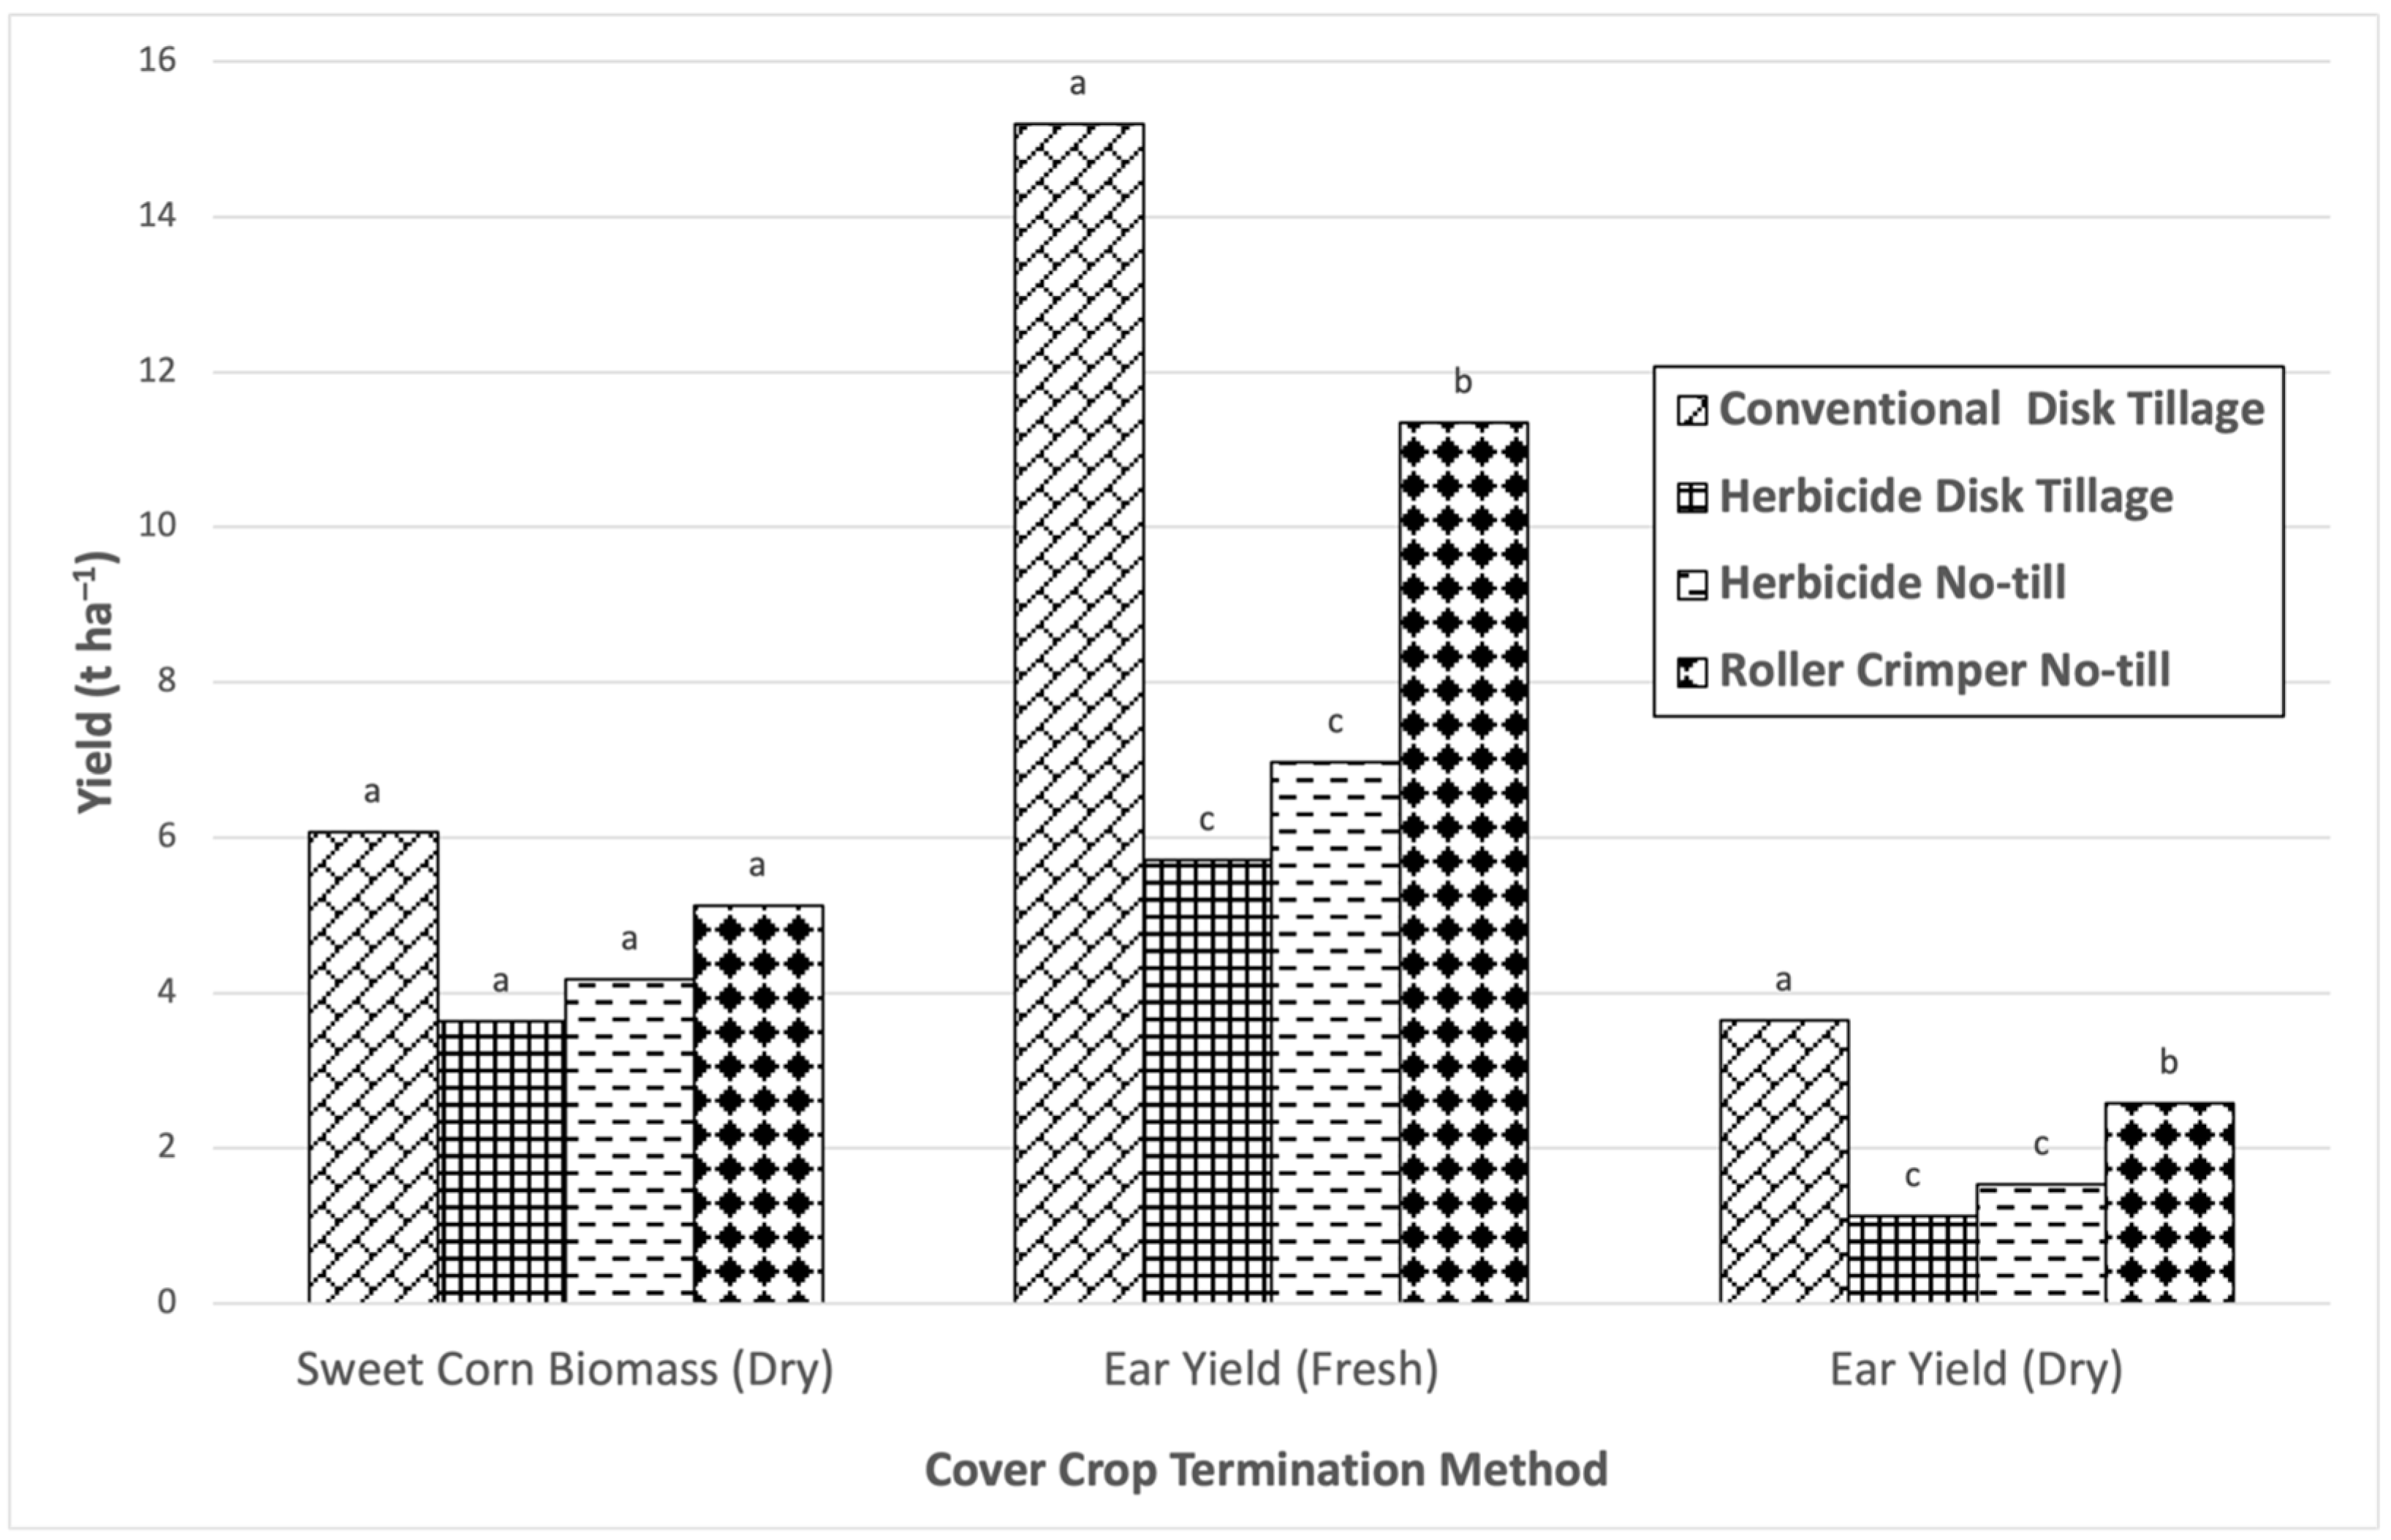
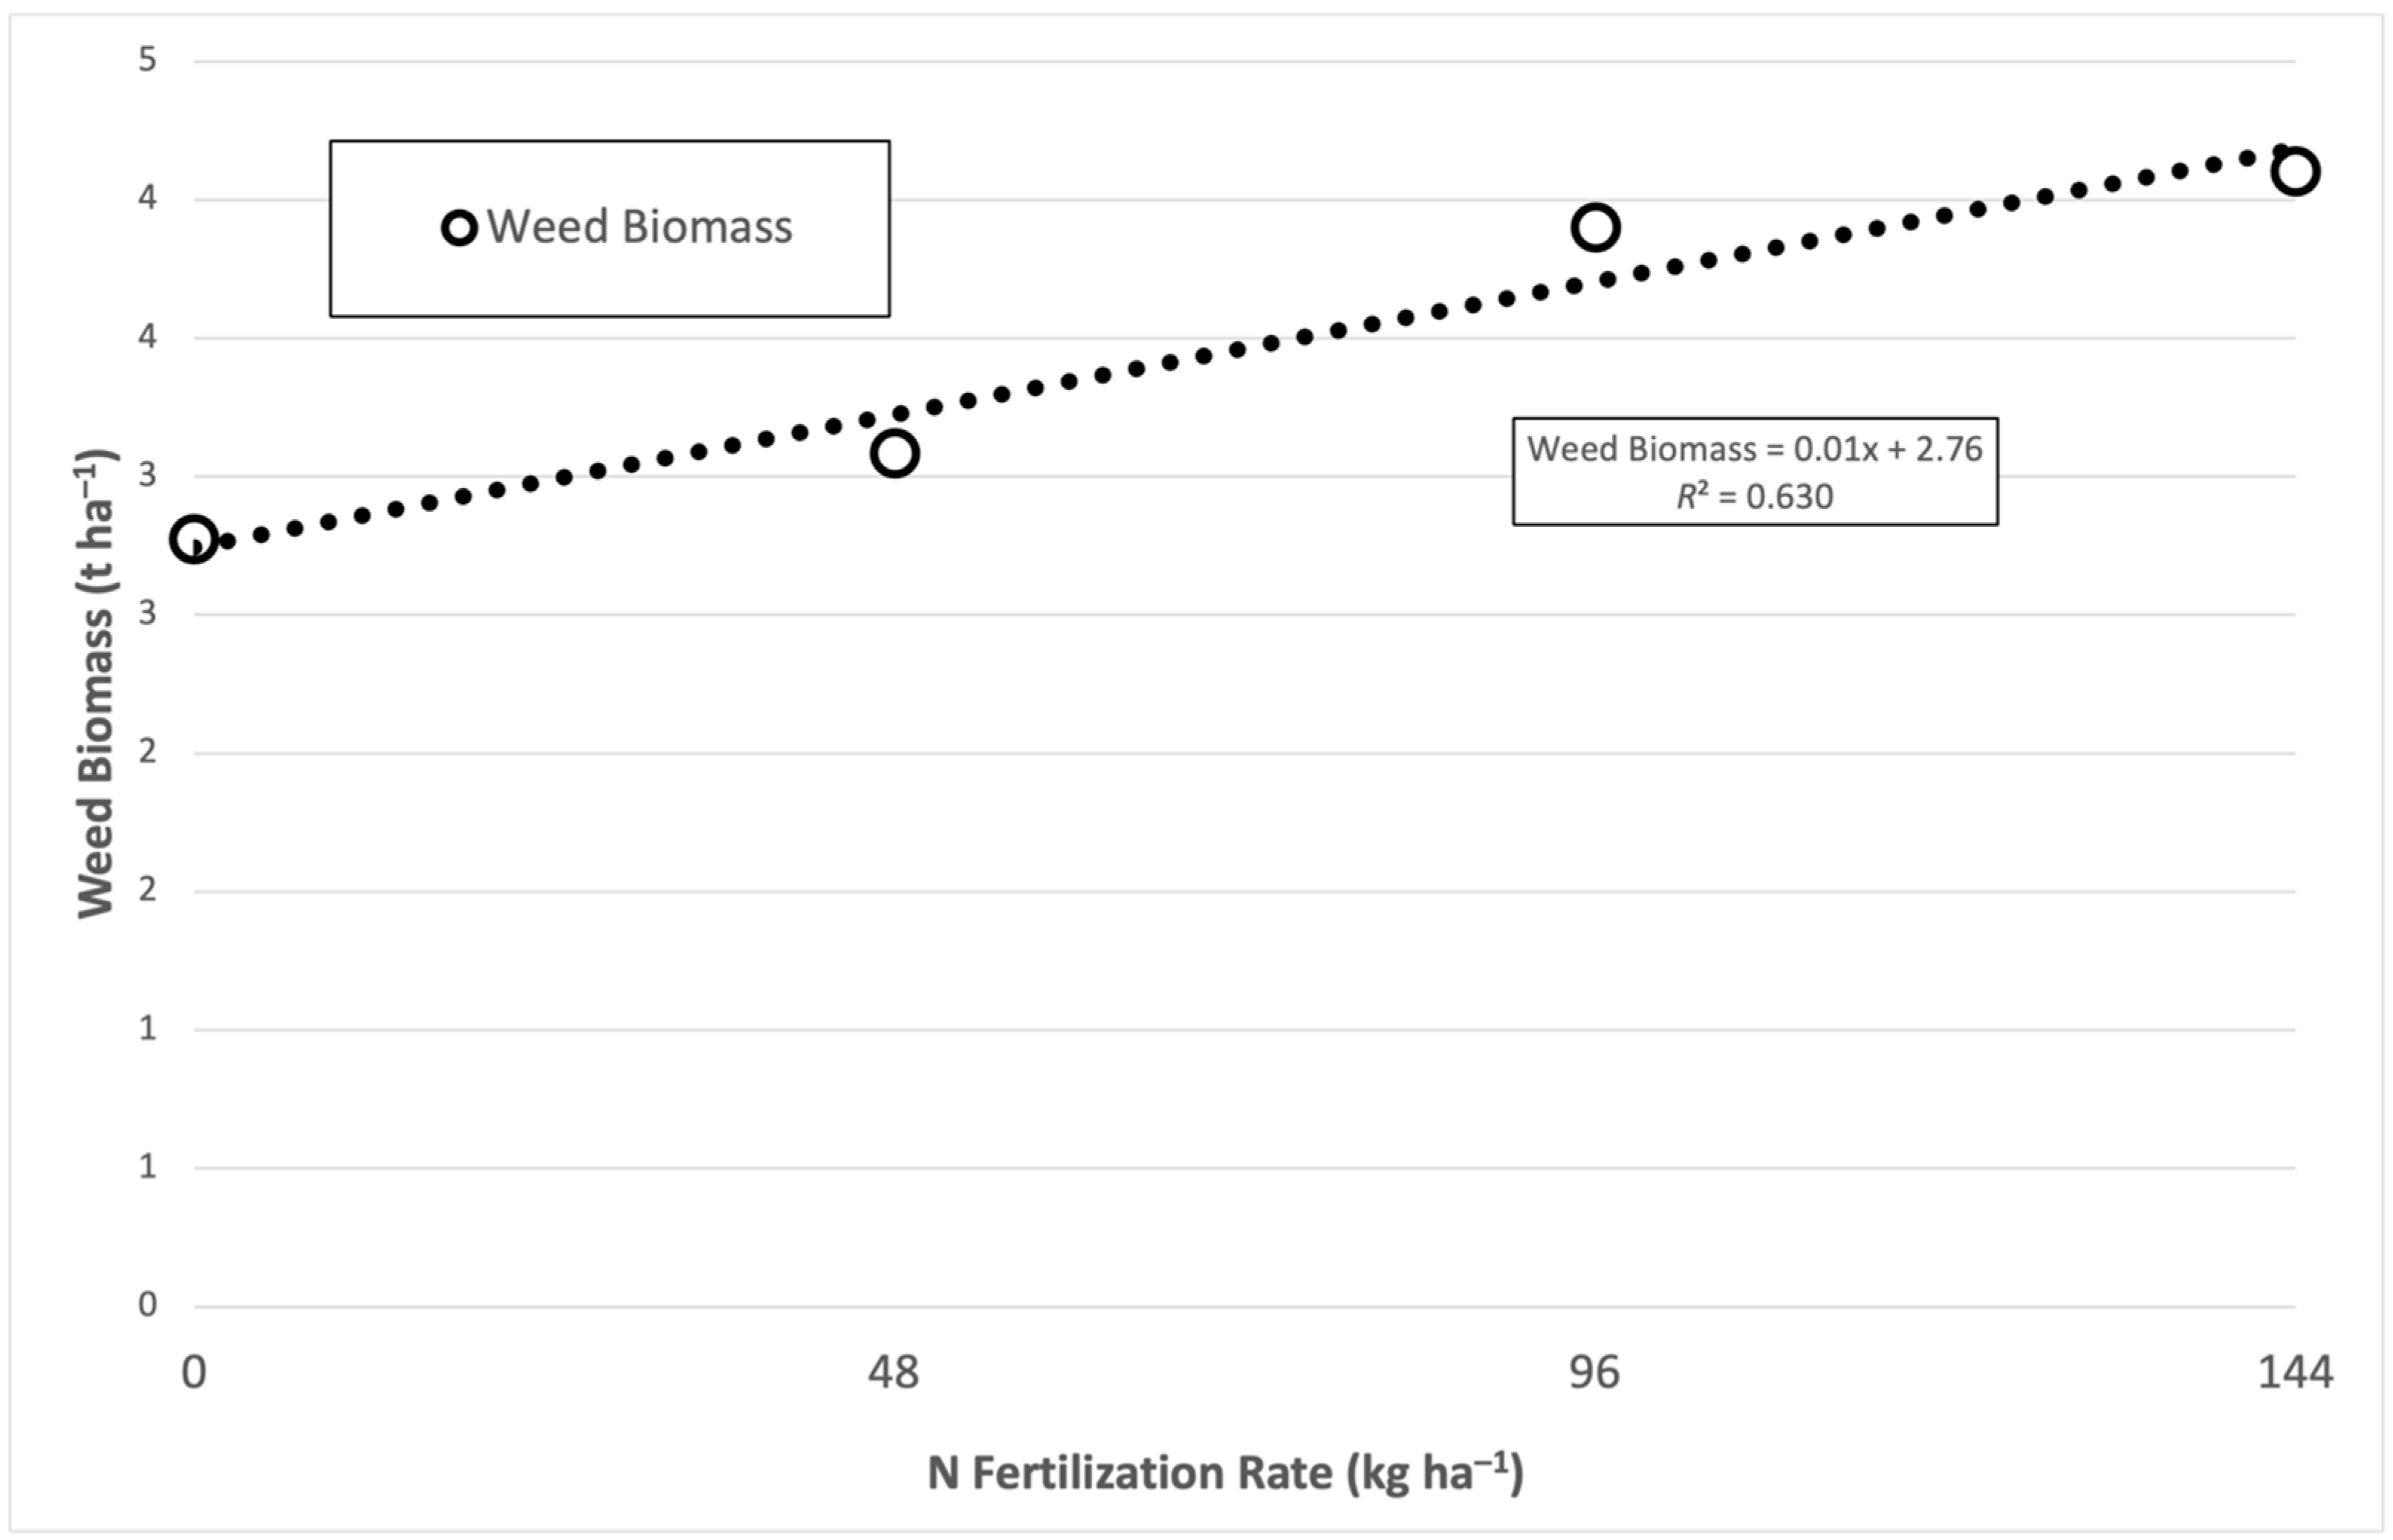
3.2. 2020 Yield and Weed Growth

The cover crop termination method influenced total biomass, ear dry weight, and weed biomass in sweet corn (Table 2, Figure 1). In 2020, the highest total biomass was obtained in plots where cover crops were terminated chemically, and the no-till system was used for planting sweet corn (HNT). The no-till system chemically terminated cover crop treatment (HNT) produced approximately 28% higher ear dry weight than the tilled chemical system (HDT). Interestingly, the late season weedy condition in the no-till chemical terminated cover crops plots had no effect on final ear weight (Table 2, Figure 2).
Averaged over cover crop termination methods, sweet corn biomass, total ear dry and fresh yield (Figure 3), and the number of ears per unit area (Figure 4) increased linearly as the N application rate in sweet corn increased (Table 2). For each kg N applied, whole plant dry biomass increased by 15 kg ha−1 while fresh ear yield increased by 51 kg ha−1, and dry ear biomass increased by 14 kg ha−1 (Figure 3).
In 2020, ear characteristics, including average ear weight, ear length, ear diameter, and percent ear tip fill (as an indication of ear quality) were not significantly affected by cover crop termination methods (Table 3). However, ear components of sweet corn were improved linearly as the N application rate increased (Table 3). For example, average ear length and ear diameter increased by 15% and 13%, respectively when N was applied at the recommended application rate. Meanwhile, ears that received the recommended N rate had 22% fewer unfilled ear tips (Figure 5). Weed biomass increased with N application in glyphosate terminated methods (HNT and HDT) but not following conventional tillage and cultivation to control weeds (CDT) (Table 2, Figure 6).

3.3. 2021 Yield and Weed Growth
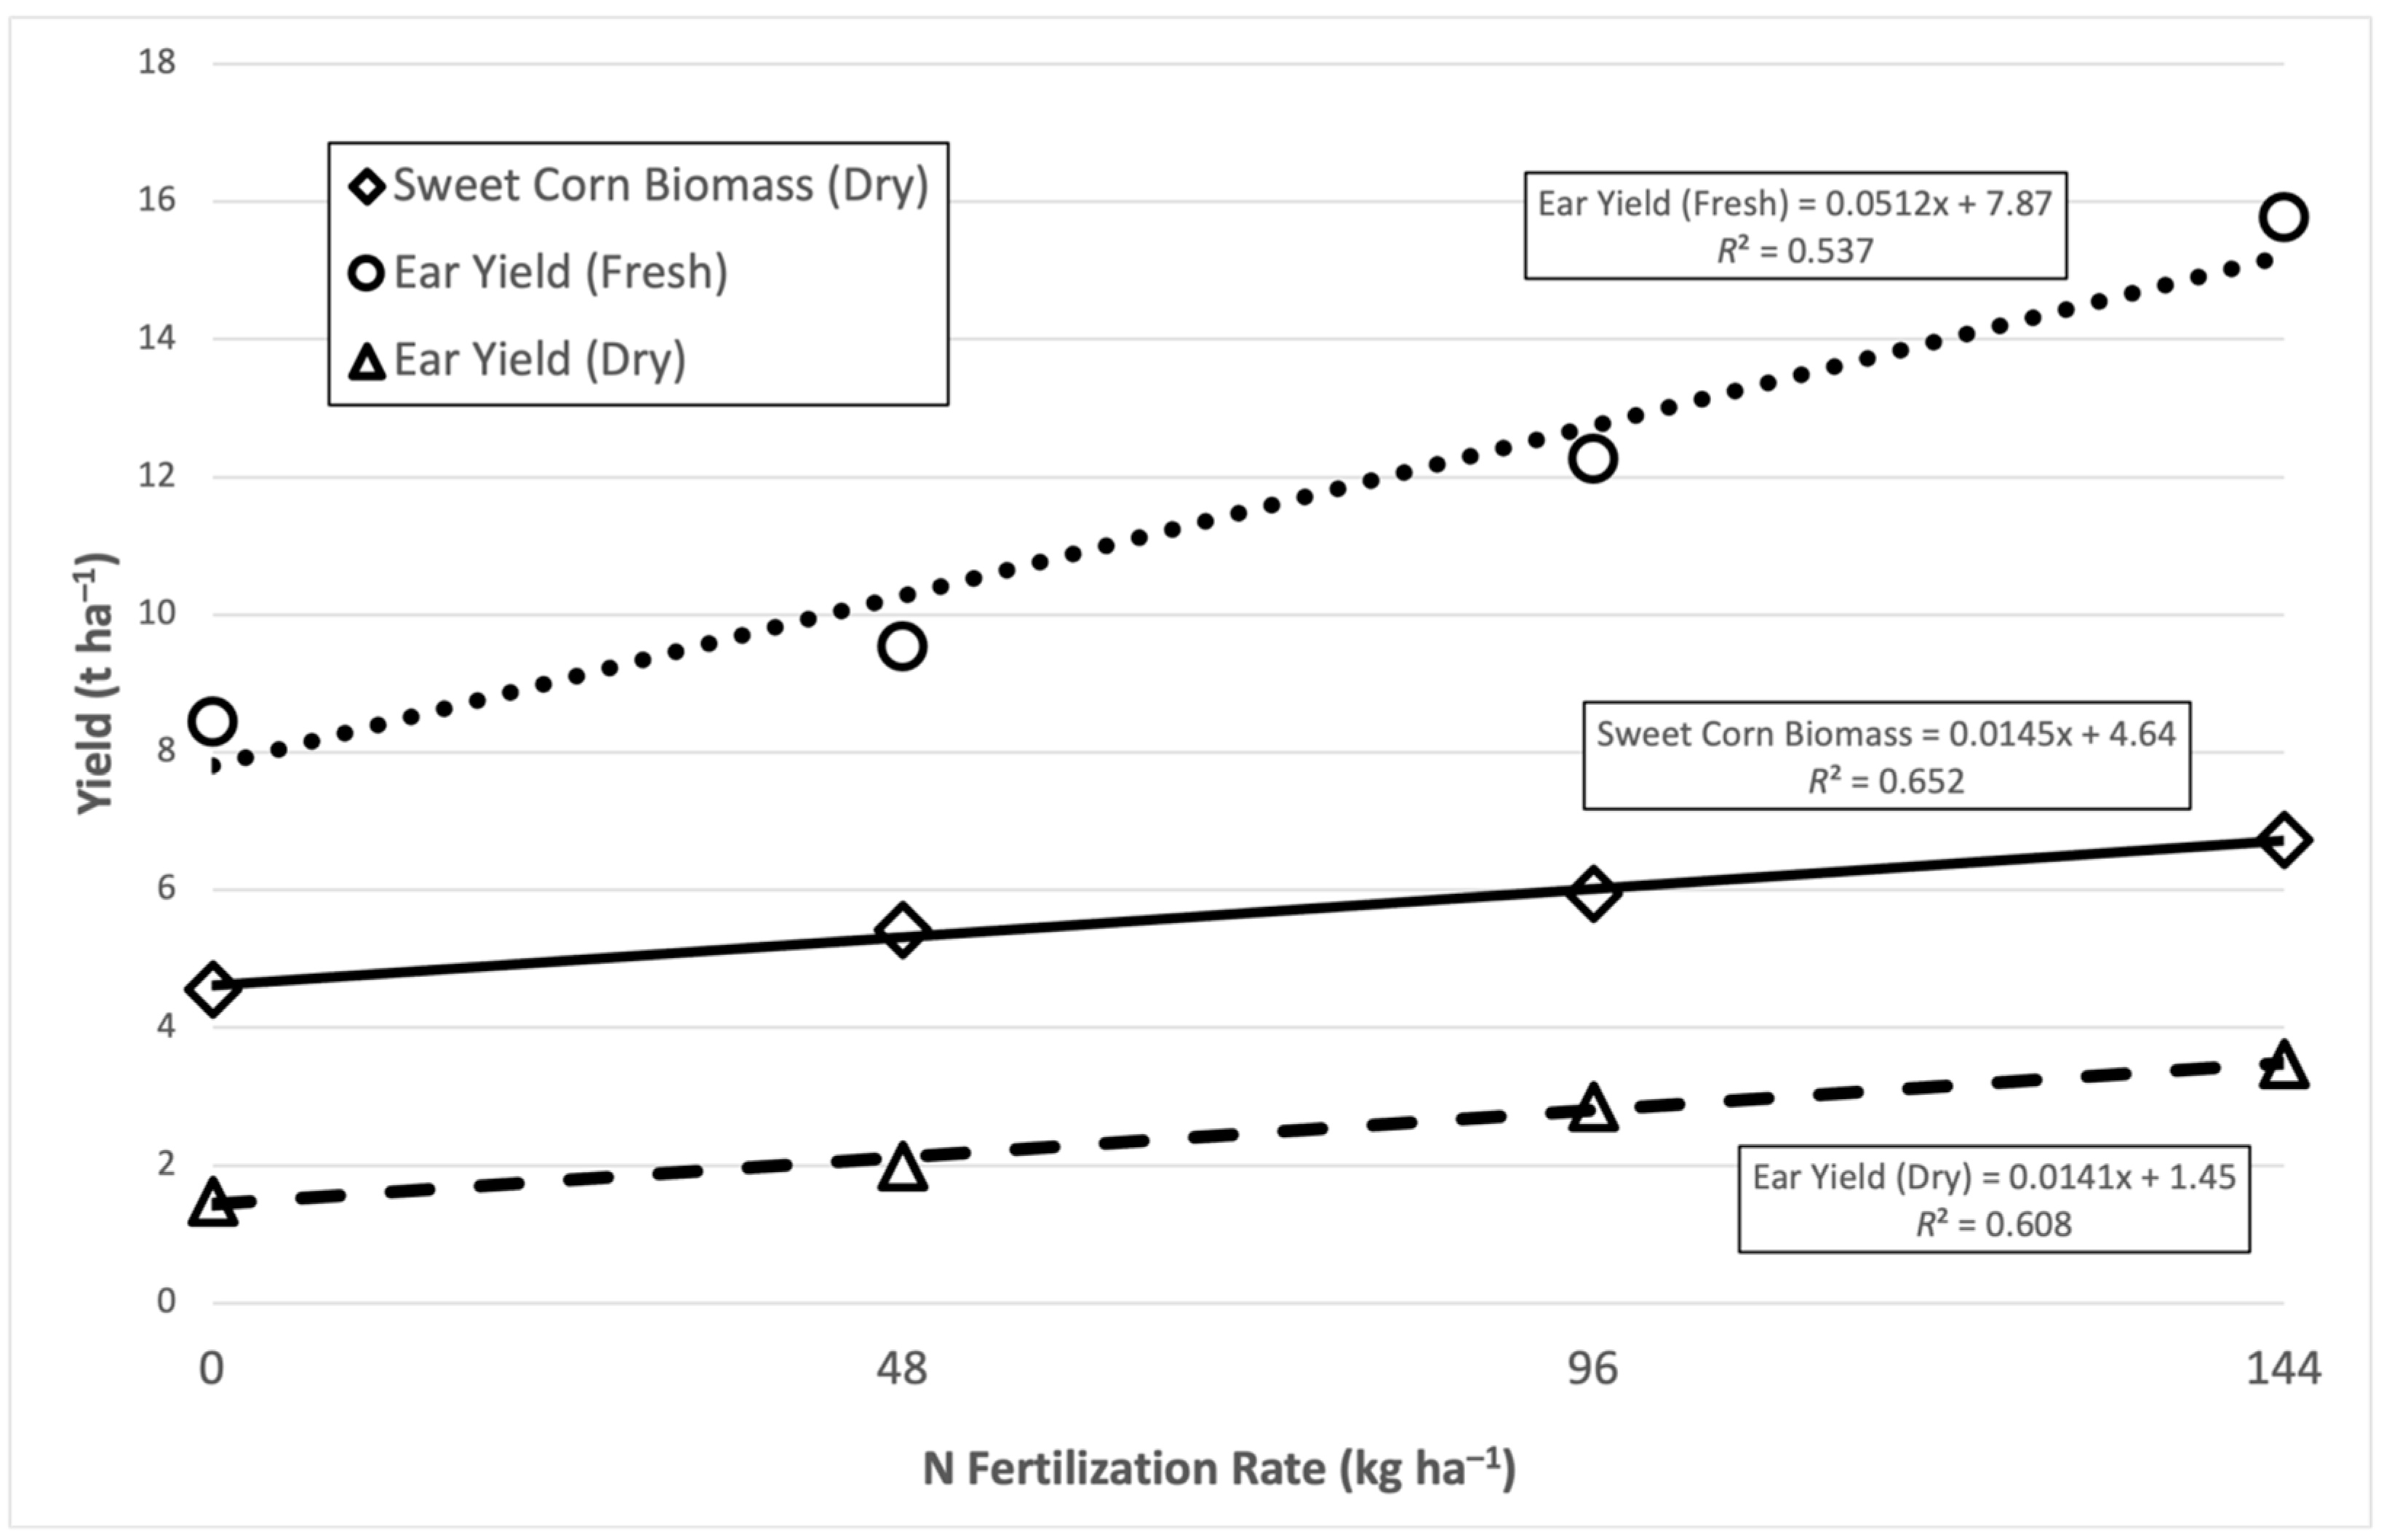
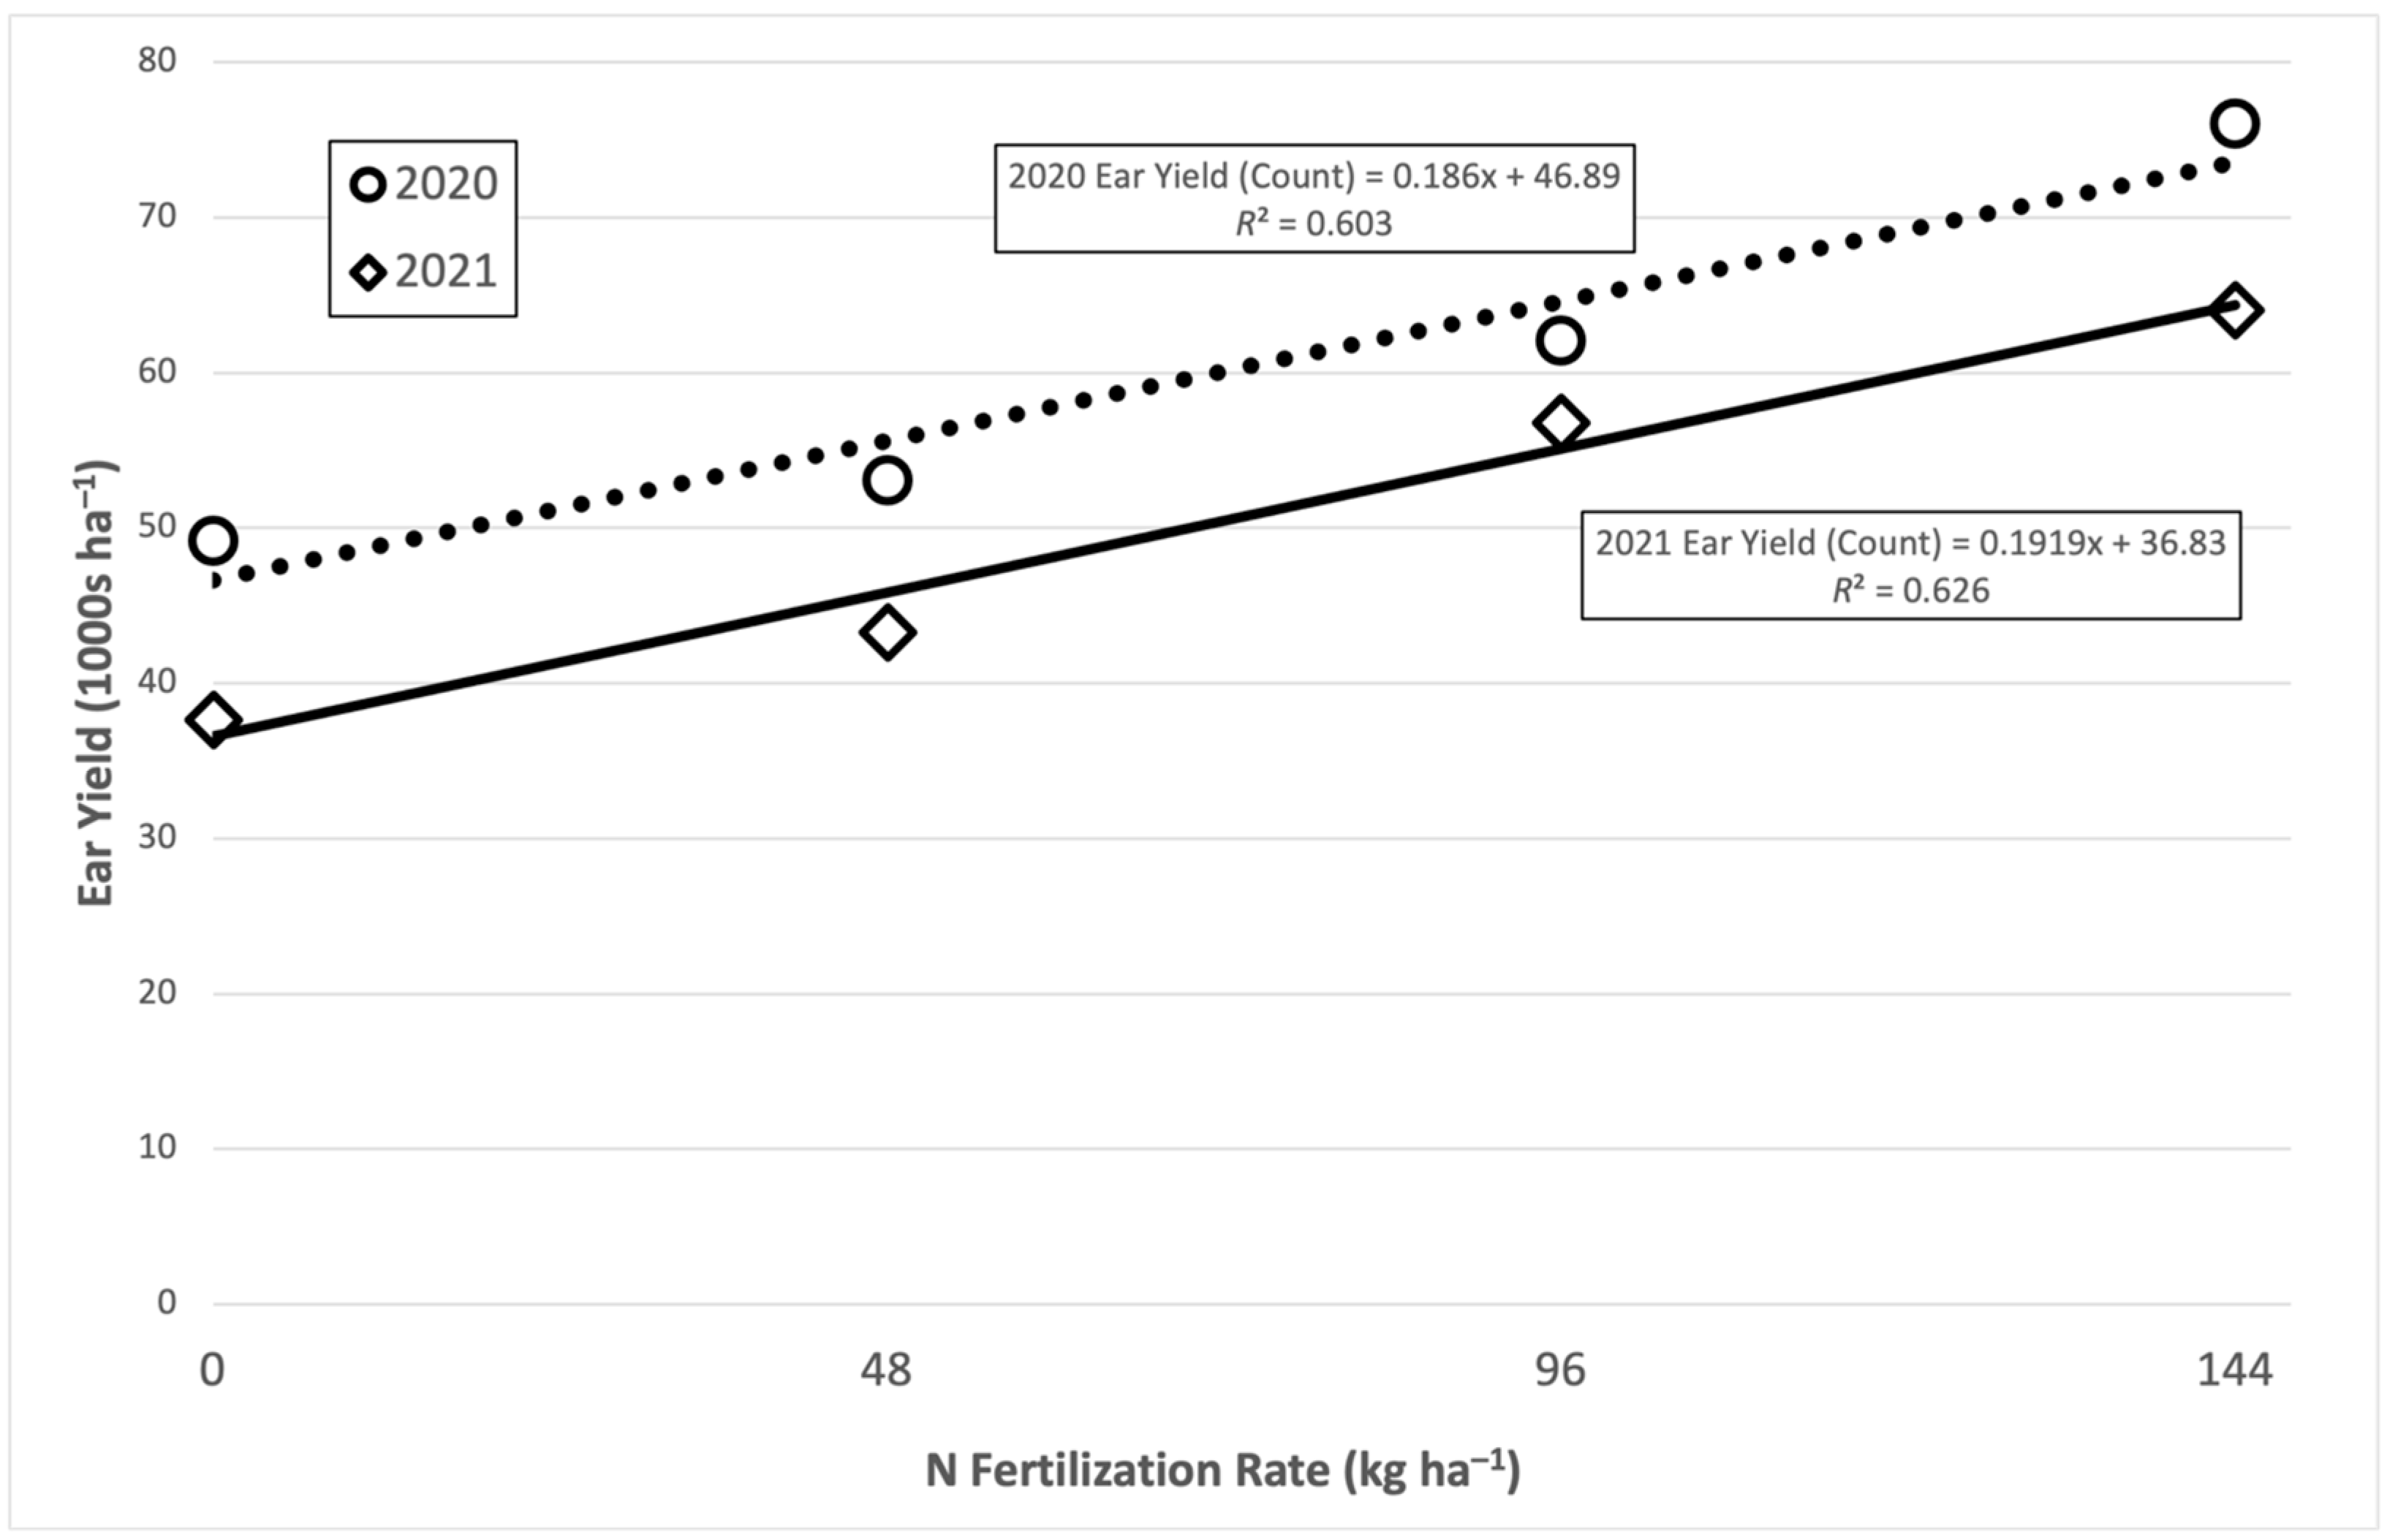
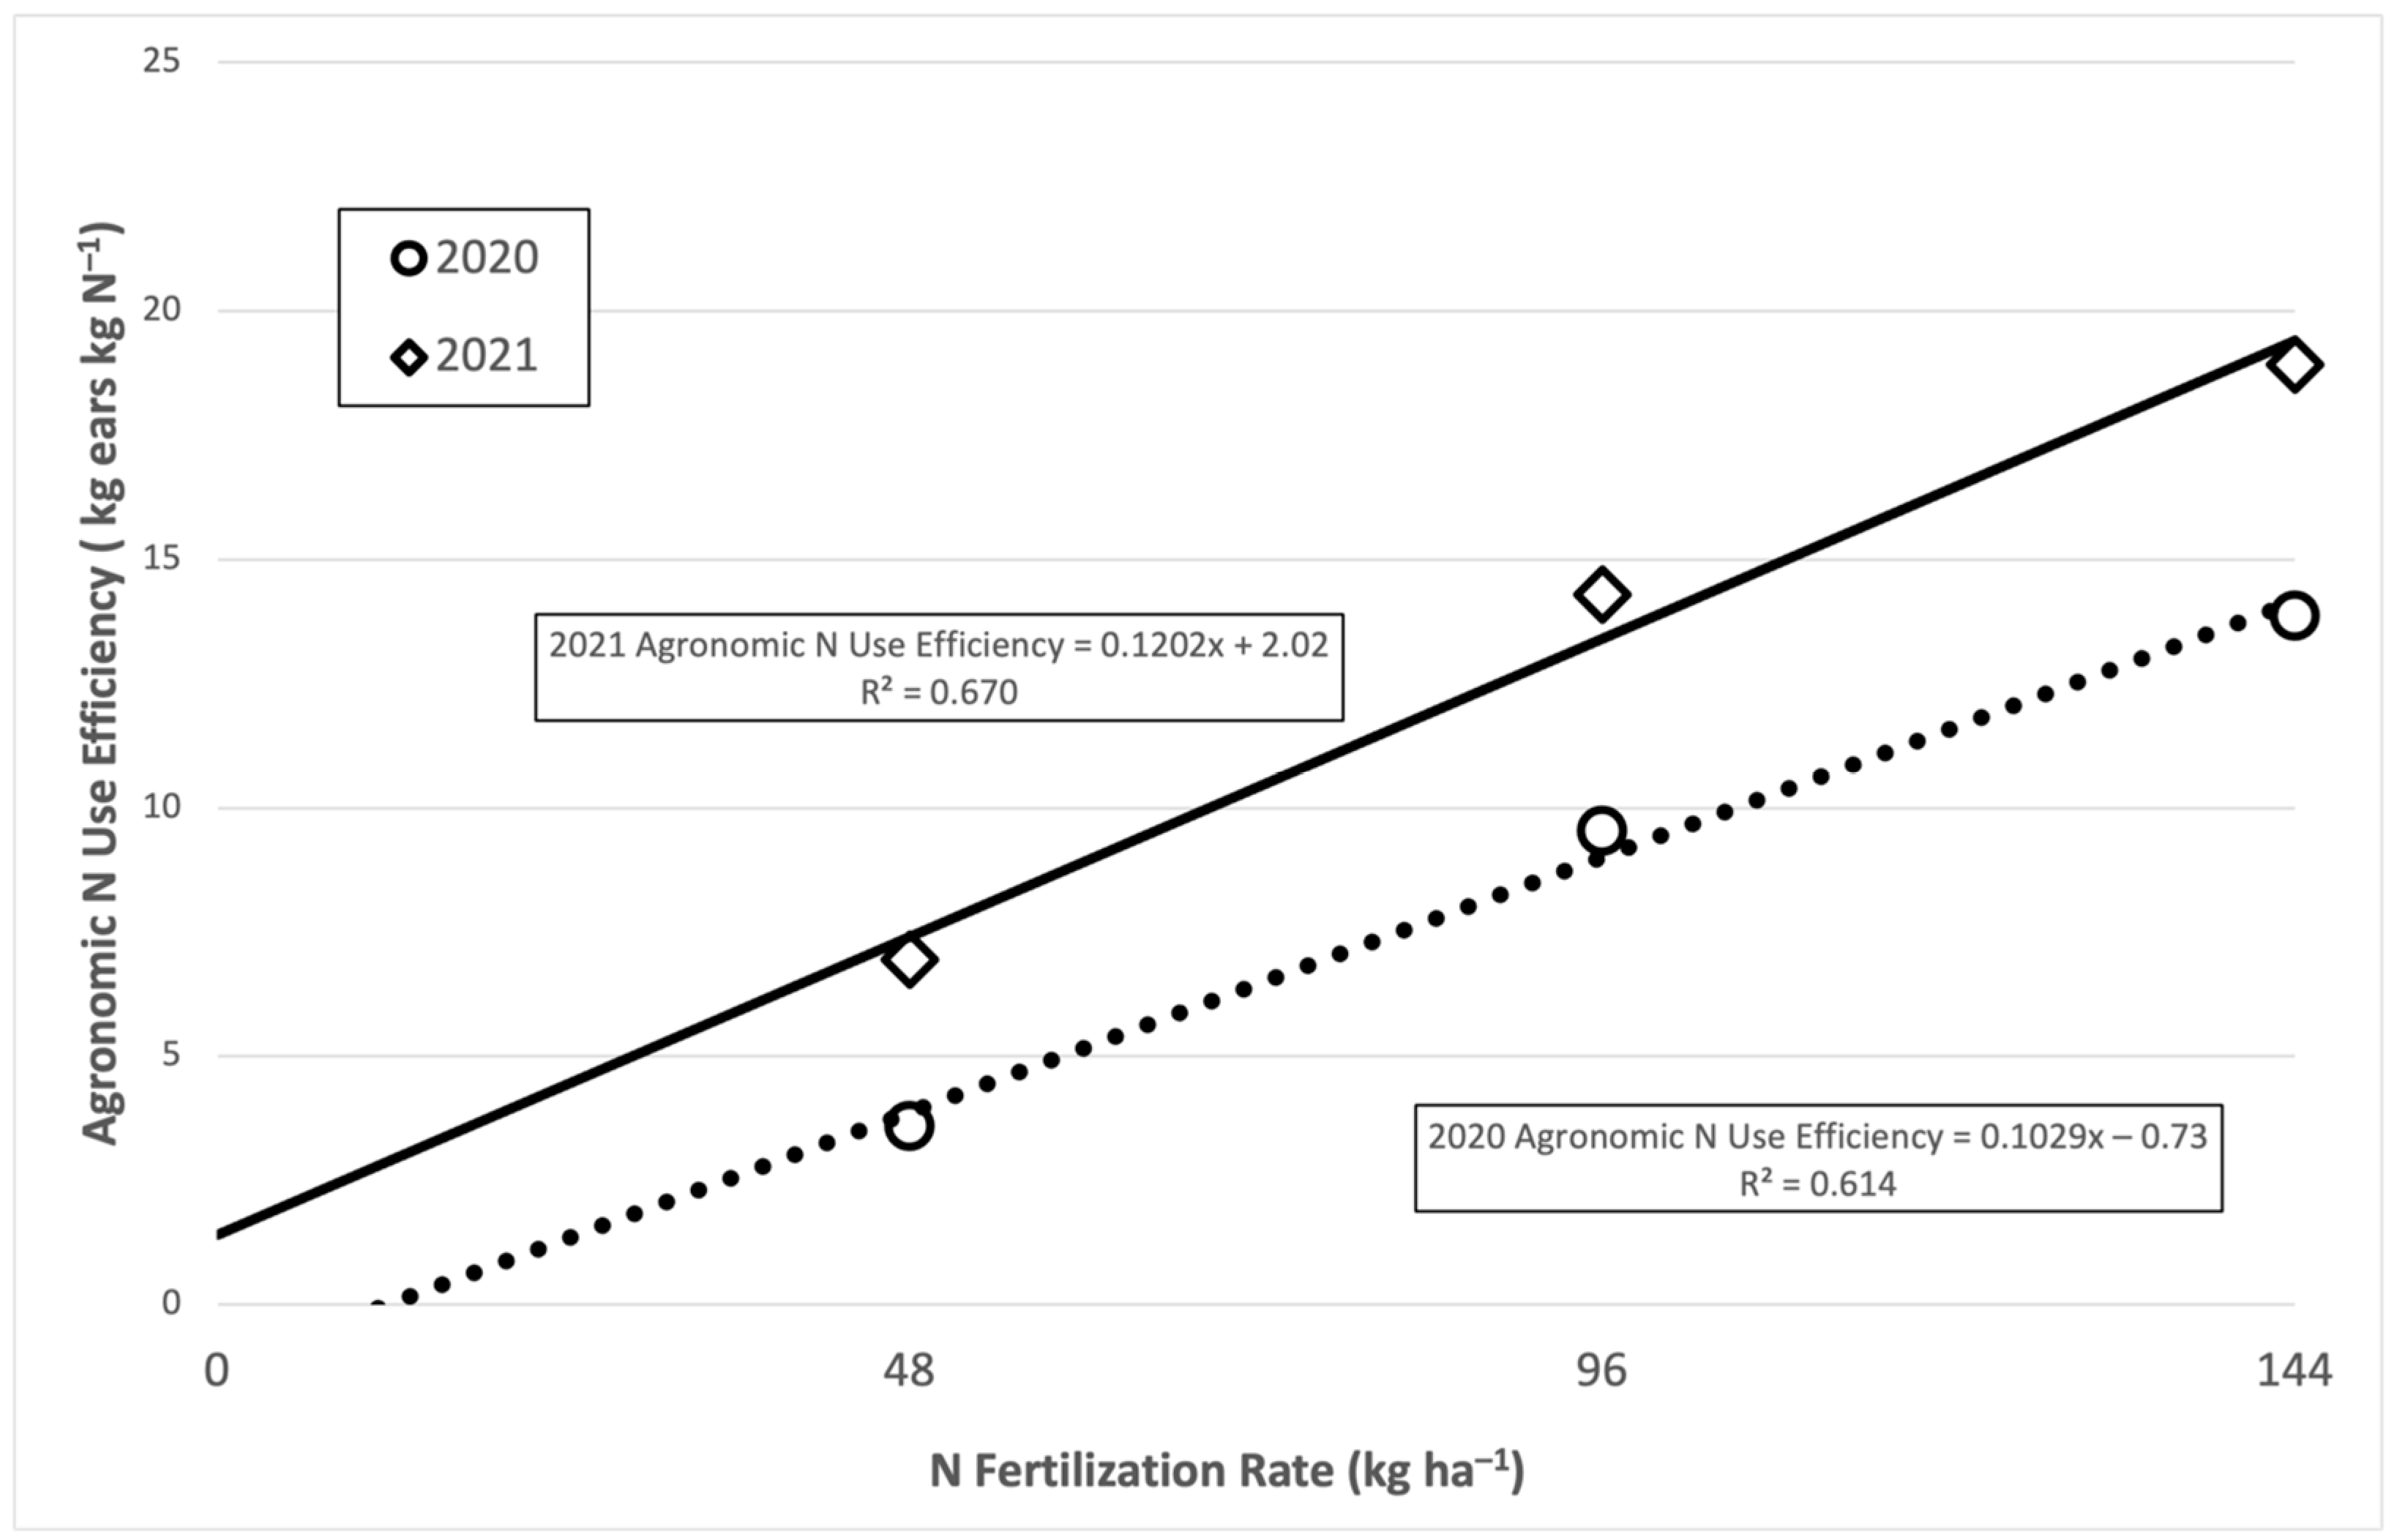
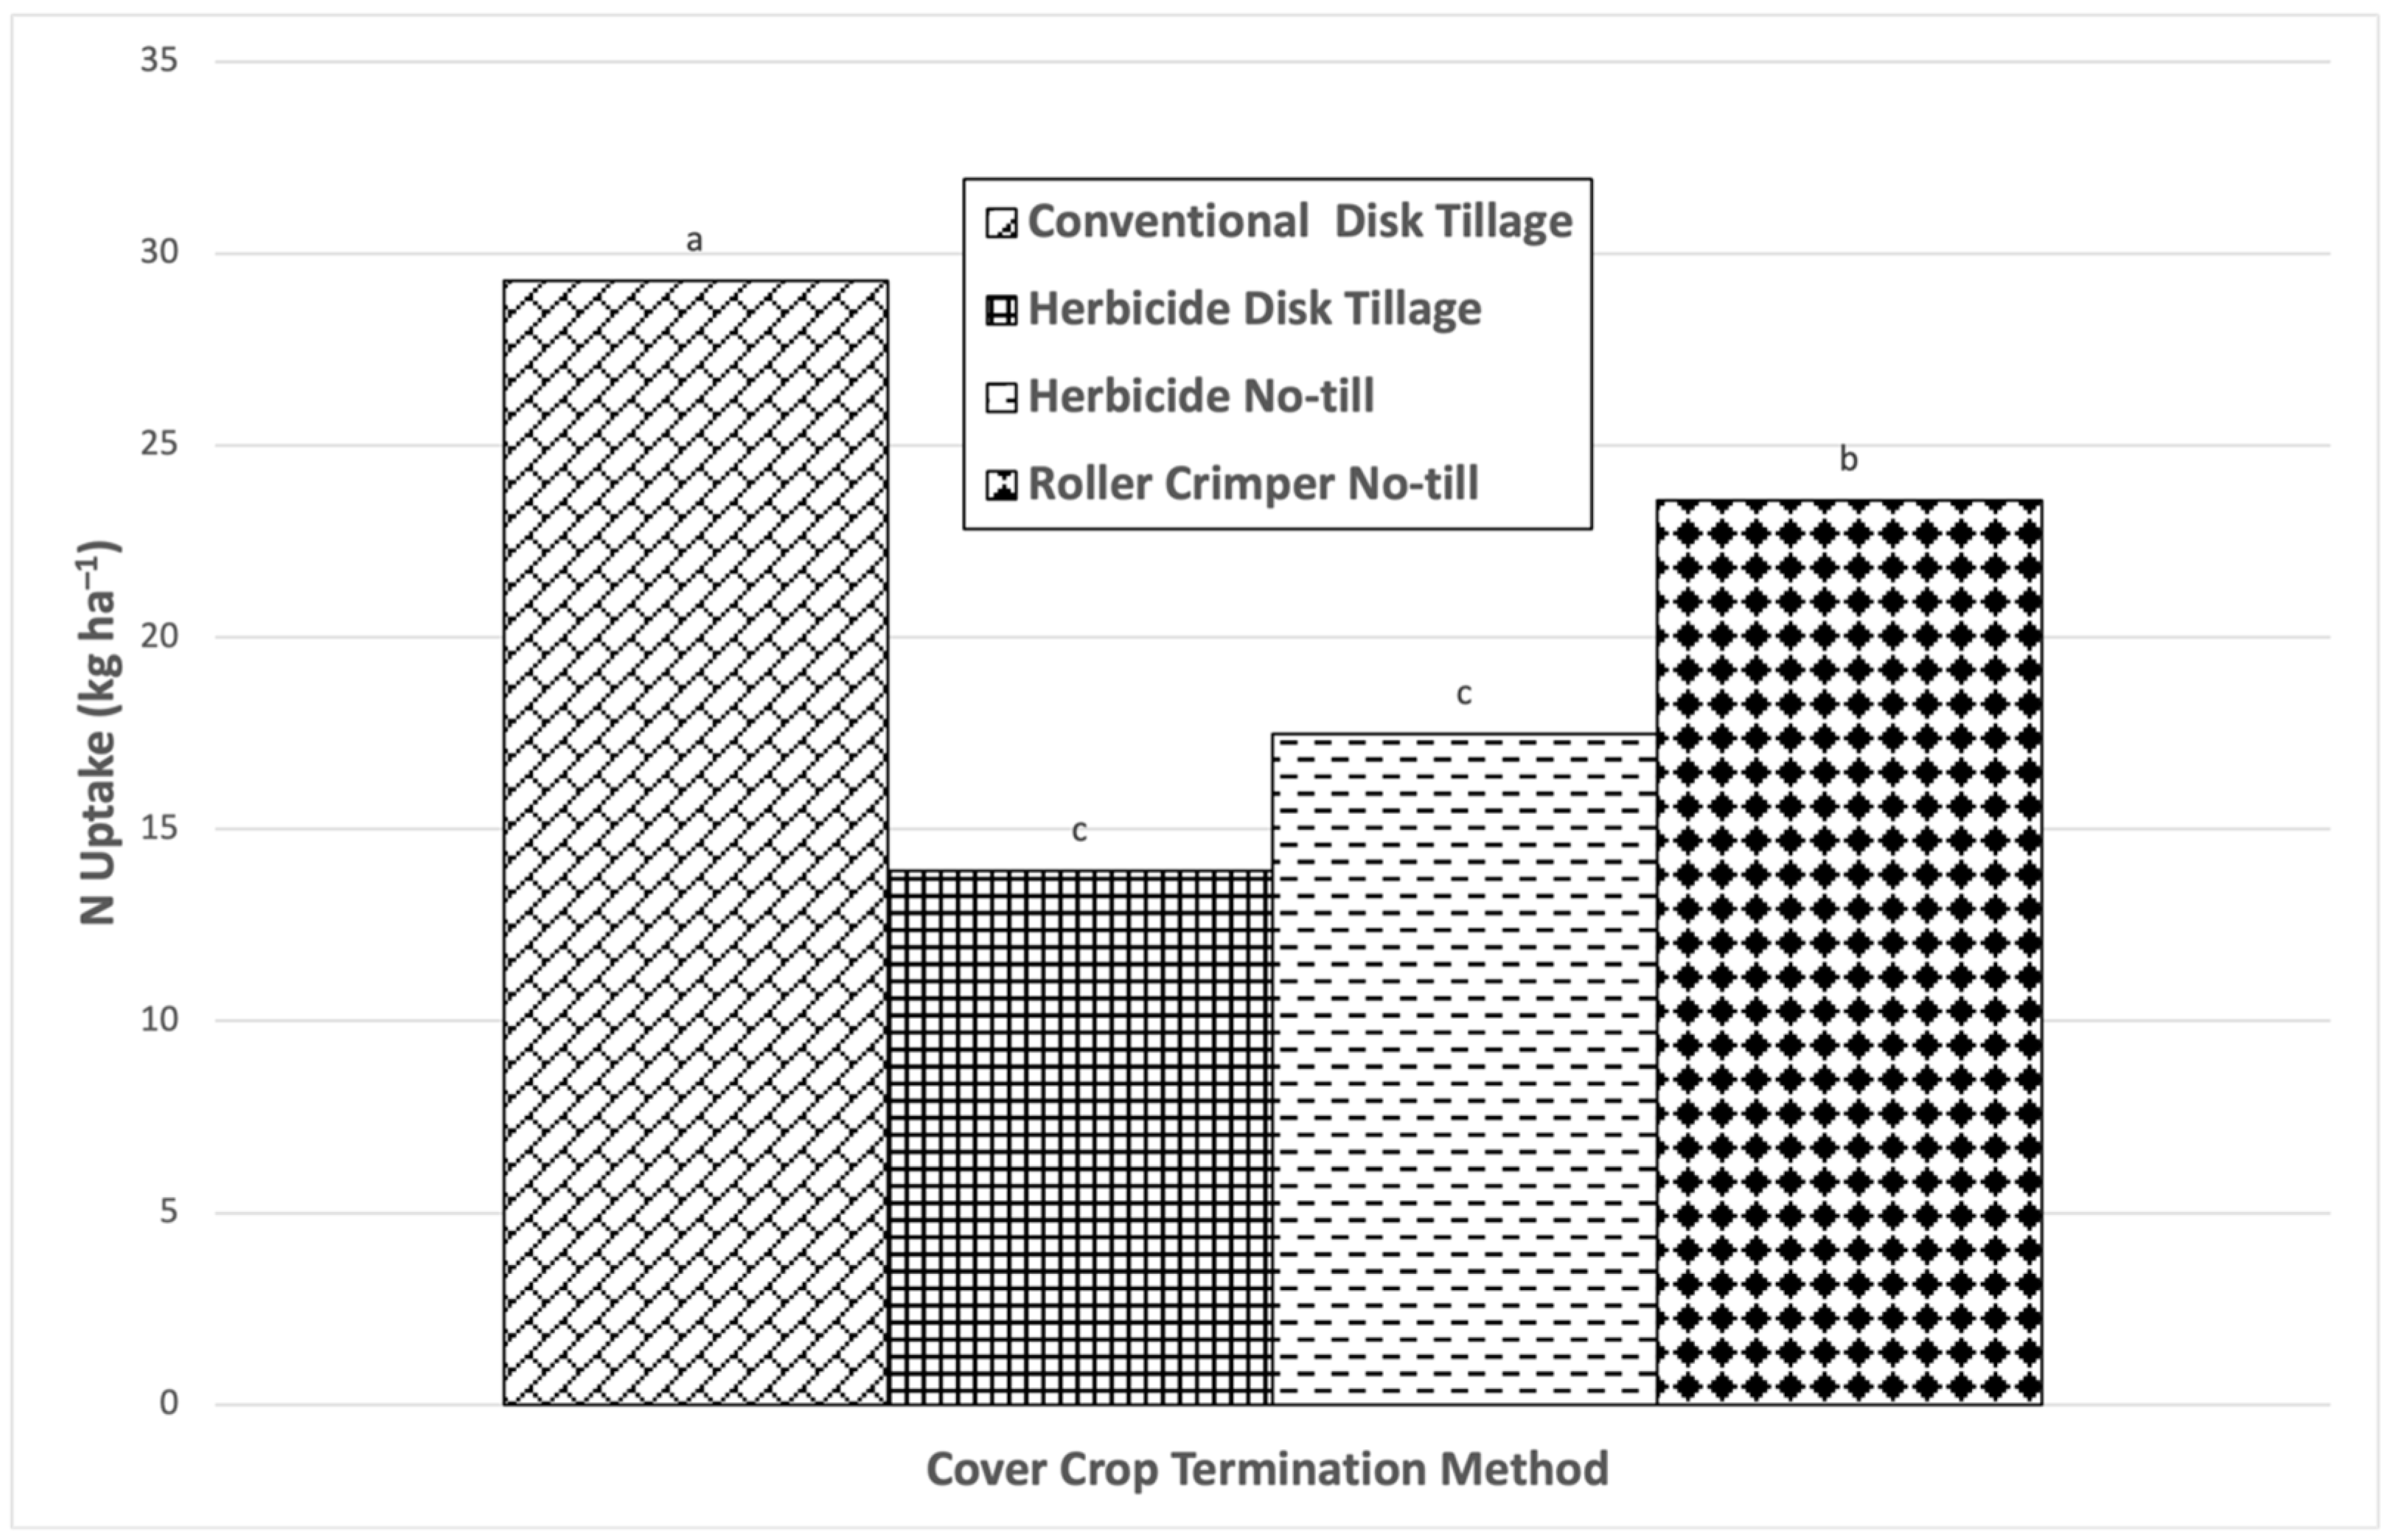
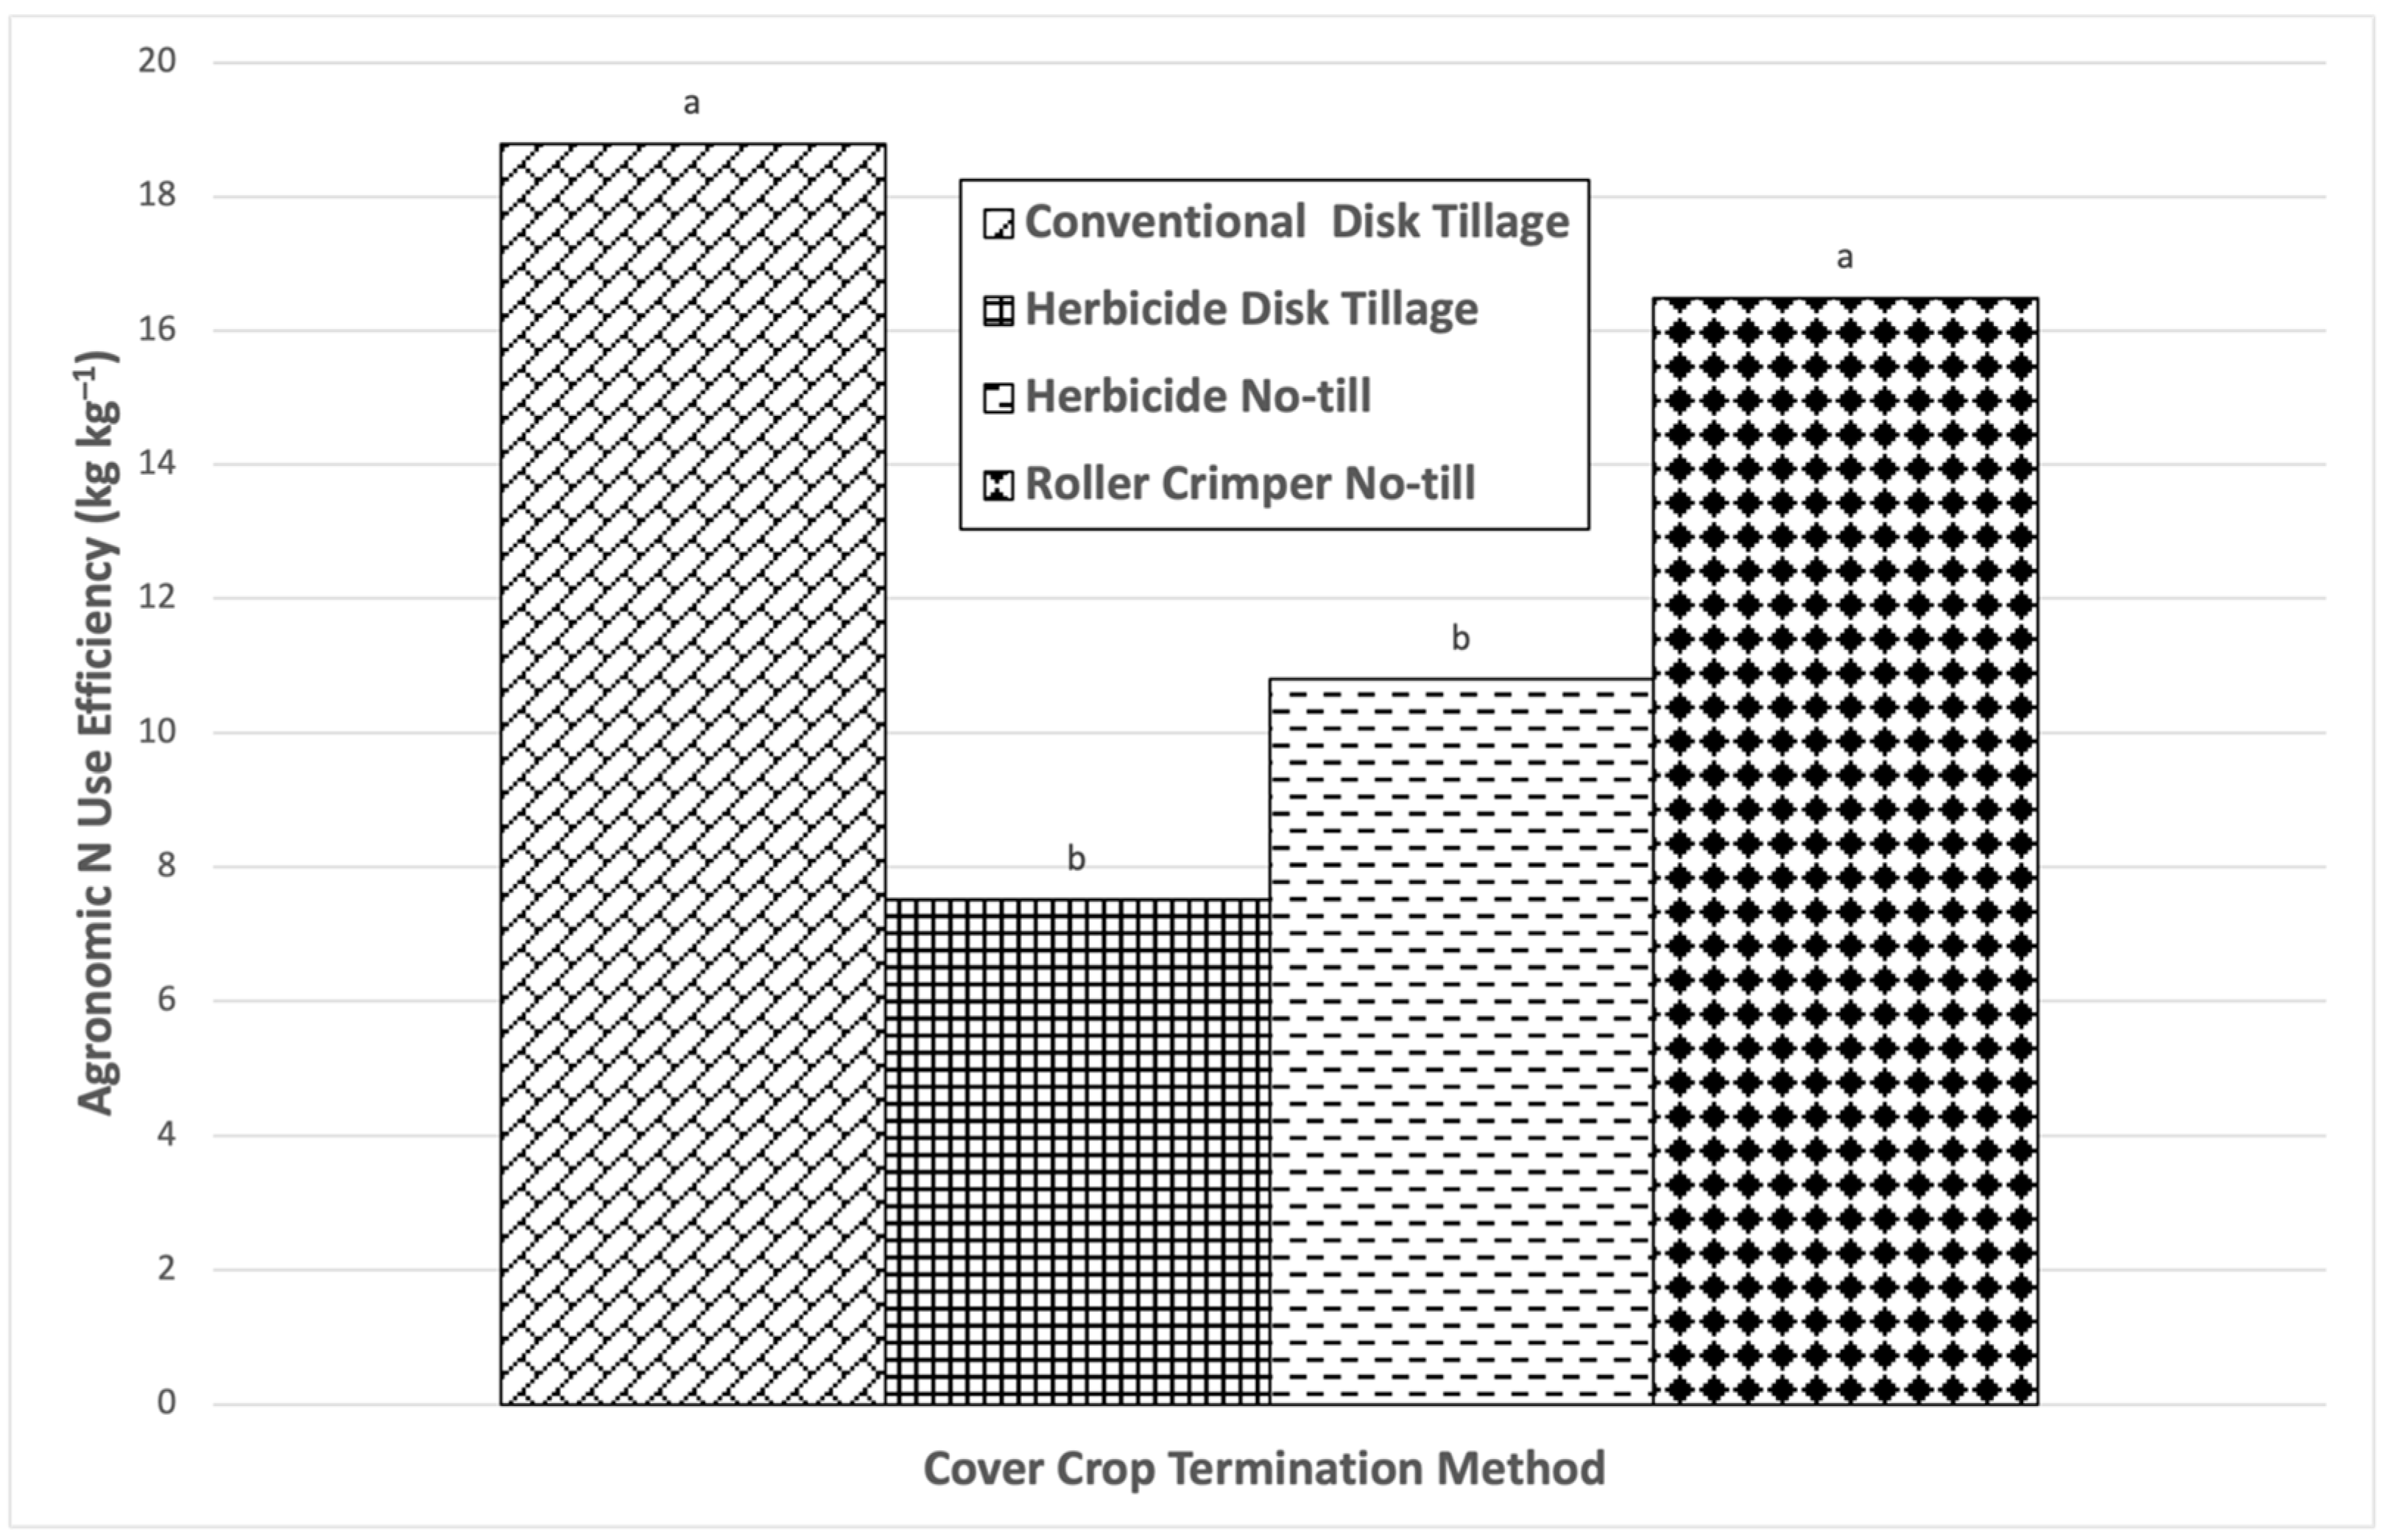
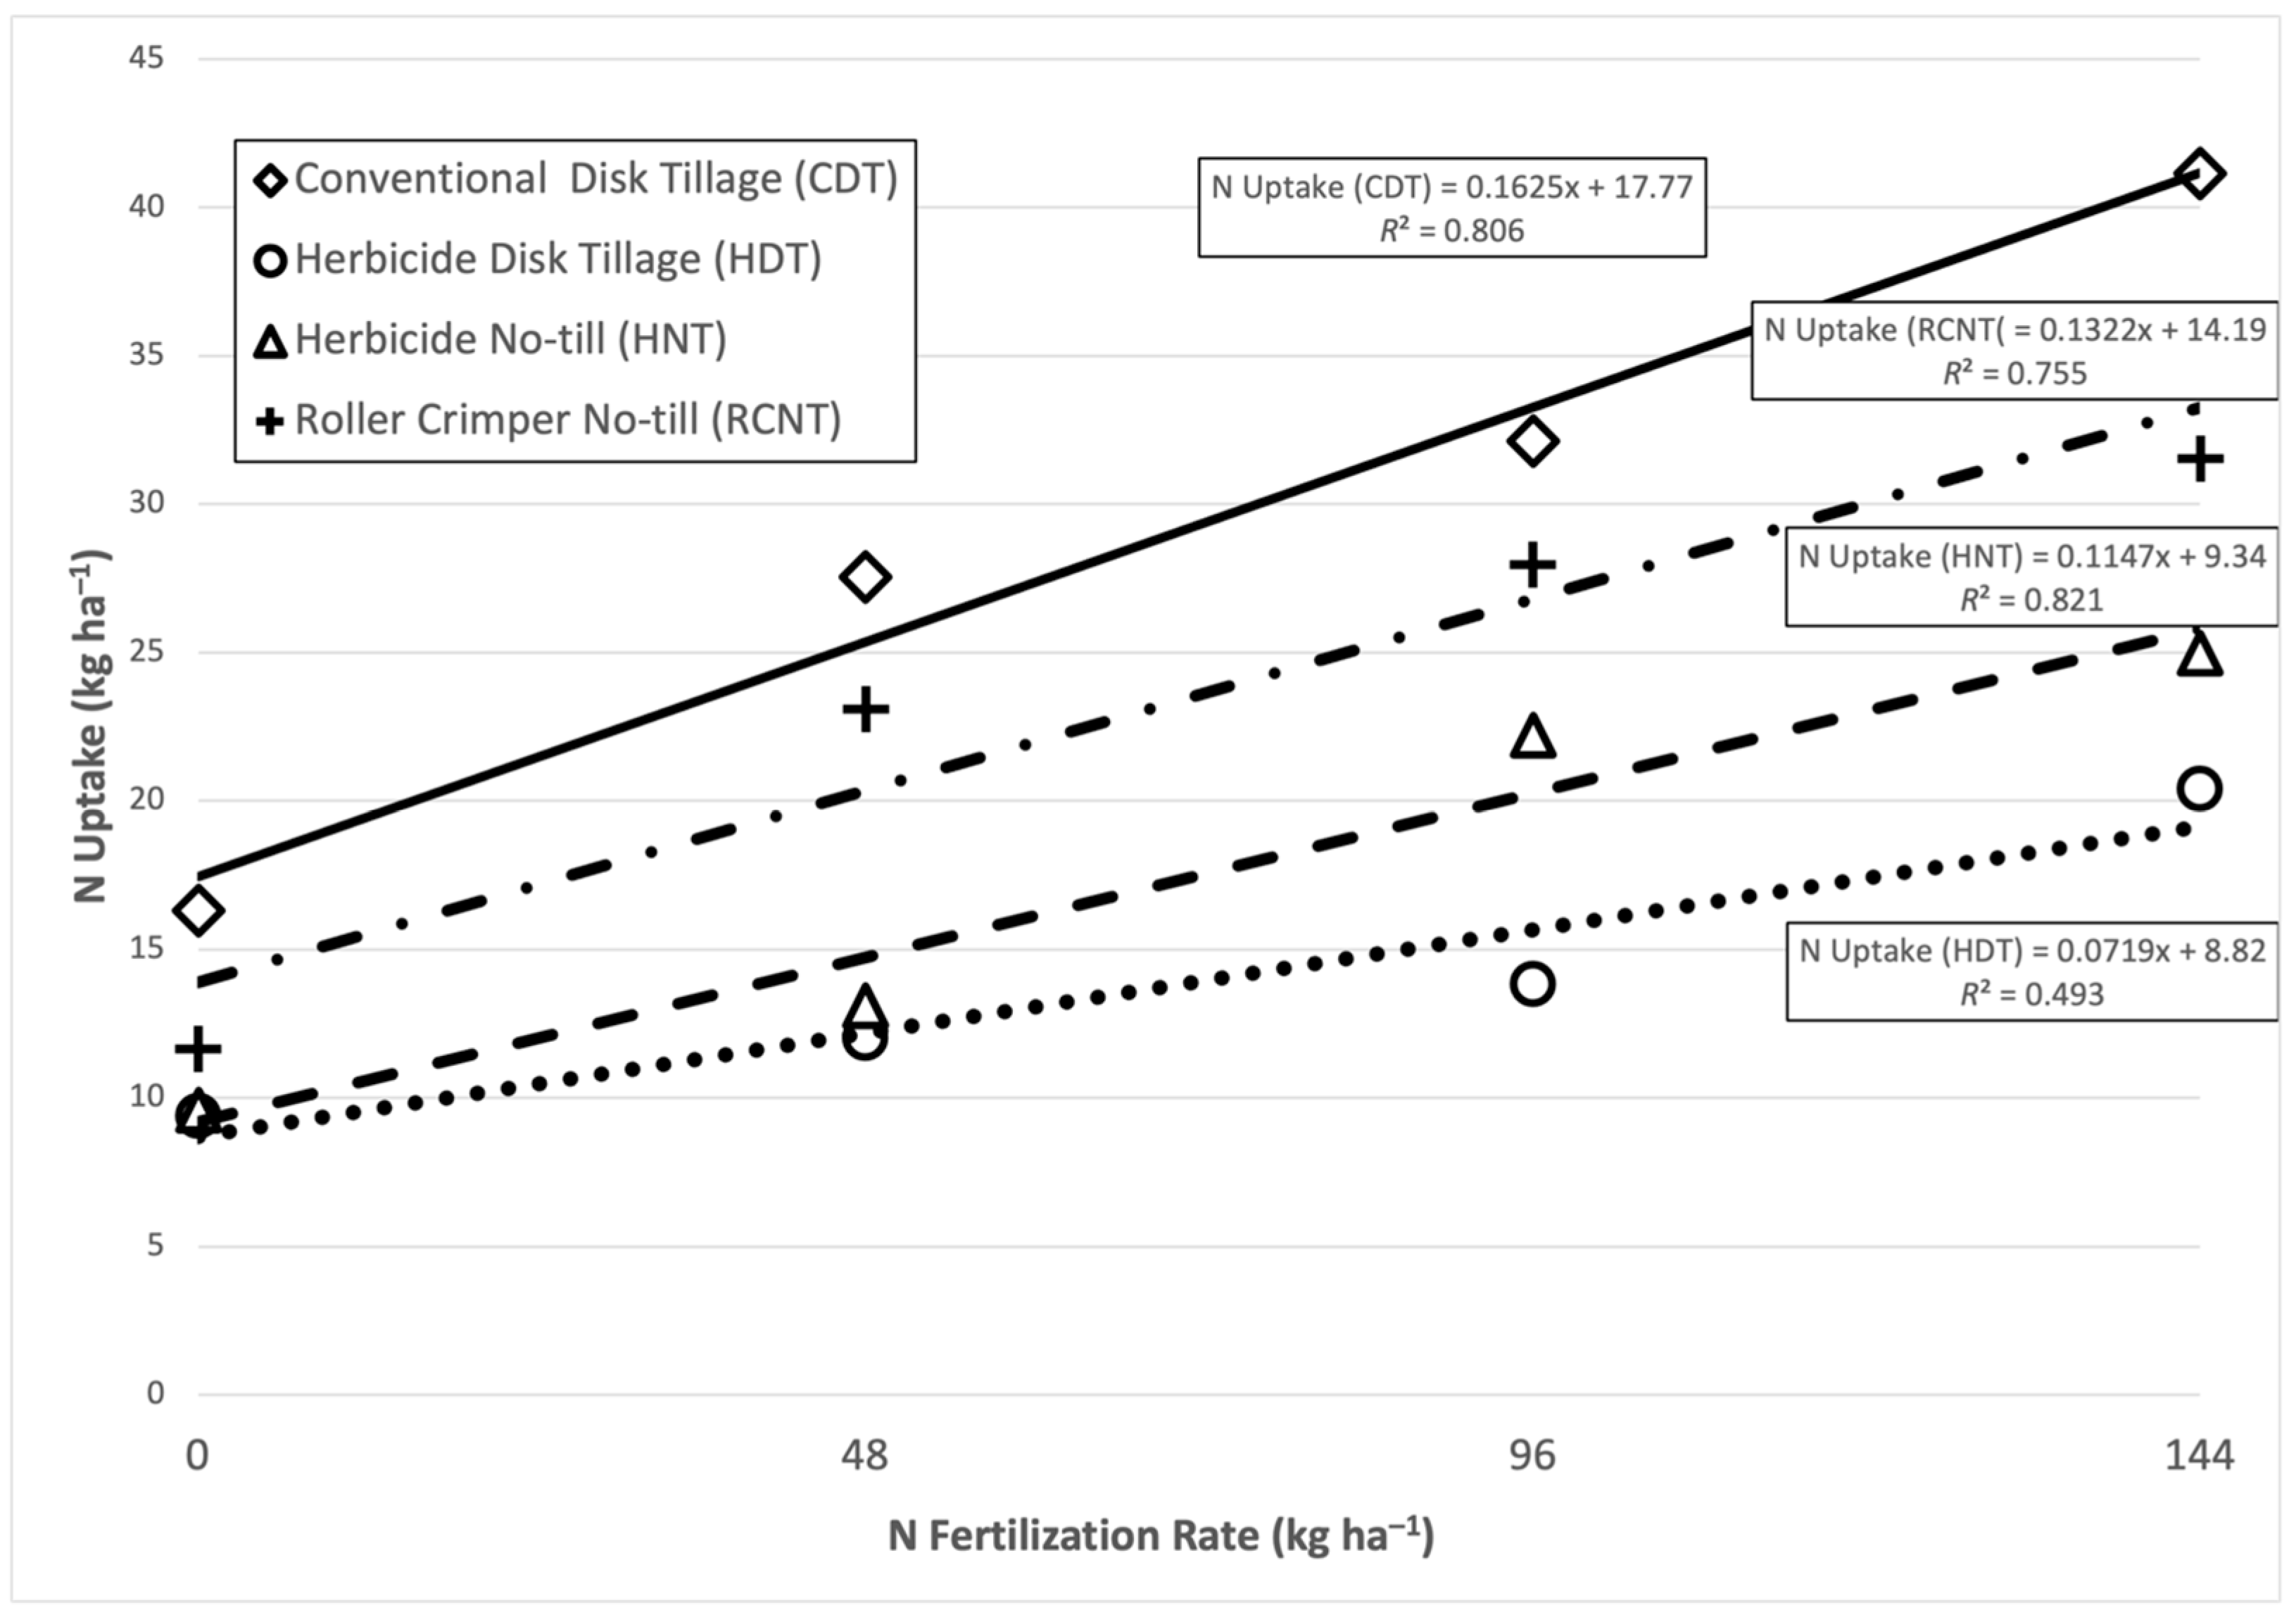
In 2021, cover crop management significantly affected the ear yield with CDT producing the most ears by count and weight (Table 2, Figure 7). Roller crimper no-till (RCNT) had the second highest yield, while HDT and HNT performed worse than either CDT or RCNT. The pattern seen in corn yield was reversed for weed growth (Table 2). Higher weed biomass was found in herbicide termination treatments (HDT and HNT) than in either CDT or RCNT (Figure 2).
N fertilization had similar effects in 2021 as in 2020. Increased N fertilization raised whole plant and ear yields (Table 2). For each kg N applied, whole plant dry biomass increased by 20 kg ha−1 while fresh ear yield increased by 80 kg ha−1, and dry ear biomass increased by 19 kg ha−1 (Figure 8). The number of ears increased by 193 ha−1 for each kg N ha−1 (Figure 4).
While some ear quality metrics were not significantly affected by cover crop management in 2021, (ear circumference and ear fill), average ear mass and length were significantly higher in CDT than in either HNT or HDT (Table 3). Conventional disk tillage termination increased average ear weight by 48% and length by 21% compared to herbicide termination treatments. Roller crimper no-till (RCNT) plots had intermediate ear mass and length (Table 3).
Higher N fertilization also improved ears in all measured quality metrics by even larger amounts than in 2020 (Table 3). For instance, ear weight was more than doubled, and the amount of unfilled ear tips fell by 46% when using the recommended N rate (Figure 5). While the effects of increasing N application on corn growth and quality were positive, each kg N fertilizer applied also increased weed growth by 10.0 kg (Table 2, Figure 9).
In both years of experiments, none of the measured sweet corn traits were influenced by the interaction of the cover crop termination method and N application rate. In other words, the significant influence of N on sweet corn yield and ear quality was independent of termination strategies.

3.4. N Uptake

In 2020, the method of cover crop termination had no significant effect on N concentration (g kg−1) or whole plant N content (kg ha−1) (Table 4). However, while N concentration was slightly increased due to increased N application rate, the whole plant N content (kg ha−1) showed considerable improvement as N application rate (Figure 10). This is mainly due to the considerable increase in total biomass when the recommended N rate was applied to the sweet corn. As a result, a dramatic improvement was observed in agronomic N efficiency (Figure 11) at 144 kg N ha−1 where each kg N resulted in production of 13.87 kg of corn dry matter. Unlike in 2020, in 2021, cover crop termination significantly affected N removal (Table 4, Figure 12). These differences were solely due to differences in yield because N concentration was not affected by cover crop termination (Table 4). CDT and RCNT also had between 50% to 150% higher agronomic N use efficiency than either HDT or HNT (Table 4, Figure 13).
Leaf N measured using SPAD showed that the differences in N uptake became more pronounced as the 2020 growing season progressed, with larger differences seen at flowering and harvest than at V5 growth stage (Table 5). That said, in 2020, the cover crop termination methods did not have consistent influence on the leaf N status of sweet corn measured by SPAD. In 2021, CDT and RCNT had higher SPAD than HDT and HNT at flowering and harvest. While not always significant, SPAD readings were higher with increased N rate in both years of the experiment (Table 5).
Higher N fertilization also improved corn N uptake and use efficiency in 2021 (Table 4). Increasing N fertilization improved agronomic N use efficiency (Figure 13), N concentration in corn biomass, and total N uptake in all cover crop treatments (Figure 14).

4. Discussion

Originally, we hypothesized that environment-friendly strategies of cover crop termination, including the no-till systems with either the use of roller crimper or mowing cover crops, might reduce the need for N by sweet corn. Our hypothesis was based on the fact that in a no-till system, better synchrony exists between the decomposition of cover crop residues and N demand by sweet corn; thus, there would be less N loss. Rye decomposes quite slowly [17,19], and while it does decompose more quickly when residues are incorporated [5,10,39], this difference is not enough to substantially contribute to the soil N level relative to added fertilizer. However, the results obtained in both years indicated that highest fresh ear yield and ear quality of sweet corn was harvested when the current recommended N rate (144 kg N ha−1) was applied, regardless of cover crop termination method. In 2020, there were small significant differences in yield or ear quality among cover crop termination treatments (Table 2 and Table 3). However, the cover crop termination treatments diverged in 2021 with CDT and RCNT performing better than HDT and HNT As a whole, these results are in line with those reported by Gao et al. [40] who found that incorporating high C residues to the soil in the spring did not adversely impact sweet corn and that 150 kg N ha−1 was sufficient to ensure high yields and ear quality. In their experiment, sweet corn did not respond positively to the higher N rates.
Measurements taken during the experiment indicated that the differences among both treatments were likely the result of differences in their N uptake and weed pressure during the growing season and not due to persistent changes in the soil environment. N is a highly mobile nutrient and over the two years of this experiment, no major differences in soil nitrate were observed between either N application rate or cover crop termination methods at either the middle or end of the sweet corn growing season (Table 4). Lacey et al. [20] found that cereal rye contained only an average of 35 kg N ha−1 at termination and that less than ten percent of this N was absorbed by the following cash crops. Thus, the slower decomposition of no-till rye treatments (HNT and RCNT) likely did not dramatically impact the soil nutrient balance during the course of this experiment. However, long term field history can also impact the decomposition rate of residues [11], and it is possible that the effects of no-till management on sweet corn yield and quality would become notable over a longer time scale.
Many treatment differences were observed in the N uptake of during the sweet corn growing season, and this was reflected by differences in corn growth. SPAD chlorophyll measures were higher with increased N at all measurements, and the best yielding termination treatments also had significantly higher SPAD chlorophyll. This was especially noticeable in 2021, where SPAD chlorophyll was higher in CDT and RCNT treatments during the reproductive growth of the sweet corn, and fresh ear yield and quality were much higher in these termination treatments than in HDT and HNT (Table 5). Although N concentration was not different between termination treatments, the higher overall biomass and ear yield in 2021 meant that total N uptake was higher in the non-herbicide termination treatments (CDT and RCNT) than in either herbicide termination (HDT and HNT) in 2021 (Table 4). Agronomic N use efficiency was also higher in CDT and RCNT in 2021 and increased with N fertilization rates, showing that the corn was better able to translate N into ears under these conditions.
Weed growth during the sweet corn season seemed to play an important role in final sweet corn harvests (Table 2). Weeds grew more with increased N fertilization in all termination treatments, but there were large termination method differences as well. Overall weed growth and weed response to N were significantly lower in CDT than in HDT or HNT in 2020, and weed growth was much lower in CDT and RCNT than in HDT or HNT in 2021 (Table 2). Weed growth was lower overall in 2020 than in 2021, and there were larger differences between termination treatments in 2021. Roller crimpers provide good weed control when cover crop termination is effective, as was the case in RCNT [23,25]. However, weed control from cover crop mulches depends on sufficient biomass and light interception [41,42]. When cover crops are left as a mowed mulch (as in HNT), the biomass coverage is less even than when a roller crimper is used (as in RCNT), and this likely led to more spaces for weed growth. Weeds were effectively controlled in CDT using mechanical cultivation, while early season herbicides, with or without a mowed cover crop mulch (HNT and HDT, respectively), were not sufficient to suppress weeds through the sweet corn growing season (Table 2).
Some of the differences between 2020 and 2021 may also be related to weather conditions (Table 1). No-till cover crop mulches, such as those in HNT and RCNT treatments, can improve soil water retention [16]. In 2020, the growing season was relatively dry. It is possible that these weather conditions both reduced weed growth relative to 2021 (Table 2), and better soil moisture in HNT could have improved the no-till treatment’s yield compared to CDT and HDT. In 2021, the conditions were considerably wetter, and no differences were seen between no-till treatments (HNT and RCNT) and tilled treatments (CDT and HDT). The differences seen between years in this study suggest that more work is needed to develop resilient systems which can be productive under the wide range of weather conditions found in New England.
These results show two things, (1) increased N fertilization up to 144 kg N ha−1 promoted growth in both sweet corn and summer weeds and (2) roller crimped cover crops (RCNT) and mechanical cultivation (CDT) were much more effective weed control methods than their corresponding herbicide-based treatments, either using no-till (HNT) or residue incorporation (HDT). Together these observations suggest that higher weed growth in HDT and HNT treatments may reduce N availability to sweet corn in these treatments and thus reduce yield and quality of sweet corn ears.

5. Conclusions

Both the quality and yield of sweet corn are paramount to marketability, and it is essential that farmers achieve the best possible quality. Simultaneously, late cover crop termination and no-till residue management can provide substantial environmental benefits. The results of this research suggest that both sufficient N fertilizer and proper agronomic management are essential to meeting these goals. In this experiment, cover crop residue incorporation did not appear to be an important contributor to soil N availability with few differences seen between CDT and RCNT or between HDT and HNT treatments. Instead, while cover crop termination did affect N uptake by sweet corn plants leading to differences in yield and quality at harvest, these differences were mainly between cover crop termination which relied on herbicides for weed control (HDT and HNT) and those which used other weed control methods (CDT and RCNT). This suggests that when cover crops are grown late into the spring before planting cash crops, the incorporation of the residues may not greatly affect the soil N dynamics. While the C:N ratio of cover crops can certainly affect soil N availability, the incorporation of the residues was not be a primary factor in the soil system in this trial. This indicates that decisions to incorporate residues may be taken by farmers with an eye mainly towards management issues such as weed control and environmental impacts.

Author Contributions

Conceptualization, A.S. and M.H.; formal analysis, A.S.; investigation, S.S., A.S. and S.G.-C.; methodology, A.S. and S.G.-C.; writing—original draft preparation, S.S. and A.S.; writing—review and editing, A.S. and M.H.; supervision, M.H. All authors have read and agreed to the published version of the manuscript.

Funding

This research received no external funding.

Institutional Review Board Statement

Not applicable.

Informed Consent Statement

Not applicable.

Data Availability Statement

The data presented in this study are openly available from UMass.

Acknowledgments

The authors would like to thank Ajay Giri, Neal Woodard, Jim Cronk, Raina Naylor, and James Siakakaba for support during field research.

Conflicts of Interest

The authors declare no conflict of interest. The funders had no role in the design of the study; in the collection, analyses, or interpretation of data; in the writing of the manuscript; or in the decision to publish the results.

References

  1. Abdalla, M.; Hastings, A.; Cheng, K.; Yue, Q.; Chadwick, D.; Espenberg, M.; Truu, J.; Rees, R.M.; Smith, P. A critical review of the impacts of cover crops on nitrogen leaching, net greenhouse gas balance and crop productivity. Glob. Chang. Biol. 2019, 25, 2530–2543. [Google Scholar] [CrossRef] [PubMed] [Green Version]
  2. Martínez-Mena, M.; Carrillo-López, E.; Boix-Fayos, C.; Almagro, M.; Franco, N.G.; Díaz-Pereira, E.; Montoya, I.; de Vente, J. Long-term effectiveness of sustainable land management practices to control runoff, soil erosion, and nutrient loss and the role of rainfall intensity in Mediterranean rainfed agroecosystems. CATENA 2020, 187, 104352. [Google Scholar] [CrossRef]
  3. Griffiths, M.; Delory, B.M.; Jawahir, V.; Wong, K.M.; Bagnall, G.C.; Dowd, T.G.; Nusinow, D.A.; Miller, A.J.; Topp, C.N. Optimisation of root traits to provide enhanced ecosystem services in agricultural systems: A focus on cover crops. Plant Cell Environ. 2021, 45, 751–770. [Google Scholar] [CrossRef] [PubMed]
  4. Etemadi, F.; Hashemi, M.; Zandvakili, O.; Dolatabadian, A.; Sadeghpour, A. Nitrogen Contribution from Winter-Killed Faba Bean Cover Crop to Spring-Sown Sweet Corn in Conventional and No-Till Systems. Agron. J. 2018, 110, 455–462. [Google Scholar] [CrossRef]
  5. Lacey, C.; Nevins, C.; Camberato, J.; Kladivko, E.; Sadeghpour, A.; Armstrong, S. Carbon and nitrogen release from cover crop residues and implications for cropping systems management. J. Soil Water Conserv. 2020, 75, 505–514. [Google Scholar] [CrossRef]
  6. Pittman, K.B.; Barney, J.N.; Flessner, M.L. Cover crop residue components and their effect on summer annual weed suppression in corn and soybean. Weed Sci. 2020, 68, 301–310. [Google Scholar] [CrossRef]
  7. Baraibar, B.; Hunter, M.C.; Schipanski, M.E.; Hamilton, A.; Mortensen, D.A. Weed Suppression in Cover Crop Monocultures and Mixtures. Weed Sci. 2017, 66, 121–133. [Google Scholar] [CrossRef]
  8. Thapa, R.; Tully, K.L.; Reberg-Horton, C.; Cabrera, M.; Davis, B.W.; Fleisher, D.; Gaskin, J.; Hitchcock, R.; Poncet, A.; Schomberg, H.H.; et al. Cover crop residue decomposition in no-till cropping systems: Insights from multi-state on-farm litter bag studies. Agric. Ecosyst. Environ. 2022, 326, 107823. [Google Scholar] [CrossRef]
  9. Nevins, C.J.; Lacey, C.; Armstrong, S. The synchrony of cover crop decomposition, enzyme activity, and nitrogen availability in a corn agroecosystem in the Midwest United States. Soil Tillage Res. 2019, 197, 104518. [Google Scholar] [CrossRef]
  10. Jahanzad, E.; Barker, A.V.; Hashemi, M.; Eaton, T.; Sadeghpour, A.; Weis, S.A. Nitrogen Release Dynamics and Decomposition of Buried and Surface Cover Crop Residues. Agron. J. 2016, 108, 1735–1741. [Google Scholar] [CrossRef]
  11. Barel, J.M.; Kuyper, T.W.; de Boer, W.; Douma, J.C.; De Deyn, G.B. Legacy effects of diversity in space and time driven by winter cover crop biomass and nitrogen concentration. J. Appl. Ecol. 2017, 55, 299–310. [Google Scholar] [CrossRef] [Green Version]
  12. Günal, H.; Korucu, T.; Birkas, M.; Özgöz, E.; Halbac-Cotoara-Zamfir, R. Threats to Sustainability of Soil Functions in Central and Southeast Europe. Sustainability 2015, 7, 2161–2188. [Google Scholar] [CrossRef] [Green Version]
  13. Tully, K.L.; McAskill, C. Promoting soil health in organically managed systems: A review. Org. Agric. 2020, 10, 339–358. [Google Scholar] [CrossRef]
  14. Adetunji, A.T.; Ncube, B.; Mulidzi, R.; Lewu, F.B. Management impact and benefit of cover crops on soil quality: A review. Soil Tillage Res. 2020, 204, 104717. [Google Scholar] [CrossRef]
  15. Inagaki, T.M.; Sá, J.C.D.M.; Tormena, C.A.; Dranski, A.; Muchalak, A.; Briedis, C.; Ferreira, A.D.O.; Giarola, N.F.; da Silva, P. Mechanical and biological chiseling impacts on soil organic C stocks, root growth, and crop yield in a long-term no-till system. Soil Tillage Res. 2021, 211, 104993. [Google Scholar] [CrossRef]
  16. Nunes, M.R.; van Es, H.M.; Schindelbeck, R.; Ristow, A.J.; Ryan, M. No-till and cropping system diversification improve soil health and crop yield. Geoderma 2018, 328, 30–43. [Google Scholar] [CrossRef]
  17. Poffenbarger, H.J.; Mirsky, S.B.; Weil, R.R.; Maul, J.E.; Kramer, M.; Spargo, J.T.; Cavigelli, M.A. Biomass and Nitrogen Content of Hairy Vetch–Cereal Rye Cover Crop Mixtures as Influenced by Species Proportions. Agron. J. 2015, 107, 2069–2082. [Google Scholar] [CrossRef] [Green Version]
  18. Lawson, A.; Cogger, C.; Bary, A.; Fortuna, A.-M. Influence of Seeding Ratio, Planting Date, and Termination Date on Rye-Hairy Vetch Cover Crop Mixture Performance under Organic Management. PLoS ONE 2015, 10, e0129597. [Google Scholar] [CrossRef] [PubMed]
  19. Sievers, T.; Cook, R.L. Aboveground and Root Decomposition of Cereal Rye and Hairy Vetch Cover Crops. Soil Sci. Soc. Am. J. 2018, 82, 147–155. [Google Scholar] [CrossRef]
  20. Lacey, C.; Camberato, J.; Armstrong, S. Field based 15 N study: An investigation of cereal rye N fate and utilization by the subsequent corn and soybean. Nutr. Cycl. Agroecosystems 2022, 1–13. [Google Scholar] [CrossRef]
  21. Rumburg, C.B.; Sneva, F.A. Accumulation and Loss of Nitrogen during Growth and Maturation of Cereal Rye (Secale cereale) 1. Agron. J. 1970, 62, 311–313. [Google Scholar] [CrossRef]
  22. Teasdale, J.R.; Mirsky, S.B. Tillage and Planting Date Effects on Weed Dormancy, Emergence, and Early Growth in Organic Corn. Weed Sci. 2015, 63, 477–490. [Google Scholar] [CrossRef]
  23. Alonso-Ayuso, M.; Gabriel, J.L.; Hontoria, C.; Ibáñez, M.; Quemada, M. The cover crop termination choice to designing sustainable cropping systems. Eur. J. Agron. 2020, 114, 126000. [Google Scholar] [CrossRef]
  24. DePalo, L.; Burgio, G.; Magagnoli, S.; Sommaggio, D.; Montemurro, F.; Canali, S.; Masetti, A. Influence of Cover Crop Termination on Ground Dwelling Arthropods in Organic Vegetable Systems. Insects 2020, 11, 445. [Google Scholar] [CrossRef]
  25. Navarro-Miró, D.; Blanco-Moreno, J.M.; Ciaccia, C.; Chamorro, L.; Testani, E.; Kristensen, H.L.; Hefner, M.; Tamm, K.; Bender, I.; Jakop, M.; et al. Agroecological service crops managed with roller crimper reduce weed density and weed species richness in organic vegetable systems across Europe. Agron. Sustain. Dev. 2019, 39, 55. [Google Scholar] [CrossRef]
  26. Liebman, A.M.; Grossman, J.; Brown, M.; Wells, M.S.; Reberg-Horton, S.C.; Shi, W. Legume Cover Crops and Tillage Impact Nitrogen Dynamics in Organic Corn Production. Agron. J. 2018, 110, 1046–1057. [Google Scholar] [CrossRef]
  27. USDA NASS (National Agricultural Statistics Service). New England Vegetable Report. Available online: https://www.nass.usda.gov/Statistics_by_State/New_England_includes/Publications/Current_News_Release/2022/Feb2022-New-England-Vegetable-Report.pdf (accessed on 29 December 2022).
  28. Revilla, P.; Anibas, C.; Tracy, W. Sweet Corn Research around the World 2015–2020. Agronomy 2021, 11, 534. [Google Scholar] [CrossRef]
  29. Soil Survey Staff. Natural Resources Conservation Service, United States Department of Agriculture. Web Soil Survey. Available online: https://websoilsurvey.nrcs.usda.gov/ (accessed on 12 April 2016).
  30. Campbell-Nelson, K. (Ed.) 2020–2021 New England Vegetable Management Guide; University of Massachusetts Extension Vegetable Program: Amherst, MA, USA, 2020. [Google Scholar]
  31. Peikielek, W.P.; Fox, R.H.; Toth, J.D.; Macneal, K.E. Use of a chlorophyll meter at the early dent stage of corn to evaluate nitrogen sufficiency. Agron. J. 1995, 87, 403–408. [Google Scholar] [CrossRef]
  32. Konica Minolta. SPAD-502 Chlorophyll Meter Instruction Manual; Konica Minolta Sensing. Inc.: Osaka, Japan, 2003. [Google Scholar]
  33. Heckman, J.; Hlubik, W.; Prostak, D.; Paterson, J. Pre-sidedress Soil Nitrate Test for Sweet Corn. Hortscience 1995, 30, 1033–1036. [Google Scholar] [CrossRef] [Green Version]
  34. Sechtig, A. QuickChem Method 12-107-04-1-A. Determination of Nitrate/Nitrite by Flow Injection Analysis; Lachat Instruments: Milwaukee, WI, USA, 2001. [Google Scholar]
  35. Bates, D.; Mächler, M.; Bolker, B.; Walker, S. Fitting Linear Mixed-Effects Models Using lme4. J. Stat. Softw. 2015, 67, 48. [Google Scholar] [CrossRef]
  36. Lenth, R. Emmeans: Estimated Marginal Means, aka Least-Squares Means. R Package Version 1.7.5. 2022. Available online: https://CRAN.R-project.org/package=emmeans (accessed on 29 December 2022).
  37. Barton, K. MuMIn: Multi-Model Inference. R Package Version 1.9.13. 2013. Available online: http://CRAN.R-project.org/package=MuMIn (accessed on 20 January 2023).
  38. R Core Team. R: A Language and Environment for Statistical Computing; R Foundation for Statistical Computing: Vienna, Austria, 2019; Available online: https://www.R-project.org/ (accessed on 20 January 2023).
  39. Jani, A.D.; Grossman, J.; Smyth, T.J.; Hu, S. Winter legume cover-crop root decomposition and N release dynamics under disking and roller-crimping termination approaches. Renew. Agric. Food Syst. 2015, 31, 214–229. [Google Scholar] [CrossRef]
  40. Gao, L.; Li, W.; Ashraf, U.; Lu, W.; Li, Y.; Li, C.; Li, G.; Li, G.; Hu, J. Nitrogen Fertilizer Management and Maize Straw Return Modulate Yield and Nitrogen Balance in Sweet Corn. Agronomy 2020, 10, 362. [Google Scholar] [CrossRef] [Green Version]
  41. Ciaccia, C.; Montemurro, F.; Campanelli, G.; Diacono, M.; Fiore, A.; Canali, S. Legume cover crop management and organic amendments application: Effects on organic zucchini performance and weed competition. Sci. Hortic. 2015, 185, 48–58. [Google Scholar] [CrossRef]
  42. Reberg-Horton, S.C.; Grossman, J.M.; Kornecki, T.S.; Meijer, A.D.; Price, A.J.; Place, G.T.; Webster, T.M. Utilizing cover crop mulches to reduce tillage in organic systems in the southeastern USA. Renew. Agric. Food Syst. 2011, 27, 41–48. [Google Scholar] [CrossRef] [Green Version]
Figure 1. Mean dry sweet corn biomass and ear yield as a function of cover crop termination method in 2020. For each response variable, columns marked with the same letter are not significantly different from each other according to Tukey’s HSD adjusted t tests at p ≤ 0.05.
Nitrogen 04 00005 g001
Figure 2. Mean weed biomass as a function of cover crop termination method in 2020 and 2021. For each year, columns marked with the same letter are not significantly different from each other according to Tukey’s HSD adjusted t tests at p ≤ 0.05.
Nitrogen 04 00005 g002
Figure 3. Mean dry sweet corn biomass and ear yield by weight as a function of N fertilization rate in 2020. Goodness of fit described with conditional R2.
Nitrogen 04 00005 g003
Figure 4. Mean sweet corn yield by number of ears as a function of N fertilization rate in 2020 and 2021. Goodness of fit described with conditional R2.
Nitrogen 04 00005 g004
Figure 5. Mean sweet corn percent grain tip fill as a function of N fertilization rate in 2020 and 2021. Goodness of fit described with conditional R2.
Nitrogen 04 00005 g005
Figure 6. Interactive effect of N fertilization rate following different cover crop termination methods on weed biomass in 2020. Goodness of fit described with conditional R2.
Nitrogen 04 00005 g006
Figure 7. Mean dry sweet corn biomass and ear yield as a function of cover crop termination method in 2021. For each response variable, columns marked with the same letter are not significantly different from each other according to Tukey’s HSD adjusted t tests at p ≤ 0.05.
Nitrogen 04 00005 g007
Figure 8. Mean dry sweet corn biomass and ear yield by weight as a function of N fertilization rate in 2021. Goodness of fit described with conditional R2.
Nitrogen 04 00005 g008
Figure 9. Mean weed biomass as a function of N fertilization rate in 2021. Goodness of fit described with conditional R2.
Nitrogen 04 00005 g009
Figure 10. Mean N uptake in sweet corn as a function of N fertilization rate in 2020. Goodness of fit described with conditional R2.
Nitrogen 04 00005 g010
Figure 11. Mean agronomic N use efficiency in sweet corn as a function of N fertilization rate in 2020 and 2021. Goodness of fit described with conditional R2.
Nitrogen 04 00005 g011
Figure 12. Mean N uptake in sweetcorn as a function of cover crop termination method in 2021. Columns marked with the same letter are not significantly different from each other according to Tukey’s HSD adjusted t tests at p ≤ 0.05.
Nitrogen 04 00005 g012
Figure 13. Mean agronomic N use efficiency in sweetcorn as a function of cover crop termination method in 2021. Columns marked with the same letter are not significantly different from each other according to Tukey’s HSD adjusted t tests at p ≤ 0.05.
Nitrogen 04 00005 g013
Figure 14. Interactive effect of N fertilization rate following different cover crop termination methods on N uptake in sweet corn in 2021. Goodness of fit described with conditional R2.
Nitrogen 04 00005 g014
Table 1. Weather Data for the University of Massachusetts Agricultural Research Farm, South Deerfield, MA.
YearMonthAvg Temp (°C)Departure from avg.*Max Temp (°C)Departure from avg. Min Temp (°C)Departure from avg. Total Precipitation (cm)Departure from avg.
2019September16.5−0.931.3−0.13.50.74.2−7.1
October11.30.725.3−0.9−0.43.513.60.6
November2.2−2.321.00.2−9.50.06.7−1.4
December−1.5−0.610.6−4.4−15.70.112.11.4
2020January−0.63.720.67.8−16.24.85.8−1.7
February−0.42.816.01.9−15.33.98.50.5
March4.93.422.64.1−9.44.79.51.3
April7.2−1.118.8−8.9−3.71.312.42.6
May14.50.129.4−1.7−0.70.05.6−3.7
June20.91.733.30.43.5−1.74.4−7.9
July23.91.534.50.214.94.66.9−3.5
August22.10.634.81.89.10.89.1−1.1
September17.40.028.7−2.71.7−1.07.6−3.8
October11.00.425.3−0.9−4.00.012.7−0.3
November6.31.824.83.9−6.82.712.64.6
December0.71.616.81.7−16.9−1.08.2−2.5
2021January−2.32.06.7−6.1−18.62.45.1−2.4
February−2.50.711.8−2.4−15.14.14.8−3.3
March4.02.423.95.4−11.52.65.1−3.2
April9.61.425.5−2.2−4.50.513.03.2
May14.70.333.52.43.03.711.82.5
June21.62.435.93.07.72.65.5−6.7
July20.9−1.532.0−2.39.5−0.827.517.0
August22.81.434.21.211.63.310.30.1
* Weather averages are based on the years 2001–2020 in Amherst MA, 11 km from the research site.
Table 2. Mean sweet corn yield and weed biomass following different cover crop terminations and N fertilizer rates in South Deerfield, MA.
Cover Crop Termination MethodN Rate (kg ha−1)Total Dry Sweet Corn Biomass (t ha−1)Fresh Ear Yield (t ha−1) Dry Ear Yield (t ha−1) Number of Ears (1000s ha−1) Weed Biomass (t ha−1)
2020 20212020 2021 2020 2021 2020 2021 2020 2021
Conventional04.48 3.4410.21 7.33 2.21 1.62 61.35 52.74 0.25 1.72
Disk Tillage485.10 6.239.84 14.76 2.45 3.67 49.51 68.89 0.21 1.85
965.57 7.0711.35 18.63 2.70 4.46 52.74 73.19 0.34 2.30
1446.63 7.5415.16 20.05 3.66 4.84 72.12 68.89 0.45 2.70
Glyphosate +04.03 2.857.33 2.81 0.86 0.32 40.90 32.29 0.22 3.63
Disk Tillage484.78 3.438.34 3.43 1.64 0.68 48.44 30.14 0.43 3.81
965.75 3.559.96 5.62 2.25 1.28 58.13 36.60 0.48 5.20
1446.21 4.7114.53 10.98 3.00 2.25 75.35 62.43 0.80 5.69
Glyphosate +05.17 2.597.80 2.09 1.39 0.37 45.21 26.91 0.43 3.23
No-till486.39 3.5710.44 2.79 1.93 0.59 61.35 23.68 0.40 4.36
966.53 5.2115.48 10.34 3.62 2.44 75.35 53.82 0.88 4.40
1447.35 5.3517.61 12.65 3.79 2.75 80.73 59.20 1.16 4.56
Roller Crimper0 3.04 4.05 0.79 38.75 2.51
No-till48 5.21 9.44 2.17 50.59 2.30
96 5.97 14.41 3.17 63.51 3.70
144 6.28 17.48 4.18 65.66 3.45
Termination Method
Conventional Disk Tillage5.44b6.0711.64 15.19a2.75a3.65a58.93 65.93a0.31b2.14b
Glyphosate + Disk Tillage5.19b3.6410.04 5.71c1.94b1.13c55.70 40.36c0.48b4.58a
Glyphosate + No-till6.36a4.1812.83 6.97c2.68a1.54c65.66 40.90c0.72a4.14a
Roller Crimper No-till 5.12 11.35b 2.58b 54.63a 2.99b
N Rate
0 4.56 2.988.45 4.07 1.49 0.78 49.16 37.67 0.30 2.77
48 5.42 4.619.54 7.61 2.00 1.78 53.10 43.32 0.35 3.08
96 5.95 5.4512.27 12.25 2.86 2.84 62.07 56.78 0.57 3.90
144 6.73 5.9715.77 15.29 3.48 3.50 76.06 64.05 0.80 4.10
Trend L *** L ***L *** L *** L *** L *** L *** L *** L *** L *
Effect Significance
Termination Method* nsns *** * *** ns *** *** *
N Rate *** ****** *** *** *** *** *** *** ***
Termination x N Ratens nsns ns ns ns ns ns * ns
Note: *, p ≤ 0.05; ***, p ≤ 0.001; ns, non-significant; L, linear regression trend component. N rate trend significance assessed using orthagonal polynomial comparisons. No higher order polynomial regressions were significant. Pairwise comparisons of termination means made using Tukey’s HSD adjusted t tests. Significant interactions between termination method and N rate were investigated as the effect of N rate within each termination method.
Table 3. Mean sweet corn ear quality following different cover crop terminations and N fertilizer rates in South Deerfield, MA.
Cover Crop Termination MethodN Rate (kg ha−1)Average Ear Fresh Weight (g) Average Ear Length (cm) Average Ear Circumference (cm)Average Percent Grain Fill (%)
2020 2021 2020 2021 2020 20212020 2021
Conventional0166.5 139.0 12.50 13.96 12.13 13.1565.32 63.54
Disk Tillage48198.8 214.3 12.65 15.45 11.95 14.5672.76 77.22
96215.2 254.5 12.96 16.04 11.95 15.4578.47 84.93
144210.2 291.1 14.08 16.54 13.08 16.0979.05 92.50
Glyphosate +0179.3 87.0 11.08 10.95 10.84 11.3659.79 47.22
Disk Tillage48172.2 113.9 12.01 12.41 11.35 12.5566.60 61.32
96171.4 153.5 12.85 9.97 11.88 10.1772.09 46.76
144192.9 175.9 13.33 14.48 12.78 14.3079.07 69.33
Glyphosate +0172.5 77.7 11.79 11.54 11.19 11.2562.44 53.14
No-till48170.1 117.7 12.07 12.68 12.03 12.0967.77 48.83
96205.5 192.2 13.42 14.89 11.64 14.3873.78 72.56
144218.1 213.6 13.83 15.38 13.36 15.0579.93 72.64
Roller Crimper0 104.4 12.46 12.27 44.74
No-till48 186.6 15.16 14.23 28.89
96 226.9 15.17 14.91 20.74
144 266.2 16.41 15.86 12.39
Termination Method
Conventional Disk Tillage197.5 230.5a13.05 15.50a12.28 14.8173.90 79.55
Glyphosate + Disk Tillage180.3 141.5c12.32 11.95c11.71 12.0969.39 56.16
Glyphosate + No-till195.4 170.3c12.78 13.62bc12.06 13.1970.98 61.79
Roller Crimper No-till 207.7b 14.80ab 14.32 73.31
N Rate
0 171.9 108.0 11.79 12.23 11.39 12.0162.52 54.79
48 179.7 175.6 12.24 13.93 11.78 13.3669.04 64.62
96 197.6 215.8 13.08 14.02 11.82 13.7374.78 70.88
144 207.3 238.7 13.75 15.70 13.08 15.3279.35 80.52
Trend L ns L *** L ns L *** L *** L ***L *** L ***
Effect Significance
Termination Methodns *** ns * ns nsns ns
N Rate ns *** *** *** *** ****** ***
Termination x N Ratens ns ns ns ns nsns ns
Note: *, p ≤ 0.05; ***, p ≤ 0.001; ns, non-significant; L, linear regression trend component. N rate trend significance assessed using orthagonal polynomial comparisons. No higher order polynomial regressions were significant. Pairwise comparisons of termination means made using Tukey’s HSD adjusted t tests.
Table 4. Mean sweet corn N uptake and agronomic N use efficiency following different cover crop terminations and N fertilizer rates in South Deerfield, MA.
Cover Crop Termination MethodN Rate (kg ha−1)Sweet Corn N Concentration (g kg−1)Total Sweet Corn N Uptake (kg ha−1) Agronomic N Use Efficiency (kg kg−1)
2020 20212020 2021 2020 2021
Conventional04.17 4.8119.24 16.33
Disk Tillage484.13 4.4621.10 27.57 1.66 14.26
964.26 4.5223.85 32.15 3.45 19.75
1444.87 5.4732.32 41.16 10.09 22.37
Glyphosate +03.75 3.3415.09 9.42
Disk Tillage483.85 3.5518.28 12.02 5.41 2.46
964.05 3.7323.15 13.84 9.65 6.65
1444.08 4.4125.69 20.41 14.84 13.38
Glyphosate +03.59 3.6518.97 9.59
No-till483.65 3.6523.42 13.12 3.72 1.53
963.84 4.2225.25 22.24 15.51 14.35
1444.55 4.6133.45 24.99 16.66 16.53
Roller Crimper0 3.81 11.67
No-till48 4.42 23.10 9.52
96 4.69 27.98 16.47
144 4.93 31.55 23.48
Termination Method
Conventional Disk Tillage4.36 4.8224.13 29.30a5.07 18.79a
Glyphosate + Disk Tillage3.93 3.7620.55 13.92c9.97 7.51b
Glyphosate + No-till3.91 4.0325.27 17.49c11.96 10.80b
Roller Crimper No-till 4.46 23.58b 16.49a
N Rate
0 3.84 3.9117.77 11.75
48 3.88 4.0220.93 18.95 3.60 6.95
96 4.05 4.2924.08 24.05 9.54 14.30
144 4.50 4.8630.49 29.53 13.87 18.94
Trend L ** L ***L *** L *** L *** L ***
Effect Significance
Termination Methodns nsns * ns *
N Rate *** ****** *** *** ***
Termination x N Ratens nsns * ns ns
Note: *, p ≤ 0.05; **, p ≤ 0.01; ***, p ≤ 0.001; ns, non-significant; L, linear regression trend component. N rate trend significance assessed using orthagonal polynomial comparisons. No higher order polynomial regressions were significant. Pairwise comparisons of termination means made using Tukey’s HSD adjusted t tests. Significant interactions between termination method and N rate were investigated as the effect of N rate within each termination method. Agronomic N use efficiency was calculated as the ear biomass/N rate.
Table 5. Mean sweet corn SPAD leaf N and soil nitrate concentration following different cover crop terminations and N fertilizer rates in South Deerfield, MA.
Cover Crop Termination MethodN Rate (kg ha −1)SPAD Leaf N at V5SPAD Leaf N at Flowering SPAD Leaf N at Harvest Soil Nitrate Concentration at V5 (mg kg–1)Soil Nitrate Concentration at Harvest (mg kg−1)
2020 20212020 2021 2020 2021 2020 20212020 2021
Conventional035.93 33.5936.03 31.67 35.68 37.39 7.95 27.70 5.06
Disk Tillage4836.86 39.2938.56 46.03 38.48 45.67 17.30 6.66 4.50
9638.08 37.9340.03 48.40 37.65 47.24 20.94 43.88 4.09
14437.83 42.3746.79 48.61 44.72 51.68 10.25 13.06 4.18
Glyphosate +036.00 31.8636.03 28.03 33.31 27.03 8.82 12.84 3.59
Disk Tillage4835.59 34.3835.57 33.84 35.35 32.03 8.46 20.72 4.36
9636.74 38.4342.53 39.31 37.75 35.22 8.96 1.94 4.56
14437.82 39.5046.93 45.07 39.69 46.20 13.48 6.42 6.36
Glyphosate +038.00 35.1540.18 26.27 33.31 31.02 8.56 22.13 4.71
No-till4838.58 39.5343.57 28.66 33.01 31.66 6.09 5.07 3.47
9639.53 41.2749.63 38.78 36.20 39.42 10.13 4.80 4.73
14437.90 45.8851.05 42.99 45.11 45.06 11.18 12.79 5.70
Roller Crimper0 33.51 23.63 33.67 22.64 6.04
No-till48 38.99 42.20 41.49 11.17 5.06
96 42.70 48.52 48.34 17.69 4.79
144 41.90 50.39 52.68 18.96 6.23
Termination Method
Conventional Disk Tillage37.17ab38.3040.35 43.68a39.13 45.50a14.11 22.82 4.45
Glyphosate + Disk Tillage36.54b36.0440.26 36.56bc36.53 35.12b9.93 10.48 4.72
Glyphosate + No-till38.50a40.4646.11 34.18c36.91 36.79b8.99 11.20 4.65
Roller Crimper No-till 39.28 41.18ab 44.04a 17.62 5.53
N Rate
0 36.64 33.5337.41 27.40 34.10 32.28 8.44 21.33 4.85
48 37.01 38.0539.23 37.68 35.61 37.71 10.62 10.90 4.35
96 38.12 40.0844.06 43.75 37.20 42.55 13.34 17.08 4.54
144 37.85 42.4148.26 46.76 43.17 48.90 11.63 12.81 5.61
Trend L ns L***L*** L*** L*** L*** L ns L ns L ns
Effect Significance
Termination Method* nsns * ns *** ns ns ns
N Rate* ****** *** *** *** ns ns ns
Termination x N Ratens nsns ns ns ns ns ns ns
Note: *, p ≤ 0.05; ***, p ≤ 0.001; ns, non-significant; L, linear regression trend component. N rate trend significance assessed using orthagonal polynomial comparisons. No higher order polynomial regressions were significant. Pairwise comparisons of termination means made using Tukey’s HSD adjusted t tests.
Disclaimer/Publisher’s Note: The statements, opinions and data contained in all publications are solely those of the individual author(s) and contributor(s) and not of MDPI and/or the editor(s). MDPI and/or the editor(s) disclaim responsibility for any injury to people or property resulting from any ideas, methods, instructions or products referred to in the content.

