Article

Evaluation of Alkaline Hydrolyzable Organic Nitrogen as an Index of Nitrogen Mineralization Potential of Some Coastal Savannah Soils of Ghana

1
Department of Soil Science, University of Ghana, Legon, Accra GA-489-9979, Ghana
2
Sierra Leone Agricultural Research Institute (SLARI), Freetown P.M.B 1313, Sierra Leone
3
Soil and Irrigation Research Centre, University of Ghana, Kpong EL-0633-5197, Ghana
*
Author to whom correspondence should be addressed.
Nitrogen 2022, 3(4), 652-662; https://doi.org/10.3390/nitrogen3040043
Submission received: 20 October 2022 / Revised: 8 November 2022 / Accepted: 5 December 2022 / Published: 16 December 2022

Abstract

:
Numerous biological and chemical methods have been proposed over the years for estimating the nitrogen (N) mineralization capacity of soils; however, none of them has found general use in soil fertility testing. The efficacy of a recently proposed alkaline hydrolysis method for assessing N availability in soils compared with the standard long-term incubation technique for determining potentially available N was evaluated. The nitrogen mineralization of 12 surface soils incubated under aerobic conditions at 25 °C for 26 weeks was determined. Field-moist soils were direct-steam distilled with 1 M KOH or 1 M NaOH; the NH3 released was trapped in boric acid, and its concentration was determined successively every 5 min for 40 min. The cumulative N mineralized or hydrolyzed was fitted to the first-order exponential equation to determine the potentially mineralizable N (No) and an analogous “potentially hydrolyzable N (Nmax)” for the soils. The flush of CO2 (fCO2) following the rewetting and incubation of air-dried soils under aerobic conditions for 3 days was also determined. The results showed that the Nmax values differed considerably among the soils, indicating differences in the chemical nature and reactivity of the organic N content of the soils, and were significantly correlated with No and fCO2 values. The estimated Nmax and No values ranged from 105 to 371 mg N kg−1 and 121 to 292 mg kg−1, respectively. Based on the simple and inexpensive nature of the alkaline hydrolysis procedure, the reduction in the incubation time required to obtain No (months to minutes), and the strong association between Nmax and No, we concluded that Nmax is a good predictor of the biologically discrete and quantifiable labile pool of mineralizable soil organic N (ON), and the use of the alkaline hydrolyzable ON as a predictor of No merits consideration for routine use in soil testing laboratories for estimating the N-supplying capacity of soils.

1. Introduction

Numerous biological and chemical methods have been proposed over the years for estimating the nitrogen (N) mineralization potential of soils [1]; however, none of these methods have been widely adopted in general soil fertility testing. The biologically based, long-term (>26 weeks) aerobic incubation procedure has been and continues to be the most widely used method for determining the potentially mineralizable N (N0) and availability in soils [2]. Due to the impracticability of the long experimental duration, other short-term biologically based procedures, ranging from 7 to 28 days, have also been proposed [3,4,5]. Indeed, a satisfactory and highly predictive relationship between the amount of N mineralized using the standard long-term aerobic incubation technique and that observed with the short-term methods has been reported [6,7]. Recently, the flush of CO2 (fCO2) following the rewetting and incubation of air-dried soils at 25 °C for 3 days has been proposed as an index of No, and significant correlation between fCO2 and the net amount of N mineralized in a 24-day incubation at 25 °C has been reported [8].
Chemical extraction methods have been proposed as a rapid approach of estimating N mineralization in soils. These chemical methods include extraction of mineral N with hot water [9,10,11] or hot KCl [12], hydrolysis of organic N with strong acids (e.g., 1 M HCl [13]) or alkaline reagents (1 M NaOH [14]; 0.01 mM NaHCO3 [11]), and direct-steam distillation of soils with pH 11.2 phosphate–borate buffer [15]. Although prone to some disadvantages [1], the chemical methods are proven to be fast and precise. Indeed, significant correlation between the amount of N extracted and/or hydrolyzed by the chemical methods and the No determined through the long-term biological incubation procedures has been reported [6,15,16,17].
Recently, a simple, rapid, and precise alkaline hydrolysis method for determining the chemical index of No of soils was proposed [18]. The method involves direct-steam distillation of field-moist soils with alkaline reagents (1 M KOH or NaOH); the NH3 released is trapped in boric acid, and its concentration is determined successively every 5 min for a total of 40 min. Akin to the first-order reaction kinetics introduced by Stanford and Smith [2] to describe N mineralization in soils, Dodor and Tabatabai [18] used a non-linear exponential model to describe the kinetics of N hydrolysis with time and proposed the concept of “potentially hydrolyzable N (Nmax)” as a discrete and quantifiable labile N pool with a corresponding first-order hydrolysis rate constant (kh) for soils.
The validity of the chemical indices of N mineralization potential is normally based on the degree of association with biological methods that simulate the microbial activity responsible for the mineralization of organic nitrogen (ON) in soils [1]. Therefore, an assessment of the efficacy of the proposed alkaline hydrolysis method compared to the long-term aerobic incubation, considered the most accurate predictor of the N-suppling capacity of soils, is imperative. This information could shed more light on the nature, pool size, and contribution of the hydrolyzable ON to the N mineralization potential of soils. In addition, the lability of soil organic carbon (SOC), as measured by fCO2 in short-term incubation, has been shown to be a good proxy for the labile pool of No in soils [8]. However, the fCO2 method has not been assessed against the alkaline hydrolysis method proposed by Dodor and Tabatabai [18]. Because the fCO2 method is simple and rapid, it is of research interest to employ it as a surrogate procedure to validate new chemical tests of N availability in soils.
In the present study, we postulate that Nmax is a discrete and definable portion of the labile and active N pool in soils, and that the alkaline hydrolysis technique could provide a reliable estimate of the N mineralization potential of soils. Therefore, the objective of this study was to assess the suitability of alkaline hydrolyzable ON as a chemical index of the mineralizable N pool in soils using the long-term incubation and the 3-day fCO2 as benchmarks.

2. Materials and Methods

2.1. Soils and Characterization

This investigation was carried out using 12 soils sampled from fields with different management histories located at the University of Ghana Farms (latitude 5°66′ N and longitude 00°19′ E), Accra, Ghana. The area experiences a bi-modal rainfall pattern with average annual rainfall of approximately 1000 mm and a mean annual temperature of 27 °C. Nyigbenya and Toje series are classified according to the FAO-WRB criteria as Lixic Vetic Nitisol, while Adentan and Haatso series are classified as Haplic Lixisol and Endogleyic Lixisol, respectively [19]. The corresponding classifications based on the Soil Taxonomy criteria are Rhodic Kandiustalf, Typic Kandiustalf, and Kandic Haplustalf, respectively [19] (Table 1). On each field, an area of approximately 5 × 5 m was delineated, and six surface soil (0–20 cm) samples were randomly taken, passed through a 2.0-mm sieve, placed in polyethene bags, and transported to the laboratory. The soil samples were divided into two portions; one portion was air-dried at room temperature and used for the determination of physical and chemical properties, whilst the other portion was refrigerated at 4 °C. A subsample of the refrigerated portion was used for the incubation and alkaline hydrolysis experiments.
In the analyses reported in Table 1, pH was measured in a soil to water ratio of 1:1, bulk density was determined by the core sampler method [20], and particle size distribution was determined by the Bouyoucos hydrometer method [21]. The mineral N content of the soils was extracted with 2 M KCl, and a 20-mL aliquot of the extract was used for the determination of NH4+-N and NO3-N by steam distillation [22]. Carbonates were removed from the soil before organic C determination by treating the soils with 2 M HCl and drying at 60 °C before the determination of the total C (TC) and N (TN) on <180-µm samples by dry combustion (LECO CNS Analyzer, LECO Corp., St. Joseph, MI, USA). The organic N (ON) content of the soils was determined by the differences between the TN and mineral N (sum of NH4+-N and NO3-N). All laboratory analyses were conducted in triplicates.

2.2. Flush of CO2 after Rewetting of Dried Soils

The procedure described by Franzluebbers et al. [8] was used to determine the fCO2 when air-dried soils were rewetted and incubated under aerobic conditions for three days. Briefly, 100 g of air-dried soils was weighed into jars, moistened to 60% water holding capacity (WHC), sealed tightly, and incubated in the dark at 25 °C for three days. The amount of CO2 released was adsorbed in a vial containing 30 mL of 1 M NaOH placed inside the jar. The concentration of CO2 was determined by titration of the excess NaOH with 0.5 M HCl after precipitation of carbonates by 20 mL of 2 M BaCl2 and addition of three drops of phenolphthalein indicator. Blank setups without soil were used to correct for background CO2 concentration [23].

2.3. Long-Term Aerobic N Mineralization

The procedure described by Stanford and Smith [2] was used for the long-term N mineralization under aerobic conditions. Duplicate samples of a mixture of 75 g field-moist soil (on oven-dry basis) and 75 g acid-washed sand were placed in leaching tubes lined with nonabsorbent cotton wool at the bottom to avoid soil loss. The soils were incubated in a constant-temperature room (25 ± 1 °C) in the dark for 26 weeks. The samples were leached with 90 mL of 0.05 M CaCl2 and 10 mL of N-free solution (0.002 M CaSO4·2H2O, 0.005 M Ca(H2PO4), 0.0025 M K2SO4, and 0.002 M MgSO4) at 2, 4, 6, 8, 10, 12, 14, 18, 22, and 26 weeks after the commencement of incubation, and the NH4+-N and NO3-N contents of the leachates were determined by steam distillation [22]. The moisture content of the soil was adjusted to 60% WHC every week. The NH4+-N and NO3-N for each leaching date were summed to calculate the cumulative N mineralized.

2.4. Alkaline Hydrolysis of Organic N

The procedure described by Dodor and Tabatabai [18] was used for the alkaline hydrolysis of organic N. Briefly, 1 g of field-moist soil (on oven-dried basis) was placed in a distillation flask, and 20 mL of 1 M NaOH or KOH was added. The sample was direct-steam distilled, and the NH3 released was captured in 5 mL of 5% boric acid, which was changed successively every 5 min for a total of 40 min. The amount of NH3 in the distillate was determined by titrating with a 0.005 M H2SO4 standard solution [22]. The initial NH4+-N present in the soils was subtracted from the results of the 5 min distillation.
All results reported for the alkaline hydrolysis were averages of triplicate analyses with the initial NH4+-N present in the soils subtracted. The initial NH4+-N was determined by steam distillation of 5 g field-moist soil (on oven-dried basis) in 20 mL of 2 M KCl with MgO for 4 min [24]. The moisture content of the soils was determined from the weight loss after drying at 105 °C for 48 h.

2.5. Modeling of N Mineralization and Hydrolysis

The cumulative N mineralized in the long-term aerobic incubation condition was fitted to the first-order kinetic equation [2]:
N m i n = N o [ 1 exp ( k m t ) ]
where Nmin (mg N kg−1) is the cumulative amount of N mineralized at time, t (week); No (mg N kg−1) is the potentially mineralizable N; and km (week−1) is the first-order mineralization rate constant. Similarly, the cumulative amount of N hydrolyzed by the alkaline reagents was fitted to the nonlinear first-order model proposed by Dodor and Tabatabai [18]:
N h y d = N m a x [ 1 exp ( k h t ) ]
where Nhyd (mg N kg−1) is the cumulative amounts of N hydrolyzed in time, t (min); Nmax (mg N kg−1) is the potentially hydrolyzable N; and kh (min−1) is the first-order alkaline hydrolysis rate constant.

2.6. Statistical Analysis

The first-order kinetic parameters of N mineralization and hydrolysis were obtained using GraphPad Prism 5 (12th Edition). Analysis of variance was performed using Genstat 12th edition. Fisher’s least significant difference (LSD) test was used to compare the means. We used SigmaPlot (v.13, Syntat Software, San Jose, CA, USA) for correlations among chemical and biological indices, No and Nmax values. A significant level of α = 0.05 was used in all cases.

3. Results

3.1. Flush of CO2

The fCO2 among the soils had values ranging from 45 to 131 mg CO2-C kg−1 soil (Table 1). Although fCO2 was positively correlated with TC, TN, and ON, the correlations were not significant (p > 0.05). The correlations between fCO2 and TC, TN, and ON were 0.201, 0.474, and 0.411, respectively.

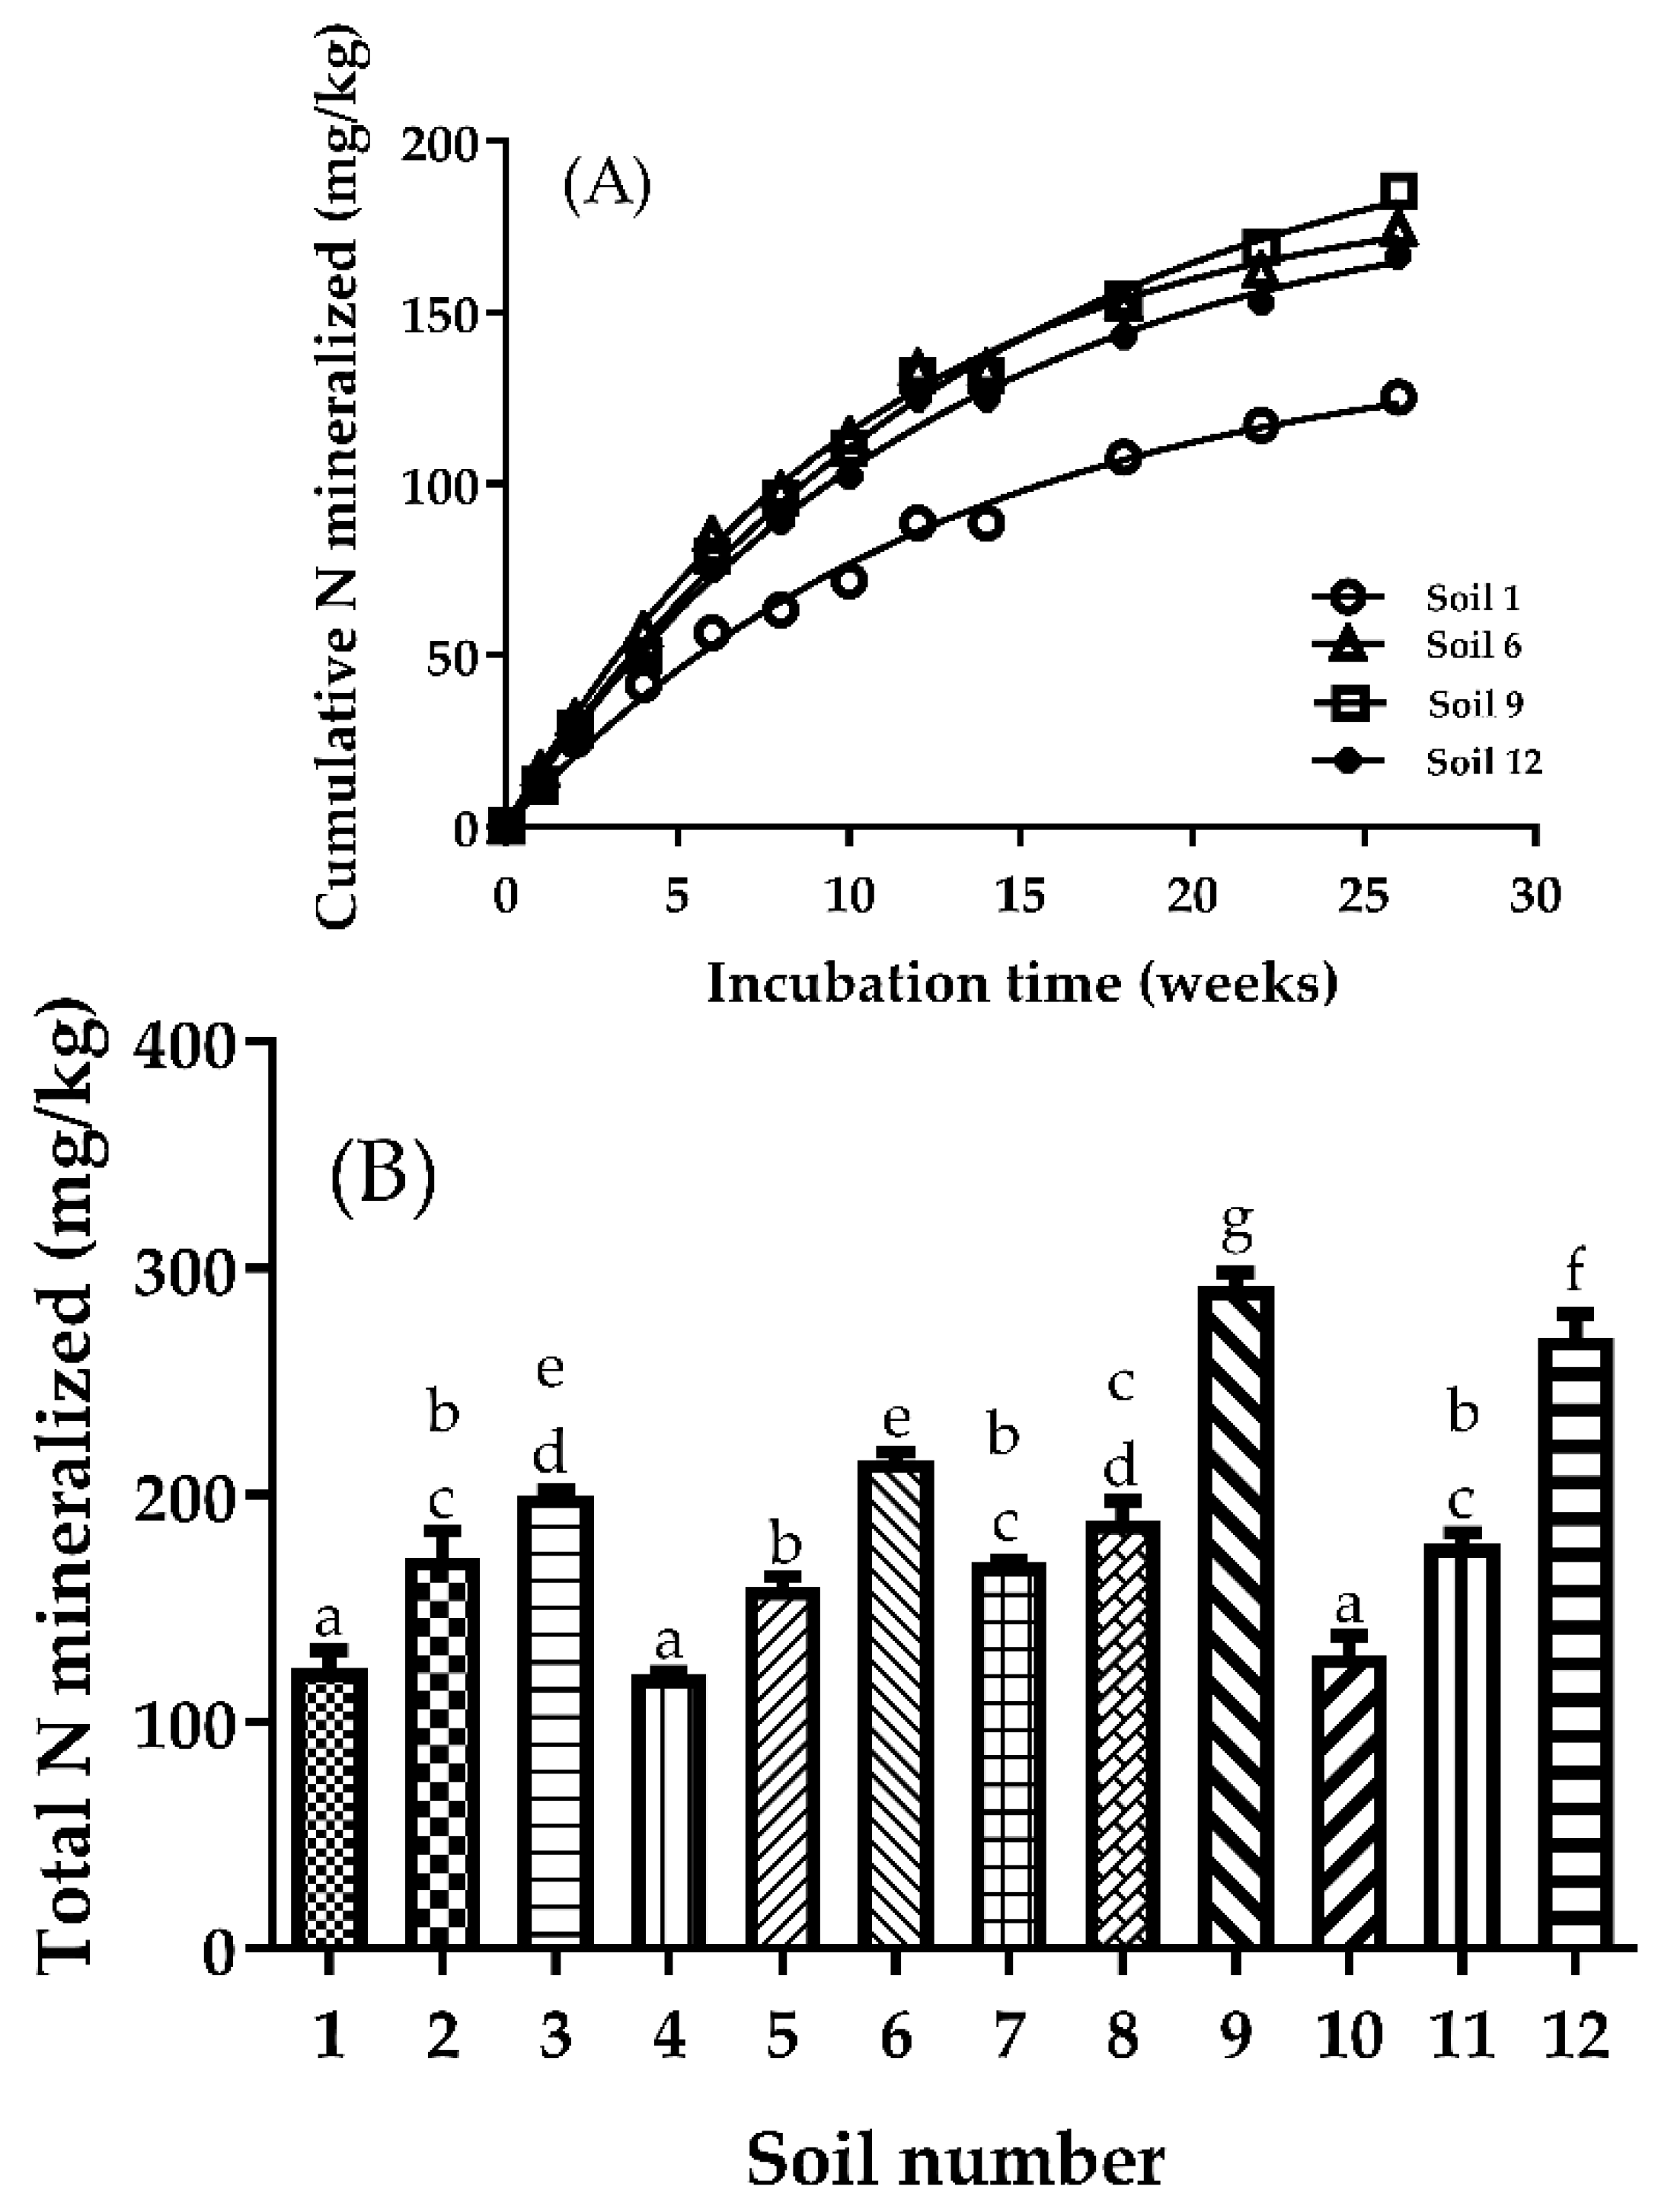
3.2. Long-Term Aerobic N Mineralization

The patterns and cumulative amounts of N mineralized in four of the soils used are plotted in Figure 1a; the results for the other eight soils fall within those shown. In general, the patterns of N mineralization in the incubated soils were similar with the N release rate, increasing rapidly during the first 7 weeks of incubation followed by a slow phase later during the incubation, resulting in a near linear increase in cumulative N after approximately week 15 (Figure 1a). The total amount of N mineralized during the 26 weeks of incubation ranged from 120.8 to 291.8 mg kg−1 soil (Figure 1b). Analysis of variance indicated that the total amount of N mineralized during the 26 weeks of incubation differed significantly (p < 0.05) among the soils (Figure 1b). Expressed as a percentage of ON in the soils, the total amounts of N mineralized during the 26 weeks of incubation varied among the soils with values ranging from 4 to 13.6%.

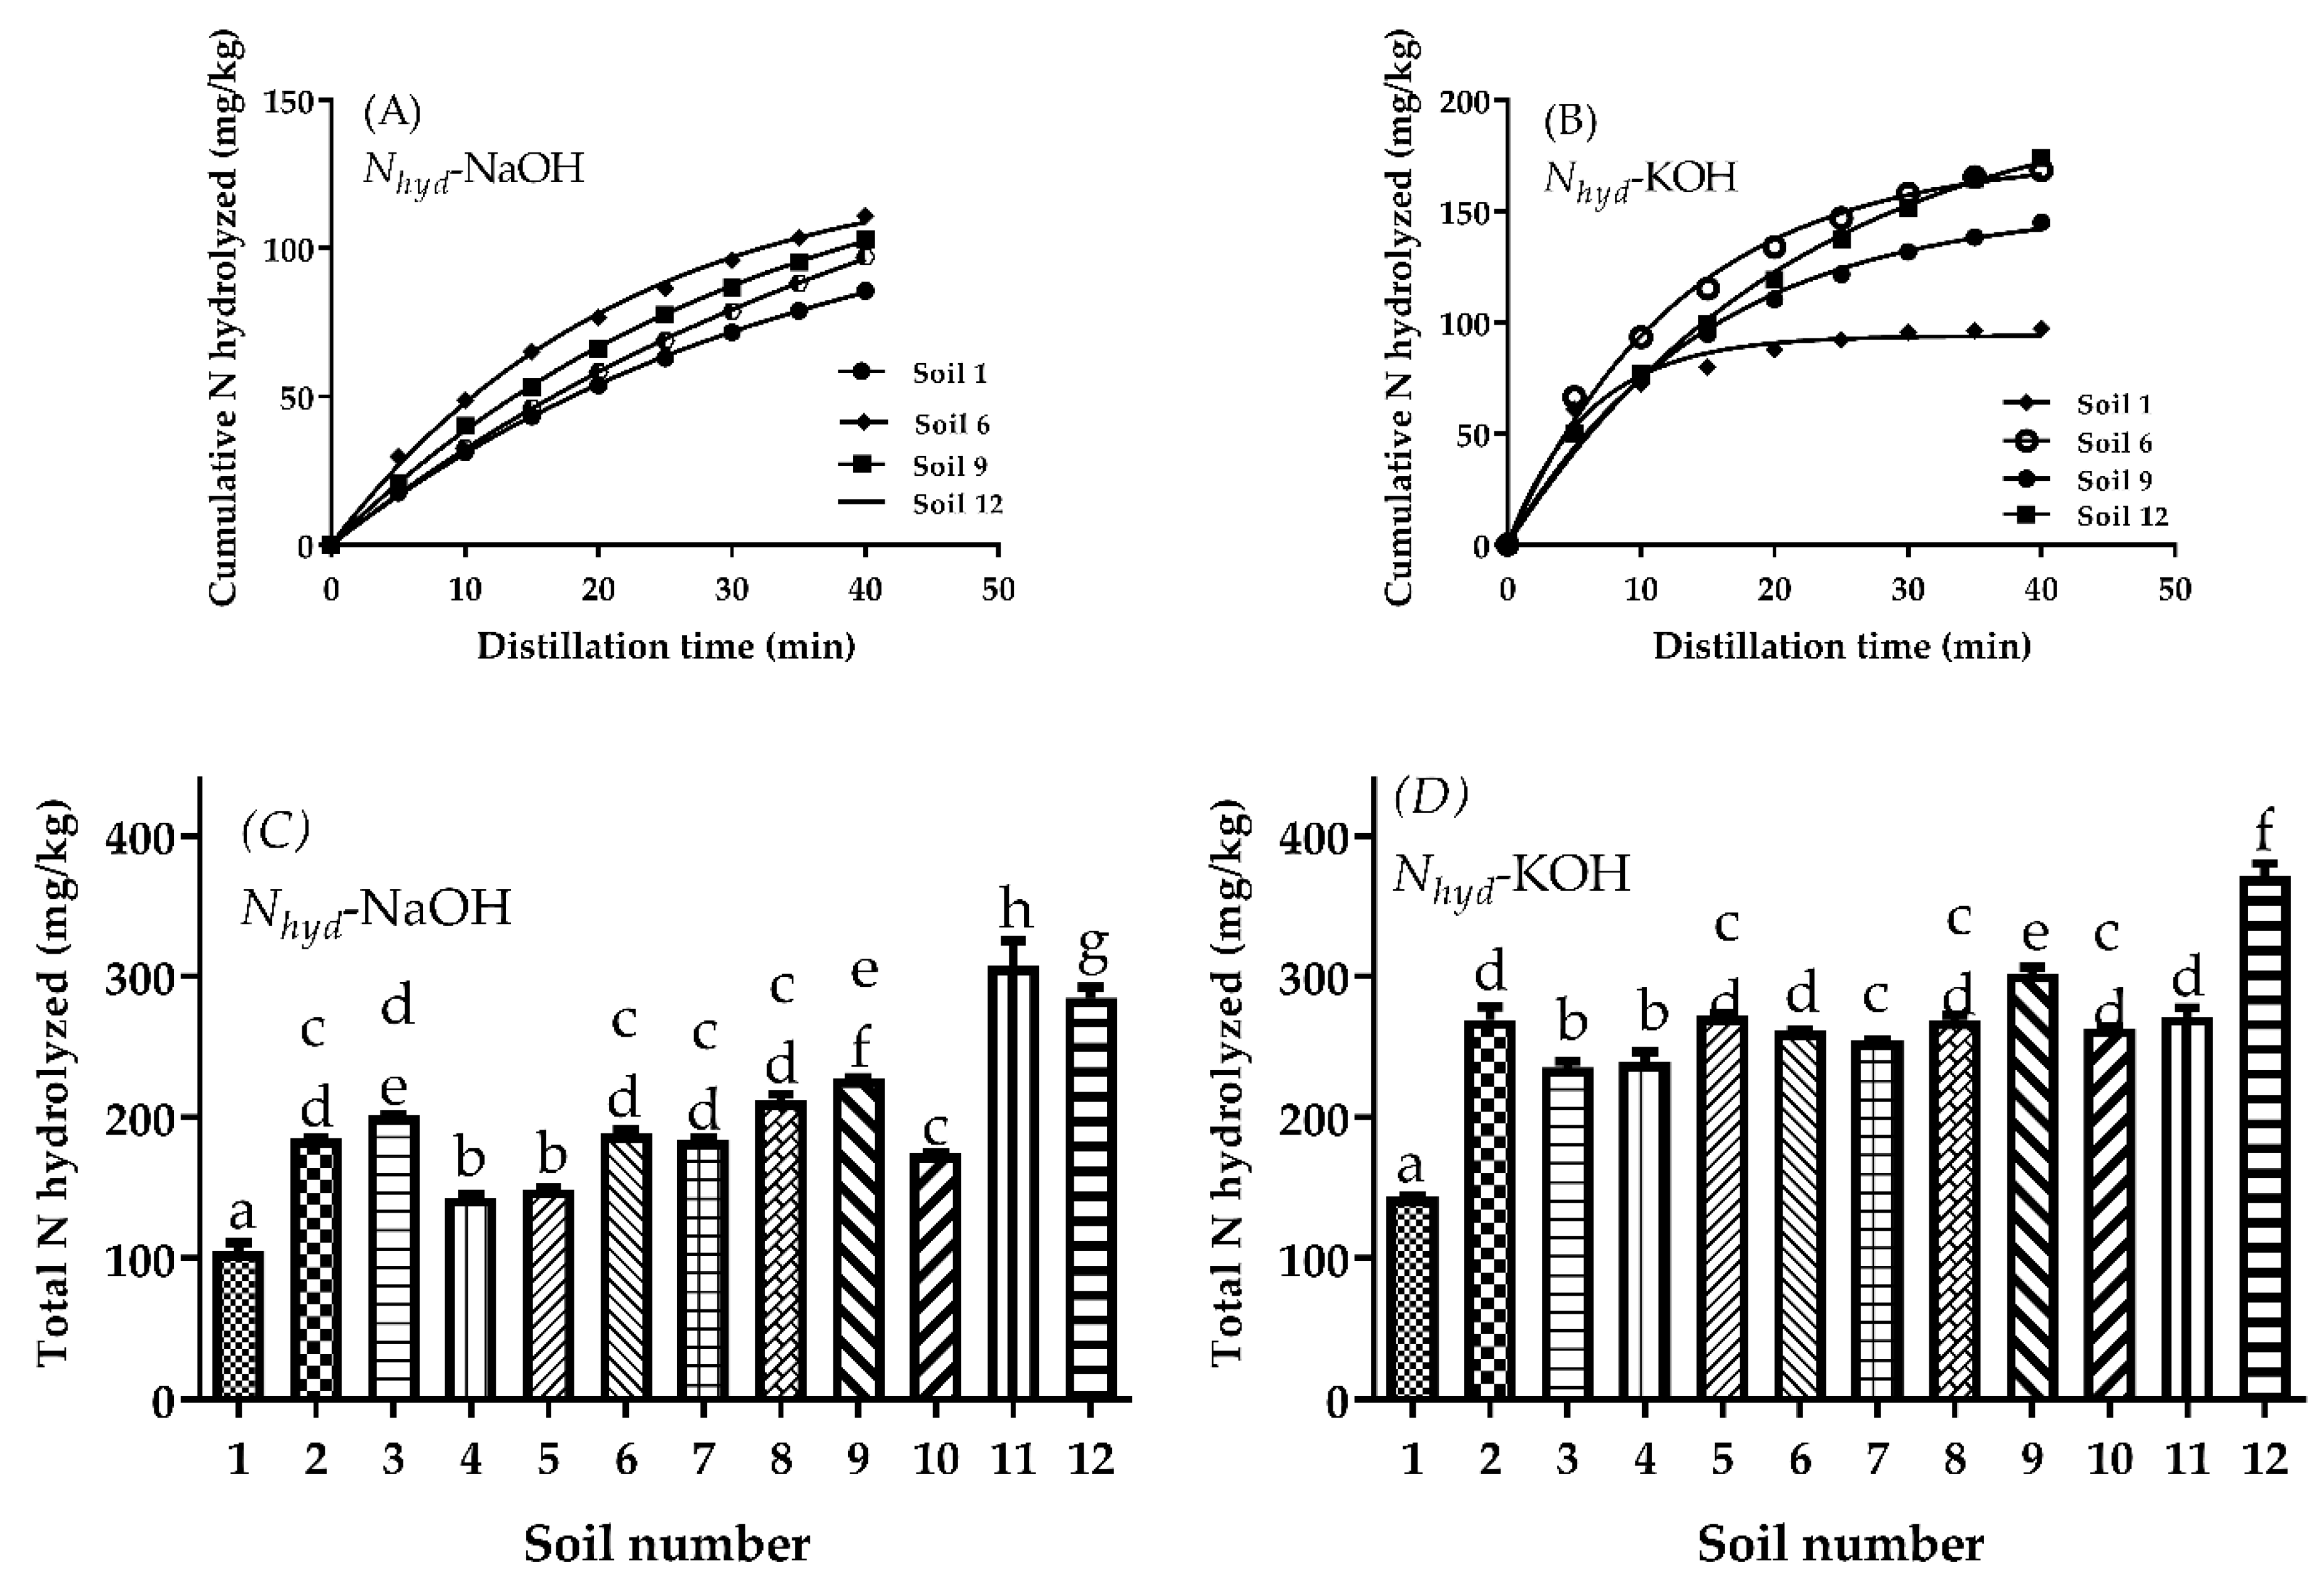
3.3. Alkaline Hydrolysis of Organic N

The cumulative amounts and patterns of alkaline hydrolysis of N with time of distillation in four of the soils used are shown in Figure 2a,b for KOH and NaOH, respectively; the results for the other soils fall within those shown. In general, the cumulative amounts of N hydrolyzed with time increased in a somewhat linear fashion during the first 15 min of distillation with the rate of N hydrolysis decreasing slowly as distillation progressed (Figure 2a,b). The total amounts of N hydrolyzed in the soils during the 40 min of distillation by the two reagents varied among the soils studied (Figure 2c,d), with the amounts ranging from 104.6–306.9 mg kg−1 and 143.5–371.3 mg kg−1 for NaOH and KOH, respectively. For each reagent, the amount of N hydrolyzed was significantly (p < 0.05) different among the soils (Figure 2c,d). Statistical analysis showed that the amount of N hydrolyzed with KOH was significantly (p < 0.05) higher than that with NaOH (Figure 2c,d). The total amounts of N hydrolyzed, expressed as a percentage of the ON contents of the soils, ranged between 3.9 to 15.1% for NaOH and between 4.6 and 15.9% for KOH.

3.4. Kinetic Parameter of N Mineralization and Hydrolysis

Application of the nonlinear regression analysis to calculate the kinetic parameters of N mineralization showed that convergence of the model occurred with 10 iterations or less, with R2 values ranging between 0.998 and 0.999. The estimated No values of the soils studied varied from 127.2 to 215.7 mg kg−1 soil (Table 2). The No values, expressed as a percentage of the ON, ranged from 4.0 to 13.6%. The km values ranged from 0.076 to 0.107 week−1 (average = 0.088 week−1). Analysis of variance indicated that the estimated No and km values differed significantly (p < 0.05) among the soils studied (Table 2).
The data for the alkaline hydrolysis of ON also fitted the exponential equation very well with all R2 values greater than 0.995. The estimated Nmax values for the alkaline reagents were significantly correlated with each other (r = 0.868; p < 0.001), with values ranging from 104.3 to 288.4 mg kg−1 soil for NaOH (Nmax-NaOH) and from 123.5 to 371.2 mg kg−1 soil for KOH (Nmax-KOH) (Table 2). Analysis of variance indicated that the estimated Nmax-NaOH and Nmax-KOH values differed significantly (p < 0.05) among the soils studied (Table 2).
When the Nmax values were expressed as a percentage of ON content of the soils, the values varied from 3.9 to 15.1% and from 4.6 to 19.2% for Nmax-NaOH and Nmax-KOH, respectively. The kh values varied from 0.021 to 0.046 min−1 (average = 0.033 min−1) for NaOH hydrolysis and from 0.033 to 0.166 min−1 (average = 0.070 min−1) for KOH hydrolysis. In general, the percentages of organic N contributing to No and Nmax values followed similar trends in all the soils.

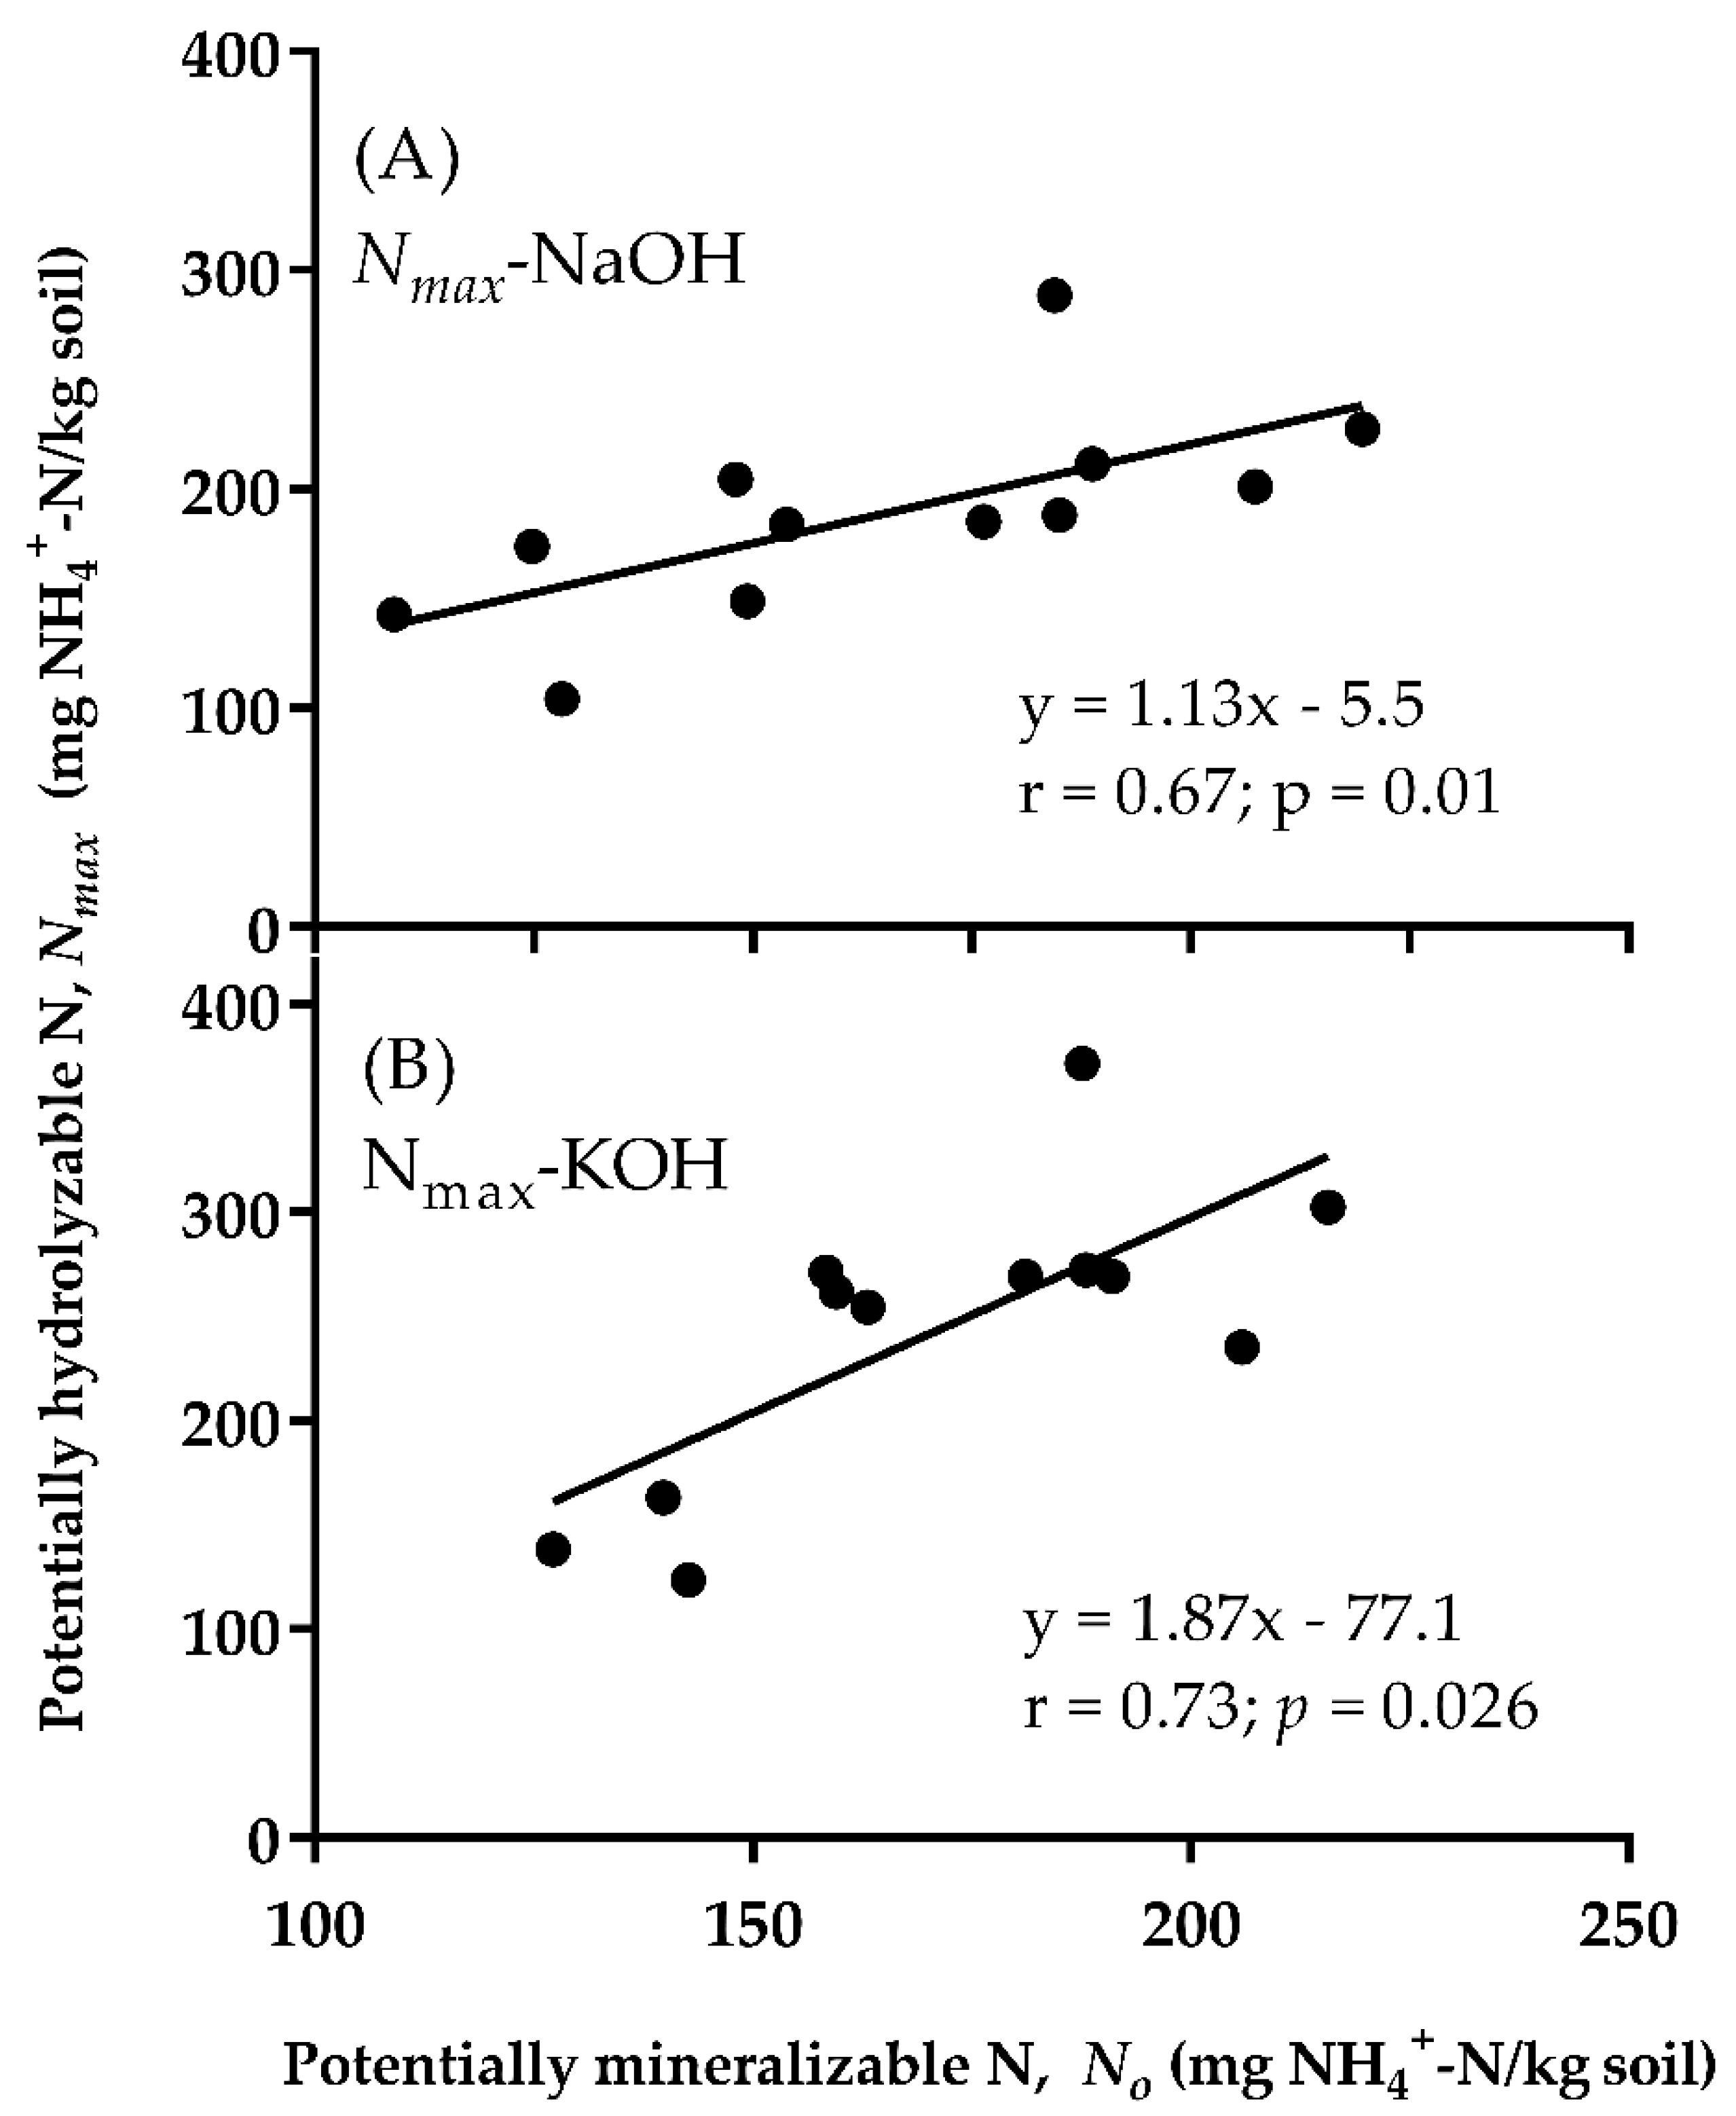
3.5. Relationship among Soil Properties, Estimated No, and Nmax Values

The estimated Nmax-NaOH and Nmax-KOH values were positively and significantly (p ≤ 0.01) correlated with the No values (Figure 3). Nonetheless, Nmax-KOH correlated better with No compared to Nmax-NaOH, and the ranges of the latter fitted better to the No values. Correlation coefficients between the estimated No values and ON, OC, TN, and fCO2 were 0.534, 0.596 (* p < 0.05), 0.497, and 0.701 (** p < 0.01), respectively, and those between fCO2 and the estimated Nmax-KOH and Nmax-NaOH values were 0.7112 (** p < 0.01) and 0.614 (* p < 0.05), respectively.
Further examination of the model parameters showed that, although the alkaline hydrolysis method was rapid, the percent of TN hydrolyzed and that mineralized in the biological method were comparable (Table 2). For the long-term incubation method, the percent of TN mineralized ranged from 4.0 to 13.6%, which compares very well with the 3.9–15.1% and 4.6–19.2% for hydrolysis with NaOH and KOH, respectively. Furthermore, despite the short duration of the alkaline hydrolysis method, the amount of N hydrolyzed also compared very well with that mineralized with the biological method. Whereas the No values ranged from 127.2 to 215.7 mg N kg−1 soil for the incubation period of 26 weeks, the Nmax-NaOH and Nmax-KOH values were 104.3288.4 and 123.5–371.2 mg N kg−1 soil, respectively, for a distillation time of 40 min.

4. Discussion

The positive but weak correlation between the N mineralization and OC contents of the soils may be due to the removal of soluble C critical for microbial growth and development during the periodic leaching. Similarly, the removal of a significant amount of soluble N during leaching [25] could result in lower N mineralization as a result of the shift in labile C and N stoichiometry. Other researchers have also reported an insignificant correlation between ON and N mineralization in soils and attributed it to the differences in the quality of the organic C and N content of the soils [18,26]. The results, however, contradict the reported close relationship among these parameters [27,28,29].
The very high R2 values obtained when the cumulative N mineralization and hydrolysis data were fitted to the first-order exponential equation indicate that N mineralization in the soils conformed to the model proposed by Stanford and Smith [2] and are consistent with the results of other researchers [30,31]. The curvilinear pattern of cumulative N mineralization, which declined as incubation time progressed, could be attributed to the decreasing quantity of the easily mineralizable N pools in the soils. Our results, however, contradict other authors who reported that the mineralization of N in incubated soils increased linearly with time [32,33]. Similarly, the initially high amounts of N hydrolyzed by the alkaline reagents, which later dropped to an almost constant rate, can be attributed to the decline in the hydrolyzable ON in the soils.
The 26-week N0 values reported in the present study are comparable to those reported in the literature. For example, Schomberg et al. [7] reported a range of 35 to 488 mg N kg−1 soil, Sharifa et al. [34] reported a range of 54 to 197 mg N kg−1 soil for 153 soil samples from 17 fields in Canada and the USA, and Jalil et al. [17] reported a range of 71 to 278 mg N kg−1 soil. The average km of 0.088 week−1 obtained in the present study is higher than the 0.054 week1 reported for 39 soils from North America [2] and can be attributed, perhaps, to the differences in soil properties such as the C/N ratios. Furthermore, the soils used in the present study are from a tropical climate where microbial activity and associated processes such as N mineralization are normally faster compared to their temperate counterparts. Different km values have, however, been reported in several studies [7,31].
The strong and positive correlation between the estimated Nmax and No values reported for the long-term incubation of soils of wide and varied properties indicates that the two procedures may be measuring the same pools of potentially mineralizable and available N. The strong relationship between fCO2 and No can be explained by the stoichiometric requirement for labile C and N by microbial populations [35]; whereby, soils with high fCO2, indicative of a high availability of labile SOC to drive microbial activity, also have a larger pool of labile and potentially mineralizable N. The results corroborate those of other workers showing that fCO2 is closely related to the net N mineralization during a 24-day incubation [8]. Furthermore, previous studies using 13 uncultivated and unfertilized soils from Iowa, USA showed that the estimated Nmax values related strongly to the amount of N mineralized in two weeks under aerobic and anaerobic incubation conditions at 30 °C, N released by 2 M KCl extraction at 80 °C for 20 h, and the initial NH4+-N present in the soils [18].
An ideal chemical index for predicting potentially available N should meet the following criteria, among others: simple and rapid, inexpensive to encourage adoption, and amenable to high-throughput operations to give quick turn-around N application recommendations [36]. The alkaline hydrolysis method proposed by Dodor and Tabatabai [18] meets most of these requirements; as such, it could provide a very good proxy of the net N mineralization potential and N-supplying power of soils. Therefore, the strong positive correlation between the estimated Nmax and No values, coupled with the relationship with fCO2, lend strong support to our assertion that Nmax could be used as a robust index of potential mineralizable N and supplying capacity of soils.
Although our study lacks information on the chemical nature of ON hydrolyzable by NaOH and KOH, it is generally known that the chemical hydrolysis of ON in soils is selective with regards to the bond being hydrolyzed. Gianello and Bremner [6] reported that only six out of the over 50 ON compounds known to occur in soils or soil hydrolysates released NH4+-N in hot KCl. In the present study, we speculate that the NaOH and KOH hydrolyzable N are derived from exchangeable NH4+, hexosamines in amino sugars, α-amino and amide-N (glutamine, asparagine, glucosamine, and galactosamine), and hydrolyzable unidentified N fractions [37,38,39]. These amine and amide bonds hydrolyzed by the alkaline reagents could be the same ones that were mineralized by the biological methods. This assertion is consistent with the results of Dodor and Tabatabai [40] who reported significant relationships between the estimated Nmax values and the activities of arylamidase and amidohydrolases, especially amidase, and suggested that the alkaline reagents might be hydrolyzing mainly amide-N. The stronger relationship between Nmax-KOH and No may be attributed to KOH probably hydrolyzing more of the same ON pool as the biological methods, some of which may have originated from the compounds released from microbial cells.

5. Conclusions

The alkaline hydrolysis procedure is rapid, is precise, and reduces the long incubation time required to obtain No (minutes compared to months). The estimated Nmax values were highly correlated with No during the 26 weeks of incubation as well as the fCO2, an indicator of overall soil biological activity. Based on the results from the present study, we conclude that the method could provide an effective, time-efficient, and practical tool for the routine assessment of N mineralization potential in soils of varied properties. The use of alkaline hydrolyzable ON as a predictor of No in soils, therefore, merits consideration for routine use in soil testing laboratories for estimating the N-supplying capacity of soils.

Author Contributions

Conceptualization, D.E.D.; methodology, D.E.D.; formal analysis, D.E.D. and S.G.K.A.; investigation, M.S.K., A.A.-B. and D.E.D.; resources, M.S.K., A.A.-B. and D.E.D.; data curation, M.S.K. and D.E.D.; writing—original draft preparation, D.E.D. and M.S.K.; writing—review and editing, D.E.D., M.S.K., S.G.K.A., D.S.M., S.K.K. and D.N.; supervision, D.E.D.; project administration, D.E.D. and S.G.K.A.; funding acquisition, D.E.D., S.G.K.A., D.S.M. and D.N. All authors have read and agreed to the published version of the manuscript.

Funding

This research received no external funding.

Data Availability Statement

Data are available upon reasonable request from the corresponding author.

Acknowledgments

This paper forms part of Mohamed S. Kamara’s unpublished MPhil Thesis submitted to the University of Ghana, Legon, Ghana. The financial support by the German Academic Exchange Service (DAAD) to Mohamed S. Kamara and Abena Asamoah-Bediako for their MPhil and PhD studies, respectively, at the Department of Soil Science, University of Ghana, Legon, is acknowledged.

Conflicts of Interest

The authors declare no conflict of interest.

References

  1. Bundy, L.G.; Meisinger, J.J. Nitrogen availability indices. In Methods of Soil Analysis, Part 2—Microbiological and Biochemical Properties; Weaver, R.W., Angle, J.S., Bottemley, P.S., Eds.; SSSA/ASA: Madison, WI, USA, 1994; pp. 951–984. [Google Scholar]
  2. Stanford, G.; Smith, S.J. Nitrogen mineralization potential of soils. Soil Sci. Soc. Am. Proc. 1972, 36, 465–472. [Google Scholar] [CrossRef]
  3. Waring, S.A.; Bremner, J.M. Ammonium Production in Soil under Waterlogged Conditions as an Index of Nitrogen Availability. Nature 1964, 201, 951–952. [Google Scholar] [CrossRef]
  4. Keeney, D.R.; Bremner, J.M. Determination and Isotope-Ratio Analysis of Different Forms of Nitrogen in Soils: 6. Mineralizable Nitrogen. Soil Sci. Soc. Am. J. 1967, 31, 34–39. [Google Scholar] [CrossRef]
  5. Stanford, G.; Carter, J.N.; Smith, S.J. Estimates of potentially mineralizable soil nitrogen based on short-term incubations. Soil Sci. Soc. Am. Proc. 1974, 38, 99–102. [Google Scholar] [CrossRef] [Green Version]
  6. Gianello, C.; Bremner, J.M. A simple chemical method of assessing potentially available organic nitrogen in soils. Commun. Soil Sci. Plant Anal. 1986, 17, 195–214. [Google Scholar] [CrossRef]
  7. Schomberg, H.H.; Wietholter, S.; Griffin, T.S.; Reeves, D.W.; Cabrera, M.L.; Fisher, D.S.; Kitchen, N.R. Assessing indices for predicting potential nitrogen mineralization in soils under different management systems. Soil Sci. Soc. Am. J. 2009, 73, 1575–1586. [Google Scholar] [CrossRef]
  8. Franzluebbers, A.J.; Pershing, M.R.; Crozier, C.; Osmond, D.; Schroeder-Moreno, M. Soil-test biological activity with the flush of CO2: I. C and N characteristics of soils in corn production. Soil Sci. Soc. Am. J. 2018, 82, 685–695. [Google Scholar] [CrossRef] [Green Version]
  9. Jenkinson, D.S. Chemical tests for potentially available nitrogen in soil. J. Sci. Food Agric. 1968, 19, 160–168. [Google Scholar] [CrossRef]
  10. Stanford, G. Extraction of soil organic nitrogen by autoclaving in water. II. A kinetic approach to estimating the NaOH-distillable fraction. Soil Sci. 1969, 107, 323–328. [Google Scholar] [CrossRef]
  11. Curtin, D.; Bearea, M.H.; Lehtoa, K.; Tregurthaa, C.; Qiua, W.; Tregurthaa, R.; Peterson, M. Rapid Assays to Predict Nitrogen Mineralization Capacity of Agricultural Soils. Soil Sci. Soc. Am. J. 2017, 81, 979–991. [Google Scholar] [CrossRef]
  12. Øien, A.; Selmer-Olsen, A.R. A laboratory method for evaluation of available nitrogen in soil. Acta Agric. Scand. 1980, 30, 149–156. [Google Scholar] [CrossRef]
  13. Xu, J.M.; Cheng, H.H.; Koskinen, W.C.; Molina, J.A.E. Characterization of potentially bioreactive soil organic carbon and nitrogen by acid hydrolysis. Nutr. Cycl. Agrosyst. 1997, 49, 267–271. [Google Scholar] [CrossRef]
  14. Stanford, G.; DeMar, W.H. Extraction of soil organic nitrogen by autoclaving in water. I. The NaOH-distillable fraction as an index of soil nitrogen availability. Soil Sci. 1969, 109, 203–205. [Google Scholar] [CrossRef]
  15. Gianello, C.; Bremner, J.M. Comparison of chemical methods of assessing potentially available organic nitrogen in soil. Comm. Soil Sci. Plant Anal. 1986, 17, 215–236. [Google Scholar] [CrossRef]
  16. Smith, K.A.; Li, S. Estimation of potentially mineralizable nitrogen in soil by KCl extraction: I. Comparison with pot experiments. Plant Soils 1993, 157, 167–174. [Google Scholar] [CrossRef]
  17. Jalil, A.; Campbell, C.A.; Schoenau, J.; Henry, J.L.; Jame, Y.W.; Laford, G.P. Assessment of two chemical extraction methods as indexes of available nitrogen. Soil Sci. Soc. Am. J. 1996, 60, 1954–1960. [Google Scholar] [CrossRef]
  18. Dodor, D.E.; Tabatabai, M.A. A simple alkaline hydrolysis method for estimating nitrogen mineralization potentially of soils. West Afr. J. Appl. Ecol. 2019, 27, 16–31. [Google Scholar]
  19. Eze, P.N. Characterization, Classification and Pedogenesis of Soils on a Legon Catena in the Accra Plains, Ghana. Ph.D. Thesis, University of Ghana, Legon, Ghana, 2008. [Google Scholar]
  20. Blake, G.R.; Hartge, K.H. Bulk density. In Methods of Soil Analysis, Part 1—Physical and Mineralogical Methods; Klute, A., Ed.; SSSA/ASA: Madison, WI, USA, 1986; pp. 363–375. [Google Scholar]
  21. Gee, G.W.; Bauder, J.W. Particle size analysis. In Methods of Soil Analysis, Part 1—Physical and Mineralogical Methods; Klute, A., Ed.; SSSA/ASA: Madison, WI, USA, 1986; pp. 383–411. [Google Scholar]
  22. Mulvaney, R.L. Nitrogen–Inorganic Forms. In Methods of Soil Analysis, Part 3—Chemical Methods; Sparks, D.L., Ed.; SSSA/ASA: Madison, WI, USA, 1996; pp. 1123–1184. [Google Scholar]
  23. Dodor, D.E.; Amanor, Y.J.; Attor, F.T.; Adjadeh, T.A.; Neina, D.; Miyittah, M. Co-application of biochar and cattle manure counteract positive priming of carbon mineralization in a sandy Soil. Environ. Syst. Res. 2018, 7, 5. [Google Scholar] [CrossRef] [Green Version]
  24. Dodor, D.E. Enzyme Activities in Soils as Affected by Long-Term Cropping Systems. Ph.D. Dissertation, Iowa State University, Ames, IA, USA, 2002. Available online: http://lib.dr.iastate.edu/rtd/990 (accessed on 8 November 2022).
  25. Curtin, D.; Wen, G. Organic matter fractions contributing to soil nitrogen mineralization potential. Soil Sci. Soc. Am. J. 1999, 63, 410–415. [Google Scholar] [CrossRef]
  26. Dodor, D.E.; Tabatabai, M.A. Arylamidase activity as an index of nitrogen mineralization in soils. Comm. Soil Sci. Plant Anal. 2007, 38, 2197–2207. [Google Scholar] [CrossRef]
  27. Simard, R.R.; N’dayegamiyie, A. Nitrogen mineralization potential of meadow soils. Can. J. Soil Sci. 1993, 73, 27–38. [Google Scholar] [CrossRef]
  28. Serna, M.D.; Pomares, F. Evaluation of chemical indices of soil organic nitrogen availability in calcareous soils. Soil Sci. Soc. Am. J. 1992, 56, 1486–1491. [Google Scholar] [CrossRef]
  29. Wang, W.; Smith, C.J.; Chalk, P.M.; Chen, D. Evaluation of chemical and physical indices of nitrogen mineralization capacity with an unequivocal reference. Soil Sci. Soc. Am. J. 2001, 65, 368–376. [Google Scholar] [CrossRef]
  30. Griffin, G.F.; Laine, A.F. Nitrogen mineralization in soils previously amended with organic wastes. Agron. J. 1983, 75, 124–129. [Google Scholar] [CrossRef]
  31. Wang, W.J.; Smith, C.J.; Chen, D. Towards a standardized procedure for determining the potentially mineralisable nitrogen. Biol. Fertil. Soils 2003, 37, 362–374. [Google Scholar] [CrossRef]
  32. Tabatabai, M.A.; Al-Khafaji, A.A. Comparison of nitrogen and sulfur mineralization in soils. Soil Sci. Soc. Am. Proc. 1980, 41, 1000–1006. [Google Scholar] [CrossRef]
  33. Addiscott, T.M. Kinetics and temperature relationships of mineralization and nitrification in Rothamsted soil with differing histories. J. Soil Sci. 1983, 34, 343–353. [Google Scholar] [CrossRef]
  34. Sharifi, M.; Zebarth, B.J.; Burton, D.L.; Grant, C.A.; Cooper, J.M. Evaluation of some indices of potentially mineralizable nitrogen soils. Soil Sci. Soc. Am. J. 2007, 71, 1233–1239. [Google Scholar] [CrossRef]
  35. Dodor, D.E.; Amanor, Y.J.; Asamoah-Bediako, A.; MacCarthy, D.S.; Dovie, B.D. Kinetics of carbon mineralization and sequestration of sole and/or co-amended biochar and manure in a sandy soil. Comm. Soil Sci. Plant Anal. 2019, 50, 2593–2609. [Google Scholar] [CrossRef]
  36. McDaniel, M.; Walters, D.; Bundy, L.; Li, X.; Drijber, R.A.; Sawyer, J.E.; Castellan, M.J.; Laboski, C.A.M.; Scharf, P.C.; Horwath, W.R. Combination of biological and chemical soil tests best predict maize nitrogen response. Agron. J. 2020, 112, 1263–1278. [Google Scholar] [CrossRef] [Green Version]
  37. Sowden, F.J. The forms of nitrogen in the organic matter of different horizons of soil profiles. Can. J. Soil Sci. 1958, 38, 147–154. [Google Scholar] [CrossRef]
  38. Stanford, G. Evaluation of ammonium release by alkaline permanganate extraction as an index of soil nitrogen availability. Soil Sci. 1978, 126, 244–253. [Google Scholar] [CrossRef]
  39. Greenfield, L.G. The origin and nature of organic nitrogen in soil as assessed by acidic and alkaline hydrolysis. Eur. J. Soil Sci. 2001, 52, 575–583. [Google Scholar] [CrossRef]
  40. Dodor, D.E.; Tabatabai, M.A. Alkaline hydrolyzable organic nitrogen as an index of nitrogen mineralization in soils: Relationship with activities of arylamidase and amidohydrolases. Comm. Soil Sci. Plant Anal. 2020, 51, 1757–1766. [Google Scholar] [CrossRef]
Figure 1. Cumulative amounts of N mineralized in four of the soils used in relation to incubation time (A), and net amounts of N mineralized in soils during incubation for 26 weeks at 25 °C (B). Error bars represent standard error of three replicates. Bars followed by the same letter are not significantly different at p = 0.05.
Nitrogen 03 00043 g001
Figure 2. Cumulative N hydrolyzed with time of distillation using 1 M NaOH (A) and 1 M KOH (B) in four of the soils used. Total N hydrolyzed from the soils using 1 M NaOH (C), and 1 M KOH (D). Error bars represent standard error of three replicates. Within each reagent, bars followed by the same letter are not significantly different at p = 0.05.
Nitrogen 03 00043 g002
Figure 3. Relationship between potentially mineralizable N and potentially hydrolyzable N using, (A) 1 M NaOH, and (B) 1 M KOH.
Nitrogen 03 00043 g003
Table 1. Physical and chemical properties of the soils used.
IDSoil SeriesSand
(g kg−1)
Silt
(g kg−1)
Clay
(g kg−1)
pHTotal C (g kg−1)Total N (g kg−1)NH4+-N (mg kg−1)NO3-N (mg kg−1)Org-N (g kg−1)fCO2 a (mg kg−1)
1Nyigbenya600503506.210.51.925.925.91.864
2Nyigbenya670552755.710.81.828.031.51.7103
3Nyigbenya825251506.915.95.135.037.15.0102
4Toje550504006.39.61.534.337.11.453
5Toje575753505.211.02.431.539.22.3108
6Toje550753754.811.43.142.746.23.0128
7Adentan650752755.65.71.720.124.51.745
8Adentan550753755.58.21.425.951.11.3110
9Adentan725252505.09.53.522.433.63.4131
10Haatso700752256.05.72.315.917.02.383
11Haatso755751756.36.62.416.823.12.4119
12Haatso750751756.46.92.826.631.52.7120
a fCO2 is the flush of CO2 following rewetting and incubation of air-dried soils.
Table 2. First-order kinetic parameters of N mineralization/hydrolysis for the soils Ϯ.
IDSoil SeriesNminNhyd-NaOHNhyd-KOH
Nokm%NTNmaxkh%NTNmaxkh%NT
1Nyigbenya142.60.0777.5104.30.0285.5123.50.1667.6
2Nyigbenya181.10.07910.1185.00.03610.3269.00.03314.9
3Nyigbenya205.90.0894.0201.20.0443.9235.10.0804.6
4Toje127.20.1078.5142.80.0249.5138.00.07715.9
5Toje159.50.1026.6148.90.0326.2261.70.07411.3
6Toje188.00.0956.1188.20.0466.1272.10.0808.4
7Adentan163.10.0769.6183.90.03810.8254.30.06715.0
8Adentan191.00.08113.6211.50.03315.1268.80.06419.2
9Adentan215.70.0725.3227.50.0316.5302.10.0578.6
10Haatso139.80.0995.0173.80.0416.2163.00.0429.4
11Haatso158.40.0966.6204.60.0228.5271.10.06111.3
12Haatso187.60.0816.8288.40.02112.5371.20.04516.1
LSD (p < 0.05)3.30.0010.810.50.0010.58.50.0020.6
ϮNo, potentially mineralizable N (mg N kg−1 soil); km, first-order mineralization rate constant (week−1); Nmax, potentially hydrolyzable N (mg N kg−1 soil); kh, first-order hydrolysis rate constant (min−1); %NT, percent of total N mineralized or hydrolyzed (%).
Publisher’s Note: MDPI stays neutral with regard to jurisdictional claims in published maps and institutional affiliations.

