Article

Rapid Permafrost Thaw Removes Nitrogen Limitation and Rises the Potential for N2O Emissions

1
Institute of Soil Science, Universität Hamburg, 20146 Hamburg, Germany
2
Center for Earth System Research and Sustainability, Universität Hamburg, 20146 Hamburg, Germany
*
Author to whom correspondence should be addressed.
Current address: Department for Environmental Science, Stockholm University, 106 91 Stockholm, Sweden.
Nitrogen 2022, 3(4), 608-627; https://doi.org/10.3390/nitrogen3040040
Submission received: 6 August 2022 / Revised: 31 October 2022 / Accepted: 2 November 2022 / Published: 15 November 2022
(This article belongs to the Special Issue Nitrogen Cycling in Permafrost Soils)

Abstract

:
Ice–rich Pleistocene permafrost deposits (Yedoma) store large amounts of nitrogen (N) and are susceptible to rapid thaw. In this study, we assess whether eroding Yedoma deposits are potential sources of N and gaseous carbon (C) losses. Therefore, we determined aerobic net ammonification and nitrification, as well as anaerobic production of nitrous oxide (N2O), carbon dioxide (CO2), and methane (CH4) in laboratory incubations. Samples were collected from non-vegetated and revegetated slump floor (SF) and thaw mound (TM) soils of a retrogressive thaw slump in the Lena River Delta of Eastern Siberia. We found high nitrate concentrations (up to 110 µg N (g DW)−1) within the growing season, a faster transformation of organic N to nitrate, and high N2O production (up to 217 ng N2O-N (g DW)−1 day−1) in revegetated thaw mounds. The slump floor was low in nitrate and did not produce N2O under anaerobic conditions, but produced the most CO2 (up to 7 µg CO2-C (g DW)−1 day−1) and CH4 (up to 65 ng CH4-C (g DW)−1 day−1). Nitrate additions showed that denitrification was substrate limited in the slump floor. Nitrate limitation was rather caused by field conditions (moisture, pH) than by microbial functional limitation since nitrification rates were positive under laboratory conditions. Our results emphasize the relevance of considering landscape processes, geomorphology, and soil origin in order to identify hotspots of high N availability, as well as C and N losses. High N availability is likely to have an impact on carbon cycling, but to what extent needs further investigation.

1. Introduction

Recent estimates suggest that if global warming continues, about 10% of the Northern Hemisphere permafrost area will be affected by abrupt permafrost thaw by the end of the century, causing an additional release of 624 Tg carbon dioxide equivalents (CO2eq) per year between 2000–2100 [1]. The release of CO2eq by rapid permafrost thaw might be even higher, as nitrous oxide (N2O) emissions are not yet considered. Studies of collapsed permafrost proved that these sites are not only significant sources of carbon dioxide (CO2) and methane (CH4), but also of N2O [2,3,4,5,6]. However, intensive research has been conducted on permafrost carbon-climate feedback, but comparatively less research focused on N biogeochemistry and N2O release from degrading permafrost soils. Voigt et al. [7] reviewed in 2020 that there were only 40 published studies on N2O across permafrost regions worldwide, thereof only three studies were conducted in the Russian Arctic. This major knowledge gap leads to uncertainties in earth system models [8]. For decades, it was assumed that Arctic ecosystems are generally N limited and that N is directly immobilized by microorganisms and plants and hence are not available for microbial processing [7,9,10,11]. Nitrous oxide, primarily formed aerobically via nitrification but also anaerobically via denitrification [12], has 298 times higher global warming potential (GWP) than CO2 [13] and further leads to ozone depletion in the stratosphere [13,14].
In addition to gaseous losses, elevated concentrations of dissolved nitrogen have been found in eroded permafrost [5,15,16,17,18,19]. In particular deposits from the Late Pleistocene—called Yedoma—are susceptible to thermoerosion due to their high ice content (up to 80 vol-%) [20,21]. The Yedoma domain (Yedoma deposits covered by sediment layers from the Pleistocene and Holocene), is suggested to store about 6 to 8 times (15–23 kg N m−2, total: 40–60 Pg N) [22] more N than permafrost–affected peatlands (4.2 kg N m−2, total: 7.1 Pg N) [23], for an area only 1.5 times larger. However, permafrost–affected peatlands are more commonly discussed as N hotspots [7], but N release from thawing Yedoma coasts represents an important source of N losses into aquatic systems [6,24]. About 78% of the coastal regions of the Laptev Sea are already affected by thermoerosion [25], and retrogressive thaw slumps (RTS)—typical features formed by abrupt permafrost thaw—are frequently observed along riverbanks and coastlines [26,27,28]. Fuchs et al. [24] reported that 0.4 × 10⁶ kg of N were exported annually from Sobe-Sise Island (Siberia) into the Lena River between 2015 and 2018. Nitrogen in form of nitrate is particularly mobilized into the Lena River in winter months [29].
Thermoerosion could favor N mineralization (sum of ammonification and nitrification) and in this way N losses by affecting moisture, temperature, texture, pH, as well as organic matter distribution in soils [3,30]. N mineralization in Yedoma sediments was found to be functionally limited by a low abundance of ammonia oxidizers [6,31]. As ammonia-oxidizing bacteria and archaea are most abundant in the active layer [32], N mineralization in Yedoma sediments might be favored by being mixed with younger sediments through erosion. Furthermore, mixing organic-rich topsoils with carbon (C) limited mineral subsoils, could stimulate soil organic matter (SOM) decomposition through priming [33,34]. Specifically, reduced competition for N between plants and microbes due to the abrasion of the vegetation cover could enhance the microbial transformation of N and thus N losses. To date, it has not been elucidated how the stabilization of RTS by revegetation affects N availability and greenhouse gas (GHG) emissions [6,26].
In this study, we investigate potential N and C release from non-vegetated and revegetated soils with different origins from a retrogressive thaw slump (RTS) formed at a coastal Yedoma cliff on Kurungnakh island in the Lena River Delta (Siberia). We hypothesize (I) that revegetated soils have a lower N availability and thus lower N2O production due to plant N uptake. We further suggest (II) that anaerobic N2O production is predominately limited by substrate availability and that nitrate additions would stimulate N2O production via denitrification. Due to different soil origin and landscape processes, we further expect (III) enhanced N availability, N2O production, and (IV) total release of CO2eq from soils where erosion mixed the Holocene cover with Pleistocene aged Yedoma deposits (slump floor) than from soils consisting only of Yedoma (thaw mounds).

2. Materials and Methods
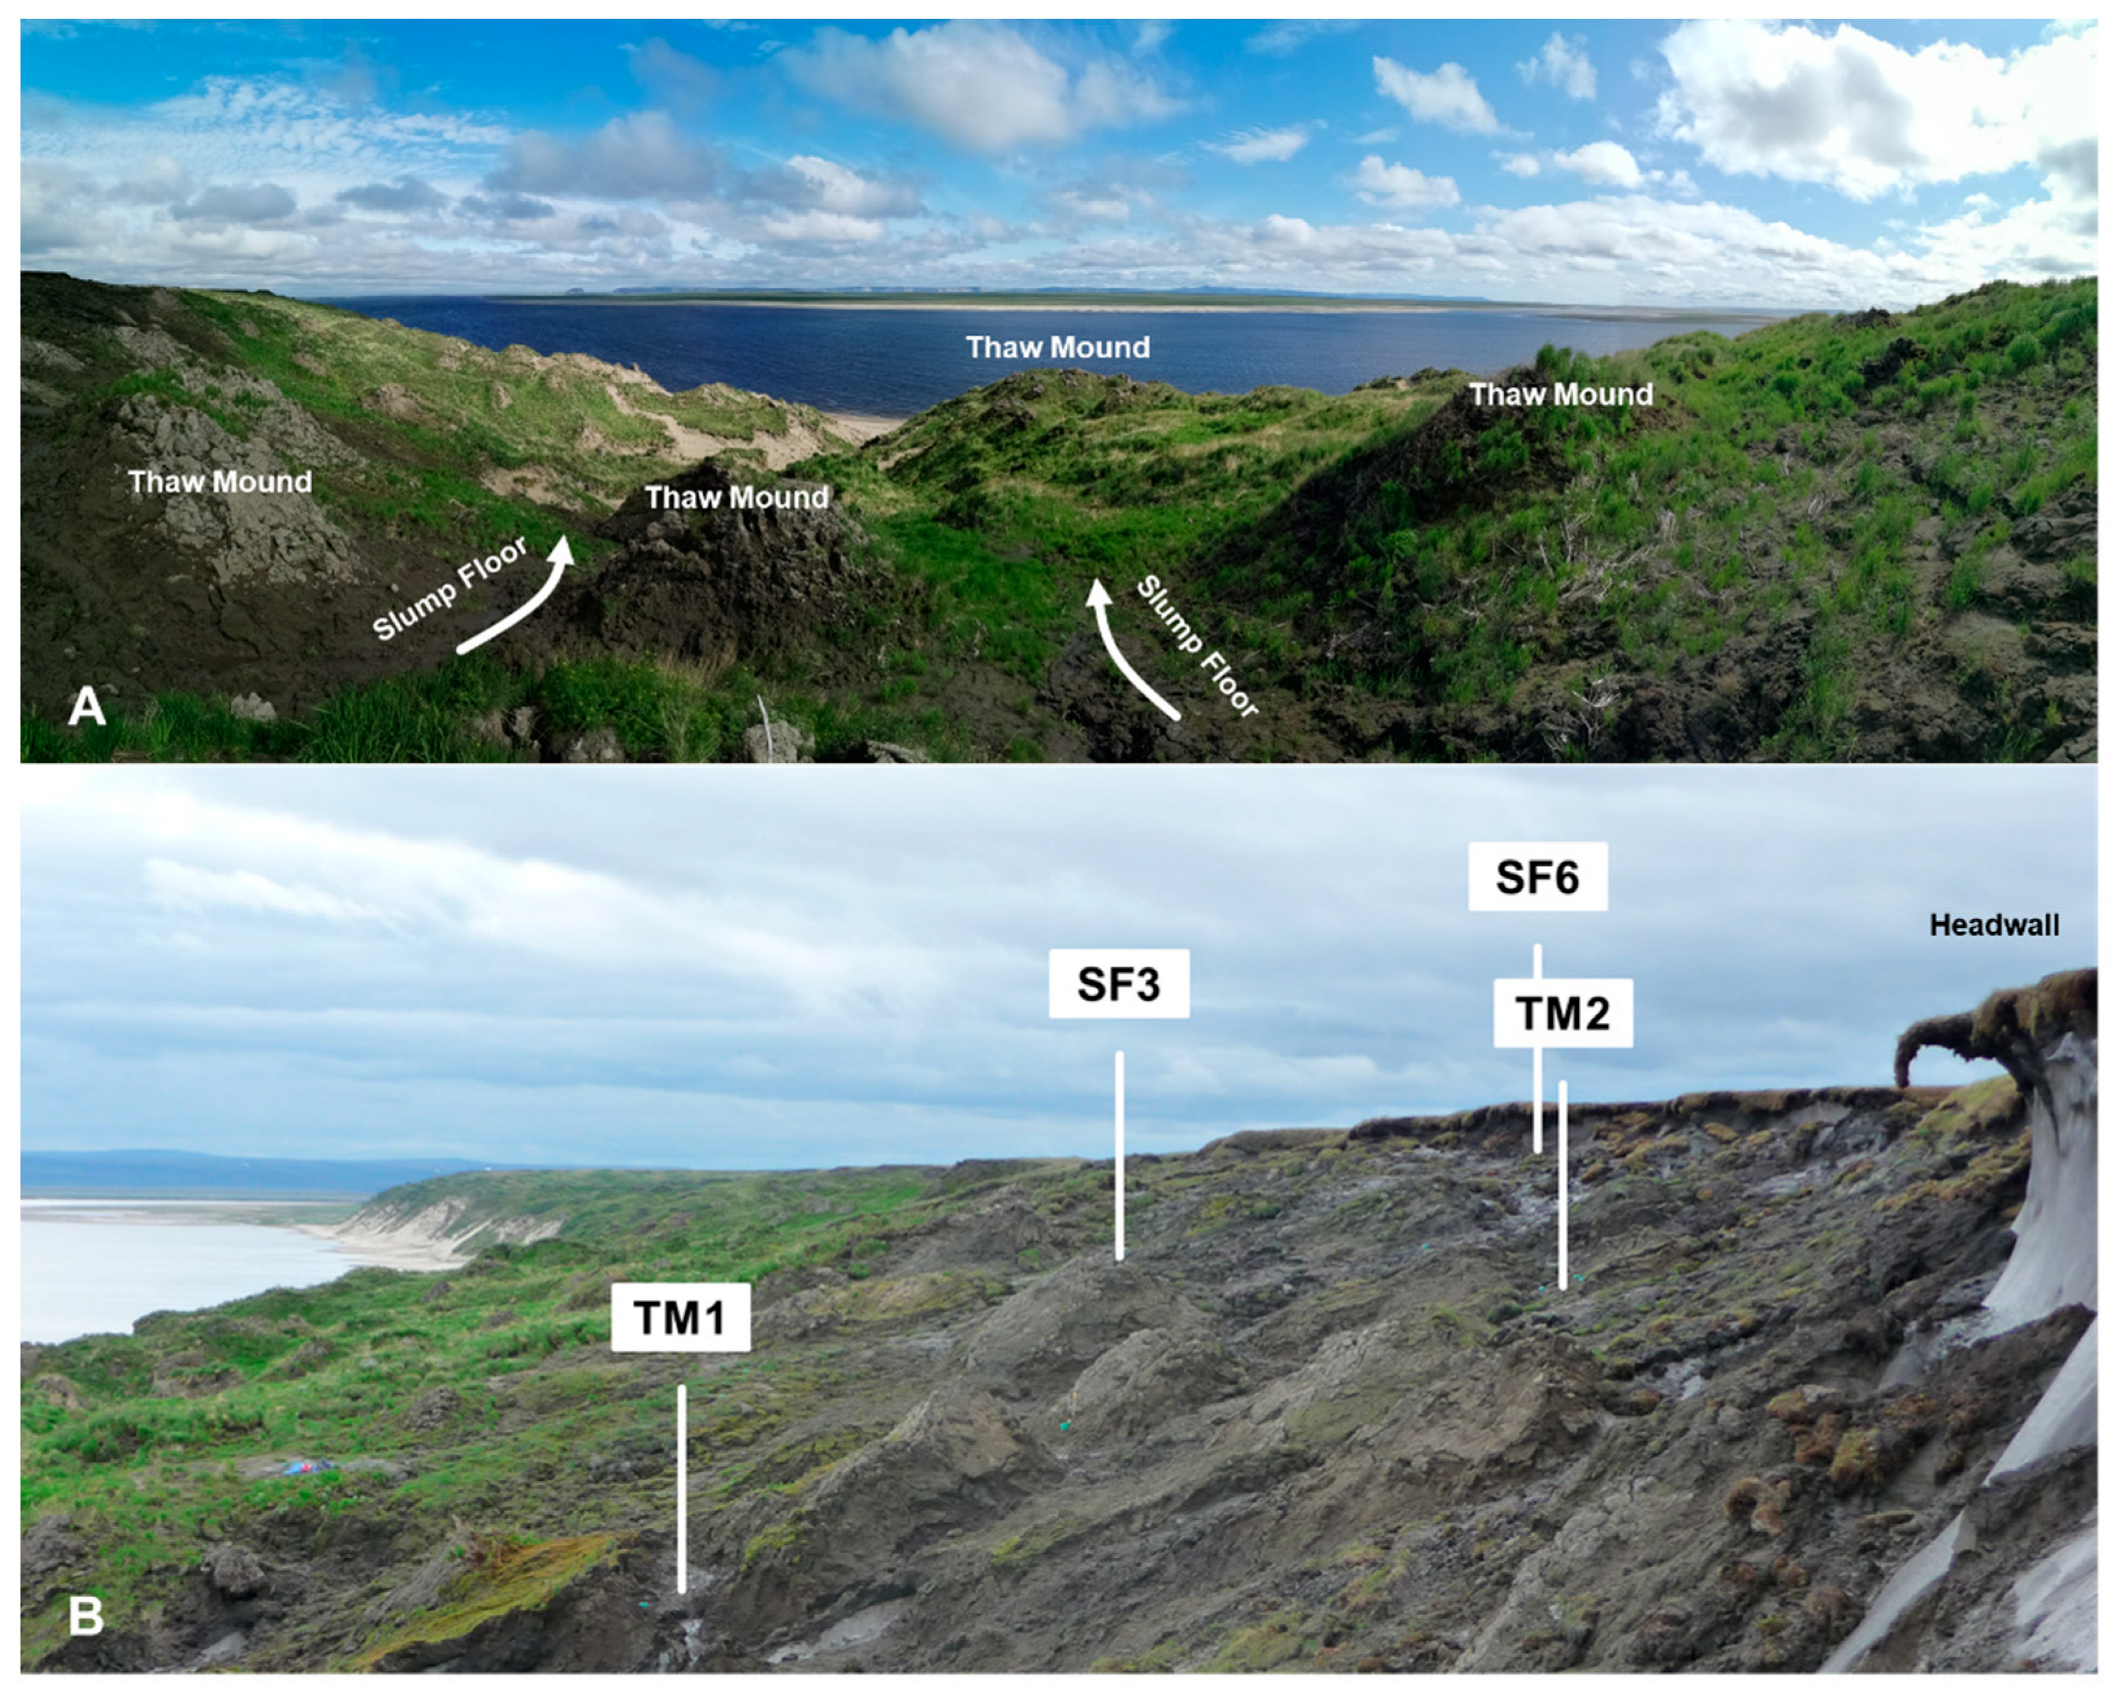
2.1. Study Sites

The studied thaw slump is located in the southeast of the island Kurungnakh within the Lena River Delta in North Siberia (72.339° N, 126.292° E). The study area is underlain by continuous permafrost and is characterized by a continental Arctic climate. The average annual air temperature and average annual rainfall measured on the neighboring island Samoylov are −12.3 °C and 169 mm, respectively [35]. Soil temperatures at 6 cm depth vary between −28 and 10 °C [36]. On Kurungnakh, ice-rich Yedoma sediments with large ice wedges, which formed during the Late Pleistocene, are covered by Holocene deposits [37]. Combined rapid permafrost thaw and thermoerosion of the massive ice–complex led to the formation of a retrogressive thaw slump (RTS). By erosion of the headwall, surface vegetation and deposits from the Holocene and Pleistocene (Yedoma) got mixed and transported down the slope, forming the slump floor (SF). The former polygon centrers—baydjarakhs (russ.) or thaw mounds (TM)—are exposed within the slump floor (Figure 1). They are not affected by relocation and consist only of Yedoma deposits. All soils were classified as Protic Cryosols due to the presence of permafrost and missing soil horizon development [26]. The plant cover at the thaw slump was disturbed, but increasing revegetation could be observed between 2013 and 2019. Revegetated sites are covered with mosses, grasses like Puccinellia neglecta, and herbs such as Tephroseris palustris and Descurainia sophioides. According to Laschinskiy et al. [38], the thaw slump can be classified into the first and second phases of plant succession after thermoerosion.

2.2. Soil Sampling and Sample Preparation

Soil samples were taken in July 2019 from revegetated (V) and non-vegetated (NV) sites from two different spots from the slump floor (sites SF3 and SF6) and two different thaw mounds (sites TM1 and TM2) (Figure 1 and Figure S1, Table S1). Due to the retrogression of the headwall, the sites have been thawing for different lengths of time. Soils from sites SF6 and TM2 were more recently thawed than soils from sites SF3 and TM2 (Figure 1). Unlike all other revegetated sites, soils from site SF6, which were closest to the headwall, were only covered by mosses and not by grasses (Figure S1). In 2019, the thaw mound at site TM1 was already partly eroded and samples were taken at a lower part while TM2 was still intact and samples were taken from the upper part of the thaw mound. Surface waters accumulated at the sampled slump floor in July 2019, while the sampled thaw mounds were well drained and had large cracks penetrating up to 40 cm into the soil. From the surface down to the permafrost (Table 1) (30 to 110 cm), two to five soil samples (depending on sampleable material) as independent replicates were taken every 10 cm to account for small–scale variability. Samples were transported frozen (−18 °C) to Hamburg (Germany), and composite samples between 0–10 and 10–20 cm (Figure S2) were created in a N2 (purity: 5.0) flushed glove box under near anoxic conditions. We also analyzed subsoil samples from site TM2 NV (20–40 cm and 40–70cm, Figure S2), which are presented in the Supplementary Material (Table S2).

2.3. Soil Analysis

After creating composite samples (see above), soils were sieved (<2 mm) and soil water content (WC) was determined by the weight difference between fresh and samples which were dried for 24 h at 105 °C. Bulk density (BD) was determined for each depth interval (0–10 and 10–20 cm) by subtracting the water content from the mass of the volumetric fresh samples. For composite samples, the mean BD from 0–10 and 10–20 cm was calculated. Particle density (PD) was determined by a gas (He) pycnometer (AccuPyc II 1340, Micromeritics Instrument Corporation, Norcross, GA, USA). The water-filled pore space (WFPS) was calculated according to Haney and Haney (2010) [39] on basis of WC, mean BD, and PD. Dried samples were analyzed for total carbon (TC) and nitrogen with an elemental analyzer (VarioMAX, Elementar Analysensysteme GmbH, Hanau, Germany). Delta δ15N in bulk soil was determined using IRMS (Thermo Delta V Plus, Thermo Fisher Scientific, Bremen). Soil pH was measured in a suspension of 2 g fresh soil in 5 mL deionized water with a potentiometric pH–meter (Typ CG820, Xylem Analytics Germany Sales GmbH & Co. KG., Weilheim, Germany). Dissolved inorganic nitrogen (DIN) was extracted from 5 g fresh soil in 20 mL 0.0125 M CaCl2. Ammonium was analyzed photometrically at 655 nm [40] (DR 5000, Hach Lange GmbH, Düsseldorf, Germany) while nitrite and nitrate were analyzed by high-performance liquid chromatography (HPLC) (1200 Series, Agilent Technologies, Santa Clara, CA, USA). Total dissolved nitrogen (TDN) was determined by extracting 12.5 g fresh soil in 50 mL 0.5 M K2SO4 and analyzed by a TOC/TON analyzer (Shimadzu TNM–L, Shimadzu Corporation, Kyoto, Japan) [41]. Dissolved organic nitrogen (DON) was calculated by subtracting DIN from TDN. Water–extractable organic carbon (WEOC) was determined according to Surey et al. [42] by suspending 10 g dry soil in 100 mL deionized water and a subsequent analysis by a TOC/TON analyzer (Shimadzu TNM–L, Shimadzu Corporation, Kyoto, Japan). Labile phosphorus (P) was extracted from 2.5 g air-dried soil in 0.02 M 125 mL calcium lactate solution with a pH of 3.6 [43] and subsequently analyzed photometrically at 882 nm [44] (Thermo Spectromic Genesys 10–S, Thermo Fisher Scientific, MA, USA).

2.4. Nitrogen Transformation

Net N transformation rates were determined by analyzing ammonium and nitrate concentrations from aerobic and continuously horizontally shaken (125 rpm) slurries which were incubated at 4 °C in a dark environment. Since a lag phase of microbial activity was expected during the first weeks [29], an incubation period of 40 days for nitrogen transformation and GHG production (see Section 2.5) was chosen in order to observe a maximal increase. On a clean bench, approximately 25 g of fresh and sieved soil and 100 mL phosphate buffer was weighed into 300 mL Erlenmeyer flasks with loose lids, enabling air exchange. The phosphate buffer was prepared by mixing 28 mL 0.2 M KH2PO4 with 72 mL 0.2 M K2HPO4 and 100 mL deionized water, followed by 1:100 dilution with deionized water and adjustment to pH 7.2 with 0.5 M HCl. Twice per week, samples from the slurry were taken with sterile pipette tips and centrifuged at 16,000 g for 10 to 20 min (20 min for organic-rich samples), and ammonium and nitrate concentrations were measured in the supernatants (as described above). Nitrate was analyzed directly after sampling while one part of the supernatant was frozen at −20 °C and analyzed later for ammonium. Since there was no constant increase in ammonium and nitrate over time, maximum net ammonification and maximum net nitrification rates were determined by calculating the maximal difference between the two measurements for ammonium and nitrate, respectively. On average, the maximum rates were observed after 20 days. Maximum rates of net ammonification and net nitrification were not necessarily observed between the same measurement points, therefore net N mineralization as the sum of ammonification and nitrification is not provided.

2.5. Greenhouse Gas Production in Anaerobic Laboratory Incubations

For the anaerobic incubation, 25 g of fresh unsieved soil was weighed into 100 mL glass flasks flushed with N2 under nearly anoxic conditions in a glove box. Subsequently, the headspace was flushed again with pure N2, and samples were incubated for 40 days at 4 °C in a dark environment. Headspace gas concentrations were analyzed with a gas chromatograph (7890 A, Agilent Technologies, Santa Clara, CA, USA) using a FID with methanizer for CO2 and CH4 and an ECD for N2O. Fluxes were calculated from cumulative gas production and gas dissolution in porewater calculated according to Carroll et al. [45] and Millero et al. [46] for CO2, Yamamoto et al. [47] for CH4 and Weiss & Price [48] for N2O. Carbon dioxide production was calculated based on a slope of a linear regression fitted to four measurement points. The mean of all slopes calculated over time is considered with the CO2 production rate. In contrast, for anaerobic CH4 and N2O production, there was no constant production observable, therefore maximal rates were calculated by the maximal difference between the two measurements. On average, the maximum rates were observed after 10 and 1 days for CH4 and N2O, respectively. CO2 equivalents (CO2eq) were calculated by multiplying production rates with the respective global warming potential (GWP) of a 100-year horizon (CH4 × 34; N2O × 298) [13]. CO2eq was given as the sum of all three GHG.

2.6. Nitrate Addition

After four weeks (28 days), 1 mL of 152 mM sterilized nitrate (KNO3) was added through a septum into the anaerobically incubated flasks, after they were flushed with pure N2. The added nitrate concentration was based on the highest concentration measured in samples from site TM1 V (110 µg N gDW−1). GHG production rates were determined before and after the substrate addition and were treated separately. By adding 1 mL KNO3 to the soil, the WFPS increased by about 10% (Figure S3). At the time nitrate was added, N2O concentrations in the headspace were declining or zero.

2.7. In–Situ N2O Fluxes

In–situ N2O fluxes from the soil surface were quantified only from non-vegetated sites with triplicates for each site on three different days in July 2019. At site TM2 NV only two measurement days were possible. Fluxes were measured by static closed chamber measurements and subsequent GC–ECD analysis of headspace gas samples. For each measurement, an opaque gas chamber (volume: 0.01 m3) was placed on top of the pre-installed collars (diameter: 24.2 cm) and the headspace was mixed by an internal fan. Collars were installed 24 h before the first measurement. Headspace gas concentrations increased differently with time, therefore five gas samples were taken in varying time intervals between 10 and 25 min from a three-way–valve installed on top of the chamber using a syringe (Braun Melsungen AG, Melsungen, Germany). The samples were directly transferred to pre–flushed (N2) and subsequently evacuated 12 mL glass vials (Exetainer®, Labco Limited, Lampeter, UK) and stored under overpressure. Nitrous oxide concentrations of the gas samples were measured after six months using a GC–ECD (7890 A, Agilent Technologies, Santa Clara, CA, USA). Nitrous oxide emissions were calculated from the linear increase of N2O concentrations in the chamber over 10 to 20 min, temperature, chamber volume, and collar area. Average flux rates from 2 to 4 sampling dates (Table S6) are presented.

2.8. Statistics

Statistical analyses were conducted with IBM SPSS STATISTICS 27. Normal distribution was tested by applying the Shapiro–Wilk test (p > 0.05) and visual consideration of Q–Q plots and histograms. Correlations for non–parametric data sets were determined by using the Spearman test while parametric data sets were correlated by the application of the Pearson test. Correlations were calculated based on topsoil and subsoil samples including 30 samples. Due to the limited amount of sample material, correlations with WEOC were only based on 22 topsoil samples. Statistically, significant differences were tested between slump floor and thaw mound topsoils, revegetated (V) and non-vegetated (NV) slump floor topsoils, as well as between revegetated (V) and non-vegetated (NV) thaw mound topsoils (Table 2). The Mann–Whitney–U test (p < 0.05) was applied to test significant differences for non–parametric datasets. Parametric data sets were first tested on variance homogeneity with the Levene test (p > 0.05), followed by a t-test (p < 0.05) for equal variances or Welch–test (p < 0.05) for unequal variances.

3. Results

3.1. Soil Properties

Soil properties of slump floor and thaw mound soils differed in most of their physical and chemical properties (Table 1). Slump floor soils were generally wetter with higher WC and WFPS as they were more strongly affected by meltwaters from the headwall while thaw mound soils were drier with lower WC and WFPS due to the increased drainage by cracks and their exposed position (Figure S3). Since site TM1 was already partly eroded in 2019, samples were taken at a lower location which likely resulted in a higher water content relative to site TM2 (sampled at the top of the thaw mound). Slump floor soils had a moderately acidic pH (5–6), while thaw mound soils had a moderately alkaline pH (7–8). The average total carbon (TC) (t-test, p < 0.01) and C/N ratio (Mann–Whitney–U test, p < 0.01) were significantly higher in slump floor (TC: 3.4–6.5%; C/N: 15.3 to 19.2) than in thaw mound soils (TC: 2.0–4.4%; C/N: 12.8–14.4). No significant contrasts were observed for WEOC and P between slump floor (WEOC: 1302–2083 µg C (g DW)−1; P: 7.0 to 18.6 µg P (g DW)−1) and thaw mounds (WEOC: 753–1919 µg C (g DW)−1; P: 9.0 to 22.9 µg P (g DW)−1). However, most of the parameters were enhanced in the revegetated soils, but this observation was only significant for soil pH (Welch, p < 0.01), C/N ratio (Mann–Whitney–U test, p < 0.05), and WEOC (Welch, p < 0.05) in slump floor soils.

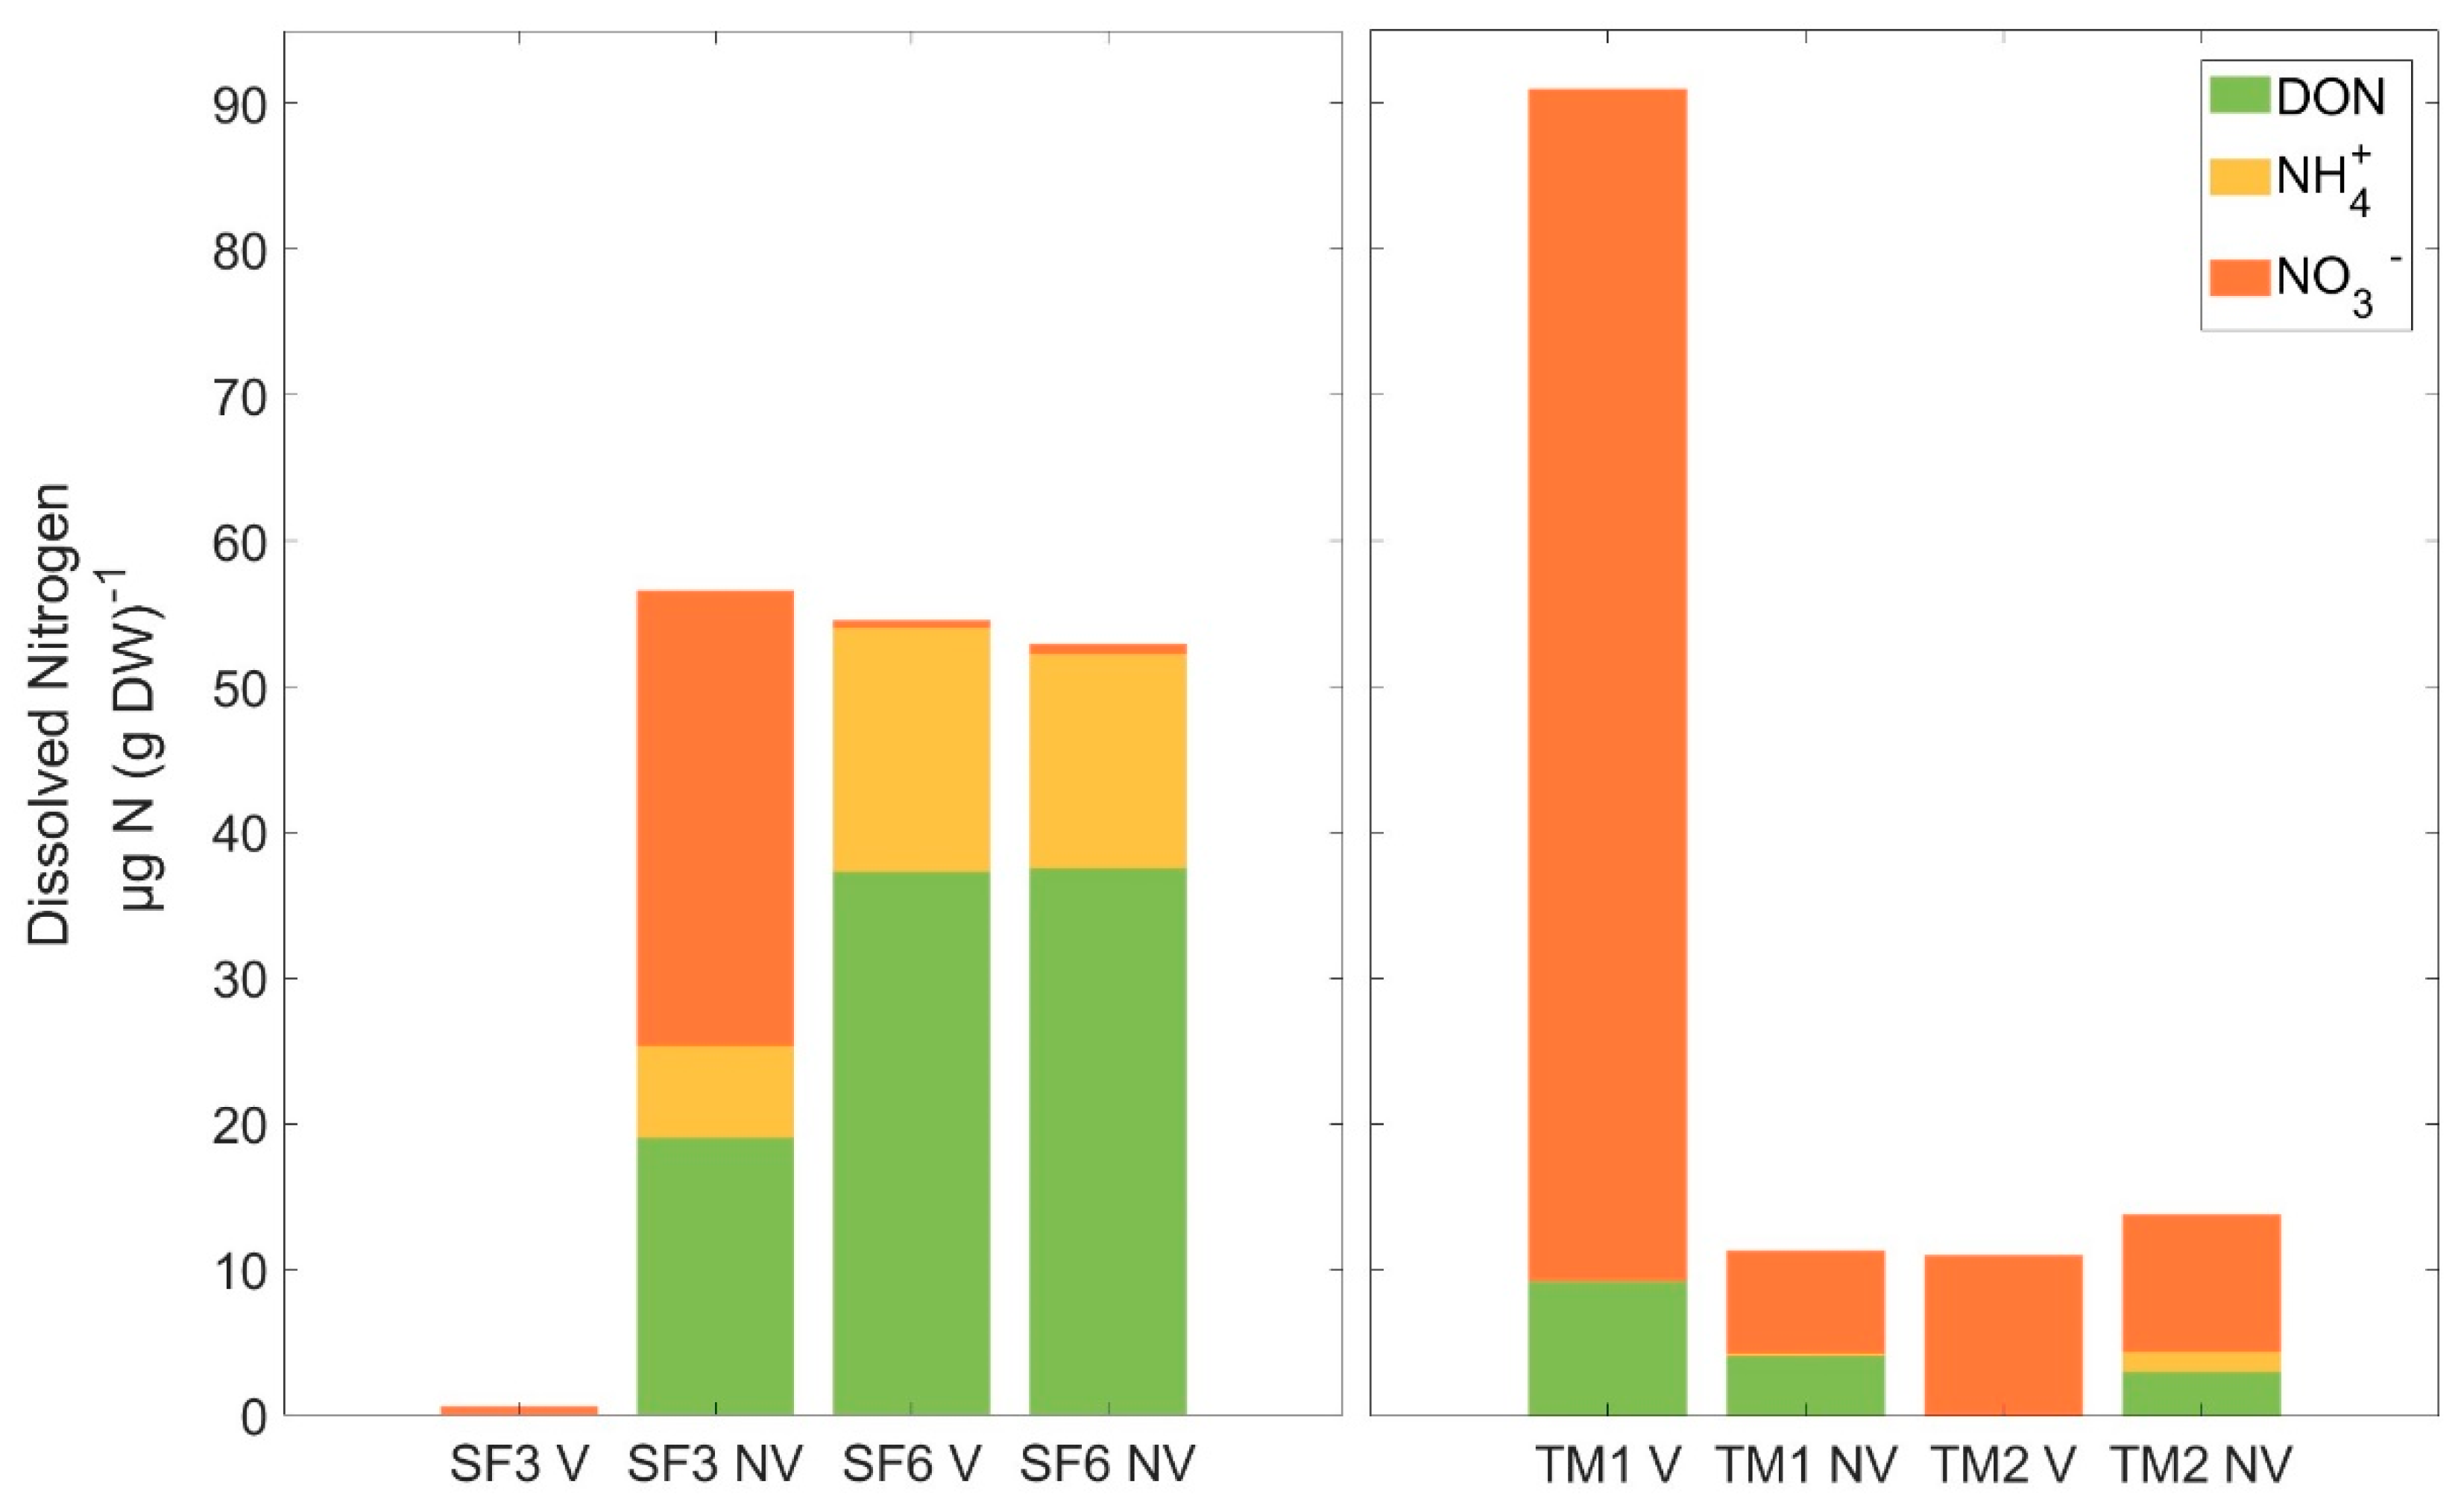
3.2. Nitrogen Pool Composition

Slump floor soils had significantly higher DON (19.05–37.54 µg N (g DW)−1) and ammonium (0.06–16.73 µg N (g DW)−1) concentrations (Mann–Whitney–U test, p < 0.01) than thaw mound soils with low DON (3.06–9.30 µg N (g DW)−1) and ammonium concentrations close to the detection limit. In contrast, nitrate concentrations were significantly higher in the thaw mounds (7.05 to 81.64 µg N (g DW)−1) (Mann–Whitney–U test, p < 0.01) and near zero in the slump floor, except at site SF3 NV where the second highest nitrate concentration was measured (mean ± standard deviation: 31.23 ± 6.20 µg N (g DW)−1) (Figure 2, Table S3). Soils from site SF3 NV contained relatively high amounts of DON (19.05 ± 4.22 µg N (g DW)−1) and ammonium (6.31 ± 2.36 µg N (g DW)−1) in comparison to thaw mound soils, where high nitrate concentrations were observed together with relatively low DON and ammonium availability. While in slump floor soils DON exceeded DIN (not at site SF3 NV), in thaw mound soils DIN exceeded DON due to high nitrate availability. There was 1.6 times more DIN and 3.2 times less DON in thaw mounds than in the slump floor. Nitrogen availability was generally enhanced in non-vegetated slump floor soils in comparison to revegetated slump floor soils, but only for nitrate significant (Mann–Whitney–U test, p < 0.05). However, this statistical significance was caused by high nitrate con-centrations in samples from site SF3 NV. Revegetation had no significant effect on N availability in thaw mounds, but nitrate concentrations were relatively enhanced in revegetated thaw mounds and the highest nitrate concentration was measured in soils from site TM1 V (81.64 ± 24.37 µg N (g DW)−1). Dissolved organic nitrogen correlated positively with C/N ratio (R = 0.49, p < 0.01) soil pH (R = 0.55, p < 0.01), and ammonium (R = 0.78, p < 0.01) while ammonium correlated positively with C/N ratio (R = 0.63, p < 0.01) and δ15N in bulk soil (R = 0.51, p < 0.01) but also negatively with WFPS (R = −0.38, p < 0.05). Delta δ15N in bulk soil correlated negatively with WC (R = −0.73, p < 0.01) and WFPS (R = −0.73, p < 0.01). There was no similar correlation with nitrate. None of the samples contained nitrite.

3.3. Nitrogen Transformation

Under optimal laboratory conditions (oxygen supply and neutral pH), net ammonification, as well as net nitrification were positive (uptake < production) in all soils, and only in soils from site SF6 NV no nitrification was observed (Table 3). Soils from site SF6 NV had the highest net ammonification rates (69.51 ± 5.26 ng N (g DW)−1 day−1). However, in all other samples, net nitrification rates exceeded net ammonification rates and were on average about 22 times higher. Net ammonification rates were significantly higher in the slump floor than in the thaw mounds (Welch, p < 0.01), varying between 23.25 to 69.51 ng N (g DW)−1 day−1 in slump floor and 1.97 to 7.60 ng N (g DW)−1 day−1 in thaw mound soils. However, there was no statistically significant difference in net nitrification between slump floor and thaw mounds (Mann–Whitney–U test, p = 0.406) (SF: 0.00–1088.40 ng N (g DW)−1 day−1; TM: 197.13–1437.41 ng N (g DW)−1 day−1). Revegetation had no significant impact on N transformation rates. Net ammonification and net nitrification were not correlated. Additionally, net ammonification correlated positively with TC (R = 0.54, p < 0.01), WC (R = 0.30, p < 0.40), anaerobic CO2 (R = 0.63, p < 0.01), CH4 (R = 0.68, p < 0.01), and N2O (R = 0.49, p < 0.01) production, and additionally negatively with soil pH (R = −0.52, p < 0.01), as well as with nitrate (R = −0.54, p < 0.01). None of these parameters correlated with net nitrification.

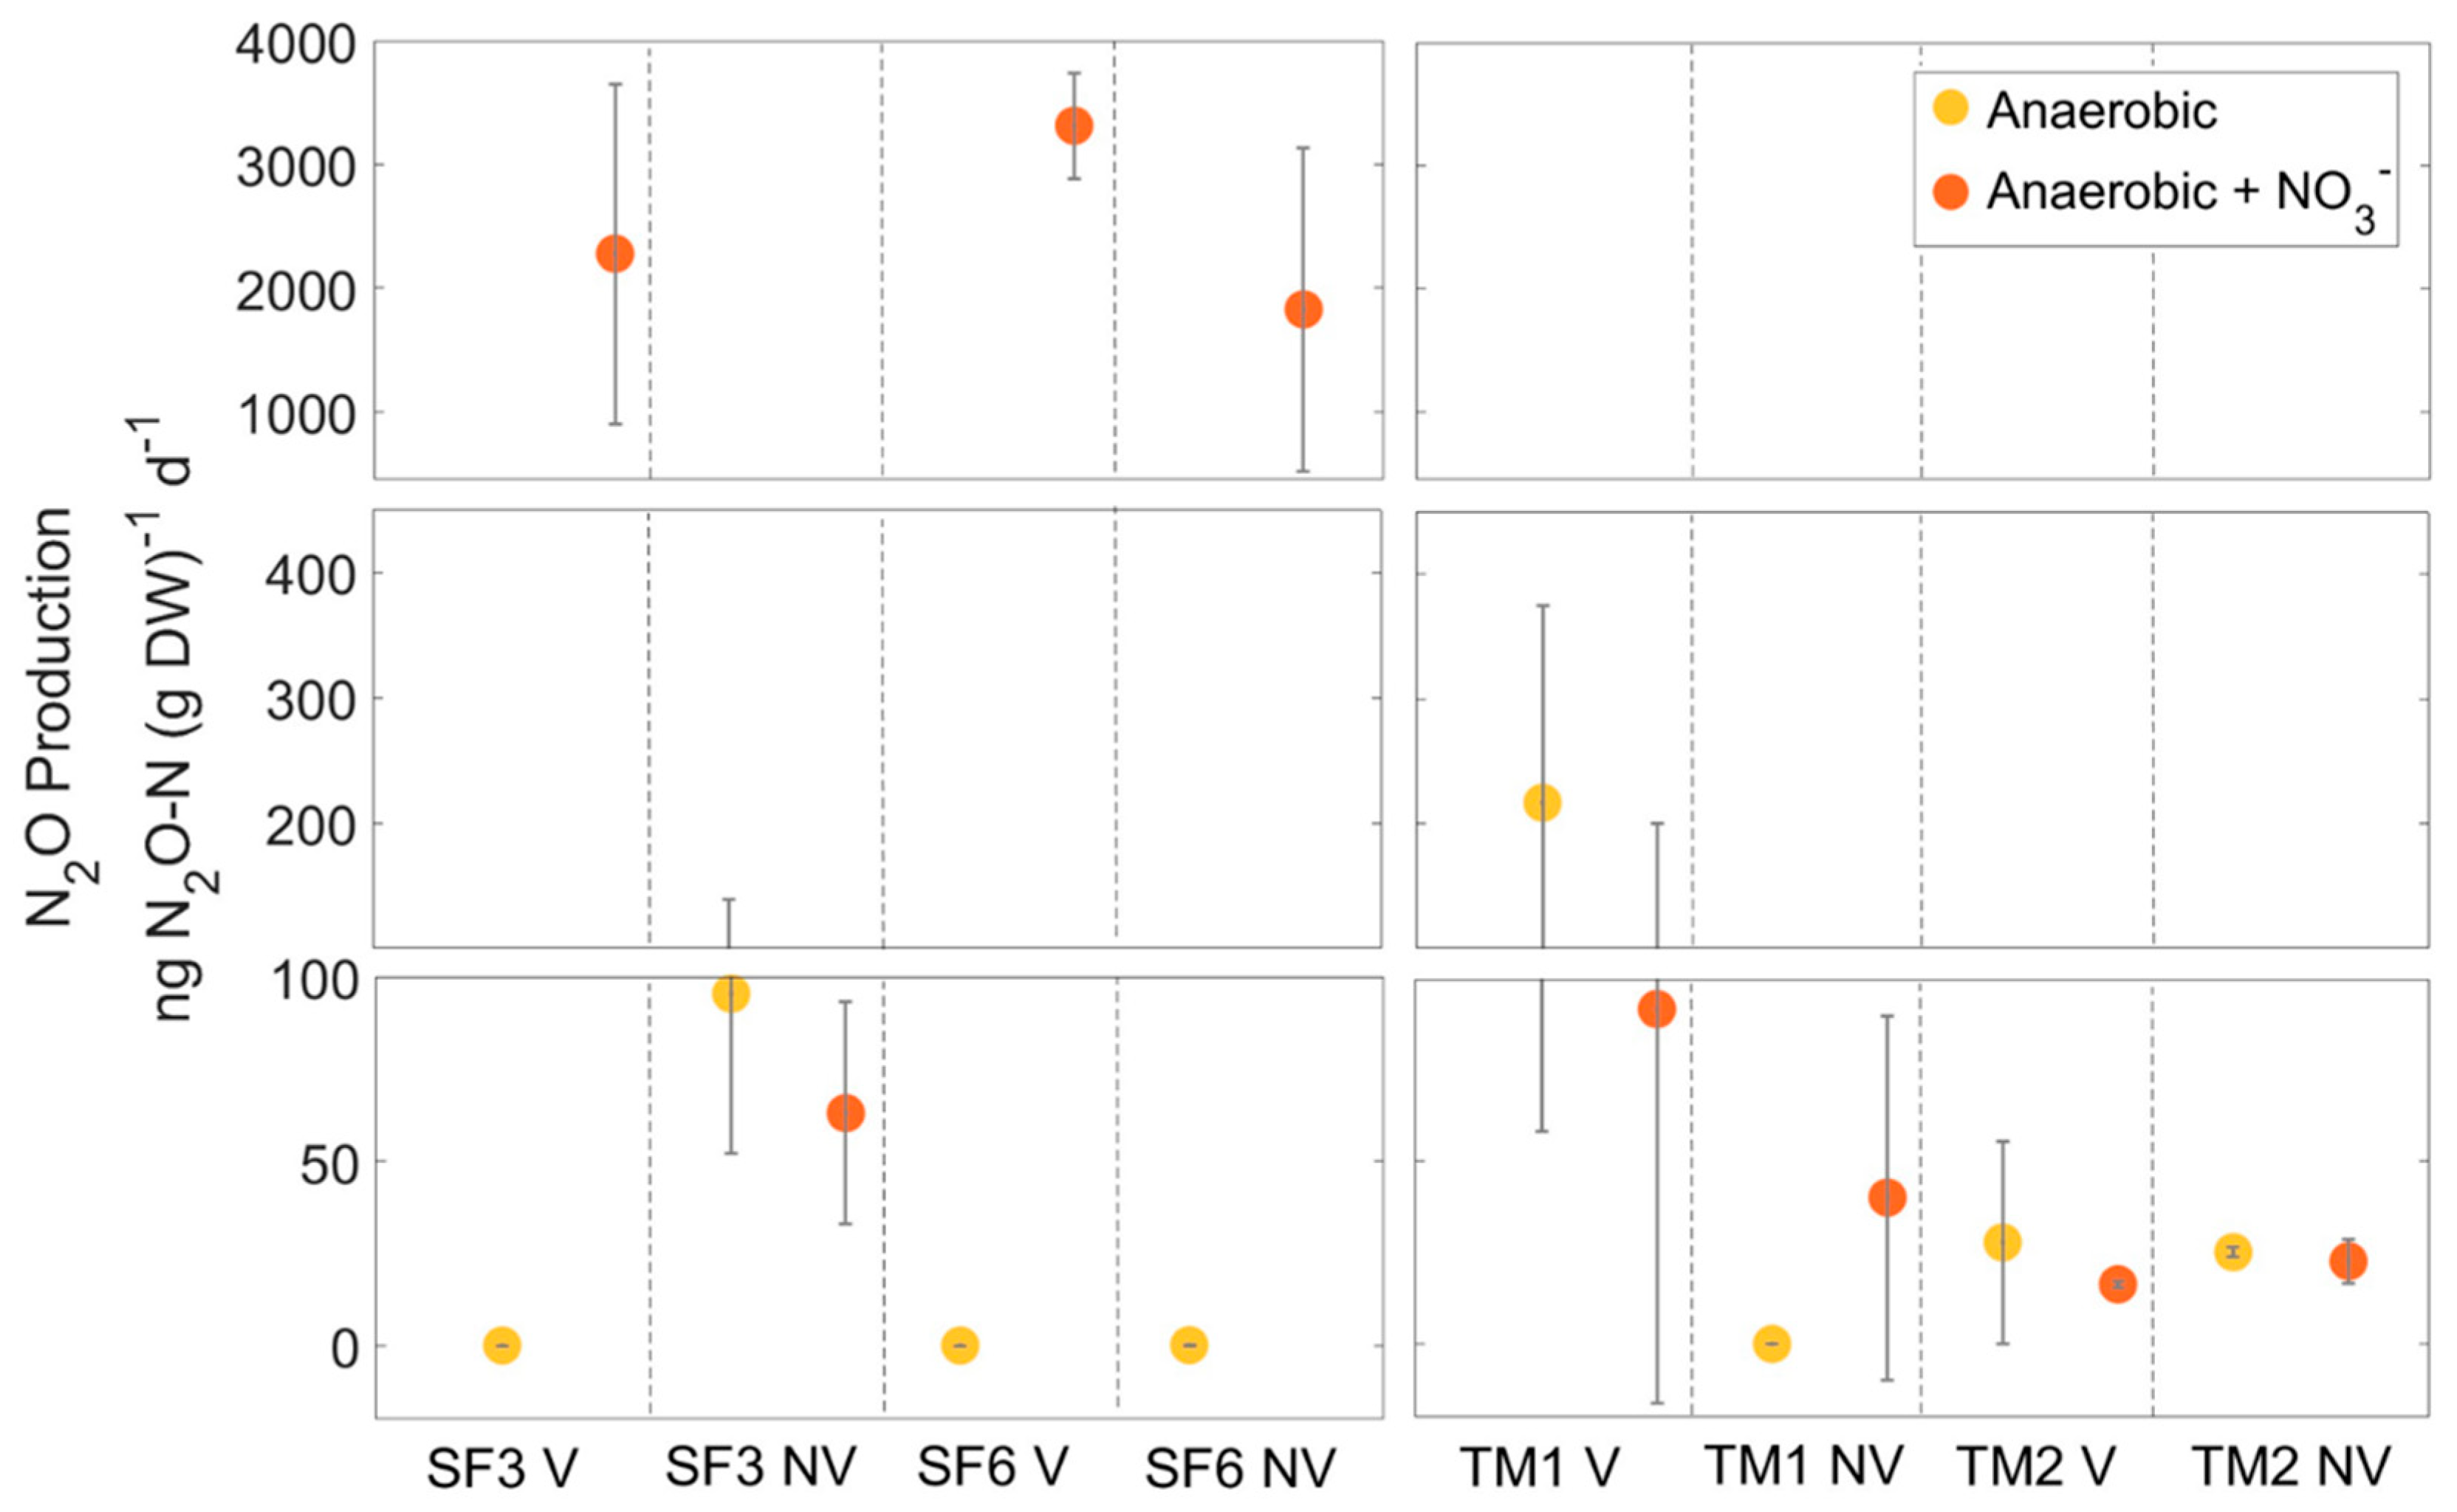
3.4. Anaerobic N2O Production and In–Situ N2O Fluxes

Anaerobic N2O production was most strongly dependent on initial nitrate availability (R = 0.74, p < 0.01) thus high N2O production rates were observed particularly from thaw mound soils (0.00 to 216.63 ng N2O-N (g DW)−1 day−1) while N2O production from slump floor soils was near or below the detection limit, except for site SF3 NV where the second highest N2O production was observed with 95.43 ± 43.21 ng N2O-N (g DW)−1 day−1 (Figure 3, Table S4). Revegetation significantly decreased N2O production in the slump floor (Mann–Whitney–U test, p < 0.05), but significance was caused by high N2O production from site SF3 NV soils. Nitrous oxide production was elevated in revegetated thaw mounds, but not statistically significant (Mann–Whitney–U test, p > 0.05). The highest N2O production was determined from soils from site TM1 (216.63 ± 158.25 ng N2O-N (g DW)−1 day−1). In addition, we noticed that soils from site TM1 NV did not produce N2O, although having higher nitrate concentrations than slump floor soils (7.05 ± 6.26 µg N (g DW)−1). Nitrous oxide production correlated moderately with the WC (R = −0.46, p < 0.05), but not with the WFPS. Anaerobic N2O production correlated positively with WEOC (R = 0.52, p < 0.05) and δ15N in bulk soil (R = 0.49, p < 0.01), but not with P.
After 28 days, nitrate was added to the incubation flasks to evaluate whether denitrification in soils with missing N2O production was limited by substrate availability (Figure 3, Table S4). Nitrous oxide production increased significantly (Mann–Whitney–U test, p < 0.01) after nitrate addition in slump floor soils from zero up to 3312.74 ± 426.27 ng N2O-N (g DW)−1 day−1 (SF6 NV), but increased only weakly in thaw mound soils and in soils from site SF3 NV. Nitrous oxide production rates after nitrate addition correlated positively with carbon components as TC (R = 0.56, p < 0.01) and C/N (R = 0.47, p < 0.01) but not with WEOC or P. The headspace gas concentration was resampled after six months and N2O concentrations declined to near zero in all samples except in replicates from site SF3 V and SF3 NV, as well as from site TM1 V and TM1 NV where N2O concentrations declined slower and were still between 16 and 1867 ppm.
In–situ N2O fluxes were only measured from non-vegetated sites on three different days in July 2019 (Table 4). However, in–situ fluxes varied strongly between different days and ranged on average between 0.01 and 2.03 mg N2O-N m−2 day−1. Comparable to N2O production from the incubation, site SF3 NV, which had a high nitrate availability and an optimal WFPS, also produced the most N2O in–situ (2.03 ± 1.39 mg N2O-N m−2 day−1), but otherwise in–situ measurements did not follow the pattern of the incubation experiment.

3.5. Anaerobic CO2 and CH4 Production

Besides N2O, also CO2 and CH4 production from anaerobic laboratory incubations were measured (Table 4). Anaerobic CO2 production was on average 164 times higher than CH4 production and both rates were positively correlated (R = 0.64, p < 0.01). Carbon dioxide and CH4 production were both significantly higher (Mann–Whitney–U test, p < 0.01 for CO2 and p < 0.05 for CH4) from slump floor (CO2: 0.99–7.07 µg CO2-C (g DW)1 day1; CH4: 0.00 to 65.46 ng CH4-C (g DW)1 day1) than from thaw mound soils (CO2: 0.24–2.34 µg CO2-C (g DW)1 day1; CH4: 0.11–7.80 ng CH4-C (g DW)1 day1). Revegetation had only a positive statistically significant impact on CO2 (Mann–Whitney–U test, p < 0.01) and CH4 (Mann–Whitney–U test, p < 0.05) production from slump floor soils. Both, CO2 and CH4 production correlated positively with TC (R = 0.52–0.64, p < 0.01). We found a negative correlation for CO2 and CH4 with nitrate and N2O (R = −0.65 to −0.67, p < 0.01). Consistent with that, replicates from site SF3 NV, which contained the second highest nitrate concentration, had a 62 to 85% lower CO2 production (0.99 ± 0.33 µg CO2-C (g DW)1 day1) than other slump floor samples although WC and TC were in a similar range. As long as there was N2O in the headspace, we observed no CH4 production and after the N2O concentration declined, CH4 production started on the same measurement day even though no reliable strong production was indicatable within the observation period (Figure S4). In addition, samples, which did not produce N2O in the beginning but CH4, stopped producing CH4 after they were flushed with N2, and artificial nitrate was added (Figure S4). Carbon dioxide and CH4 production correlated also negatively with soil pH (CO2: R = −0.65, p < 0.01, CH4: R = −0.47, p < 0.01). Carbon dioxide production correlated additionally positively with DON (R = 0.38, p < 0.05) and WEOC (R = 0.64, p < 0.01).

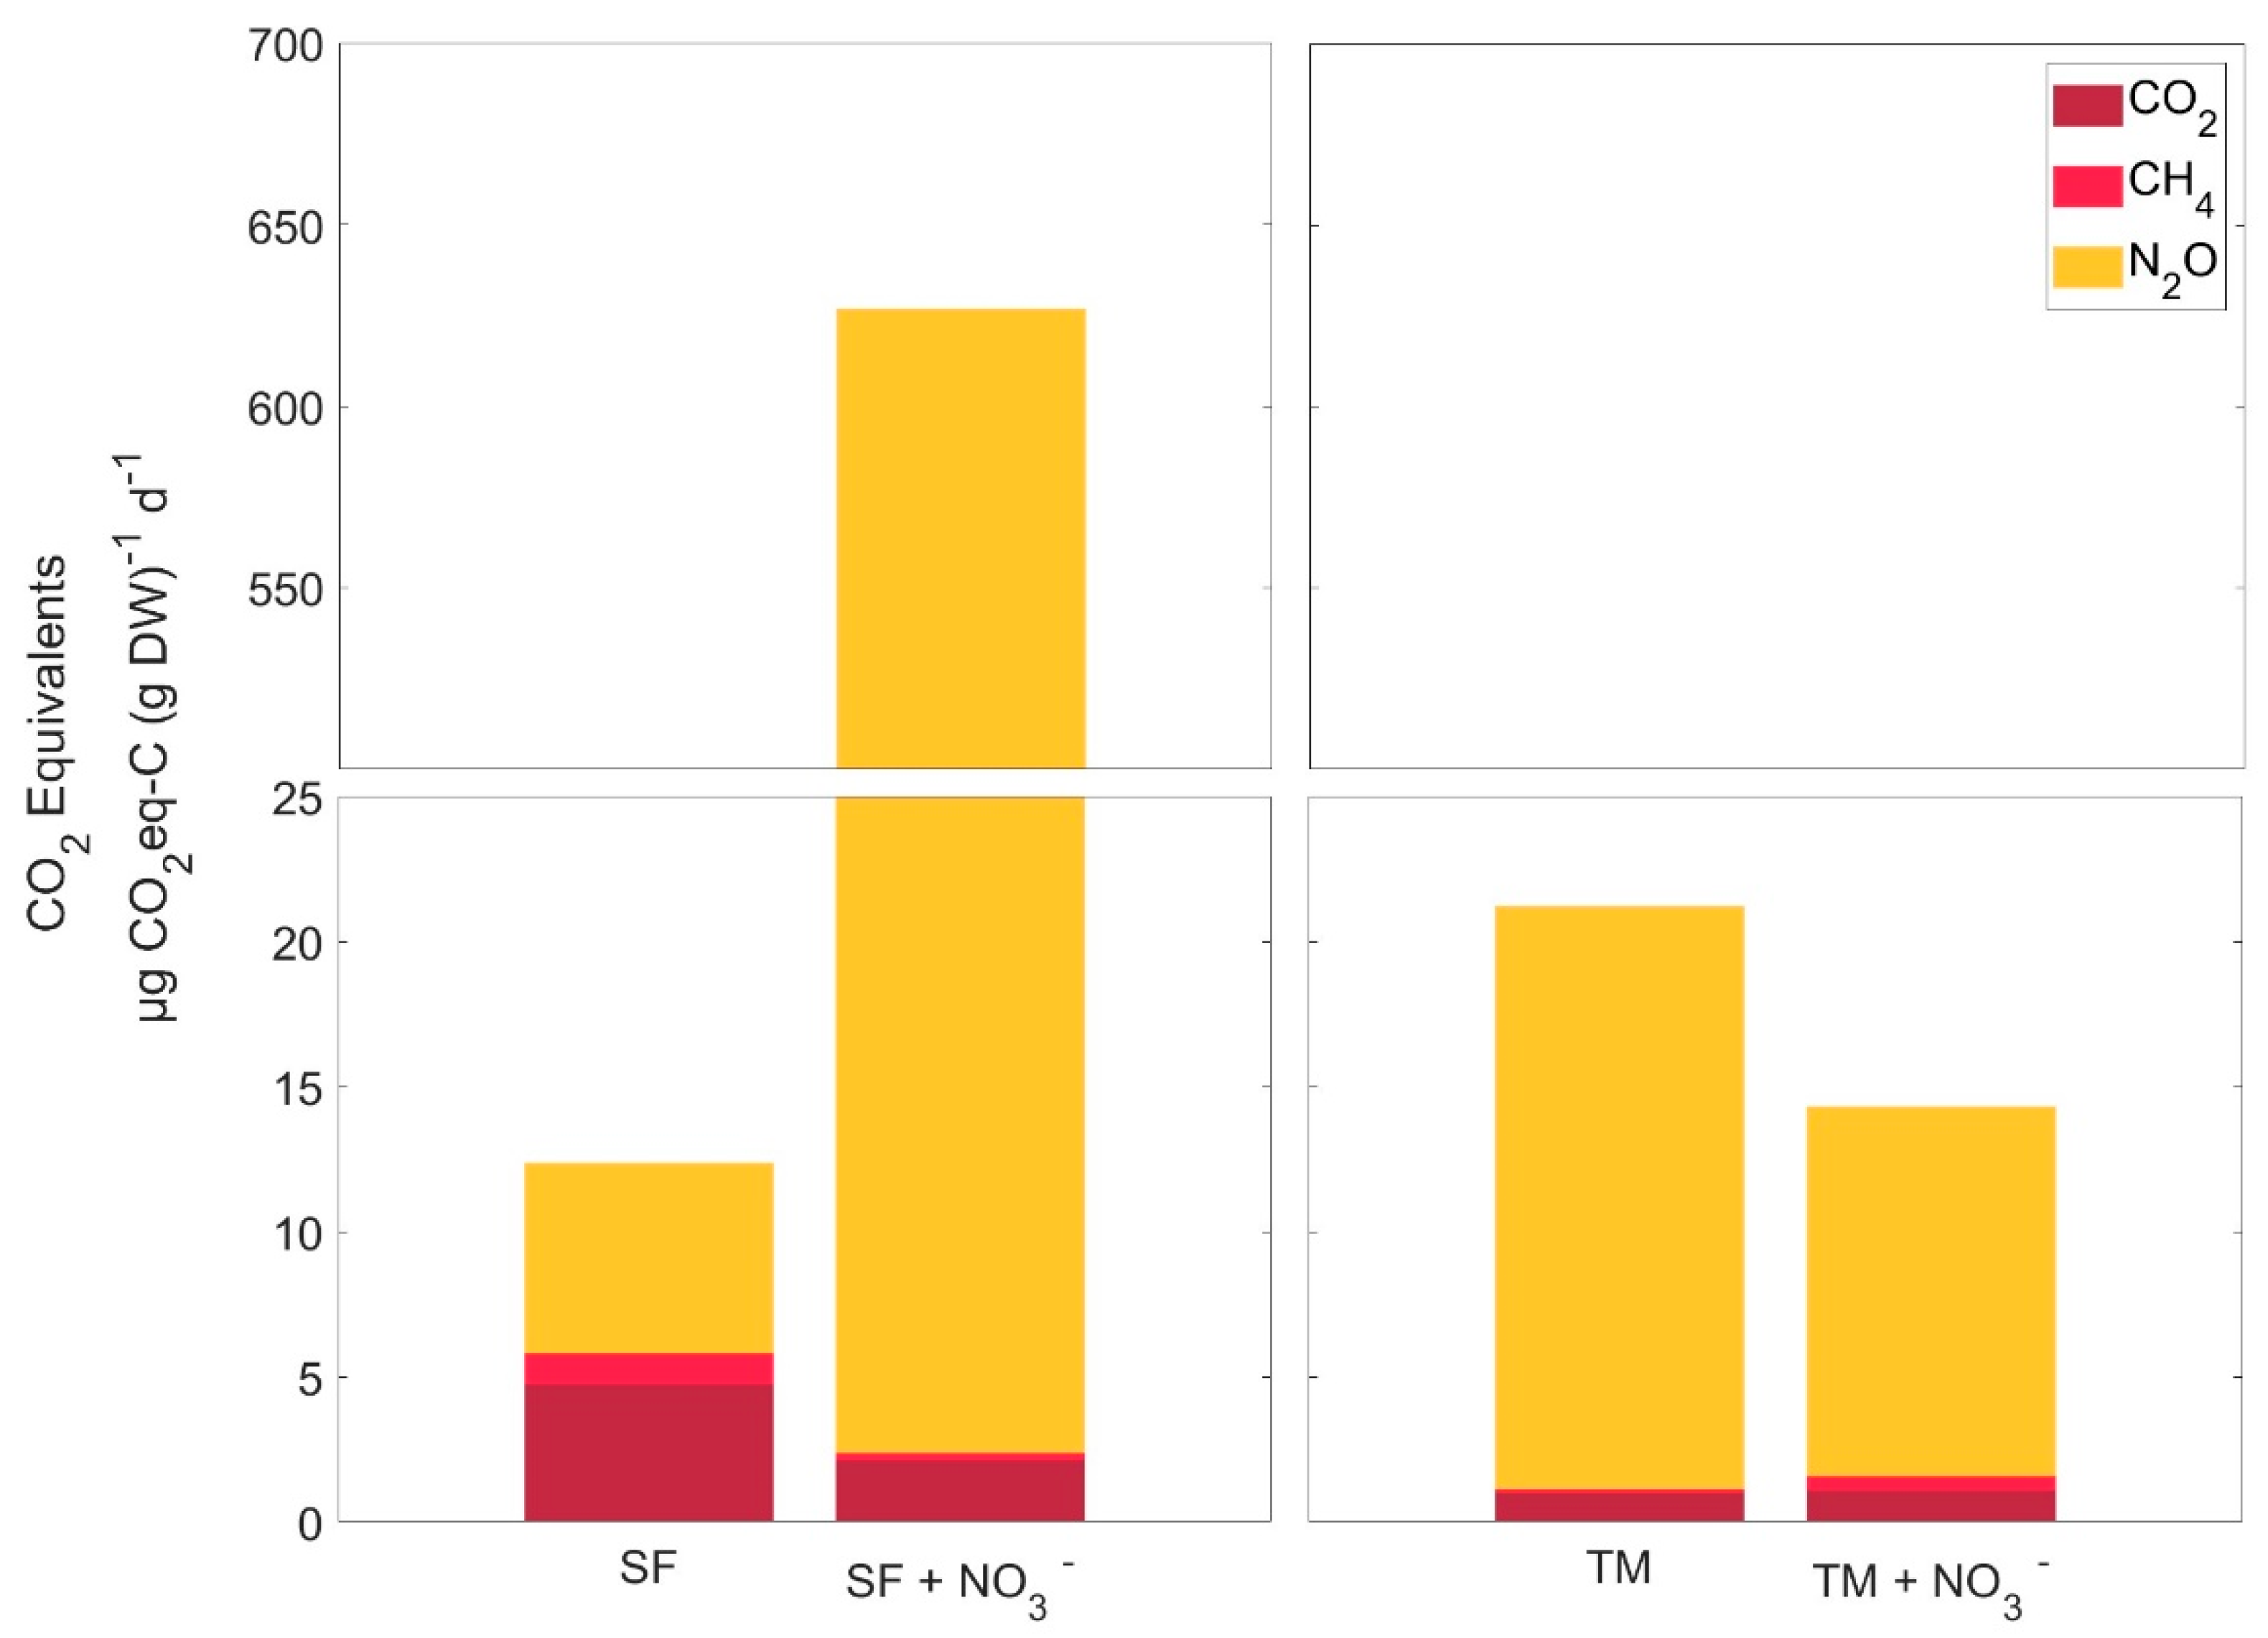
3.6. Anerobic Production of CO2 Equivalents

As long as no N2O production was observed in the anaerobic incubation, the production of CO2 equivalents (CO2eq) was dominated by CO2 (76–92%), otherwise, N2O was the major contributor (94–98%) (Figure 4, Table S5). Methane production had only a minor impact on CO2eq production (0–24%). No significant impact of revegetation was observed when GHG production was summarised as CO2eq. In general, CO2eq from the slump floor was dominated by CO2 (83%) (except site SF3 NV, high N2O production) while CO2eq from the thaw mounds mainly came from N2O (95%). Consequently, under anaerobic conditions, thaw mounds had the highest production of CO2eq (SF: 12.37 ± 11.63 µg CO2eq-C (g DW)1 day1; TM: 21.21 ± 35.16 µg CO2eq-C (g DW)1 day1). However, after nitrate was added, the production rates of CO2 and CH4 decreased from slump floor soils, but since N2O production increased, mean CO2eq were about 45 times higher than before nitrate addition (559.60 ± 35.73 µg CO2eq-C (g DW)1 day1). Since N2O production from thaw mound soils was less affected by nitrate addition, CO2eq slightly decreased (33%) if compared to the CO2eq from before.

4. Discussion

This study differentiated between slump floor (SF) and thaw mound (TM) soils within a RTS and found differences in soil properties, N availability, and GHG release. Differences can be attributed to different soil origins and landscape processes. Slump floor soils contain mixed Pleistocene and Holocene material and are actively affected by persistent erosion and meltwaters while thaw mound soils consist solely of Pleistocene Yedoma deposits and are less affected by disturbance due to their exposed position. Contrary to our hypotheses, revegetated thaw mounds had the highest N availability, produced the most N2O, and released more CO2eq than non-vegetated soils from the slump floor.

4.1. Nitrogen Availability

Most studies on Arctic permafrost soils describe higher N availability in the absence of vegetation [2,5,49,50] and a domination of DON over DIN, with higher ammonium than nitrate concentrations [3,51,52,53,54]. In general, Arctic ecosystems are N-limited, and available N is directly consumed by plants and microbes, often leading to a tight N cycle and negative N transformation rates [6,10,55,56,57,58]. Despite our expectations (I and III), we found the highest N availability in revegetated thaw mounds and not in soils from non-vegetated parts of the slump floor, suggesting that competition for N between plants and microbes is low and that N availability was affected by soil origin and landscape processes rather than by revegetation. Different from previous studies [3,51,52,53,54], we report that DIN, dominated by nitrate, exceeded DON in thaw mound soils. Nitrate concentrations in thaw mounds exceeded most of those reported from other (disturbed) permafrost–affected soils [15,16,19,51,52], but were in a comparable range to those reported from soils from Arctic lowlands of Canada [59], non-vegetated peat plateaus in the subarctic tundra of Russia [2], upland thermokarst soils on the Tibetan Plateau [5], and thaw mounds soils from a Siberian RTS [6]. Significantly smaller net ammonification rates in thaw mound than in slump floor soils, as well as lower DON and ammonium concentrations with simultaneously elevated nitrate concentrations, indicate a faster turnover of DON to nitrate by immobilization and nitrification in thaw mounds. Positive N transformation rates and higher net nitrification rates than the mean nitrification reported from permafrost–affected soils (−700 to −100 ng N (g DW)−1 day−1), [10], confirm that microbes at the thaw slump of Kurungnakh are not generally N limited. However, higher nitrate concentrations in thaw mounds might be not only due to an enhanced microbial N turnover, but also due to the high N content in Pleistocene Yedoma deposits [22].
Nitrification is particularly favored in thaw mounds as their exposed position and deep cracks lead to drainage and aeration (Figure 5A). Similarly, Marushchak et al. [6] found a comparable high concentration (116 µg N (g DW)−1) from a moss-covered thaw mound at Duvanny Yar exposure near the Kolyma River (Siberia) (max. at site TM1 V: 110 µg µg N (g DW)−1) and Tanski et al. [19] found elevated nitrate concentrations in cracked and well–aerated surfaces at a slump floor at a thaw slump in Alaska. Strong differences in N pools between the slump floor and thaw mounds were most probably not linked to microbial functional limitation (III), as suggested in Monteux et al. [31] and Marushchak et al. [6], since our N transformation experiment showed a continuous nitrate production (except site SF6 NV) under optimal conditions with oxygen supply and at a neutral pH. It is more likely that the high ammonium concentrations in slump floor soils were caused by an inhibited nitrification under field conditions due to high soil moisture [60,61,62] and acidic pH (Figure 5A), despite the fact that there were only negative correlations between ammonium and WFPS, between δ15N and WC and WFPS, as well as between DON and soil pH. In particular, ammonia oxidizers (archaea and bacteria) prefer oxic conditions and react sensitively to elevated soil moisture [61]. The impact of soil pH on nitrification is contentious and depends strongly on the microbial community [63,64,65], although at a neutral pH less ammonia is converted into ammonium, being generally optimal for nitrification.
At the beginning of the growing season, the slump floor is more affected by meltwaters, which increase soil moisture and might slow down nitrification (Figure 5A). Accordingly, the mobilization of nitrate by meltwaters could be an additional reason why nitrate concentrations were lower in the slump floor than in the thaw mounds [19]. Contrary, thaw mound topsoils are presumably water saturated only after rain events or overlain snow melt but are otherwise well aerated. However, the second-highest nitrate concentration was measured at site SF3 NV. Samples from site SF3 NV were taken from the steep middle part of the slope and were rich in DON and ammonium compared to thaw mound soils, suggesting that nitrate might not be produced in–situ at site SF3 NV, but could be enriched by meltwaters. Soils from site SF6 were only recently thawed in 2016 and sampled from the upper slope close to the headwall, where they are likely less affected by N leaching.

4.2. Anaerobic N2O Production

Under anaerobic conditions, N2O is released as an intermediate during denitrification, but often denitrification is limited in continuously water–saturated environments as the required substrate (nitrate) is produced via nitrification under aerobic conditions [7,12]. We did not measure N2O production via nitrification, but Marushchak et al. [6] presented that less N2O is produced under oxygen supply than under anoxic conditions from the same thaw slump emphasizing that denitrification is the major pathway that releases N2O in the study area. Denitrification was also estimated to be the main process releasing N2O in permafrost–affected peat soils when nitrate is available [2,66]. As already known, N2O release via denitrification strongly depends on nitrate availability and soil moisture [66,67]. Consequently, the highest N2O fluxes were observed in nitrate-enriched thaw mounds while there was no N2O production in the nitrate-poor slump floor (Figure 5B). Confirming our hypothesis II, nitrate addition stimulated N2O release via denitrification in soils that did not produce N2O. This indicates that N2O production is most likely limited by nitrate availability. Contrary to our hypotheses I and III and previous studies [2,4,5,49,66,68], we found higher N2O production rates in revegetated thaw mounds [6] and not in non-vegetated soils of the slump floor as revegetated thaw mounds had higher nitrate concentrations and hence provided more substrate for denitrification. We found only a correlation between N2O and the water content, but not with N2O and the WFPS. Nevertheless, soils with the highest N2O production, site TM1 V and SF3 NV, had in addition to the highest nitrate concentration an optimal WFPS (66–67%) for N2O production via denitrification [7] (Table 1, Figure S3). Soils from site TM1 NV did not produce N2O, although having a similar nitrate concentration to site TM2 NV, but since samples from site TM1 NV had the highest water content (29 ± 0%) and WFPS (74 ± 1%) (Table 1, Figure S3), N2O was most likely directly reduced to N2 and therefore not detectable. Differences in N2O production and reduction could also be attributed to differences in microbial community composition which were not tested here. N2O production rates were in a similar range to Marushack et al. [6] from the same study area.
N2O production from the incubation experiment overestimated the N2O fluxes measured in the field and was 3 to 73 times higher. Variations between N2O fluxes from the incubations and in–situ measurements can be best explained by a higher oxygen supply in the field limiting denitrification. In–situ fluxes are in a comparable range to those reviewed by Voigt et al. [7] for permafrost–affected soils. Based on our data, we hypothesize that due to low soil moisture in thaw mounds, less N is lost via denitrification within the growing season enabling nitrate accumulation (Figure 5A). When soil conditions become anaerobic (e.g., after rain events and overlain snow melt at the beginning of the growing season), there is a high potential that thaw mounds produce considerable amounts of N2O via denitrification (Figure 5B).
Under anaerobic conditions, N2O was the major GHG contributing to the total release of CO2eq when nitrate was available. Consequently, in contradiction to our expectations (IV), thaw mounds released more CO2eq than slump floor soils (Figure 5B).

4.3. Effects of Nitrate on Greenhouse Gas Production

As expected, (II) N2O production could be stimulated by the addition of nitrate in soils that did not produce N2O at the beginning of the incubation. This indicates that denitrification, mainly in slump floor soils, was limited by substrate availability. Consequently, the slump floor could become a considerable N2O source if nitrate is leached by erosion or meltwaters from nitrate-rich thaw mounds towards the slump floor (Figure 5C). However, it remains unclear whether nitrate is leached from thaw mounds, for how long, and in which concentrations. Studies of abrupt permafrost thaw on the Tibetan Plateau and in Alaska have shown a decline in N availability with time after erosion [5,16,62,69,70]. Nitrous oxide production after nitrate addition increased only weakly in thaw mound soils as most probably the reduction of N2O to N2 exceeded already N2O production. Maximum N2O production rates from slump floor soils were observed relatively late after 7 to 12 days after nitrate addition, supporting the assumption that microbes were not adapted to these conditions in the field, resulting in a lag phase of N2O production in the incubation.
So far, less attention has been paid to the effects of N on the C cycle at N hotspots in permafrost regions. Most studies in permafrost regions discuss GHG production separately for C and N. As the paradigm of an N-limited Arctic is changing [7,10], and more studies are proving elevated nitrate export and N2O production from disturbed permafrost [2,3,4,5,6,15,16,17,18,19,50], the effects of N on the C cycle need to be urgently considered in the future, in particular in hotspots of high N availability [58]. In our study, nitrate and N2O, in addition to total carbon (TC), had major control over anaerobic CH4 production. Apart from the fact that nitrate is a preferred electron acceptor for microorganisms, it was proven in other soils and ecosystems [71,72,73], that denitrification intermediates (even at low concentrations) can have negative effects on methanogenesis and methanogen abundance. As a consequence, short–term incubations measuring CH4, might give biased estimations when N2O is not considered. Yang et al. [5,30] measured in–situ CH4 and N2O fluxes, as well as nitrate concentration from a thermoerosion gully (published in two different studies) on the Tibetan Plateau. They show that CH4 production, as well as methanogen abundance, increases with time after erosion (20 years) while at the same time nitrate concentration and hence N2O production have declined. As demonstrated in our study, Yang et al. [74] found a negative correlation between N2O (R = −0.40, p < 0.05) and nitrate (R = −0.47, p < 0.01) with CH4, as well as between nitrate and methanogen gene abundance (R = −0.48, p < 0.01) (personal communication). In addition, Marushchak et al. [75] studied soils across a thawing Yedoma exposure, and found a lack of CH4 production in anaerobic incubations when substantial N2O production or nitrate content was observed (personal communication). They also reported that substantial N2O fluxes were mainly associated with zero CH4 emissions in the field [75]. Furthermore, Abbott et al. [18] described a 90% reduction of dissolved CH4 due to high inorganic N concentration in thermokarst outflows in Alaska. Those observations might indicate that N leaching from N–rich soils could negatively affect methanogenesis (Figure 5C). However, since nitrate is rapidly leached or immobilized, it needs to be examined whether the impact of N on CH4 has an impact on a regional or global scale. High nitrogen availability might also slow down CO2 production by satisfying microbial N demand [70,76] (Figure 5C), but the effects of N on SOM decomposition are controversial [33,34,70,76]. However, decomposition depends on more factors such as SOM age [77], quality [78], or microbial accessibility [79]. Disturbance and methanogen abundance could have affected our observations. Knoblauch et al. [26,80] and Holm et al. [81] reported a generally lower abundance or even a lack of methanogens in Pleistocene-aged Yedoma sediments.

4.4. Role of Revegetation on Greenhouse Gas Production

The impact of plants could not be generalized due to a larger heterogeneity of selected slump floor sites. We hypothesize three major aspects that could have enhanced N turnover in revegetated soils: The control of soil moisture on N mineralization and denitrification are well described [82]. Plant water uptake, transpiration, soil loosening via rooting, as well as oxygen supply via roots into the soil, potentially affect soil aeration and in this way favor N mineralization. However, in our study, revegetated soils tended to be wetter but there was no statistically significant difference in WC or WFPS between revegetated and non-vegetated soils. Plants also have a direct impact on N mineralization by stimulating SOM decomposition through root exudation (priming effect) [83,84,85]. We found that WEOC was generally 36–38% higher in revegetated than in non-vegetated soils, however, it did not correlate with dissolved N, but with N2O production [42]. Dissolved carbon is an important electron donor for heterotrophic denitrification and potentially could have favored N2O production in revegetated soils. With increasing stabilization and plant succession, plant N demand might exceed microbial supply. At this point, the thaw slump could return to an N-limited system, lowering the potential for N losses as shown for other thermokarst–affected soils [5,16,62,69,70,78]. So far it is not clear how long eroded Yedoma coasts remain as a source for N and C losses after stabilization.

5. Conclusions

At the studied retrogressive thaw slump, due to thermoerosion Yedoma deposits were exposed and mixed with the Holocene topsoil cover forming the two studied thermokarst features, thaw mounds, and slump floor. The different origins and geomorphology of thaw mound and slump floor soils led to differences in soil properties, N availability, N transformation, as well as GHG production. Despite our expectation, nitrification was not limited in exposed Yedoma deposits due to microbial functional limitation or plant N uptake and high amounts of nitrate could accumulate in revegetated thaw mounds during the growing season. In particular, thaw mounds have a high potential for N losses in form of nitrate and N2O, when soils become water saturated at the beginning or end of the growing season. At the slump floor, nitrification was likely inhibited by wet and acidic field conditions causing substrate limitation for the denitrification. However, when substrate limitation is removed, e.g., by nitrate leaching of nitrate-rich thaw mound soils, the slump floor has a high potential to become a N2O source. We showed here that Arctic soils can be potential sources of significant N losses. Nitrous oxide and CO2 were the main components of produced CO2 equivalents, while CH4 played a minor role. The role of revegetation remains unclear and requires more research, but we assume that an increasing plant demand for N will determine the fate of N and GHG emissions with further stabilization and plant succession. This study highlights the relevance of considering landscape processes, such as thermoerosion, to estimate N and C losses at a landscape scale. More studies are necessary in order to characterize the seasonality and extent of N losses and to further evaluate the importance of C–N interactions in hotspots of high N availability.

Supplementary Materials

The following supporting information can be downloaded at: https://www.mdpi.com/2504-3129/3/4/40/s1, Figure S1: Studied field sites; Figure S2: Soil profiles with indication of analyzed depths of studied field sites; Figure S3: Water-filled pore space; Figure S4: Cumulative CH4 and N2O headspace gas concentration; Table S1: Coordinates of the sampled soil profiles in July 2019; Table S2: Subsoil samples from site TM2 NV; Table S3: Dissolved nitrogen components; Table S4: Anaerobic N2O production rates without and with nitrate addition; Table S5: CO2 equivalents based on the anaerobic incubation; Table S6: Dates of in–situ N2O measurements in 2019.

Author Contributions

Conceptualization, C.F., R.W. and C.K.; methodology, C.F. and C.K.; validation, R.W., C.F., C.K. and C.B.; formal analysis, R.W., C.F. and C.K.; investigation, R.W. and L.S.; writing—original draft preparation, R.W.; writing—review and editing, R.W, C.F., C.K., C.B. and L.S., visualization, R.W.; supervision, C.F., C.K. and C.B. All authors have read and agreed to the published version of the manuscript.

Funding

C.K. received support from the German Ministry of Education and Research as part of the project KoPf [grant no. 03F0764A] and from the cluster of Excellence CLICCS (EXC2037/1). C.B. acknowledges financial support by Deutsche Forschungsgemeinschaft (DFG, German Research Foundation)—BE 6485/1-1.

Acknowledgments

We are grateful to Birgit Grabellus, Ralf Lendt and Peter Schöbel for the support of laboratory analyses. Furthermore, we owe our gratitude to Maija E. Marushchak and Guibiao Yang for the scientific exchange on nitrogen–carbon interactions, and to Alexander Schuett who provided photos from the study site.

Conflicts of Interest

The authors declare no conflict of interest.

Correction Statement

This article has been republished with a minor correction to resolve typographical errors. In Section 'Conclusions', “At the slump floor, nitrification was likely inhibited by wet and acidic field conditions causing substrate limitation for the identification” was changed into “At the slump floor, nitrification was likely inhibited by wet and acidic field conditions causing substrate limitation for the denitrification" in the republished version. This change does not affect the scientific content of the article.

References

  1. Turetsky, M.R.; Abbott, B.W.; Jones, M.C.; Anthony, K.W.; Olefeldt, D.; Schuur, E.A.G.; Grosse, G.; Kuhry, P.; Hugelius, G.; Koven, C.; et al. Carbon release through abrupt permafrost thaw. Nat. Geosci. 2020, 13, 138–143. [Google Scholar] [CrossRef]
  2. Marushchak, M.E.; Pitkämäki, A.; Koponen, H.; Biasi, C.; Seppälä, M.; Martikainen, P.J. Hot spots for nitrous oxide emissions found in different types of permafrost peatlands. Glob. Chang. Biol. 2011, 17, 2601–2614. [Google Scholar] [CrossRef]
  3. Abbott, B.W.; Jones, J.B. Permafrost collapse alters soil carbon stocks, respiration, CH4, and N2O in upland tundra. Glob. Chang. Biol. 2015, 21, 4570–4587. [Google Scholar] [CrossRef] [PubMed]
  4. Mu, C.C.; Abbott, B.W.; Zhao, Q.; Su, H.; Wang, S.F.; Wu, Q.B.; Zhang, T.J.; Wu, X.D. Permafrost collapse shifts alpine tundra to a carbon source but reduces N2O and CH4 release on the northern Qinghai-Tibetan Plateau. Geophys. Res. Lett. 2017, 44, 8945–8952. [Google Scholar] [CrossRef]
  5. Yang, G.; Peng, Y.; Marushchak, M.E.; Chen, Y.; Wang, G.; Li, F.; Zhang, D.; Wang, J.; Yu, J.; Liu, L.; et al. Magnitude and Pathways of Increased Nitrous Oxide Emissions from Uplands Following Permafrost Thaw. Environ. Sci. Technol. 2018, 52, 9162–9169. [Google Scholar] [CrossRef]
  6. Marushchak, M.E.; Kerttula, J.; Diáková, K.; Faguet, A.; Gil, J.; Grosse, G.; Knoblauch, C.; Lashchinskiy, N.; Martikainen, P.J.; Morgenstern, A.; et al. Thawing Yedoma permafrost is a neglected nitrous oxide source. Nat. Commun. 2021, 12, 7107. [Google Scholar] [CrossRef]
  7. Voigt, C.; Marushchak, M.E.; Abbott, B.W.; Biasi, C.; Elberling, B.; Siciliano, S.D.; Sonnentag, O.; Stewart, K.J.; Yang, Y.; Martikainen, P.J. Nitrous oxide emissions from permafrost-affected soils. Nat. Rev. Earth Environ. 2020, 1, 420–434. [Google Scholar] [CrossRef]
  8. Lacroix, F.; Zaehle, S.; Caldararu, S.; Schaller, J.; Stimmler, P.; Holl, D.; Kutzbach, L.; Göckede, M. Mismatch of N release from the permafrost and vegetative uptake opens pathways of increasing nitrous oxide emissions in the high Arctic. Glob. Chang. Biol. 2022, 28, 5973–5990. [Google Scholar] [CrossRef]
  9. Schimel, J.P.; Bennett, J. Nitrogen Mineralization: Challenges of a Changing Paradigm. Ecology 2004, 85, 591–602. [Google Scholar] [CrossRef]
  10. Ramm, E.; Liu, C.; Ambus, P.; Butterbach-Bahl, K.; Hu, B.; Martikainen, P.J.; Marushchak, M.E.; Mueller, C.W.; Rennenberg, H.; Schloter, M.; et al. A review of the importance of mineral nitrogen cycling in the plant-soil-microbe system of permafrost-affected soils—Changing the paradigm. Environ. Res. Lett. 2022, 17, 13004. [Google Scholar] [CrossRef]
  11. Ramm, E.; Liu, C.; Wang, X.; Yue, H.; Zhang, W.; Pan, Y.; Schloter, M.; Gschwendtner, S.; Mueller, C.W.; Hu, B.; et al. The Forgotten Nutrient—The Role of Nitrogen in Permafrost Soils of Northern China. Adv. Atmos. Sci. 2020, 37, 793–799. [Google Scholar] [CrossRef]
  12. Prosser, J.I.; Hink, L.; Gubry-Rangin, C.; Nicol, G.W. Nitrous oxide production by ammonia oxidizers: Physiological diversity, niche differentiation and potential mitigation strategies. Glob. Chang. Biol. 2019, 26, 103–118. [Google Scholar] [CrossRef] [PubMed]
  13. Myhre, G.D.; Shindell, F.-M.; Bréon, W.; Collins, J.; Fuglestvedt, J.; Huang, D.; Koch, J.-F.; Lamarque, D.; Lee, B.; Mendoza, T.; et al. Anthropogenic and Natural Radiative Forcing in Climate Change 2013: The Physical Science Basis. Contribution of Working Group I to the Fifth Assessment; Stocker, T.F., Qin, D., Plattner, G.-K., Tignor, M., Allen, S.K., Boschung, J., Nauels, A., Xia, Y., Bex, V., Midgley, P.M., Eds.; Cambridge University Press: Cambridge, UK; New York, NY, USA, 2013; pp. 659–740. [Google Scholar]
  14. Ravishankara, A.R.; Daniel, J.S.; Portmann, R.W. Nitrous oxide (N2O): The dominant ozone-depleting substance emitted in the 21st century. Science 2009, 326, 123–125. [Google Scholar] [CrossRef]
  15. Harms, T.K.; Jones, J. Thaw depth determines reaction and transport of inorganic nitrogen in valley bottom permafrost soils: Nitrogen cycling in permafrost soils. Glob. Chang. Biol. 2012, 18, 2958–2968. [Google Scholar] [CrossRef] [PubMed]
  16. Harms, T.K.; Abbott, B.W.; Jones, J.B. Thermo-erosion gullies increase nitrogen available for hydrologic export. Biogeochemistry 2014, 117, 299–311. [Google Scholar] [CrossRef]
  17. Louiseize, N.L.; Lafrenière, M.J.; Hastings, M.G. Stable isotopic evidence of enhanced export of microbially derived NO3 following active layer slope disturbance in the Canadian High Arctic. Biogeochemistry 2014, 121, 565–580. [Google Scholar] [CrossRef]
  18. Abbott, B.W.; Jones, J.B.; Godsey, S.E.; Larouche, J.R.; Bowden, W.B. Patterns and persistence of hydrologic carbon and nutrient export from collapsing upland permafrost. Biogeosciences 2015, 119, 2049–2063. [Google Scholar] [CrossRef]
  19. Tanski, G.; Lantuit, H.; Ruttor, S.; Knoblauch, C.; Radosavljevic, B.; Strauss, J.; Wolter, J.; Irrgang, A.M.; Ramage, J.; Fritz, M. Transformation of terrestrial organic matter along thermokarst-affected permafrost coasts in the Arctic. Sci. Total Environ. 2017, 581–582, 434–447. [Google Scholar] [CrossRef]
  20. Schirrmeister, L.; Froese, D.; Tumskoy, V.; Grosse, G.; Wetterich, S. Yedoma: Late Pleistocene Ice-Rich Syngenetic Permafrost of Beringia. In The Encyclopedia of Quaternary Science; Elias, S.A., Ed.; Elsevier: Amsterdam, the Netherlands, 2013; Volume 3, pp. 542–552. [Google Scholar]
  21. Segal, R.A.; Lantz, T.C.; Kokelj, S.V. Acceleration of thaw slump activity in glaciated landscapes of the Western Canadian Arctic. Environ. Res. Lett. 2016, 11, 034025. [Google Scholar] [CrossRef]
  22. Strauss, J.; Abbott, B.W.; Beermann, F.; Biasi, C.; Fuchs, M.; Grosse, G.; Horn, M.A.; Liebner, S.; Sanders, T.; Schirrmeister, L.; et al. The nitrogen stock of the ice-rich yedoma domain. In Proceedings of the 5th European Conference on Permafrost, Chamonix Mont-Blanc, France, 23 June–1 July 2018; pp. 784–785. [Google Scholar]
  23. Hugelius, G.; Loisel, J.; Chadburn, S.; Jackson, R.B.; Jones, M.; MacDonald, G.; Marushchak, M.; Olefeldt, D.; Packalen, M.; Siewert, M.B.; et al. Large stocks of peatland carbon and nitrogen are vulnerable to permafrost thaw. Proc. Natl. Acad. Sci. USA 2020, 117, 20438–20446. [Google Scholar] [CrossRef]
  24. Fuchs, M.; Nitze, I.; Strauss, J.; Günther, F.; Wetterich, S.; Kizyakov, A.; Fritz, M.; Opel, T.; Grigoriev, M.N.; Maksimov, G.T.; et al. Rapid Fluvio-Thermal Erosion of a Yedoma Permafrost Cliff in the Lena River Delta. Front. Earth Sci. 2020, 8, 00336. [Google Scholar] [CrossRef]
  25. Grosse, G.; Schirrmeister, L.; Malthus, T.J. Application of Landsat-7 satellite data and a DEM for the quantification of thermokarst-affected terrain types in the periglacial Lena–Anabar coastal lowland. Polar Res. 2006, 25, 51–67. [Google Scholar] [CrossRef]
  26. Knoblauch, C.; Beer, C.; Schuett, A.; Sauerland, L.; Liebner, S.; Steinhof, A.; Rethemeyer, J.; Grigoriev, M.N.; Faguet, A.; Pfeiffer, E.-M. Carbon Dioxide and Methane Release Following Abrupt Thaw of Pleistocene Permafrost Deposits in Arctic Siberia. J. Geophys. Res.-Biogeo. 2021, 126, e2021JG006543. [Google Scholar] [CrossRef]
  27. Wolfe, S.; Kotler, E.; Dallimore, S. Surficial Characteristics and the Distribution of Thaw Landforms (1970–1999), Shingle Point to Kay Point, Yukon Territory; Geological Survey of Canada Open File 4115; Terrain Sciences Division, Geological Survey of Canada: Ottawa, ON, Canada, 2001. Available online: https://emrlibrary.gov.yk.ca/gsc/open_files/4115/OF4115.pdf (accessed on 15 November 2022).
  28. Lantuit, H.; Pollard, W.H. Fifty years of coastal erosion and retrogressive thaw slump activity on Herschel Island, southern Beaufort Sea, Yukon Territory, Canada. Geomorphology 2008, 95, 84–102. [Google Scholar] [CrossRef]
  29. Sanders, T.; Fiencke, C.; Fuchs, M.; Haugk, C.; Juhls, B.; Mollenhauer, G.; Ogneva, O.; Overduin, P.; Palmtag, J.; Povazhniy, V.; et al. Seasonal nitrogen fluxes of the Lena River Delta. Ambio 2022, 51, 423–438. [Google Scholar] [CrossRef] [PubMed]
  30. Yang, G.; Peng, Y.; Olefeldt, D.; Chen, Y.; Wang, G.; Li, F.; Zhang, D.; Wang, J.; Yu, J.; Liu, L.; et al. Changes in Methane Flux along a Permafrost Thaw Sequence on the Tibetan Plateau. Environ. Sci. Technol. 2018, 52, 1244–1252. [Google Scholar] [CrossRef]
  31. Monteux, S.; Keuper, F.; Fontaine, S.; Gavazov, K.; Hallin, S.; Juhanson, J.; Krab, E.J.; Revaillot, S.; Verbruggen, E.; Walz, J.; et al. Carbon and nitrogen cycling in Yedoma permafrost controlled by microbial functional limitations. Nat. Geosci. 2020, 13, 794–798. [Google Scholar] [CrossRef]
  32. Yergeau, E.; Hogues, H.; Whyte, L.G.; Greer, C.W. The functional potential of high Arctic permafrost revealed by metagenomic sequencing, qPCR and microarray analyses. ISME J. 2010, 4, 1206–1214. [Google Scholar] [CrossRef]
  33. Wild, B.; Schnecker, J.; Alves, R.J.E.; Barsukov, P.; Bárta, J.; Capek, P.; Gentsch, N.; Gittel, A.; Guggenberger, G.; Lashchinskiy, N.; et al. Input of easily available organic C and N stimulates microbial decomposition of soil organic matter in arctic permafrost soil. Soil Biol. Biochem. 2014, 75, 143–151. [Google Scholar] [CrossRef]
  34. Wild, B.; Gentsch, N.; Čapek, P.; Diáková, K.; Alves, R.J.E.; Bárta, J.; Gittel, A.; Hugelius, G.; Knoltsch, A.; Kuhry, P.; et al. Plant-derived compounds stimulate the decomposition of organic matter in arctic permafrost soils. Sci. Rep. 2016, 6, 25607. [Google Scholar] [CrossRef]
  35. Boike, J.; Nitzbon, J.; Anders, K.; Grigoriev, M.; Bolshiyanov, D.; Langer, M.; Lange, S.; Bornemann, N.; Morgenstern, A.; Schreiber, P.; et al. A 16-year record (2002–2017) of permafrost, active-layer, and meteorological conditions at the Samoylov Island Arctic permafrost research site, Lena River delta, northern Siberia: An opportunity to validate remote-sensing data and land surface, snow, and permafrost models. Earth Syst. Sci. Data 2019, 11, 261–299. [Google Scholar] [CrossRef]
  36. Boike, J.; Kattenstroth, B.; Abramova, K.; Bornemann, N.; Chetverova, A.; Fedorova, I.; Fröb, K.; Grigoriev, M.; Grüber, M.; Kutzbach, L.; et al. Baseline characteristics of climate, permafrost and land cover from a new permafrost observatory in the Lena River Delta, Siberia (1998–2011). Biogeosciences 2013, 10, 2105–2128. [Google Scholar] [CrossRef]
  37. Wetterich, S.; Kuzmina, S.; Andreev, A.A.; Kienast, F.; Meyer, H.; Schirrmeister, L.; Kuznetsova, T.; Sierralta, M. Palaeoenvironmental dynamics inferred from late Quaternary permafrost deposits on Kurungnakh Island, Lena Delta, Northeast Siberia, Russia. Quat. Sci. Rev. 2008, 27, 1523–1540. [Google Scholar] [CrossRef]
  38. Laschinskiy, N.; Faguet, A.; Biasi, C. Primary plant succession on freshly degraded yedoma (ice complex) in Lena delta (Eastern Siberia). BIO Web Conf. 2020, 24, 00047. [Google Scholar] [CrossRef]
  39. Haney, R.L.; Haney, E.B. Simple and Rapid Laboratory Method for Rewetting Dry Soil for Incubations. Commun. Soil Sci. Plant Anal. 2010, 41, 1493–1501. [Google Scholar] [CrossRef]
  40. Kandeler, E.; Gerber, H. Short-term assay of soil urease activity using colorimetric determination of ammonium. Biol. Fertil. Soils 1988, 6, 68–72. [Google Scholar] [CrossRef]
  41. Jones, D.L.; Willet, V.B. Experimental evaluation of methods to quantify dissolved organic nitrogen (DON) and dissolved organic carbon (DOC) in soil. Soil Biol. Biochem. 2006, 38, 991–999. [Google Scholar] [CrossRef]
  42. Surey, R.; Schimpf, C.M.; Sauheitl, L.; Mueller, C.W.; Rummel, P.S.; Dittert, K.; Kaiser, K.; Böttcher, J.; Mikutta, R. Potential denitrification stimulated by water-soluble organic carbon from plant residues during initial decomposition. Soil Biol. Biochem. 2020, 147, 107841. [Google Scholar] [CrossRef]
  43. Riehm, H. Die Bestimmung der laktatlöslichen Phosphorsäure im Boden unter Verwendung eines lichtelektrischen Kolorimeters. Bodenk. Pflanzenernaehr. 1938, 9, 30–50. [Google Scholar] [CrossRef]
  44. Murphy, J.; Riley, J.P. A modified single solution method for the determination of phosphate in natural waters. Anal. Chim. Acta 1962, 27, 31–36. [Google Scholar] [CrossRef]
  45. Carroll, J.J.; Slupsky, J.D.; Mather, A.E. The Solubility of Carbon Dioxide in Water at Low Pressure. J. Phys. Chem. Ref. Data 1991, 20, 1201–1209. [Google Scholar] [CrossRef]
  46. Millero, F.; Huang, F.; Graham, T.; Pierrot, D. The dissociation of carbonic acid in NaCl solutions as a function of concentration and temperature. Geochim. Cosmochim. Acta 2007, 71, 46–55. [Google Scholar] [CrossRef]
  47. Yamamoto, S.; Alcauskas, J.B.; Crozier, T.E. Solubility of methane in distilled water and seawater. J. Chem. Eng. Data 1976, 21, 78–80. [Google Scholar] [CrossRef]
  48. Weiss, R.F.; Price, B.A. Nitrous oxide solubility in water and seawater. Mar. Chem. 1980, 8, 347–359. [Google Scholar] [CrossRef]
  49. Repo, M.E.; Susiluoto, S.; Lind, S.E.; Jokinen, S.; Elsakov, V.; Biasi, C.; Virtanen, T.; Martikainen, P.J. Large N2O emissions from cryoturbated peat soil in tundra. Nat. Geosci. 2009, 2, 189–192. [Google Scholar] [CrossRef]
  50. Voigt, C.; Lamprecht, R.E.; Marushchak, M.E.; Lind, S.E.; Novakovskiy, A.; Aurela, M.; Martikainen, P.J.; Biasi, C. Warming of subarctic tundra increases emissions of all three important greenhouse gases—Carbon dioxide, methane, and nitrous oxide. Glob. Chang. Biol. 2017, 23, 3121–3138. [Google Scholar] [CrossRef]
  51. Wild, B.; Schnecker, J.; Bárta, J.; Čapek, P.; Guggenberger, G.; Hofhansl, F.; Kaiser, C.; Lashchinsky, N.; Mikutta, R.; Mooshammer, M.; et al. Nitrogen dynamics in Turbic Cryosols from Siberia and Greenland. Soil Biol. Biochem. 2013, 67, 85–93. [Google Scholar] [CrossRef]
  52. Beermann, F.; Teltewskoi, A.; Fiencke, C.; Pfeiffer, E.-M.; Kutzbach, L. Stoichiometric analysis of nutrient availability (N, P, K) within soils of polygonal tundra. Biogeochemistry 2015, 122, 211–227. [Google Scholar] [CrossRef]
  53. Wild, B.; Schnecker, J.; Knoltsch, A.; Takriti, M.; Mooshammer, M.; Gentsch, N.; Mikutta, R.; Alves, R.J.E.; Gittel, A.; Lashchinskiy, N.; et al. Microbial nitrogen dynamics in organic and mineral soil horizons along a latitudinal transect in western Siberia. Glob. Biogeochem. Cycles 2015, 29, 567–582. [Google Scholar] [CrossRef]
  54. Wickland, K.P.; Waldrop, M.P.; Aiken, G.R.; Koch, J.C.; Jorgenson, M.T.; Striegl, R.G. Dissolved organic carbon and nitrogen release from boreal Holocene permafrost and seasonally frozen soils of Alaska. Environ. Res. Lett. 2018, 13, 65011. [Google Scholar] [CrossRef]
  55. Nordin, A.; Schmidt, I.K.; Shaver, G.R. Nitrogen uptake by Arctic soil microbes and plant in relation to soil nitrogen supply. Ecology 2004, 85, 955–962. [Google Scholar] [CrossRef]
  56. Oulehle, F.; Rowe, E.C.; Myška, O.; Chuman, T.; Evans, C.D. Plant functional type affects nitrogen use efficiency in high-Arctic tundra. Soil Biol. Biochem. 2016, 94, 19–28. [Google Scholar] [CrossRef]
  57. Morison, M.Q.; Macrae, M.L.; Petrone, R.M.; Fishback, L. Climate-induced changes in nutrient transformations across landscape units in a thermokarst subarctic peatland. Arct. Antarct. Alp. Res. 2018, 50, e1519366. [Google Scholar] [CrossRef]
  58. Fiencke, C.; Marushchak, M.E.; Sanders, T.; Wegner, R.; Beer., C. Microbiogeochemical Traits to Identify Nitrogen Hotspots in Permafrost Regions. Nitrogen 2022, 3, 458–501. [Google Scholar] [CrossRef]
  59. Ma, W.K.; Schautz, A.; Fishback, L.A.E.; Bedard-Haughn, A.; Farrell, R.E.; Siciliano, S.D. Assessing the potential of ammonia oxidizing bacteria to produce nitrous oxide in soils of a high arctic lowland ecosystem on Devon Island, Canada. Soil Biol. Biochem. 2007, 39, 2001–2013. [Google Scholar] [CrossRef]
  60. Bateman, E.J.; Baggs, E.M. Contributions of nitrification and denitrification to N2O emissions from soils at different water-filled pore space. Biol. Fertil. Soils 2005, 41, 379–388. [Google Scholar] [CrossRef]
  61. Gleeson, D.B.; Müller, C.; Banerjee, S.; Ma, W.; Siciliano, S.D.; Murphy, D.V. Response of ammonia oxidizing archaea and bacteria to changing water filled pore space. Soil Biol. Biochem. 2010, 42, 1888–1891. [Google Scholar] [CrossRef]
  62. Mao, C.; Kou, D.; Wang, G.; Peng, Y.; Yang, G.; Liu, F.; Zhang, J.; Yang, Y. Trajectory of Topsoil Nitrogen Transformations Along a Thermo-Erosion Gully on the Tibetan Plateau. J. Geophys. Res.-Biogeo. 2019, 124, 1342–1354. [Google Scholar] [CrossRef]
  63. Weber, D.F.; Gainey, P.L. Relative sensitivity of nitrifying organisms to hydrogen ions in soils and in solutions. Soil Sci. 1961, 94, 138–145. [Google Scholar] [CrossRef]
  64. Prinčič, A.; Mahne, I.; Megušar, F.; Paul, E.A.; Tiedje, J.M. Effects of pH and Oxygen and Ammonium Concentrations on the Community Structure of Nitrifying Bacteria from Wastewater. Appl. Environ. Microbiol 1998, 64, 3584–3590. [Google Scholar] [CrossRef]
  65. Li, Z.; Tian, D.; Wang, B.; Wang, J.; Wang, S.; Chen, H.Y.H.; Xu, X.; Wang, C.; He, N.; Niu, S. Microbes drive global soil nitrogen mineralization and availability. Glob. Chang. Biol. 2018, 25, 1078–1088. [Google Scholar] [CrossRef] [PubMed]
  66. Gil, J.A.; Marushchak, M.E.; Rütting, T.; Baggs, E.M.; Pérez, T.; Novakovskiy, A.; Trubnikova, T.; Kaverin, D.; Martikainen, P.J.; Biasi, C. Sources of nitrous oxide and fate of mineral nitrogen in sub-Arctic permafrost peat soils. Biogeosciences 2022, 19, 2683–2698. [Google Scholar] [CrossRef]
  67. Chen, Z.; Ge, S.; Zhang, Z.; Du, Y.; Yao, B.; Xie, H.; Liu, P.; Zhang, Y.; Wang, W.; Zhou, H. Soil Moisture but Not Warming Dominates Nitrous Oxide Emissions During Freeze–Thaw Cycles in a Qinghai–Tibetan Plateau Alpine Meadow With Discontinuous Permafrost. Front. Ecol. Evol. 2021, 9, 676027. [Google Scholar] [CrossRef]
  68. Voigt, C.; Marushchak, M.E.; Lamprecht, R.E.; Jackowicz-Korczyński, M.; Lindgren, A.; Mastepanov, M.; Granlund, L.; Christensen, T.R.; Tahvanainen, T.; Martikainen, P.J.; et al. Increased nitrous oxide emissions from Arctic peatlands after permafrost thaw. Proc. Natl. Acad. Sci. USA 2017, 114, 6238–6243. [Google Scholar] [CrossRef]
  69. Buckeridge, K.M.; Schaeffer, S.M.; Schimel, J.P. Vegetation Leachate During Arctic Thaw Enhances Soil Microbial Phosphorus. Ecosystems 2016, 19, 477–489. [Google Scholar] [CrossRef]
  70. Chen, L.; Liu, L.; Mao, C.; Qin, S.; Wang, J.; Liu, F.; Blagodatsky, S.; Yang, G.; Zhang, Q.; Zhang, D.; et al. Nitrogen availability regulates topsoil carbon dynamics after permafrost thaw by altering microbial metabolic efficiency. Nat. Commun. 2018, 9, 13951. [Google Scholar] [CrossRef]
  71. Klüber, H.D.; Conrad, R. Effects of nitrate, nitrite, NO and N2O on methanogenesis and other redox processes in anoxic rice field soil. FEMS Microbiol. Ecol. 1998, 25, 301–318. [Google Scholar] [CrossRef]
  72. Roy, R.; Conrad, R. Effect of methanogenic precursors (acetate, hydrogen, propionate) on the suppression of methane production by nitrate in anoxic rice field soil. FEMS Microbiol. Ecol. 1999, 28, 49–61. [Google Scholar] [CrossRef]
  73. Wang, J.; Xu, T.; Yin, L.; Han, C.; Deng, H.; Jiang, Y.; Zhong, W. Nitrate addition inhibited methanogenesis in paddy soils under long-term managements. Plant Soil Environ. 2018, 64, 393–399. [Google Scholar] [CrossRef]
  74. Yang, G.; (State Key Laboratory of Vegetation and Environmental Change, Institute of Botany, Chinese Academy of Sciences, Beijing, China). Personal communication, 2022.
  75. Marushchak, M.E.; (Department of Environmental and Biological Sciences, University of Eastern Finland, Kuopio, Finland). Personal communication, 2022.
  76. Liu, W.; Qiao, C.; Yang, S.; Bai, W.; Liu, L. Microbial carbon use efficiency and priming effect regulate soil carbon storage under nitrogen deposition by slowing soil organic matter decomposition. Geoderma 2018, 332, 37–44. [Google Scholar] [CrossRef]
  77. Melchert, J.O.; Wischhöfer, P.; Knoblauch, C.; Eckhardt, T.; Liebner, S.; Rethemeyer, J. Sources of CO2 Produced in Freshly Thawed Pleistocene-Age Yedoma Permafrost. Front. Earth Sci. 2022, 9, 737237. [Google Scholar] [CrossRef]
  78. Chen, L.; Liang, J.; Qin, S.; Liu, L.; Fang, K.; Xu, Y.; Ding, J.; Li, F.; Luo, Y.; Yang, Y. Determinants of carbon release from the active layer and permafrost deposits on the Tibetan Plateau. Nat. Commun. 2016, 7, 13046. [Google Scholar] [CrossRef] [PubMed]
  79. Gentsch, N.; Wild, B.; Mikutta, R.; Čapek, P.; Diáková, K.; Schrumpf, M.; Turner, S.; Minnich, C.; Schaarschmidt, F.; Shibistova, O.; et al. Temperature response of permafrost soil carbon is attenuated by mineral protection. Glob. Chang. Biol. 2018, 24, 3401–3415. [Google Scholar] [CrossRef] [PubMed]
  80. Knoblauch, C.; Beer, C.; Liebner, S.; Grigoriev, M.N.; Pfeiffer, E.-M. Methane production as key to the greenhouse gas budget of thawing permafrost. Nat. Clim. Chang. 2018, 8, 309–312. [Google Scholar] [CrossRef]
  81. Holm, S.; Walz, J.; Horn, F.; Yang, S.; Grigoriev, M.N.; Wagner, D.; Knoblauch, C.; Liebner, S. Methanogenic response to long-term permafrost thaw is determined by paleoenvironment. FEMS Microbiol. Ecol. 2020, 96, fiaa021. [Google Scholar] [CrossRef]
  82. Davidson, E.A.; Keller, M.; Erickson, H.E.; Vercholt, L.V.; Veldkamp, E. Testing a Conceptual Model of Soil Emissions of Nitrousand Nitric Oxides. BioScience 2000, 50, 677–680. [Google Scholar] [CrossRef]
  83. Kuzyakov, Y.; Friedel, J.K.; Stahr, K. Review of mechanisms and quantification of priming effects. Soil Biol. Biochem. 2000, 32, 1485–1498. [Google Scholar] [CrossRef]
  84. Rousk, K.; Michelsen, A.; Rousk, J. Microbial control of soil organic matter mineralization responses to labile carbon in subarctic climate change treatments. Glob. Chang. Biol. 2016, 22, 4150–4161. [Google Scholar] [CrossRef]
  85. Hicks, L.C.; Leizeaga, A.; Rousk, K.; Michelsen, A.; Rousk, J. Simulated rhizosphere deposits induce microbial N-mining that may accelerate shrubification in the subarctic. Ecology 2020, 101, e03094. [Google Scholar] [CrossRef]
Figure 1. Studied retrogressive thaw slump on Kurungnakh: (A): Top–down view (2019) showing the slump floor (SF) and thaw mounds (TM) within the landscape. Thaw mounds are recognizable by their exposition from the SF. (B): Sample location within the slump (2016). The ice–rich headwall can be seen on the right site in the picture. Vegetation density increases with distance from the thaw front and hence time since thawing. Accordingly, sites SF6 and TM2 were more recently thawed than sites SF3 and TM1.
Nitrogen 03 00040 g001
Figure 2. Contribution of dissolved organic nitrogen (DON, green), ammonium (NH4+, yellow), and nitrate (NO3, orange) to the total dissolved nitrogen in revegetated (V) and non−vegetated (NV) slump floor (SF, left) and thaw mounds (TM, right) soils. None of the samples contained nitrite. Mean values and standard deviation are shown in Table S3 in the supplements.
Nitrogen 03 00040 g002
Figure 3. Mean anaerobic N2O production before (yellow) and after nitrate addition (152 mM) (orange) from revegetated (V) and non−vegetated (NV) slump floor (SF, left) and thaw mound (TM, right) soils (at 4 °C). Whiskers indicate standard deviation. For a better visualization the y–axis is broken.
Nitrogen 03 00040 g003
Figure 4. Contribution of CO2 (dark red), CH4 (bright red) and N2O (yellow) to total CO2 equivalents measured in anaerobic incubated (4 °C) slump floor (SF, left) and thaw mound soils (TM, right) without and with nitrate addition (152 mM). For a better visualization the y–axis is broken.
Nitrogen 03 00040 g004
Figure 5. Possible scenarios for GHG release from the slump floor (SF) and thaw mounds (TM) of a retreogressive thaw slump. Red indicates rather aerobic than anaerobic conditions, while blue indicates rather anaerobic than aerobic conditions. The size of the arrows represents the strength of the flux. (A): During the growing season, TMs are well aerated and provide together with a neural soil pH good conditions for nitrification. Nitrate (NO3) can accumulate throughout the season even under a vegetation coverage. The SF is affected by meltwaters increasing soil moisture. High soil moisture and low pH of SF soils slow down or inhibit nitrification leading to an accumulation of DON and ammonium (NH4+). N2O via nitrification and CO2 losses from TM soils are relatively small [6,26] and more CO2 equivalents are produced from the SF. (B): When the TMs become anaerobic in the end or beginning of the next growing season after rain events or snow melt, accumulated nitrate can be reduced via denitrification to N2O and less CO2 is produced due to the slowdown of SOM decomposition. When the SF becomes predominately anaerobic, it produces in addition to CO2, also CH4, but no N2O since denitrification is nitrate limited at the SF. Due to the GWP of N2O, more CO2 equivalents are released from TMs, CH4 emissions play a minor role. (C): When nitrate is leached from the TMs towards the SF by meltwaters or soil erosion, it removes the nitrate limitation for the denitrification at the SF and leads to high N2O losses. Nitrate leaching might also affect CO2 and CH4 production or adjacent aquatic ecosystems (here Lena River).
Nitrogen 03 00040 g005
Table 1. Active layer (AL) depth and soil properties (water content (WC), water-filled pore space (WFPS), soil pH (pH), total carbon (TC), total carbon–nitrogen ratio (C/N), delta 15N in bulk soil (δ15N), water–extractable organic carbon (WEOC), and phosphorus (P)) of sampled revegetated (V) and non-vegetated (NV) slump floor (SF) and thaw mounds (TM) soils (n = number of replicates).
SiteAL Depth
(cm)
nWC
(%)
WFPS
(%)
pHTC
(%)
C/Nδ15N Bulk
(‰)
WEOC
(µg C (g DW)−1)
P
(µg P (g DW)−1)
SF3 V30328 ± 267 ± 36.1 ± 0.26.5 ± 1.015.3 ±1.71.76 ± 0.072083 ± 3077.7 ± 0.3
SF3 NV100325 ± 263 ± 55.0 ± 0.25.2 ± 0.919.2 ± 0.32.31 ± 0.091325 ± 1757.0 ± 0.4
SF6 V30525 ± 166 ± 16.2 ± 0.1 *4.7 ± 0.317.4 ± 0.12.02 ± 0.121671 ± 36 **12.5 ± 0.8 *
SF6 NV30221 ± 252 ± 55.6 ± 0.13.4 ± 0.718.1 ± 0.32.10 ± 0.111302 ± 139 **18.6 ± 1.0
TM1 V30324 ± 260 ± 37.9 ± 0.04.4 ± 0.212.8 ± 0.11.95 ± 0.081702 ± 1522.9 ± 5.6
TM1 NV70329 ± 074 ± 17.8 ± 0.03.9 ± 0.112.9 ± 0.11.52 ± 0.031919 ± 10418.2 ± 0.4
TM2 V30319 ± 049 ± 18.1 ± 0.12.8 ± 0.114.2 ± 0.31.65 ± 0.161218 ± 5311.8 ± 0.9
TM2 NV110317 ± 045 ± 08.2 ± 0.02.0 ± 0.114.4 ± 0.22.60 ± 0.04753 ± 259.0 ± 0.3
Values (mean ± standard deviation), * n = 4, ** n = 2.
Table 2. Significance of differences between sites: thaw mound (TM) and slump floor (SF) sites, revegetated (TM V) and non-vegetated (TM NV) thaw mounds, as well as revegetated (SF V) and non-vegetated slump floor (SF NV).
ParameterBetween TM and SF SitesBetween TM V and TM NV SitesBetween SFV and SF NV Sites
Sign.TMSFSign.TM VTM NVSign.SF VSF NV
WCn.s. n.s. n.s.
WFPSn.s n.s.
pH***a n.s. ***a
TC*** an.s
WEOCn.s. n.s **a
C/N*** an.s **a
Pn.s. n.s n.s.
δ15N bulkn.s. n.s. ** a
DON*** an.s.
NH4+*** an.s.
NO3***a n.s. (**) a
Net ammonification*** an.s. n.s.
Net nitrificationn.s. n.s. n.s.
N2O productionn.s. n.s. (**) a
CO2 production*** an.s ***a
CH4 production** an.s **a
CO2 equivalentsn.s. n.s. n.s.
Levels of significance: *** p < 0.01, ** p < 0.05, n.s. = not significant. (**) = biased significance, due to elevated values at site SF3 NV. The letter a indicates the highest value.
Table 3. Net N transformation rates of incubated soil slurries (4 °C for 40 days) from revegetated (V) and non-vegetated (NV) slump floor (SF) and thaw mounds (TM) soils under oxygen supply and pH 7.2 (n = number of replicates).
SitenNet Ammonification
(ng N (g DW)−1 day−1)
Net Nitrification
(ng N (g DW)−1 day−1)
SF3 V323.25 ± 8.74484.39 ± 289.91
SF3 NV354.39 ± 74.981088.40 ± 539.50
SF6 V558.57 ± 39.10999.04 ± 595.15
SF6 NV269.51 ± 5.260.00 ± 0.00
TM1 V37.60 ± 0.321437.41 ± 539.73
TM1 NV35.10 ± 3.64383.11 ± 85.47
TM2 V35.01 ± 1.97197.13 ± 2.48
TM2 NV31.97 ± 1.16278.16 ± 58.26
Values (mean ± standard deviation).
Table 4. In–situ N2O fluxes from July 2019 and CO2 and CH4 production rates from an anaerobic incubation (4 °C) of revegetated (V) and non-vegetated (NV) slump floor (SF) and thaw mound (TM) soils (n = number of replicates). Dates of in–situ sampling are given in the Supplementary Material (Table S6).
SitenN2O In–Situ
(mg N2O-N m−2 Day−1)
Anaerobic CO2
(µg CO2-C (g DW)−1 Day−1)
Anaerobic CH4
(ng CH4-C (g DW)−1 Day−1)
SF3 V3n.d.6.00 ± 2.5714.90 ± 13.80
SF3 NV32.03 ± 1.390.99 ± 0.330.00 ± 0.00
SF6 V5n.d.7.07 ± 1.7665.46 ± 6.83
SF6 NV2 *0.01 ± 0.022.67 ± 1.3016.97 ± 13.17
TM1 V3n.d.0.89 ± 0.287.80 ± 11.02
TM1 NV30.68 ± 0.232.34 ± 0.846.22 ± 8.58
TM2 V3n.d.0.24 ± 0.040.57 ± 0.81
TM2 NV30.10 ± 0.040.52 ± 0.130.11 ± 0.15
Values (mean ± standard deviation), n.d. = not determined. * n = 3 for N2O in–situ measurements.
Publisher’s Note: MDPI stays neutral with regard to jurisdictional claims in published maps and institutional affiliations.

