
Sentiment Analysis and Text Analysis of the Public Discourse on Twitter about COVID-19 and MPox

Abstract
:1. Introduction
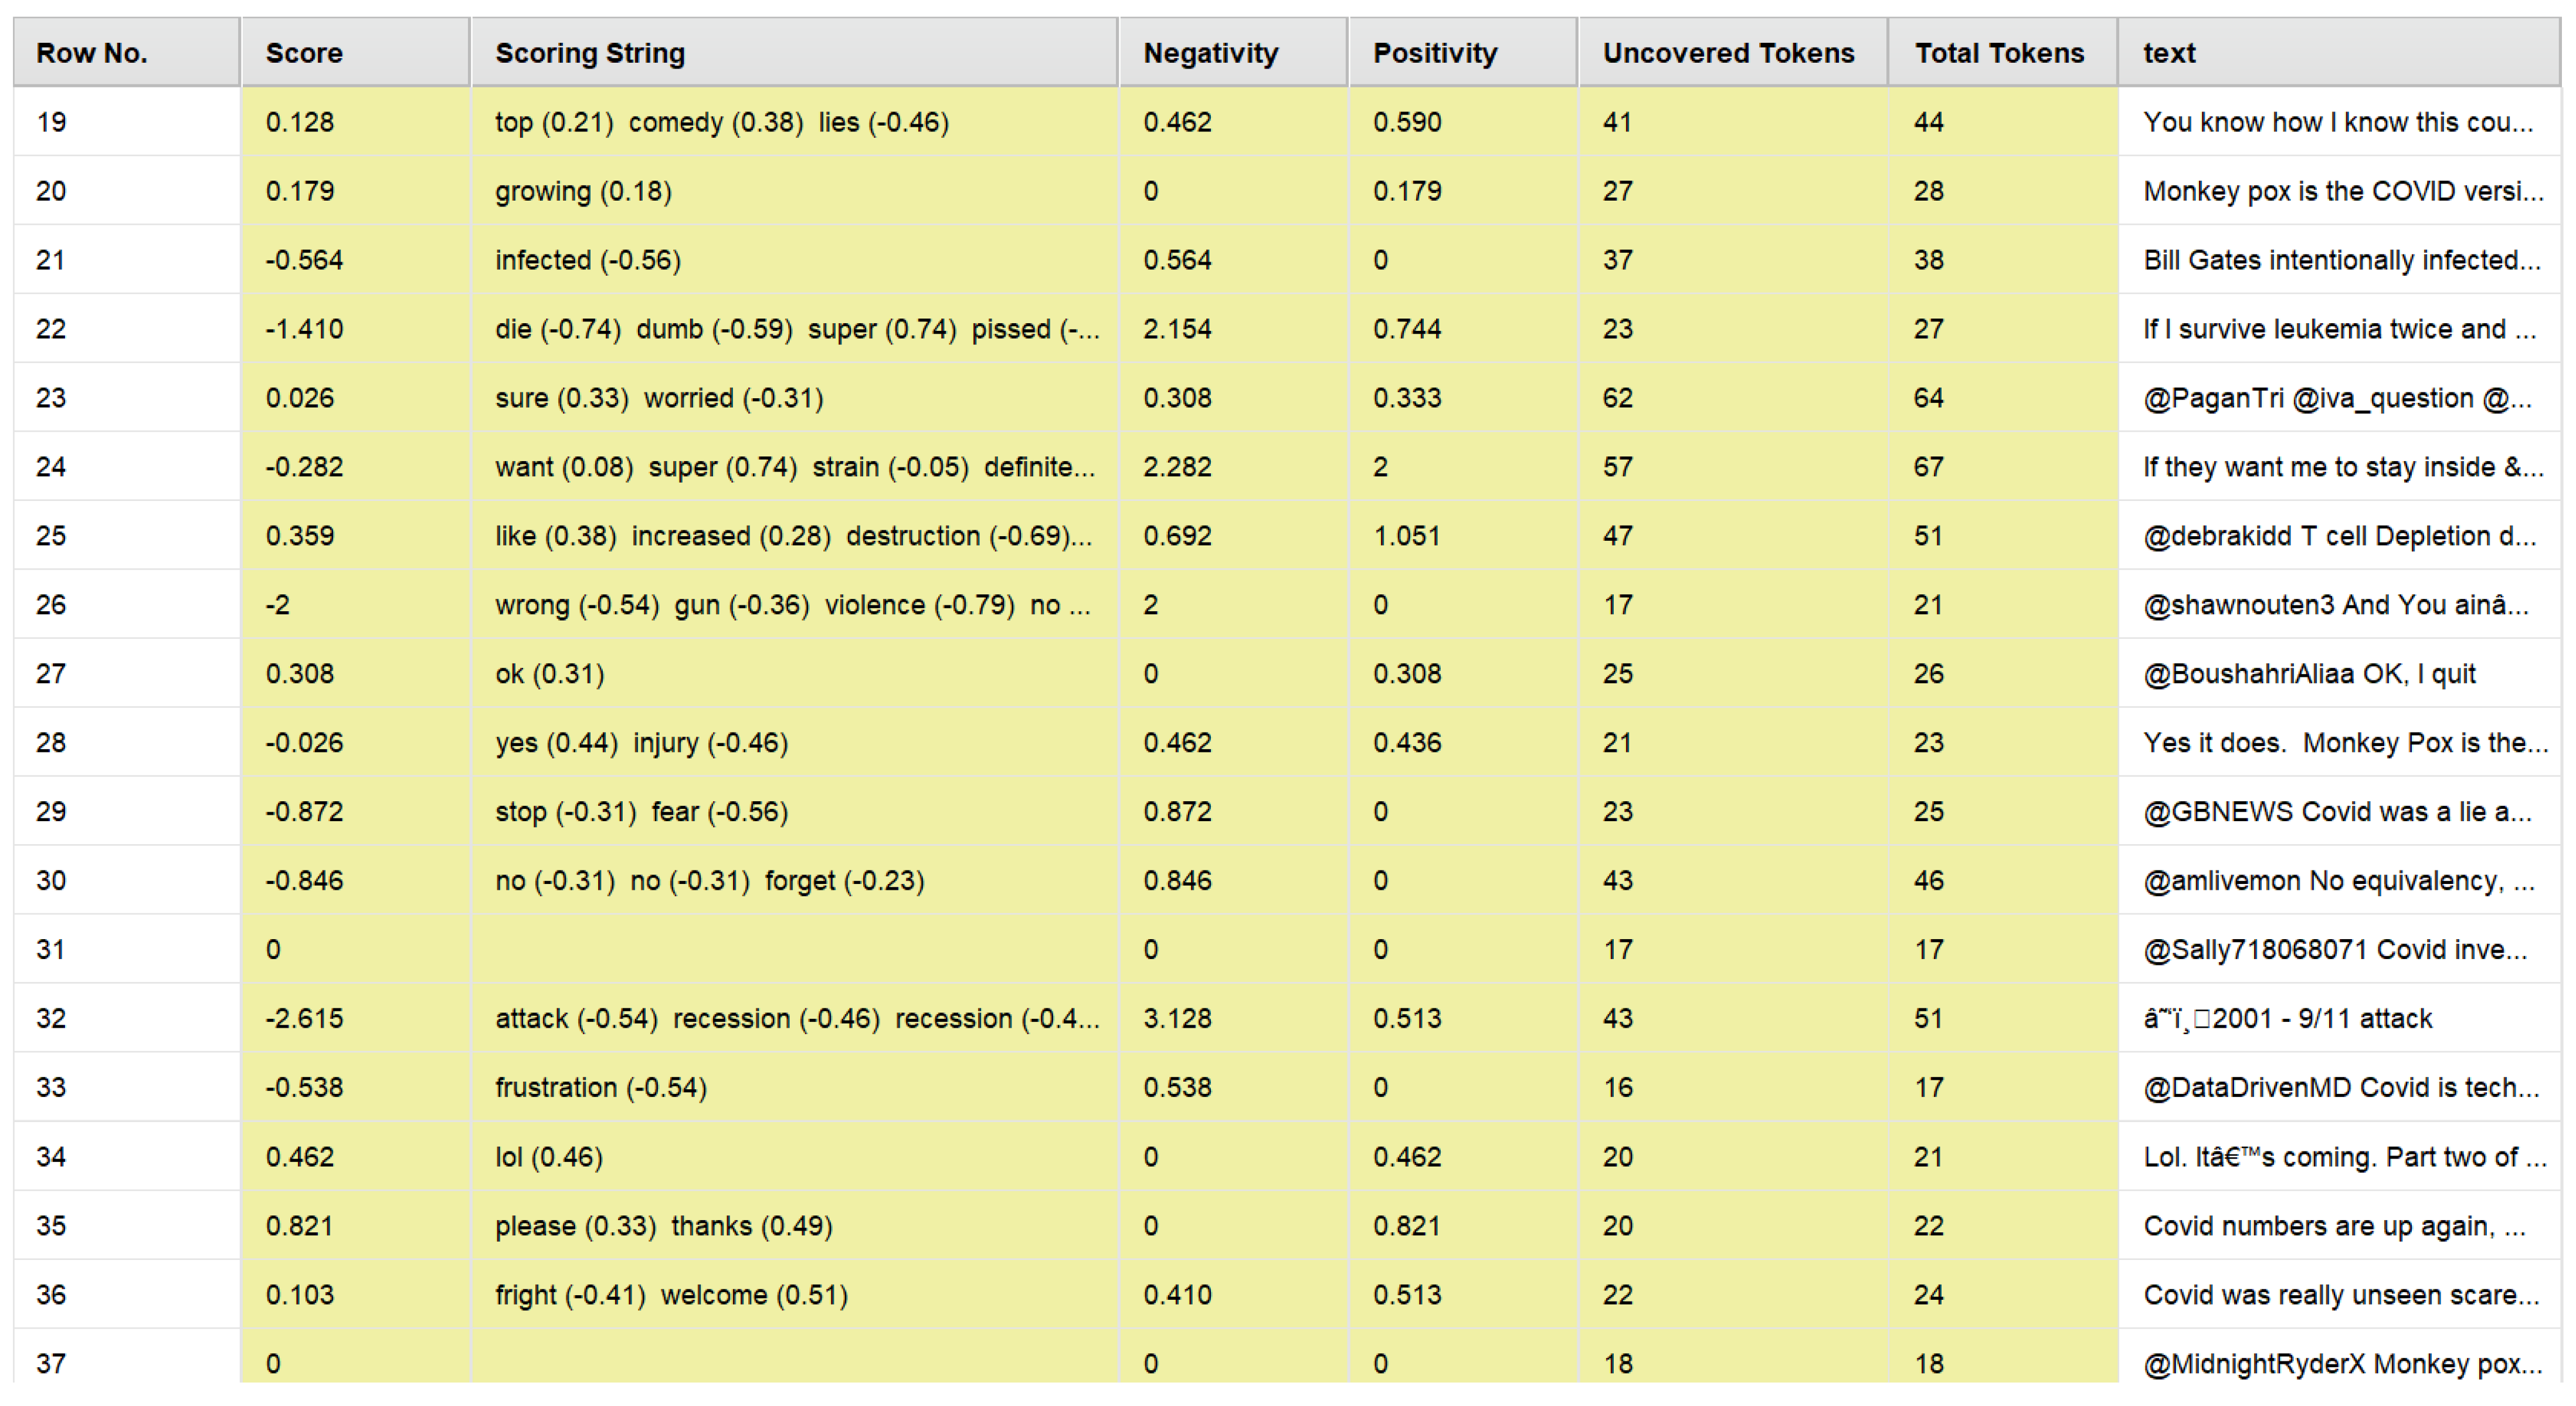
- The results of sentiment analysis using the VADER (Valence Aware Dictionary for sEntiment Reasoning) approach shows that nearly half the tweets (46.88%) had a negative sentiment. It was followed by tweets that had a positive sentiment (31.97%) and tweets that had a neutral sentiment (21.14%), respectively.
- Using concepts of text analysis, the top 50 hashtags associated with these tweets were obtained. These hashtags are presented in this paper.
- The top 100 most frequently used words that featured in these tweets were obtained after performing tokenization, removal of stopwords, and word frequency analysis of these tweets. The findings show that some of the commonly used words involved Twitter users directly referring to either or both of these viruses. In addition to this, the presence of words such as “Polio”, “Biden”, “Ukraine”, “HIV”, “climate”, and “Ebola” in the list of the top 100 most frequent words indicates that topics of conversations on Twitter in the context of COVID-19 and MPox also included a high level of interest related to other viruses, President Biden, and Ukraine.
2. Literature Review
2.1. Recent Works That Focused on Sentiment Analysis and Text Analysis of Tweets about COVID-19
2.2. Recent Works That Focused on Sentiment Analysis and Text Analysis of Tweets about MPox
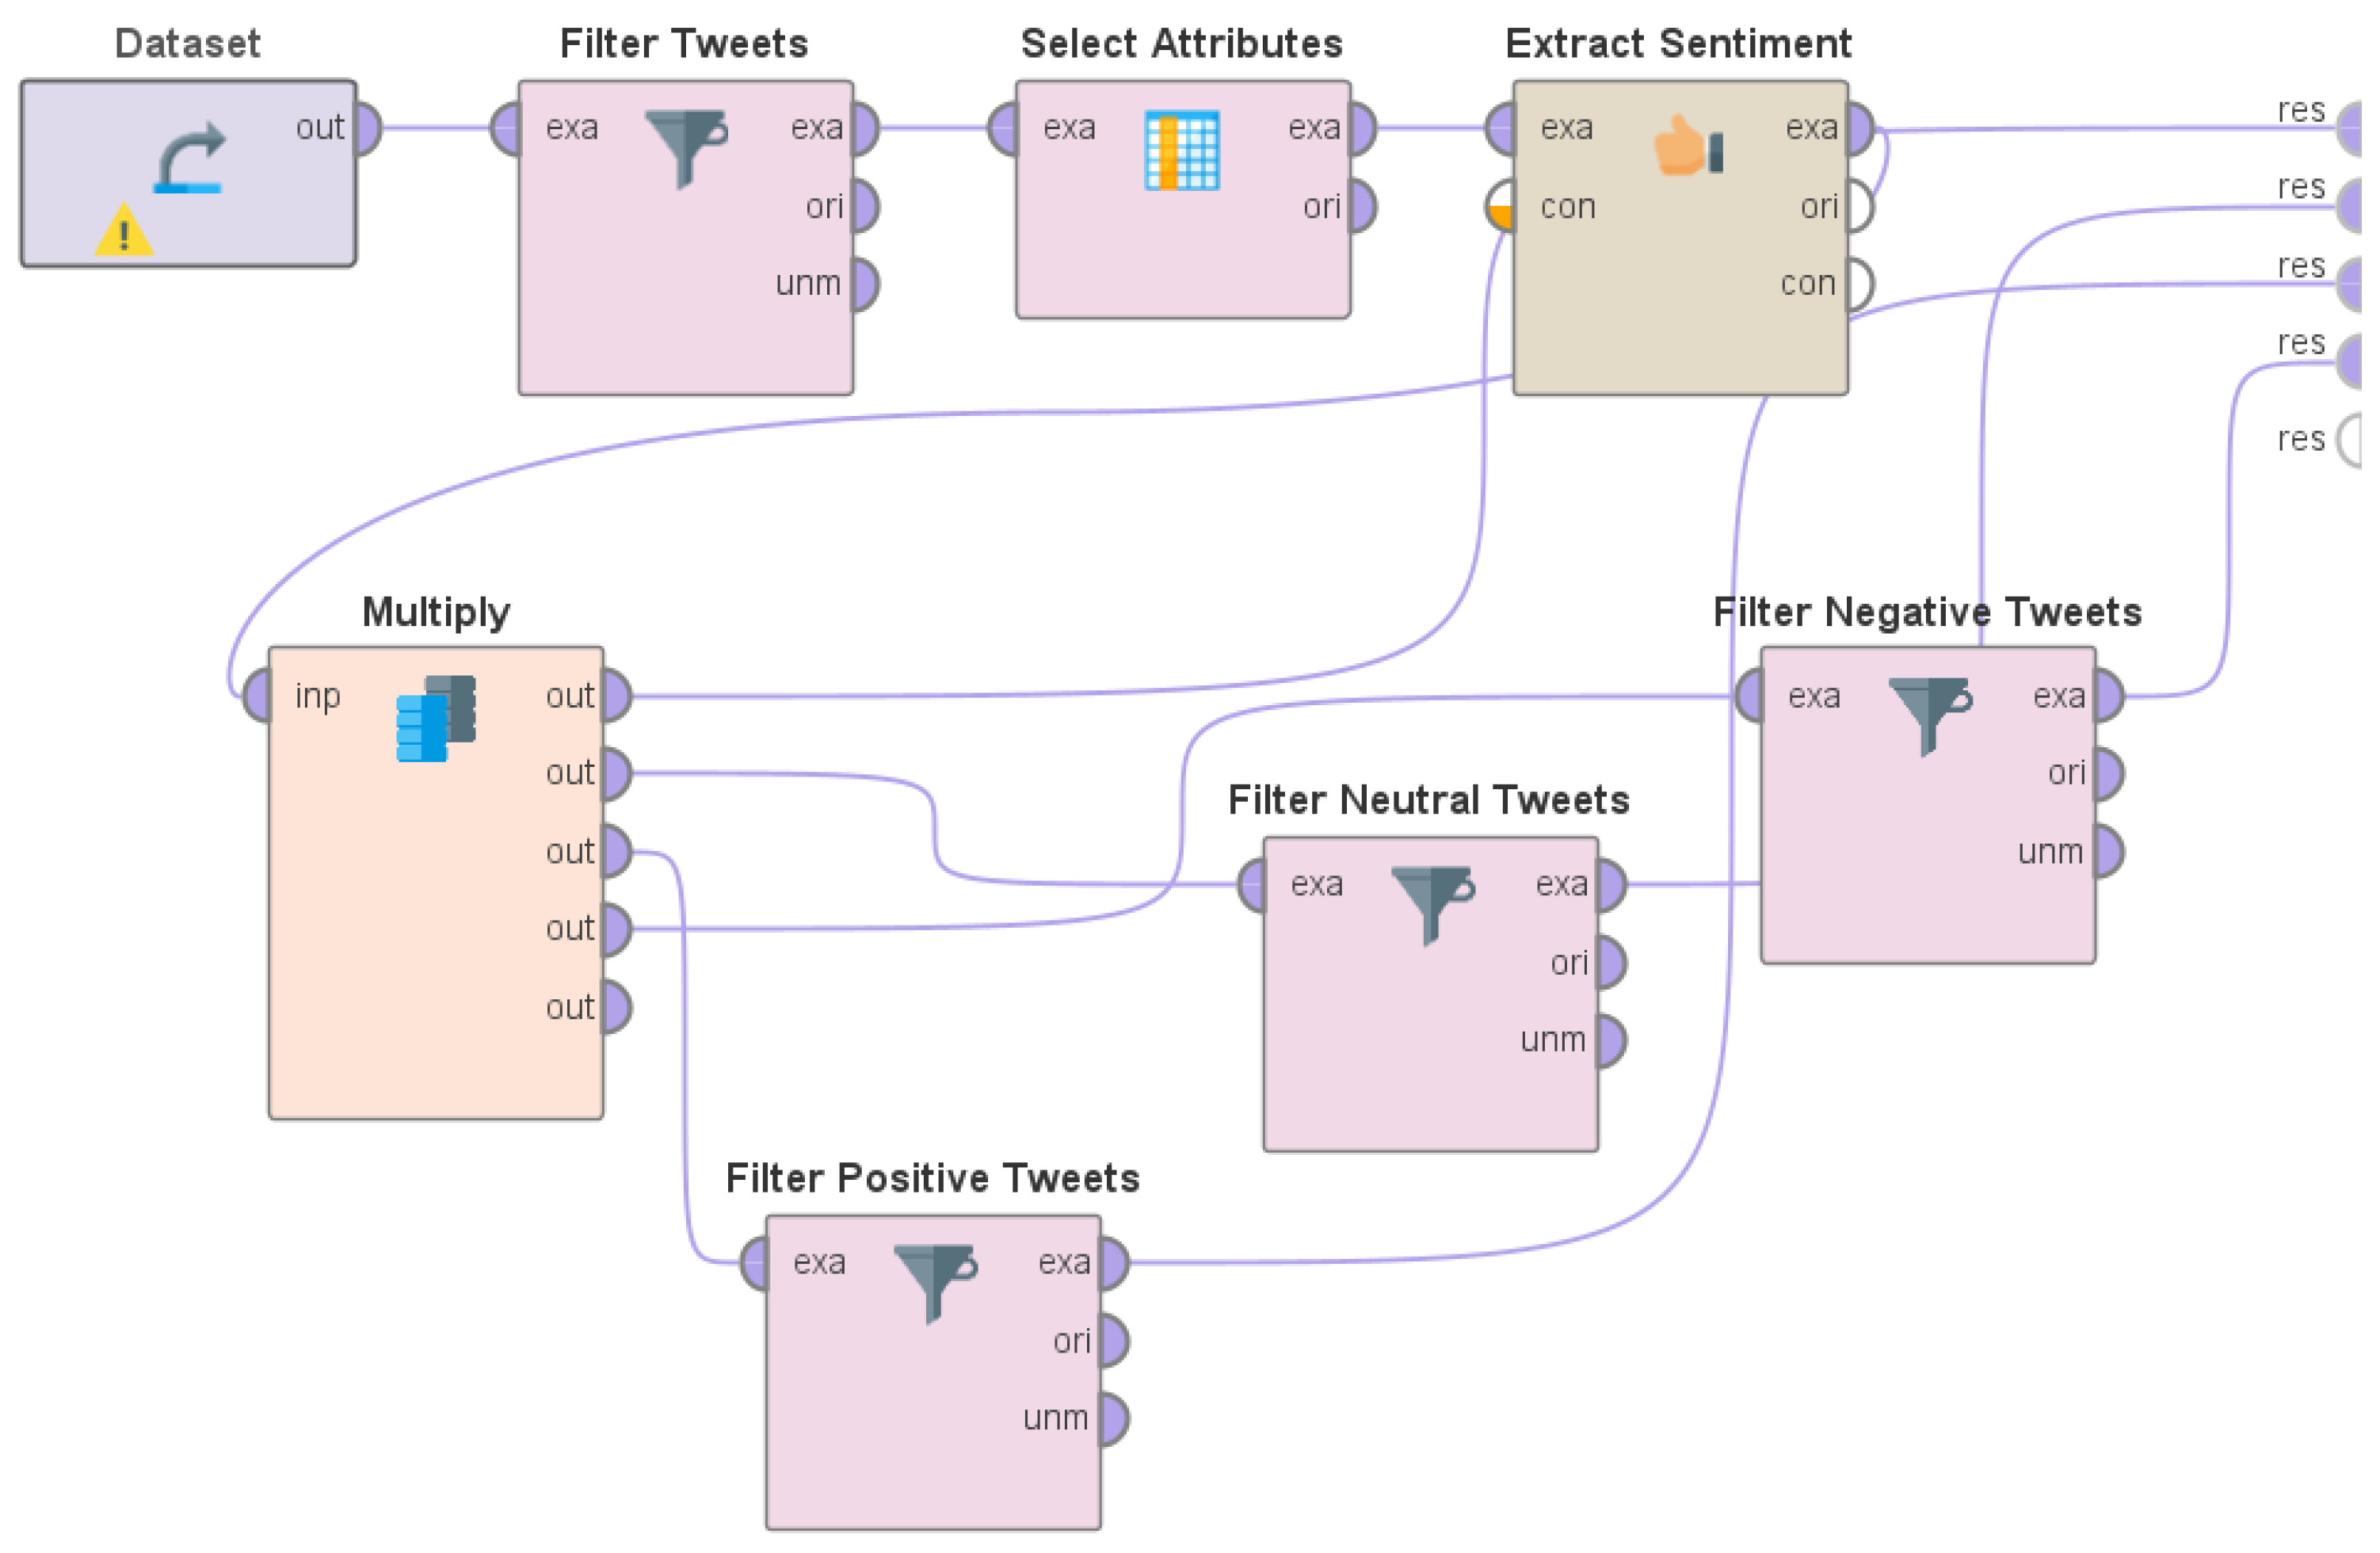
3. Methodology
- The desktop version of Hydrator was downloaded and installed on a computer with a Microsoft Windows 10 Pro operating system (Version 10.0.19043 Build 19043) comprising Intel(R) Core (TM) i7-7600U CPU @ 2.80 GHz, 2904 Mhz, 2 Core(s) and 4 Logical Processor(s)
- The Hydrator app was then connected to the Twitter API by clicking on the “Link Twitter Account” button on the app’s interface.
- This next step involved uploading a dataset file to the Hydrator app for hydration. As the Hydrator app allows only one file to be uploaded at a time, all the dataset files (containing only Tweet IDs) were merged to create one .txt file, which was uploaded to the app.
- Then, specific information about the uploaded dataset file (such as Title, Creator, Publisher, and URL) was entered in the Hydrator app, and then the “Add Dataset” button was clicked to complete the process of dataset upload.
- Thereafter, in the “Datasets” tab of the Hydrator app, the “Start” button was clicked to initiate the process of hydration.
- a.
- VADER distinguishes itself from LIWC, as it is more sensitive to sentiment expressions in social media contexts.
- b.
- The General Inquirer suffers from a lack of coverage of sentiment-relevant lexical features common to social text.
- c.
- The ANEW lexicon is also insensitive to common sentiment-relevant lexical features in social text.
- d.
- The SentiWordNet lexicon is very noisy; a large majority of synsets have no positive or negative polarity.
- e.
- The Naïve Bayes classifier involves the naïve assumption that feature probabilities are independent of one another.
- f.
- The Maximum Entropy approach makes no conditional independence assumption between features and thereby accounts for information entropy (feature weightings).
- g.
- In general, machine-learning classifiers require (often extensive) training data, which are, as with validated sentiment lexicons, sometimes troublesome to acquire.
- h.
- In general, machine-learning classifiers also depend on the training set to represent as many features as possible.
4. Results and Discussion
4.1. Results of Sentiment Analysis
4.2. Results of Text Analysis
4.3. Comparative Study with Prior Works
5. Conclusions
Funding
Institutional Review Board Statement
Data Availability Statement
Conflicts of Interest
References
- Katz, M.; Nandi, N. Social Media and Medical Education in the Context of the COVID-19 Pandemic: Scoping Review. JMIR Med. Educ. 2021, 7, e25892. [Google Scholar] [CrossRef]
- Lee, H.E.; Cho, J. Social Media Use and Well-Being in People with Physical Disabilities: Influence of SNS and Online Community Uses on Social Support, Depression, and Psychological Disposition. Health Commun. 2019, 34, 1043–1052. [Google Scholar] [CrossRef]
- Kavada, A. Social Media as Conversation: A Manifesto. Soc. Media Soc. 2015, 1, 205630511558079. [Google Scholar] [CrossRef] [Green Version]
- Statista. Twitter: Number of Users Worldwide 2024. Available online: https://www.statista.com/statistics/303681/twitter-users-worldwide/ (accessed on 26 March 2023).
- Hutchinson, A. New Study Shows Twitter Is the Most Used Social Media Platform among Journalists. Social Media Today, 28 June 2022. Available online: https://www.socialmediatoday.com/news/new-study-shows-twitter-is-the-most-used-social-media-platform-among-journa/626245/ (accessed on 26 March 2023).
- Statista. Biggest Social Media Platforms 2023. Available online: https://www.statista.com/statistics/272014/global-social-networks-ranked-by-number-of-users/ (accessed on 26 March 2023).
- Taecharungroj, V. What Can ChatGPT Do? Analyzing Early Reactions to the Innovative AI Chatbot on Twitter. Big Data Cogn. Comput. 2023, 7, 35. [Google Scholar] [CrossRef]
- Tao, W.; Peng, Y. Differentiation and Unity: A Cross-Platform Comparison Analysis of Online Posts’ Semantics of the Russian–Ukrainian War Based on Weibo and Twitter. Commun. Public 2023, 205704732311655. [Google Scholar] [CrossRef]
- Ante, L. How Elon Musk’s Twitter Activity Moves Cryptocurrency Markets. Technol. Forecast. Soc. Chang. 2023, 186, 122112. [Google Scholar] [CrossRef]
- Thakur, N.; Han, C.Y. An Approach to Analyze the Social Acceptance of Virtual Assistants by Elderly People. In Proceedings of the 8th International Conference on the Internet of Things, Santa Barbara, CA, USA, 15–18 October 2018; ACM: New York, NY, USA, 2018. [Google Scholar]
- Di Cara, N.H.; Maggio, V.; Davis, O.S.P.; Haworth, C.M.A. Methodologies for Monitoring Mental Health on Twitter: Systematic Review. J. Med. Internet Res. 2023, 25, e42734. [Google Scholar] [CrossRef]
- Thakur, N.; Han, C.Y. A Framework for facilitating human-human interactions to mitigate loneliness in elderly. In Human Interaction, Emerging Technologies and Future Applications III; Springer International Publishing: Cham, Switzerland, 2021; pp. 322–327. ISBN 9783030553067. [Google Scholar]
- Thakur, N.; Han, C.Y. A human-human interaction-driven framework to address societal issues. In Human Interaction, Emerging Technologies and Future Systems V; Springer International Publishing: Cham, Switzerland, 2022; pp. 563–571. [Google Scholar]
- Shaheer, I.; Carr, N.; Insch, A. Rallying Support for Animal Welfare on Twitter: A Tale of Four Destination Boycotts. Tour. Recreat. Res. 2021, 48, 384–398. [Google Scholar] [CrossRef]
- Daume, S.; Galaz, V.; Bjersér, P. Automated Framing of Climate Change? The Role of Social Bots in the Twitter Climate Change Discourse during the 2019/2020 Australia Bushfires. Soc. Media Soc. 2023, 9, 205630512311683. [Google Scholar] [CrossRef]
- Thakur, N.; Han, C.Y. A Multimodal approach for early detection of cognitive impairment from tweets. In Human Interaction, Emerging Technologies and Future Systems V; Springer International Publishing: Cham, Switzerland, 2022; pp. 11–19. [Google Scholar]
- Pezoa-Fuentes, C.; García-Rivera, D.; Matamoros-Rojas, S. Sentiment and Emotion on Twitter: The Case of the Global Consumer Electronics Industry. J. Theor. Appl. Electron. Commer. Res. 2023, 18, 765–776. [Google Scholar] [CrossRef]
- Yadav, J.; Yadav, A.; Misra, M.; Rana, N.P.; Zhou, J. Role of Social Media in Technology Adoption for Sustainable Agriculture Practices: Evidence from Twitter Analytics. Commun. Assoc. Inf. Syst. 2023, 52, 35. [Google Scholar]
- Golder, S.; Stevens, R.; O’Connor, K.; James, R.; Gonzalez-Hernandez, G. Methods to Establish Race or Ethnicity of Twitter Users: Scoping Review. J. Med. Internet Res. 2022, 24, e35788. [Google Scholar] [CrossRef]
- Bodaghi, A.; Oliveira, J. The Theater of Fake News Spreading, Who Plays Which Role? A Study on Real Graphs of Spreading on Twitter. Expert Syst. Appl. 2022, 189, 116110. [Google Scholar] [CrossRef]
- Chang, R.-C.; Rao, A.; Zhong, Q.; Wojcieszak, M.; Lerman, K. #RoeOverturned: Twitter Dataset on the Abortion Rights Controversy. arXiv 2023, arXiv:2302.01439. [Google Scholar]
- Bhatia, K.V. Hindu Nationalism Online: Twitter as Discourse and Interface. Religions 2022, 13, 739. [Google Scholar] [CrossRef]
- Thakur, N.; Hall, I.; Han, C.Y. A Comprehensive Study to Analyze Trends in Web Search Interests Related to Fall Detection before and after COVID-19. In Proceedings of the 2022 5th International Conference on Computer Science and Software Engineering (CSSE 2022), Guilin, China, 21–23 October 2022; ACM: New York, NY, USA, 2022. [Google Scholar]
- Thakur, N.; Han, C.Y. Country-Specific Interests towards Fall Detection from 2004–2021: An Open Access Dataset and Research Questions. Data 2021, 6, 92. [Google Scholar] [CrossRef]
- Peña-Fernández, S.; Larrondo-Ureta, A.; Morales-i-Gras, J. Feminism, gender identity and polarization in TikTok and Twitter. Comunicar 2023, 31, 47–58. [Google Scholar] [CrossRef]
- Berrocal-Gonzalo, S.; Zamora-Martínez, P.; González-Neira, A. Politainment on Twitter: Engagement in the Spanish Legislative Elections of April 2019. Media Commun. 2023, 11, 163–175. [Google Scholar] [CrossRef]
- Collins, S.; DeWitt, J. Words Matter: Presidents Obama and Trump, Twitter, and US Soft Power. World Aff. 2023, 004382002311616. [Google Scholar] [CrossRef]
- Goetz, S.J.; Heaton, C.; Imran, M.; Pan, Y.; Tian, Z.; Schmidt, C.; Qazi, U.; Ofli, F.; Mitra, P. Food Insufficiency and Twitter Emotions during a Pandemic. Appl. Econ. Perspect. Policy 2022, 45, 1189–1210. [Google Scholar] [CrossRef]
- Klein, A.Z.; Kunatharaju, S.; O’Connor, K.; Gonzalez-Hernandez, G. Pregex: Rule-Based Detection and Extraction of Twitter Data in Pregnancy. J. Med. Internet Res. 2023, 25, e40569. [Google Scholar] [CrossRef]
- Klein, A.Z.; O’Connor, K.; Levine, L.D.; Gonzalez-Hernandez, G. Using Twitter Data for Cohort Studies of Drug Safety in Pregnancy: Proof-of-Concept with β-Blockers. JMIR Form. Res. 2022, 6, e36771. [Google Scholar] [CrossRef] [PubMed]
- Thakur, N.; Han, C.Y. Google trends to investigate the degree of global interest related to indoor location detection. In Human Interaction, Emerging Technologies and Future Systems V; Springer International Publishing: Cham, Switzerland, 2022; pp. 580–588. [Google Scholar]
- Russell, A.M.T.; Hing, N.; Bryden, G.M.; Thorne, H.; Rockloff, M.J.; Browne, M. Gambling Advertising on Twitter before, during and after the Initial Australian COVID-19 Lockdown. J. Behav. Addict. 2023, 1. [Google Scholar] [CrossRef] [PubMed]
- Mouronte-López, M.L.; Ceres, J.S.; Columbrans, A.M. Analysing the Sentiments about the Education System Trough Twitter. Educ. Inf. Technol. 2023, 1–30. [Google Scholar] [CrossRef] [PubMed]
- Thakur, N. Twitter Big Data as a Resource for Exoskeleton Research: A Large-Scale Dataset of about 140,000 Tweets from 2017–2022 and 100 Research Questions. Analytics 2022, 1, 72–97. [Google Scholar] [CrossRef]
- Skovgaard, L.; Grundtvig, A. Who Tweets What about Personalised Medicine? Promises and Concerns from Twitter Discussions in Denmark. Digit. Health 2023, 9, 20552076231169830. [Google Scholar] [CrossRef] [PubMed]
- Li, X.; Hasan, S.; Culotta, A. Identifying Hurricane Evacuation Intent on Twitter. In Proceedings of the International AAAI Conference on Web and Social Media, Atlanta, GA, USA, 6–9 June 2022; Volume 16, pp. 618–627. [Google Scholar] [CrossRef]
- Monika; Bhat, A. Automatic Twitter Crime Prediction Using Hybrid Wavelet Convolutional Neural Network with World Cup Optimization. Intern. J. Pattern Recognit. Artif. Intell. 2022, 36, 2250019. [Google Scholar] [CrossRef]
- Lawelai, H.; Sadat, A.; Suherman, A. Democracy and Freedom of Opinion in Social Media: Sentiment Analysis on Twitter. PRAJA J. Ilm. Pemerintah. 2022, 10, 40–48. [Google Scholar] [CrossRef]
- Abu Samah, K.A.F.; Amirah Misdan, N.F.; Hasrol Jono, M.N.H.; Riza, L.S. The Best Malaysian Airline Companies Visualization through Bilingual Twitter Sentiment Analysis: A Machine Learning Classification. JOIV Int. J. Inform. Vis. 2022, 6, 130. [Google Scholar] [CrossRef]
- Lazard, A.J.; Scheinfeld, E.; Bernhardt, J.M.; Wilcox, G.B.; Suran, M. Detecting Themes of Public Concern: A Text Mining Analysis of the Centers for Disease Control and Prevention’s Ebola Live Twitter Chat. Am. J. Infect. Control 2015, 43, 1109–1111. [Google Scholar] [CrossRef]
- Bolotova, Y.V.; Lou, J.; Safro, I. Detecting and Monitoring Foodborne Illness Outbreaks: Twitter Communications and the 2015 U.S. Salmonella Outbreak Linked to Imported Cucumbers. arXiv 2017, arXiv:1703.05025. [Google Scholar]
- Gomide, J.; Veloso, A.; Almeida, V.; Benevenuto, F.; Ferraz, F.; Teixeira, M.; Meira, W., Jr. Dengue Surveillance Based on a Computational Model of Spatio-Temporal Locality of Twitter. In Proceedings of the 3rd International Web Science Conference, Koblenz, Germany, 14–17 June 2011. [Google Scholar]
- Tomaszewski, T.; Walczak, P.; Rak, R.; Białobrzeska, O.; Kopczyński, P.; Nielek, R. Identifying False Human Papillomavirus (HPV) Vaccine Information and Corresponding Risk Perceptions from Twitter: Advanced Predictive Models. J. Med. Internet Res. 2021, 23, e30451. [Google Scholar] [CrossRef] [PubMed]
- Lee, S.Y.; Khang, Y.H.; Lim, H.K. Impact of the 2015 Middle East Respiratory Syndrome Outbreak on Emergency Care Utilization and Mortality in South Korea. Yonsei Med. J. 2019, 60, 796–803. [Google Scholar] [CrossRef]
- Radzikowski, J.; Stefanidis, A.; Jacobsen, K.H.; Croitoru, A.; Crooks, A.; Delamater, P.L. The measles vaccination narrative in Twitter: A quantitative analysis. JMIR Public Health Surveill. 2016, 2, e1. [Google Scholar] [CrossRef] [PubMed]
- Fu, K.-W.; Liang, H.; Saroha, N.; Tse, Z.T.H.; Ip, P.; Fung, I.C.-H. How people react to Zika virus outbreaks on Twitter? A computational content analysis. Am. J. Infect. Control 2016, 44, 1700–1702. [Google Scholar] [CrossRef]
- Signorini, A.; Segre, A.M.; Polgreen, P.M. The use of Twitter to track levels of disease activity and public concern in the U.S. during the influenza A H1N1 pandemic. PLoS ONE 2011, 6, e19467. [Google Scholar] [CrossRef] [Green Version]
- Gesualdo, F.; Stilo, G.; D’Ambrosio, A.; Carloni, E.; Pandolfi, E.; Velardi, P.; Tozzi, A.E. Influenza-like illness surveillance on Twitter through automated learning of naïve language. PLoS ONE 2013, 8, e82489. [Google Scholar] [CrossRef] [PubMed] [Green Version]
- Szomszor, M.; Kostkova, P.; de Quincey, E. #swineflu: Twitter predicts swine flu outbreak in 2009. In Proceedings of the 6th International Conference on Information Technology and Applications in Biomedicine, ITAB 2009, Larnaca, Cyprus, 4–7 November 2009; Springer: Berlin/Heidelberg, Germany, 2011; pp. 18–26. [Google Scholar]
- Alessa, A.; Faezipour, M. Flu outbreak prediction using Twitter posts classification and linear regression with historical Centers for Disease Control and Prevention reports: Prediction framework study. JMIR Public Health Surveill. 2019, 5, e12383. [Google Scholar] [CrossRef] [Green Version]
- Hirschfeld, D. Twitter data accurately tracked Haiti cholera outbreak. Nature 2012. [Google Scholar] [CrossRef]
- Van der Vyver, A.G. The listeriosis outbreak in South Africa: A Twitter analysis of public reaction. In Proceedings of the 18th International Conference on Management of Information & Communication Technology (ICMICT), Cape Town, South Africa, 26–27 September 2018. [Google Scholar]
- Thackeray, R.; Burton, S.H.; Giraud-Carrier, C.; Rollins, S.; Draper, C.R. Using Twitter for breast cancer prevention: An analysis of breast cancer awareness month. BMC Cancer 2013, 13, 508. [Google Scholar] [CrossRef] [Green Version]
- Da, B.L.; Im, G.Y.; Schiano, T.D.; Gulati, R. Twitter as a noninvasive bio-marker for trends in liver disease. Hepatol. Commun. 2019, 3, 1271–1280. [Google Scholar] [CrossRef] [Green Version]
- Szvarca, D.; Tabbara, N.; Masur, J.; Greenfest, A.; Clarke, L.M.; Borum, M.L. P013 Unregulated: Medical companies use social media to sell alternative treatments for inflammatory bowel disease. Inflamm. Bowel Dis. 2019, 25, S8. [Google Scholar] [CrossRef]
- McLean, R.; Shirazian, S. Women and Kidney Disease: A Twitter Conversation for One and All. Kidney Int. Rep. 2018, 3, 767–768. [Google Scholar] [CrossRef] [PubMed]
- Stens, O.; Weisman, M.H.; Simard, J.; Reuter, K. Insights from Twitter Conversations on Lupus and Reproductive Health: Protocol for a Content Analysis. JMIR Res. Protoc. 2020, 9, e15623. [Google Scholar] [CrossRef]
- Cevik, F.; Kilimci, Z.H. Analysis of Parkinson’s Disease Using Deep Learning and Word Embedding Models. Acad. Perspect. Procedia 2019, 2, 786–797. [Google Scholar] [CrossRef]
- Porat, T.; Garaizar, P.; Ferrero, M.; Jones, H.; Ashworth, M.; Vadillo, M.A. Content and Source Analysis of Popular Tweets Following a Recent Case of Diphtheria in Spain. Eur. J. Public Health 2019, 29, 117–122. [Google Scholar] [CrossRef] [PubMed]
- Sugumaran, R.; Voss, J. Real-Time Spatio-Temporal Analysis of West Nile Virus Using Twitter Data. In Proceedings of the 3rd International Conference on Computing for Geospatial Research and Applications, Washington, DC, USA, 1–3 July 2012. [Google Scholar]
- Ksiazek, T.G.; Erdman, D.; Goldsmith, C.S.; Zaki, S.R.; Peret, T.; Emery, S.; Tong, S.; Urbani, C.; Comer, J.A.; Lim, W.; et al. A Novel Coronavirus Associated with Severe Acute Respiratory Syndrome. N. Engl. J. Med. 2003, 348, 1953–1966. [Google Scholar] [CrossRef]
- Fauci, A.S.; Lane, H.C.; Redfield, R.R. COVID-19—Navigating the Uncharted. N. Engl. J. Med. 2020, 382, 1268–1269. [Google Scholar] [CrossRef] [PubMed]
- CDC. SARS-CoV-2 Variant Classifications and Definitions. Centers for Disease Control and Prevention, 21 March 2023. Available online: https://www.cdc.gov/coronavirus/2019-ncov/variants/variant-classifications.html (accessed on 26 March 2023).
- Worldometer. COVID—Coronavirus Statistics—Worldometer. Available online: https://www.worldometers.info/coronavirus/ (accessed on 13 May 2023).
- Huang, C.; Wang, Y.; Li, X.; Ren, L.; Zhao, J.; Hu, Y.; Zhang, L.; Fan, G.; Xu, J.; Gu, X.; et al. Clinical Features of Patients Infected with 2019 Novel Coronavirus in Wuhan, China. Lancet 2020, 395, 497–506. [Google Scholar] [CrossRef] [Green Version]
- Iser, B.P.M.; Sliva, I.; Raymundo, V.T.; Poleto, M.B.; Schuelter-Trevisol, F.; Bobinski, F. Suspected COVID-19 Case Definition: A Narrative Review of the Most Frequent Signs and Symptoms among Confirmed Cases. Epidemiol. Serv. Saude 2020, 29, e2020233. [Google Scholar]
- Al Khatib, H.A.; Amor, N.M.; Hussain, A.H.; Al-Mulla, F. Within-Host Diversity of SARS-CoV-2 in COVID-19 Patients with Variable Disease Severities. Front. Cell. Infect. Microbiol. 2020, 10, 575613. [Google Scholar] [CrossRef] [PubMed]
- McCollum, A.M.; Damon, I.K. Human Monkeypox. Clin. Infect. Dis. 2014, 58, 260–267. [Google Scholar] [CrossRef] [PubMed] [Green Version]
- von Magnus, P.; Andersen, E.K.; Petersen, K.B.; Birch-Andersen, A. A pox-like disease in Cynomolgus monkeys. Acta Pathol. Microbiol. Scand. 2009, 46, 156–176. [Google Scholar] [CrossRef]
- Charniga, K.; Matson, M.J.; Ali, H.; Bower, H.; Painter, J.; Doshi, R.; O’Hara, M.; Sealy, T.K.; Kuhn, J.H.; Ladner, J.T. Estimating the incubation period of monkeypox virus during the 2022 multi-national outbreak. medRxiv 2022. [Google Scholar] [CrossRef]
- Jezek, Z.; Szczeniowski, M.; Paluku, K.M.; Mutombo, M. Human monkeypox: Clinical features of 282 patients. J. Infect. Dis. 1987, 156, 293–298. [Google Scholar] [CrossRef]
- Centers for Disease Control and Prevention (CDC). Update: Multistate outbreak of monkeypox--Illinois, Indiana, Kansas, Missouri, Ohio, and Wisconsin, 2003. MMWR Morb. Mortal. Wkly. Rep. 2003, 52, 561–564. [Google Scholar]
- Vaughan, A.; Ainslie, K.E.C.; Baillie, J.K.; Delgado, R.; Edwards, T.; Faria, N.R.; Laydon, D.J.; Lee, J.C.; Mahalingam, S.; Meakin, S.; et al. Two Cases of Monkeypox Imported to the United Kingdom, September 2018. Euro Surveill. 2018, 23, 38. [Google Scholar] [CrossRef] [Green Version]
- Yinka-Ogunleye, A.; Aruna, O.; Dalhat, M.; Ogoina, D.; McCollum, A.; Disu, Y.; Nwangwu, U.; Waziri, N.; Ahmad, A.; Shettima, M.; et al. Outbreak of human monkeypox in Nigeria in 2017–18: A clinical and epidemiological report. Lancet Infect. Dis. 2019, 19, 872–879. [Google Scholar] [CrossRef]
- Centers for Disease Control and Prevention (CDC). 2022 Mpox Outbreak Global Map. Available online: https://www.cdc.gov/poxvirus/mpox/response/2022/world-map.html (accessed on 27 February 2023).
- Medhat, W.; Hassan, A.; Korashy, H. Sentiment Analysis Algorithms and Applications: A Survey. Ain Shams Eng. J. 2014, 5, 1093–1113. [Google Scholar] [CrossRef] [Green Version]
- Vijay, T.; Chawla, A.; Dhanka, B.; Karmakar, P. Sentiment Analysis on COVID-19 Twitter Data. In Proceedings of the 2020 5th IEEE International Conference on Recent Advances and Innovations in Engineering (ICRAIE), Jaipur, India, 1–3 December 2020; pp. 1–7. [Google Scholar]
- Mansoor, M.; Gurumurthy, K.; Anantharam, R.U.; Prasad, V.R.B. Global sentiment analysis of COVID-19 tweets over time. arXiv 2020, arXiv:2010.14234. [Google Scholar]
- Pokharel, B.P. Twitter sentiment analysis during COVID-19 outbreak in Nepal. SSRN Electron. J. 2020. [Google Scholar] [CrossRef]
- Chakraborty, K.; Bhatia, S.; Bhattacharyya, S.; Platos, J.; Bag, R.; Hassanien, A.E. Sentiment Analysis of COVID-19 tweets by Deep Learning Classifiers-A study to show how popularity is affecting accuracy in social media. Appl. Soft Comput. 2020, 97, 106754. [Google Scholar] [CrossRef] [PubMed]
- Shofiya, C.; Abidi, S. Sentiment analysis on COVID-19-related social distancing in Canada using Twitter data. Int. J. Environ. Res. Public Health 2021, 18, 5993. [Google Scholar] [CrossRef]
- Basiri, M.E.; Nemati, S.; Abdar, M.; Asadi, S.; Acharrya, U.R. A novel fusion-based deep learning model for sentiment analysis of COVID-19 tweets. Knowl. Based Syst. 2021, 228, 107242. [Google Scholar] [CrossRef]
- Cheeti, S.S.; Li, Y.; Hadaegh, A. Twitter based sentiment analysis of impact of COVID-19 on education globally. Int. J. Artif. Intell. Appl. 2021, 12, 15–24. [Google Scholar]
- Mohamed Ridhwan, K.; Hargreaves, C.A. Leveraging Twitter data to understand public sentiment for the COVID-19 outbreak in Singapore. Int. J. Inf. Manag. Data Insights 2021, 1, 100021. [Google Scholar] [CrossRef]
- Tripathi, M. Sentiment analysis of Nepali COVID19 tweets using N.B., SVM AND LSTM. J. Artif. Intell. Capsul. Netw. 2021, 3, 151–168. [Google Scholar] [CrossRef]
- Sitaula, C.; Basnet, A.; Mainali, A.; Shahi, T.B. Deep learning-based methods for sentiment analysis on Nepali COVID-19-related tweets. Comput. Intell. Neurosci. 2021, 2021, 2158184. [Google Scholar] [CrossRef] [PubMed]
- Gupta, P.; Kumar, S.; Suman, R.R.; Kumar, V. Sentiment analysis of lockdown in India during COVID-19: A case study on Twitter. IEEE Trans. Comput. Soc. Syst. 2021, 8, 992–1002. [Google Scholar] [CrossRef]
- Alanezi, M.A.; Hewahi, N.M. Tweets sentiment analysis during COVID-19 pandemic. In Proceedings of the 2020 International Conference on Data Analytics for Business and Industry: Way towards a Sustainable Economy (ICDABI), Sakheer, Bahrain, 26–27 October 2020; pp. 1–6. [Google Scholar]
- Dubey, A.D. Twitter Sentiment Analysis during COVID-19 Outbreak. SSRN Electron. J. 2020. [Google Scholar] [CrossRef]
- Rahman, M.M.; Islam, M.N. Exploring the performance of ensemble machine learning classifiers for sentiment analysis of COVID-19 tweets. In Advances in Intelligent Systems and Computing; Springer Singapore: Singapore, 2022; pp. 383–396. [Google Scholar]
- Ainley, E.; Witwicki, C.; Tallett, A.; Graham, C. Using Twitter comments to understand people’s experiences of U.K. health care during the COVID-19 pandemic: Thematic and sentiment analysis. J. Med. Internet Res. 2021, 23, e31101. [Google Scholar] [CrossRef] [PubMed]
- Slobodin, O.; Plochotnikov, I.; Cohen, I.-C.; Elyashar, A.; Cohen, O.; Puzis, R. Global and local trends affecting the experience of U.S. and U.K. healthcare professionals during COVID-19: Twitter text analysis. Int. J. Environ. Res. Public Health 2022, 19, 6895. [Google Scholar] [CrossRef] [PubMed]
- Zou, C.; Wang, X.; Xie, Z.; Li, D. Public reactions towards the COVID-19 pandemic on Twitter in the United Kingdom and the United States. medRxiv 2020. [Google Scholar] [CrossRef]
- Alhuzali, H.; Zhang, T.; Ananiadou, S. Emotions and topics expressed on Twitter during the COVID-19 pandemic in the United Kingdom: Comparative geolocation and text mining analysis. J. Med. Internet Res. 2022, 24, e40323. [Google Scholar] [CrossRef]
- Hussain, Z.; Sheikh, Z.; Tahir, A.; Dashtipour, K.; Gogate, M.; Sheikh, A.; Hussain, A. Artificial intelligence-enabled social media analysis for pharmacovigilance of COVID-19 vaccinations in the United Kingdom: Observational study. JMIR Public Health Surveill. 2022, 8, e32543. [Google Scholar] [CrossRef] [PubMed]
- Liu, S.; Liu, J. Public attitudes toward COVID-19 vaccines on English-language Twitter: A sentiment analysis. Vaccine 2021, 39, 5499–5505. [Google Scholar] [CrossRef]
- Hu, T.; Wang, S.; Luo, W.; Zhang, M.; Huang, X.; Yan, Y.; Liu, R.; Ly, K.; Kacker, V.; She, B.; et al. Revealing public opinion towards COVID-19 vaccines with Twitter data in the United States: Spatiotemporal perspective. J. Med. Internet Res. 2021, 23, e30854. [Google Scholar] [CrossRef] [PubMed]
- Khan, R.; Rustam, F.; Kanwal, K.; Mehmood, A.; Choi, G.S. U.S. based COVID-19 tweets sentiment analysis using TextBlob and supervised machine learning algorithms. In Proceedings of the 2021 International Conference on Artificial Intelligence (ICAI), Lucknow, India, 22–23 May 2021; pp. 1–8. [Google Scholar]
- Ahmed, M.E.; Rabin, M.R.I.; Chowdhury, F.N. COVID-19: Social media sentiment analysis on reopening. arXiv 2020, arXiv:2006.00804. [Google Scholar]
- Bustos, V.P.; Comer, C.D.; Manstein, S.M.; Laikhter, E.; Shiah, E.; Xun, H.; Lee, B.T.; Lin, S.J. Twitter Voices: Twitter Users’ Sentiments and Emotions about COVID-19 Vaccination within the United States. Eur. J. Environ. Public Health 2022, 6, em0096. [Google Scholar]
- Jang, H.; Rempel, E.; Roe, I.; Adu, P.; Carenini, G.; Janjua, N.Z. Tracking Public Attitudes toward COVID-19 Vaccination on Tweets in Canada: Using Aspect-Based Sentiment Analysis. J. Med. Internet Res. 2022, 24, e35016. [Google Scholar] [CrossRef]
- Tsao, S.-F.; MacLean, A.; Chen, H.; Li, L.; Yang, Y.; Butt, Z.A. Public Attitudes during the Second Lockdown: Sentiment and Topic Analyses Using Tweets from Ontario, Canada. Int. J. Public Health 2022, 67, 1604658. [Google Scholar] [CrossRef] [PubMed]
- Griffith, J.; Marani, H.; Monkman, H. COVID-19 Vaccine Hesitancy in Canada: Content Analysis of Tweets Using the Theoretical Domains Framework. J. Med. Internet Res. 2021, 23, e26874. [Google Scholar] [CrossRef] [PubMed]
- Chum, A.; Nielsen, A.; Bellows, Z.; Farrell, E.; Durette, P.-N.; Balnda, J.M.; Cupchik, G. Changes in Public Response Associated with Various COVID-19 Restrictions in Ontario, Canada: Observational Infoveillance Study Using Social Media Time Series Data. J. Med. Internet Res. 2021, 23, e28716. [Google Scholar] [CrossRef]
- Kothari, A.; Foisey, L.; Donelle, L.; Bauer, M. How Do Canadian Public Health Agencies Respond to the COVID-19 Emergency Using Social Media: A Protocol for a Case Study Using Content and Sentiment Analysis. BMJ Open 2021, 11, e041818. [Google Scholar] [CrossRef] [PubMed]
- Barkur, G.; Vibha; Kamath, G.B. Sentiment Analysis of Nationwide Lockdown Due to COVID 19 Outbreak: Evidence from India. Asian J. Psychiatr. 2020, 51, 102089. [Google Scholar] [CrossRef]
- Afroz, N.; Boral, M.; Sharma, V.; Gupta, M. Sentiment Analysis of COVID-19 Nationwide Lockdown Effect in India. In Proceedings of the 2021 International Conference on Artificial Intelligence and Smart Systems (ICAIS), Coimbatore, India, 25–27 March 2021; pp. 561–567. [Google Scholar]
- Hota, H.S.; Sharma, D.K.; Verma, N. Lexicon-based sentiment analysis using twitter data. In Data Science for COVID-19; Kose, U., Gupta, D., de Albuquerque, V.H.C., Khanna, A., Eds.; Elsevier: San Diego, CA, USA, 2021; pp. 275–295. [Google Scholar]
- Venigalla, A.S.M.; Chimalakonda, S.; Vagavolu, D. Mood of India During COVID-19—An Interactive Web Portal Based on Emotion Analysis of Twitter Data. In Proceedings of the Conference Companion Publication of the 2020 on Computer Supported Cooperative Work and Social Computing, Online, 17–21 October 2020. [Google Scholar]
- Paliwal, S.; Parveen, S.; Alam, M.A.; Ahmed, J. Sentiment Analysis of COVID-19 Vaccine Rollout in India. In ICT Systems and Sustainability; Springer Nature: Singapore, 2022; pp. 21–33. [Google Scholar]
- Zhou, J.; Yang, S.; Xiao, C.; Chen, F. Examination of community sentiment dynamics due to COVID-19 pandemic: A case study from a state in Australia. SN Comput. Sci. 2021, 2, 201. [Google Scholar] [CrossRef] [PubMed]
- Lamsal, R.; Read, M.R.; Karunasekera, S. A Twitter narrative of the COVID-19 pandemic in Australia. arXiv 2023, arXiv:2302.11136. [Google Scholar]
- Zhou, J.; Zogan, H.; Yang, S.; Jameel, S.; Xu, G.; Chen, F. Detecting community depression dynamics due to COVID-19 pandemic in Australia. IEEE Trans. Comput. Soc. Syst. 2021, 8, 982–991. [Google Scholar]
- de Melo, T.; Figueiredo, C.M. Comparing news articles and tweets about COVID-19 in Brazil: Sentiment analysis and topic modeling approach. JMIR Public Health Surveill. 2021, 7, e24585. [Google Scholar] [CrossRef]
- Brum, P.; Teixeira, M.C.; Vimieiro, R.; Araújo, E.; Meira, W., Jr.; Lobo Pappa, G. Political polarization on Twitter during the COVID-19 pandemic: A case study in Brazil. Soc. Netw. Anal. Min. 2022, 12, 140. [Google Scholar] [CrossRef]
- de Sousa, A.M.; Becker, K. Pro/Anti-vaxxers in Brazil: A temporal analysis of COVID vaccination stance in Twitter. In Proceedings of the Anais do IX Symposium on Knowledge Discovery, Mining and Learning (KDMiLe 2021), Rio de Janeiro, Brazil, 4–8 October 2021; pp. 105–112. [Google Scholar]
- Iparraguirre-Villanueva, O.; Alvarez-Risco, A.; Salazar, J.L.H.; Beltozar-Clemente, S.; Zapata-Paulini, J.; Yáñez, J.A.; Cabanillas-Carbonell, M. The public health contribution of sentiment analysis of Monkeypox tweets to detect polarities using the CNN-LSTM model. Vaccines 2023, 11, 312. [Google Scholar] [CrossRef]
- Mohbey, K.K.; Meena, G.; Kumar, S.; Lokesh, K. A CNN-LSTM-based hybrid deep learning approach to detect sentiment polarities on Monkeypox tweets. arXiv 2022, arXiv:2208.12019. [Google Scholar]
- Farahat, R.A.; Yassin, M.A.; Al-Tawfiq, J.A.; Bejan, C.A.; Abdelazeem, B. Public perspectives of monkeypox in Twitter: A social media analysis using machine learning. New Microbes New Infect. 2022, 49, 101053. [Google Scholar] [CrossRef]
- Sv, P.; Ittamalla, R. What concerns the general public the most about monkeypox virus?—A text analytics study based on Natural Language Processing (NLP). Travel Med. Infect. Dis. 2022, 49, 102404. [Google Scholar] [CrossRef] [PubMed]
- Bengesi, S.; Oladunni, T.; Olusegun, R.; Audu, H. A machine learning-sentiment analysis on Monkeypox outbreak: An extensive dataset to show the polarity of public opinion from twitter tweets. IEEE Access 2023, 11, 11811–11826. [Google Scholar] [CrossRef]
- Dsouza, V.S.; Weber, J.F.; Van Lare, S.B.; Henderson, J.M. A sentiment and content analysis of tweets on monkeypox stigma among the LGBTQ+ community: A cue to risk communication plan. Dialogues Health 2023, 2, 100095. [Google Scholar] [CrossRef]
- Zuhanda, M.K.; Syofra AH, S.; Mathelinea, D.; Gio, P.U.; Anisa, Y.A.; Novita, N. Analysis of twitter user sentiment on the monkeypox virus issue using the nrc lexicon. J. Mantik 2023, 6, 3854–3860. [Google Scholar]
- Cooper, L.N.; Thompson, R.C.; Klevens, R.M. Analyzing an emerging pandemic on Twitter: Monkeypox. Open Forum Infect. Dis. 2023, 10, ofad142. [Google Scholar] [CrossRef] [PubMed]
- Ng, Q.X.; Yau, C.E.; Lim, Y.L.; Wong, L.K.T.; Liew, T.M. Public sentiment on the global outbreak of monkeypox: An unsupervised machine learning analysis of 352,182 twitter posts. Public Health 2022, 213, 1–4. [Google Scholar] [CrossRef]
- Thakur, N. MonkeyPox2022Tweets: A Large-Scale Twitter Dataset on the 2022 Monkeypox Outbreak, Findings from Analysis of Tweets, and Open Research Questions. Infect. Dis. Rep. 2022, 14, 855–883. [Google Scholar] [CrossRef]
- Hydrator: Turn Tweet I.D.s into Twitter JSON & CSV from Your Desktop. Available online: https://github.com/docnow/hydrator (accessed on 27 March 2023).
- Thakur, N. A large-scale dataset of Twitter chatter about online learning during the current COVID-19 Omicron wave. Data 2022, 7, 109. [Google Scholar] [CrossRef]
- Hutto, C.J.; Gilbert, E. VADER: A parsimonious rule-based model for sentiment analysis of social media text. Proc. Int. AAAI Conf. Web Soc. Media 2014, 8, 216–225. [Google Scholar] [CrossRef]
- Mierswa, I.; Wurst, M.; Klinkenberg, R.; Scholz, M.; Euler, T. YALE: Rapid prototyping for complex data mining tasks. In Proceedings of the 12th ACM SIGKDD International Conference on Knowledge Discovery and Data Mining, Philadelphia, PA, USA, 20–23 August 2006. [Google Scholar]


| Tweets Related to COVID-19 and MPox | |
|---|---|
| Tweet #1 | They cant figure out how Monkey Pox got here without traveling, and why people are susceptible to it after Covid? Try looking at your immune system after taking the vaccines. Every disease that ever was, is now something for you to fear. Your immune system has been compromised. |
| Tweet #2 | Thanks all you biden fans letting in all these illegal immigrants that have been coming every day since Biden took office. Now we have to worry even more about a new virus coming into this country Monkey Pox forget Covid welcome MONKEY POX |
| Tweet #3 | So, I’ve got my rainbow sticker, Thank you NHS on my window,’ I’ve had my covid vaccine’ on my fb page, Ukraine flag in the garden. It still isn’t enough to show how nice I am! Just need a monkey pox sticker. Deffo going to heaven. Stay safe everyone |
| Tweet #4 | MONKEY POX, I am so not ready for you to show up anywhere.Can you imagine the dilemma of future docs, Now with long COVID, long monkey, monkey heart, monkey lungs, monkey brain might emerge. a monkey mask might help. If lived long enough, might have COVID docs, monkey docs etc |
| Tweet #5 | Are you kidding me, now Monkey Pox?! I’ve spent 3 years caring for my ill wife, fighting against Covid, and trying to survive…now this?! Some days… |
| Tweet #6 | I sure hope the Government doesn’t plan to try to force everyone to get monkey pox vaccines. I’d hate to see where that goes so shortly after covid. |
| Tweet #7 | Another lockdown is incoming. They are trying to make monkey pox look like a pandemic. Their media tools are ready, their vaccines were ready before the pox was introduced. These were the same people that played the COVID19 play. They just changed the name of the movie. Failure! |
| Tweet #8 | Monkey Pox new Covid. Election is coming. Coincidence? No |
| Tweet #9 | First it was maga. Then there came covid. Now, it’s Monkey Pox. When will these horrors end?!? |
| Tweet #10 | No longer scared of disease be it Covid or Monkey pox; I’m scared of loosing more years of my life… |
| Hashtag | Frequency |
|---|---|
| monkeypox | 350 |
| COVID19 | 97 |
| Monkeypox | 88 |
| monkeypox COVID19 | 77 |
| COVID19 monkeypox | 64 |
| COVID | 31 |
| MonkeyPox | 29 |
| SchlongCovid | 27 |
| monkeypoxCOVID | 24 |
| CovidIsNotOver | 21 |
| covidmonkeypox | 21 |
| COVIDmonkeypox | 19 |
| MonkeypoxVirus | 18 |
| monkeypoxCovid_19 | 17 |
| covid19 | 16 |
| COVIDisAirborne | 15 |
| moneypox | 15 |
| monkeypoxcovid | 15 |
| schlongcovid | 15 |
| auspol | 14 |
| COVID19Monkeypox | 13 |
| CovidIsNotOvermonkeypox | 12 |
| MonkeypoxCOVID19 | 12 |
| Covidmonkeypox | 11 |
| Covid19 | 11 |
| LongCovid | 11 |
| covid | 11 |
| covid19monkeypox | 11 |
| Covid_19 | 9 |
| Covid_19monkeypox | 9 |
| LoveIslandUSA | 9 |
| MoneyPox | 9 |
| monkeypoxcovid19 | 9 |
| MonkeypoxCOVID | 8 |
| PrimeMorning | 8 |
| monkeypoxmonkeypox | 8 |
| COVID19ausCOVID19vicWearamask | 7 |
| Covid | 7 |
| Covid19monkeypox | 7 |
| LoveIsland | 7 |
| MedTwitter | 7 |
| MonkeyPoxCOVID19 | 7 |
| monkeypoxCovidIsNotOver | 7 |
| rogerbezanisLetsGoBrandon | 7 |
| CovidMonkeypox | 6 |
| FJB | 6 |
| RussiaUkraine | 6 |
| SmartNews | 6 |
| cdnpoli | 6 |
| covidMonkeypox | 6 |
| Word | Frequency |
|---|---|
| pox | 40,154 |
| monkey | 34,485 |
| Covid | 25,992 |
| covid | 21,385 |
| Monkey | 15,963 |
| COVID | 15,078 |
| Pox | 10,051 |
| monkeypox | 6578 |
| people | 6223 |
| get | 5968 |
| going | 3763 |
| vaccine | 4040 |
| Monkeypox | 3247 |
| got | 3004 |
| time | 2744 |
| know | 2579 |
| shit | 2565 |
| virus | 2540 |
| go | 2331 |
| think | 2286 |
| pandemic | 2226 |
| flu | 2096 |
| want | 2008 |
| polio | 1939 |
| getting | 1985 |
| health | 2005 |
| cases | 2036 |
| spread | 2006 |
| see | 1895 |
| world | 1823 |
| vaccines | 1808 |
| thing | 1614 |
| why | 1586 |
| mask | 1559 |
| years | 1518 |
| make | 1393 |
| disease | 1365 |
| said | 1373 |
| work | 1403 |
| say | 1237 |
| keep | 1167 |
| Polio | 1128 |
| POX | 1133 |
| scared | 1216 |
| fear | 1155 |
| outbreak | 1125 |
| Biden | 1131 |
| Ukraine | 1064 |
| year | 1127 |
| emergency | 1146 |
| stop | 1119 |
| come | 1033 |
| ay | 1092 |
| change | 1017 |
| spreading | 1010 |
| good | 1006 |
| coming | 985 |
| masks | 987 |
| global | 973 |
| bad | 954 |
| HIV | 943 |
| climate | 925 |
| trying | 897 |
| Why | 940 |
| day | 898 |
| MONKEY | 862 |
| news | 903 |
| vaccinated | 893 |
| cause | 862 |
| stay | 827 |
| vax | 1001 |
| government | 820 |
| care | 844 |
| safe | 810 |
| else | 769 |
| CDC | 822 |
| made | 785 |
| days | 802 |
| country | 765 |
| shot | 979 |
| Flu | 755 |
| sick | 765 |
| believe | 750 |
| case | 758 |
| risk | 791 |
| start | 717 |
| corona | 727 |
| catch | 736 |
| control | 753 |
| thought | 711 |
| saying | 725 |
| look | 706 |
| diseases | 720 |
| Ebola | 714 |
| moneypox | 689 |
| kids | 744 |
| life | 699 |
| sex | 756 |
| give | 695 |
| Lol | 691 |
| Work | Sentiment Analysis of Tweets about COVID-19 | Sentiment Analysis of Tweets about MPox |
|---|---|---|
| Vijay et al. [77] | ✓ | |
| Mansoor et al. [78] | ✓ | |
| Pokharel [79] | ✓ | |
| Chakraborty et al. [80] | ✓ | |
| Shofiya et al. [81] | ✓ | |
| Basiri et al. [82] | ✓ | |
| Cheeti et al. [83] | ✓ | |
| Ridhwan et al. [84] | ✓ | |
| Tripathi [85] | ✓ | |
| Situala et al. [86] | ✓ | |
| Gupta et al. [87] | ✓ | |
| Alanezi et al. [88] | ✓ | |
| Dubey [89] | ✓ | |
| Rahman et al. [90] | ✓ | |
| Ainlet et al. [91] | ✓ | |
| Slobodin et al. [92] | ✓ | |
| Zou et al. [93] | ✓ | |
| Alhuzali et al. [94] | ✓ | |
| Hussain et al. [95] | ✓ | |
| Liu et al. [96] | ✓ | |
| Hu et al. [97] | ✓ | |
| Khan et al. [98] | ✓ | |
| Ahmed et al. [99] | ✓ | |
| Lin et al. [100] | ✓ | |
| Jang et al. [101] | ✓ | |
| Tsao et al. [102] | ✓ | |
| Griffith et al. [103] | ✓ | |
| Chum et al. [104] | ✓ | |
| Kothari et al. [105] | ✓ | |
| Barkur et al. [106] | ✓ | |
| Afroz et al. [107] | ✓ | |
| Hota et al. [108] | ✓ | |
| Venigalla et al. [109] | ✓ | |
| Paliwal et al. [110] | ✓ | |
| Zhou et al. [111] | ✓ | |
| Lamsal et al. [112] | ✓ | |
| Zhou et al. [113] | ✓ | |
| de Melo et al. [114] | ✓ | |
| Brum et al. [115] | ✓ | |
| de Sousa et al. [116] | ✓ | |
| Iparraguirre-Villanueva et al. [117] | ✓ | |
| Mohbey et al. [118] | ✓ | |
| Farahat et al. [119] | ✓ | |
| Sv et al. [120] | ✓ | |
| Bengesi et al. [121] | ✓ | |
| Dsouza et al. [122] | ✓ | |
| Zuhanda et al. [123] | ✓ | |
| Cooper et al. [124] | ✓ | |
| Ng et al. [125] | ✓ | |
| Thakur [this work] | ✓ | ✓ |
Disclaimer/Publisher’s Note: The statements, opinions and data contained in all publications are solely those of the individual author(s) and contributor(s) and not of MDPI and/or the editor(s). MDPI and/or the editor(s) disclaim responsibility for any injury to people or property resulting from any ideas, methods, instructions or products referred to in the content. |
© 2023 by the author. Licensee MDPI, Basel, Switzerland. This article is an open access article distributed under the terms and conditions of the Creative Commons Attribution (CC BY) license (https://creativecommons.org/licenses/by/4.0/).
Share and Cite
Thakur, N. Sentiment Analysis and Text Analysis of the Public Discourse on Twitter about COVID-19 and MPox. Big Data Cogn. Comput. 2023, 7, 116. https://doi.org/10.3390/bdcc7020116
Thakur N. Sentiment Analysis and Text Analysis of the Public Discourse on Twitter about COVID-19 and MPox. Big Data and Cognitive Computing. 2023; 7(2):116. https://doi.org/10.3390/bdcc7020116
Chicago/Turabian StyleThakur, Nirmalya. 2023. "Sentiment Analysis and Text Analysis of the Public Discourse on Twitter about COVID-19 and MPox" Big Data and Cognitive Computing 7, no. 2: 116. https://doi.org/10.3390/bdcc7020116