Article

Expanding the Horizons of Situated Visualization: The Extended SV Model

by
Nuno Cid Martins
1,2,3,
Bernardo Marques
1,2,4,
Paulo Dias
1,2,4 and
Beatriz Sousa Santos
1,2,4,*
1
Institute of Electronics and Informatics Engineering of Aveiro (IEETA), University of Aveiro, 3810-193 Aveiro, Portugal
2
Department of Electronics, Telecommunications and Informatics (DETI), University of Aveiro, 3810-193 Aveiro, Portugal
3
Polytechnic Institute of Coimbra, Coimbra Institute of Engineering, 3030-199 Coimbra, Portugal
4
Intelligent Systems Associate Laboratory (LASI), University of Aveiro, 3810-193 Aveiro, Portugal
*
Author to whom correspondence should be addressed.
Big Data Cogn. Comput. 2023, 7(2), 112; https://doi.org/10.3390/bdcc7020112
Submission received: 21 February 2023 / Revised: 22 May 2023 / Accepted: 25 May 2023 / Published: 7 June 2023
(This article belongs to the Special Issue Augmented Reality, Virtual Reality, and Computer Graphics)

Abstract

:
To fully leverage the benefits of augmented and mixed reality (AR/MR) in supporting users, it is crucial to establish a consistent and well-defined situated visualization (SV) model. SV encompasses visualizations that adapt based on context, considering the relevant visualizations within their physical display environment. Recognizing the potential of SV in various domains such as collaborative tasks, situational awareness, decision-making, assistance, training, and maintenance, AR/MR is well-suited to facilitate these scenarios by providing additional data and context-driven visualization techniques. While some perspectives on the SV model have been proposed, such as space, time, place, activity, and community, a comprehensive and up-to-date systematization of the entire SV model is yet to be established. Therefore, there is a pressing need for a more comprehensive and updated description of the SV model within the AR/MR framework to foster research discussions.

1. Introduction

The context is critical in many areas, including communication, decision-making, problem-solving, and understanding complex systems or concepts. This context refers to the set of conditions where individuals build knowledge [1]. It includes any information that characterizes the individual, activity, content, and the environment surrounding the individual. For instance, when specifically thinking in collaborative tasks, situational awareness, assistance, training and maintenance, the context becomes much more important. To support these kinds of environments, and adopting innovative methodologies, many researchers have explored the field of Augmented and Mixed Reality (AR/MR), given their capacity to promote and facilitate support in several tasks [2]. Evidence of this AR/MR capacity can be seen in the Korkmaz et al.’s survey [3], where they show that with this technology the logical and spatial thinking abilities can improve, as well as skills regarding problem solving and questioning can be developed. They also demonstrate that AR/MR technology can create cooperative environments. Other interesting studies about AR/MR are the work of [4], which shows the effectiveness of this technology in developing training for choreography, and the work of [5], that present a framework of generalized capabilities for virtually assisted activities. Due to the COVID-19 pandemic, this kind of technology has gained more prominence, reinforcing personalized learning spaces and user-centered approaches [6].
Typically, visual means are the primary way of acquiring knowledge [7]. Therefore, visualization is a fundamental component of any AR/MR system, which could be defined as, “the communication of data, a process of interpreting abstract or visible data that is not immediately seen and putting it into visual form, producing readable and recognizable images” [8]. According to Card et al., visualization can also be defined as “the use of computer-based, interactive, and visual representations of data to amplify cognition” [9], corroborating with the idea that AR/MR allows the augmentation of the perception of conventional reality. AR/MR technologies have been rapidly advancing, enabling users to interact with the digital information overlaid onto their real world in a more natural and intuitive way, creating a seamless blend between the physical and digital realms [10]. One investigation area that has arisen from this, by the hands of White [11], is situated visualization (SV), which focuses on visualizations that are context-aware and adapt to the physical environment in which they are displayed [12]. SV has the potential to revolutionize the way we interact with digital information, making it more relevant and useful in our daily lives. The combination of SV and AR/MR enables tasks to become dynamic and focused on the user (user-centered).
SV can play a significant role in other areas beyond AR/MR, including decision-making processes and situational awareness. Moreover, it is applicable in diverse settings, both indoors and outdoors. In decision-making processes, SV can help decision-makers to better understand complex data by providing visual representations that incorporate different perspectives and contextual information. For example, Ref. [13], in the SensePlace3 project, uses SV to support decision-making in the context of crisis events management, by extracting meaningful information from social media. In healthcare, SV can be used to visualize patient data and medical records to support clinical decision making. In indoor and outdoor environments, SV can be used to enhance the user’s experience and understanding of their surroundings, enabling more efficient indoor environments, by visualizing data such as energy usage, occupancy patterns, and air quality. For instance, in retail stores, SV can be used to provide additional context and information about the product, enhancing the shopping experience [14] and, in smart buildings, SV can be used to optimize heating and cooling systems, lighting, and space utilization. SV can also be used to visualize data in outdoor environments, such as urban planning, environmental monitoring, and agriculture. SV can be used to visualize traffic patterns, air quality, and climate data to support city planning and policy decisions. In agriculture, SV can be used to monitor crop growth and soil moisture levels to optimize crop yields. SV can also have a significant impact on situational awareness. By providing visualizations that are tailored to the user’s context, SV can increase the user’s understanding and awareness of their surroundings, tasks, and activities. For example, in outdoor environments, Ref. [15] use SV to increase awareness of the water pollution on the Chelsea Creek, in Massachusetts. In indoor environments, for instance, SV techniques based on interactive maps can help users navigate efficiently and locate points of interest within a building. This can be particularly helpful in complex indoor environments such as airports or hospitals, where finding specific locations can be challenging. Furthermore, by incorporating for instance multiple visualizations regarding the space, time, place and activity, users can have a more comprehensive understanding of their situation, enhancing their situational awareness. For instance, an SV system that incorporates real-time data about the user’s location, weather conditions, and traffic patterns can provide users with a more complete view to make them adjust their behavior or make better decisions based on the current situation.
Nowadays, it is important for society to be able to obtain further data to have a clearer understanding and to make better decisions. The current technology and data sources can make this society’s necessity possible, but sometimes, analytic techniques are required due to the huge amount of available data. In other words, at times (and increasingly), the amount of data about the environment/context in which the user is in is so vast that it is impossible to visualize all this information at the same time. In addition, some of this information may not even be relevant. Therefore, that is why it is important to analyse the data before visualization. The area of SV is connected to new research areas that are concerned with solving this important necessity. The mentioned areas are situated analytics [16,17,18], immersive analytics [19,20,21], and ubiquitous analytics [22]. For example, regarding AR/MR tasks, assistive analytics involves the collection and analysis of data from instructional contexts, including user performance and demographic data, and other relevant information, and can be supported by the technologies and methodologies of these areas. The liaison between assistive analytics and the visualization of situated information can help understanding, create new practices, improve its results, as evidenced by [23]. The mentioned liaison can also optimize the environments in which the assistance occurs. For instance, the environment data, obtained by the analytics and SV system, may lead to that optimization by adjusting lighting to create a more conducive space, while presenting digital data. This could be achieved either with the assistance of Internet of Things (IoT) sensors or without them. For example, in the latter case, it could entail adjusting the contrast of the visualization to improve readability in response to external stimuli captured by the SV system. Additionally, the collected data could also involve changes to the digital assistive environment, such as improving design and usability to better meet users’ needs and maximize their outcomes. An example of this is when the SV system automatically adapts the presentation of data based on factors such as the number of records and the types of visual encoding utilized. SV can make assistive analytics data more accessible and understandable, facilitating more effective decision-making. Therefore, it is important to have consistent and well defined SV concepts and terminology.
In order to ensure solid embracing of SV terminology and concepts, particularly within the research community associated with AR/MR, it is necessary to establish a consistent viewpoint. This article aims to promote a shared understanding for analysis, foster discussion within the community, and emphasize the importance of prioritizing users and their needs in the SV design process. Building upon prior work [24], this article expands on the content of several SV perspectives while also introducing a new perspective and respective category, as well as a new category for an existing perspective. It also includes a description of the SV challenges. Table 1 provides a more detailed overview of the main contributions of this article to the enhanced SV model, compared to the current state-of-the-art situation.
The present study began with an analysis of data obtained from the systematic literature review presented in [28]. This review provided an understanding of the current SV model and its various perspectives, which are now discussed in Section 2 of this manuscript. To enhance the understanding of the model, some of its less well-defined features were explored, and issues that had been omitted from the initial model were identified. This stage was achieved by updating the initial literature review. For this update, a combination of databases (Google Scholar, Scopus, and Web of Science) were searched to cover conference proceedings, and workshop articles, journals and books. Particular keywords and Boolean logic were utilized to improve the search outcomes and identify relevant publications for analysis. The selection criteria for the analyzed papers were those whose content could be classified as related to SV, even if they did not explicitly mention this terminology. This led to a suitable systematization proposal by extending the SV model to cover the main definitions and perspectives. The proposal is presented in Section 3 of this article.
The remaining of this paper is structured in the following manner: the conventional SV model in the context of AR/MR is described in Section 2, drawing upon existing research. In Section 3, a thorough examination of various visualization perspectives and their situatedness is presented, along with the generation of original insights. In Section 4, the challenges encountered in SV for AR/MR are outlined. A real-life example is utilized to illustrate the characteristics of SV in Section 5. Section 6 concludes the paper with final remarks and recommendations for future research opportunities.

2. Situated Visualization

According to Bressa et al., in [27], the emerging research concept of SV is present in the literature of several research areas, including visualization (involving the use of digital screens or other visual display technologies, and data physicalization), as well as AR/MR, human-computer interaction, ubiquitous computing, and urban computing. The same authors highlight that this wide range of use has led to inconsistent adoption of the concept and terminology. Therefore, to have a global vision of this concept, an overview of the SV is pertinent. This section presents fundamental notions of SV, the SV theoretical model, and SV perspectives and their respective situatedness.

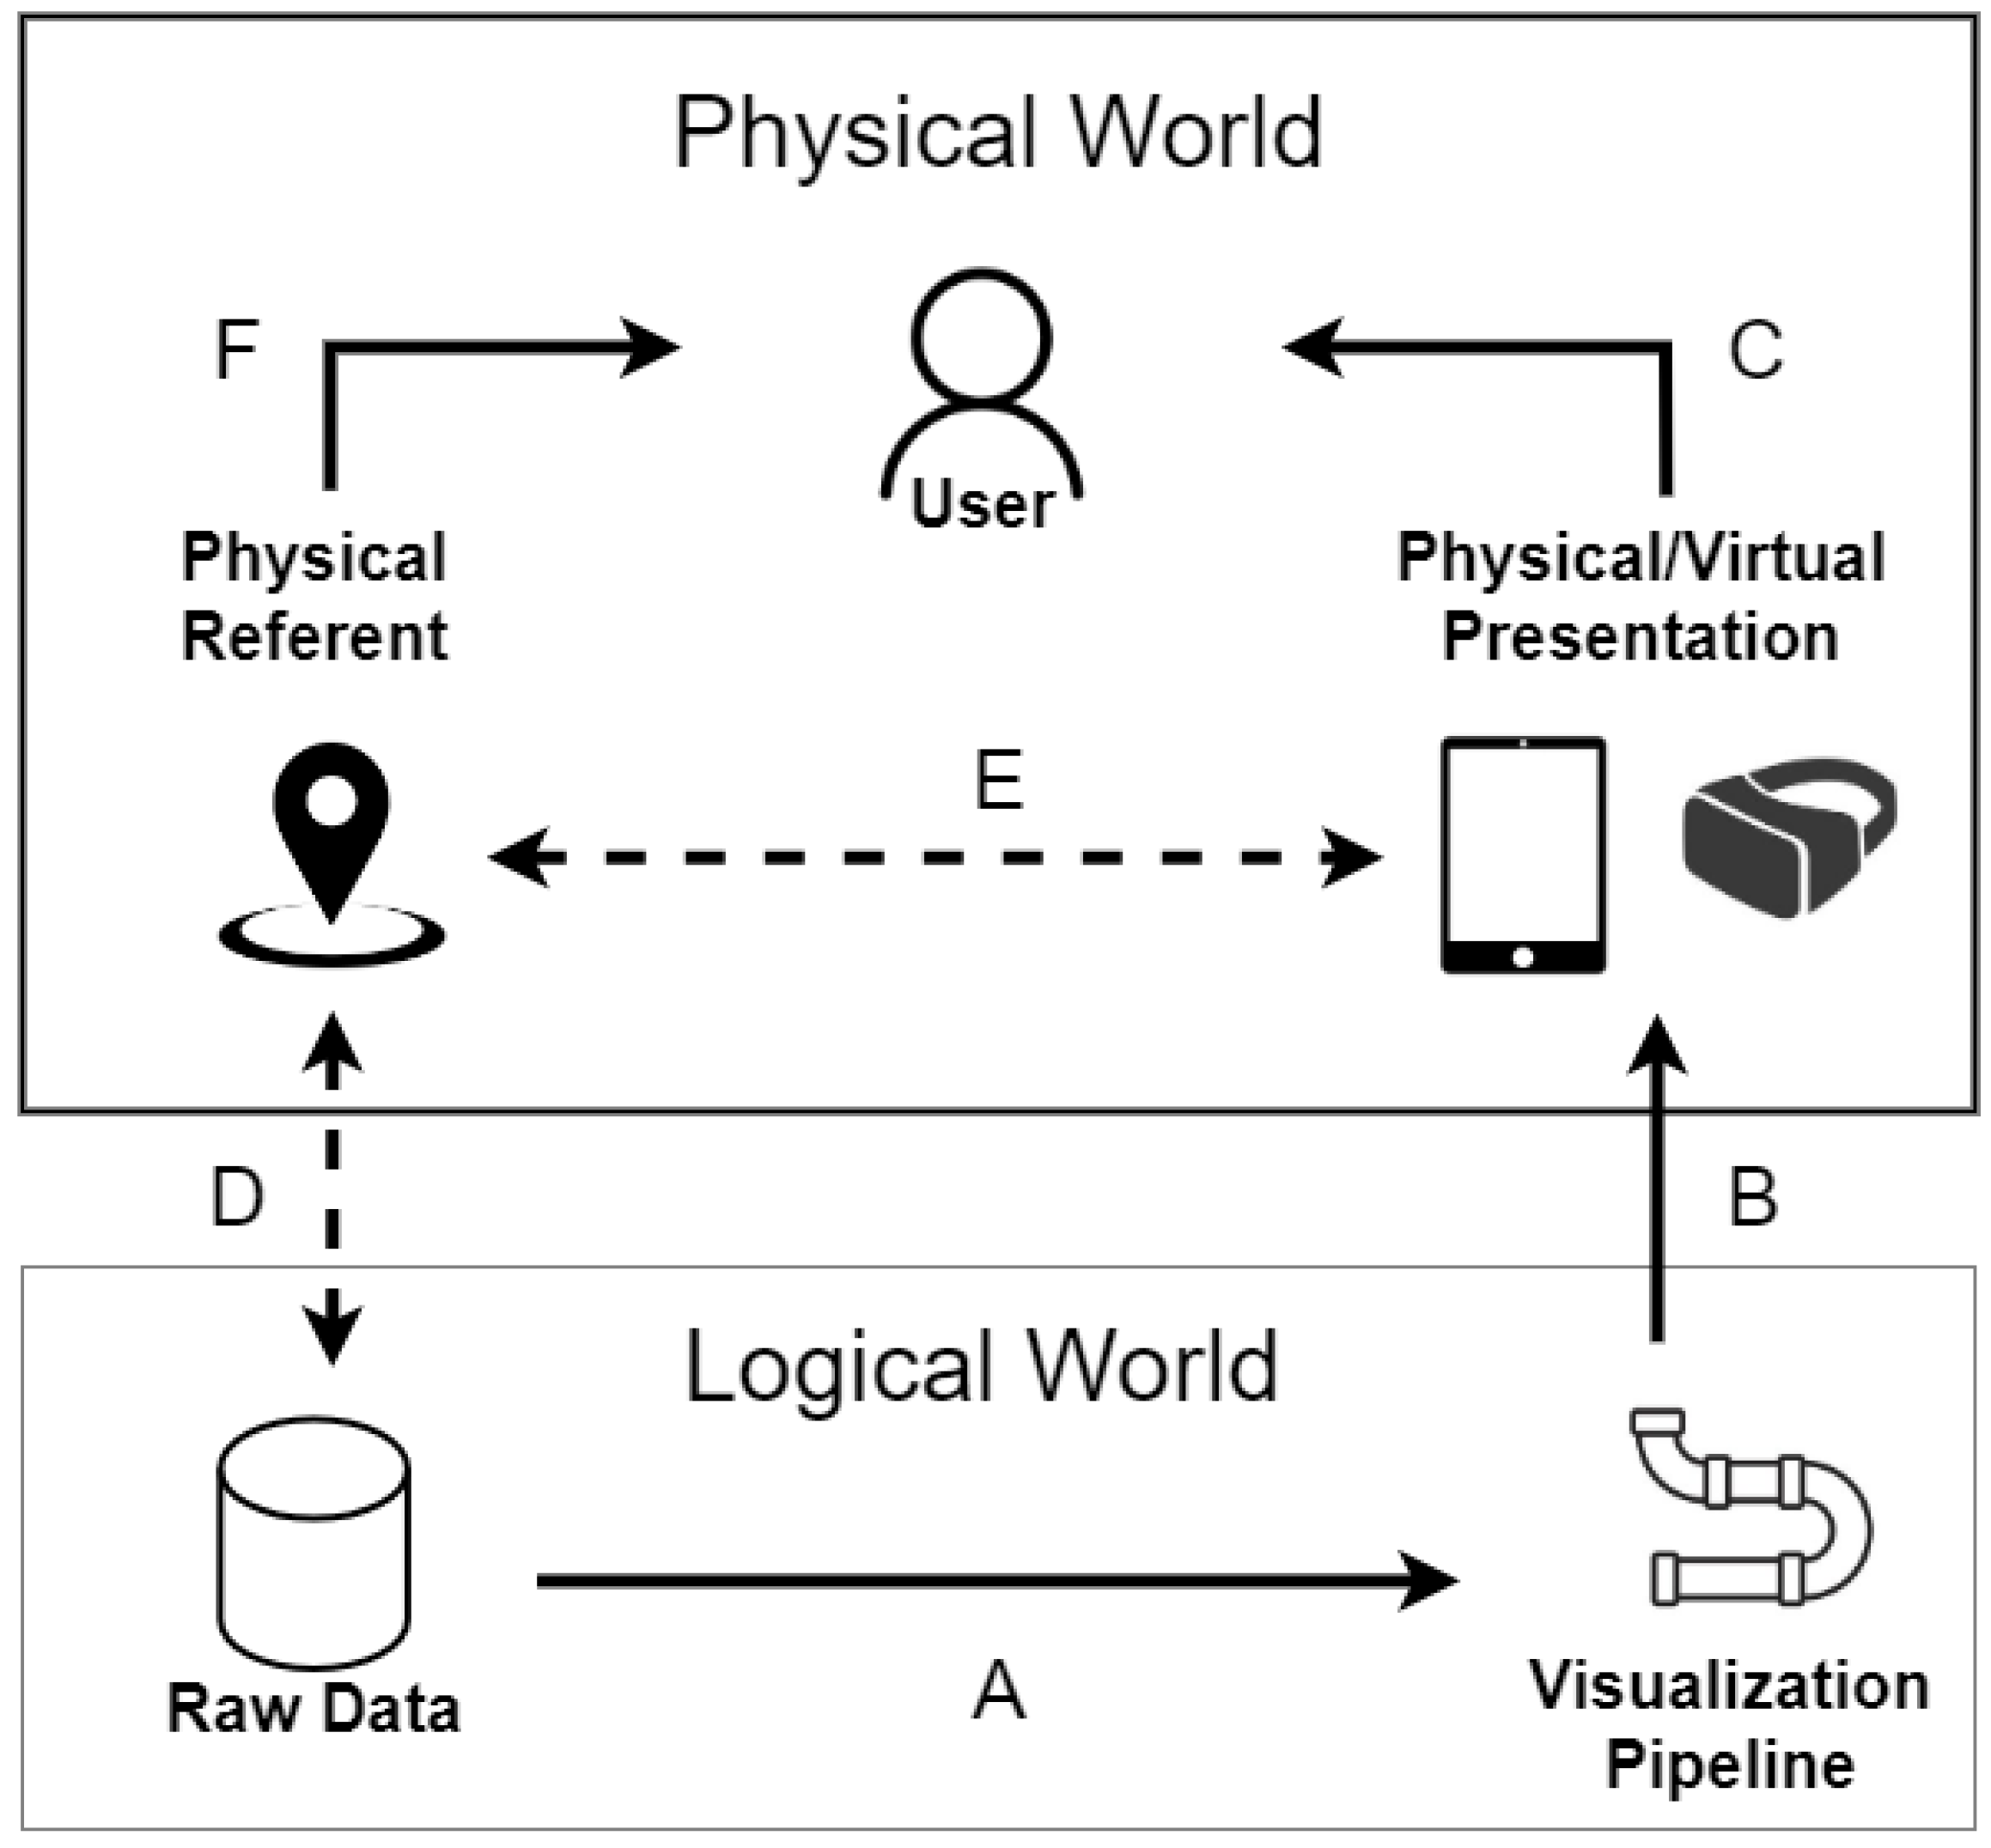
2.1. Fundamental Notions

It can be said that the term “situated visualization” was introduced by White et al., in [11,29,30]. The idea behind SV is to present data in locations and times that are meaningful to the audience. By integrating virtual information with the environment, visualizations gain significance and convey deeper insights, as White et al. suggested. Depending on the context and research field, the definition of SV can vary in scope and detail. A survey about this can be seen in [27]. This article follows the two predominant definitions of SV, White et al.’s (“visualizations that are displayed in correlation with its surrounding environment” [11]) and Willett et al.’s (“Visualizations located in a pertinent area, spatially aligned or not with their corresponding physical entities to which the data refers” [26]). Examples of SV can be seen in applications that guide/train the users through assembly tasks or give information about air pollution on a particular location (Figure 1).
The main characteristic from the SV’s definition is its adaptability to contextualize the relevant information to the current time, physical space, activity, content, community, and place, which is lacking in other types of AR/MR visualizations. This characteristic is essential at present-day because it is more and more important for society to be able to obtain further information about the objects, places, and people being dealt with at a given moment so that it is possible to have a clearer interpretation of the originally received information and make better and informed decisions [31]. Other characteristics of the SV are its usefulness and intuitiveness. SV can provide valuable assistance in various scenarios, such as indicating nearby food purchasing options or guiding users through a maintenance process during training [23]. White noted that SV can improve cognitive performance in tasks such as spatial learning, pattern recognition, and comparison, particularly when compared to other visualization methods [11].
Moere et al., in [32], identified three key characteristics of SV: contextual, local, and social. Contextual means that the visualization is tailored to the specific physical location, considering both explicit and implicit context. Local means that the data are closely tied to the immediate environment, allowing for real-time processing and integration (the data retrieval occurs without significant delay). Social means that the visualization addresses topics relevant to the cultural and social context of the area. The SV must also be informative. This means that it should create a direct feedback loop between the environment, its inhabitants/objects and their actions, allow users to make meaningful insights beyond the retrieval of information, and have consistent data, which does not refute the meaning it carries (data representations must be aligned with the semantic content of the data).
It is also important to know that not all visualizations in AR/MR are situated, as it is the case when the displayed virtual elements are not connected to the viewed real-world entity [25]. Examples of this kind of visualization can be found in the literature, wherein the examples of the physical background have no meaningful relationship to the visualization. In [33], a way to investigate common properties of dynamical systems on a personal interaction panel is presented. In [34], a prototype, which allows users to perform tasks, in desktop information visualization tool is proposed (tasks such as data dynamic filters, attribute selection, semantic zoom and details on demand). Ref. [35] shows an augmented reality tool for industrial assembly of parts. In all the presented examples, the digital information is completely independent of the physical context in which they are displayed because each of the AR/MR applications could be executed in different environments and the result would still be the same, proving no relation between the application and the user’s environment.
According to the SV definition, it is not the type of data which defines if the visualization is situated. Data are purely logical entities. Thus, it is possible to have SV with both abstract and physically based data [25]. Examples of SV using abstract data can be found in the literature. In [36], the position of the labels (the abstract data) and their appearance (including depth cue for the labels’ anchor or their leader lines) are automatically optimized according to the buildings in the scenario of a city. In [20], the visualizations on AR-canvases showed the abstract data information (the annotations) depending on the viewer’s distance in the library room or from the shelf. Examples of SV using physically based data can be also found in the literature. In [37], different visualization methods of the airflow inside the test scenario are shown. Ref. [30] presents physical properties and measurements of air pollution, comparing data from a local sensor and data from a remote environmental protection agency sensor associated with the site’s location. In [17], a prototype tool for situated analytics was developed to assist with grocery selection during shopping. The tool used AR and analytical interactions to dynamically change the location and appearance of data based on tracking information, and alter its representation based on users’ queries.
Regarding technology, SV systems are not limited to a specific one. Thinking in a more general way, an SV system does not even have to use AR/MR technology. For example, SV can be created with simple methods, such as printing a visualization of a car’s information and taking it to the car itself, or with complex technology, such as seen in Figure 1. However, according to [18], emerging technologies make it possible to create elaborate and innovative forms of SV.

2.2. SV Characterization

Before delving into the SV characterization, for a better understanding, it is necessary to establish some key terms. The words “perspective” [27], “dimension” [31] or “property” [18,25] are used whenever it is intended to refer to a global SV characteristic, showing the stated broader use of concepts. From now on, whenever an SV characteristic is referred to, the term “perspective” will be employed. It is important to mention that SV can be classified according to its perspectives, their own categories and particular cases. The known SV perspectives are space, time, place, activity, and community. Each category represents a more specific aspect of the perspective. Each particular case, as the name implies, defines situations in which the SV characteristic has a specific behaviour. Moreover, the concept of situatedness, originally from the field of situated analytics, is employed to describe a trait of the visualization perspective that may vary on a continuum (“the degree the information and person are connected to the task, location, and/or another person”) [18]. Next, the existing SV perspectives and their concepts will be described.

2.2.1. Space Perspective

The characterization of SV must start with the dominant spatial understanding of what it means for data visualization to be spatially situated. According to [18,26], a visualization is spatially situated when its physical presentation is closely aligned with the data’s physical referent, which could be a physical object or physical space to which the data refers. The physical object or apparatus that enables the visualization to be perceived is referred to as the physical presentation [38]. The physical referent must be meaningful, as highlighted [39]. For example, superimposing a visualization of the underground infrastructure on a street is an SV, because the street is a meaningful referent for the infrastructure visualization. In a usual visualization system, the physical presentation can take various forms, such as large public displays, mobile handheld displays, pieces of paper, interactive objects, light and 3D prints. For AR/MR visualizations, common devices include, for instance, mobile handheld displays, head-mounted displays, and spatial displays. It is worth noting that the degree of “close”ness between the physical referent and presentation, as described earlier, can vary on a continuum. The term “close” is intentionally ambiguous, as the level of situatedness depends on the display on which the visualization appears and its proximity to the referent [18].
To provide a more distinct representation, ref. [18] introduces a theoretical framework of a spatially SV model, primarily based on [26]. The model covers both the logical and physical worlds, as depicted in Figure 2. The physical world corresponds to the actual 3D environment, whereas the logical world is computer-generated and produces the information for visualization. Figure 2 illustrates the information flow from raw data to the user through different links. Raw data are used in visualization after passing through the visualization pipeline (AB). Physical presentation is required to view the rendered images (C). Unlike the commonly used information visualization reference model, the SV model necessitates the existence of the physical world since data visualization is intertwined with the context/physical environment. Link D, in Figure 2, connects the physical referent and raw data, allowing raw data to originate from various referents, some of which may not be visible to the user (the reason to make it dashed). Link E indicates the proximity between the physical referent and the physical presentation. The link is drawn as dashed to highlight the possible variances in proximity. The visualization is called spatially situated if the physical referent and presentation share the same space, and both are visible to the user. Finally, link F represents the visibility of the referents to the user.
Suppose a maintenance technician needs to teach a trainee how to inspect/maintain several machines, as an example of the concepts discussed earlier. The raw data could be a model of the machines and their locations. The visualization pipeline produces an image of the machines’ map, which can be presented physically on a mobile phone/tablet screen or on paper. When selecting a specific machine model, the raw data related to it could refer to multiple machines situated in different physical locations, some of which may not be visible to the technician and trainee. If they are examining the information on a mobile device away from the machines, the physical referent and presentation would be too far apart, resulting in a non-spatially SV. However, if the technician and trainee are in the factory and viewing the information on a tablet, the physical referent and machine could be close enough to allow for a spatially SV. Thus, whether a visualization is spatially situated or not depends on the physical presentation rather than the visualization itself, even if both are viewed on the same device.
From [27], there are three spatial placement types, namely, entity-centric, activity-centric, and space-centric. These categories acknowledge that space is not only about the physical distance between the visualization and the referents of interest, but also about the user’s activities and context, which must be taken into account [40]. Bressa et al. also argued that, when taking into account other SV perspectives such as activity, direct spatial proximity may not always be ideal or suitable for classifying those perspectives as situated.

Physically and Perceptually SV

Thinking specifically about the concept of distance, it is common knowledge that, for several reasons, the distance is perceived in a relative way. In some situations, three meters between physical referent and the physical presentation could be a lot (for example, on accurate indoor navigation) and in others, it could be very close (for example, in outdoor navigation to pinpoint an area). It is common to encounter discrepancies in the interpretation of the distance between the physical referent and the physical presentation, especially in the context of AR/MR [10]. To provide a clearer definition of spatially SV, ref. [18] propose two definitions. The first one is that a visualization is considered physically situated in space if its physical presentation is in close proximity to the data’s physical referent. The second definition is that a visualization is perceptually situated in space if its presentation, whether physical or virtual, appears to be near the data’s physical referent. More explicitly, a visualization is considered perceptually situated in space if its appearance seems to be close to the percept of the data’s physical referent. Thus, perceptually SV can be related to virtual presentations and that is the reason to include the virtual presentation component in Figure 2. Despite the differences between physical and perceptual situatedness, to make full use of the SV, there should be a convergence between the two in order to provide users with a more consistent representation. The more accurate this convergence is, the better the result will be.

Embedded Visualization

A different physical aspect in the characterization of SV is embedded visualization (EV). In [26], Willett et al. define embedded visualization as the incorporation of visual and physical representations of data that deeply integrated with the physical spaces, objects, and entities to which the data pertains. According to [18], embedded visualization occurs when each physical sub-presentation is in close proximity (and aligned) to its corresponding physical sub-referent. The behaviour of each sub-presentation and sub-referent is the same as the presentation and referent. This distinguishes SV scenarios, in which data are displayed near data referents, from EV, which displays data so that it coincides spatially with data referents. The notion of EV is more limited in scope than SV, because each EV is a SV and SV can be embedded or non-embedded. However, EV poses more challenges. For instance, if a user’s gas consumption is displayed on a single visualization located next to the house, the visualization will be simply situated. On the contrary, if graphs of gas consumption were only shown for the house’s kitchen and Barbeque grill, the visualization, aligned with them, would become embedded. Finally, Willett et al. introduced a particular case in embedded visualization known as highly embedded data representation. Highly embedded visualization arises when an array of extremely small-scaled data presentations are considered together, such as the heat-sensitive color-changing tiles presented in [26].

2.2.2. Time Perspective

Thomas et al. [18] propose a broader characterization of SV beyond its spatial, physical and perceptual location. They suggest that SV should be viewed in connection to time, where data can be thought of as referring to a specific region in time. In this sense, a visualization is considered temporally situated if the data’s temporal referent closely relates to the moment in time when the physical presentation is observed. While the perspective of time is not fully developed in the literature, it is implicit in the connection between the time when data are presented and when they are recorded. To achieve temporally situated SV, visualizations should minimize temporal indirection (i.e., display data as it is captured), assuming a linear time-flow [27]. This is a tough design restriction, which is not always accommodated. As it is not feasible to travel back in time, visualizations typically rely on traces or aggregated information. The perspective of time is not static but rather exists on a spectrum of situatedness. For instance, when considering a user’s gas consumption, the data’s temporal referent can encompass the past, present, or future (in the form of an estimate) and span across one or multiple days. An example of a visualization that is highly situated both spatially and temporally is the one presented in Figure 1, because the air pollution’s measure sensor is located within the data’s physical referent (the place where air pollutants are) and shows real-time data.
In relation to the perspective of time, Bressa et al. [27] propose the concept of social time as another relevant aspect of temporal situatedness. This idea allows for the consideration of various temporalities associated with activities tied to a location (particularly when coordination is necessary), cultural practices, and community habits (like taking eating breaks). As a result, temporal situatedness involves the interactions among individuals and the way that information connects them through time.

2.2.3. Place, Activity, Community Perspectives

In order to give the research community an incentive to systematically go beyond the prevailing spatial interpretation of SV and the concepts of situatedness, Bressa et al., in [27], proposed three additional visualization perspectives: place, activity, and community, which are consistent with [32]. These new perspectives, also, exist along a spectrum of situatedness, with varying levels.
Based on the theoretical foundations of place in Human-Computer Interaction (HCI), as presented in [41], Bressa et al. propose the place perspective as encompassing more than just the physical location or contextual factors of an activity. They argue that visualizations become situated regarding the place if they incorporate not only relevant information but also the attributes of the location, such as its socio-cultural significance, history, and local identity.
Drawing on the concepts of activity theory outlined in [42], Bressa et al. also propose that the activity perspective situatedness involves visualizations that are integrated and connected to a larger array of tasks that go beyond spatial aspects and have a significant influence on the suitability of various spatial configurations. Therefore, SV designers must consider how activities are accomplished, how visualizations can facilitate these activities, and how they relate and associate to a wider set of tasks led across space, time, or through collaborations.
Finally, for Bressa et al., community perspective, an underdeveloped perspective, is an important complement to the activity and place perspectives. This perspective directs attention to the viewers and authors of the visualizations and highlights the significance of community-specific factors. For instance, conducting a public opinion poll on local matters only makes sense if it involves individuals from that particular community.

3. Expanding the SV Model

This section aims to provide a comprehensive analysis of SV, building on the concepts discussed in the previous section. The analysis will include an extension of the SV model (Section 3.1) and critical insights into the visualization perspectives and their situatedness, resulting in updated concepts and novel insights (Section 3.2).

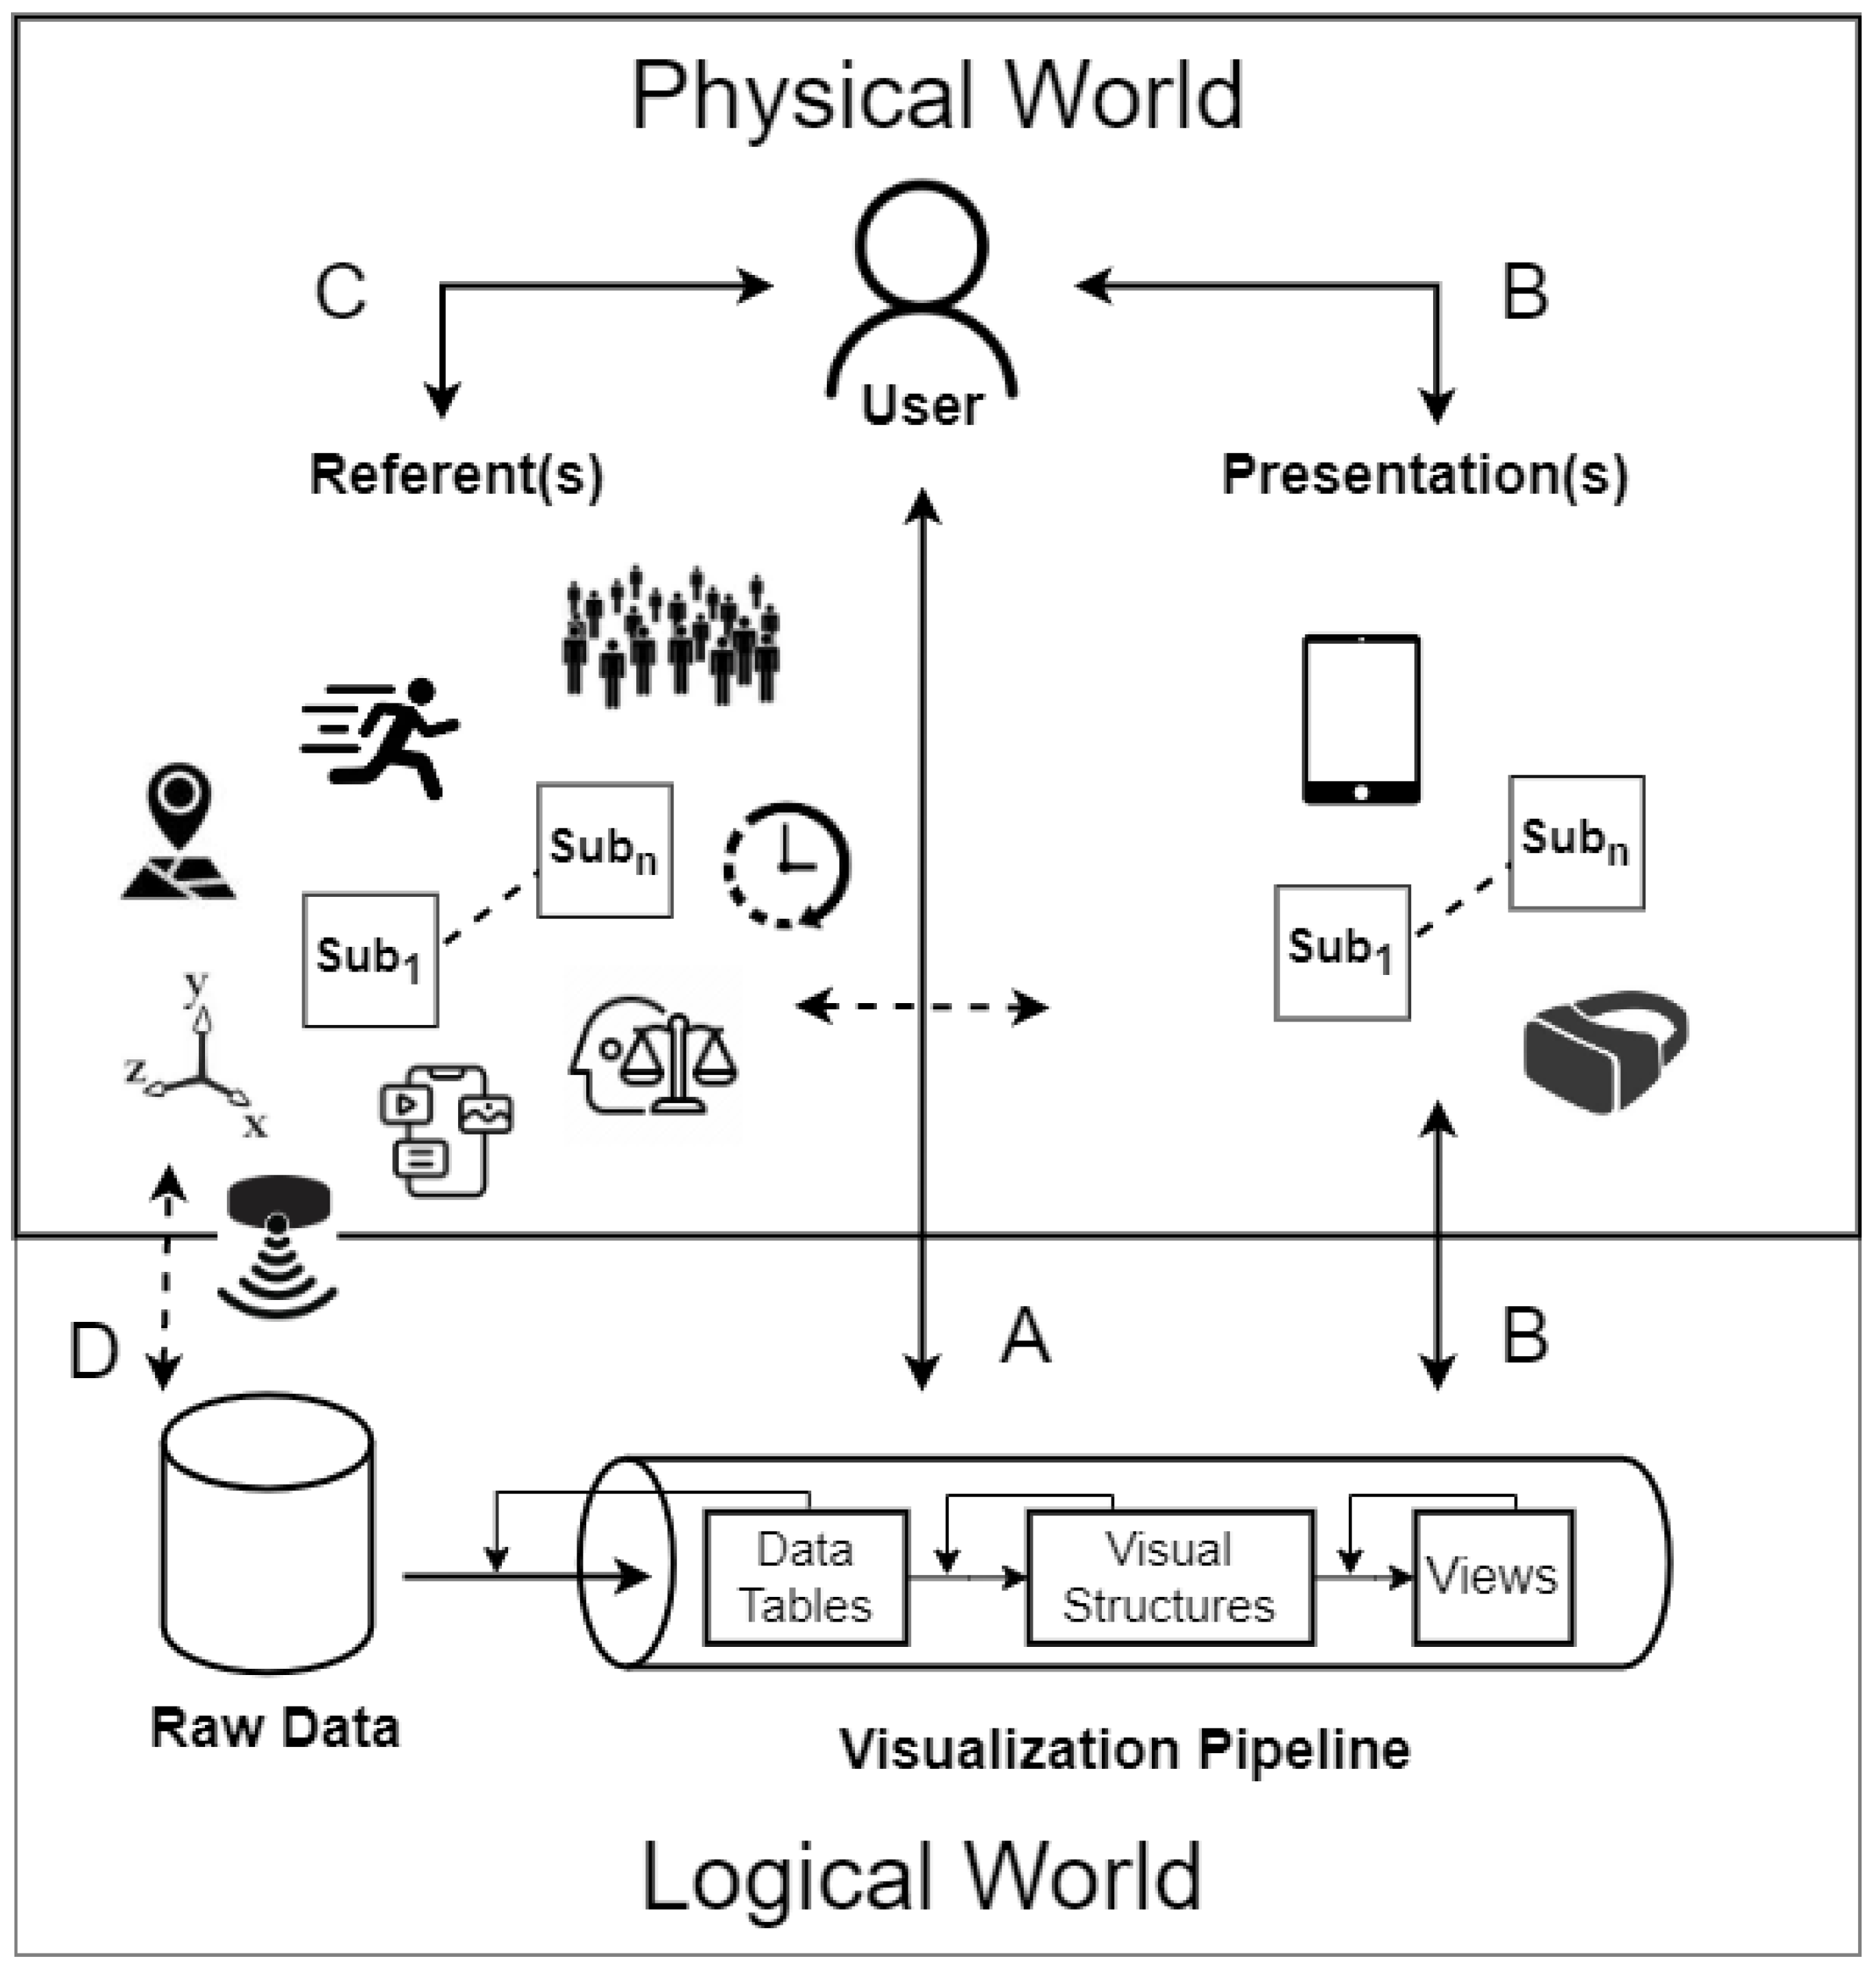
3.1. Enhancing the SV Model

Figure 3 depicts an extended SV model that incorporates various perspectives characterizing SV, including those proposed in this work and the ones mentioned in the literature, for enhanced comprehension. Unlike the original SV model shown in Figure 2, which assumes that the raw data belongs only to the logical world, the updated model acknowledges that some of the data’s information originates from the sensors within the physical world. Moreover, the updated model features an additional element detailing the visualization pipeline, inspired by Card et al.’s information visualization model [9]. According to Willett et al. [26], it is beneficial to consider multiple referents and physical presentations that independently display data related to their respective physical referent, which is why Figure 3 shows various sub-referents and physical and virtual sub-presentations of different types. As visualization technology advances and the need for information visualization grows, the integration of multiple referents and presentations becomes more prevalent. Figure 3 depicts the referents associated with space, place, time, activity, content, community and ethics perspectives as physical, local, temporal, activity, content, communal and ethical, respectively. They are the key for SV. The physical referents are classified by Fleck et al., in [39], as passive and active. A physical referent is passive when it is just a thing, such as an object or a physical space. Physical referents are active when they provide their own data and are communicable, for example, via the IoT.
According to Card’s model, user interaction with the SV system can modify the visualization. Therefore, a comprehensive representation of the SV theoretical model should encompass all the possible user-SV system interactions. These forms are systematized by Thomas et al., in [18], on their conceptual model for interaction with spatially SV, derived from the models beyond-desktop visualization [38] and EV [26]. Figure 3 shows the user’s interactions that enter the visualization pipeline (link A and B), that can pertain to any interactive visualization system, regardless of whether it is situated or not. However, the flow from the user to the referent is specific to SV (link C). The visualization can be altered when the user provides information to the visualization pipeline that changes the pipeline, such as filtering, selecting, or highlighting data, changing the visual representations, or adjusting the camera parameters [38] (link A). The number of interactions provided by this form is limited to the number of ways that the visualization pipeline could be changed. To achieve these kinds of interactions, sensors and/or interaction devices (mouse, joysticks, keyboards, tangible elements) are used to detect user actions. Another way to change the visualization is by reorganizing physical presentation (link B). According to [38], moving physical presentations around can give users new perspectives and expand the range of possible interactions. For example, if the mobile screen is the physical presentation, changing its location or orientation allows the user a new perspective or new ways to interact. The arrow linking the physical presentation to the visualization pipeline in Figure 3 (link B) indicates that some user actions on the physical elements can affect the visualization pipeline. When user information passes through a referent, the visualization becomes situated, and this can lead to further modifications of the visualization (link C), as the referents may become visible and manageable, as noted by Willett et al. [26]. If users interact with a non-SV system, their actions on the physical referent are limited to analytical reasoning and decision-making. In contrast, SV systems can allow for interlacing of analysis and action, including real-time modifications of raw data if the referent is the data source (as represented by link D) between referent and raw data in Figure 3. Classical visualization systems normally do not support this type of interaction [18]. For example a weather map that updates in real-time to display changing weather patterns and conditions. The map could show various weather metrics, such as temperature, precipitation, and wind speed, and update as new data are collected from weather sensors and forecasting models. This type of visualization could be useful for meteorologists and anyone interested in tracking weather patterns and conditions in a specific region.

3.2. Systematic Analysis

Figure 4 provides an overview of the identified visualization perspectives, including space, place, time, activity, content, community and ethics along with their respective categories and particular cases. This diagram is closely linked with the referents presented in Figure 3. These outcomes will be further discussed in the critical analysis that follows.

3.2.1. Space Perspective

To prevent confusion and following the presented earlier definitions of SV space perspective, with emphasis on AR/MR, the subsequent are recommended:
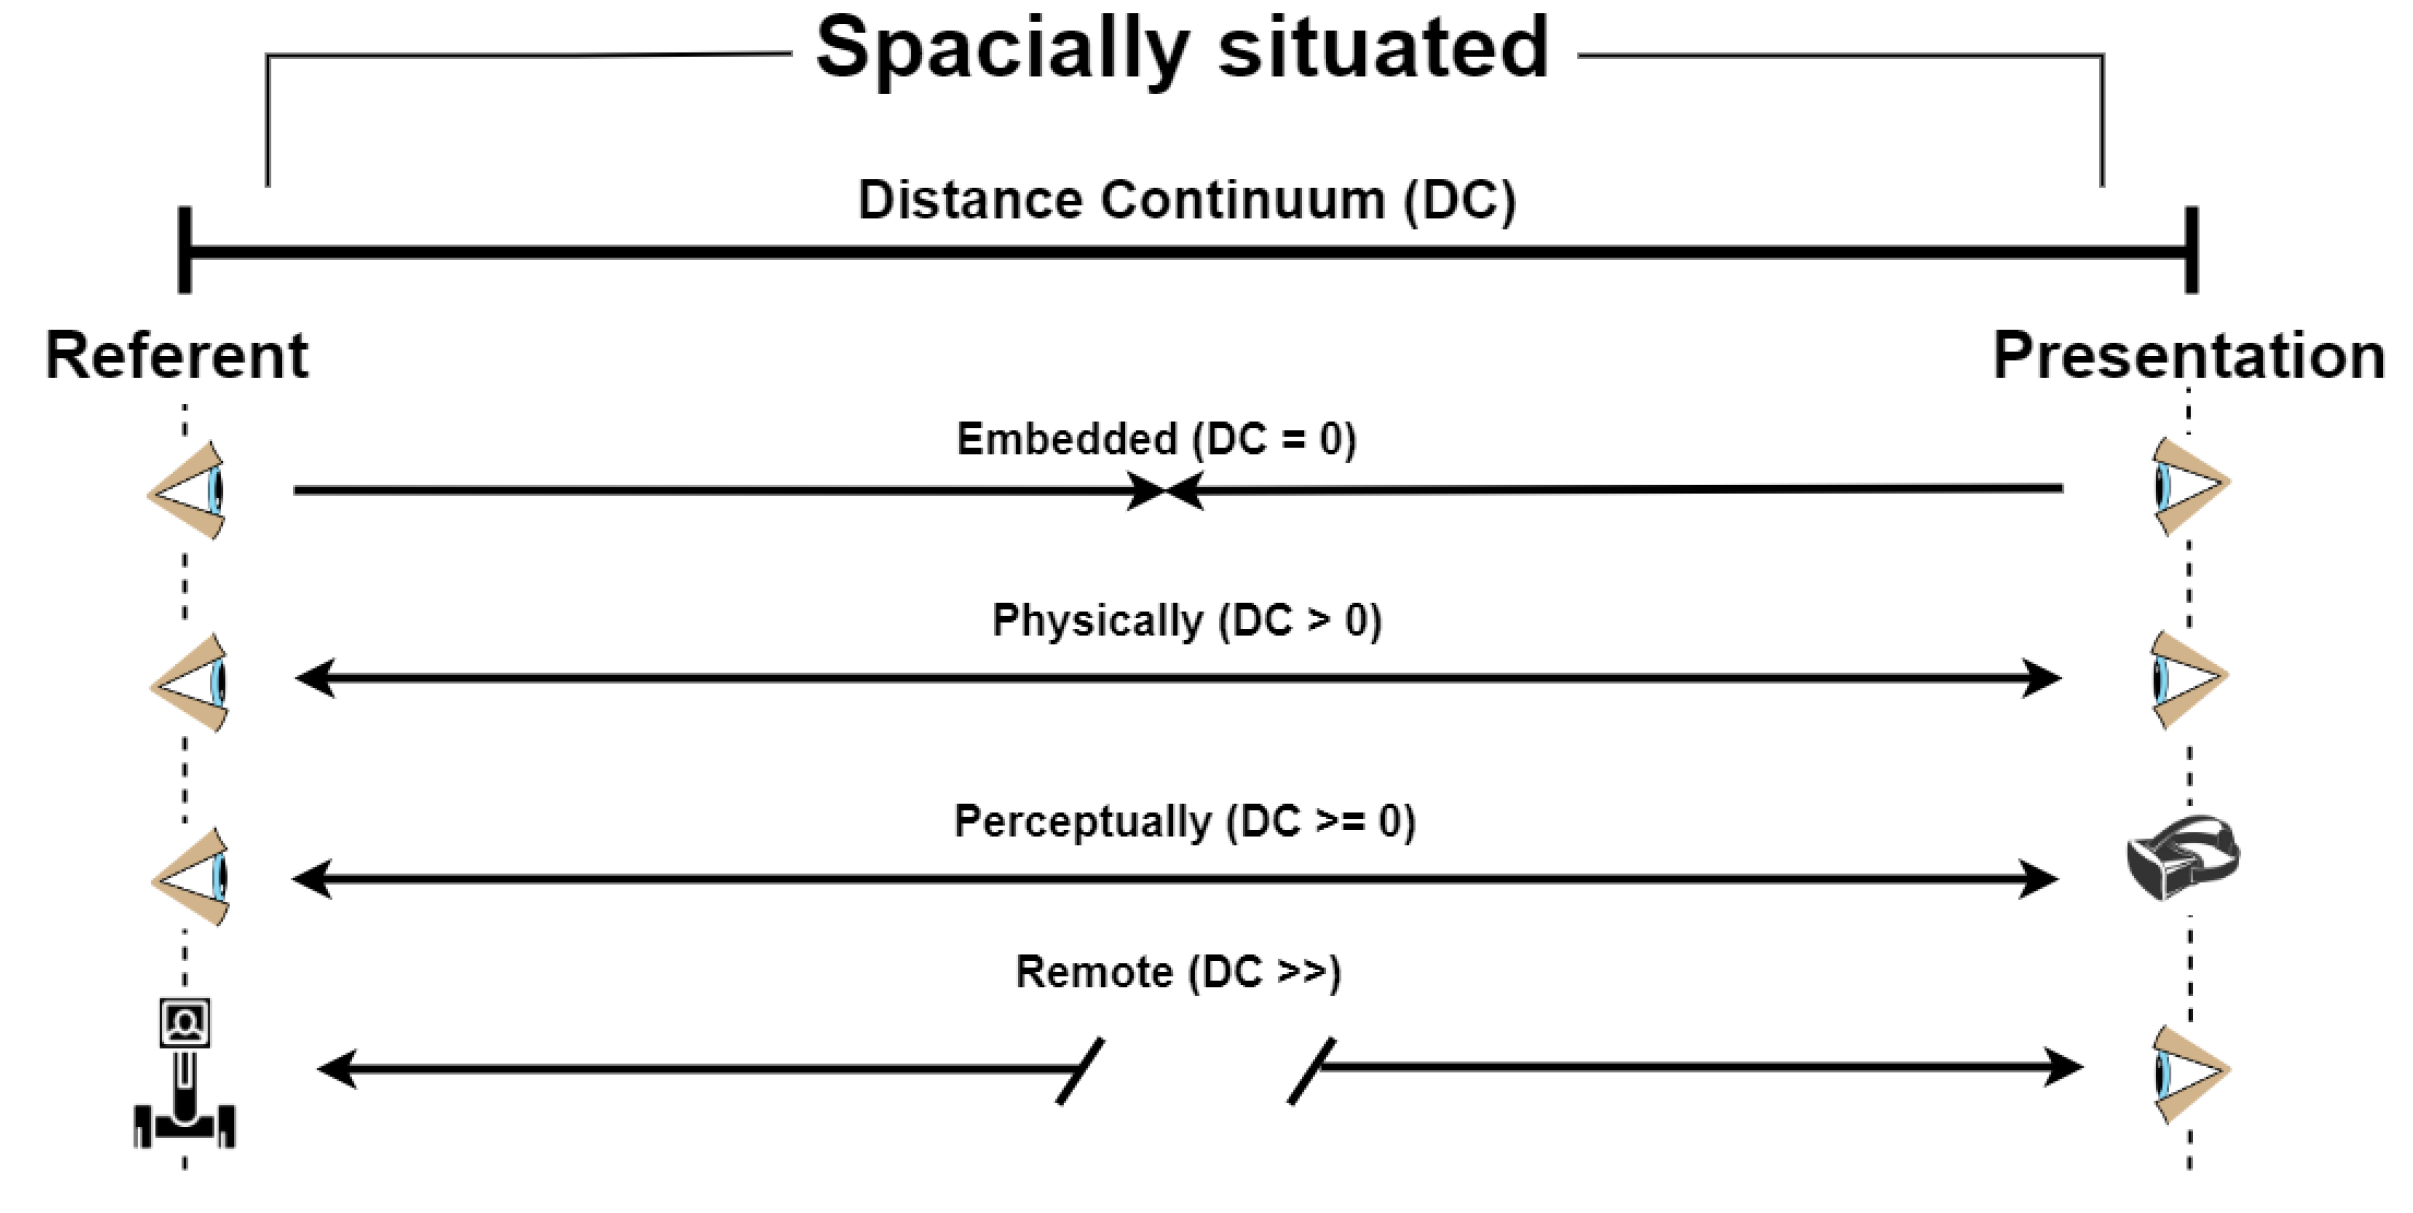
  • A visualization is physically situated in space if at least one of its physical sub-presentations is physically close and aligned to its corresponding data’s physical sub-referent (i.e., the matching physical sub-presentation and its corresponding physical sub-referent share the same space and are seen at the same time);
  • A visualization is perceptually situated in space if at least one of its percepts (physical or virtual sub-presentations) appears to be close to the percept of its matching and aligned data’s physical sub-referent (i.e., the matching sub-presentation and its corresponding physical sub-referent are seen at the same time);
  • A visualization is embedded if at least one of its physical sub-presentations is deeply integrated and aligned to its corresponding data’s physical sub-referent (i.e., the matching pairs are in the same space and are seen at the same time).
In the context of spatially SV, a new contribution emerged as an attempt to address the question of whether it is feasible to have SV in hazardous environments or involving interconnected equipment located in different physical locations. Such scenarios make it challenging to have the physical presentation close to its matching physical referent, even with “close” varying along a continuum. As mentioned in the previous section, a visualization is spatially situated if the physical presentation is close to the physical referent and the term “close” was left vague on purpose because situatedness is lying on a continuum with different levels. Having this in consideration, it is common knowledge that there are two dominating senses, sight, and audition. When people learn, 75% of knowledge comes to them visually, 13% comes through hearing and 12% comes through the other three senses, touch, smell, and taste [7]. Therefore, the knowledge about an entity or a space, even if obtained from the feed of a remote digital camera (video and audio) covers 88% of all senses. If, with that remote camera, a robotic arm is used (touch becomes included), that percentage can easily reach more than 90%. The concept of telepresence enables individuals to have the perception and ability to act as if they are present in a different location, despite physically being situated in another place [43]. An example of an AR/MR telepresence would be to have a situation that allows co-present interaction between two remote participants, as the one presented in [44]. The use of the telepresence to obtain SV in certain cases allow a wider extension of the term “close”. Milgram’s virtuality continuum concept [45] suggests that virtuality separates the essence of something from its physical embodiment, allowing it to possess the characteristics of something without being physically present. The connection between telepresence and AR/MR is analogous to that of the non-augmented world [43], meaning that obtaining data are no different whether present in a location or observing them remotely. As such, providing a physical presentation with video feed of a physical referent that users cannot grasp from their position is akin to being physically close to that referent, visualizing the aligned data’s physical presentation. In accordance with what was mentioned previously, a new type of SV is introduced, referred to as remote spatially SV, which is a particular case of the physically SV category that involves remotely connected physical referents and physical presentations. Its definition is:
  • A visualization is remote spatially situated if at least one of its physical sub-referents cannot be seen from the user’s current location, but its data are seen aligned with its corresponding physical sub-presentation (i.e., the corresponding pairs do not share the same space but are seen at the same time).
This new particular case of the SV space perspective is illustrated in Figure 3 by the dotted line between the physical presentation and the physical referent. It is important to note that remote spatially SV must not be confused with perceptually SV since the user always knows the location of the physical referent and presentation, rather than perceiving it. In conclusion, based on the above, the user’s physical world extends from the physical scenario “where the user is” to “where the user is either physically or remotely”.
Figure 5 provides an illustration of the continuum for the physically and perceptually situated categories of the space perspective, as well as for the embedded and remote spatially situated particular cases. This illustration is included to enhance understanding of the concepts presented, and is similar to the approach taken by Milgram et al. in their work [45].

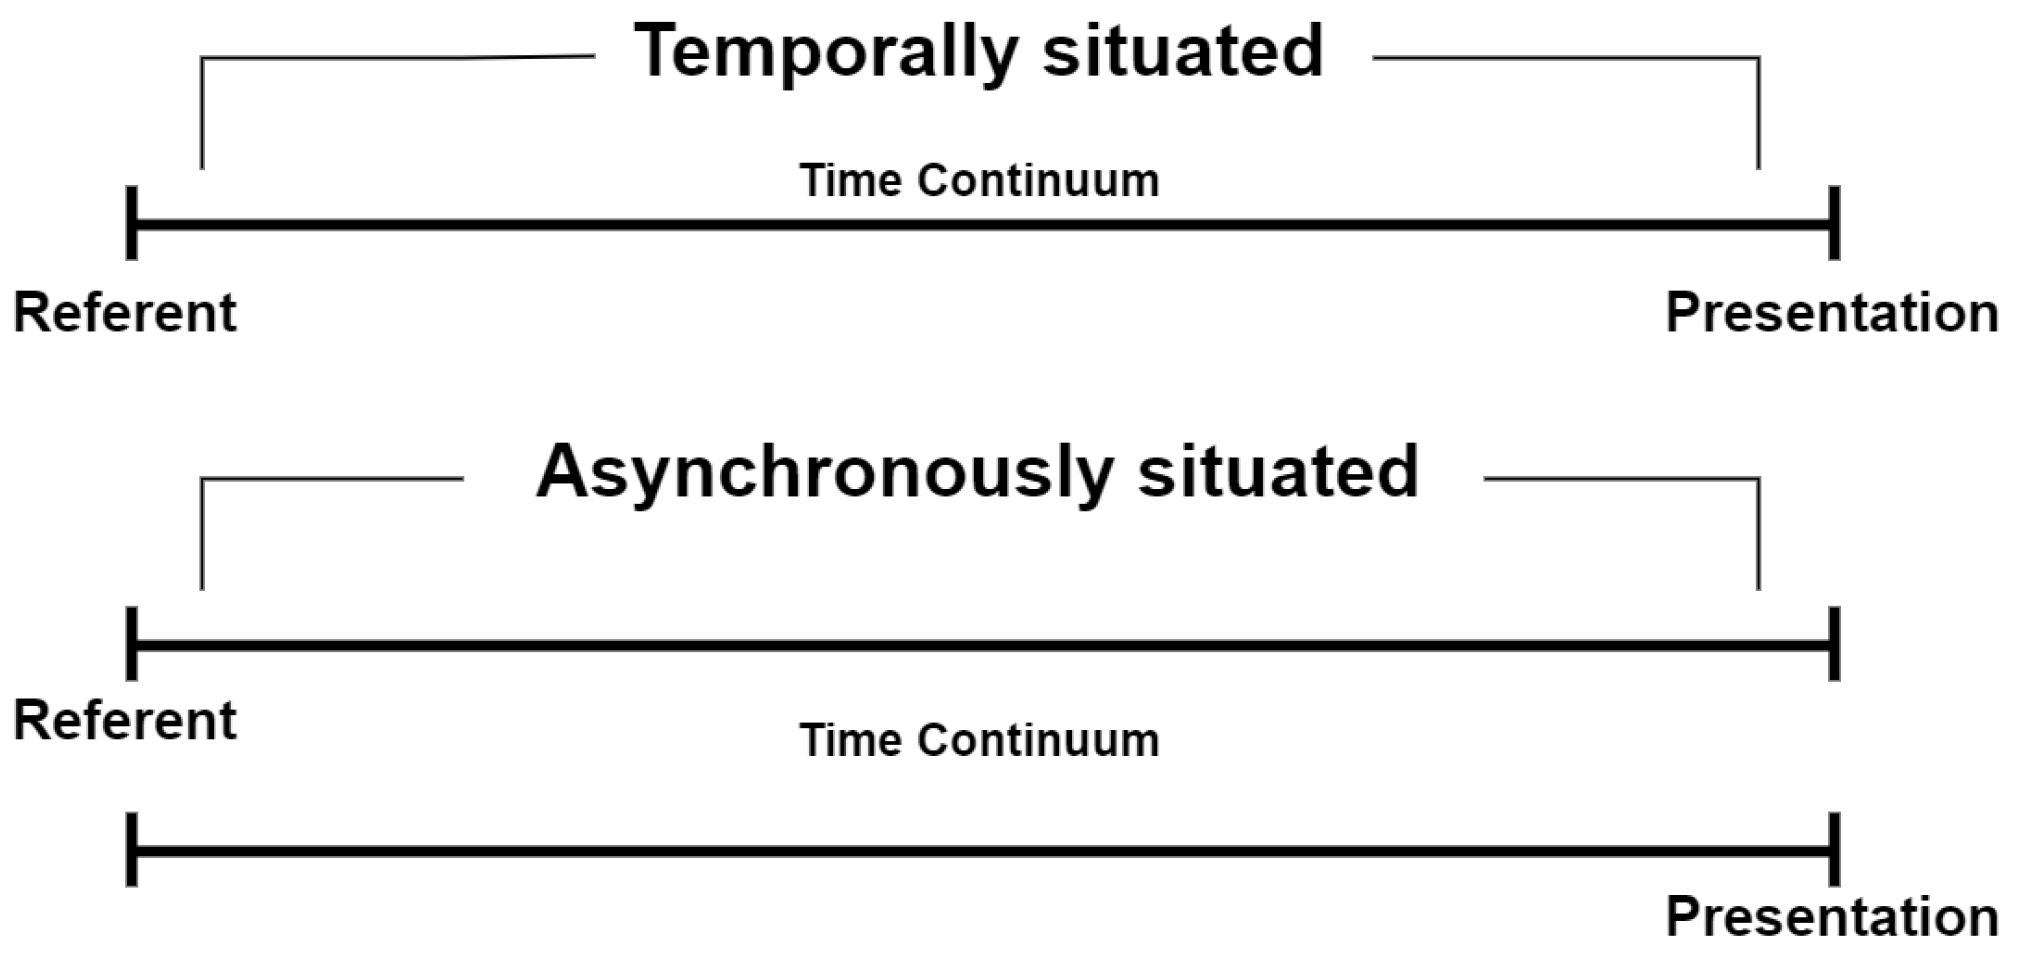
3.2.2. Time Perspective

To escape vagueness concerning the SV time perspective and emphasizing on AR/MR, the following definitions are put forth:
  • A temporal referent is any meaningful period of time, social temporality or moment to which the data refers;
  • A visualization is temporally situated if at least one of its data’s temporal sub-referents is close to the period of time, the social temporality, or the moment its corresponding and aligned physical sub-presentation is observed or recorded.
The need for the word “recorded” in the first definition of Temporally SV [18] was driven by the remote spatially situated case.
The idea behind the remote spatially SV can be applied to time. An example of this occurs when the city government wants to identify pollution hot spots, track changes over time, and make informed decisions about how to improve air quality in different parts of the city, augmenting the pollutant concentration data over time with other data, such as traffic patterns, weather conditions, and industrial activity in the area. Below is the proposed definition for this particular case:
  • A visualization is asynchronously situated if at least one of its temporal sub-referents cannot be seen from the user’s current time, but its data are seen aligned with its corresponding physical sub-presentation (i.e., the corresponding pairs do not share the user’s current time but are seen at the same time).
Depending on the technology used or the historical moment in which it is performed, remote spatial SV could also be considered asynchronous due to the delay (latency time) in sending the video feed from the physical referent to the physical presentation (or the user’s location). However, with the 5G technology (the 5th generation mobile network with a theoretical peak speed of 20 Gbps) the latency time is almost nonexistent that the view is perceived as being in real-time. This situation could be considered highly temporally situated and comparable to the concept of EV in the space perspective.
To enhance the understanding of the concepts presented, Figure 6 is included as an illustration depicting the continuum for the temporally situated category of the time perspective, along with the synchronously situated particular cases.

3.2.3. Place Perspective

There is currently no comprehensive definition available in the literature for the place perspective of the SV. Therefore, with a specific emphasis on AR/MR, the next definitions are recommended to address this gap:
  • A local referent is any meaningful characteristic or characteristics of the place to which the data refers;
  • A visualization is locally situated if at least one of its physical sub-presentations provides information that closely embodies the identity, history or socio-cultural meaning of its corresponding and aligned data’s local sub-referent.
One of the findings of the systematization study was that the SV “locally” category must include an extra feature related to the place’s identity: the surroundings. The dynamism of a place is what this feature entails. When it comes to visualization, there is a difference between a static place and a dynamic one (frequently changing).

3.2.4. Activity Perspective

There is no existing definition for the SV activity perspective in the literature, thus, with a focus on AR/MR, the next ones are presented:
  • An activity referent is the meaningful activity to which the data refers;
  • A visualization is situated regarding the activity if at least one of its physical sub-presentations provides information that is closely related with its matching and aligned data’s activity sub-referent.
The systematization study revealed that the SV activity perspective lacks a comprehensive description of its situatedness. Ref. [46] identified six related components that form an activity: object, subject, tools, division of labour, community, and rules. The object is something to be transformed by the subject or the activity’s team. The tools are the means used by the subject to alter the object. The division of labor refers to the fixed roles assigned to individuals based on their relation to the object. The community is composed of individuals who share knowledge, interests, stakes, and goals to accomplish the activity, and also the physical place where the activity happens. Finally, the rules refer to the norms to be followed within the community. While the component subject is already integrated into the community perspective and the component community in the place and community perspectives, the situatedness of the SV activity perspective must also include the category “role”. This category emphasizes the activities that each participant must perform, such as division of labour, rules, instructions, guidelines, or advice, and has a significant effect on the appropriateness of diverse spatial layouts. It extends beyond temporal and spatial aspects. Spatial layouts refer to the arrangement of physical elements in a particular real space or environment, including the positioning of objects, the organization of spaces, the distribution of features, and the overall structure of the environment. They can be designed to facilitate certain activities, create specific moods or aesthetics, optimize efficiency and functionality, or simply to provide an appealing and comfortable environment. Therefore, the following definition is suggested:
  • A visualization is situated regarding the activity’s role if at least one of its physical sub-presentations provides information about the playing part of the activity’s intervenient that is closely related to its matching and aligned data’s activity sub-referent.
The activity perspective is strongly connected to the surroundings (feature of the SV “locally” category).

3.2.5. Community Perspective

In continuation of the previous sub-section, in order to establish clear definitions for the community perspective in the context of SV for AR/MR, the following definitions are proposed:
  • A communal referent is the meaningful person or group of persons associated to a space, a time, a place, an activity, or a content to which the data refers;
  • A visualization is communally situated if at least one of its physical sub-presentations provides data that is closely related with its corresponding and aligned data’s communal sub-referents.
The systematization study emphasizes that visualizations are created for users and therefore should be designed to cater to a diverse range of user profiles. This gives rise to a particular case of communal SV known as multidisciplinary. The multidisciplinary situatedness arises due to the diversity of backgrounds, experiences, and perceptions of individuals in the community, which can significantly influence the visualization, and can range from complex (for expert users) to simple (for non-expert users). However, especially when it comes to team activities, the subjective viewpoints of users can be debatable in terms of how they would be considered in the visualization. Agreeing with [47], multidisciplinary poses unique challenges in providing elaborate contexts, supporting communication, and enabling adaptation for discipline-specific augmentation. As a result, the following definition is proposed for this particular case:
  • A visualization is multidisciplinary situated if at least one of its physical sub-presentations provides information that is closely understood by its corresponding data’s communal sub-referents.

3.2.6. Content Perspective

Regarding novel visualization perspectives, the systematization harvests another important one to consider, the content. This perspective supplements the other perspectives stated previously (space, place, time, activity, and community) and, like them, its situatedness levels varies on a continuum. The content perspective concerns more the application developers than the users themselves and encompasses the categories of “comprehensively”, “interactively” and “emotionally”.
The “comprehensively” category refers to the provision of accurate, well-organized data to the user. However, in some cases, physical presentation may not be able to handle certain types of data or present information that is partial, confused, or inaccurate. According to Tatzgern, in [25], these challenges are among the key challenges when combining SV with AR/MR. A detailed description of these SV challenges, namely, egocentric viewpoint limitation, data overload, visual interference, visual coherence, registration error, dynamics of AR/MR and temporal coherence, and enunciated by Tatzgern, will be presented in the next section.
As previously mentioned, user interactions can influence the visualization. Thus, the situatedness of the “interactively” category pertains to the interaction between the visualization and its users, including how different users perceive and interact with the visualization, as well as how the accessibility and availability of data and visualization tools impact the use and effectiveness of visualizations. This situatedness has three distinct aspects. The first aspect concerns the input/output modality, which refers to the various independent channels for obtaining or providing data. When considering accessibility for people with special needs, it is essential to ensure that these channels are accessible to everyone, regardless of their abilities. For instance, visualizations should include alternative text descriptions for users who are blind or have low vision, and captions or transcripts for users who are deaf or hard of hearing. Additionally, interactive elements should be designed with adaptability in mind (for instance, keyboard navigation in the eventual absence of pointing or tactile devices), allowing for seamless interaction across different technological paradigms. This ensures that everyone can fully engage with the visualization, benefiting from the insights and information provided, regardless of the specific accessibility needs. By considering the diverse range of technologies and their respective interaction devices, interactions can be translated and tailored accordingly to provide an optimal user experience. Based on Marques et al.’s work [47], the second aspect concerns the user’s level of interaction, which ranges from passive viewing (either on-site or remote) to active exploration (such as manipulating content within the scene), and finally to providing or generating content (such as adding annotations or new views). The last aspect described by Marques et al. pertains to the possibility for the system or user to automatically select or customize the most appropriate output channels.
As mentioned earlier, the SV model includes interactions with several sub-referents, which can lead to challenging scenarios of interaction with multiple viewpoints at once. However, if performed correctly, it can also be rewarding. To effectively incorporate such interactions, designers need to consider various factors. Firstly, they must consider the context and purpose of the visualization and prioritize the viewpoints that are most useful for the intended audience at a certain moment. This requires a thorough understanding of the target audience, their information needs, goals, preferences, and cognitive abilities, involving making decisions about what information is most important to convey and which viewpoints will be most helpful in understanding it. Secondly, designers must ensure that each viewpoint is represented fairly and accurately in the visualization, taking into account potential biases and limitations. Thirdly, they must balance the presentation of different perspectives to avoid overwhelming or conflicting with others, while also considering the user’s cognitive load to ensure that the information presented is easy to process and interpret. Fourthly, designers must recognize that different perspectives can complement each other to provide a more complete and nuanced understanding of the data being visualized. To validate the effectiveness of the visualization design, it is important to conduct tests with representative users to gather feedback and make necessary improvements.
One additional proposed category is the “emotionally”. This category focuses on the emotional experiences and responses of the users to the visualization, including their feelings and attitudes. The attitudes could be immediate or long-term, involving changes in routines and ways of living. For example, a visualization that portrays a natural disaster (due to pollution and global warming) or a health problem (due to smoking) may evoke emotions such as fear, sadness, or empathy from the users. These emotions can influence their understanding and interpretation of the data being presented, as well as their daily routines and ways of living. By incorporating this category, designers can create visualizations that not only convey information but also engage users emotionally, leading to a more impactful and memorable experience.
The following definitions are proposed for the content perspective and its associated categories:
  • A content referent is any meaningful input/output information to which the data refers;
  • A visualization is situated regarding the content if at least one of its physical sub-presentations provides data that is closely related with its corresponding and aligned data’s content sub-referents;
  • A visualization is comprehensively situated if at least one of its physical sub-presentations provides the correct, wholly and organised information that is closely related to its corresponding and aligned data’s content sub-referent;
  • A visualization is interactively situated if at least one of its physical sub-presentations provides the needed data for a closely understandable interaction with its matching and aligned data’s content sub-referent;
  • A visualization is emotionally situated if at least one of its physical sub-presentations engages users emotionally, leading to feelings and attitudes related with its corresponding and aligned data’s content sub-referents.

3.2.7. Ethics Perspective

The visualizations should not only effective but also ethical and responsible. Therefore, a new perspective, the “ethics”, arises from the gap discovered in the literature regarding how ethical principles impact the development and use of visualizations. This perspective should cover issues related to bias, transparency, accountability, privacy, ownership, safety, democracy, and social responsibility to avoid bias, discrimination, or harm. It may be useful to provide guidelines for ethically situatedness visualizations. It is worth noting that ethics perspective may vary depending on the specific context and the involved parties. For example, ethical principles and values may differ between different cultures. Therefore, it is important to take into account the diversity of points of view and potential impacts when designing and using visualizations.
The following definitions are proposed for the ethics perspective and its associated category:
  • An ethical reference encompasses the ethical considerations and implications related to the principles, values, rights, and interests of all parties involved in a given space, time, place, activity, community, or content to which the data refers;
  • A visualization is ethically situated if, during the design phase and when it is used, all of its designers and physical sub-presentations respect the ethical principles, values, rights, and interests of the users, the data, and the society associated with its corresponding and aligned data’s ethical sub-referents;
  • A visualization is ethically diverse if all of its physical sub-presentations take into account the diversity of backgrounds, norms, values, and practices associated with its corresponding and aligned data’s ethical sub-referents.

4. Challenges in SV for AR/MR

Developing immersive visualizations in SV applications can be a highly motivating task with potential advantages over conventional AR/MR-based visualizations. As pointed out in [11], improved perception through SV can help certain tasks such as spatial learning, inspection/comparison, and in-situ pattern-seeking and discovery when compared to alternative methods. However, the advantages of SV come with challenges that affect its applicability and usefulness. These conciliations and several research challenges are discussed by Willet et al. in [26]. While some of these challenges are shared by other areas, including information and scientific visualizations, others are unique to AR/MR [48]. Furthermore, SV presents other problems due to the real world dynamic and distracting nature. Therefore, SV is a very motivating research area that needs further investigation.
As pointed out by Tatzgern [25], the integration of SV with real-world requires careful consideration of the following aspects:
  • Data overload
    The presentation and interaction with a large amount of data are a challenge for any kind of visualization, and not only for AR/MR. The visualization of all the information leads to confusion and lack of clarity. A possible solution for the data overload problem, among others, is filtered and automatically overlaid the annotations through object recognition techniques.
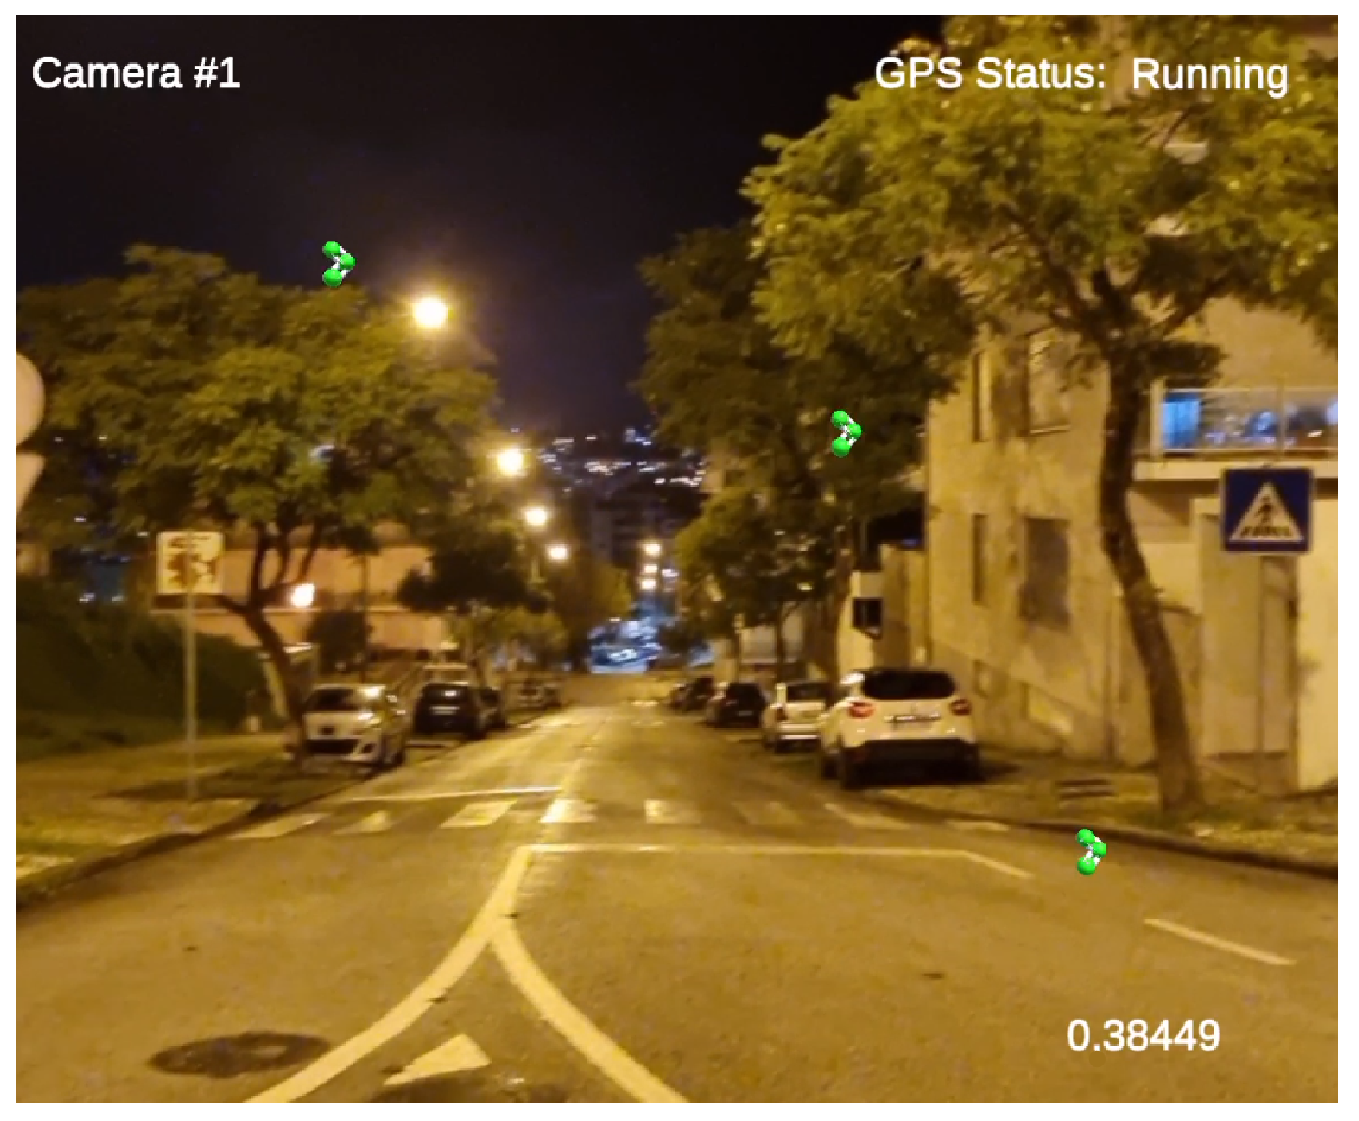
  • Visual interference
    The essential information must be clearly distinguished from the irrelevant one. Important landmarks or any kind of essential information might be occluded or not occluded, by the annotations. Ref. [36] shows an example of essential information occluded by annotations and the same annotations in irrelevant parts of the image (in the case, in the sky).
  • Visual coherence and registration errors
    In AR/MR, supplementary virtual information (usually visual) is superimposed onto the user’s environment, in the real world and in real-time. When the result of that process makes sense to the user, it can be said it is coherent. A coherent visual result offers the user clearer visual cues on the location, shape and characteristics of the virtual objects and the interactions between them and real objects. The registration is how accurately the overlay process is performed. In other words, when the digital content is in the exact right position in the real-world image it is said the virtual data are aligned with the real data. When the virtual data are not in the right location, the digital content is considered misaligned or with registration errors. So, virtual information must be consistent with the real-world and erroneous registration may communicate false information.
  • Dynamics of AR/MR and temporal coherence
    Variations of the scenario or the user’s viewpoint can produce distracting alterations of the visualization. A change in the user’s viewpoint can result in a reordering of the annotations. As can be understood, these modifications produce confusing outcomes because, for example, the annotations can be misleading. To avoid this, the changes must be performed in a temporally coherent way. It is necessary for digital content to maintain a record of the user’s viewpoint operations throughout the course of interaction.
  • Egocentric viewpoint limitation
    Typically, AR/MR systems are based on one view (or camera). At any time, the user only has the viewpoint of that camera towards the 3D world, referred to as the egocentric viewpoint. In this context, the egocentric viewpoint involves a camera-to-objects representational system, establishing where the world objects are concerning the camera location (or the user’s position).
    There are two main reasons why the visualization and usability of an AR/MR system are severely impaired by the limitation of the egocentric viewpoint of the user. The first is that there are many situations in which the viewpoint is not the most appropriate to present the relevant information, restricting the ability of the users to explore all the information in real world environments (for example, when training with a machine and only part of its main panel is viewed) [25]. The second, and most important, is that some visualization tasks cannot be performed from an egocentric viewpoint, for example, to show to a student a comprehensive layout of the entire campus. Knowing that the overview task could be the initial point or a recurrent one when the AR/MR application is being used, its absence weakens the user’s interaction. Some solutions or mitigation for the egocentric viewpoint limitation challenge can be seen on [25,28,49].
  • Situated analytics
    The mixture of analytics and SV, the situated analytics (SA), raises challenges at the following levels:
    -
    Theoretical and practical
    SA takes a less formal approach to data analysis compared to traditional methods. As a result, it requires a fresh perspective on how to develop, test and assess tools that are context-specific. This involves exploring novel techniques, guidelines and models [18]. An example of that is the DXR toolkit, presented in [50], that offers developers an efficient way to build immersive data visualization designs, with a new succinct declarative visualization grammar inspired by Vega-Lite.
    -
    Ethical
    The information that SA, and even SV, provide could improve understanding and be highly valuable to the users, but could also reveal sensitive information. This is a problem of any visualization system. So, all the delicate information should be dealt with extreme care. Another concern relates to the possibility of an inexhaustible data collection (giving a wrong idea because it is only a partial view of reality), despite the correctness of the gathering process. Selectively displaying data is a way to introduce some prejudice by over-emphasizing some elements. The problem of fake news, which involves the use of altered, incorrect, or wrong facts, as well as biased data collection practices, should also be addressed. Such practices may reflect the perspectives of specific groups of people and propagate stereotypes and prejudices.

5. Practical Scenarios

In order to illustrate these perspectives, let us consider a practical case in the field of air pollution. The Situated Pollution research project [49], which is still in development, aims to use AR/MR devices for public visualization to assess air pollution, raise awareness, and educate communities on this issue. Currently, the Situated Pollution hand-held mobile application displays various types of air quality information for specific geographical zones (gathered by the Department of Environment and Planning at the University of Aveiro). It consists of two canvas: one to present the user’s camera feed augmented with information on the concentration level of pollutants in the user’s location, and the other to show a virtual model of the user’s surroundings and the associated pollution levels based on GPS coordinates (using the Google Maps SDK for Unity© package that provides access to high-quality geo data from the Google Maps database). The application uses glyphs to represent the pollutant molecules in the air, along with a simplified color code and numerical scale to report how clean or polluted the air is. It is intended that the application will identify potential environmental concerns for users living in these areas, collect data through surveys on residents’ habits, distribute content on air quality, provide instruction on how to reduce air pollution through a collaborative task, and promote interaction with a simulation about air quality. Until now, data on air pollution have been gathered from three distinct locations, referred to as zone A, zone B, and zone C. One example of the implemented so far mobile application is presented in Figure 7, where the users can see two separate canvases with real (from the camera’s smartphone) and virtual information, related between them, through their location. This was the solution used to extend the egocentric viewpoint (regarding the egocentric viewpoint limitation). In the Situated Pollution, each local user’s mobile phone, tablet or AR glasses (when implemented) serves as the physical sub-presentations. Following, it is described the components of the project where each of the aforementioned SV perspectives is or will be applicable.

5.1. Space Perspective

As users move through different zones and use the Situated Pollution app, they can view the pollutants concentration in their vicinity. The exact location where pollution is being measured serves as the data’s spatial referent. If the user can view that location but is not currently there, the visualization will be considered spatially situated. In contrast, if the user is physically present at the location, the visualization will be physically situated. Figure 7 exemplifies this situation. If the pollution sensor and the user are in the same position within the measurement area, the visualization will be highly spatially situated. Additionally, if users can access air pollution information from precise positions within that area, the visualization, aligned with those positions, would be embedded. Suppose a head-mounted display is used to view the pollutants concentrations, which combines real-world images with virtual content, and delivers both to the user’s eyes simultaneously. In that case, the users may feel that they are close to the physical referent even when they could not be. In such cases, the visualization seen by the user is virtual rather than physical [18], and is termed as perceptually situated. Lastly, if a camera captures images of the location, and users view these images, with augmented information on air pollution, from a different location, the visualization will be remotely spatially situated.

5.2. Time Perspective

This research project is designed to enable the presentation of air pollutant levels at a specific moment in time (the data’s temporal referent). This kind of visualization can be considered temporally situated. On the other hand, if the pollution data are being shown in real-time, then the visualization is classified as highly temporally situated. Additionally, the visualization is classified as asynchronously situated if a user is looking at the camera feed from the previous day, overlaid with the air pollution data from that specific time and area. Figure 7 illustrates this situation, because the air pollution data were collected on a different day than the day the Situated Pollution mobile application was used.

5.3. Place Perspective

In zone B, a structure with a distinctive shape stands out and contributes to the area’s identity (data’s local referent). Additionally, the zone was baptized after a prominent singer, further tying the cultural heritage of that singer to the area. Therefore, when a 3D avatar of the singer highlights the effects of air pollution on that particular structure, the visualization becomes locally situated, embodying the identity of the place. Figure 8 illustrates this situation. The application will allow users to share information about the place where they are related to the air quality of that place. This information will only be available after validation by the application managers. After this step, the information will be used as content to raise user’s awareness and provide contextual information about pollution. Considering the surroundings characteristic of the place’s identity, the visualization should consider whether the zone is active and how this affects the user. For example, if there is an excessive amount of data about air pollution and the place on the physical presentations, a user in a car trying to evade polluted zones may be unable to access the needed data without stopping, disrupting traffic movement. Thus, the dynamism of the surroundings must be considered when the information is given to the user.

5.4. Activity Perspective

The Situated Pollution research project is designed to notify users if the air pollution in their area exceeds a certain level, triggering an activity. This feature provides users with suggestions to lessen air pollution (scientific teaching) and represents a situated visualization regarding the activity since pollution decrease is the activity’s referent. The application then prompts the user to join a Collaborative activity by following a set of commands. This represents a situated visualization regarding the activity’s role, as the commands are closely related to the mentioned activity. The term “closely” implies that the instructions may range from precise to generic. In an ideal scenario, the user would earn eco-times for every correctly followed commands, which they could use to plant trees, although this has not yet been implemented.

5.5. Community Perspective

The project plans to conduct a public poll around pollution concerns based on the examination of local pollution data outcomes. Since the data are specific to Zones A or B, it is logic to engage with people from those zones (data’s communal referent). Consequently, the visualization is communally situated due to the questions asked on passerby are closely connected to them. In this research project, a visualization will be considered multidisciplinary situated if it caters to both layman and expert user profiles. For example, a layman user may receive the message “Air quality is good”, as is illustrated in Figure 9 (but not yet implemented in the Situated Pollution mobile application), while the expert user’s physical presentation would show the pollution’s 3D models overlaid on the real world images, the air quality index, the concentration level of each pollutant, and area’s past data on the air quality.

5.6. Content Perspective

The situatedness of the “comprehensively” category is dependent on the person that prepares the information to present to the users (or the source of that information). For example, if there is misrepresented information on concentrations of one pollutant by claiming it is from another, or only a partial amount of that information is presented (in an attempt to give the wrong idea), the visualization cannot be comprehensively situated. The pollution concentration data represented in Figure 7 are simulated for testing purposes and, therefore, since the data are not real, the visualizations are not comprehensively situated. However, if the available information is real, correctly collected and prepared, and then displayed to the user, such as the example presented in Figure 9, the visualization can be considered comprehensively situated (all the data are perceived “closely” by the user). The responsibility for creating a comprehensively SV lies with the visualization designers, as they are accountable for ensuring clarity and accuracy. Unclear, partial, or flawed information can result from both poor design, incorrect data gathering and analysis practices, with these last two aligning with the garbage in, garbage out principle. The Situated Pollution project aims to include and make the visualization accessible through multimodal input and output, as well as customizable to the user’s abilities. When these goals are achieved, the project will have an interactively situated visualization that responds to the user’s actions. In conclusion, a comprehensively or interactively SV (or situated regarding the content) is dependent on the designer’s ability to create an effective visualization that incorporates the context of the data and the user. Finally, if the Situated Pollution application makes that its users start to not use their private car to reduce the pollution in their movement areas, the visualization will be emotionally situated.

5.7. Ethics Perspective

If the Situated Pollution application presents a comparative table to prove that a certain zone suffers more from pollution than others, using pollution concentrations for that zone in the rush hour and pollution concentrations for the other zones at night (without taking into account the factors that contribute to pollution rates in those areas), the visualization will be not ethically situated. In spite of the use of correct pollution concentration information, the data were manipulated. This situation could perpetuate harmful stereotypes and stigmatize certain communities, reinforcing discrimination and marginalization. The ethics perspective can also be adversely affected by improper data gathering and analysis practices. Therefore, to ensure that visualizations are ethically situated, designers should take several steps, such as being transparent about the data sources and any limitations or potential biases in the data (so that users can make informed decisions about how to use and interpret the visualization), avoiding misrepresenting the data (including using clear and accurate labels and explanations to help users understand the data being presented), using accurate and unbiased data sources, and ensuring that the visualization content is not harmful, stereotypical, or offensive to anyone.

6. Conclusions

AR/MR has great potential in numerous applications and as it becomes more affordable it is likely to become more widespread in daily life tasks, such as in situated visualization. Thus, efforts to harmonize SV perspectives should be made in order to facilitate analysis and enhance understanding of the contributions brought by AR/MR. In this article, a critical analysis of the AR/MR-based SV research is presented, offering new perspectives and updating existing concepts and definitions, aiming to establish a common ground for debate and analysis by the research community.
The concept of situatedness should be seen in a broader context to include visualizations that not only consider each perspective individually but also integrate multiple layers of situatedness within each perspective. For example, within the activity perspective, a visualization could consider not only the primary activity being visualized, but also the related or intersecting activities that impact or are impacted by the primary activity.
Introducing this extended SV model in AR/MR application development process can bring several benefits. First, it allows for a more nuanced and context-specific approach to data visualization, which can improve the overall user experience. Second, by having in mind the situatedness within each perspective, designers can create visualizations that are richer in meaning and can potentially help address issues of bias and cultural sensitivity. Third, having standardized definitions for space, time, place, activity, and community can promote more effective communication and collaboration among designers and users. Finally, by considering the emotionally situated category and ethics perspective, designers can create AR/MR applications that are more empathetic, ethical, and inclusive.
The content perspective stresses the importance of designing SV with the users and their needs at the center of the process, given that not everyone has a solid understanding of basic computer applications. SV designers should thus aim to create visualizations and interactions that cater to a broad spectrum of user profiles whenever possible and appropriate. When there is a need to automatically change/update a visualization, the definitions proposed for the SV model can be used as guidelines for designers to ensure that the changes made still adhere to the intended situatedness perspectives. To solve possible conflicts between contrasting requirements, it is necessary to take a holistic approach that considers all the perspectives involved in the SV model and the specific context in which the visualization will be used. It may require compromising or finding creative solutions that satisfy all parties involved. Effective communication and collaboration among stakeholders, including designers and users, are also crucial to ensure a successful SV implementation.
It is not necessary for a visualization to be compliant with all the perspectives introduced in the extended SV model. The perspectives should be chosen based on the specific requirements of the visualization and its intended use cases. However, incorporating multiple perspectives can enhance the overall user experience and improve the degree of situatedness achieved by the visualization.
To rate the degree of situatedness achieved in visualizations, each element of the visualization should be evaluated based on how much it corresponds to the situatedness of each perspective. For example, a visualization that employs technology enabling physical situatedness would score higher in the space perspective situatedness than one made with technology that only offers perceptual situatedness. Likewise, a visualization made by technology that can adapt to the user’s context in real-time would be rated higher in the content perspective situatedness than others using technology that cannot provide that. Evaluation based on the degree of situatedness achieved in each perspective can provide a comprehensive assessment of a visualization’s overall situatedness. Strategies such as expert evaluation, user feedback and surveys, comparative evaluation, and deriving specific quantitative metrics can be utilized to tackle the challenge of measuring situatedness in each perspective. In cases where defining a precise scale is not possible, a combination of these strategies can still be used to assess the degree of situatedness.
It is important to emphasize that our proposal should not be viewed as a final product, but rather a foundation that can be built upon and improved by the community over time. The purpose of this article is to provide a well-structured framework that can facilitate the addition of new categories as needed. However, the proposal is robust and flexible enough to accommodate future technological advances that may radically change the current situation by providing a theoretical framework that is focused on the fundamental principles of situatedness rather than specific technological implementations.
In the future, the incorporation of Artificial Intelligence into the SV for AR/MR can produce new advanced systems, making it possible to understand a broad variety of information and choose the finest course of action. Using machine learning, the systems could enhance with time, delivering information that is more efficient.
The Situated Pollution mobile application will be used to validate the proposed systematization with visualization experts and to evaluate user experience. The project must provide methods and tools, technological or not, to facilitate interaction and democratize visualization, accommodating different profiles and environments. The community should strive to develop intelligent AR/MR systems for SV scenarios, providing better tools and support for decision-making situations across user profiles. Additionally, gamification concepts could be explored in the SV domain to increase user engagement and awareness.

Author Contributions

Conceptualization, N.C.M., P.D. and B.S.S.; methodology, N.C.M., B.M., P.D. and B.S.S.; software, N.C.M.; validation, N.C.M.; formal analysis, B.M., P.D. and B.S.S.; investigation, N.C.M. and B.S.S.; resources, N.C.M., B.M. and P.D.; data curation, N.C.M.; writing—original draft preparation, N.C.M.; writing—review and editing, N.C.M., B.M., P.D. and B.S.S.; visualization, N.C.M., B.M., P.D. and B.S.S.; supervision, P.D. and B.S.S.; project administration, N.C.M., P.D. and B.S.S.; funding acquisition, P.D. and B.S.S. All authors have read and agreed to the published version of the manuscript.

Funding

This research was supported by Institute of Electronics and Informatics Engineering of Aveiro (IEETA), funded through the Foundation for Science and Technology (FCT), in the context of the project [UIDB/00127/2020].

Institutional Review Board Statement

Not applicable.

Informed Consent Statement

Not applicable.

Data Availability Statement

Not applicable.

Acknowledgments

We are grateful to Sandra Rafael from CESAM—University of Aveiro, for providing the air pollution data used by the Situated Pollution application.

Conflicts of Interest

The authors declare no conflict of interest.

References

  1. Dağtaş, A.; Zaimoglu, S. The Language Learning Journey of ELT Teachers: A Narrative Approach. In Autoethnographic Perspectives on Multilingual Life Stories; IGI Global: Hershey, PA, USA, 2022; pp. 202–216. [Google Scholar]
  2. Speicher, M.; Hall, B.D.; Nebeling, M. What is mixed reality? In Proceedings of the 2019 CHI Conference on Human Factors in Computing Systems, Glasgow, UK, 4–9 May 2019; pp. 1–15. [Google Scholar]
  3. Korkmaz, E.; Morali, H.S. A meta-synthesis of studies on the use of augmented reality in mathematics education. Int. Electron. J. Math. Educ. 2022, 17, em0701. [Google Scholar]
  4. Dube, T.J.; İnce, G. A novel interface for generating choreography based on augmented reality. Int. J. Hum. Comput. Stud. 2019, 132, 12–24. [Google Scholar] [CrossRef]
  5. Steffen, J.H.; Gaskin, J.E.; Meservy, T.O.; Jenkins, J.L.; Wolman, I. Framework of affordances for virtual reality and augmented reality. J. Manag. Inf. Syst. 2019, 36, 683–729. [Google Scholar] [CrossRef]
  6. Iqbal, M.Z.; Mangina, E.; Campbell, A.G. Current Current Challenges and Future Research Directions in Augmented Reality for Education. Multimodal Technol. Interact. 2022, 6, 75. [Google Scholar] [CrossRef]
  7. Laird, D.; Holton, E.F.; Naquin, S.S. Approaches to Training and Development: Revised and Updated; Basic Books: New York, NY, USA, 2003. [Google Scholar]
  8. Kosara, R. Visualization criticism-the missing link between information visualization and art. In Proceedings of the 2007 11th International Conference Information Visualization (IV’07), Zurich, Switzerland, 4–6 July 2007; IEEE: New York, NY, USA, 2007; pp. 631–636. [Google Scholar]
  9. Card, M. Readings in Information Visualization: Using Vision to Think; Morgan Kaufmann: Burlington, MA, USA, 1999. [Google Scholar]
  10. Schmalstieg, D.; Hollerer, T. Augmented Reality: Principles and Practice; Addison-Wesley Professional: Boston, MA, USA, 2016. [Google Scholar]
  11. White, S.M. Interaction and Presentation Techniques for Situated Visualization. Ph.D. Thesis, Columbia University, New York, NY, USA, 2009. [Google Scholar]
  12. Kalkofen, D.; Sandor, C.; White, S.; Schmalstieg, D. Visualization techniques for augmented reality. In Handbook of Augmented Reality; Springer: Berlin/Heidelberg, Germany, 2011; pp. 65–98. [Google Scholar]
  13. Pezanowski, S.; MacEachren, A.; Savelyev, A.; Robinson, A. SensePlace3: A geovisual framework to analyze place–time–attribute information in social media. Cartogr. Geogr. Inf. Sci. 2017, 45, 420–437. [Google Scholar] [CrossRef]
  14. Reitberger, W.; Obermair, C.; Ploderer, B.; Meschtscherjakov, A.; Tscheligi, M. Enhancing the shopping experience with ambient displays: A field study in a retail store. In Ambient Intelligence. AmI 2007; Springer: Berlin/Heidelberg, Germany, 2007; pp. 314–331. [Google Scholar]
  15. Perovich, L.J.; Wylie, S.A.; Bongiovanni, R. Chemicals in the Creek: Designing a situated data physicalization of open government data with the community. IEEE Trans. Vis. Comput. Graph. 2020, 27, 913–923. [Google Scholar] [CrossRef]
  16. ElSayed, N.A.M.; Thomas, B.H.; Smith, R.T.; Marriott, K.; Piantadosi, J. Using augmented reality to support situated analytics. In Proceedings of the 2015 IEEE Virtual Reality (VR), Arles, France, 23–27 March 2015; IEEE: New York, NY, USA, 2015; pp. 175–176. [Google Scholar]
  17. ElSayed, N.A.M.; Thomas, B.H.; Marriott, K.; Piantadosi, J.; Smith, R.T. Situated analytics: Demonstrating immersive analytical tools with augmented reality. J. Vis. Lang. Comput. 2016, 36, 13–23. [Google Scholar] [CrossRef]
  18. Thomas, B.H.; Welch, G.F.; Dragicevic, P.; Elmqvist, N.; Irani, P.; Jansen, Y.; Schmalstieg, D.; Tabard, A.; ElSayed, N.A.M.; Smith, R.T.; et al. Situated Analytics. Immersive Anal. 2018, 11190, 185–220. [Google Scholar]
  19. Dwyer, T.; Henry Riche, N.; Klein, K.; Stuerzlinger, W.; Thomas, B. Immersive analytics (Dagstuhl seminar 16231). In Dagstuhl Reports; Schloss Dagstuhl-Leibniz-Zentrum fuer Informatik: Wadern, Germany, 2016; Volume 6, pp. 1–9. [Google Scholar]
  20. Bach, B.; Sicat, R.; Pfister, H.; Quigley, A. Drawing into the AR-CANVAS: Designing embedded visualizations for augmented reality. In Proceedings of the Workshop on Immersive Analytics, IEEE Vis., Phoenix, AR, USA, 1–6 October 2017. [Google Scholar]
  21. Ens, B.; Bach, B.; Cordeil, M.; Engelke, U.; Serrano, M.; Willett, W.; Prouzeau, A.; Anthes, C.; Büschel, W.; Dunne, C.; et al. Grand challenges in immersive analytics. In Proceedings of the 2021 CHI Conference on Human Factors in Computing Systems, Yokohama, Japan, 8–13 May 2021; pp. 1–17. [Google Scholar]
  22. Elmqvist, N.; Irani, P. Ubiquitous analytics: Interacting with big data anywhere, anytime. Computer 2013, 46, 86–89. [Google Scholar] [CrossRef]
  23. Marques, B.; Silva, S.; Alves, J.; Rocha, A.; Dias, P.; Santos, B.S. Remote collaboration in maintenance contexts using augmented reality: Insights from a participatory process. Int. J. Interact. Des. Manuf. (IJIDeM) 2022, 16, 419–438. [Google Scholar] [CrossRef]
  24. Martins, N.C.; Marques, B.; Dias, P.; Santos, B.S. Augmenting the Reality of Situated Visualization. In Proceedings of the International Conference on Information Visualization, IV, Vienna, Austria, 19–22 July 2022; pp. 1–7. [Google Scholar]
  25. Tatzgern, M. Situated Visualization in Augmented Reality. Ph.D. Thesis, Graz University of Technology, Graz, Austria, 2015. [Google Scholar]
  26. Willett, W.; Jansen, Y.; Dragicevic, P. Embedded data representations. IEEE Trans. Vis. Comput. Graph. 2017, 23, 461–470. [Google Scholar] [CrossRef] [Green Version]
  27. Bressa, N.; Korsgaard, H.; Tabard, A.; Houben, S.; Vermeulen, J. What’s the Situation with Situated Visualization? A Survey and Perspectives on Situatedness. IEEE Trans. Vis. Comput. Graph. 2021, 28, 107–117. [Google Scholar] [CrossRef]
  28. Martins, N.C.; Dias, P.; Santos, B.S. Egocentric viewpoint in mixed reality situated visualization: Challenges and opportunities. In Proceedings of the 2020 24th International Conference Information Visualisation (IV), Melbourne, Australia, 7–11 September 2020; IEEE: New York, NY, USA, 2020; pp. 9–15. [Google Scholar]
  29. White, S.; Morozov, P.; Oda, O.; Feiner, S. Progress towards site visits by situated visualization. In Proceedings of the ACM CHI 2008 Workshop: Urban Mixed Reality, Florence, Italy, 5–10 April 2008. [Google Scholar]
  30. White, S.; Feiner, S. SiteLens: Situated visualization techniques for urban site visits. In Proceedings of the SIGCHI Conference on Human Factors in Computing Systems, Boston, MA, USA, 4–9 April 2009; pp. 1117–1120. [Google Scholar]
  31. Martins, N.C.; Marques, B.; Alves, J.; Araújo, T.; Dias, P.; Santos, B.S. Augmented reality situated visualization in decision-making. Multimed. Tools Appl. 2021, 81, 14749–14772. [Google Scholar] [CrossRef]
  32. Moere, A.V.; Hill, D. Designing for the situated and public visualization of urban data. J. Urban Technol. 2012, 19, 25–46. [Google Scholar] [CrossRef]
  33. Fuhrmann, A.; Loffelmann, H.; Schmalstieg, D. Collaborative augmented reality: Exploring dynamical systems. In Proceedings of the Visualization’97 (Cat. No. 97CB36155), Phoenix, AZ, USA, 24 October 1997; IEEE: New York, NY, USA, 1997; pp. 459–462. [Google Scholar]
  34. Meiguins, B.S.; do Carmo, R.C.; Goncalves, A.S.; Godinho, P.I.A.; de Brito Garcia, M. Using augmented reality for multidimensional data visualization. In Proceedings of the Tenth International Conference on Information Visualisation (IV’06), London, UK, 5–7 July 2006; IEEE: New York, NY, USA, 2006; pp. 529–534. [Google Scholar]
  35. Nee, A.Y.C.; Ong, S.; Chryssolouris, G.; Mourtzis, D. Augmented reality applications in design and manufacturing. CIRP Ann. 2012, 61, 657–679. [Google Scholar] [CrossRef]
  36. Grasset, R.; Langlotz, T.; Kalkofen, D.; Tatzgern, M.; Schmalstieg, D. Image-driven view management for augmented reality browsers. In Proceedings of the 2012 IEEE International Symposium on Mixed and Augmented Reality (ISMAR), Atlanta, GA, USA, 5–8 November 2012; IEEE: New York, NY, USA, 2012; pp. 177–186. [Google Scholar]
  37. Eissele, M.; Kreiser, M.; Ertl, T. Context-controlled flow visualization in augmented reality. In Proceedings of the Graphics Interface 2008, Windsor, ON, Canada, 28–30 May 2008; pp. 89–96. [Google Scholar]
  38. Jansen, Y.; Dragicevic, P. An interaction model for visualizations beyond the desktop. IEEE Trans. Vis. Comput. Graph. 2013, 19, 2396–2405. [Google Scholar] [CrossRef] [Green Version]
  39. Fleck, P.; Calepso, A.S.; Hubenschmid, S.; Sedlmair, M.; Schmalstieg, D. RagRug: A Toolkit for Situated Analytics. IEEE Trans. Vis. Comput. Graph. 2023, 29, 3281–3297. [Google Scholar] [CrossRef]
  40. Pederson, T. From Conceptual Links to Causal Relations—Physical-Virtual Artefacts in Mixed-Reality Space. Ph.D. Thesis, Umeå University, Umeå, Sweden, 2003. [Google Scholar]
  41. Dourish, P. Re-space-ing place: “Place” and “space” ten years on. In Proceedings of the 2006 20th Anniversary Conference on Computer Supported Cooperative Work, Banff, AB, Canada, 4–8 November 2006; pp. 299–308. [Google Scholar]
  42. Bødker, S. Through the Interface: A Human Activity Approach to User Interface Design, 1st ed.; CRC Press: Boca Raton, FL, USA, 1991. [Google Scholar]
  43. Craig, A.B. Understanding Augmented Reality: Concepts and Applications; Morgan Kaufmann: Amsterdam, The Netherlands, 2013. [Google Scholar]
  44. Pejsa, T.; Kantor, J.; Benko, H.; Ofek, E.; Wilson, A. Room2room: Enabling life-size telepresence in a projected augmented reality environment. In Proceedings of the 19th ACM Conference On Computer-Supported Cooperative Work & Social Computing, San Francisco, CA, USA, 27 February–2 March 2016; pp. 1716–1725. [Google Scholar]
  45. Milgram, P.; Kishino, F. A taxonomy of mixed reality visual displays. IEICE Trans. Inf. Syst. 1994, 77, 1321–1329. [Google Scholar]
  46. Zhang, P.; Bai, G. An activity systems theory approach to agent technology. Int. J. Knowl. Syst. Sci. 2005, 2, 60–65. [Google Scholar]
  47. Marques, B.; Silva, S.S.; Alves, J.; Araujo, T.; Dias, P.M.; Santos, B.S. A conceptual model and taxonomy for collaborative augmented reality. IEEE Trans. Vis. Comput. Graph. 2021, 28, 5113–5133. [Google Scholar] [CrossRef]
  48. Kruijff, E.; Swan, J.E.; Feiner, S. Perceptual issues in augmented reality revisited. In Proceedings of the 2010 IEEE International Symposium on Mixed and Augmented Reality, Seoul, Korea, 13–16 October 2010; IEEE: New York, NY, USA, 2010; pp. 3–12. [Google Scholar]
  49. Martins, N.C.; Marques, B.; Rafael, S.; Dias, P.; Santos, B.S. Seeing Clearly: A Situated Air Quality Visualization with AR Egocentric Viewpoint Extension. In Proceedings of the Workshop on Visualisation in Environmental Sciences (EnvirVis) at EuroVis, Leipzig, Germany, 12–16 June 2023. accepted. [Google Scholar]
  50. Sicat, R.; Li, J.; Choi, J.; Cordeil, M.; Jeong, W.K.; Bach, B.; Pfister, H. DXR: A toolkit for building immersive data visualizations. IEEE Trans. Vis. Comput. Graph. 2018, 25, 715–725. [Google Scholar] [CrossRef] [PubMed] [Green Version]
Figure 1. An example of situated visualization (SV), a context-driven visualization technique, displaying the pollution concentration related to a user’s GPS coordinates on a particular street using digital augmentations based on representations of the polluting molecules.
Bdcc 07 00112 g001
Figure 2. Classical spatially SV model, showing the different paths of the information until arrives at the user, adapted from [18].
Bdcc 07 00112 g002
Figure 3. The updated SV model, integrating different forms of interaction, sub-presentations and the spatial, local, temporal, activity, content, communal and ethical sub-referents, adapted from [24].
Bdcc 07 00112 g003
Figure 4. Systematization of space, place, time, activity, content, community and ethics SV perspectives, their own categories, and particular cases.
Bdcc 07 00112 g004
Figure 5. Representation of the continuum of the space perspective for the categories physically and perceptually situated, and particular cases embedded and remote spatially situated.
Bdcc 07 00112 g005
Figure 6. Representation of the continuum of the time perspective for the category temporally and for the particular case asynchronously situated.
Bdcc 07 00112 g006
Figure 7. Example of the Situated Pollution mobile application, by joining two separate canvases to visualize related and dynamic real and virtual information regarding the air quality.
Bdcc 07 00112 g007
Figure 8. Illustration of the locally situated visualization, showing a 3D avatar of a singer with the same name as the place, highlighting the effects of air pollution on a specific structure of that place (not yet implemented in the Situated Pollution mobile application).
Bdcc 07 00112 g008
Figure 9. Illustration of the multidisciplinary situated (not yet implemented by the Situated Pollution mobile application) and comprehensively situated obtained with the Situated Pollution mobile application.
Bdcc 07 00112 g009
Table 1. Summary of the main contributions over the current state-of-the-art.
Literature OverviewArticle [24]The Current Article (Extension of [24])
• Explains the SV model [11,25,26]• Proposes an expansion of the SV model• Refines the expansion of the proposed SV model to address the explanation gaps identified in [24]
• Creates detailed SV definitions for space and time perspectives, but no comprehensive definitions for place, activity and community perspectives [27]• To avoid confusion between the definitions of SV across different fields of study, systematizes and rewrites all known definitions of SV (standardized definitions were developed for space, time, place, activity, and community)• Refines some definitions presented in [24] to provide better clarity on the physically situated, perceptually situated, and embedded definitions, and explains more comprehensively the space, time, place, activity, community and content perspectives in order to address identified gaps
• Proposes new categories for space, time, place, activity and community• Proposes the emotionally situated category under the SV content perspective
• Proposes the SV content perspective• Introduces the ethics perspective and its corresponding category
• Presents the challenges in SV for AR/MR
Disclaimer/Publisher’s Note: The statements, opinions and data contained in all publications are solely those of the individual author(s) and contributor(s) and not of MDPI and/or the editor(s). MDPI and/or the editor(s) disclaim responsibility for any injury to people or property resulting from any ideas, methods, instructions or products referred to in the content.

