1. Introduction
The current COVID-19 pandemic has caused a significant global crisis, with over 663 million confirmed cases and 6.68 million deaths worldwide, as of December 2022 [
1]. The virus, caused by the severe acute respiratory syndrome coronavirus 2 (SARS-CoV-2), is highly contagious and can be transmitted through respiratory droplets or the air. Initial symptoms include cough, fever, body aches, and difficulty breathing, which can progress to severe respiratory problems and even death. One effective way to control the spread of COVID-19 is to identify and isolate infected individuals. The reverse transcription polymerase chain reaction (RT-PCR) test is the gold standard for detecting SARS-CoV-2; it can take several days to receive results and has a high rate of false negatives.
An alternative method for detecting COVID-19 is computed tomography (CT) analysis, which is more accurate than RT-PCR and has a lower rate of false negatives [
2,
3]. Although CT scans involve exposure to radiation, which can have potential side effects such as allergic reactions to contrast material, dizziness or nausea, and a risk of cancer, the risks for these side effects to occur are generally very low. For example, the estimated risk of acquiring cancer from a single CT scan of the chest (including the lungs) is roughly 1% for a 20 years old and only 0.001% for a 50 years old patient. With careful procedures, the potential risks associated with radiation exposure from CT scans can be further reduced, such as by using the lowest possible radiation dose, limiting the number of CT scans, and using shielding to protect unnecessary body parts from radiation exposure during the scan. However, it is worth noting that the feasibility and utility of COVID-19 screening through CT images may vary depending on the specific context and resources available in a given country or region. In countries where resources and infrastructure are more abundant, CT-based COVID-19 screening could be a valuable tool for detecting the virus, particularly in situations where RT-PCR tests are not accessible, such as in remote regions or during crisis that causes a shortage in reagents. Despite advancements in medical technology, the manual diagnosis of COVID-19 infection on CT images remains a significant challenge. The characteristics of the infection, particularly in its early stages, may be subtle and difficult to detect, thereby impeding the ability of radiologists to accurately diagnose COVID-19. This is particularly problematic in cases where the infection is not yet severe or the symptoms are inconspicuous.
On the other hand, deep learning (DL) models can analyze large amounts of data and identify patterns and features indicative of COVID-19 or other medical conditions. The successful application of DL in many computer vision tasks [
4,
5,
6,
7] has encouraged researchers to explore AI-based solutions for the automated detection of COVID-19 using medical images. Specifically, convolutional neural networks (CNNs) have become the most popular method in the COVID-19 detection domain [
8,
9]. This can allow the models to detect the characteristics of COVID-19 infection on CT images that may be difficult for human experts to identify. However, a DL model is highly dependent on the quality and quantity of the training data, as the model requires a large and diverse set of examples to learn from in order to generalize well to new data. Unfortunately, due to the confidentiality of patients’ data and the virus’s novelty, publicly available CT datasets on COVID-19 are restricted in size. Furthermore, collecting and sharing medical imaging data requires obtaining patients’ consent and protecting the privacy of patients and their health information, which makes these data difficult to obtain. Additionally, the lack of standardization protocol for image acquisition and annotation leads to variations in image appearance, making it challenging for researchers to obtain a larger CT dataset for COVID-19 from different sources.
As a result, many recent studies on CT-based COVID-19 diagnosis have preferred transfer learning. One of the main issues with transfer learning for CT-based COVID-19 diagnosis is that CT images are typically grayscale, while most available pre-trained models were trained on RGB images. RGB images contain three channels (red, green, and blue), while grayscale images contain only one channel. This difference in the number of channels can make it more difficult to apply pre-trained models to grayscale CT images. This necessitates additional pre-processing on the grayscale CT images in order to replicate the nature of the RGB images.
Some studies have utilized a method called pseudo-colorization to convert grayscale medical images into color images by assigning different colors to different intensities of the grayscale image. For instance, Albiol et al. [
10] added a convolutional layer with three channels at the beginning of the pre-trained models (i.e., ResNet50, InceptionV3, DenseNet121, and InceptionResNetV2) that serve as a pseudo-color conversion to fit the input CXR images into the pre-trained input layer. Liang et al. [
11] proposed a multi-modal DL framework for the diagnosis of COVID-19, which incorporates a pseudo-colorization tool to convert grayscale medical images into three-channel color images. While pseudo-colorization can be useful for visualizing features of medical images, it should be noted that it does not provide any additional information to the image and may result in unrealistic representations. Besides that, the process of pseudo-colorization is subjective, depending on the persons who perform it, and different settings can lead to different results, which may affect the interpretability of the images.
On the other hand, colorization is a method that uses DL algorithms to predict the color of a grayscale image based on its content, which offers a more realistic representation of the medical images. In [
12], the authors used the DeOldify method to colorize the grayscale CT images before feeding them into the pre-trained DenseNet121 model. DeOldify [
13] is a freely distributed network architecture using the MIT License. It is based on a pre-trained U-Net that colorizes the image according to the picture it had seen before. However, the colorization process has a very high computational requirement and fully depends on the amount and quality of training data.
Thus, most studies on the COVID-19 diagnosis preferred to use the replication method to fit the one-channel grayscale image to the architecture of the pre-trained model. For example, Ahmed et al. [
14] used a three-channel CXR image by copying the grayscale channel as input to their proposed ReCoNet (residual image-based COVID-19 detection network) for COVID-19 detection. After a simple pre-processing (rescaling and pixel normalization), Ko et al. [
15] also arranged three channels by copying the one-channel normalized image before being fed into the pre-trained model layers for features extraction. Similarly, the works by Bai et al. [
16] and Bougourzi et al. [
17] stacked the grayscale CT slice to three channels as the input of the DL models to use the pre-trained weights on ImageNet for the binary classification task (COVID-19 and Non-COVID-19). Although the replication technique offers a simple and fast solution by replicating the grayscale image three times to create an RGB image, it does not add any additional information to the image. It can lead to poor performance due to the redundant features learned by the DL models in every channel. Hence, this paper introduced a new image representation through enhancements of the three-channel grayscale image to improve the DL models’ performance in COVID-19 detection. This study also aims to contribute to the following objectives:
Propose a novel three-channel grayscale image representation to improve the recognition ability of the DL models;
Present a comparative study of several DL architectures to select a suitable model to perform binary classification on the SARS-CoV-2 dataset, specifically divided into COVID-19 and Non-COVID-19 cases;
Provide an extensive experimental analysis of the performance of the pre-trained DL models across various image representations (i.e., RGB, GRAY3, GRAY3_HE, GRAY3_CLAHE, and GRAY+GRAY_HE+GRAY_CLAHE).
Following the introduction section, this article is divided into five other sections.
Section 2 presents the related works in the research area, while the proposed methodology, including the dataset used, pre-processing steps, models’ architecture, and experimental setups, are explained in
Section 3. Then,
Section 4 presents and discusses the results obtained. Finally, this study’s conclusion and potential future works will be presented in
Section 5 and
Section 6, respectively.
2. Related Works
The diagnosis of COVID-19 using medical imaging, particularly chest CT scans, has been a crucial area of research in the fight against the pandemic. Deep learning (DL) has recently been widely adopted as a powerful tool for classifying COVID-19 using medical images. This section reviews the recent literature on DL-based COVID-19 classification using CT images. Wang et al. [
18] introduced a novel joint learning framework by redesigning their previously proposed COVID-Net [
19] from architecture and learning strategy as a strong backbone. The submitted work by El-bana et al. [
20] aims to fine-tune InceptionV3 with multi-modal learning for COVID-19 detection from CT scans and X-ray images. Alhicri [
21] presented a DL approach for classifying chest CT scans based on a CNN model and ensemble techniques that depend on lightweight transfer learning with the EfficientNet-B3 model. Kundu et al. [
22] applied an ensemble strategy to generate fuzzy ranks of the base classification models using the Gompertz function and then fuse the decision scores of the base models adaptively to make the final predictions on the CT-scan images (i.e., COVID-19 or Non-COVID-19). The authors used three transfer learning-based CNN models, namely VGG-11, Wide ResNet-50-2, and Inception v3, as the base models [
22]. Moung et al. [
23] proposed a fusion between moment invariants (MI) and several CNN architectures. Among the six models generated, the VGG16+MI showed the best performance, with a 93% accuracy and a 96% sensitivity rate [
23].
Arora et al. [
24] detected COVID-19 from CT-scan images using MobileNet architecture and a residual dense neural network. When the results were compared to other pre-trained architectures, MobileNet performed better. Ezzat et al. [
25] used a gravitational search algorithm (GSA) to find the optimal DenseNet121 hyperparameters. The proposed model was compared to the results of DenseNet121 and InceptionV3 with hand-tuned hyperparameters, and the GSA outperformed the two methods [
25]. The authors additionally utilized gradient-weighted class activation mapping (Grad-CAM) to aid in explainability [
25]. Turkoglu [
26] proposed multiple kernels of extreme machine learning (ELM)-based DenseNet201 to classify the COVID-19 CT images by generating the final class prediction of the CT image using majority voting on the ELM [
26]. The transfer learning strategy was adopted because the existing COVID-19 datasets were insufficient to train the CNN models effectively.
Gifani et al. [
27] proposed an ensemble method that uses majority voting of the prediction made by several pre-trained models. They trained and evaluated the ensemble model on the CT dataset, which consisted of 349 positive and 397 negative cases, and achieved an accuracy of 85%. Jangam et al. [
28] utilized a stacked ensemble of VGG16 and DenseNet169 models to detect COVID-19 from an individual’s CT or chest x-ray images. Evaluations on the SARS-CoV-2 showed that the proposed VGG16+DenseNet169 obtained the best 91.5% accuracy and 95.5% sensitivity. Oluwasanmi et al. [
29] presented transfer learning and the adversarial network on CT scans to annotate COVID-19 and Pneumonia images. Ismael and Şengür [
30] employed different DL approaches to classify COVID-19: a deep extraction function and a fine-tuning pre-trained convolution network.
Wu et al. [
31] recently demonstrated that merging parallelly derived characteristics from CT images by simultaneous application of ViT and CNN can assist in effectively categorizing COVID-19 patients. The authors reported a 96% recall performance utilizing 194,922 images from 3745 patients, indicating the strength of combinational approaches [
31]. Gao et al. [
32] developed an explainable ViT model for diagnosing COVID-19 from 3D chest CT. The initial evaluation of the COVID-19-CT-DB dataset indicated that their proposed ViT model performs better than the DenseNet model, with an F1-score of 76% and 73.7%, respectively. Krishnan and Krishnan [
33] fine-tuned the pre-trained ViT-B32 model on an upsampled COVID-19 X-ray dataset consisting of 6880 and 6980 images for COVID-19 and Non-COVID-19 classes, respectively. This approach achieves an accuracy score of 97.61% and a recall score of 93.84% [
33]. Mehboob et al. [
34] developed a self-attention transformer-based approach with having self-attention mechanism using CT slices. The results indicated that the proposed method effectively detected COVID-19 with a 98% accuracy in the binary classification of the SARS-CoV-2 dataset. The work by [
35] adopted a ViT as the backbone of their proposed COVID-19 detection framework. The authors utilized a Siamese encoder inside their ViT architecture. At the beginning of the framework, the input images were divided into patches with equal size (i.e., 8 × 8 pixel size) and fed through the encoder [
35].
Overall, these studies demonstrate the effectiveness of DL-based approaches, particularly transfer learning, for classifying COVID-19 using CT images. Two competing DL approaches exist in the domain: convolutional neural networks (CNNs) and vision transformers (ViTs). CNNs have been a well-established technique in computer vision tasks for many years and have been proven to be effective in various applications. However, ViTs have recently gained attention due to their advantages in tackling the limitations of CNNs. Although ViTs have shown promising results in various applications, the competition between these two approaches is ongoing, and it is still unclear whether ViTs can fully replace CNNs. In light of this, our study compares CNNs and ViTs to provide a comprehensive evaluation of their performance in the classification of COVID-19 using CT images.
3. Materials and Methods
3.1. Dataset
The SARS-CoV-2 CT-Scan dataset was used for experimental purposes in this study. Soares et al. [
36] produced this dataset by collecting data from a hospital in Sao Paulo, Brazil, and their institutional ethical council authorized it. The authors have made the dataset public, which can be retrieved through the Kaggle website. There are a total of 2481 CT scans in the SARS-CoV-2 dataset, evenly split between 1229 Non-COVID-19 and 1252 COVID-19 scans. To avoid having a model learn only one class notion rather than two independent concepts during training, make sure the dataset is evenly split between the two classes [
37]. This collection contains digital scans of printed CT images with sizes ranging from 104,153 to 484,416 pixels.
The proposed is fitted to the training dataset by adjusting the weight tensor of the DL model to minimize the loss function. This study used a validation dataset to evaluate the model’s performance frequently. This dataset, distinct from the training dataset, was used to estimate the model’s ability to generalize to unseen data. Importantly, the validation dataset is not utilized to fit the model but to assess its performance and monitor the training process.
Finally, a testing dataset is a subset of data used to evaluate the trained model’s performance on unseen data. The amount of training delivered and the availability of testing data are the two most critical factors in machine learning success [
38]. I t was proven that if training data is less than 50%, test results will fail to produce a strong classifier [
39]. As a result, the training data is enhanced to ensure a correct diagnosis. The chosen dataset was randomly divided into training, validation, and testing sets, with an approximate ratio of 70%, 20%, and 10%, respectively.
To ensure the reproducibility of this work, a Python function called ‘
random.seed(0)’ was utilized during the generation of the training, validation, and testing dataset. Although the samples inside this data set were randomly selected, future researchers could still replicate the current work using the same seed value during data generation. The training dataset consists of 1736 images, 860 of which are Non-COVID-19 CT images and 876 of which are COVID-19 CT images. On the other hand, the validation dataset has 246 and 250 CT pictures of Non-COVID-19, and COVID-19 images, respectively. There were 249 CT scans in the testing dataset with equal COVID-19 positive and negative cases.
Table 1 summarizes the partitioning of the given dataset.
3.2. Data Pre-Processing
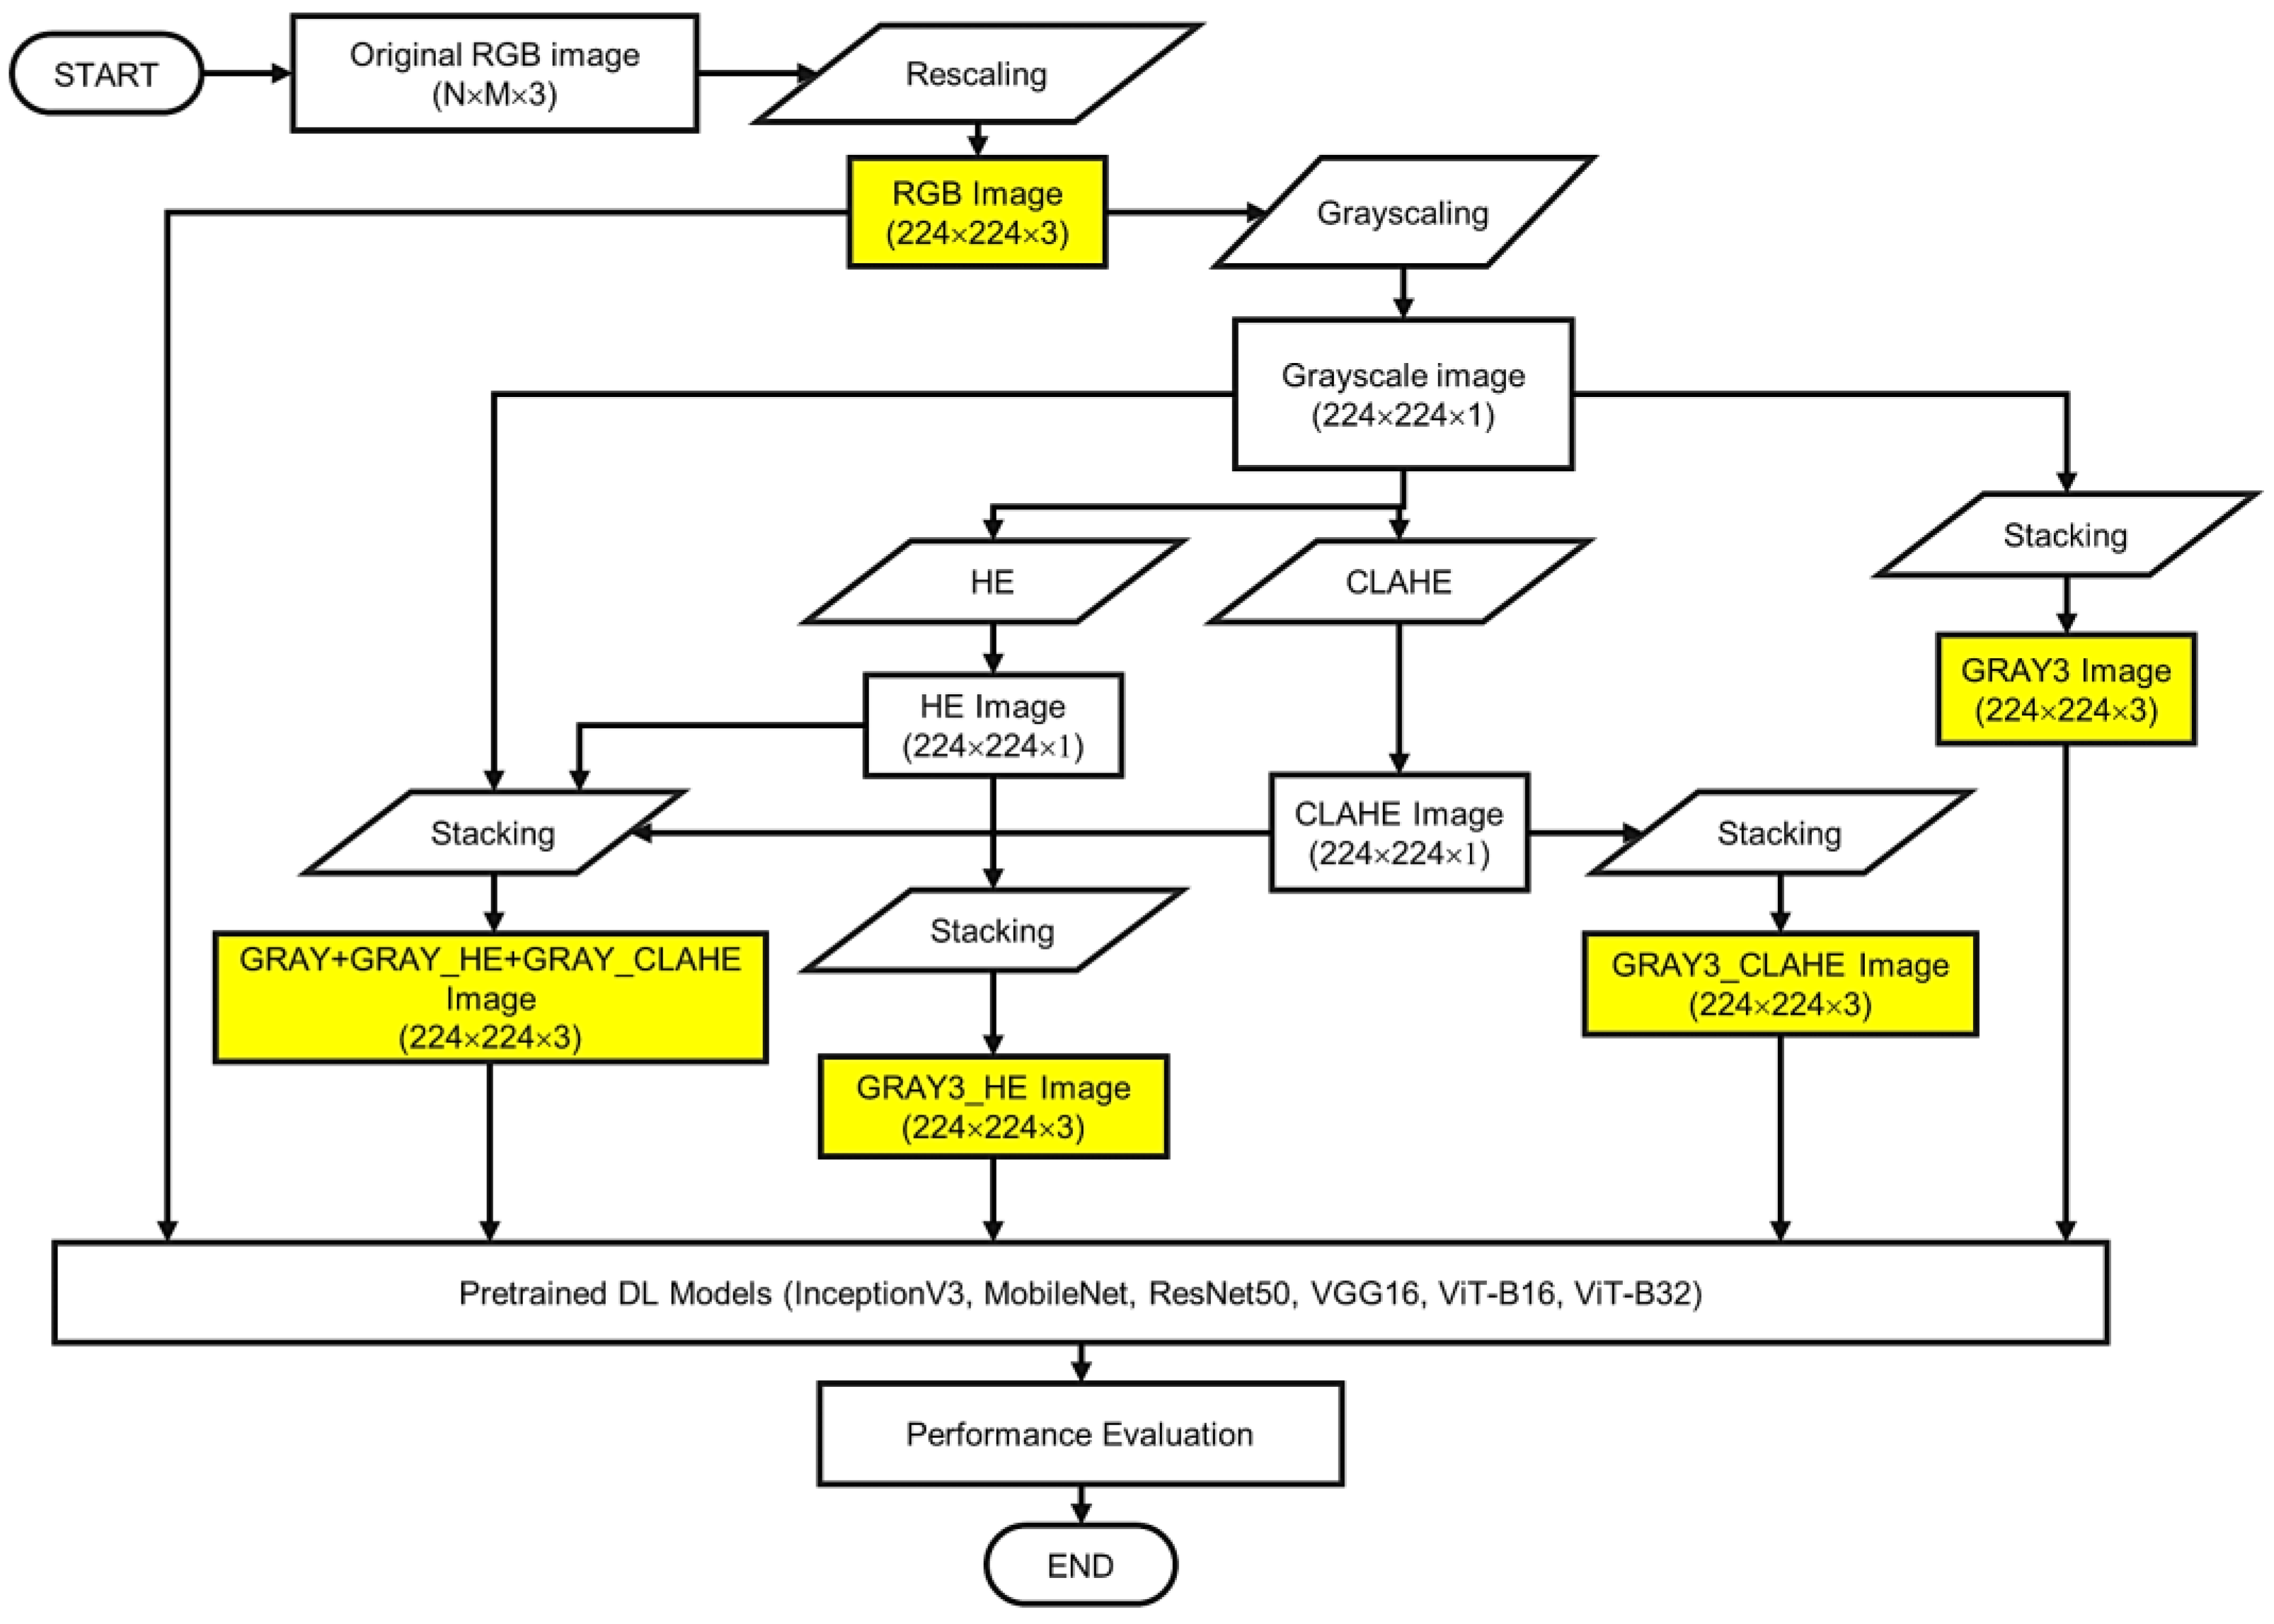
Figure 1 presents the flowchart of the proposed methodology with details on the data pre-processing steps. As shown in the figure, this study investigates the effectiveness of five different image representations (i.e., RGB, GRAY3, GRAY3_HE, GRAY3_CLAHE, and GRAY+GRAY_HE+GRAY_CLAHE). The data pre-processing steps begin with rescaling the width and height of the CT image to 224. Because the dataset used in this study was supplied in RGB color space, this representation was used in the comparison analysis.
As shown in
Figure 1, to facilitate the analysis of GRAY3 images, the rescaled RGB CT images were first converted into one-channel grayscale images. Three copies of the 224 × 224 × 1 grayscale image are then used to create the three-channel grayscale (GRAY3) image by stacking the three images together. The initial steps in the creation of GRAY3_HE and GRAY3_CLAHE images are similar to those employed in the formation of the GRAY3 image, up to the grayscaling step. To construct a three-GRAY3_HE image, the steps followed by applying histogram equalization (HE) on the grayscale image. Currently, the Tensorflow Addons package includes a global HE function called ‘
tfa.image.equalize ()’. In this study, we apply this function to the one-channel grayscale image to form a three-channel equalized (i.e., GRAY3_HE) image. Similar to the GRAY3 image, the GRAY3_HE image is constructed by stacking three equalized grayscale images on top of each other.
For the GRAY3_CLAHE image, another enhancement method called Contrast Limited Adaptive Histogram Equalization (CLAHE) is used. This technique is applied directly to the one-channel grayscale image using the Tensorflow function called ‘
tfa.clahe()’. Then, another three-channel image is formed using the output of this step. Specifically, we copy the one-channel image (the grayscale image enhanced using CLAHE) to create a three-channel CLAHE image. Last but not least, another image representation called GRAY+GRAY_HE+GRAY_CLAHE was also proposed in this study. The formation of this image representation starts by creating three one-channel grayscale images in parallel. Then, we applied HE to one of the grayscaled images and CLAHE to another image. The last grayscale image remained unenhanced. After that, these three images are stacked together to form a three-channel image consisting of a grayscale image, an equalized image, and a CLAHE image.
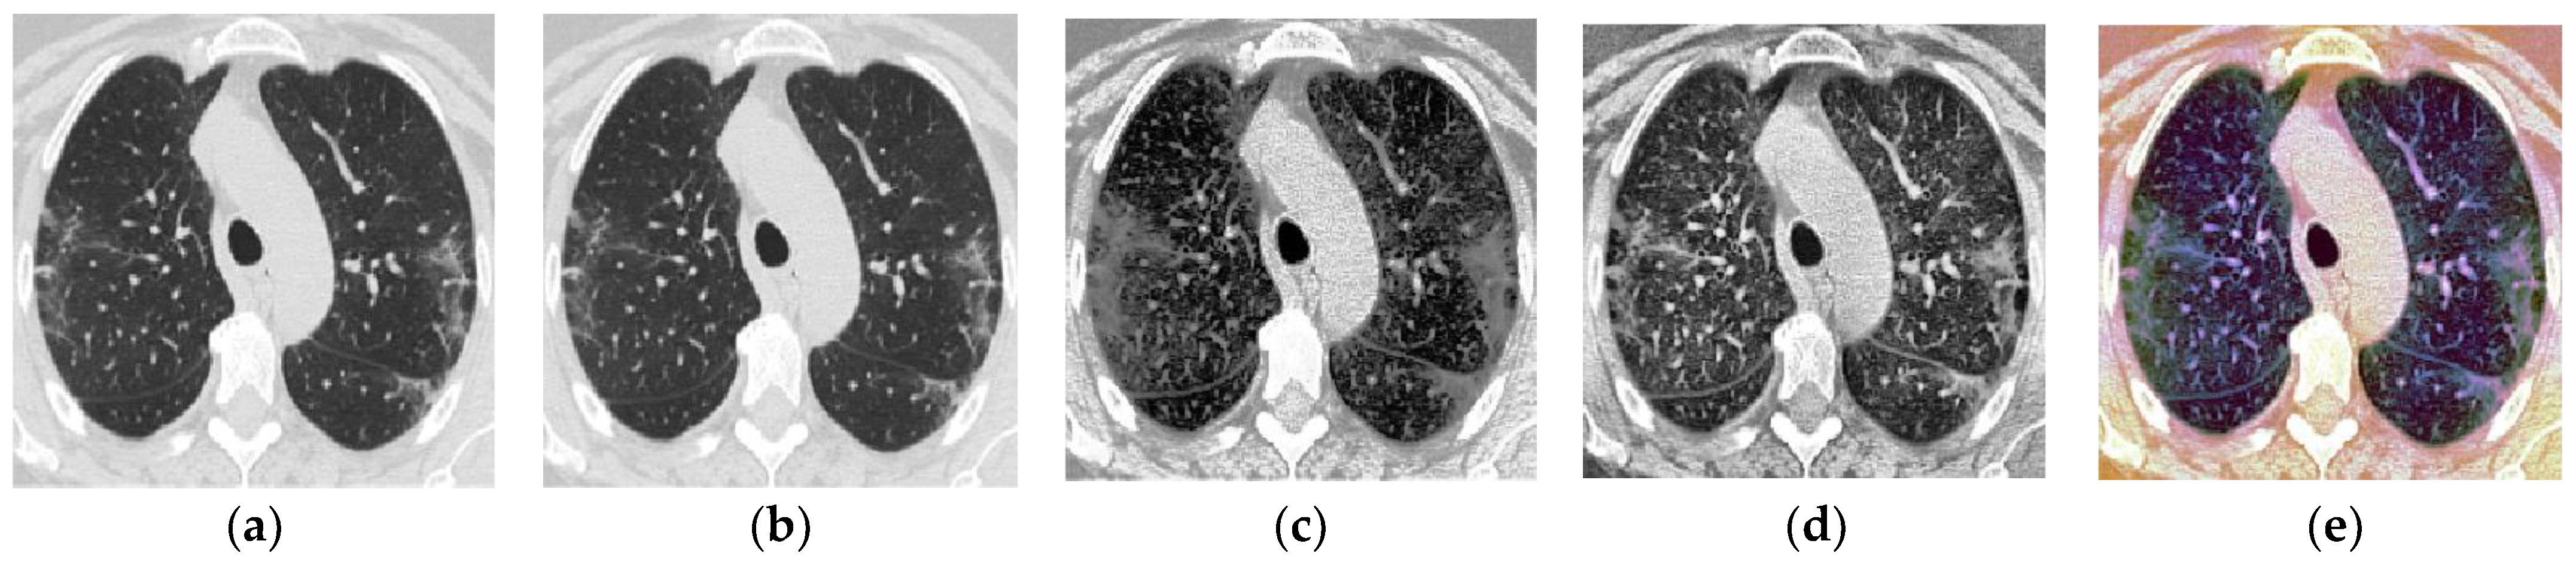
Table 2 is prepared to facilitate the presentation of findings throughout this paper, briefly describing the five image representations. A sample CT image for each representation is also presented in
Figure 2.
Figure 2a shows a sample of one original CT image that belongs to the COVID-19 class after rescaling.
As shown in
Figure 2, although it appears as a grey image, it has RGB color space (three-channel image) without any bias toward red, green, or blue hue. In other words, all the original CT images in the SARS-CoV-2 dataset are technically RGB images, but they still appear grey as the three RGB channels are identical.
The proposed three-channel grayscale image representation is designed to replicate the three-channel RGB images that are typically fed into pre-trained models, with the goal of ensuring that the DL models (CNNs or Vision Transformers) are able to learn different features from each channel. By applying HE and CLAHE to one of the grayscale images in the proposed representation, the visibility and clarity of the image features are improved, making it easier for the DL model to identify and classify relevant features. In addition, HE redistributes the intensity values of pixels to improve global contrast. At the same time, CLAHE only enhances local contrast in regions with high variation while preserving subtle details and reducing noise amplification, allowing the preservation of subtle details, resulting in images with higher contrast and more visible features. By applying these enhancement techniques, the proposed three-channel grayscale image representation aims to improve the performance of the DL model in identifying and classifying relevant features in the images, ultimately leading to more accurate image analysis and diagnosis.
3.3. Pre-Trained Models
One of the primary goals of this study was to achieve cutting-edge classification results using publicly available data and “out-of-the-box” models with transfer learning to compensate for the sample data’s limited size. Therefore, six deep learning models are selected as classifiers in the experimental analysis, which includes CNN-based and ViT-based architectures. Conveniently, all of these models are provided as part of the Keras API, and each enables transfer learning [
40] by allowing the pre-application of ImageNet [
41] weights to the model. This section describes in detail the proposed architecture of the six DL models utilized in the comparative study (i.e., InceptionV3, MobileNet, ResNet50, ViT-B16, and ViT-B32).
3.3.1. InceptionV3
The InceptionV3 [
42] sought to increase the utilization of computing resources within the network by expanding network depth and width while maintaining constant computation operation. The term “inception modules” was coined by the network’s designers to describe an efficient network topology with skipped connections that are utilized as a construction block [
42]. To reduce dimensionality to a workable level for computation, this inception module was repeated spatially by stacking with occasional max-pooling layers [
42]. In this study, the InceptionV3 model is loaded from the Keras libraries using the command “
from tensorflow.keras.applications.inception_v3 import InceptionV3” and the original classification head is removed by setting the “
include_to” argument to
False. Then, a 2 × 2 average pooling layer is added after the last Inception module in the architecture. Following the average pooling layer, there are a flattened layer and two dense layers (which have 2048 and 2 neurons, respectively). The last dense layer, referred to as the output layer, has a Softmax activation function, whereas the other dense layer has a ReLU activation function.
Figure 3 depicts the architecture of the proposed InceptionV3 model.
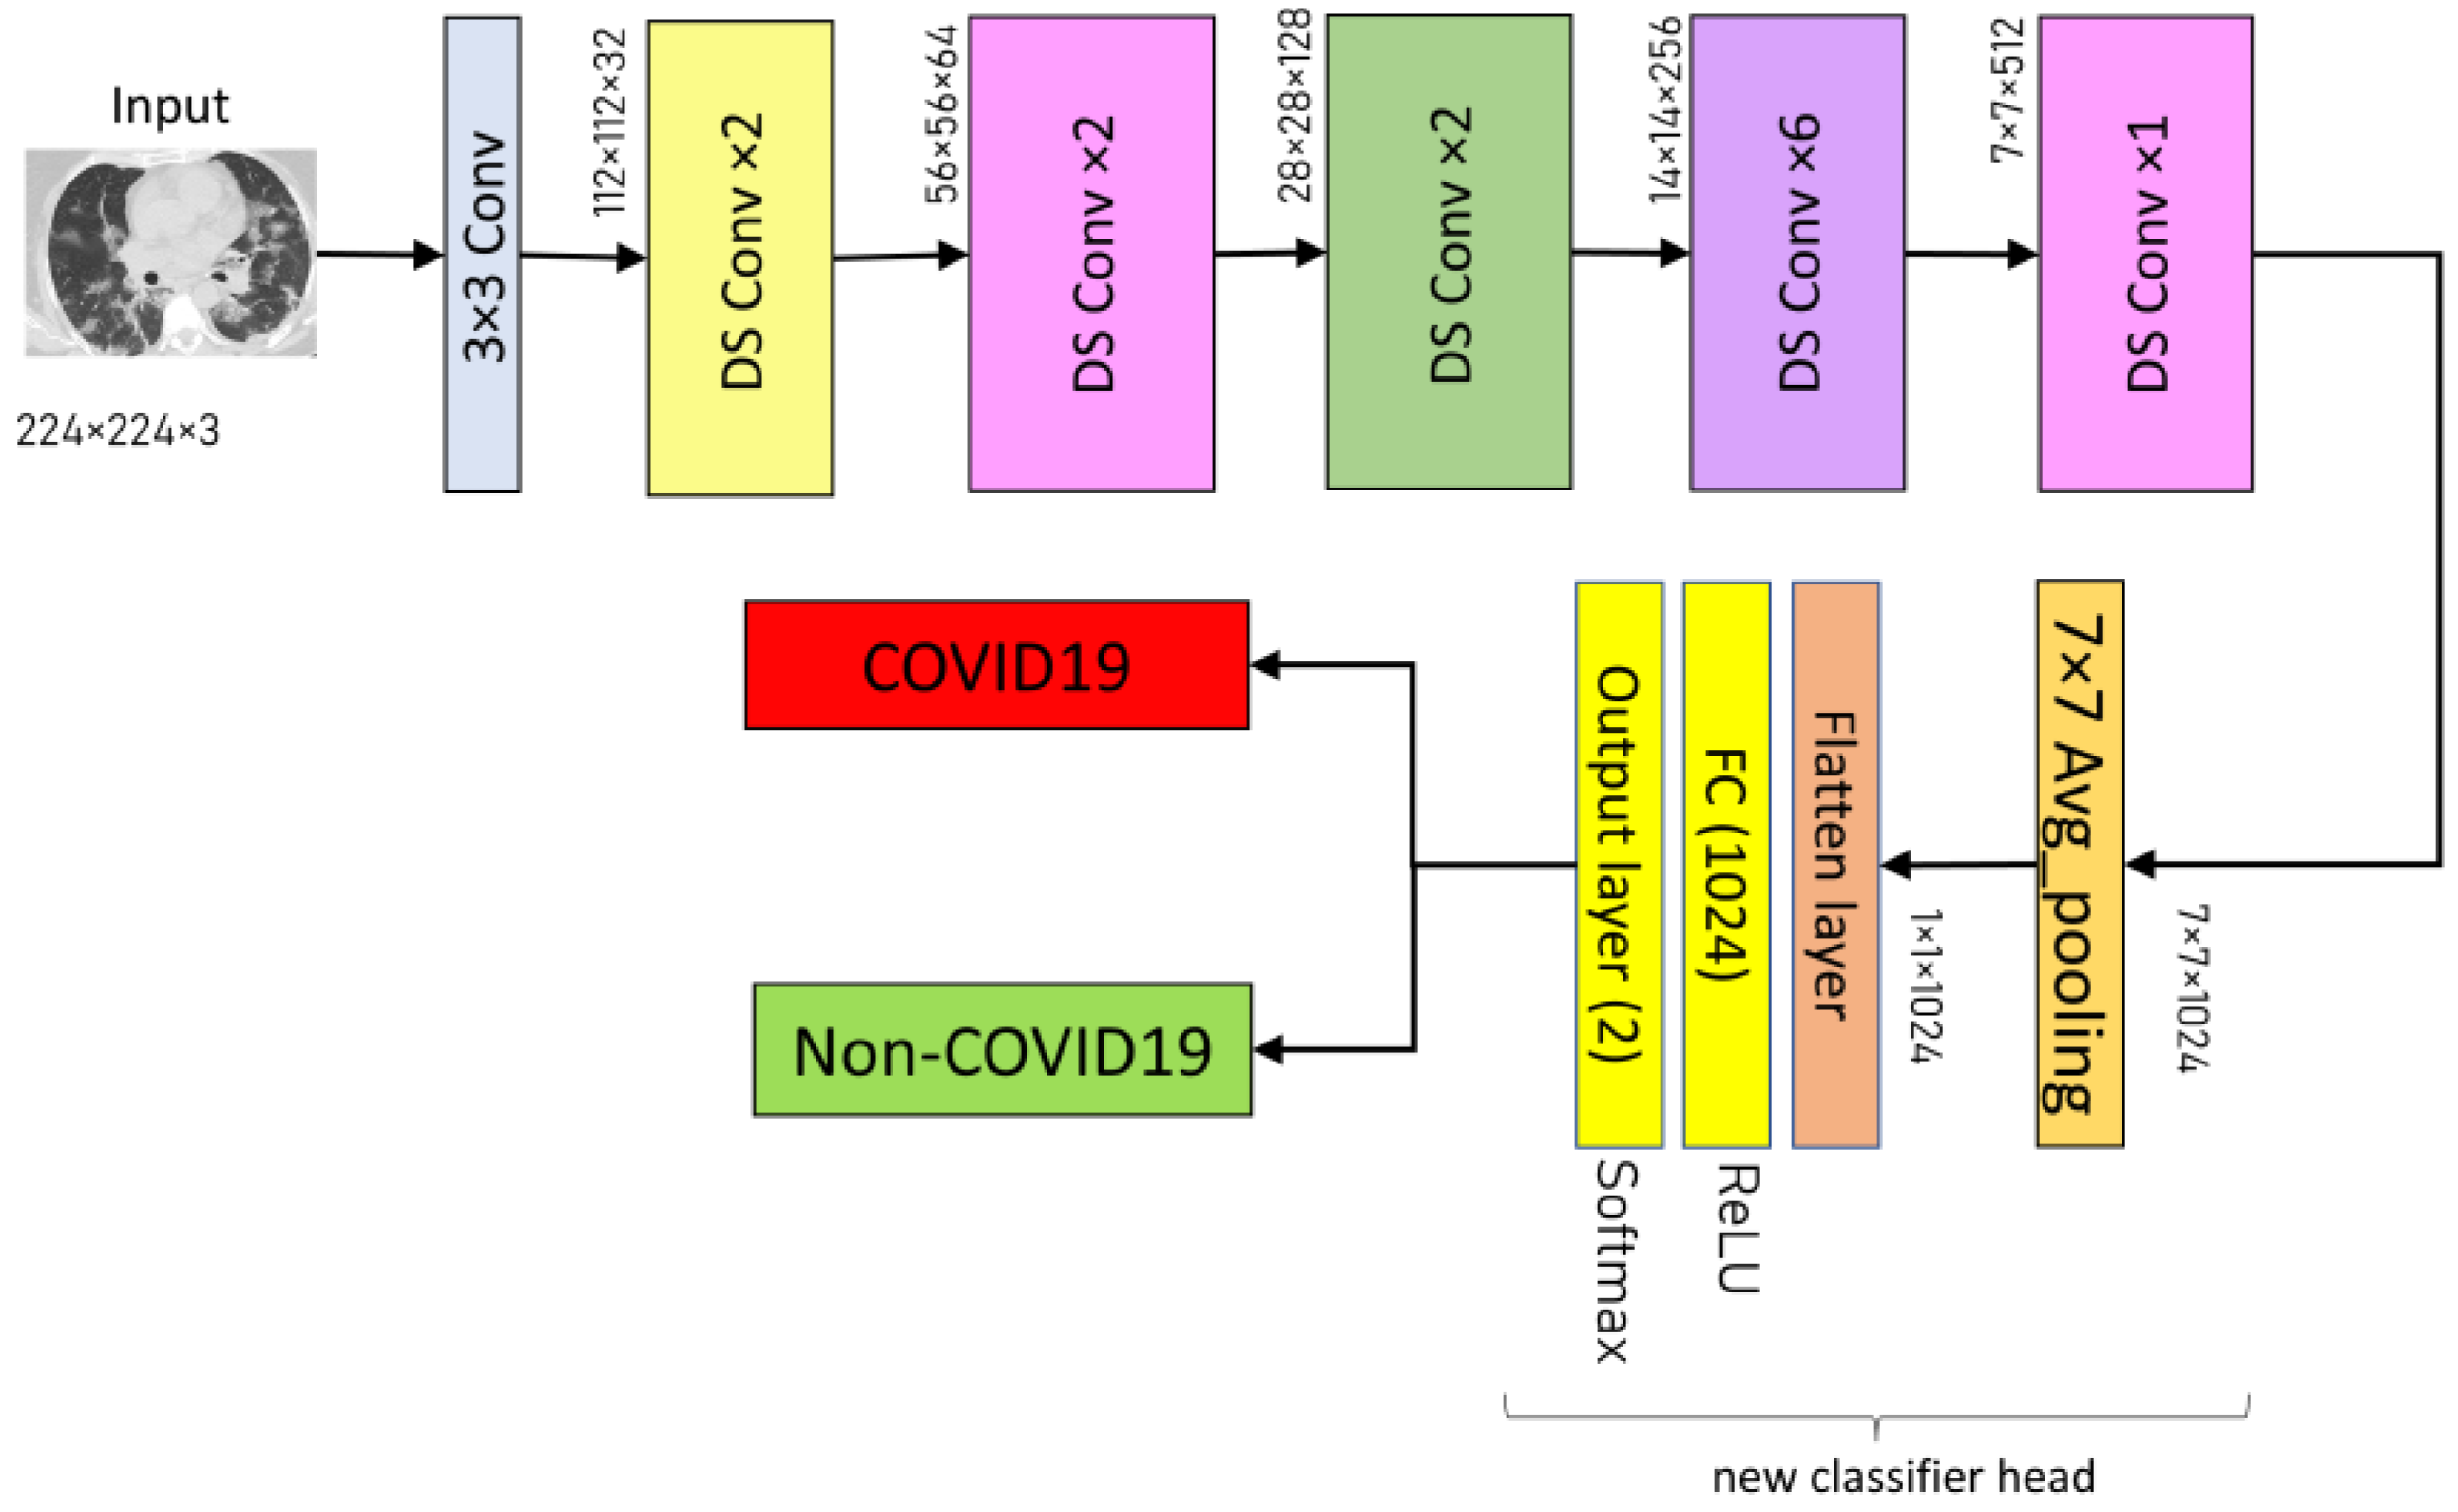
3.3.2. MobileNet
MobileNet is a CNN architecture based on depth-wise separable convolution, which decreased the processing and model size while maintaining classification performance comparable to large-scale models such as Inception. Each depth-wise separable convolution layer in the MobileNet structure consists of a depthwise convolution and a point-wise convolution. The MobileNet model has 28 layers, counting the depth-wise and point-wise convolution as separate layers. In this study, the pre-trained MobileNet model is loaded by executing the command
from tensorflow.keras.applications.mobilenet import mobilenet with the
include_top argument set to
False. For classification, several layers are added at the top of the network consisting 7 × 7 average pooling layer, a flattened layer, and two dense layers (with 1024 and two neurons, respectively). The former dense layer has a ReLU activation function, while the latter dense layer (i.e., output layer) has a Softmax activation function.
Figure 4 summarizes the architecture of the proposed MobileNet model.
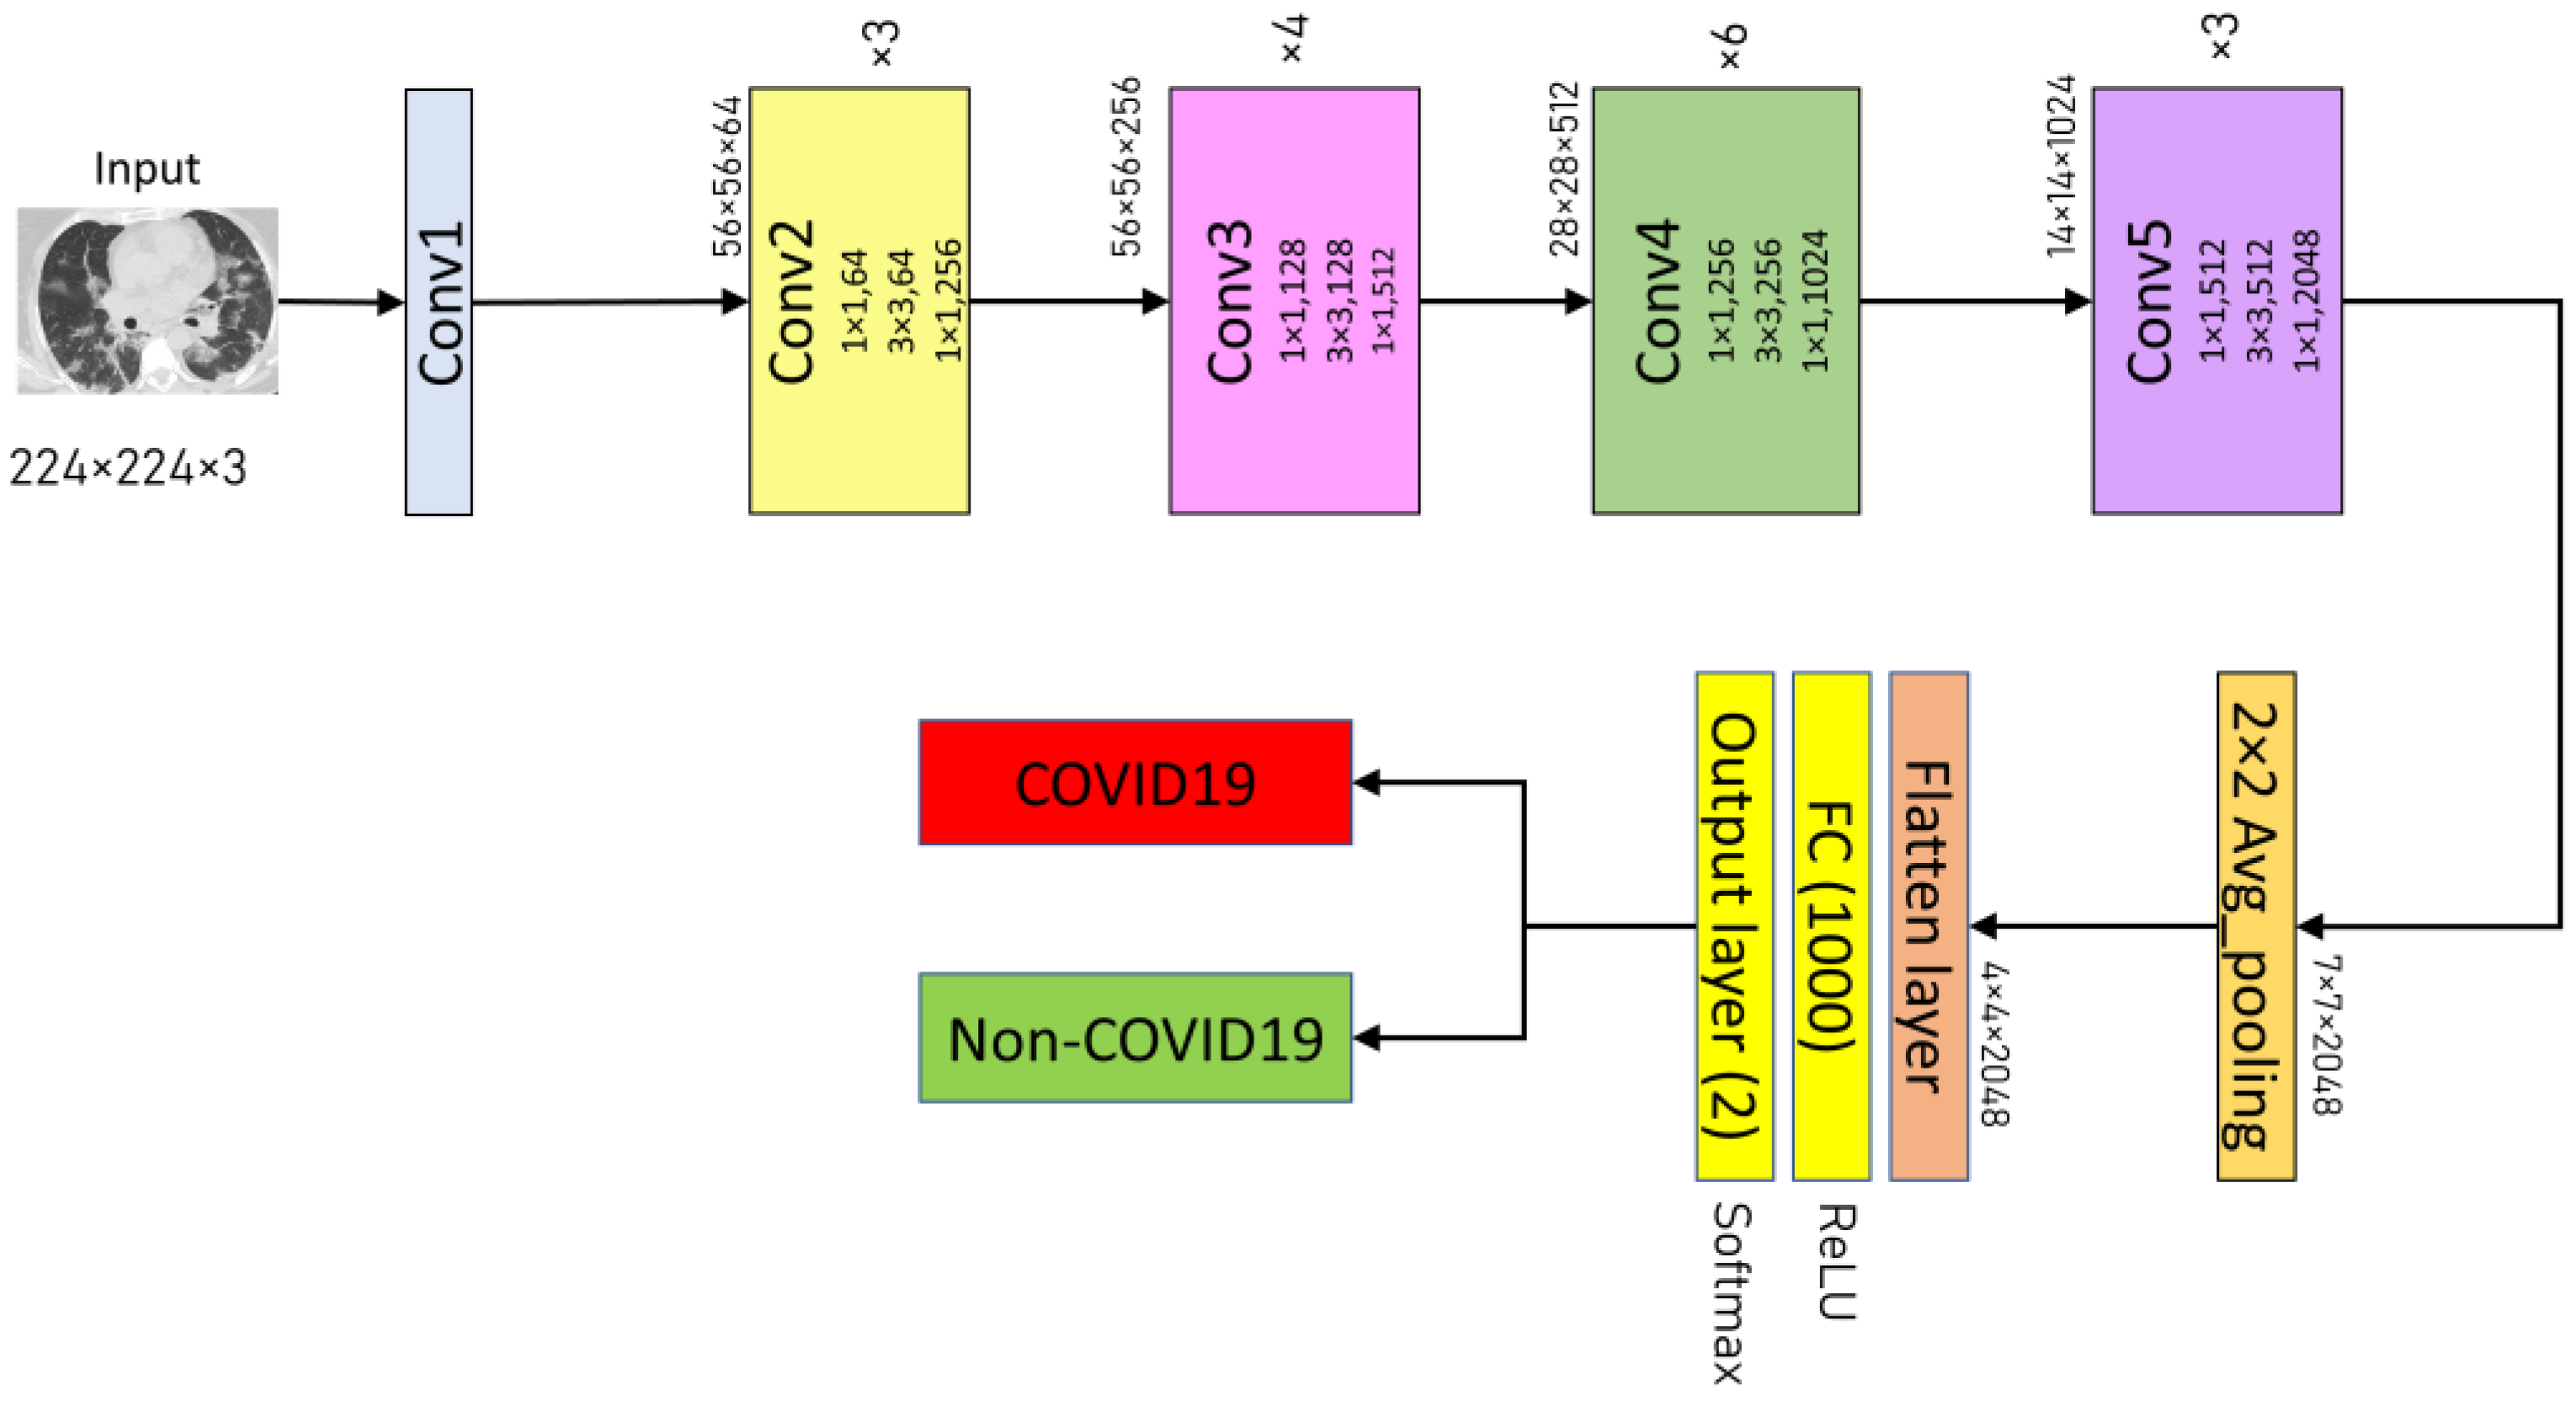
3.3.3. ResNet50
The ResNet50 was created to circumvent the inherent vanishing gradient problem in deep neural networks by integrating a system of skip connections between layers—a technique known as residual learning [
43]. This architecture produces a more efficient network to train, enabling the building of deeper networks that improve model accuracy. ResNet50 is a network with 50 layers that uses residual learning [
43]. First, the ResNet50 model is imported from the Keras framework in this study by running the command “
from tensorflow.keras.applications.resnet50 import ResNet50” with the
include_top argument set to
False. Consequently, an average pooling layer is inserted after the fifth convolutional block of the ResNet50 design. The proposed ResNet50 model’s classifier comprises a flattened layer, a fully-connected layer (with 1000 neurons and a ReLU activation function), and a two-neurons dense layer as the output layer (with Softmax activation function).
Figure 5 illustrates the proposed ResNet50 architectures used in the experimental analysis.
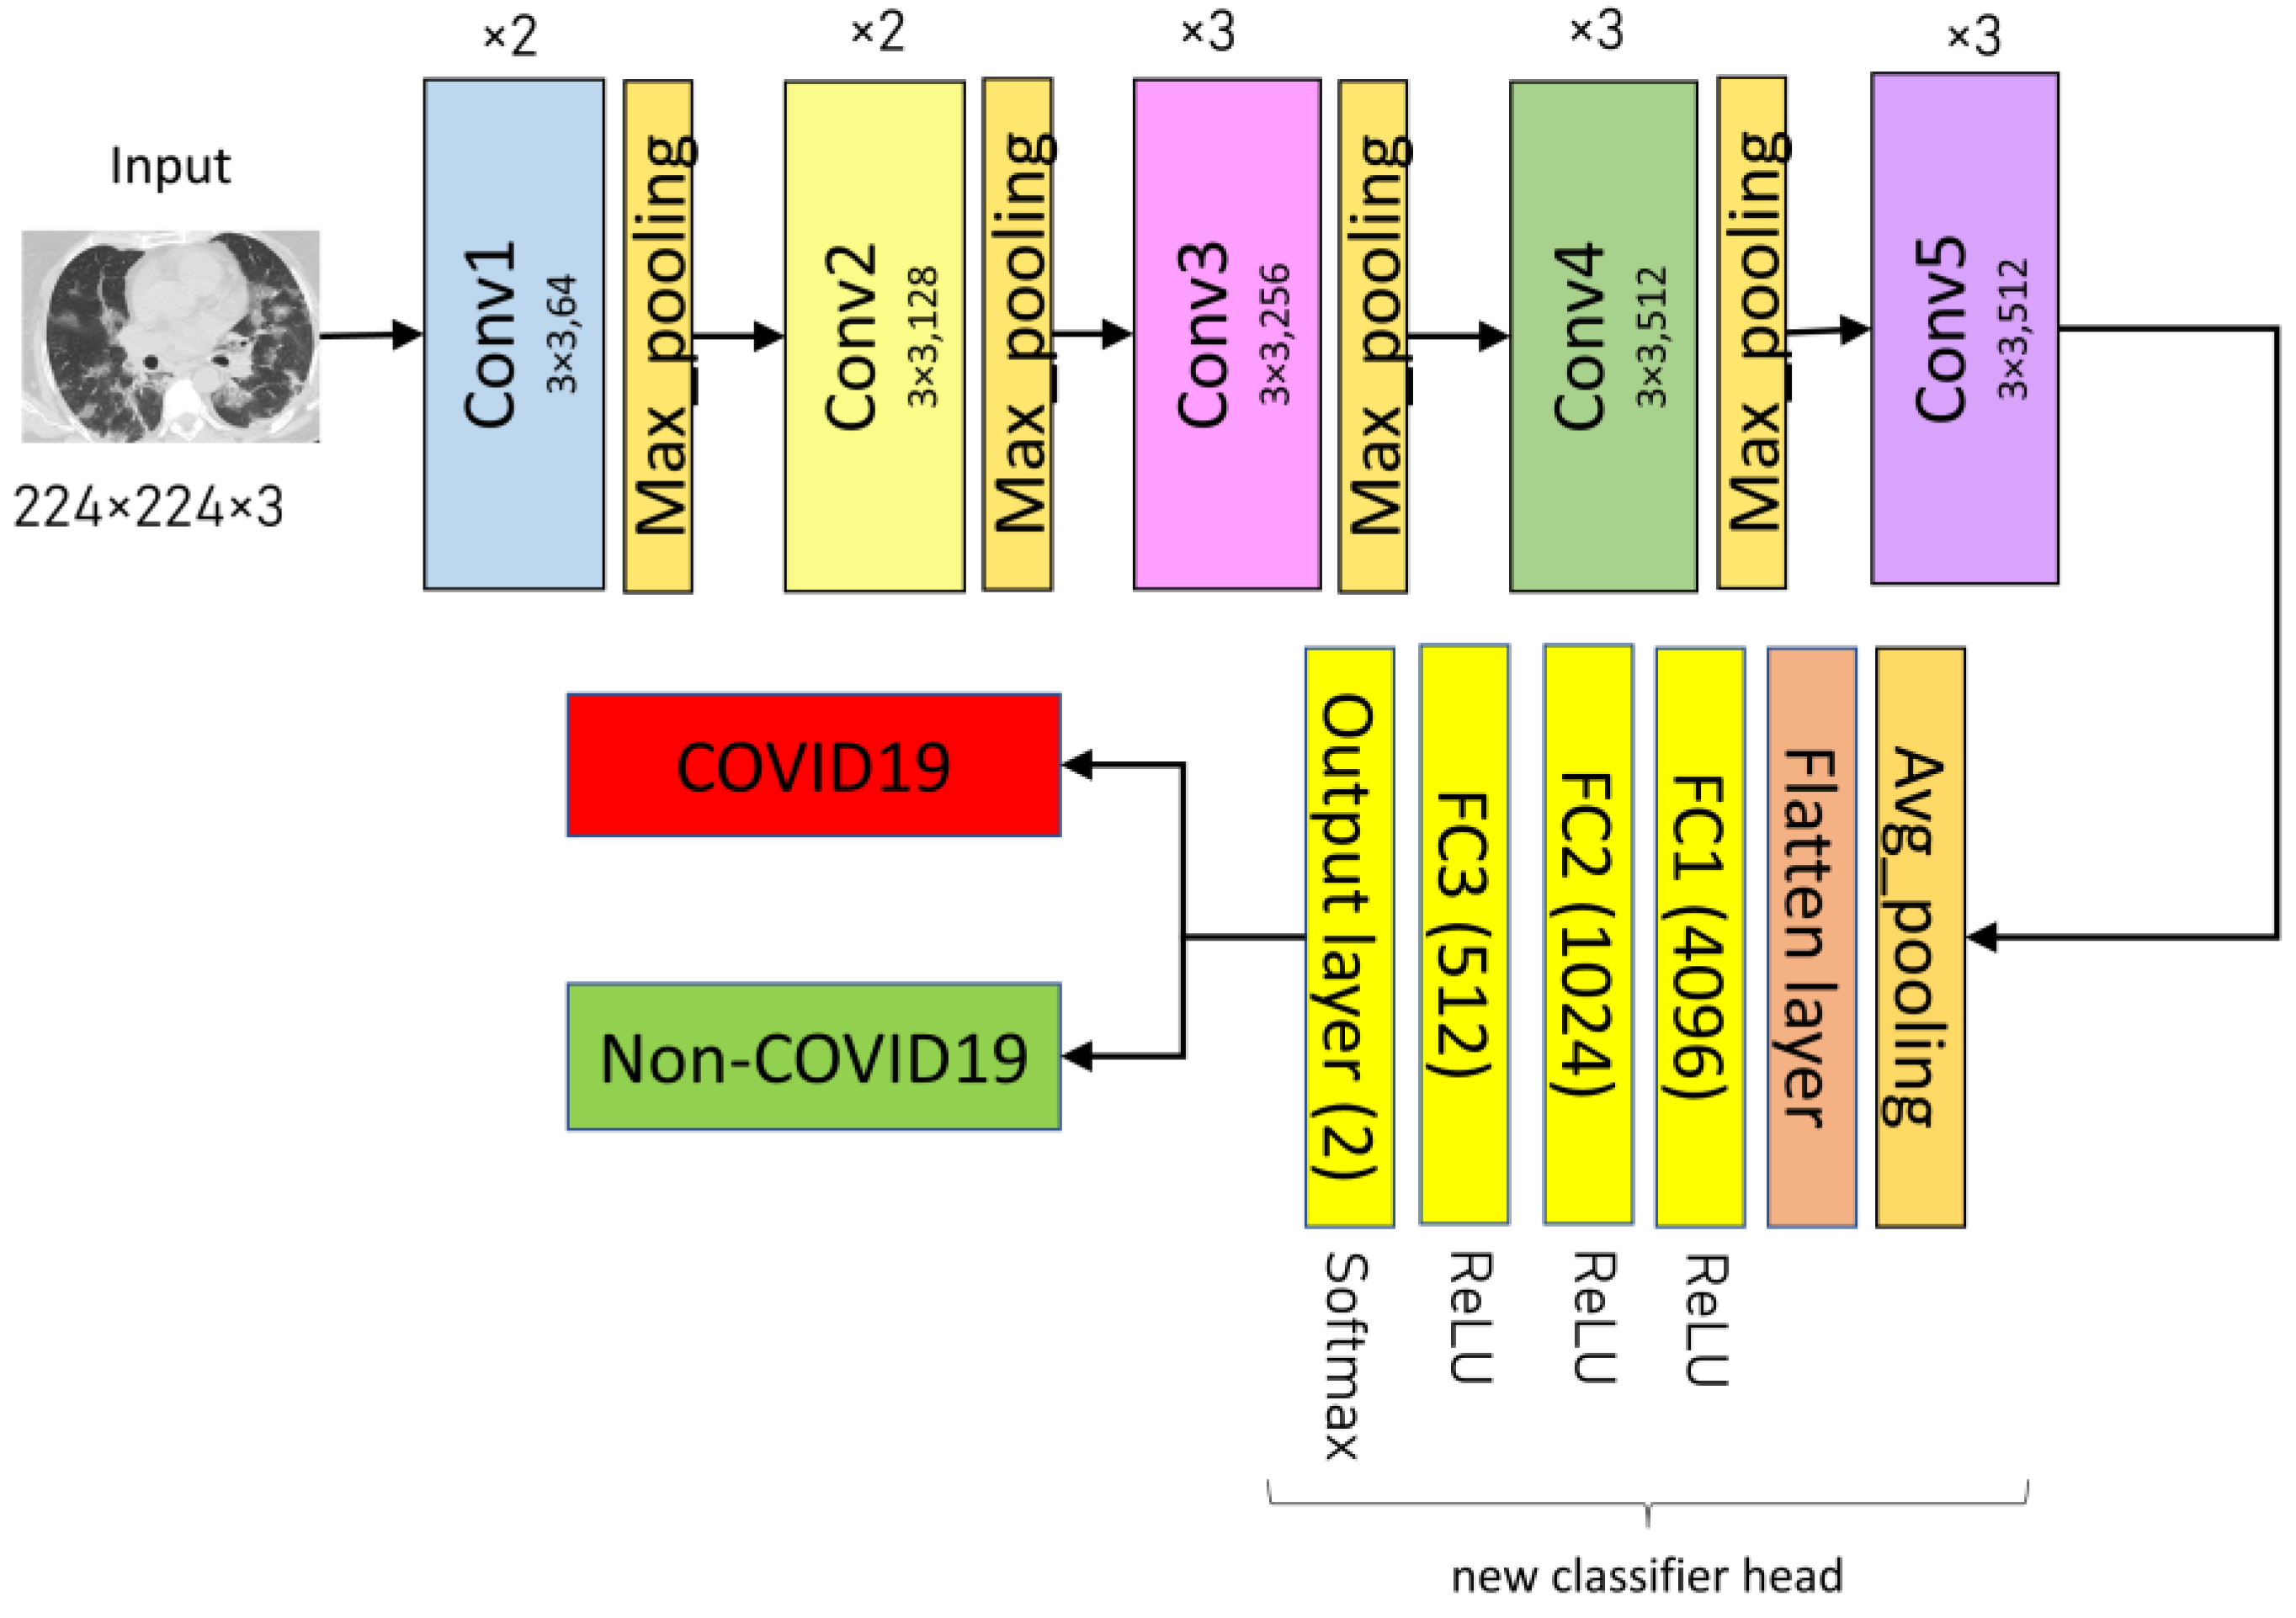
3.3.4. VGG16
VGG16 is a CNN architecture with 3 × 3 convolution filters and a stride of one that was meant to provide excellent accuracy in large-scale image recognition applications. This study follows the original architecture of the VGG16, which can be downloaded using Keras libraries via the Application API. The VGG16 model is imported using the command “
from keras.applications import VGG16”, with the
include_top argument set to
False upon import to omit the original classifier part of the model. In addition, the final max-pooling layer in the original architecture was removed and replaced with an average pooling layer. There are a flattened layer and three fully-connected layers (4096, 1024, and 512, respectively). All three FC layers have Rectified Linear Unit (ReLU) activation functions. Lastly, the output layer is dense with a Softmax activation function and two neurons corresponding to the two classes (COVID-19 and Non-COVID-19).
Figure 6 depicts the architecture of the proposed VGG16 model.
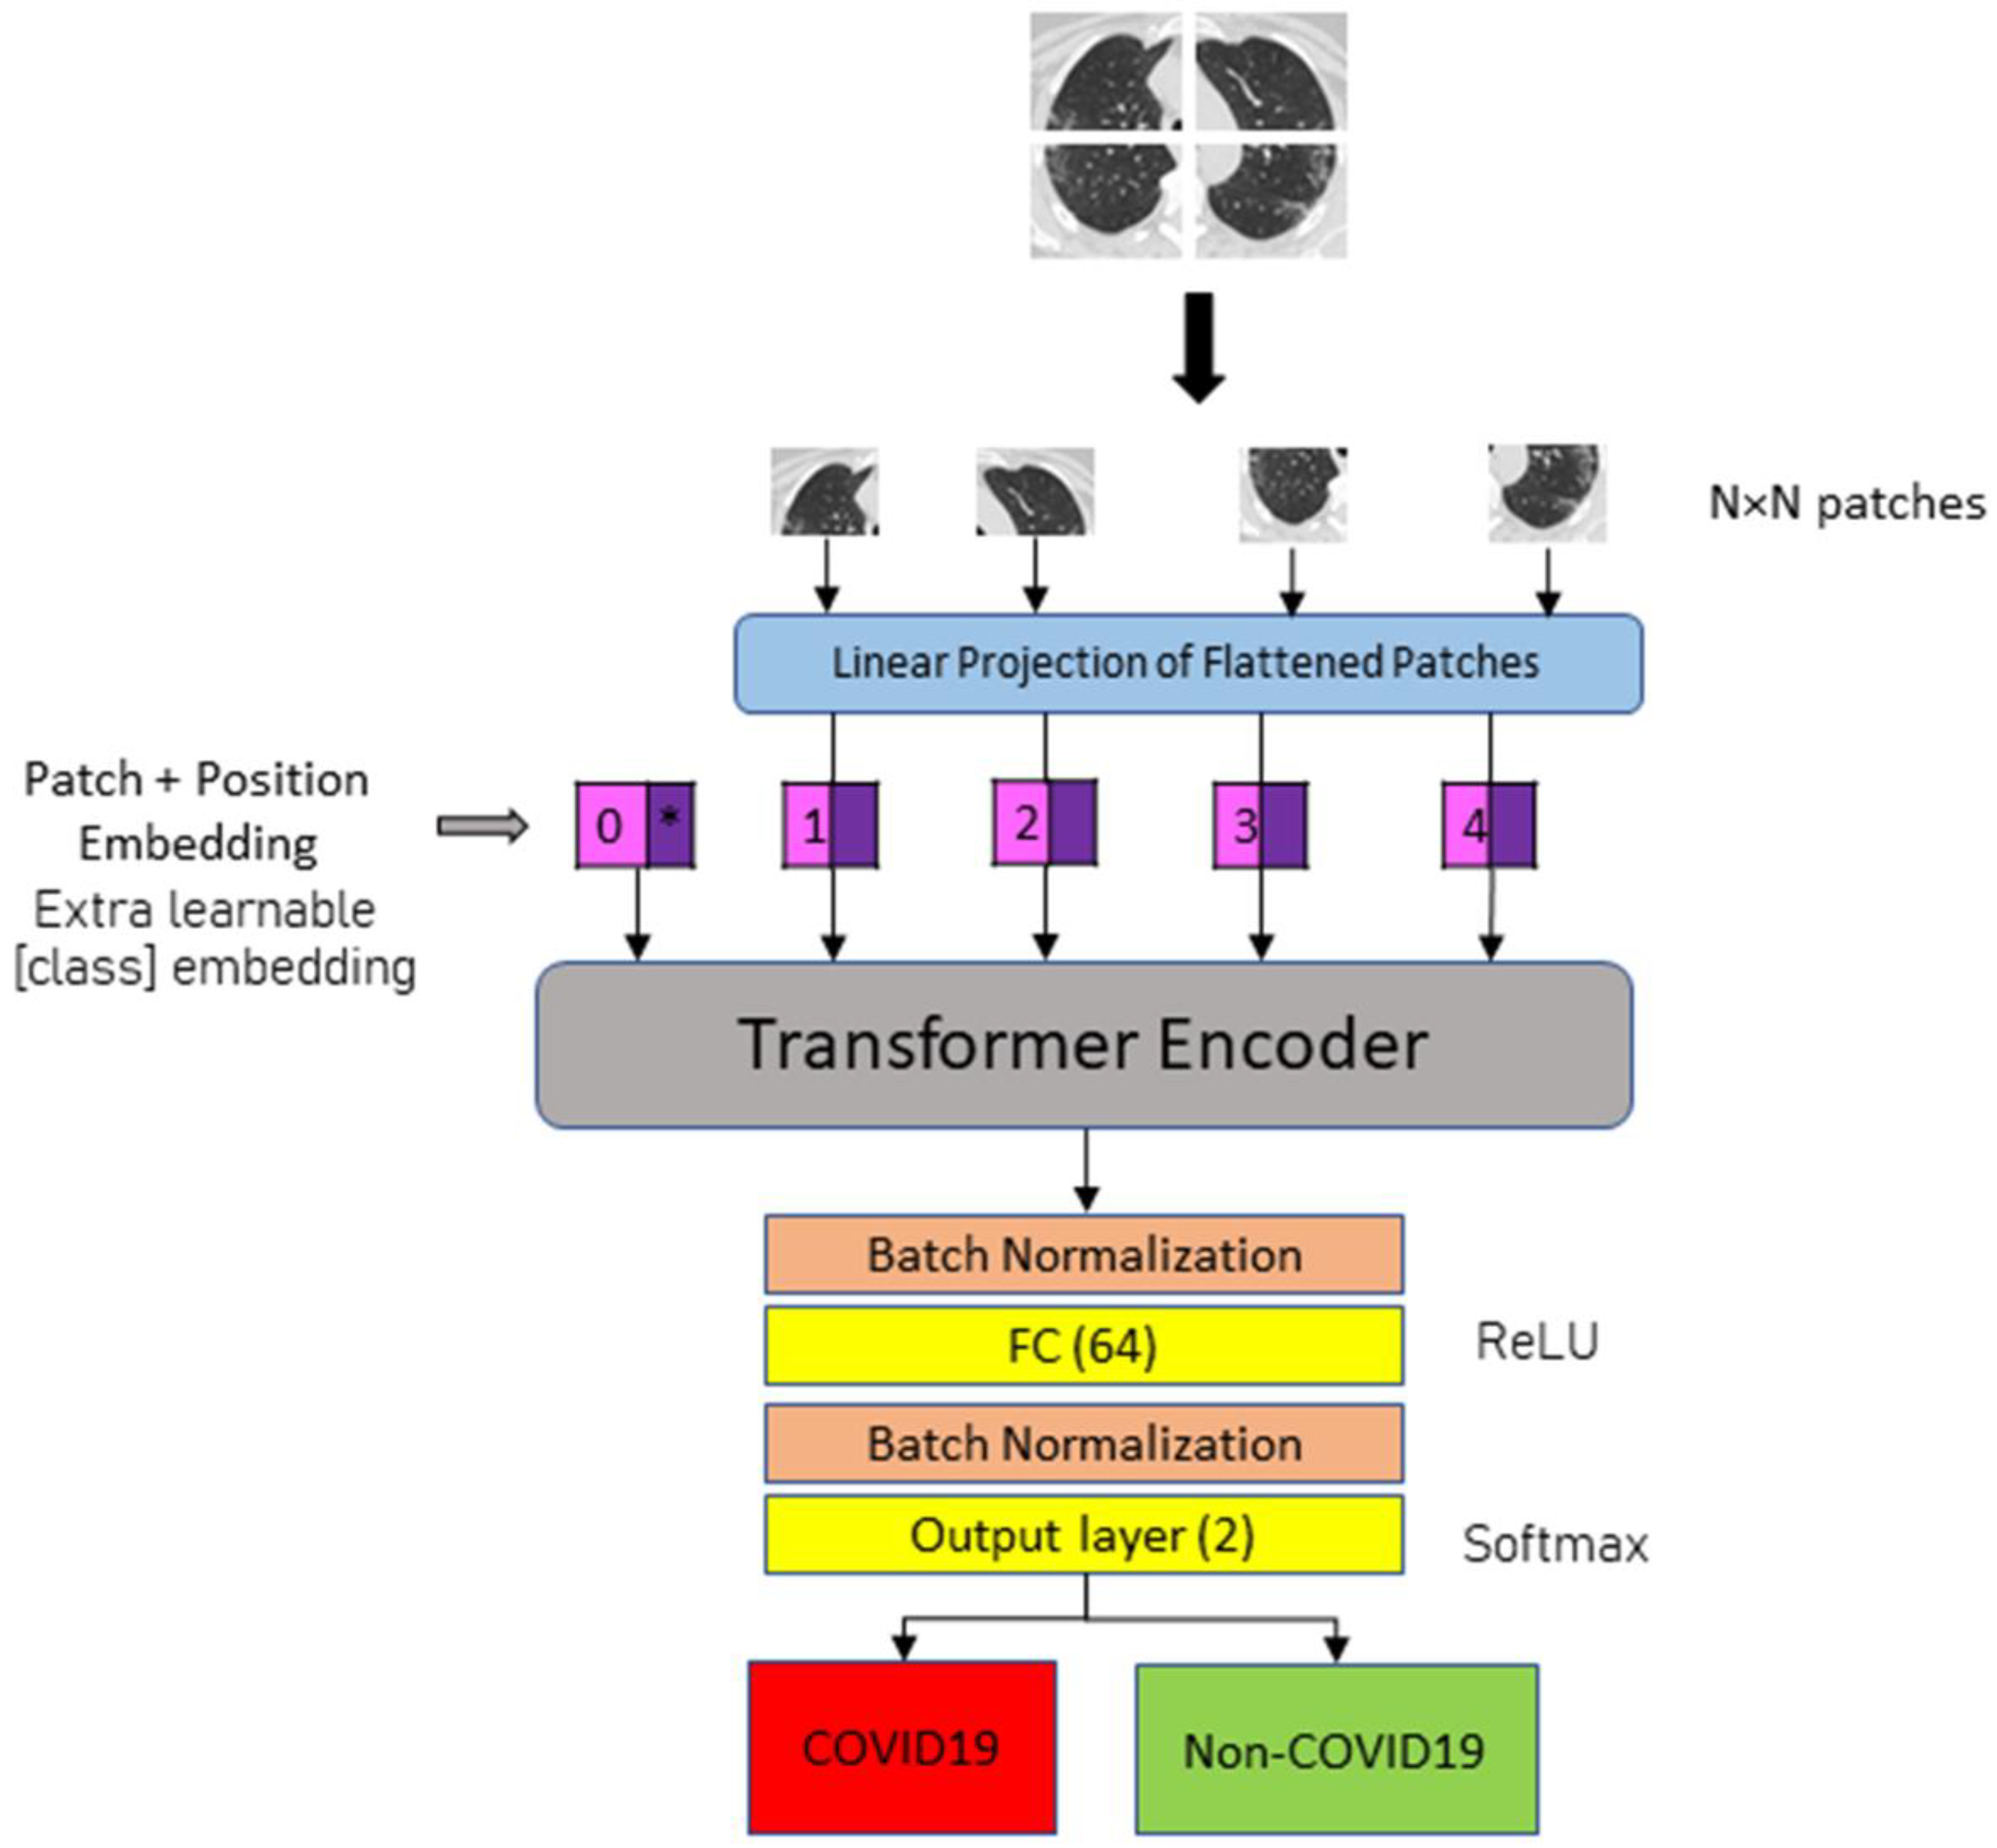
3.3.5. Vision Transformers (ViT-B16 and ViT-B32)
This study employs two vision transformer models (ViT-B16 and ViT-B32) to detect COVID-19 and Non-COVID-19 instances in CT images. A vision transformer model splits an image into several patches of identical size (N × N pixels for each patch). Specifically, ViT-B16 patches with size 16 × 16 and ViT-B32 patches with size 32 × 32. The 2D patch sequence is then flattened into a vector format for use as the input sequence. A position embedding is appended to the patch embedding to maintain positional information. An extra learnable (class) embedding is used to predict the class of the new image based on the position of the image patch. Based on the position of the image patch, an extra learnable (class) embedding is used to predict the class of the new image.
The transformer encoder is a multi-head attention structure with a self-attention layer built in. In the multi-head setup, embedded patches are linked to layer normalization, which is likely connected to multi-layer perceptron (MLP) blocks. The MLP head representing the classifier is swapped out during model fitting for a new classification head. The new classifier is comprised of three completely connected layers with ReLU activation. The number of neurons for each layer is 4096, 1024, and 512. The final layer, the output layer, contains a Softmax activation function that determines the likelihood of classifying CT scans as COVID-19 or Non-COVID-19.
Figure 7 illustrates the general architecture of the fine-tuned ViT model for COVID-19 detection using CT images.
3.4. Performance Metrics
After training completion, the models were assessed on the testing dataset. The adopted measurements are precision, recall (or sensitivity), F1-score, and accuracy. The following equations provide definitions for the metrics:
True positive, true negative, false positive, and false negative are symbolized by the letters TP, TN, FP, and FN, respectively. In this study, TP represents successfully categorized COVID-19 images, whereas TN represents correctly classed Non-COVID-19 images. A false positive occurs when a COVID-19 picture is incorrectly labelled as non-COVID-19. Otherwise, the incorrectly labelled Non-COVID-19 image is FN. The confusion matrix for each model is generated using the Scikit-learn function and consequently prepare the classification reports based on the confusion matrix.
3.5. Other Experimental Setups
All experiments are carried out on an Asus TUF Dash F15 laptop with an Intel Core i5-11300H CPU running at 3.10 GHz. The laptop is equipped with an Nvidia GeForce RTX3060 GPU and 6 GB of visual RAM. There was also 8 GB of physical RAM installed. During training, all the pre-trained models use Adam Optimizer with initial learning rate values of 0.001 and 0.0001 for CNN-based and ViT-based models, respectively. CNN-based models have a batch size of 16, while ViT-based models have a batch size of 8. In addition, two callback functions, ReduceLROnPlateau() and EarlyStopping(), are employed to prevent the overfitting problem. ReduceLROnPlateau scheduler monitors the validation loss during model fitting and reduces the learning rate by 0.2 if it does not decrease for three epochs. The EarlyStopping scheduler monitors the validation loss and stops the training process if the monitored metric does not improve within ten epochs.
4. Results and Discussion
In this study, a total of six DL-based models were evaluated for the COVID-19 classification task. These models were trained and tested across five different image representations, including RGB, GRAY3, GRAY3_HE, GRAY3_CLAHE, and GRAY+GRAY_HE+GRAY_CLAHE. This resulted in a total of 30 experiments. The results of the experiments are then further analyzed to demonstrate the effect of the proposed image representations on the classification performance. During the training process, all the DL models were trained for a maximum of 100 epochs with the EarlyStopping() and ReduceLROnPlateau() callback functions.
Table 3,
Table 4,
Table 5 and
Table 6 present the accuracy, precision, recall, and F1-score of the six DL models that were evaluated across five different image representations.
As can be observed in
Table 3, the performance of all models decreased when the image representation was changed from RGB to GRAY3 and GRAY3_HE. However, when the GRAY3_CLAHE image representation was employed, the InceptionV3, ResNet50, and VGG16 models could achieve results similar to those obtained using the RGB representation. ViT-B32 (GRAY3_CLAHE) provides higher accuracy than ViT-B32(RGB), with 78.31% and 77.11%, respectively. MobileNet (GRAY3_CLAHE) and ViT-B16 (GRAY3_CLAHE), on the other hand, showed lower accuracy than MobileNet (RGB) and ViT-B16 (RGB), respectively. Using the GRAY+GRAY_HE+GRAY_CLAHE representation, the InceptionV3 model obtained the best accuracy with 99.6%, equal to the accuracy score of MobileNet (RGB). Significant improvement in accuracy can also be seen when the proposed GRAY+GRAY_HE+GRAY_CLAHE representation is applied to ViT-B16 and ViT-B32 models. Specifically, ViT-B16 (GRAY+GRAY_HE+GRAY_CLAHE) has higher accuracy than ViT-B16 (RGB), with 83.94% and 89.56%, respectively. ViT-B32 (GRAY+GRAY_HE+GRAY_CLAHE) outperformed ViT-B32 (RGB) with 84.74% and 77.11% accuracies, respectively.
Table 4 illustrated the decline in precision values of the DL models when GRAY3 and GRAY3_HE image representations were used, as compared to the RGB representation. Despite this degradation, the models InceptionV3 (GRAY3_HE), MobileNet (GRAY3_HE), and ResNet50 (GRAY3_HE) respectively exhibited higher precision than the models InceptionV3 (GRAY3), MobileNet (GRAY3), and Res-Net50 (GRAY3). Although most models that used GRAY3_CLAHE representations had lower precision than those that used RGB representation, InceptionV3 (GRAY3_CLAHE) and ViT-B32 (GRAY3_CLAHE) gave better precisions, with 98.41% and 78.32%, respectively than InceptionV3 (RGB) and ViT-B32 (RGB), with 97.59% and 77.61%, respectively. The highest precision was obtained by InceptionV3 (GRAY+GRAY_HE+GRAY_CLAHE) with 99.61%. Using the proposed GRAY+GRAY_HE+GRAY_CLAHE, the significantly increased precision values were also achieved by ViT-B16 and ViT-B32 models. Specifically, the precision of ViT-B16(GRAY+GRAY_HE+GRAY_CLAHE) was 89.78%, which is higher than 85.43% (the precision value of ViT-B16(RGB)). ViT-B32 (GRAY+GRAY_HE+GRAY_CLAHE) also outperformed ViT-B32 (RGB), with 85.44% and 77.61% precision values, respectively.
Table 5 presents the recall values of the DL models across the five image representations. Similar to the previous metrics, the recall values reveal that the models using RGB image representations performed better than the corresponding models using GRAY3 and GRAY3_HE image representations. For example, ResNet50 (RGB), with 97.6% recall, has topped ResNet50 (GRAY3) and ResNet50 (GRAY3_HE), with 97.19 and 96.81%, respectively. Besides that, GRAY3_CLAHE was a better image representation than GRAY3_HE, considering that five out of six models improved their recall scores when changed from GRAY3_HE to GRAY3_CLAHE. For example, the recall score of ViT-B16 (GRAY3_CLAHE) was notably higher than that of ViT-B16 (GRAY3_HE), with 82.45% and 71.56%, respectively. Additionally, the recall score of ViT-B32 (GRAY3_CLAHE) was superior to that of ViT-B32 (RGB), with 78.3%. Using the proposed GRAY+GRAY_HE+GRAY_CLAHE image representation, most models achieved an improvement in recall value when compared to that used RGB representation. For example, InceptionV3 (GRAY+GRAY_HE+GRAY_CLAHE) gave a 99.59% recall value, which is higher than InceptionV3 (RGB), with a 98.4% recall. ResNet50 (GRAY+GRAY_HE+GRAY_CLAHE) also outperformed ResNet50 (RGB) with 98.01% and 97.6%, respectively.
As demonstrated in
Table 6, similar to the previous metrics, the GRAY3 and GRAY3_HE image representations decreased the F1-score of the DL models compared to the RGB representation. Furthermore, the models InceptionV3 (GRAY3_CLAHE), ResNet50 (GRAY3_CLAHE), and VGG16 (GRAY3_CLAHE) exhibited F1_scores comparable to those of InceptionV3 (RGB), Res-Net50 (RGB), and VGG16 (RGB), respectively. Although ViT-B16 (GRAY3_CLAHE) had a lower F1_score value, with 82.18%, than ViT-B16 (RGB), with 83.8%, the F1_score value of ViT-B16 (GRAY3_CLAHE) was higher than ViT-B32 (RGB), with 78.3% and 77.04%, respectively. On the other hand, four out of six models that used GRAY+GRAY_HE+GRAY_CLAHE representation showed a significant improvement compared to the respective model that uses RGB representation. For instance, InceptionV3 (GRAY+GRAY_HE+GRAY_CLAHE) gave a higher F1_score, with 99.6%, than InceptionV3 (RGB), with 98.39%. ResNet50 (GRAY+GRAY_HE+GRAY_CLAHE) also outperformed ResNet50 (RGB) with 97.99% and 97.59%, respectively. Additionally, when the GRAY+GRAY_HE+GRAY_CLAHE representation was used, ViT-B16 and ViT-B32 achieved significant increases in F1_score; specifically, the F1_score values of ViT-B16 (GRAY+GRAY_HE+GRAY_CLAHE) and ViT-B32 (GRAY+GRAY_HE+GRAY_CLAHE) were 89.55% and 84.68%, respectively, which are greater than ViT-B16 (RGB) and ViT-B32 (RGB), with 4.87% and 12.76% increases, respectively.
4.1. Overall Performance of the Image Representations
Notice that, in the last rows of
Table 3,
Table 4,
Table 5 and
Table 6, we calculated the average values of all models’ performance for each image representation to demonstrate in detail the contribution of each image representation to the models’ classification performance. For instance, the average accuracy for the RGB image representation, as calculated in the last row of
Table 3, is presented in Equation (5). The same equation applies to other performance metrics, such as precision, recall, and F1-score.
where
M is a set of DL models; M = {InceptionV3, MobileNet, ResNet50, VGG16, ViT-B16, ViT-B32}.
m is the index of the DL model in set M, where m = 1, 2, 3, 4, 5, 6.
Y is a set of image representations; Y = {RGB, GRAY3, GRAY3_HE, GRAY3_CLAHE, GRAY+GRAY_HE+GRAY_CLAHE}.
y is the index of the image representation in set Y, where y = 1, 2, 3, 4, 5.
Ay is the average value of image representation y’s performance on metric for all six DL models.
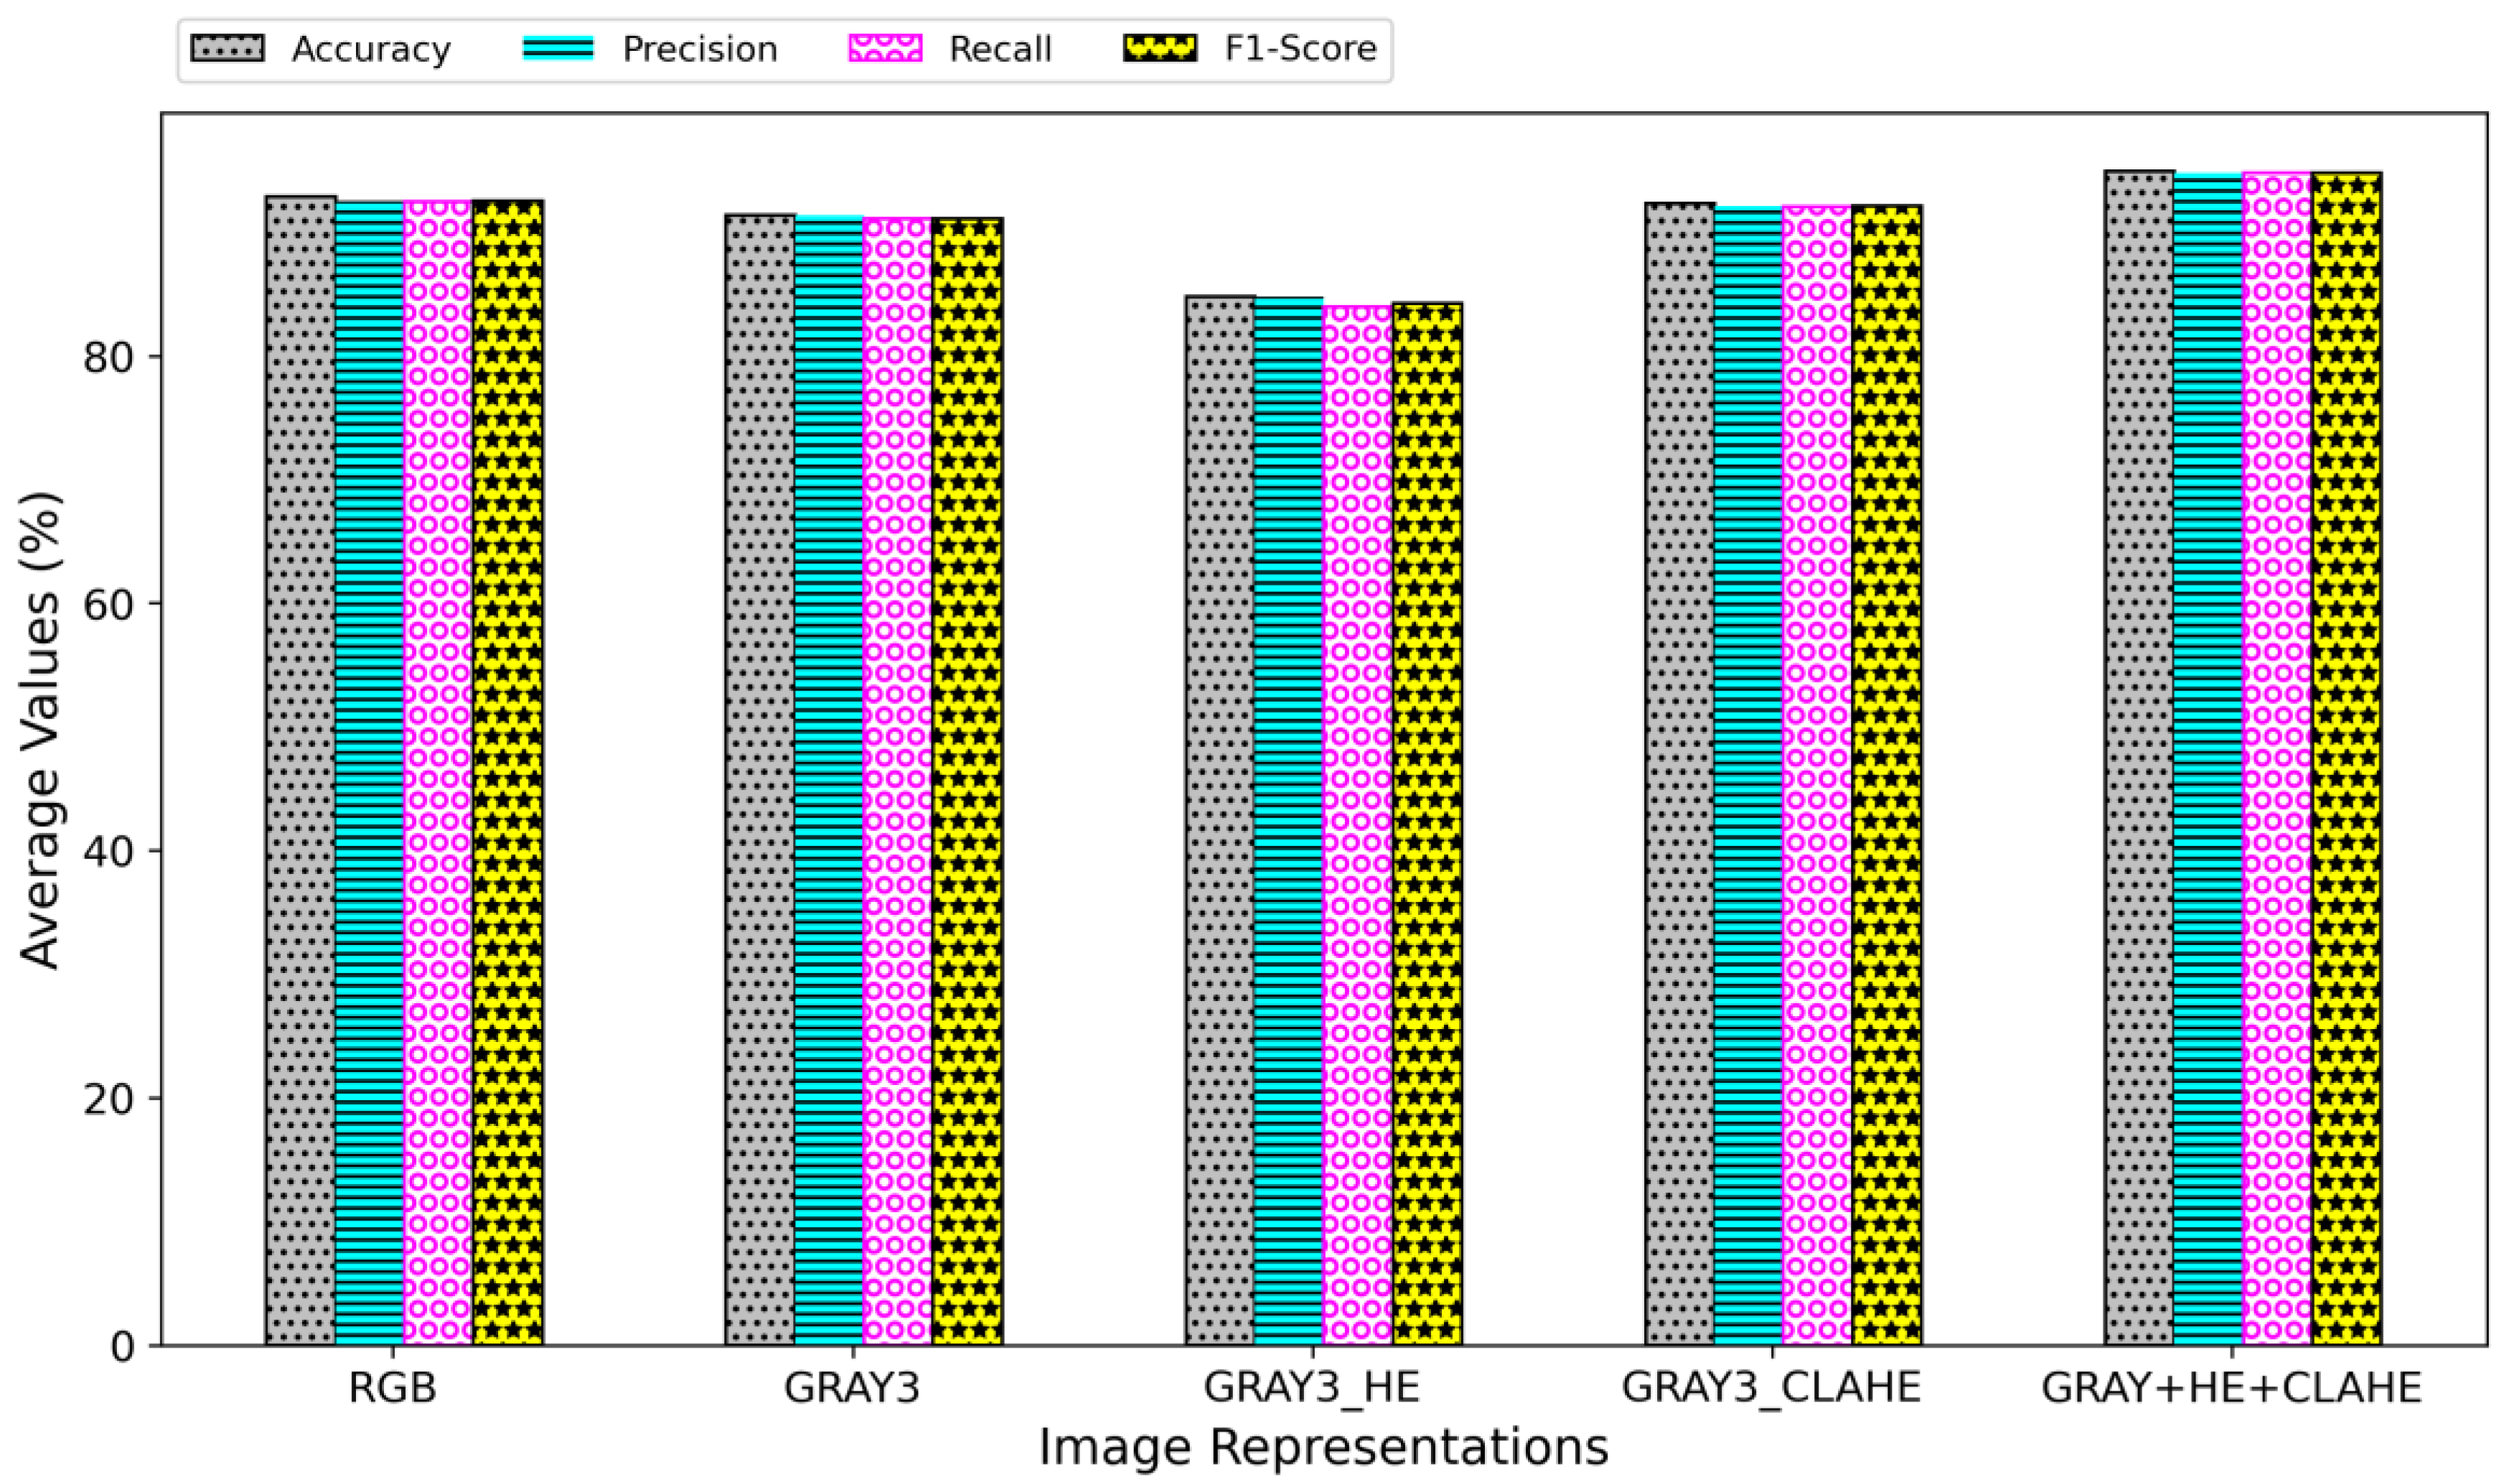
The values calculated from Equation (5) are presented in
Figure 8 using bar plots. The figure illustrates that the highest average performance is achieved using the GRAY+GRAY_HE+GRAY_CLAHE image representation, regardless of the performance metric. As such, this image representation is deemed the most appropriate for the development of a more accurate COVID-19 classification model using CT images. RGB representation beats the GRAY3 and GRAY3_HE representations, with GRAY3_HE having the least average values in all metrics. The HE technique made the grayscale image’s pixel values evenly distributed across the intensity values, hence emphasizing the global features of the grayscale CT image. However, this technique might leave out the important local features necessary for accurate classification. On the other hand, CLAHE preserved the overall contrast of the grayscale image while avoiding the over-saturation of high-contrast areas, emphasizing the local features of the image. By incorporating the HE-enhanced and CLAHE-enhanced images in the proposed GRAY+GRAY_HE+GRAY_CLAHE representation, the models could learn both global and local features of the CT images, thus improving the classification performance.
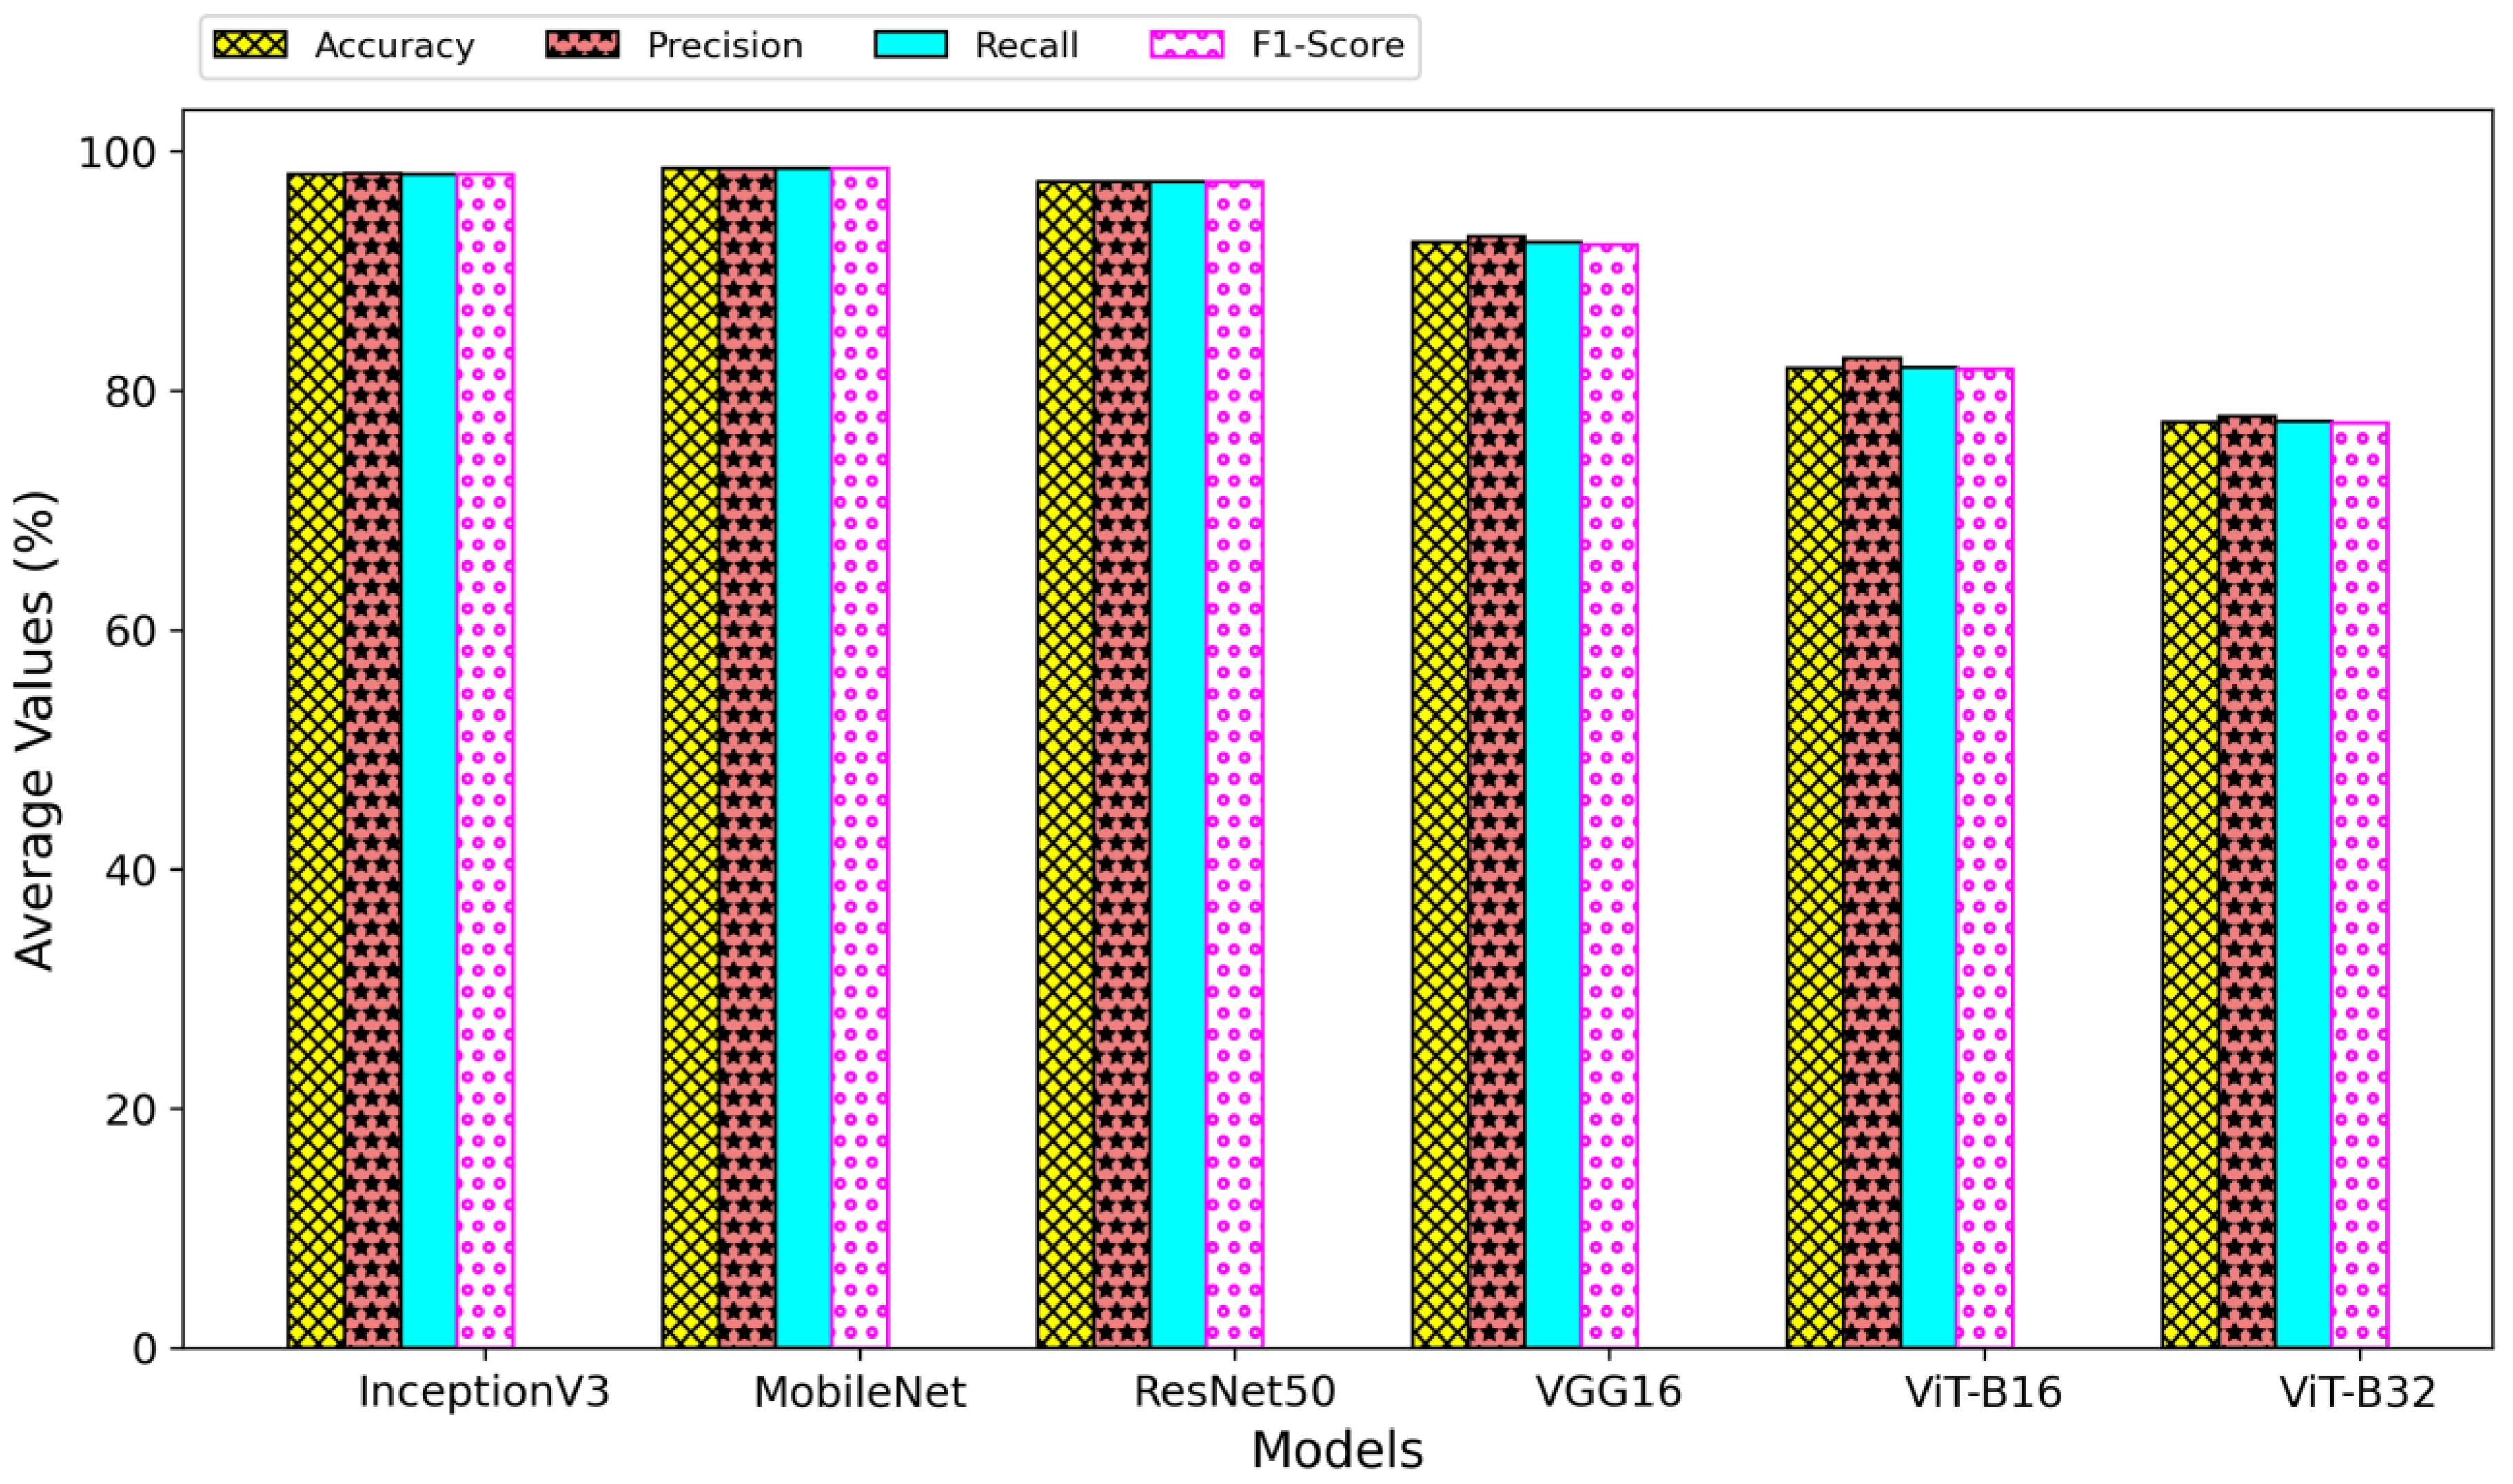
4.2. Overall Performance of the Classification Models
Figure 9 compares the performance of the six models across all image representations. These values were obtained by aggregating a model’s performance on every image representation and dividing by the total number of image representations utilized (in this case, five). Equation (6) illustrates an example of the performance metric, accuracy, used to compute these values. The same equation applies to other performance metrics, such as precision, recall, and F1-score.
where
M is a set of DL models; M = {InceptionV3, MobileNet, ResNet50, VGG16, ViT-B16, ViT-B32}.
m is the index of the DL model in set M, where m = 1, 2, 3, 4, 5, 6.
Y is a set of image representations; Y = {RGB, GRAY3, GRAY3_HE, GRAY3_CLAHE, GRAY+GRAY_HE+GRAY_CLAHE}.
y is the index of the image representation in set Y, where y = 1, 2, 3, 4, 5.
Bm is the average value of the model m’s performance on metric for all five image representations.
Figure 9.
Average of each model’s performance regardless of the image representations.
Figure 9.
Average of each model’s performance regardless of the image representations.
As evidenced in
Figure 9, the performance of all vision transformer-based models is significantly lower than that of all CNN-based models. Despite the ability of the transformer-based to learn long-range dependencies across the entire image, the CNN-based models may be more effective for CT-based COVID-19 classification in learning local features within the image that are relevant to the task. The low performance shown by the vision transformer-based models might be due to the limited size of the training data. ViT-B16 and ViT-B32 have many parameters (i.e., more than 85 million), requiring a large amount of data to be trained effectively. With only a total of 1736 images used for training in this study, it is not large enough to fully leverage the capabilities of the transformer-based models. Besides, this study did not focus on fully exploring the hyper-parameter space for the models used, which could have led to sub-optimal performance.
Table 7 lists the best-performed models for each performance metric. These models were obtained by identifying the highest values in
Table 3,
Table 4,
Table 5 and
Table 6.
Table 7 shows only two models that dominated the highest score for all metrics: InceptionV3 (GRAY+GRAY_HE+GRAY_CLAHE) and MobileNet (RGB). The two models gave equal values for both accuracy and F1-score metrics. However, InceptionV3 (GRAY+GRAY_HE+GRAY_CLAHE) has the highest precision value of 99.61%. On the other hand, MobileNet (RGB) outperformed all the other models in the recall, with 99.60%. Furthermore, it is noteworthy that the recall score of InceptionV3 (GRAY+GRAY_HE+GRAY_CLAHE) is comparable to that of MobileNet (RGB), with only a 0.01% difference.
MobileNet is a lightweight CNN architecture that is designed for efficient deployment on mobile and embedded devices. It is pre-trained on the ImageNet dataset, which contains natural images in RGB format. The use of GRAY+GRAY_HE+GRAY_CLAHE image representation, which is a different format from the images the model was pre-trained on, may result in poor performance due to the model’s inability to extract relevant features from the grayscale image effectively. InceptionV3, on the other hand, is a more complex architecture designed to handle a wide range of image inputs and may be more robust to changes in the input format. Therefore, the InceptionV3 model, when trained on GRAY+GRAY_HE+GRAY_CLAHE image representation, may extract relevant features from the grayscale image more effectively and thus resulting in better performance. Hence, the proposed GRAY+GRAY_HE+GRAY_CLAHE image representation is more suitable for the InceptionV3 than for the MobileNet architecture, which is a less robust model.
In addition, the performance per class for the MobileNet (RGB) and InceptionV3 (GRAY+GRAY_HE+GRAY_CLAHE) is also presented in
Table 8. The InceptionV3 (GRAY+GRAY_HE+GRAY_CLAHE) demonstrates better accuracy and recall for the COVID-19 class, with a 100% rate for both metrics, compared to MobileNet (RGB). A higher accuracy for the COVID-19 class indicates that the model correctly identifies a higher proportion of COVID-19 cases among all the samples. In contrast, a higher recall for the COVID-19 class implies that the model correctly identified a higher proportion of COVID-19 cases among all the actual COVID-19 samples. Despite the fact that both models demonstrated equal accuracy in
Table 7 and MobileNet (RGB) exhibited a higher recall value than InceptionV3 (GRAY+GRAY_HE+GRAY_CLAHE), the InceptionV3 (GRAY+GRAY_HE+GRAY_CLAHE) model displays greater sensitivity in identifying COVID-19 cases, resulting in a reduced number of false negatives. False negatives can have severe consequences in the context of COVID-19 diagnosis, as they can result in undetected disease cases. If a person is tested negative for COVID-19 when infected, they may not self-isolate or seek medical treatment, which can contribute to the spread of the disease. Furthermore, undetected cases can lead to an increase in the number of severe cases and fatalities, which can put a strain on the healthcare system.
Since the MobileNet (RGB) and InceptionV3 (GRAY+GRAY_HE+GRAY_CLAHE) models demonstrate a negligible performance in all the evaluation metrics, we prepared
Table 9 to compare these two models on different aspects (i.e., training time, number of trainable parameters, and testing time). With more parameters, InceptionV3 (GRAY+GRAY_HE+GRAY_CLAHE) took longer to train on the training dataset than the MobileNet (RGB). In this study, testing time refers to the time it takes a model to predict the class of all images in the testing datasets, and it shows how long a model takes to provide the diagnosis results in a real-world application. Based on
Table 9, MobileNet (RGB) generates faster results than InceptionV3 (GRAY+GRAY_HE+GRAY_CLAHE).
Overall, the InceptionV3 (GRAY+GRAY_HE+GRAY_CLAHE) model is a better choice than MobileNet in the context of COVID-19 diagnosis due to its higher accuracy and recall in identifying COVID-19 cases, contributing to lower false negatives. In addition, the proposed GRAY+GRAY_HE+GRAY_CLAHE image representation used in the InceptionV3 model has made it more sensitive to the COVID-19 class. However, in the case of generating faster results, the MobileNet (RGB) model is a much better solution than the InceptionV3 (GRAY+GRAY_HE+GRAY_CLAHE) model.
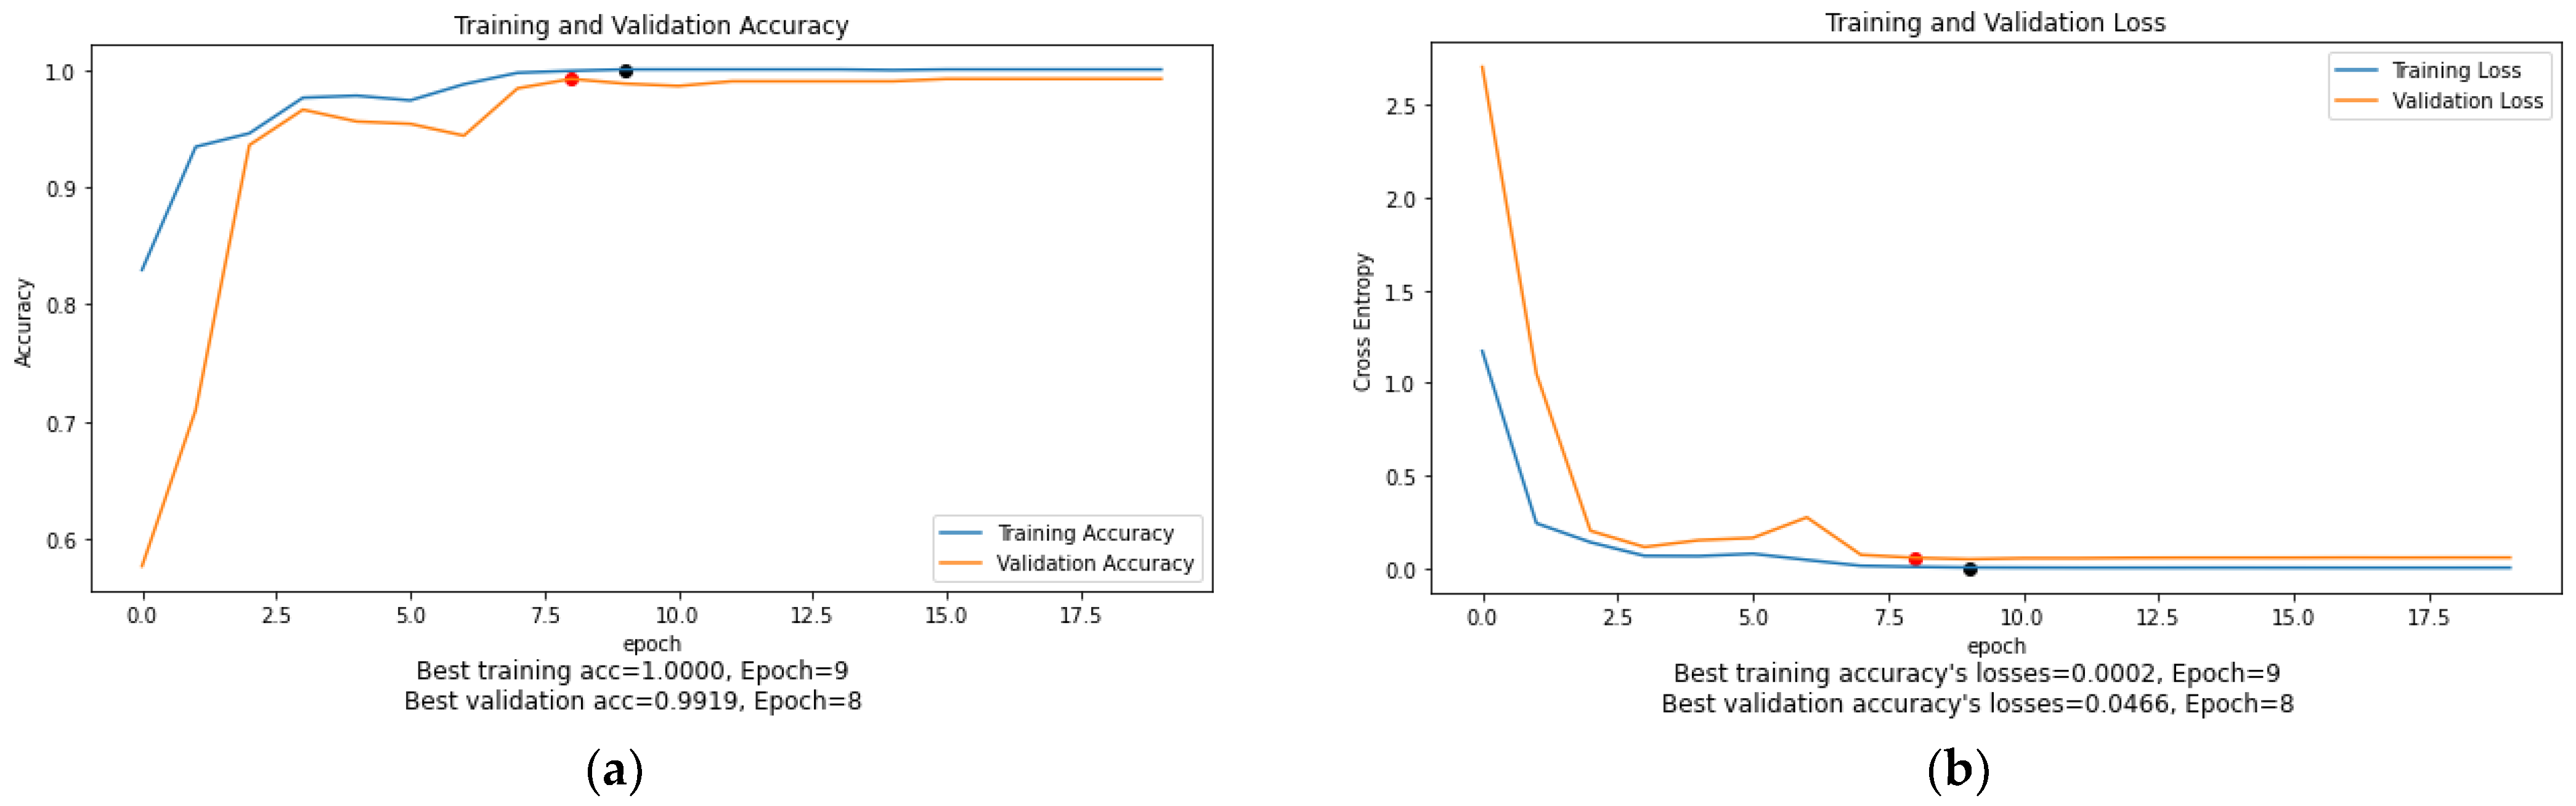
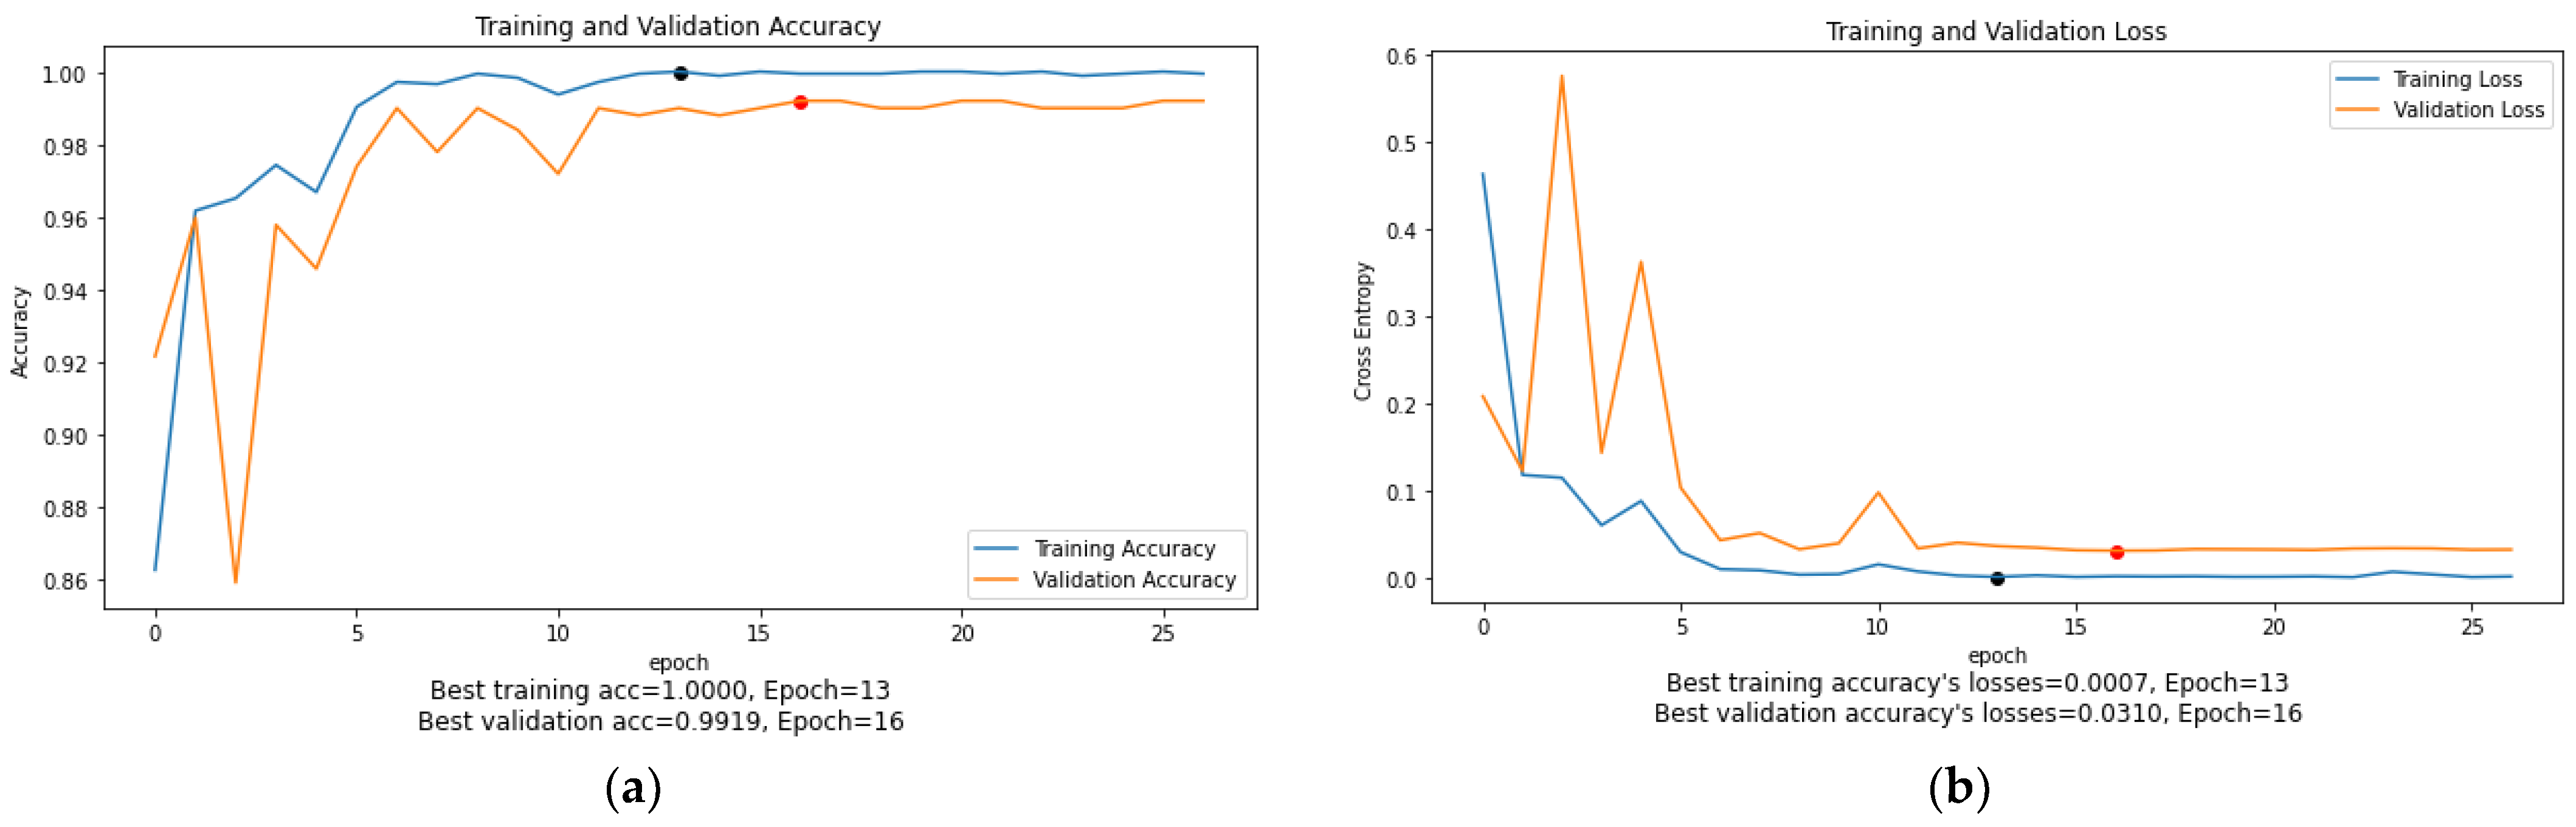
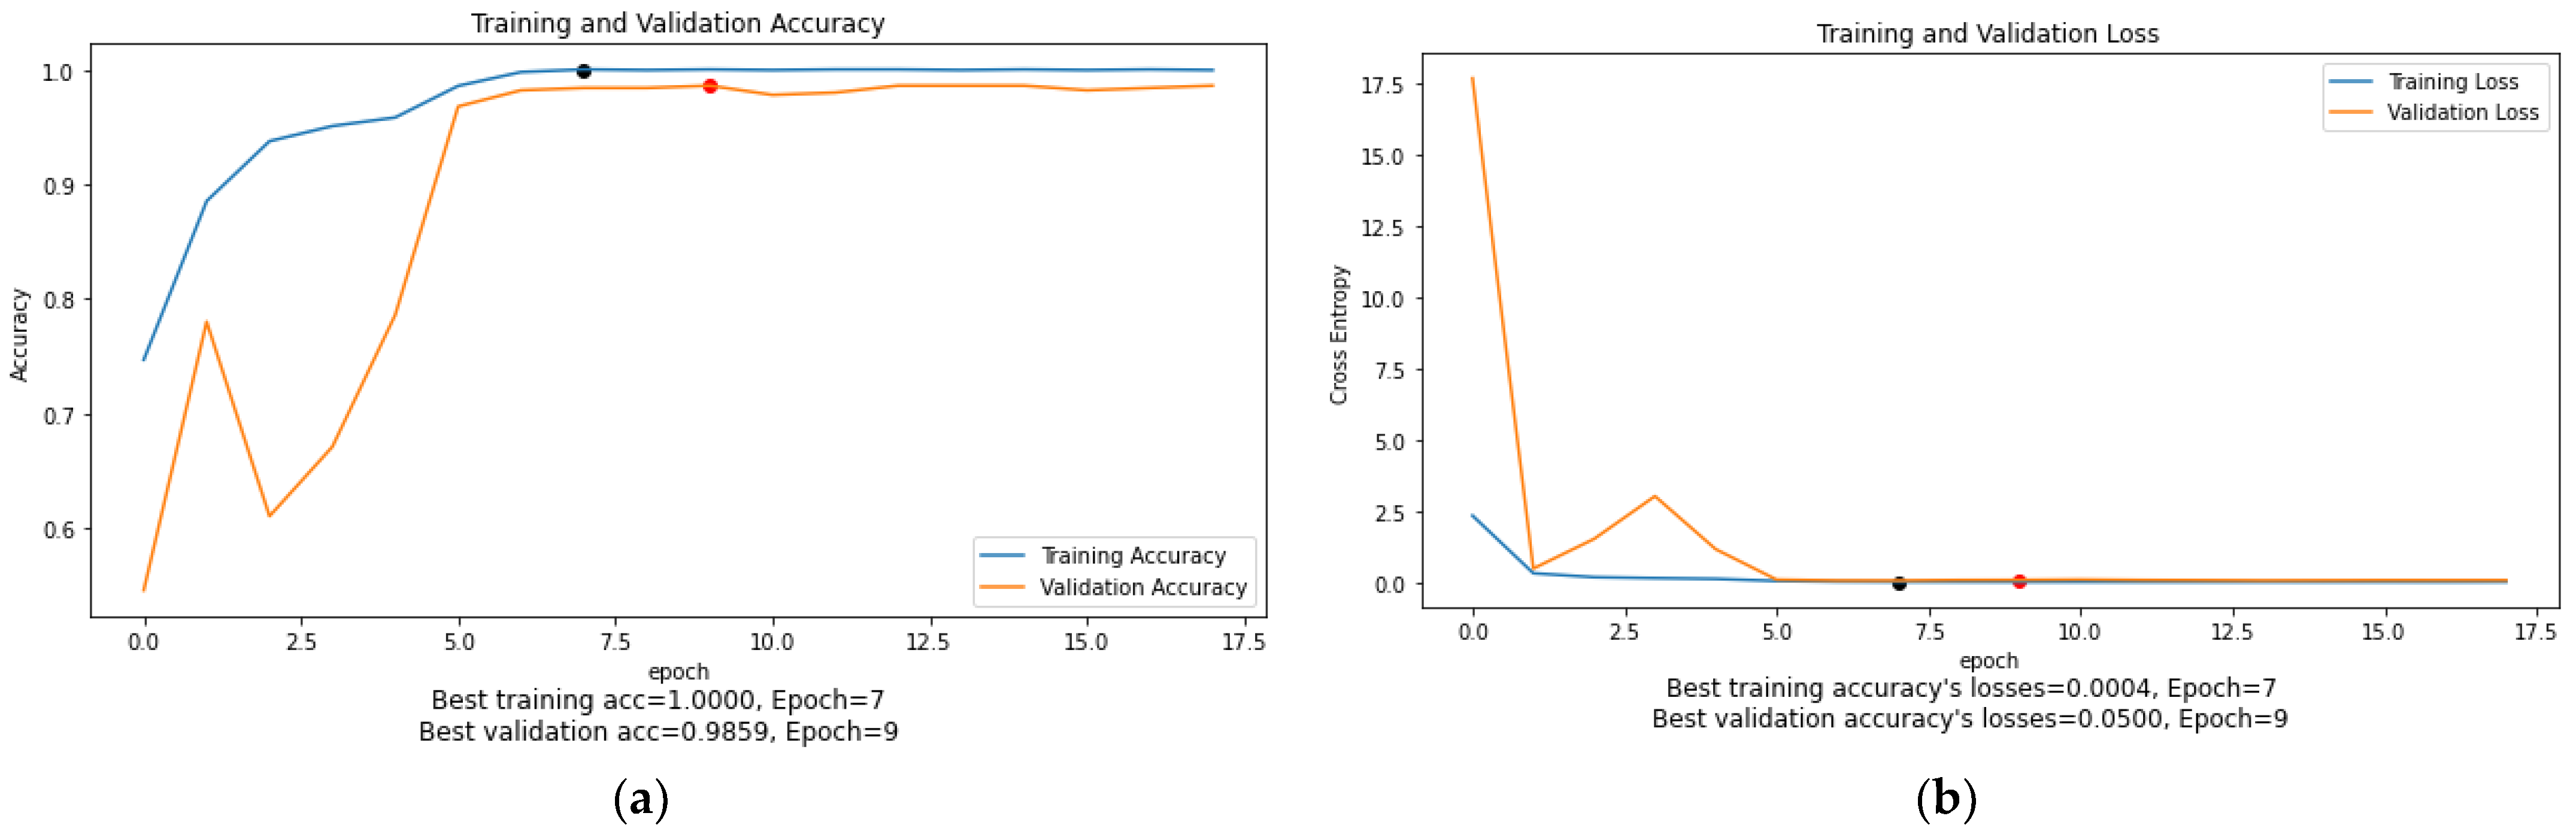
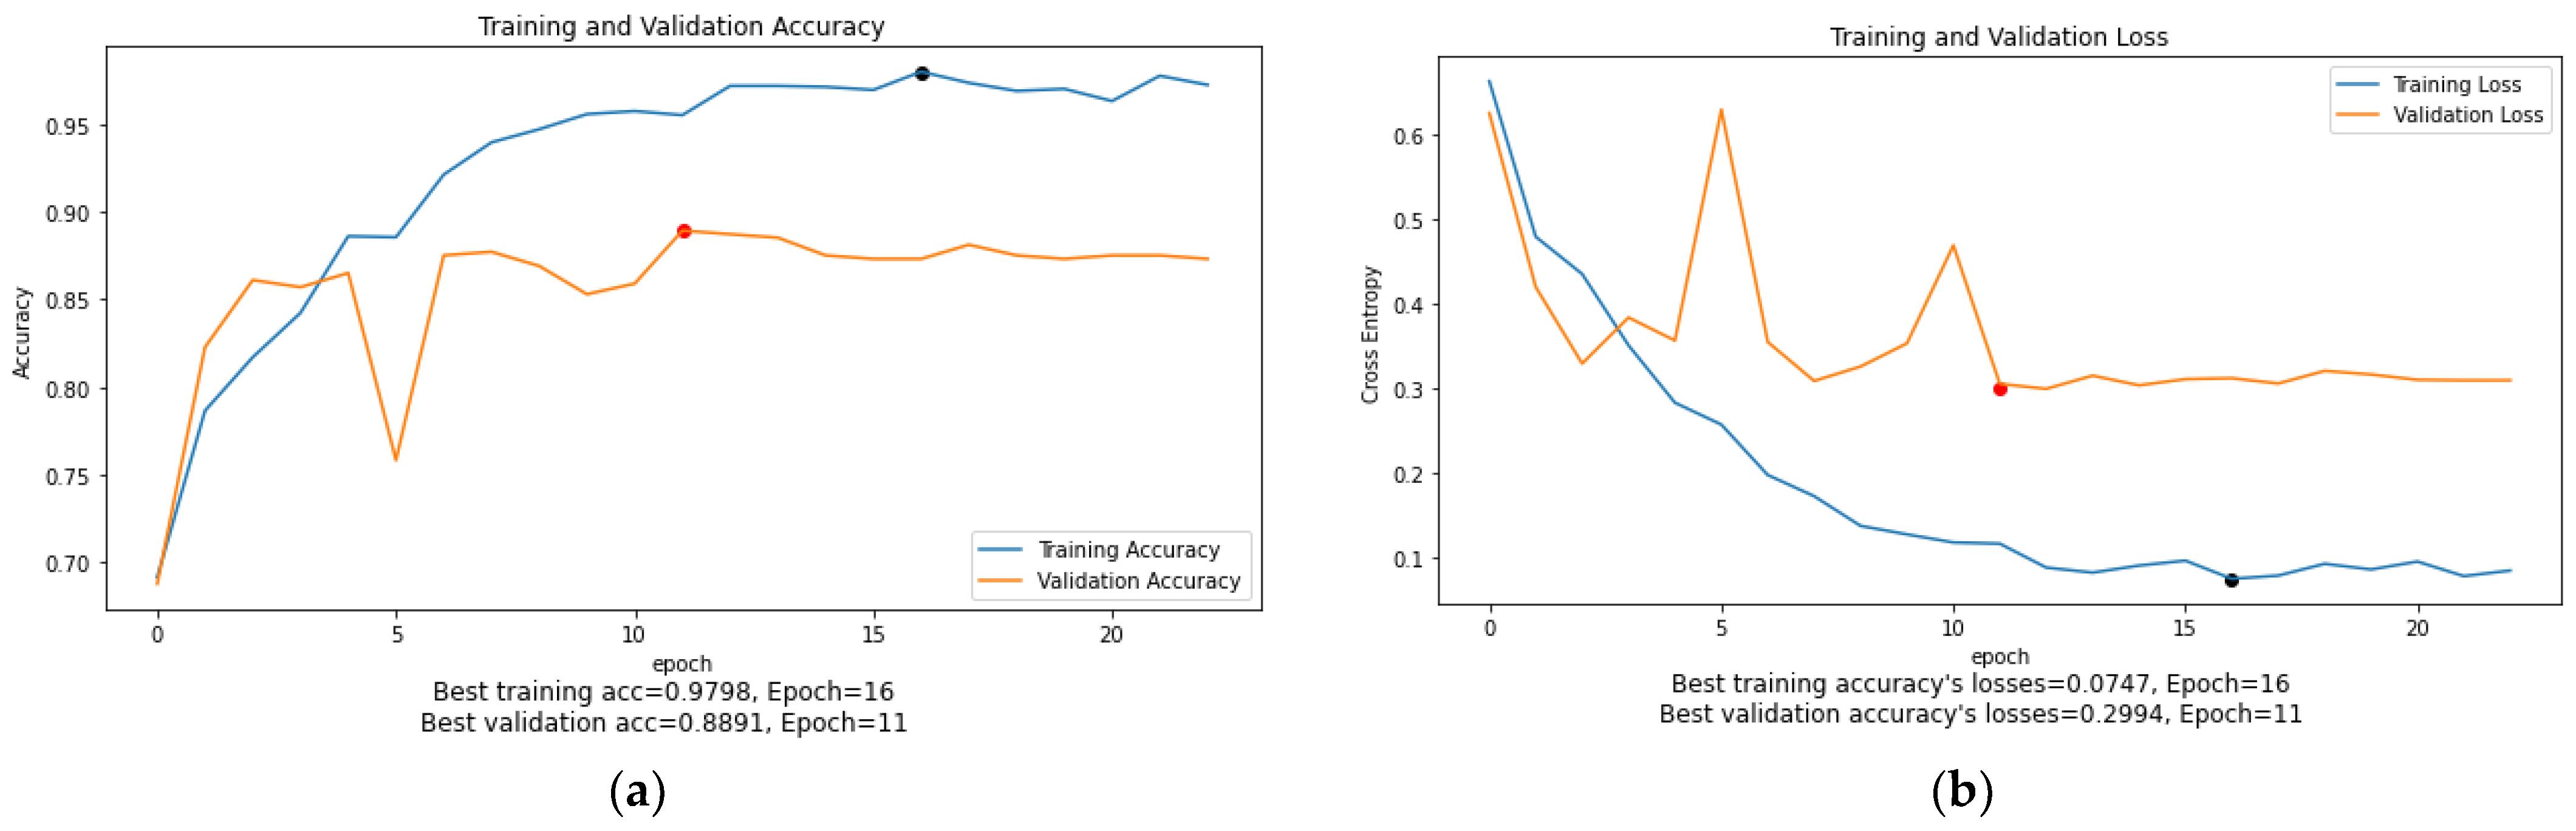
4.3. The Accuracy and Loss Plots of GRAY+GRAY_HE+GRAY_CLAHE Image Representation
As can be seen in
Figure 10,
Figure 11,
Figure 12,
Figure 13,
Figure 14 and
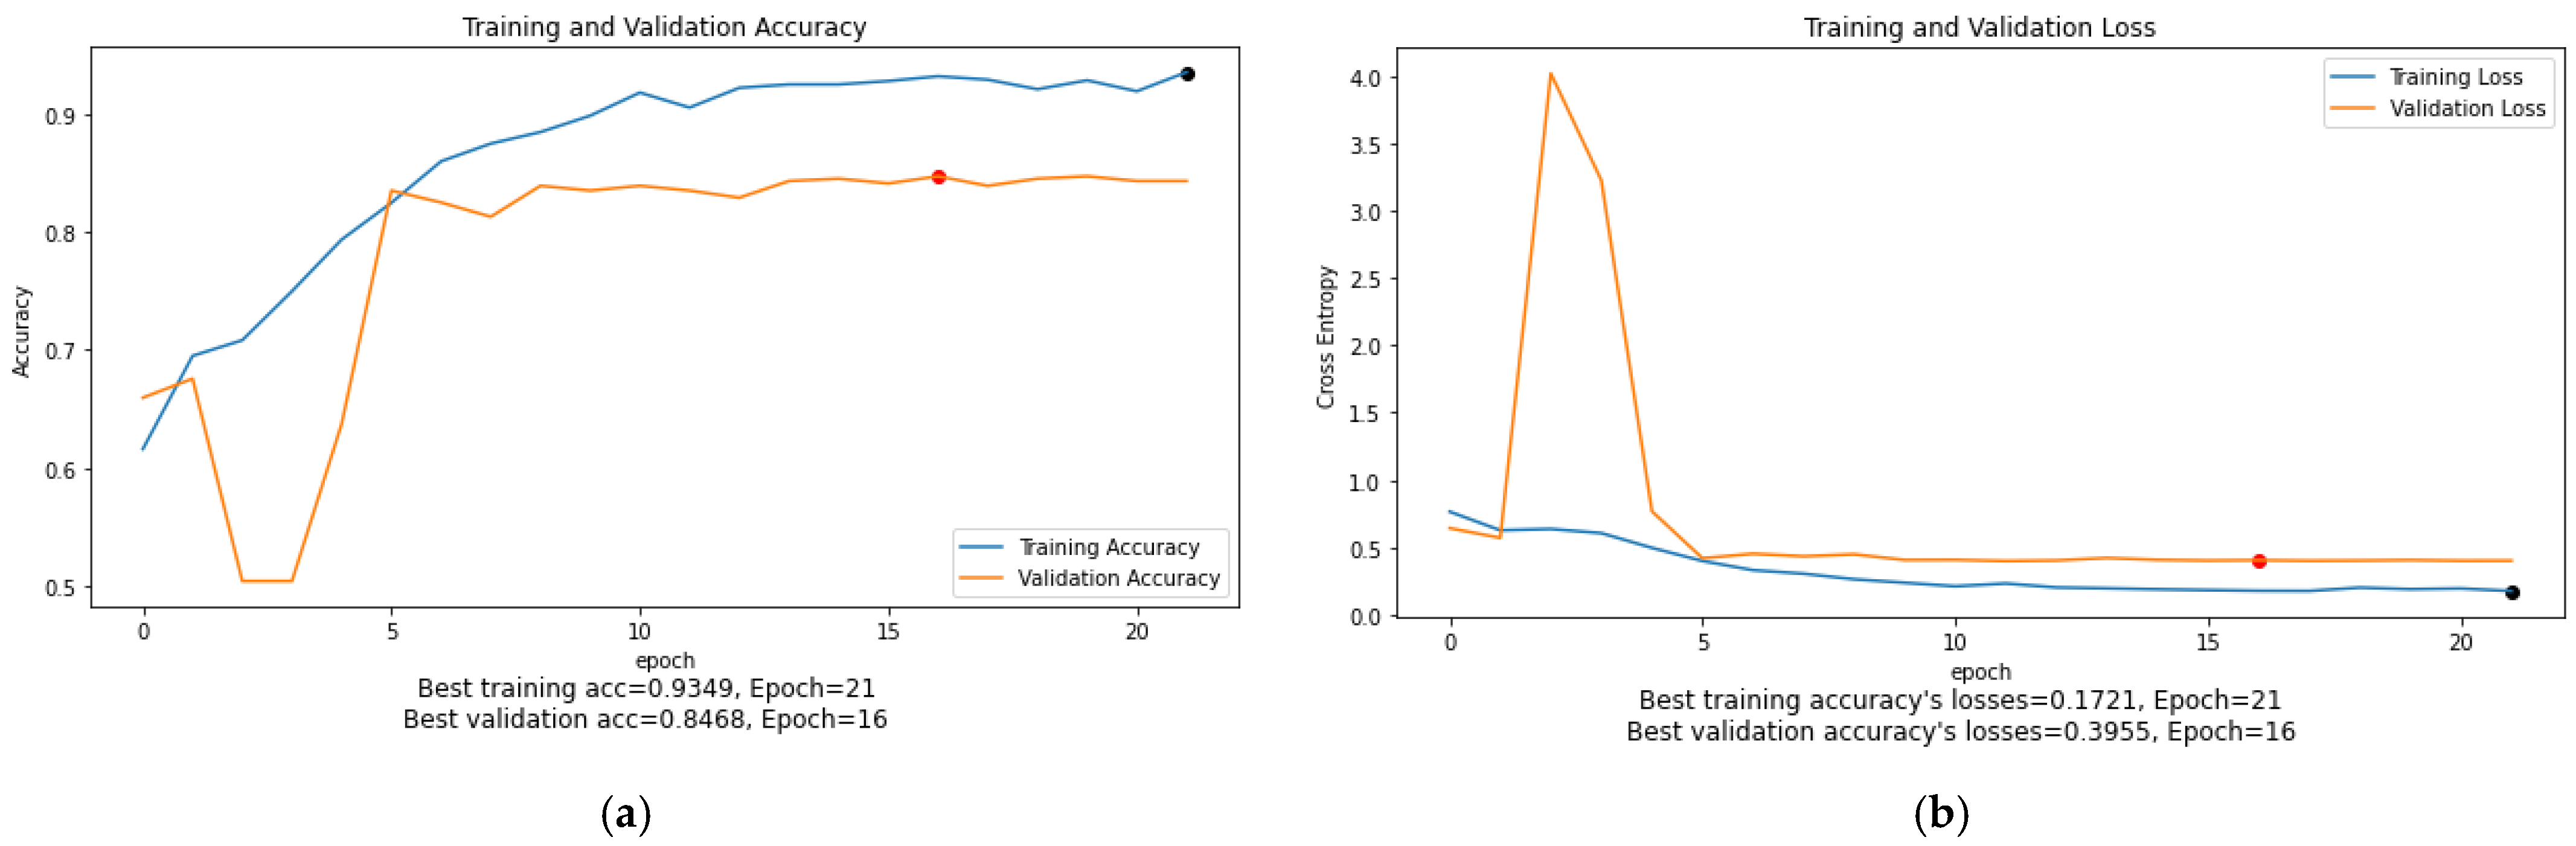
Figure 15, the training accuracy and loss graphs for each model generally show a smooth convergence pattern, indicating that the models are improving as they are exposed to more data. However, in some cases, there is a sudden fluctuation in the validation graphs, particularly when the ReduceLROnPlateau() function is triggered. For example, in
Figure 11b, the validation loss for the MobileNet model suddenly fluctuates on epoch 3. Similarly, in
Figure 14b, the validation loss of the ViT-B16 model shows sudden fluctuations in epochs 5 and 10. These sudden fluctuations in the validation loss at certain epochs could indicate that the model is overfitting, as the model is not generalizing well to unseen data. However, it is worth noting that after every fluctuation, the validation graph returns to the normal convergence pattern, indicating that the overfitting problem has been resolved to some extent. The ReduceOnPlateau() function is designed to reduce the learning rate when the model performance stops improving on the validation dataset, which can cause the validation loss to fluctuate and helps the model generalize better. The sudden fluctuation in the validation loss at a certain epoch is likely the point at which the learning rate is reduced. The reduced learning rate can make the model’s optimization steps smaller and prevent it from memorizing the training data. In this study, a model reached its best epoch when it obtained the highest validation accuracy with minimum loss before the EarlyStopping() function took place. The values of the best epoch for each model were highlighted in
Figure 10,
Figure 11,
Figure 12,
Figure 13,
Figure 14 and
Figure 15 with red dots. The weights of the best epoch were then selected to be used during the testing.
4.4. Comparisons with the State-of-the-Art Models
Table 10 compares the proposed InceptionV3 (GRAY+GRAY_HE+GRAY_CLAHE) and MobileNet (RGB) models to the previous studies on the COVID-19 classification. Although the previous sub-section concluded MobileNet (RGB) as the best model for this study, InceptionV3 (GRAY+GRAY_HE+GRAY_CLAHE) is also included in
Table 10 to demonstrate further the effectiveness of the proposed GRAY+GRAY_HE+GRAY_CLAHE image representation in designing a more accurate COVID-19 classification model. To provide a fair comparison, only the works that used the same dataset as the present study were selected for comparison. Based on the findings in
Table 10, both our proposed models outperformed all the models used by [
18,
23,
28,
34,
35,
44]. There were significant differences between our proposed models and the Redesigned COVID-Net [
18], VGG19+DenseNet169 [
28], and VGG16+MI [
23]. On the other hand, the ViT+Siamese encoder proposed by [
35] showed a comparative performance to our models, with a 99.13% accuracy. Nevertheless, the MobileNet (RGB) and InceptionV3 (GRAY+GRAY_HE+GRAY_CLAHE) still have better accuracy than the ViT+Siamese encoder model, with 99.60%. Although InceptionV3 (GRAY+GRAY_HE+GRAY_CLAHE) in the present study showed slightly lower sensitivity than MobileNet (RGB), this model outperformed the state-of-the-art models in both accuracy and sensitivity metrics, thus, confirming the effectiveness of the proposed GRAY+GRAY_HE+GRAY_CLAHE image representation in improving the performance of the COVID-19 classification model.
4.5. Additional Experiment
To further demonstrate the contribution of the proposed GRAY+GRAY_HE+GRAY_CLAHE image representation in improving the DL models’ performance, an additional experiment was conducted by using a different dataset. The dataset used in the additional experiment is an extension of the SARS-CoV-2 dataset, called New_Data_CoV2, produced by the same authors. It is publicly available at
https://www.kaggle.com/plameneduardo/a-covid-multiclass-dataset-of-ct-scans (accessed on 4 October 2022). During the experiment, the dataset is partitioned in a way that there are no overlapping patients in the training, validation, and testing datasets. In other words, we ensure that the CT images belonging to a specific patient in training would not have appeared in the testing data.
Table 11 presents the dataset partition in detail. In this experiment, only the two competing models from the previous experiments are included (MobileNet and InceptionV3). The dataset is distributed in such a way that the number of unique patients in the training, validation and testing sets are 70%, 20%, and 10% of the total patients available in the New_Data_CoV2 dataset, respectively. In order to ensure the reproducibility of the results, the Python function’
random.seed(123)’ was employed during the distribution of the training, validation, and testing patients. It should be noted that all patients in each dataset are unique.
Table 12 and
Table 13 compare the average performance of the MobileNet and InceptionV3 models on RGB and GRAY+GRAY_HE+GRAY_CLAHE image representations. The results indicate that both models perform better when trained on the GRAY+GRAY_HE+GRAY_CLAHE than RGB image representation. In
Table 12, the MobileNet model achieves an improvement of 1.48% in accuracy, 0.98% in precision, 2.57% in recall and 2.10% in F1-Score when using the GRAY+GRAY_HE+GRAY_CLAHE image representation. The GRAY+GRAY HE+GRAY CLAHE image representation increases the InceptionV3 model’s accuracy by 0.37%, precision by 3.65%, recall by 4.38%, and F1-Score by 2.48% (as shown in
Table 13). The GRAY+GRAY_HE+GRAY_CLAHE representation enhances the contrast of the grayscale image, making it easier for the model to extract relevant features. Additionally, the GRAY+GRAY_HE+GRAY_CLAHE representation provides more information than the RGB representation, which allows the model to learn more robust features. This additional information enables the model to generalize better on unseen data.
In addition,
Table 14 presents the performance per class of the MobileNet and InceptionV3 models on both RGB and GRAY+GRAY_HE+GRAY_CLAHE image representations using the New_Data_CoV2 dataset. A significant difference can be observed between the performance of all the models for the Healthy class and the COVID-19 class, with the models’ performance for the Healthy class generally being lower than the COVID-19 class. This may be attributed to the imbalanced data distribution of the new dataset used for the additional experiments. However, focusing on the models’ performance for the COVID-19 class, the InceptionV3 (GRAY+GRAY_HE+GRAY_CLAHE) outperformed the InceptionV3 (RGB) in both accuracy and recall. This suggests that the InceptionV3 model is 6.22% more sensitive to COVID-19 cases when using the GRAY+GRAY_HE+GRAY_CLAHE image representation.
With the MobileNet model, the use of the GRAY+GRAY_HE+GRAY_CLAHE image representation has not resulted in an improvement in accuracy and recall. Still, it has resulted in a slight increase in precision and F1-score for the COVID-19 class. It is important to note that the improvement in performance is not solely due to the GRAY+GRAY_HE+GRAY_CLAHE image representation but also a combination of the model’s architecture, image representation, and pre-processing techniques applied. Nonetheless, the proposed GRAY+GRAY_HE+GRAY_CLAHE image representation has shown significant potential for the advancement of automated CT-based COVID-19 screening when applied to compatible DL architectures.
5. Conclusions
This paper proposed an enhanced three-channel grayscale image representation, referred to as GRAY+GRAY_HE+GRAY_CLAHE, using two enhancement methods, namely Histogram Equalization (HE) and Contrast Limited Adaptive Histogram Equalization (CLAHE). A comprehensive experimental study was conducted, utilizing five image representations, namely RGB, GRAY3, GRAY3_HE, GRAY3_CLAHE, and GRAY+GRAY_HE+GRAY_CLAHE, in conjunction with six pre-trained models, namely InceptionV3, MobileNet, ResNet50, VGG16, ViT-B16, and ViT-B32. The results indicate that all CNN-based architectures outperform the ViT-based architecture in the binary classification of COVID-19 using CT images. Furthermore, the proposed GRAY+GRAY_HE+GRAY_CLAHE image representation was evaluated on two different datasets, SARS-CoV-2 CT-Scan and New_Data_CoV2, where it was found to be superior to RGB, GRAY3, GRAY3_HE, and GRAY3_CLAHE. The reported accuracy and recall for GRAY+GRAY_HE+GRAY_CLAHE on SARS-CoV-2 CT-Scan are 99.60% and 99.59% using the InceptionV3 model, respectively. The reported accuracy and recall for GRAY+GRAY_HE+GRAY_CLAHE on New_Data_CoV2 are 93.36% and 89.23% using the MobileNet model, respectively. Overall, the proposed GRAY+GRAY_HE+GRAY_CLAHE image representation has demonstrated significant potential for the advancement of automated CT-based COVID-19 screening when applied to compatible DL architectures. This study provides a diverse comparative analysis that includes CNN-based architecture and vision-transformer models and offers insights into how image representations can be utilized to improve the recognition ability of classification models.

 ,
, 


