1. Introduction
Inducer cavitation instabilities can cause serious noise and vibration, which may result in the failure of the propulsion system. Therefore, their types and identification have received significant attention. For instance, Tsujimoto et al. [
1] observed various cavitation instabilities that occurred in a three-bladed inducer and categorized them into local instabilities such as super-synchronous rotating cavitation and global instabilities such as cavitation surge. Similarly, Cervone et al. [
2] experimentally observed a cavitation instability called alternate blade cavitation in a two-bladed inducer. These various cavitation instabilities have different frequency and spatial mode characteristics, which can be identified using Fourier transformation and circumferential unsteady pressure measurements.
Various analytical models have been suggested to predict cavitation instability and analyze its mechanism. Tsujimoto et al. [
3] used an actuator disk method to predict rotating cavitation, where quasi-steady lumped parameters, such as mass flow gain factor and cavitation compliance, were introduced. The study showed that the mass flow gain factor plays a key role in the cavitation instability. Similarly, Watanabe et al. [
4] and Horiguchi et al. [
5] performed stability analysis using the singularity method, predicting various cavitation instabilities, including forward and backward propagating rotating cavitation. However, these methods cannot adequately reflect the 3-D nature of the inducer cavitation, which is primarily composed of tip leakage vortex cavitation (TLVC). Previous studies showed TLVC has a highly complex 3-D structure including severe turbulence, rather than having a quasi-steady feature with glossy surfaces which can be observed in 2-D sheet-type cavities. Cheng et al. [
6] suggested the development of the TLVC would significantly alter the vorticity and turbulence kinetic energy distribution of the flow field, and due to the complex flow features, there is still no simple way to control the TLVC. Also, Cheng et al. [
7] performed a Large Eddy Simulation (LES) and showed that the large amount of turbulent kinetic energy is produced around the TLVC region due to the interaction between three different vortex structures (tip leakage vortex, tip separation vortex, and induced vortex). Hence, 3-D numerical approaches and experiments have been conducted to investigate the cavitation instability mechanism. For instance, Kang et al. [
8] conducted 3-D numerical simulations, showing that cavitation instabilities begin to occur when the cavity on a blade interacts with the adjacent blade leading edge. Additionally, Kim and Song [
9] performed an experimental investigation on rotating cavitation, demonstrating that cavitation reduces the incidence of the following blade using particle image velocimetry (PIV) and high-speed visualization. Nevertheless, although these studies proposed the mechanism of blade-to-blade interaction for cavitation instability, only a few selected cases have been examined in the research.
Therefore, the present research investigates the interaction between the cavity and the flow field under various operating conditions for a two-bladed inducer, using PIV to quantify the change in the velocity field around the blade leading edge. Furthermore, the study aims to analyze the blade-to-blade interaction under alternate blade cavitation.
3. Experiment Results and Discussion
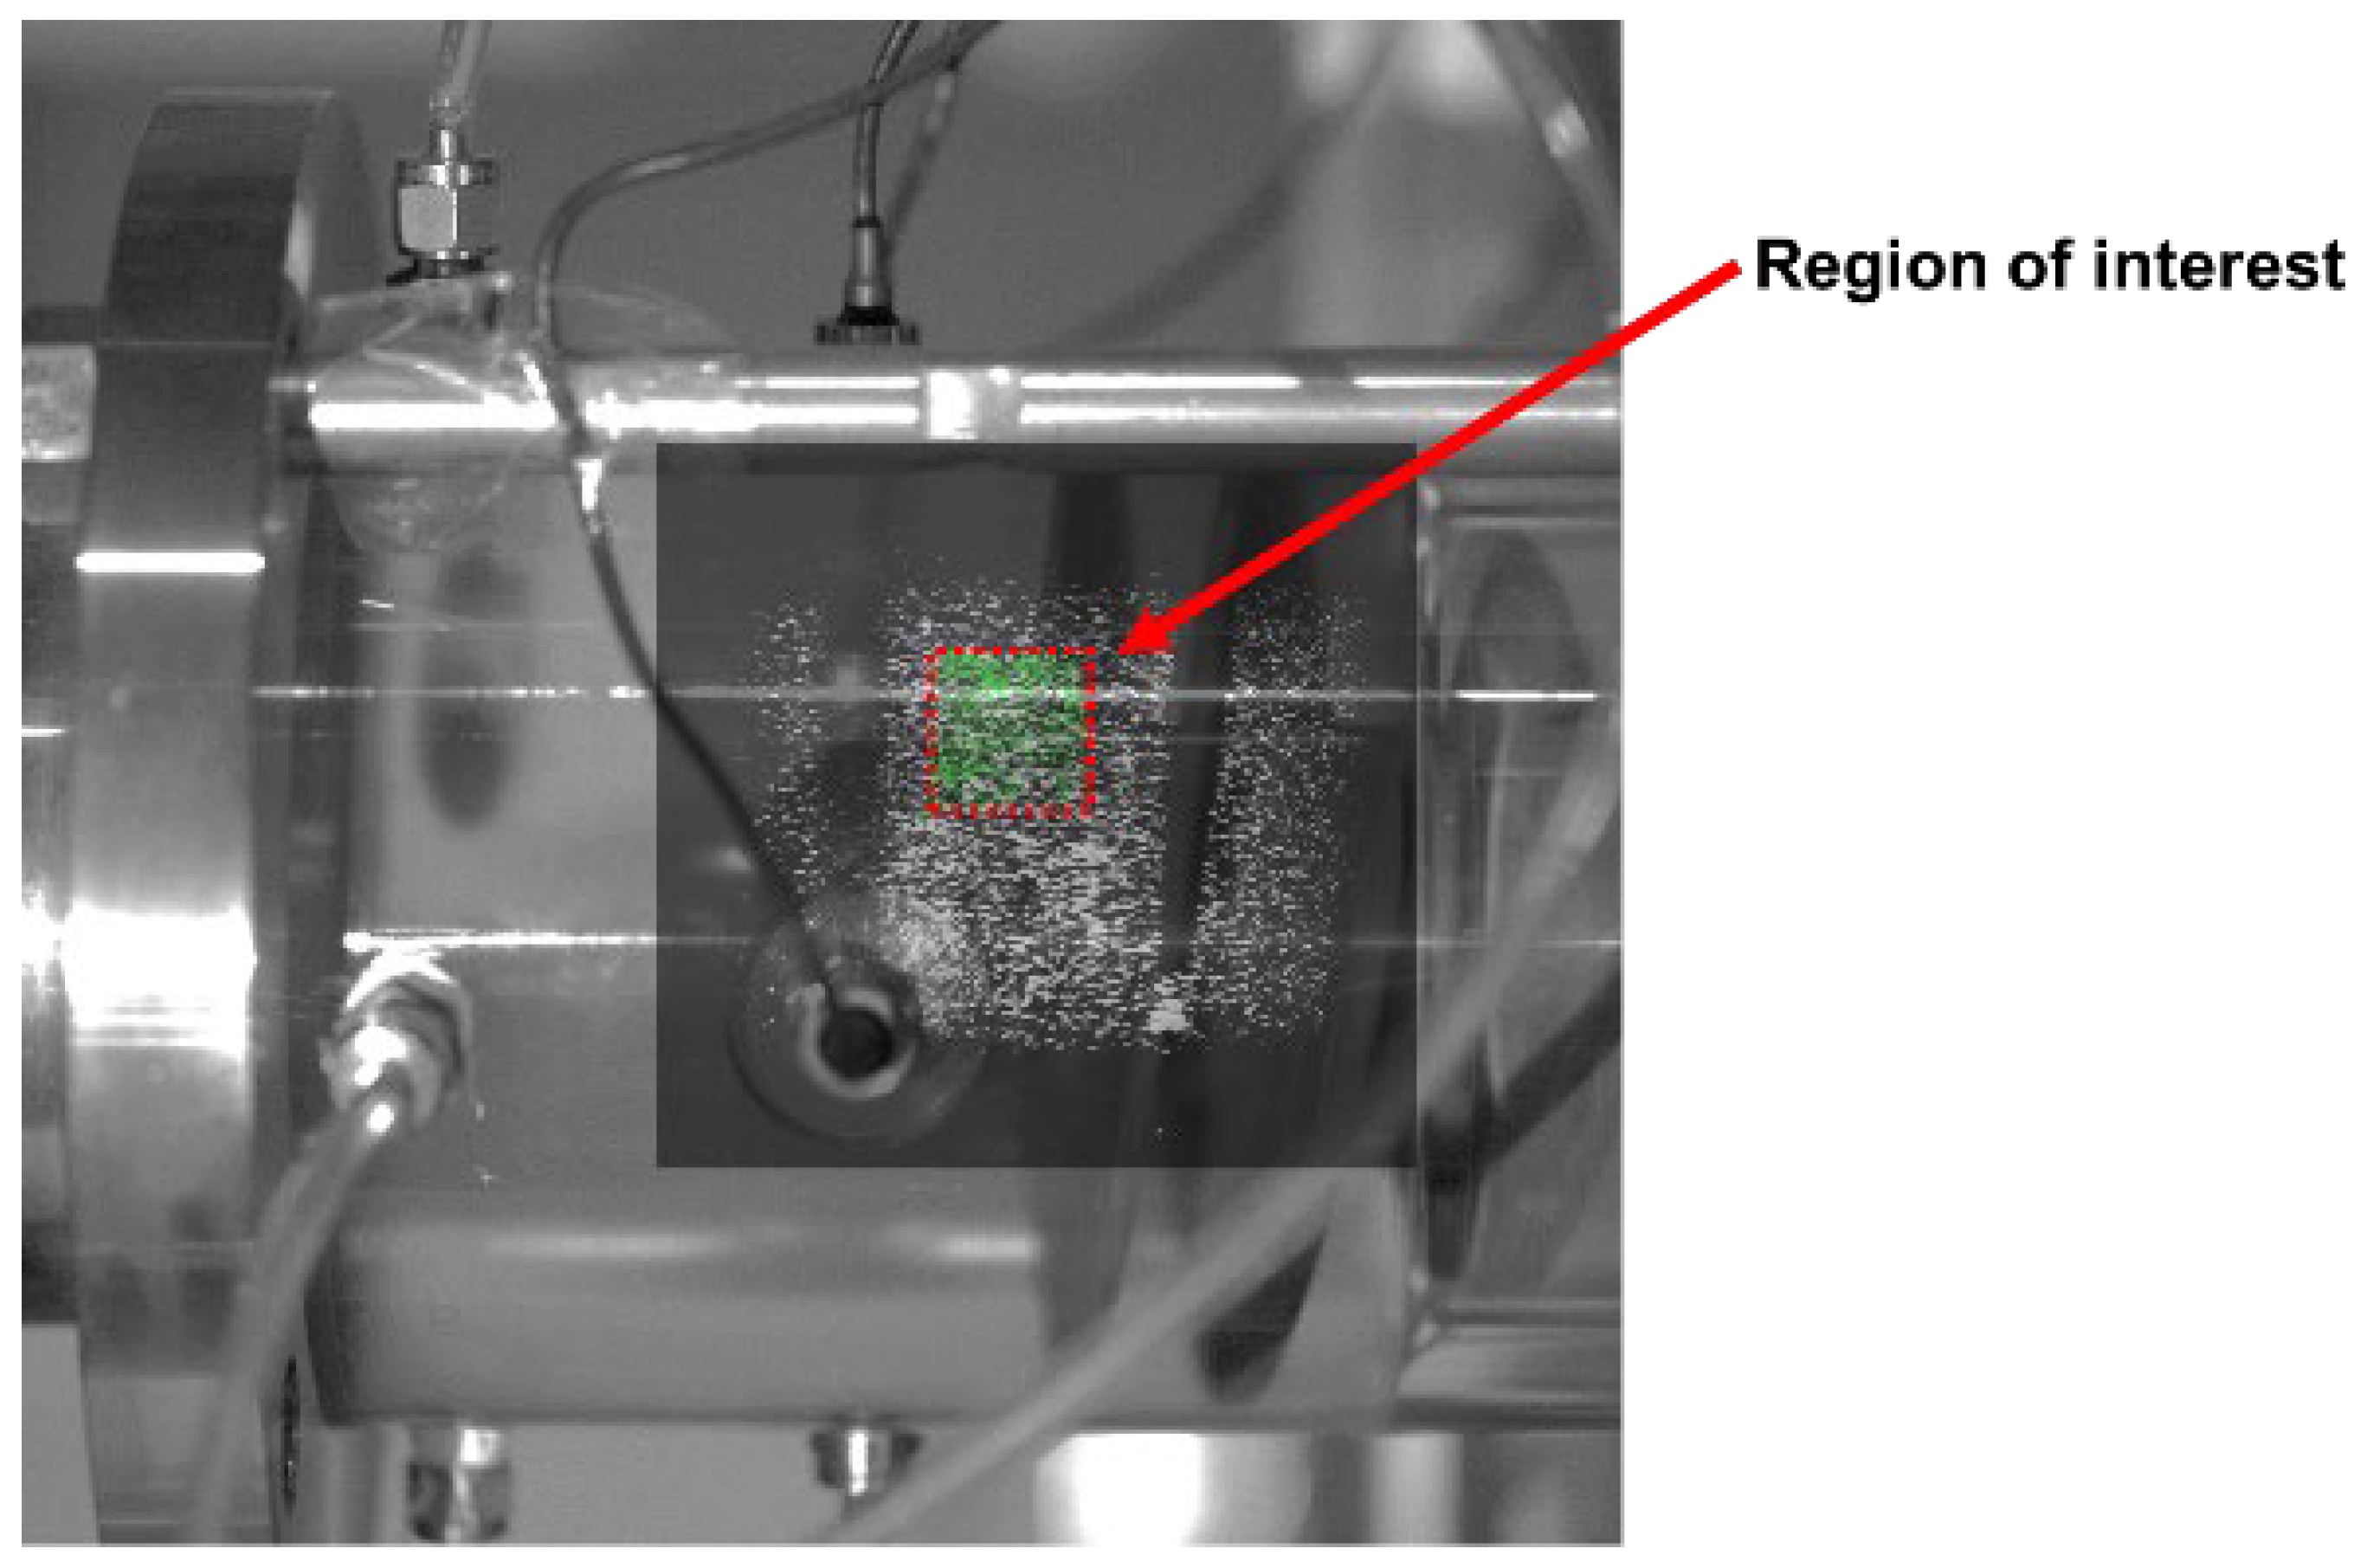
To quantify the blade-to-blade interaction, the flow field near the blade leading edge was obtained under non-cavitating conditions and averaged over a region of interest, as shown in
Figure 3.
The background image in
Figure 3 is a raw image captured under continuous lighting using a high-speed camera. Overlapped particle images were obtained under pulsed laser lighting, and the resulting velocity vectors are shown in green. The red dotted box indicates the area over which the velocity vectors were averaged to determine the mean velocity vector near the blade leading edge.
At the cavitating condition, the same calculation was performed, and the difference between the mean velocity vectors was obtained. Under alternate blade cavitation, the leading edges of the two blades were treated separately due to the asymmetry of the cavity. Finally, these velocity differences were converted to changes in the incidence in the rotating frame, . In the present study, was used to represent the blade-to-blade interaction. (In this study, incidence (), which is defined as the difference between the flow angle () and the blade angle (), was used instead of angle of attack. Although the numerical difference between the two values is small due to the small camber angle of the inducer blade, incidence is more suitable for the turbomachinery analysis conducted in this paper).
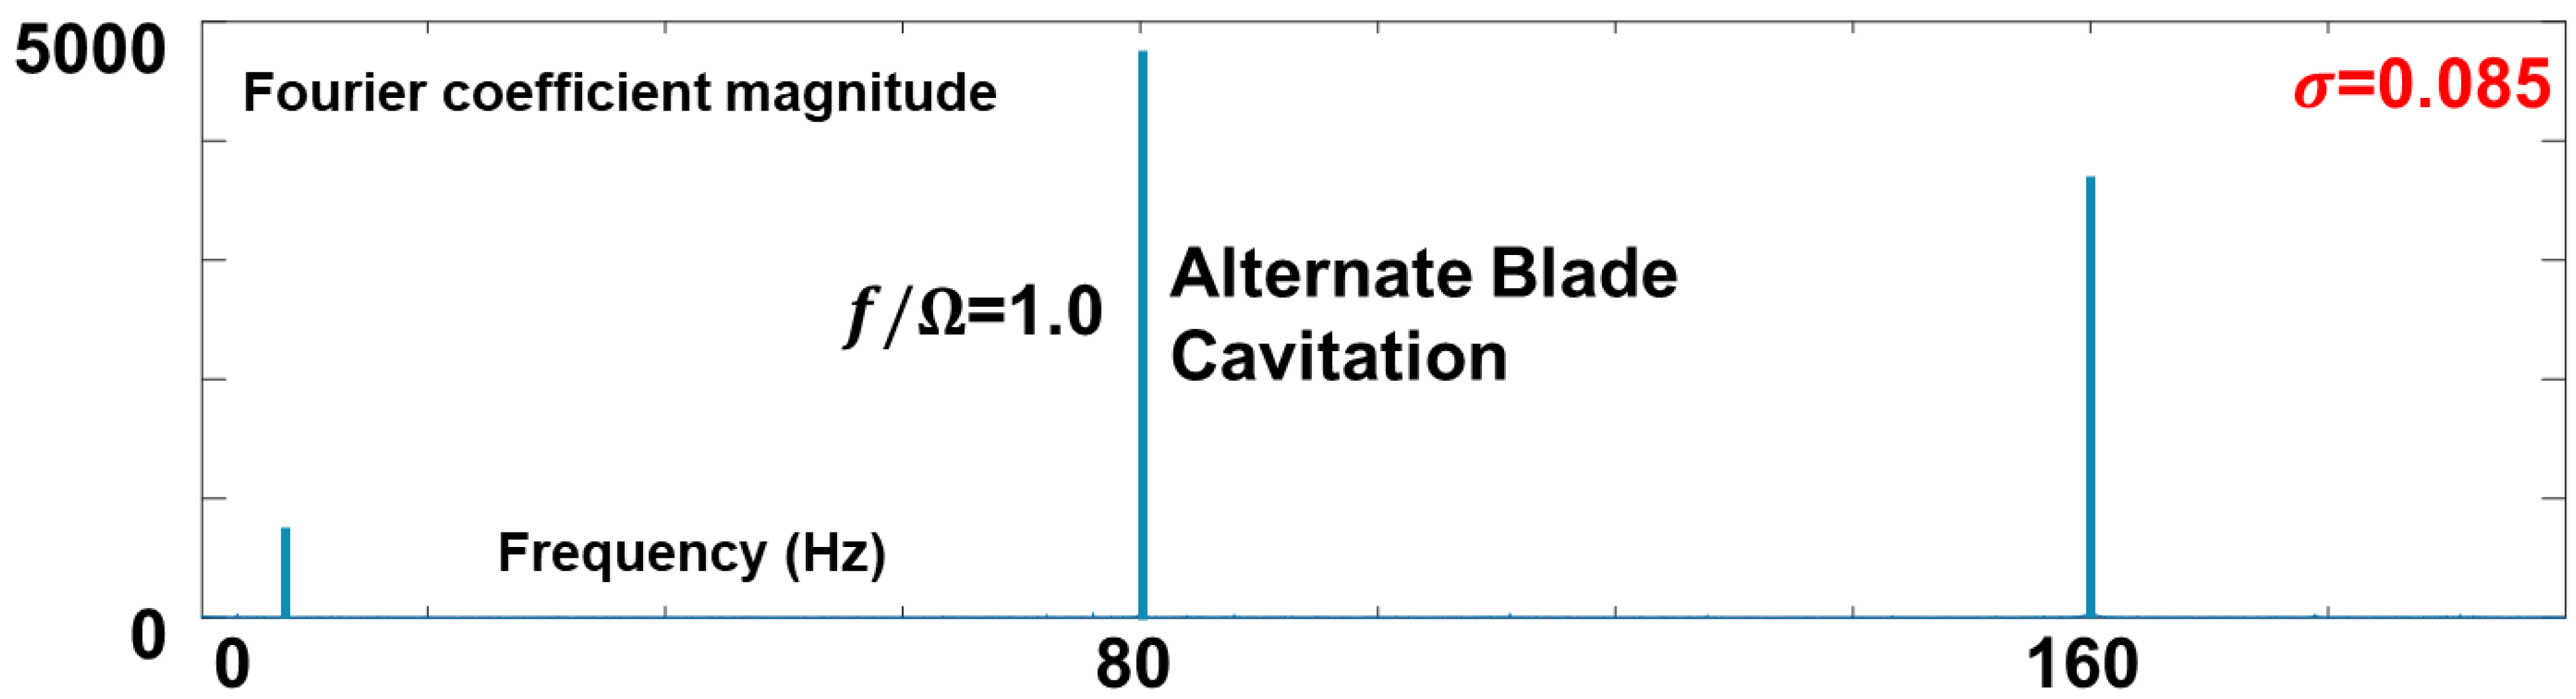
In this study, the occurrence of alternate blade cavitation was examined using unsteady pressure measurements at the inducer casing inlet. At a distance of 0.15
D upstream of the inducer tip leading edge (where
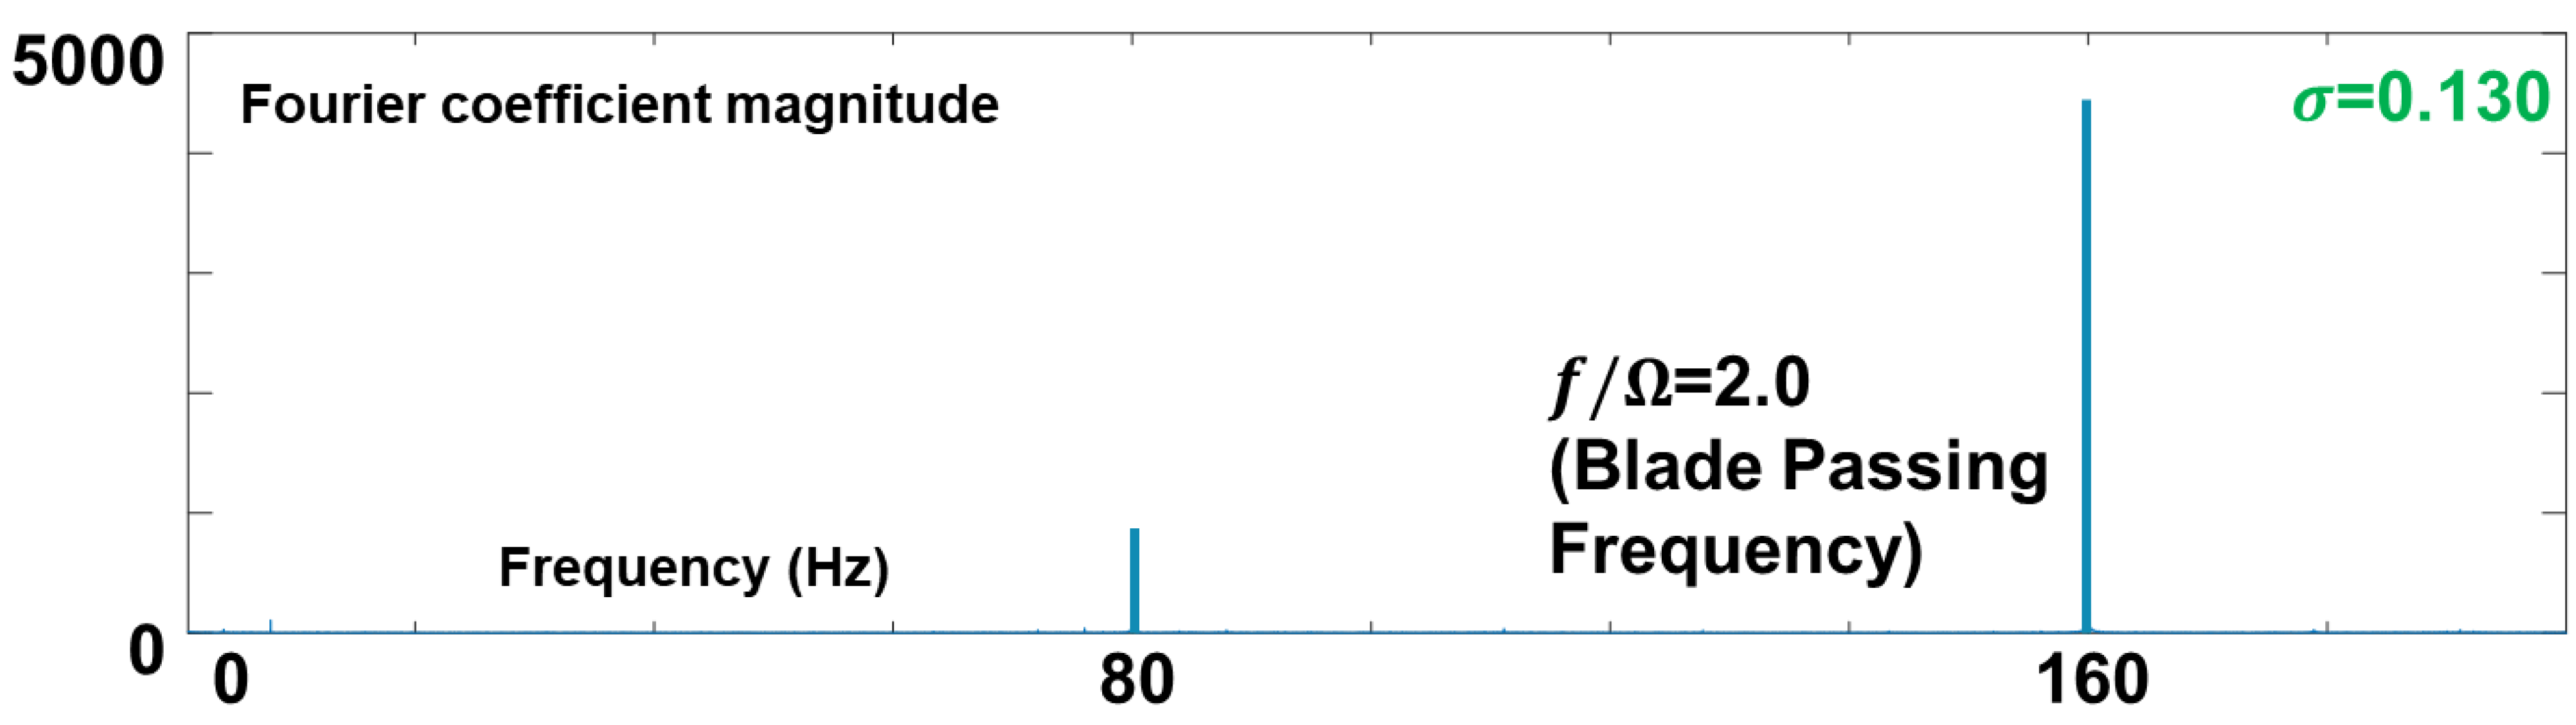
D is the inducer casing diameter), an unsteady pressure transducer was flush-mounted, and the data was sampled at 2000 samples per second. As the cavitation number was decreased during the experiment, the unsteady pressure signal, with its DC component filtered out, was Fourier-transformed to examine the alternate blade cavitation. The results of the Fourier transformation are shown in
Figure 4 and
Figure 5 for equal length cavitation and alternate blade cavitation, respectively. In both cases, a peak was observed at a normalized frequency of 2 due to the blade passing frequency of the two-bladed inducer. However, if the system was under alternate blade cavitation, as shown in
Figure 5, a peak at a normalized frequency of 1 (which equals the shaft rotating frequency) was excited due to the asymmetry of the alternate blade cavitation.
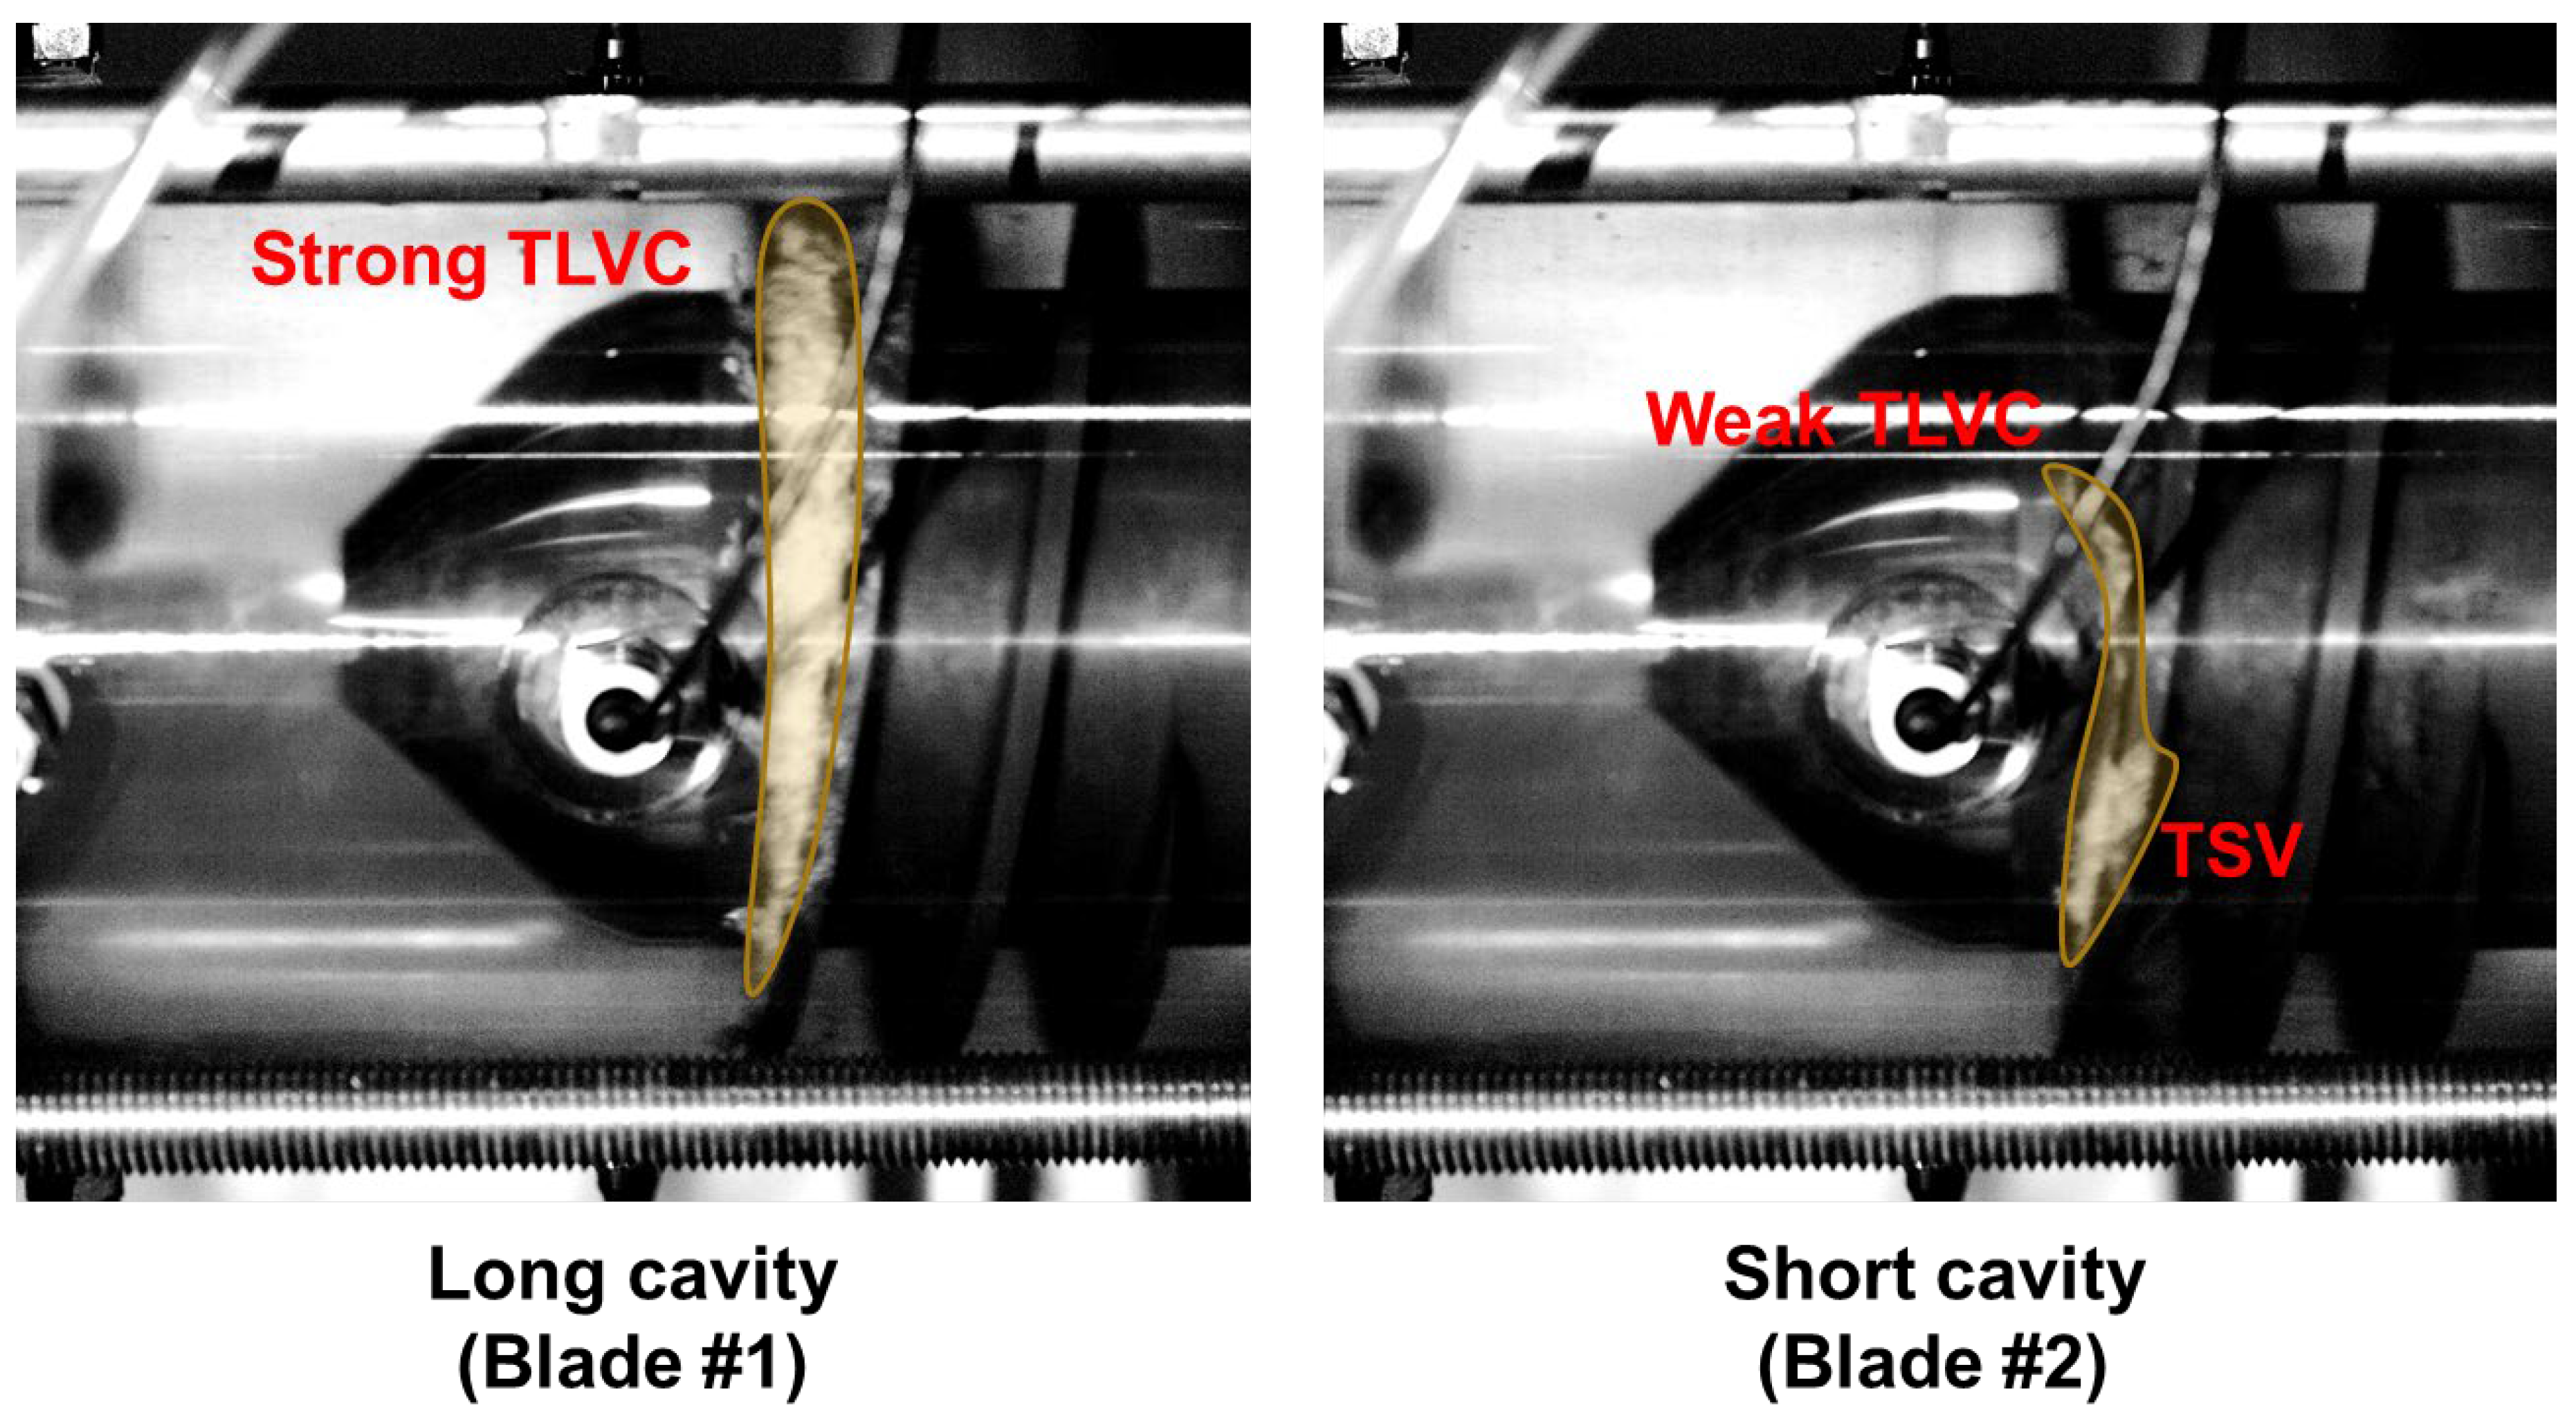
Figure 6 visually demonstrates the asymmetry of cavity development under alternate blade cavitation, where both long and short cavities are developed on different blades, forming an asymmetric pattern that remains stationary in the rotating frame. Therefore, the peak at a normalized frequency of 1 was used to judge whether the alternate blade cavitation occurred, and its magnitude represented the strength of the instability. In the experiment, both the magnitude of the Fourier coefficient and the difference between the two cavity lengths showed the same trend, and thus both were used to represent the magnitude of the alternate blade cavitation.
Figure 6 also shows the 3-D nature of the cavity on the current inducer. Due to the back-swept leading edge of the inducer, 2-D sheet-type cavity at the hub region is suppressed, and most of the cavity is developed at the tip region. At the tip region, pressure difference between the pressure side and suction side of the blade drives the fluid to go through the tip clearance. This tip clearance flow creates a shear layer with the main flow and, consequently, vortex is generated (tip clearance vortex). While low pressure region is created at the vortex core, cavitation occurs inside the vortex (TLVC). Additionally, TLVC shows highly intermittent behavior because of the large turbulent kinetic energy at the vortex region [
5,
6]. Thus, rather than glossy surface, bubbly surface is observed as a bright region from the high-speed visualization. Cavitation at the tip separation vortex region shown in the right side of
Figure 6 further indicate the tip clearance flow is the main source of cavitation for the test inducer.
Due to the strong axial flow induced by the collapsing cavity,
has a negative sign in most situations.
Figure 7,
Figure 8 and
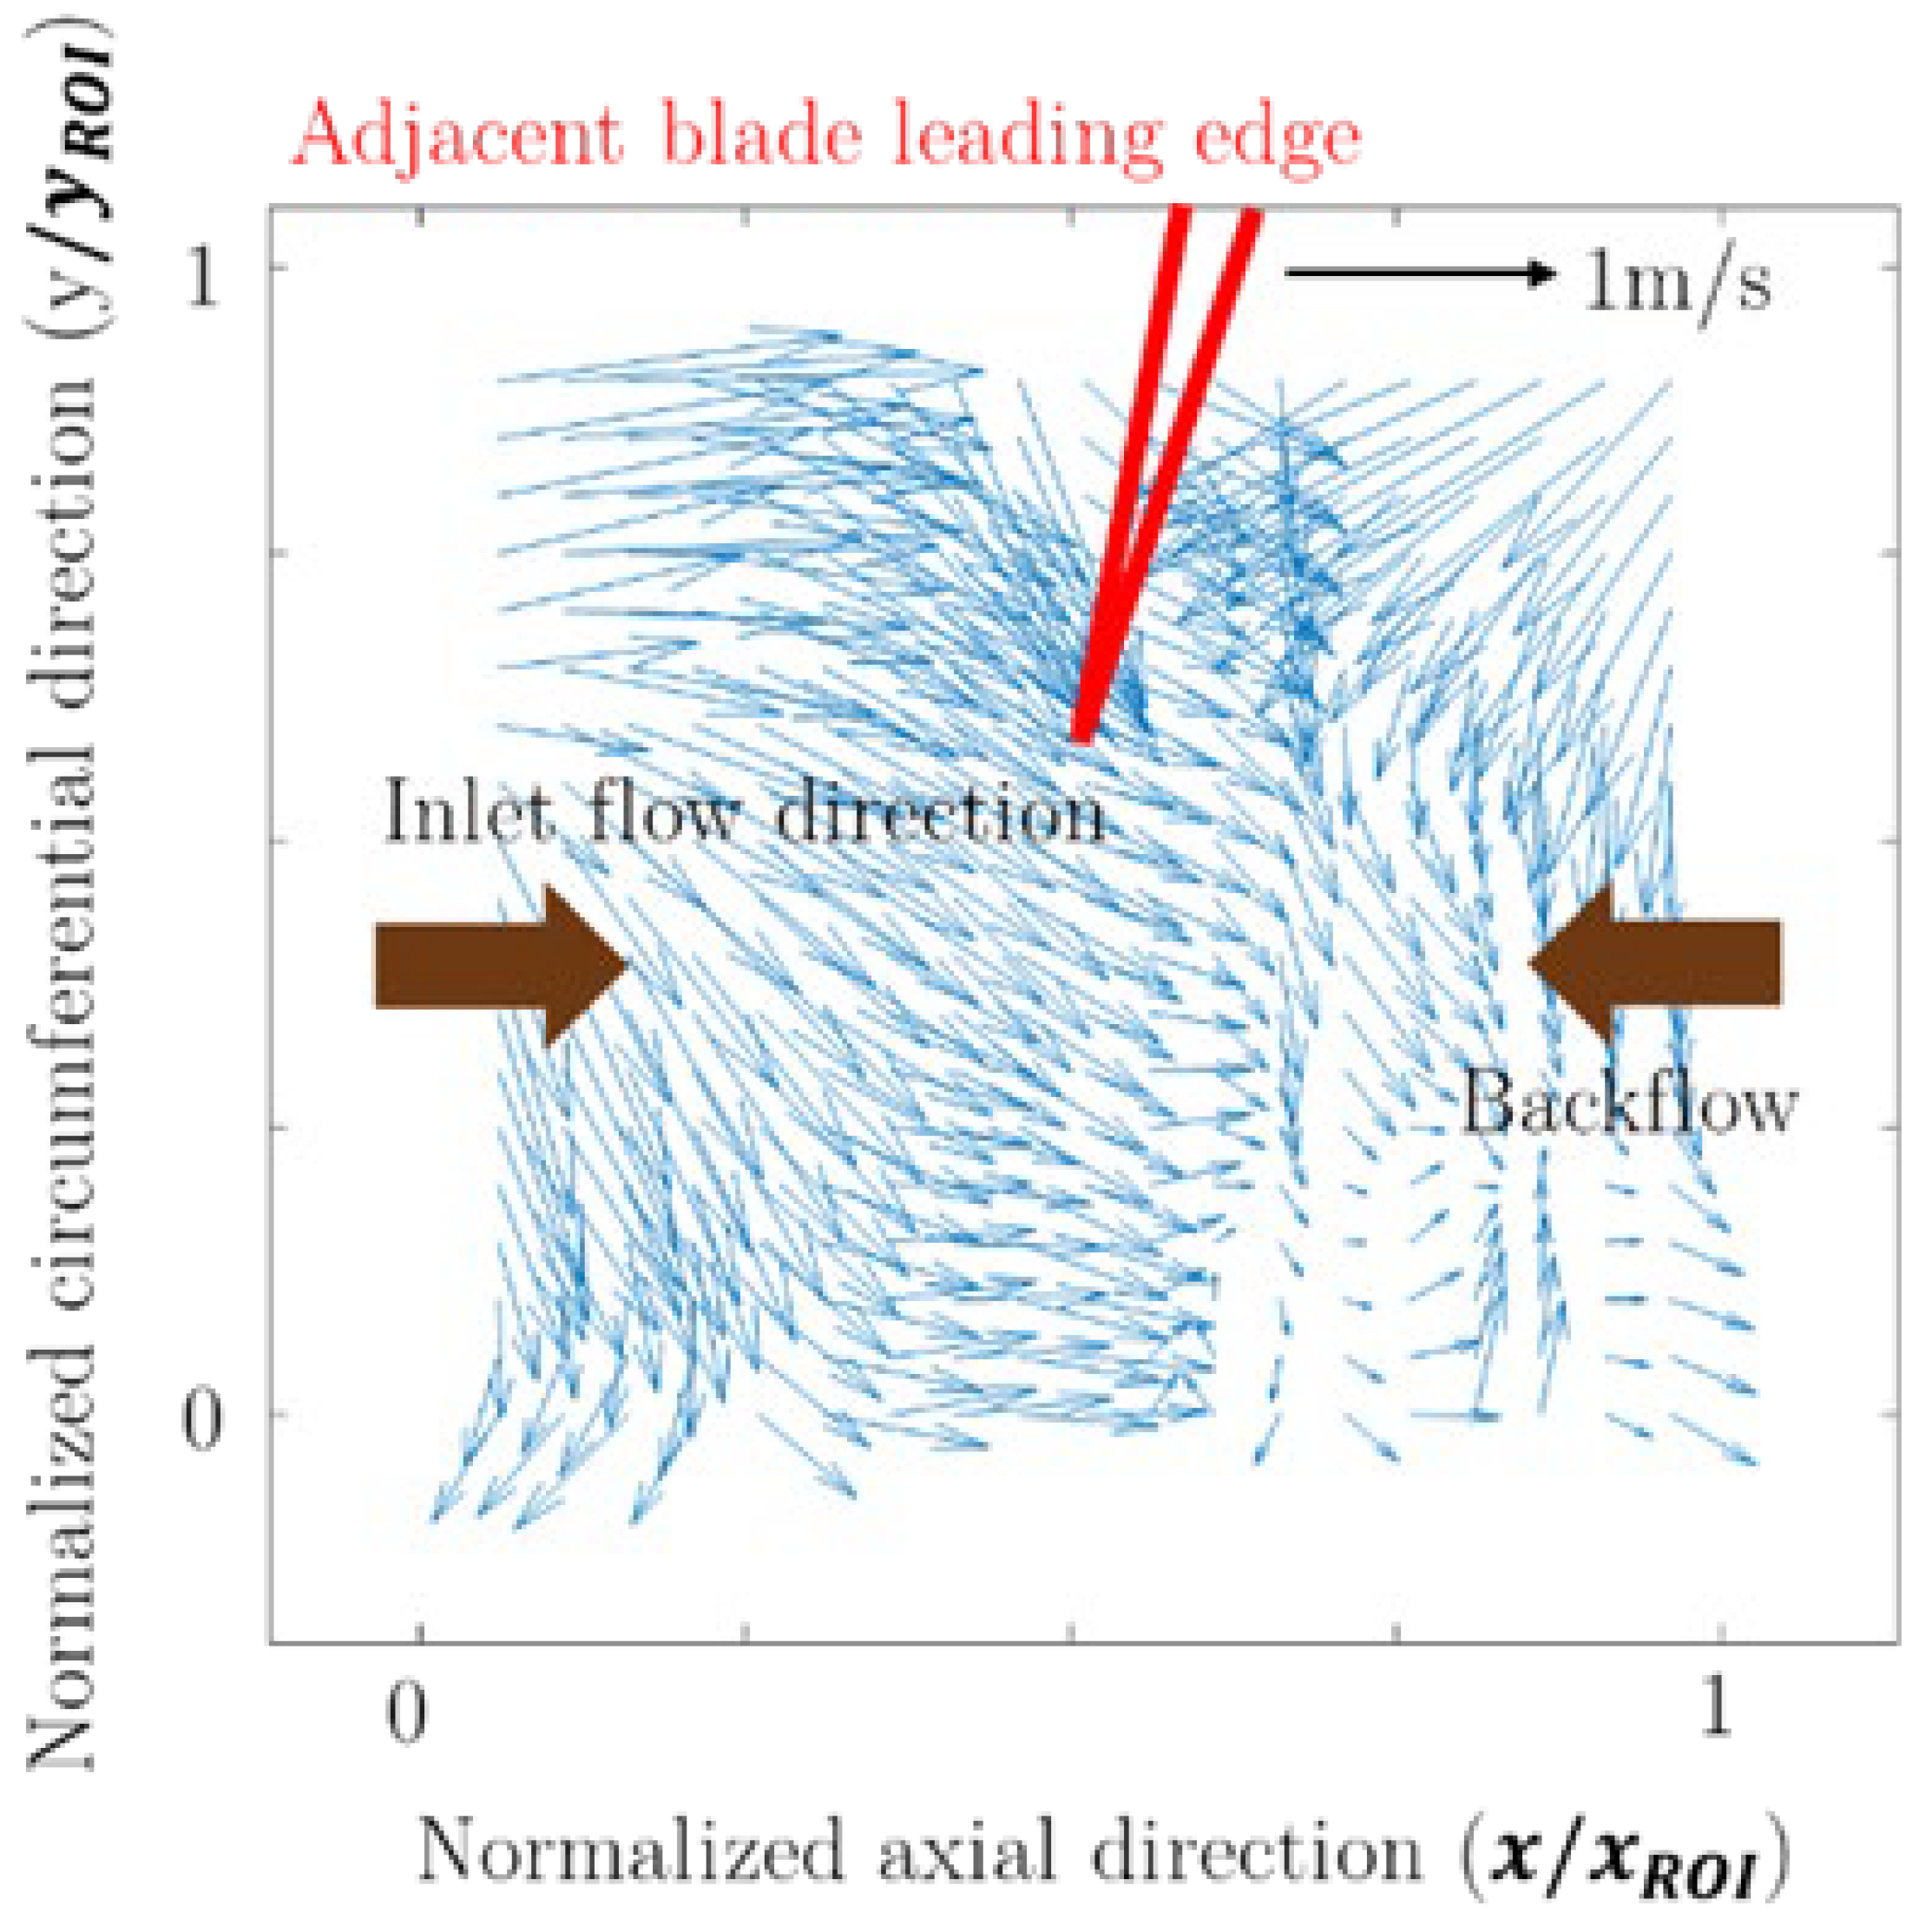
Figure 9 show the flow field vector plots at the PIV region of interest under non-cavitating conditions and alternate blade cavitation. The
x-axis and the
y-axis of the vector plots are normalized with the width and height of the region of interest (shown in
Figure 3). Thus, the square defined by the coordinate (0,0) and (1,1) corresponds to the entire region of interest. In
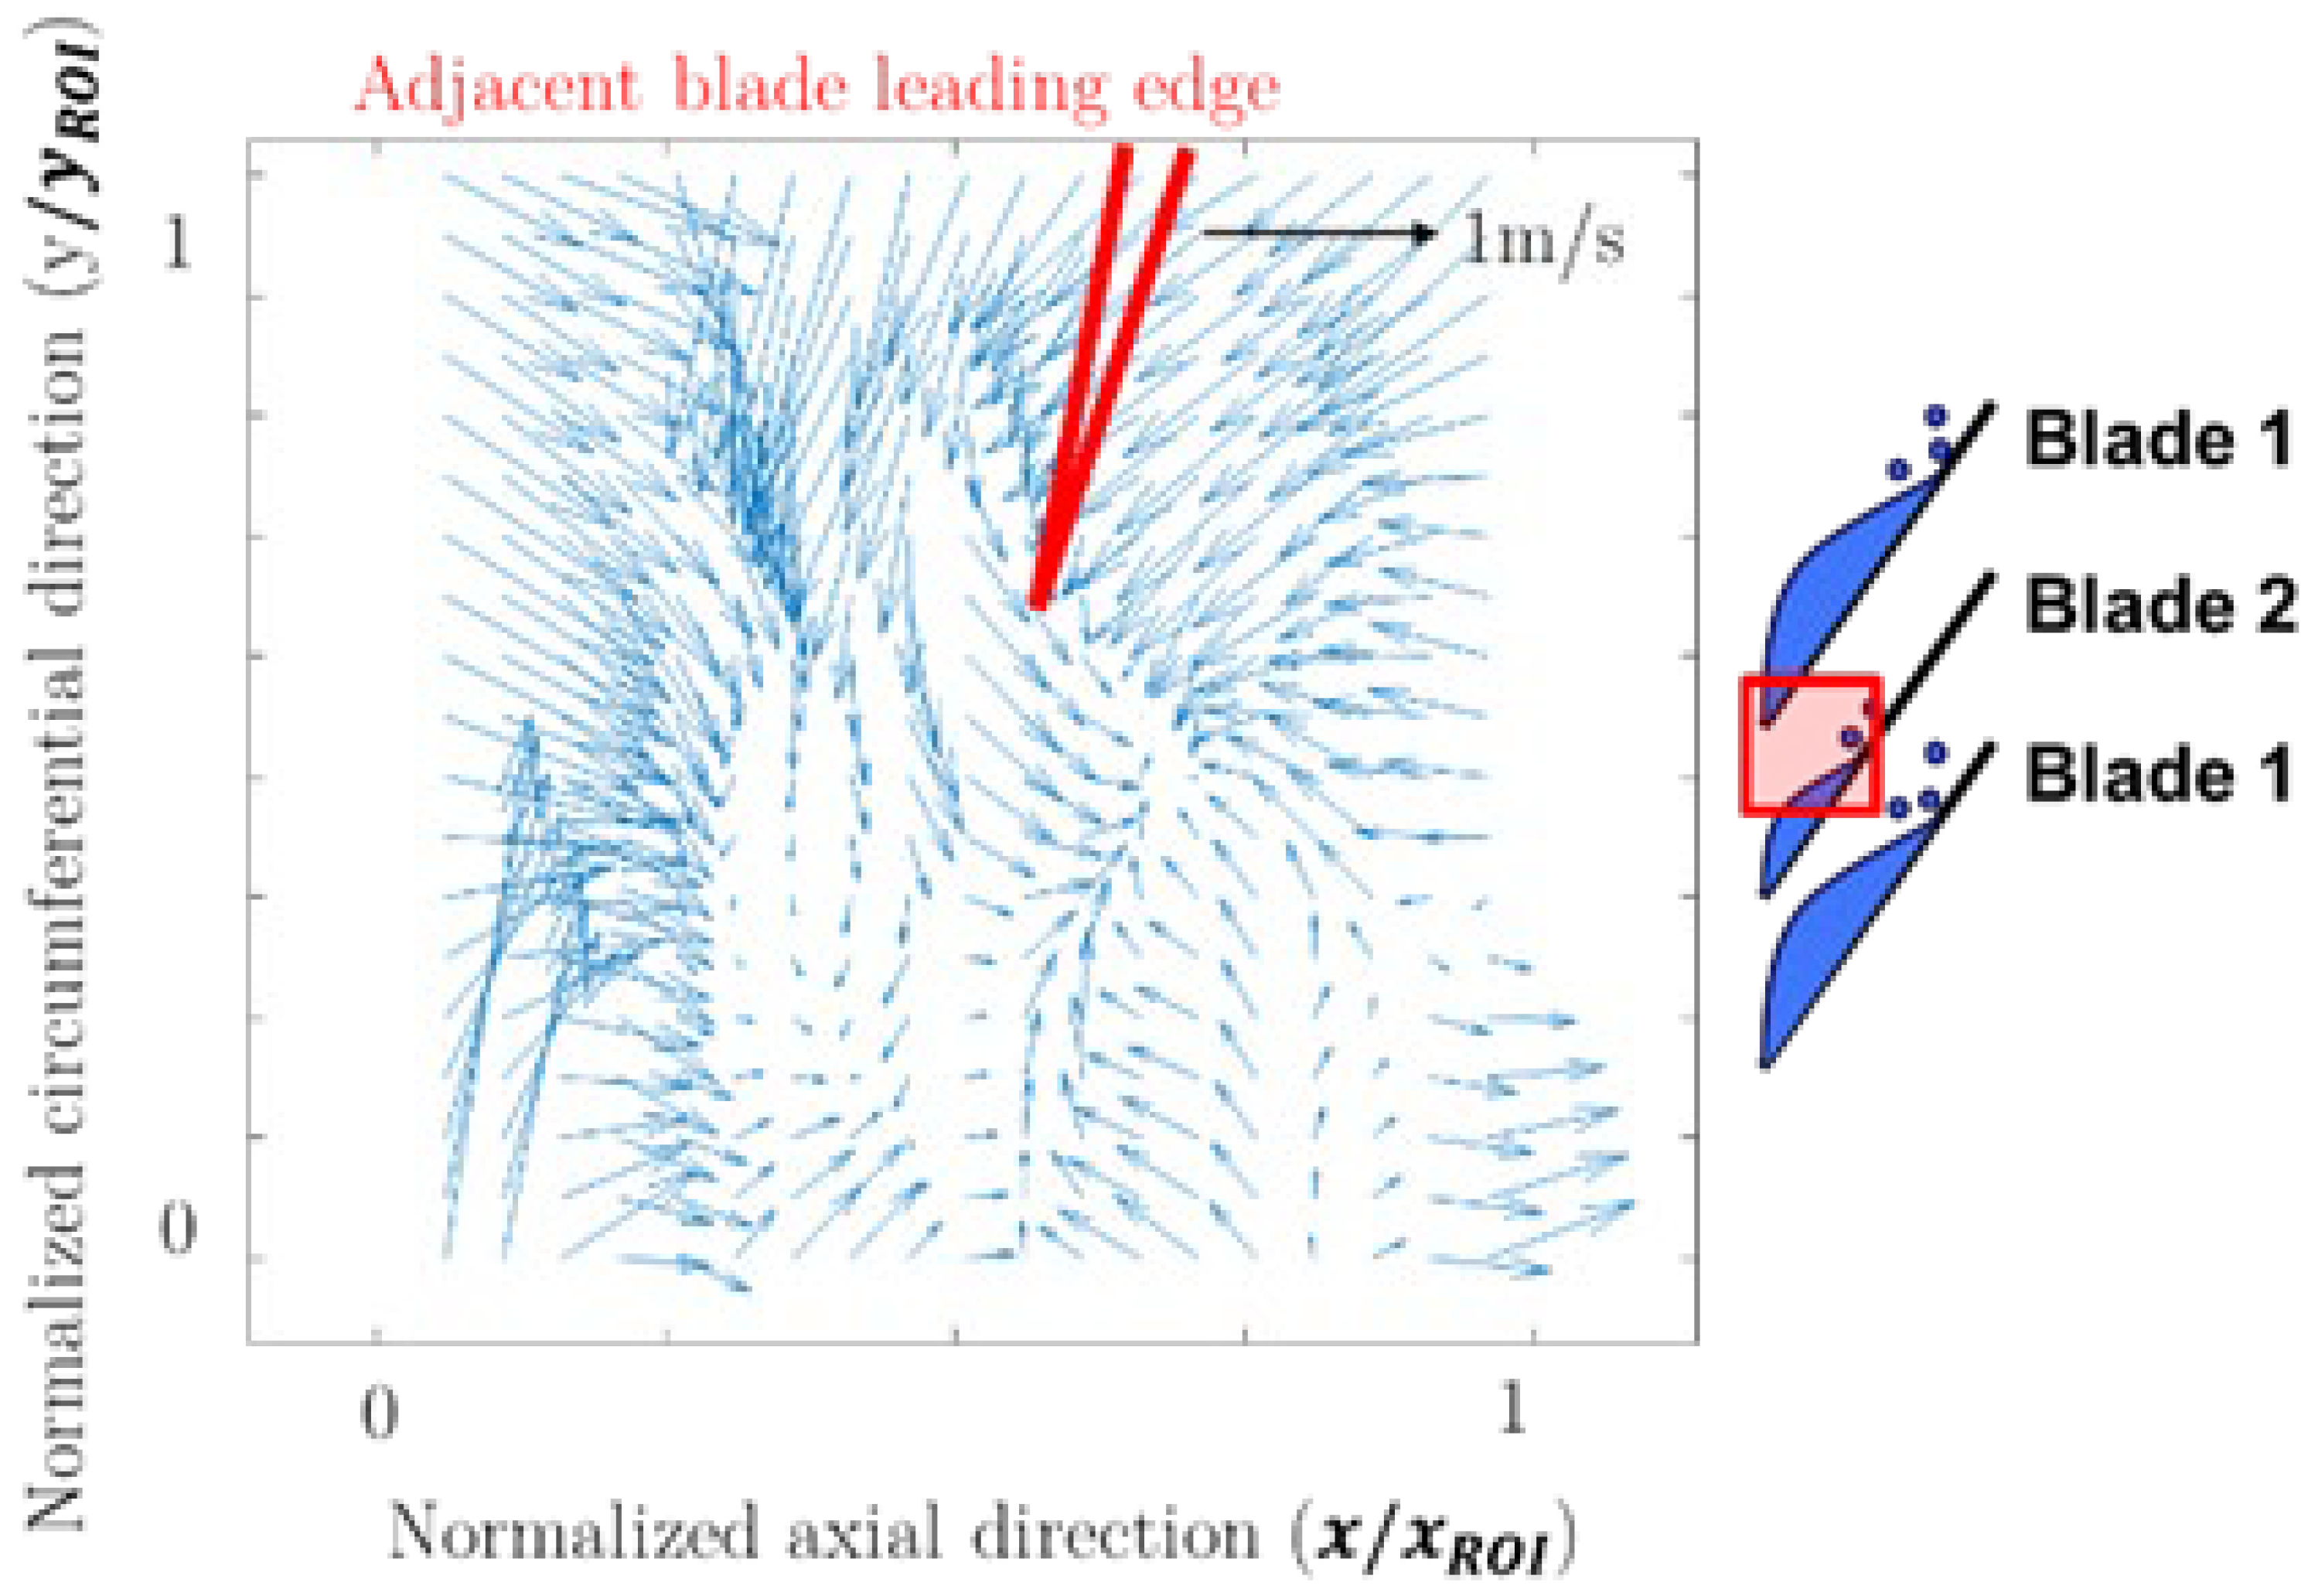
Figure 8 and
Figure 9, both blades 1 and 2 are shown to compare the effect of the larger and smaller cavities. In
Figure 7, it can be seen that backflow is developed near the blade leading edge due to the adverse pressure gradient of the inducer. In
Figure 8, a similar flow structure is developed near the blade 1 leading edge (blades are numbered as 1 and 2, corresponding to the blade with larger cavity and smaller cavity under alternate blade cavitation, respectively). Therefore, the smaller cavity induced at blade 2 is not developed enough to interact with the leading edge of the following blade.
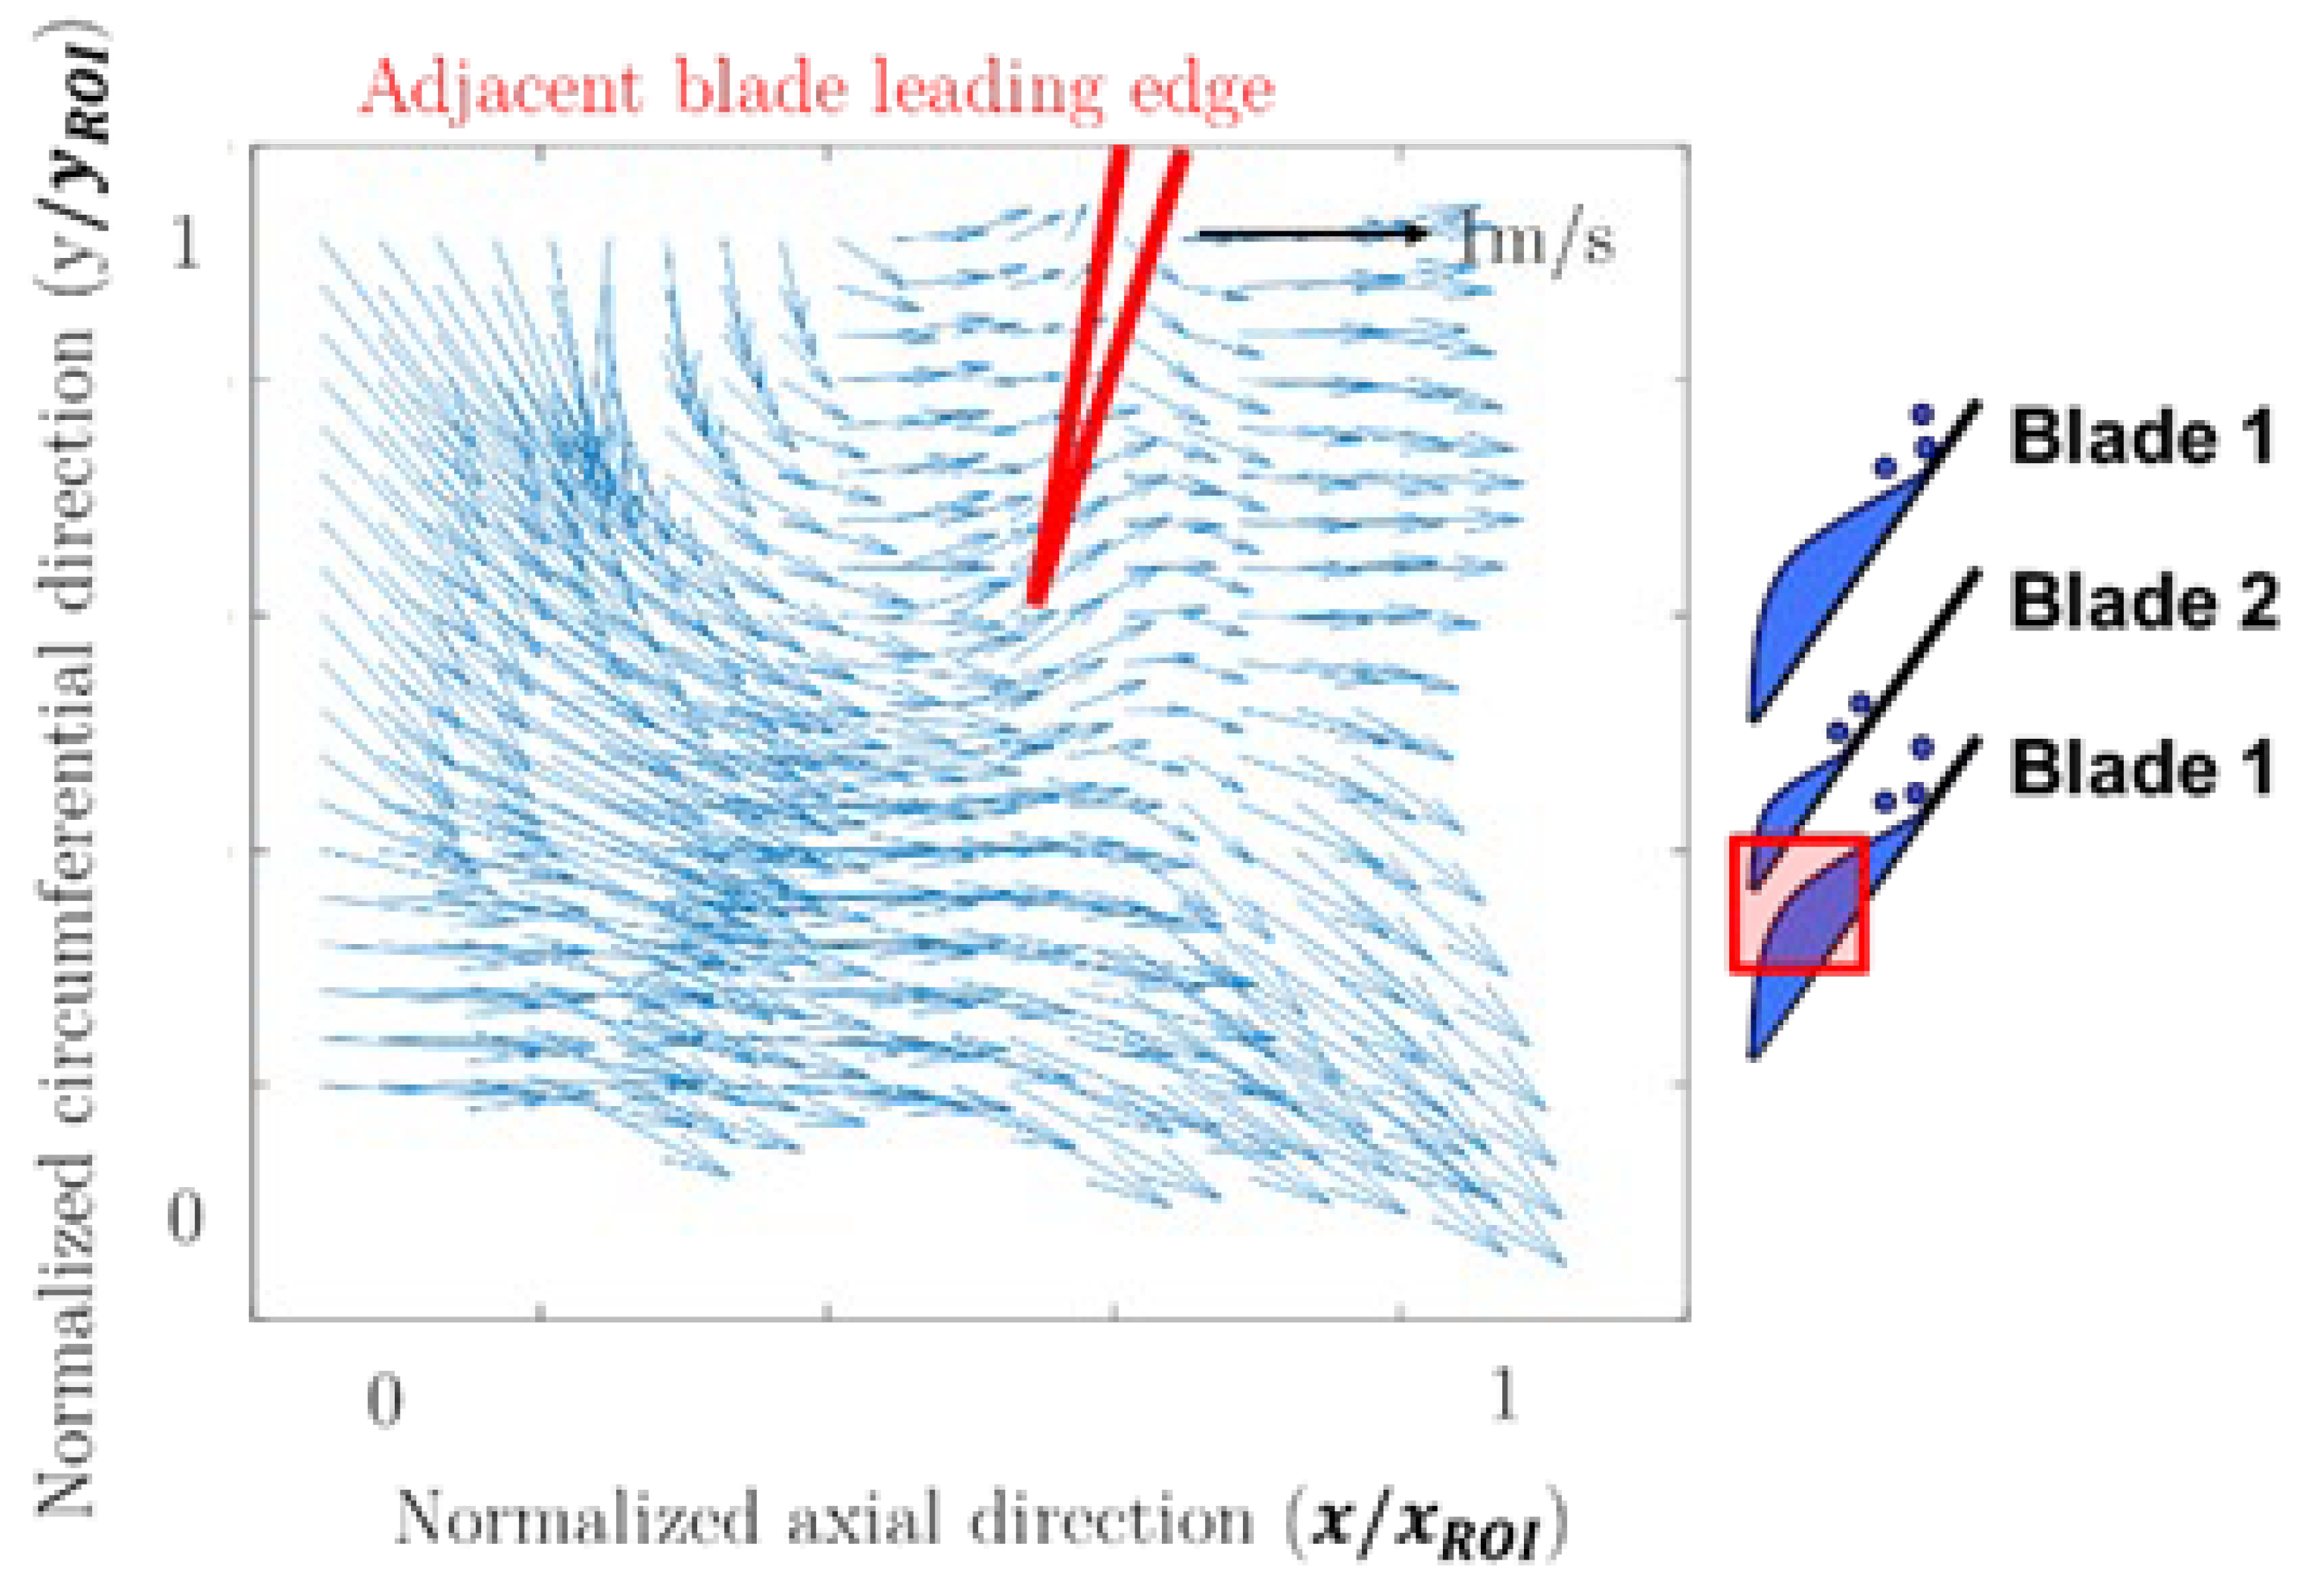
However, as shown in
Figure 9, a strong axial flow is developed at the leading edge of blade 2. This is a result of the cavity collapse occurring near the leading edge of blade 2. The cavity developed at blade 1 is large enough to interact with the following blade’s leading edge. Therefore, it collapses due to high pressure at the throat area and drags the surrounding fluid to create a strong axial flow. This axial flow reduces the incidence of the following blade and inhibits the cavity development.
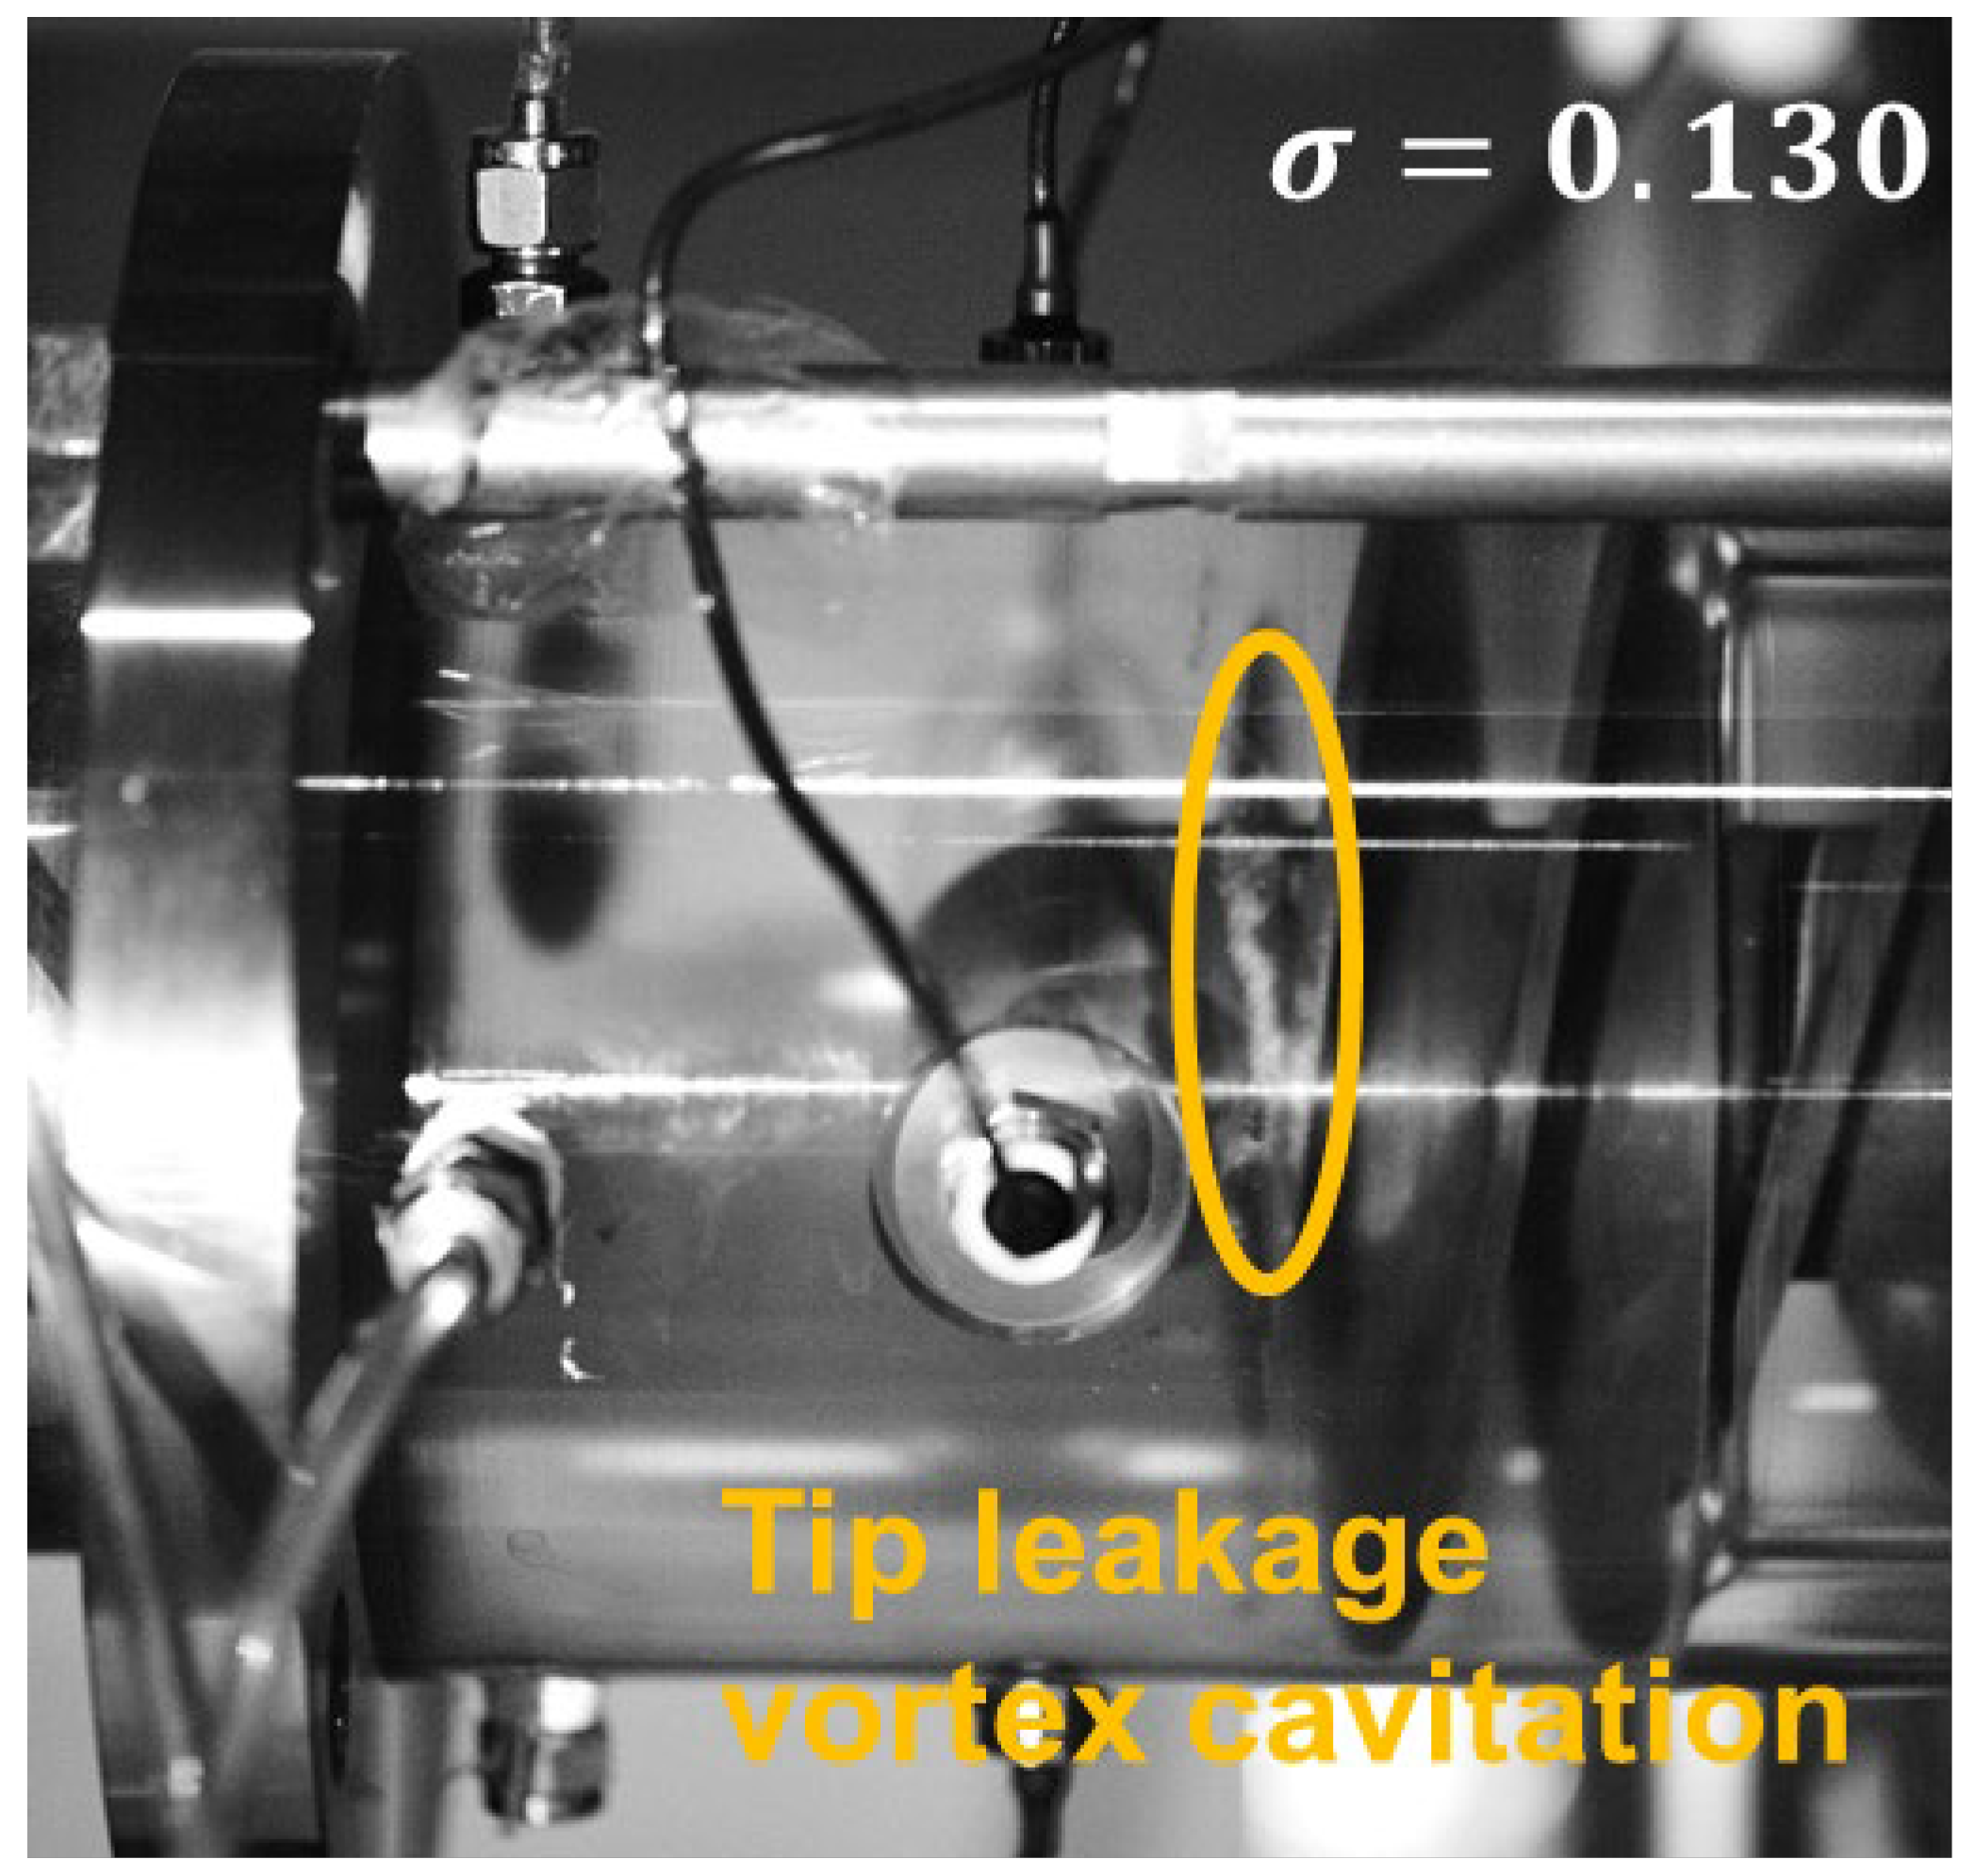
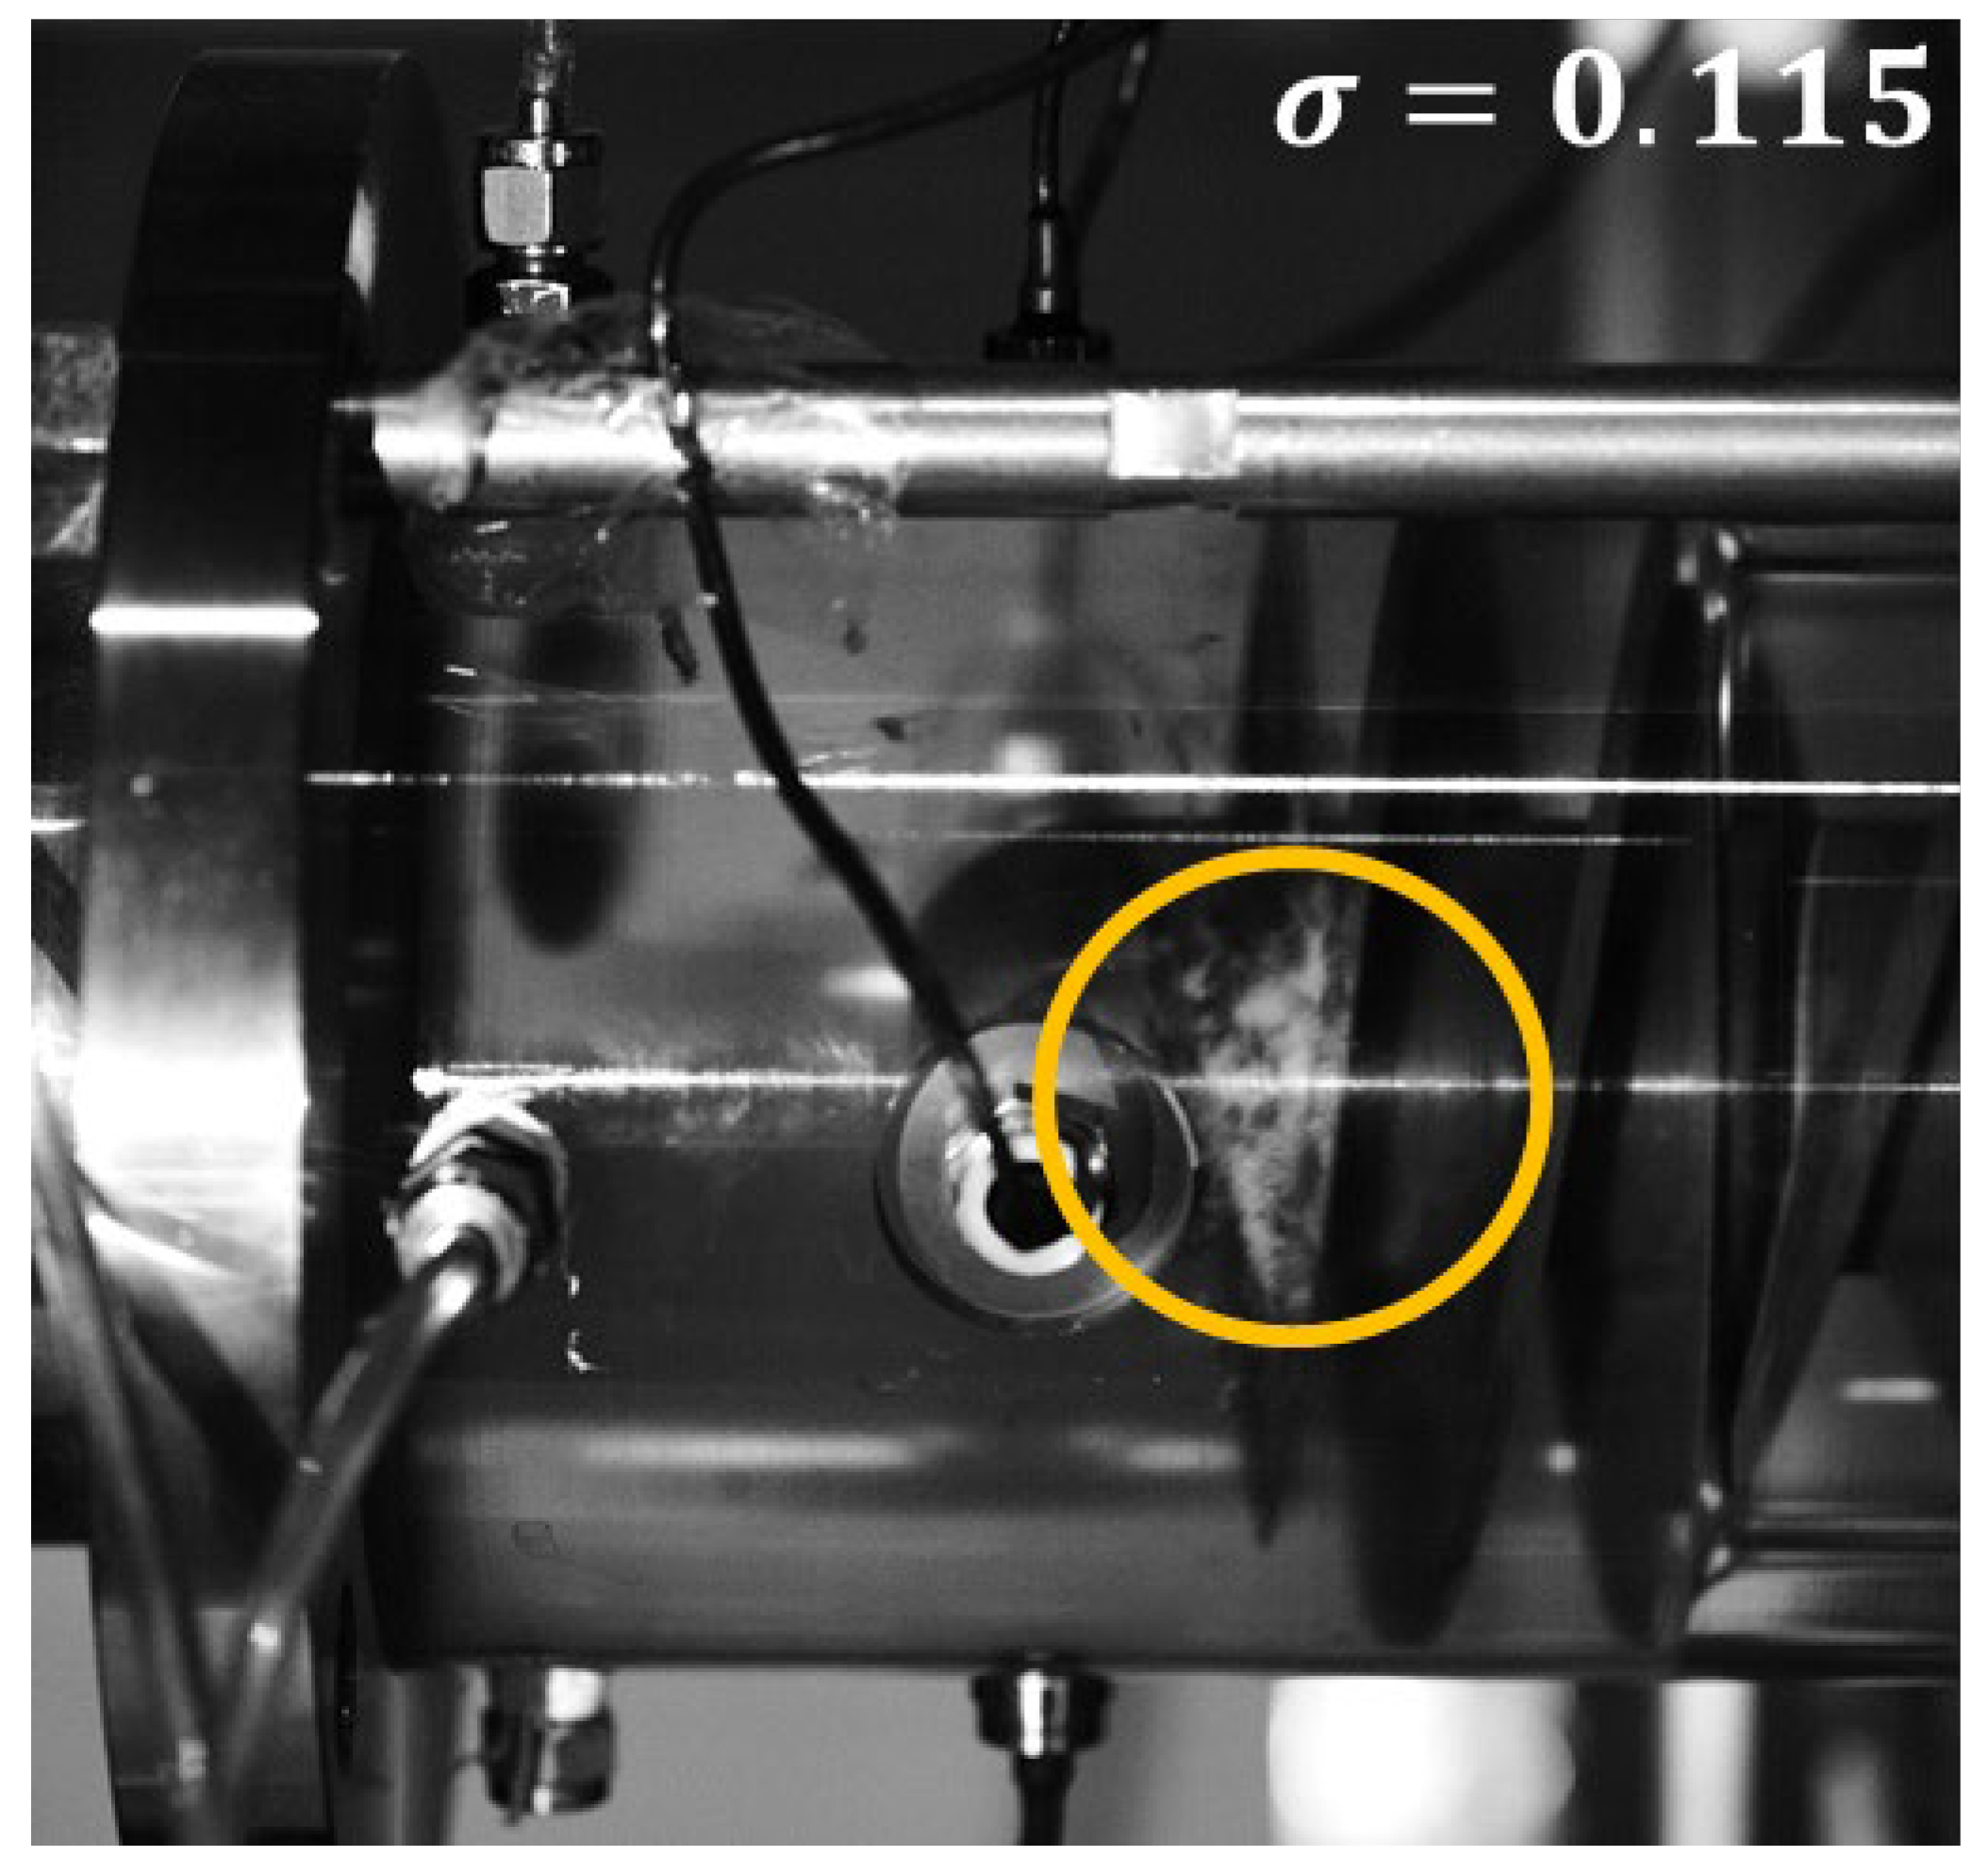
The existence of a critical cavity length that enables the cavity to interact with the following blade leading edge can also be confirmed during the early stages of cavity development. At the cavitation number of 0.130 and 0.115, the normalized cavity length is less than 0.5, and the cavity develops in the form of equal length cavitation (the same cavity develops at both blades).
Figure 10 and
Figure 11 visualize the cavity in both cavitation numbers. It can be seen that the cavities are not large enough to reach the following blade’s leading edge, and no impact is exerted on the incidence. With respect to the following blade, those cavities are the same as the non-cavitating condition.
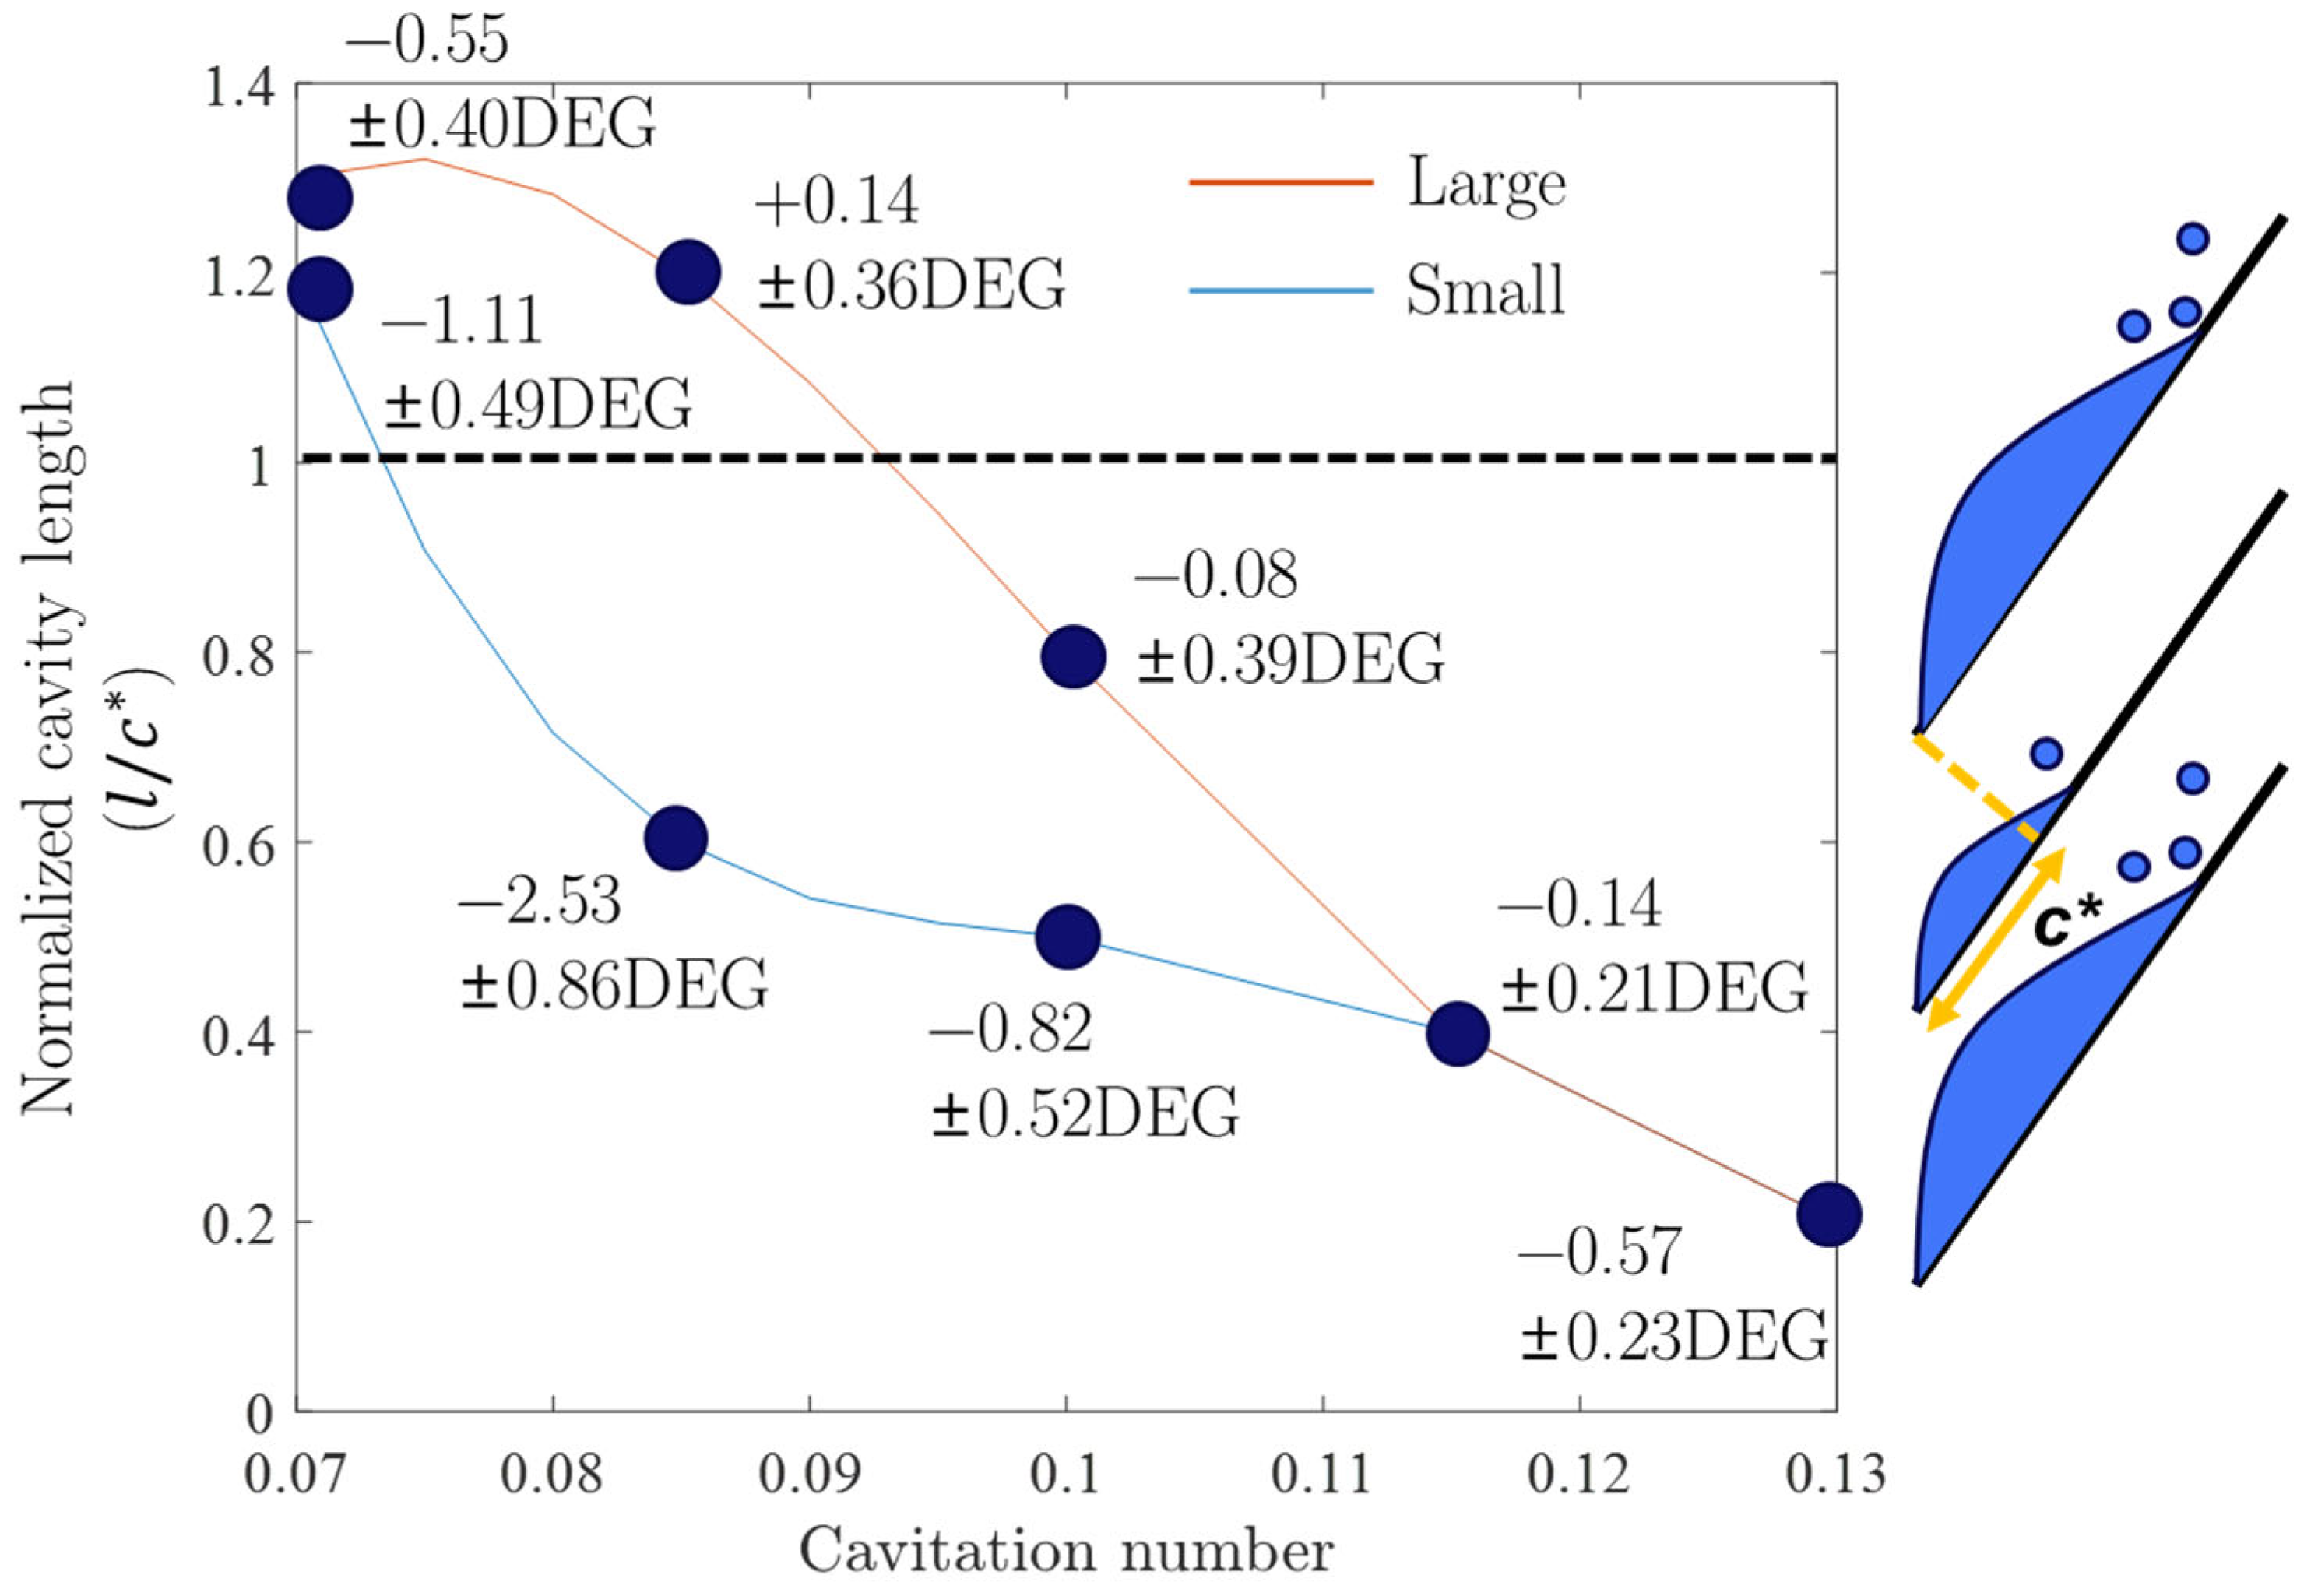
Figure 12 summarizes the experiment results under various cavitation numbers, which is defined as follows:
The ordinate of
Figure 12 is the normalized cavity length, which is the length of the cavity divided by the inducer throat chord length, as illustrated in the right inset of
Figure 12. As the cavitation number drops below 0.110, the cavity length graph bifurcates, and the maximum difference occurs at approximately
. The red line represents the longer cavity length, while the blue line represents the shorter one.
Figure 12 demonstrates that, after the onset of alternate blade cavitation, the magnitude (or difference between the two cavity lengths) increases until it reaches a certain cavitation number, after which it starts to decrease again.
The dark blue dots and captions in
Figure 12 represent
s at the given cavitation number and blade. The alternate blade cavitation is caused by uneven incidence for each blade, as shown in
Figure 8 and
Figure 9. The cavity on the red branch is large enough to interact with the leading edge of the following blade, and it induces strong axial flow, leading to a decrease in the incidence of the following blade. As a result, the blade loading of the following blade (blue branch) decreases, and the tip leakage vortex cavitation (TLVC) extent also decreases. The measured
s at various cavitation numbers can explain the changing magnitude of the alternate blade cavitation, as also observed by Huang et al. [
11]. The alternate blade cavitation reaches its maximum magnitude when the normalized length of the larger cavity is around 1. The decrease in incidence due to the larger cavity becomes smaller before and after that point. Therefore, it can be concluded that the magnitude of
is at its highest when the normalized cavity length is close to 1 (
, where
is the chord length between the leading edge of the blade and the throat). As the cavitation number decreases, the cavity length increases, resulting in an increase in the magnitude of
and the alternate blade cavitation until the cavity length reaches
. Once the cavity length reaches
,
and the alternate blade cavitation start to decrease.
Physically, the maximized
at
can be explained by the position of cavity collapse. When the cavity bubble at the TLVC trailing edge collapses, it induces a large axial flow and decreases the incidence of the following blade. According to Kang et al. [
8], the position of the TLVC trailing edge plays a key role. Therefore, if the position of the cavity collapse coincides with the leading edge of the following blade,
is maximized, and the alternate blade cavitation becomes the strongest. This can be seen more clearly in
Figure 13 and
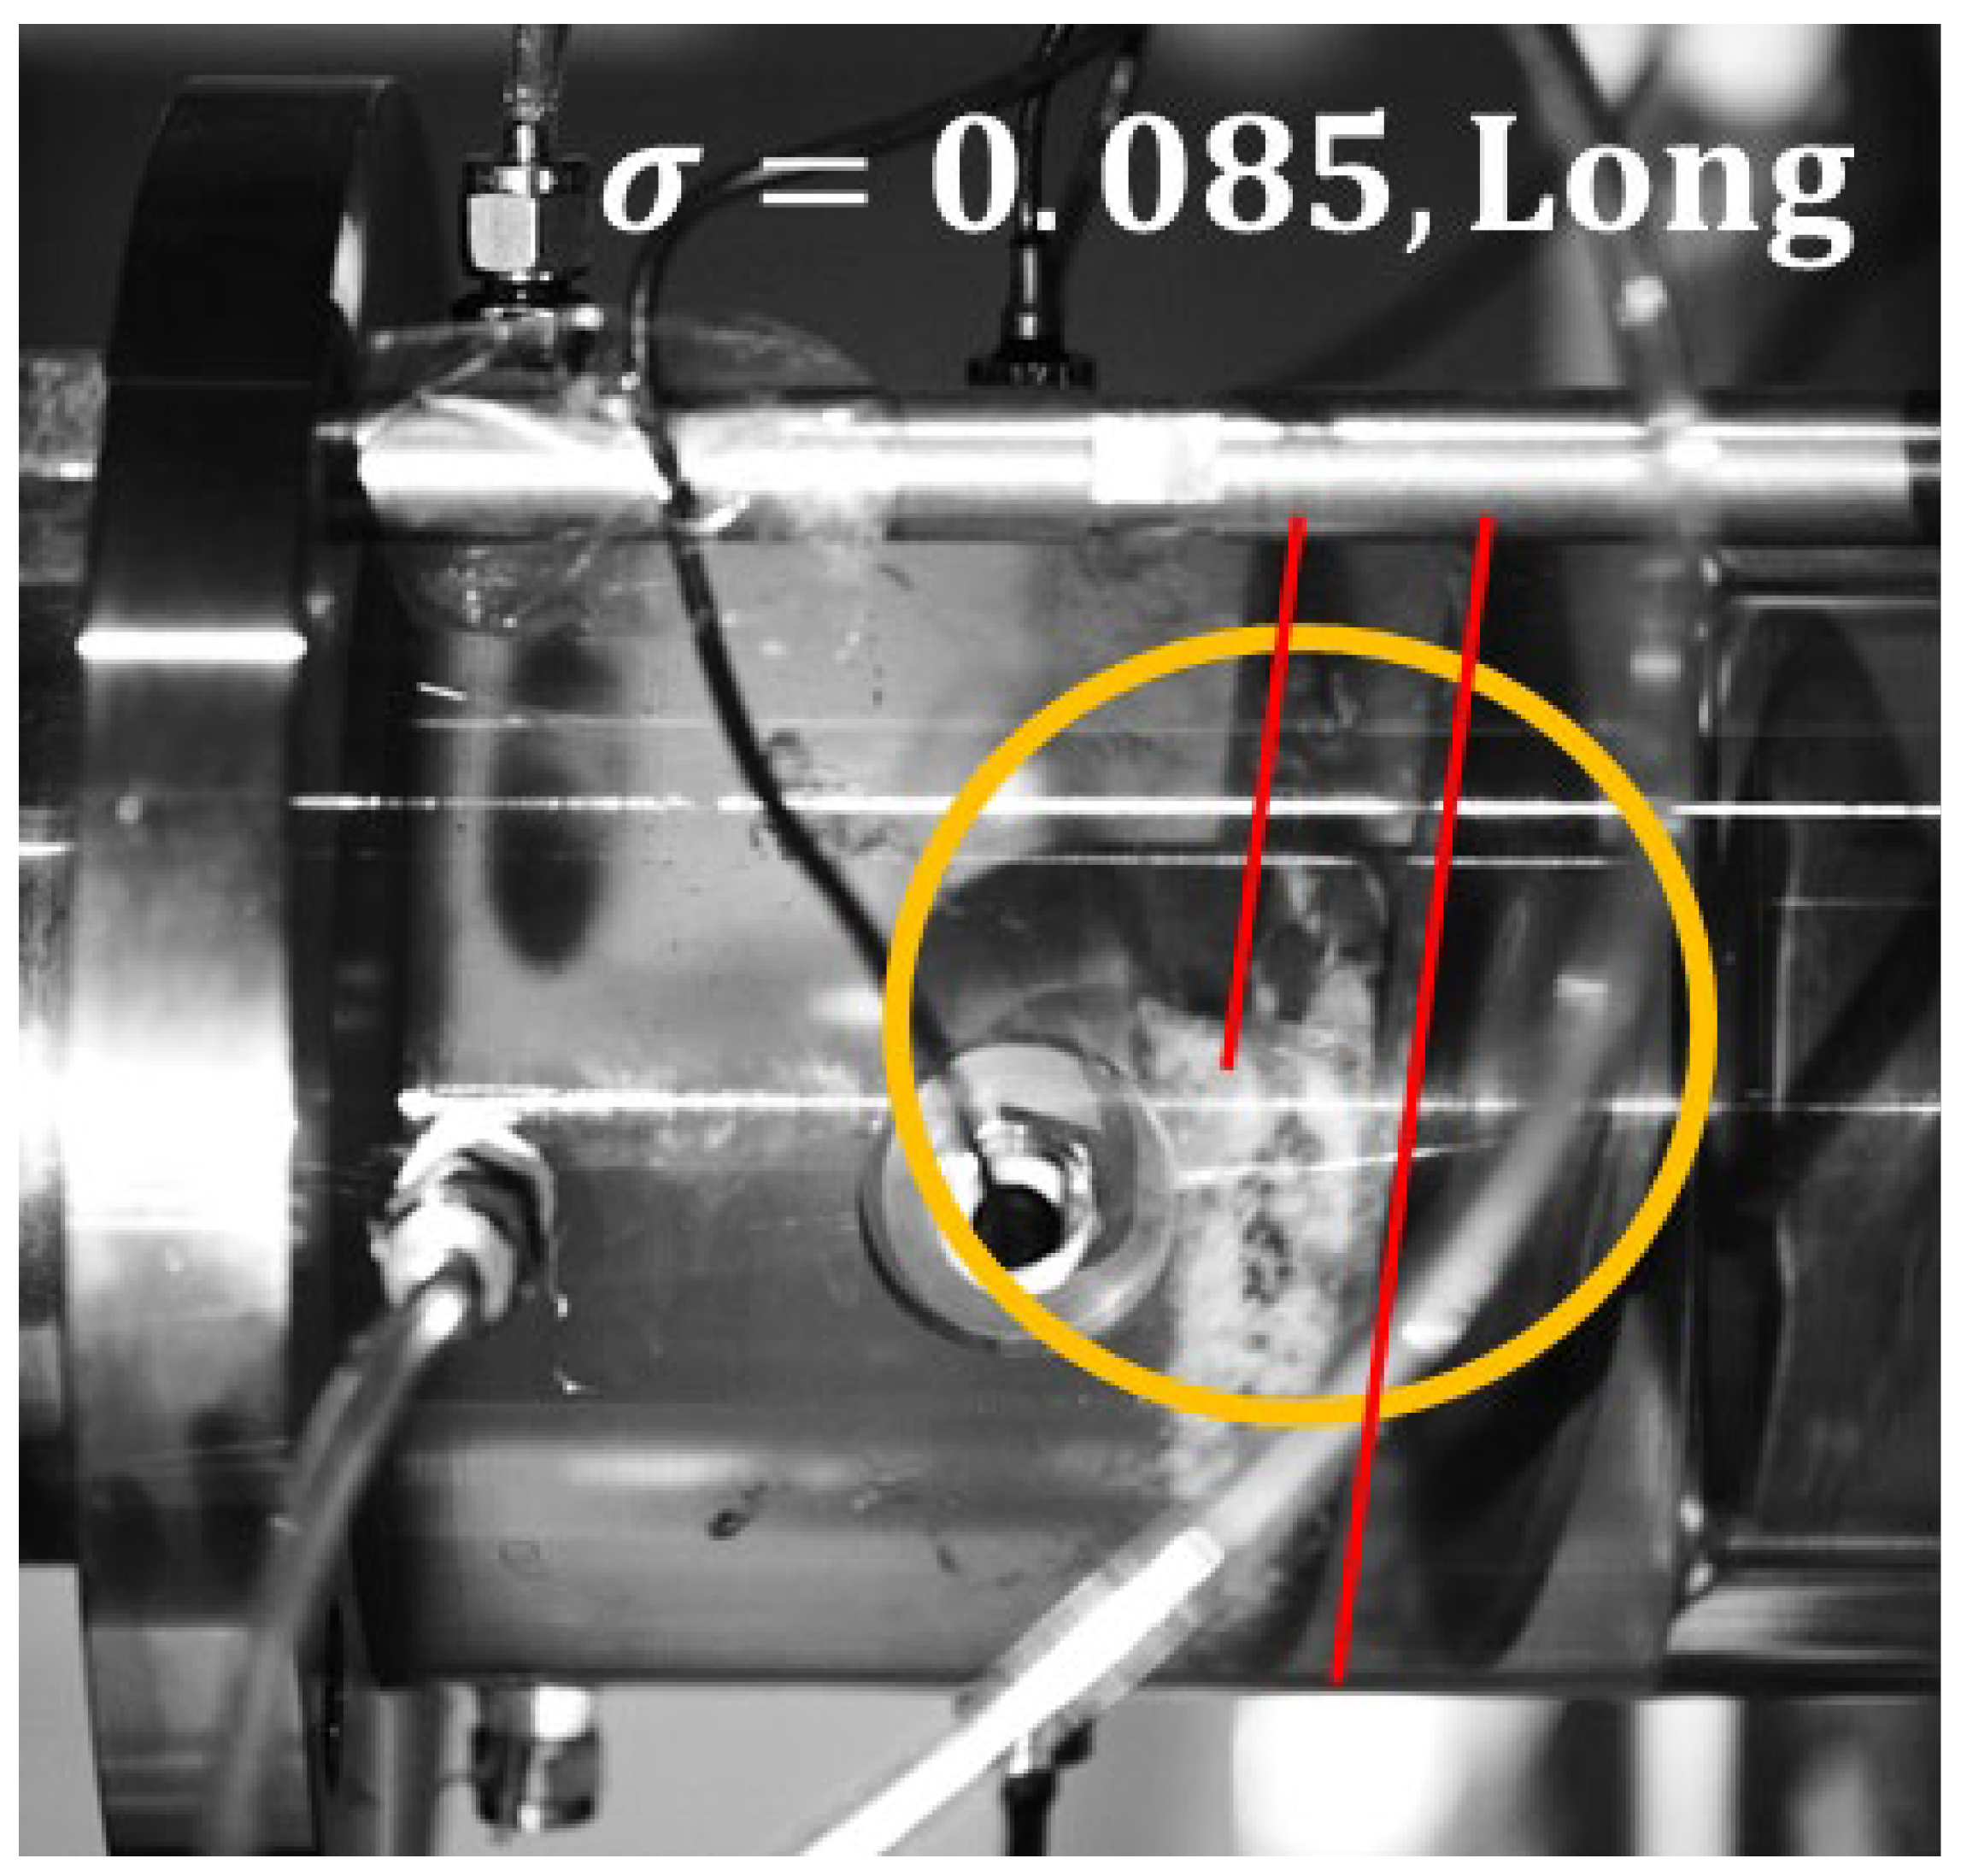
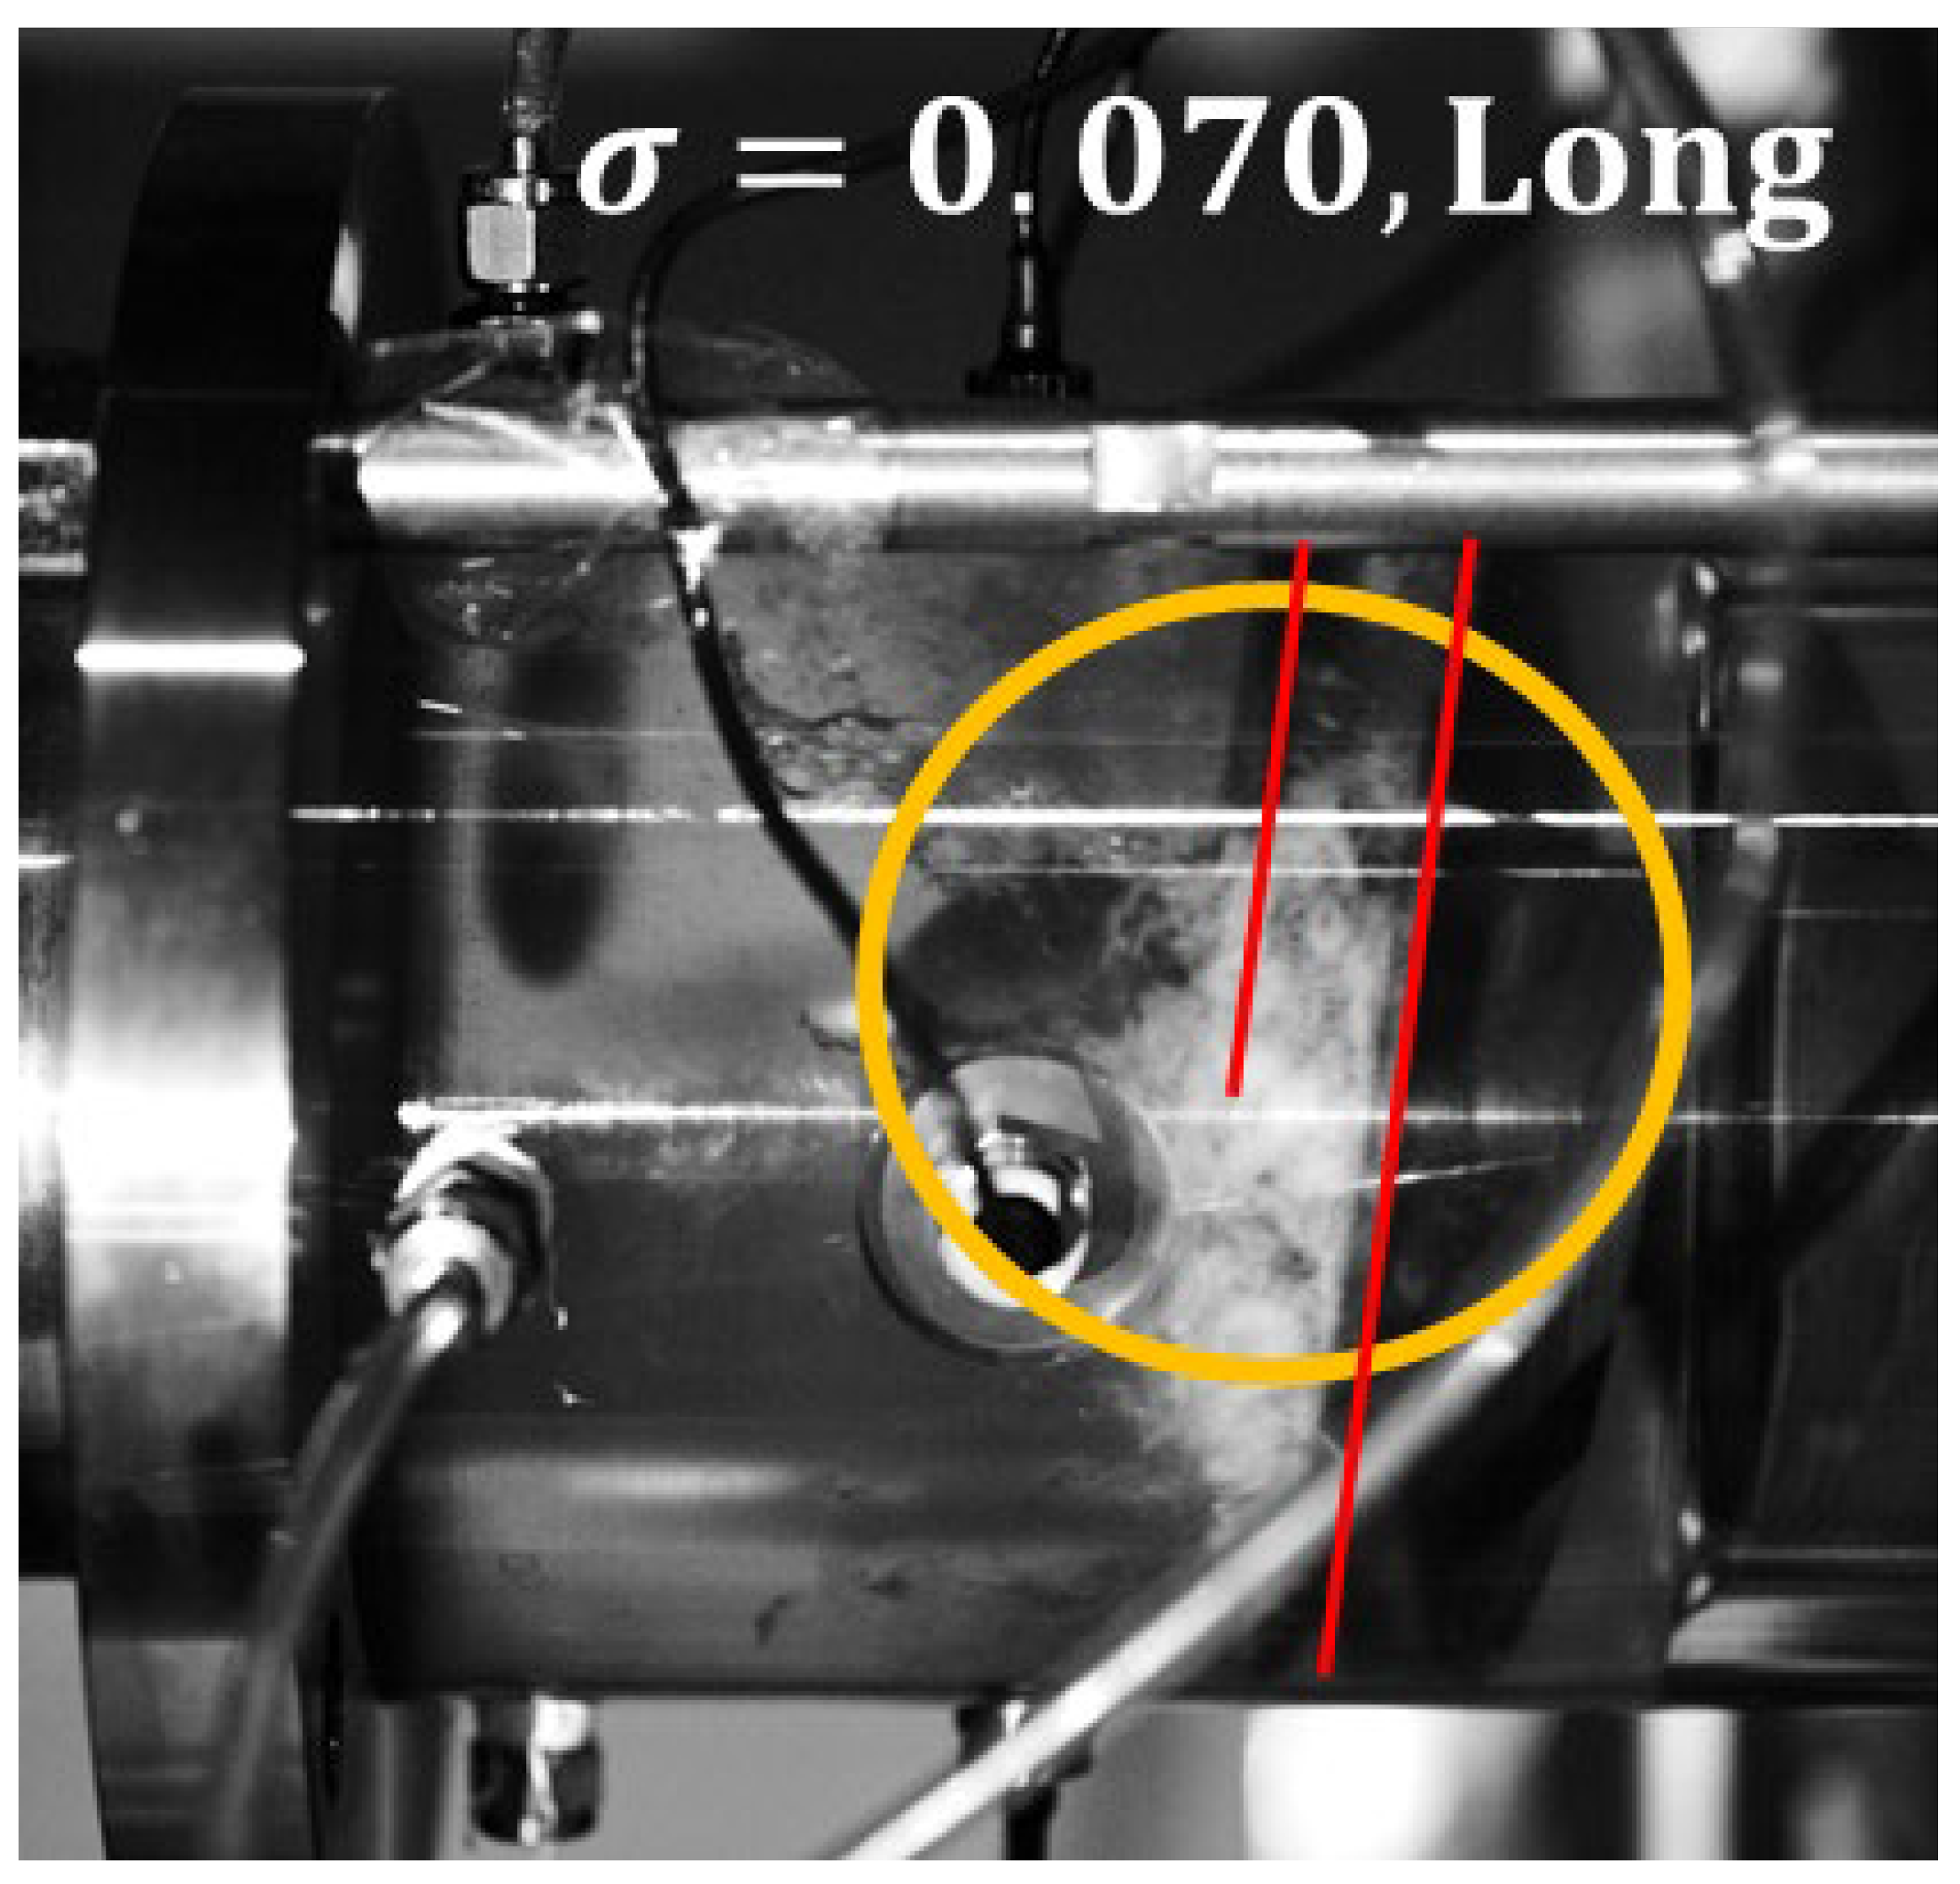
Figure 14.
Figure 13 shows a larger cavity at
, and
Figure 14 shows a larger cavity at
. At
, most of the cavities collapse near the leading edge of the following blade. However, at
, the TLVC extends further until
= 1.3, and much fewer cavities collapse near the leading edge of the following blade. This reduces the induced axial flow and, accordingly, decreases the incidence of the following blade less.


