1. Introduction
Fans are omnipresent in different products and applications. Since 2011, eco-design regulates the minimum energy performance of fans above 125 W [
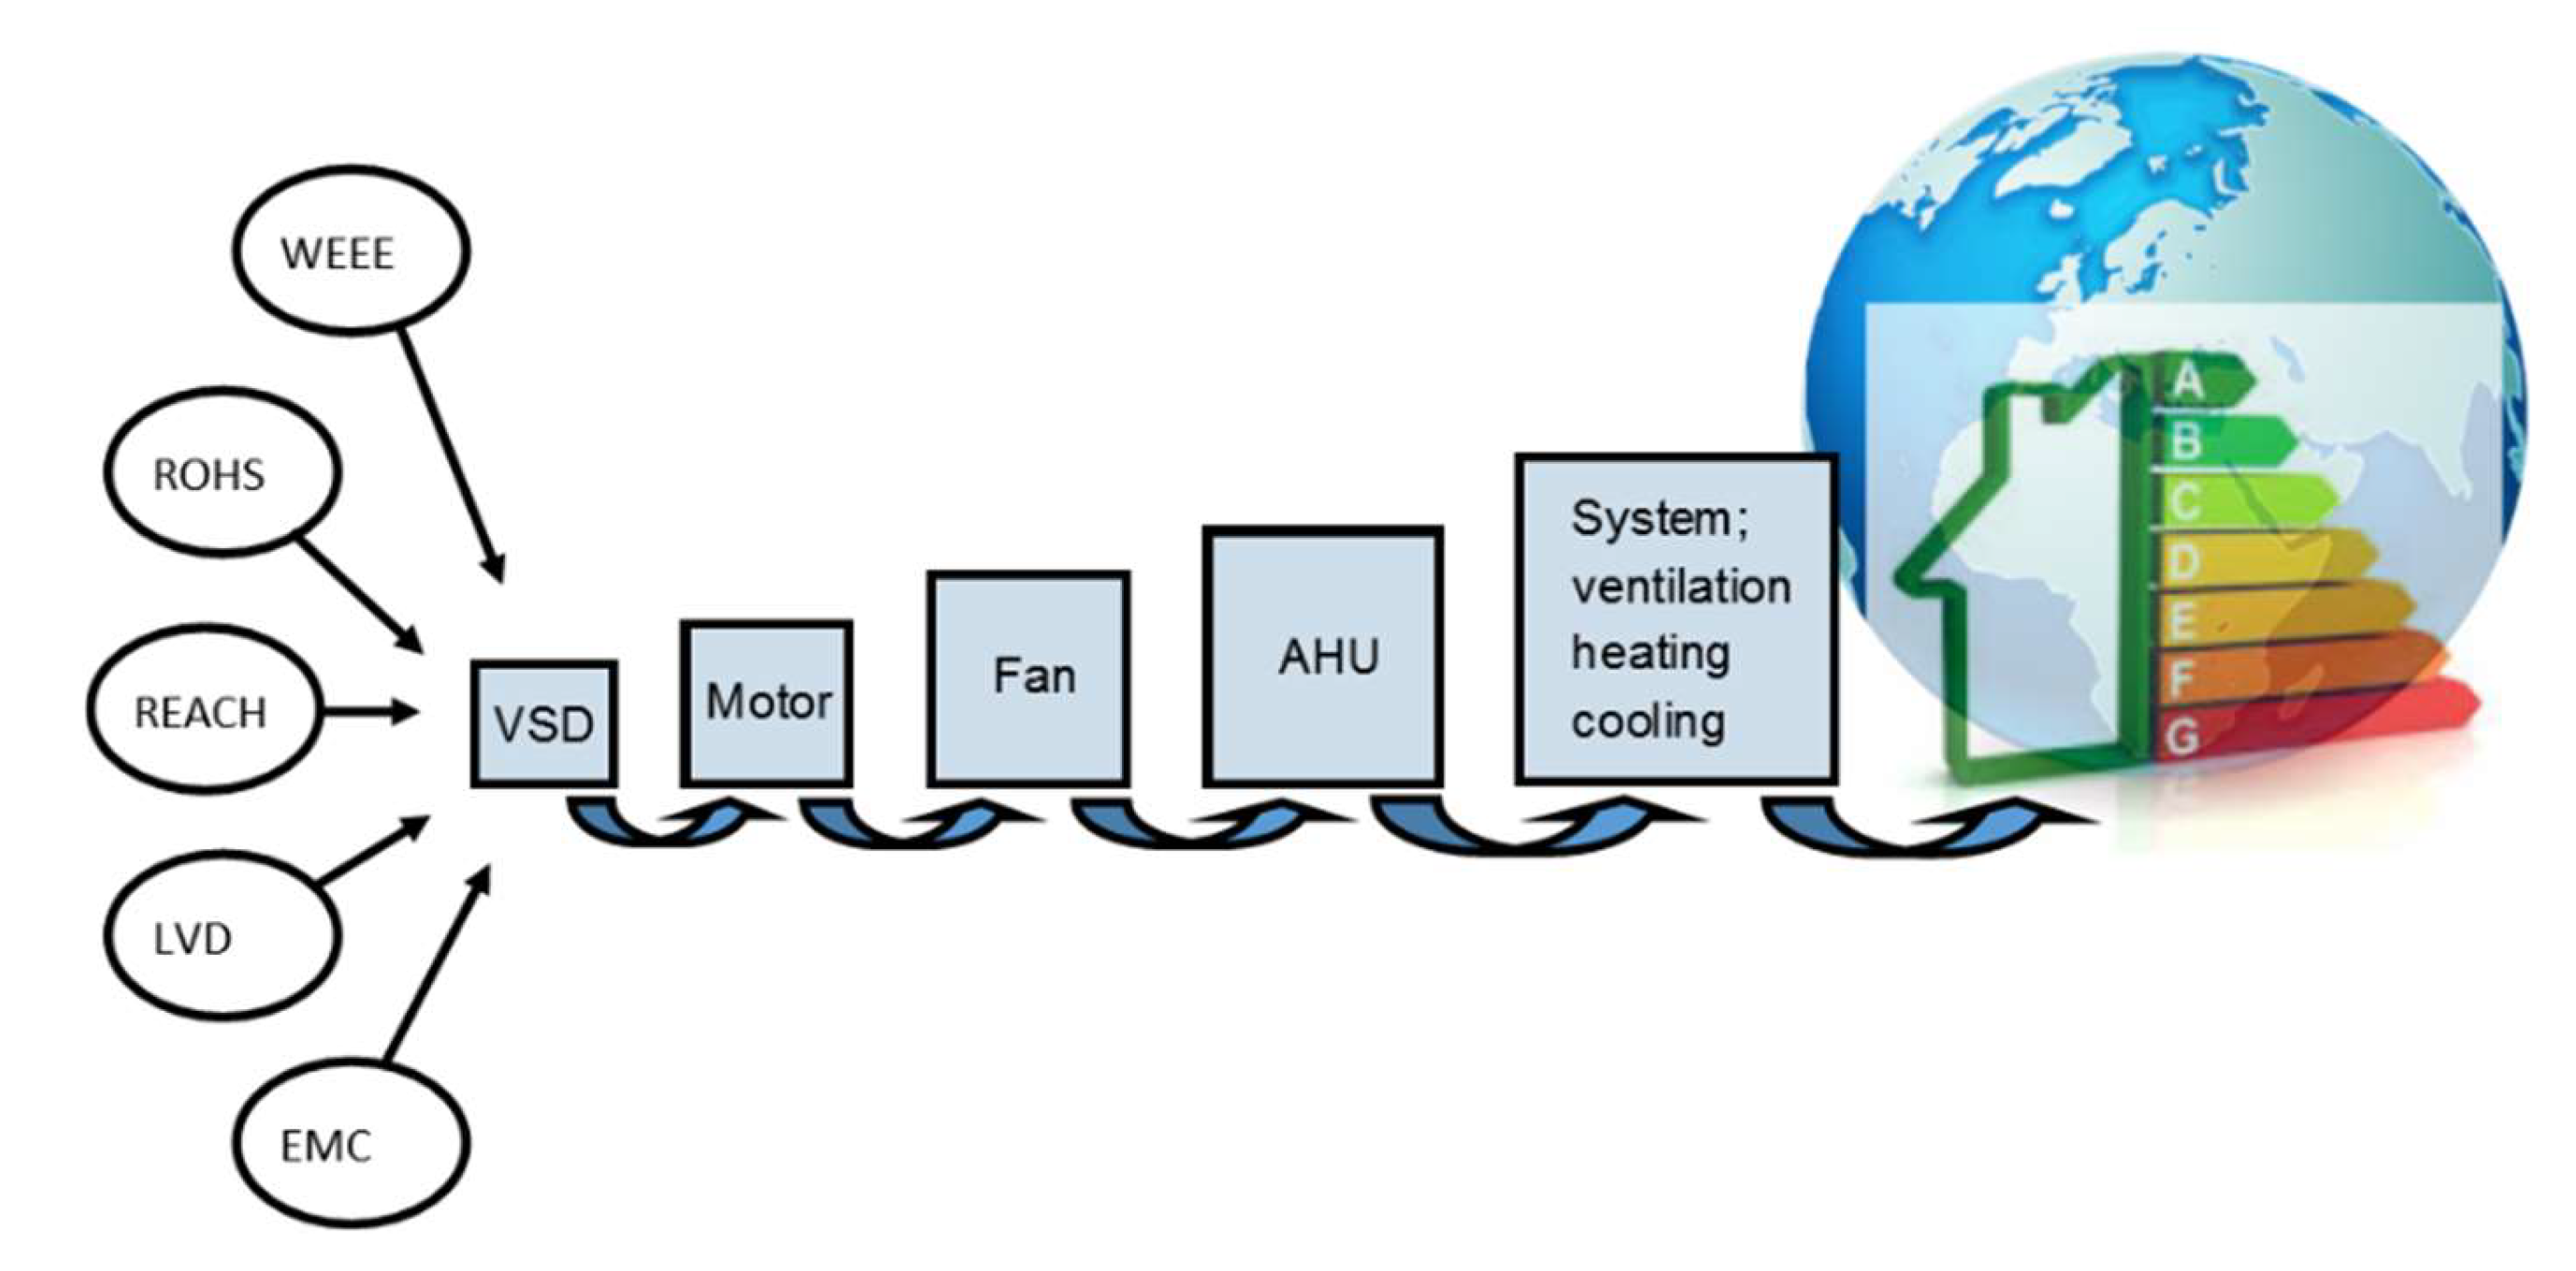
1]. A fan is typically not a final product but used as a component in different products, systems, and applications. From the very beginning, questions have been raised as to whether it is helpful to regulate a component and not a final product only (
Figure 1). However, so-called “cascading” is a well-established element in regulation that ensures the availability of cost-effective and efficient components for downstream products, which are also components used in a next step (e.g., motor > fan > ventilation unit, heat pump or chiller > technical building system > building). The important aspect of this principle is that the requirements for each product in the chain are guiding in the right direction for all of the following chain links. This study analysed the European market’s transformation for fans from the beginning of the regulation in 2012 until 2020 and estimated the energy savings achieved under the influence of this regulation. Additionally, an estimation of the share of fans placed on the European market in other eco-design-regulated products (i.e., ventilation units, air heating/cooling devices, chillers, room air conditioner and refrigeration) was made.
In 2018, we produced a questionnaire to determine the energy savings aspects of the Eco-Design Regulation EU 327/2011 in relation to the estimated market size, and this was published [
2,
3] and presented among the relevant stakeholders in the European Commission and industry partners. The documents were also used in several publications issued by political institutions. In 2019, the EVIA’s Fans Working Group agreed to update the questionnaire to reflect the most recent data and to provide estimates for 2020 and 2025. One of the reasons for this restart was that the revision of the fan regulation with important clarifications and an update of the minimum requirements was presented in 2017, but was not finalised until now, although the industry and the market expected this. Possibly significant energy savings and CO
2 reductions were lost for many years. The basis for the energy savings estimations considered the possibility of the upcoming revision of Regulation EU 327/2011.
2. Methodology of the Data Collection and Analysis
The current generally available data on the sales of fans do not consider the energy performance of fans or details on their sizing when they are placed on the market. Therefore, we developed a questionnaire as a basis for the following market impact estimations, which was simple enough to allow manufacturers to answer the questions with acceptable effort but also allowing us to determine the answers we needed. This questionnaire was developed together with fan manufacturers to ensure a reasonable number of answers, considering the aspects of compliance and the availability of data by the companies.
The data are given for the EU-28 (including the UK) market when placing fans on the market, and we collected the data from fan manufacturers representing approx. 33% of the estimated market size in the EU-28 in pieces as determined in [
4] for different fan sizes (i.e., fan power). The market size in pieces of fans was estimated for 11.8 million fans as per [
4], and we obtained answers from companies representing 3.9 million fans.
The results were extrapolated to the estimated market size taken from EU LOT 11 studies [
4]. The typical power savings, defined for each fan size group for each year, led to energy savings by considering 4000 operating hours per year for each fan, which was estimated as a good average for all fan applications, but clearly had significant uncertainty. The CO
2 factor for the electricity of 460 g CO
2/kWh
Electricity was used for the CO
2 savings calculation. The saving estimations made were based on the best efficiency point (BEP) (optimistic) but not including the variable speed drive (conservative). This study did not include very large fans >> 22 kW (due to a lack of information and only few data being available), jet fans (due to the lack of suitable performance data in the regulation), and fans below 125 W
el (as they were outside the scope). This study also did not include special industrial fans, such as dust conveying fans, high-pressure low-flow fans (HPLV), and other special applications.
We had weak information regarding fans placed on the market integrated in other products that were manufactured completely outside of the EU. This uncertainty regarding integrated fans could not be solved with our questionnaire, and it was not solved in the data regarding the market we used as our basis [
4,
5].
The energy performance of the fans was divided for the questionnaire into 4 groups:
Fans not complying with the 2013 limit of EU 327/2014 [
5].
Fans complying with the 2013 limit but not with the 2015 limit.
Fans complying with the 2015 limit or better (until 2017) and not complying with the expected limit of the revision (called 202x) of EU 327/2011 (from 2018 on).
Fans complying with the expected limit for the revision 202x (
Table 1).
Data were collected and divided into the following design groups and sizes:
Design (some manufacturers could only provide data as a mix of axial, radial, and other fans—a split was conducted according to an average share of all):
- ○
Axial fans;
- ○
Radial fans (including others).
Sizes (some manufacturers could only deliver a mix of different sizes—a split was conducted according to an average share of all):
- ○
125 W ≤ x < 375 W Pel,av = 250 W;
- ○
375 W ≤ x < 750 W Pel,av = 560 W;
- ○
0.75 kW≤ x < 3 kW Pel,av = 1.88 kW;
- ○
3 kW ≤ x < 11 kW Pel,av = 7.0 kW;
- ○
x ≥ 11 kW Pel,av = 18 kW.
3. Results of the Market Questionnaire
3.1. Fans Placed on the Market
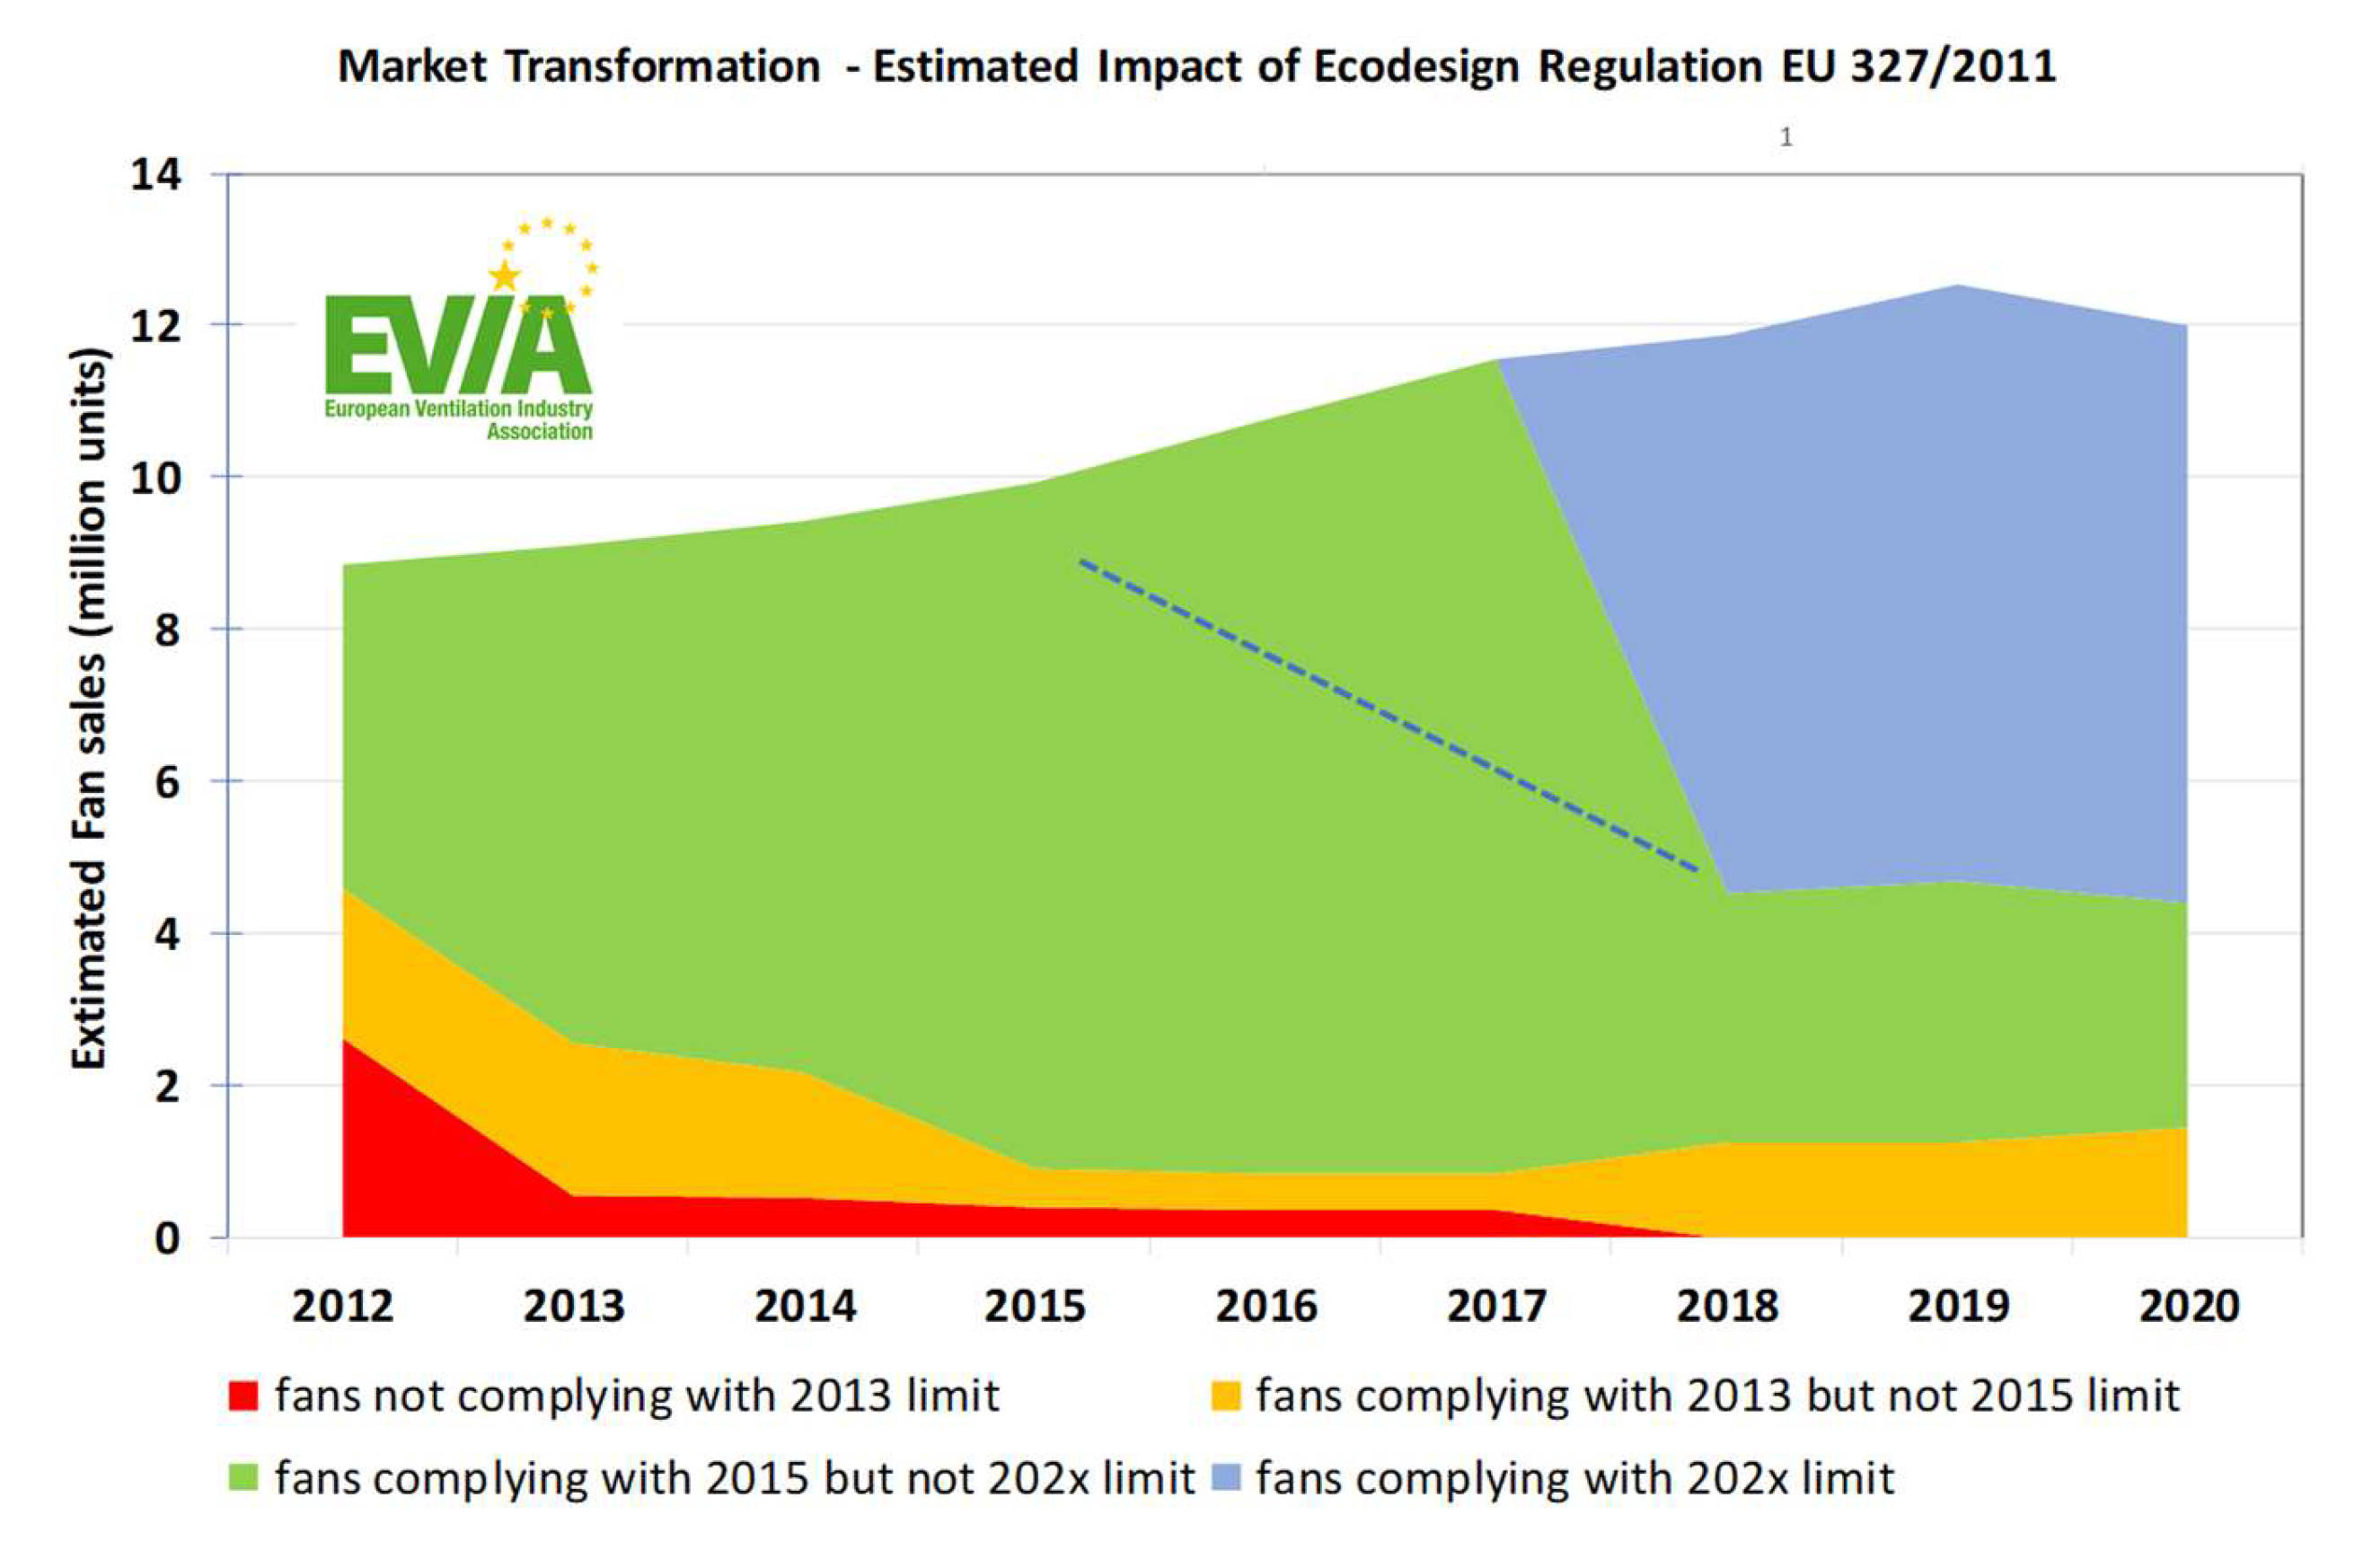
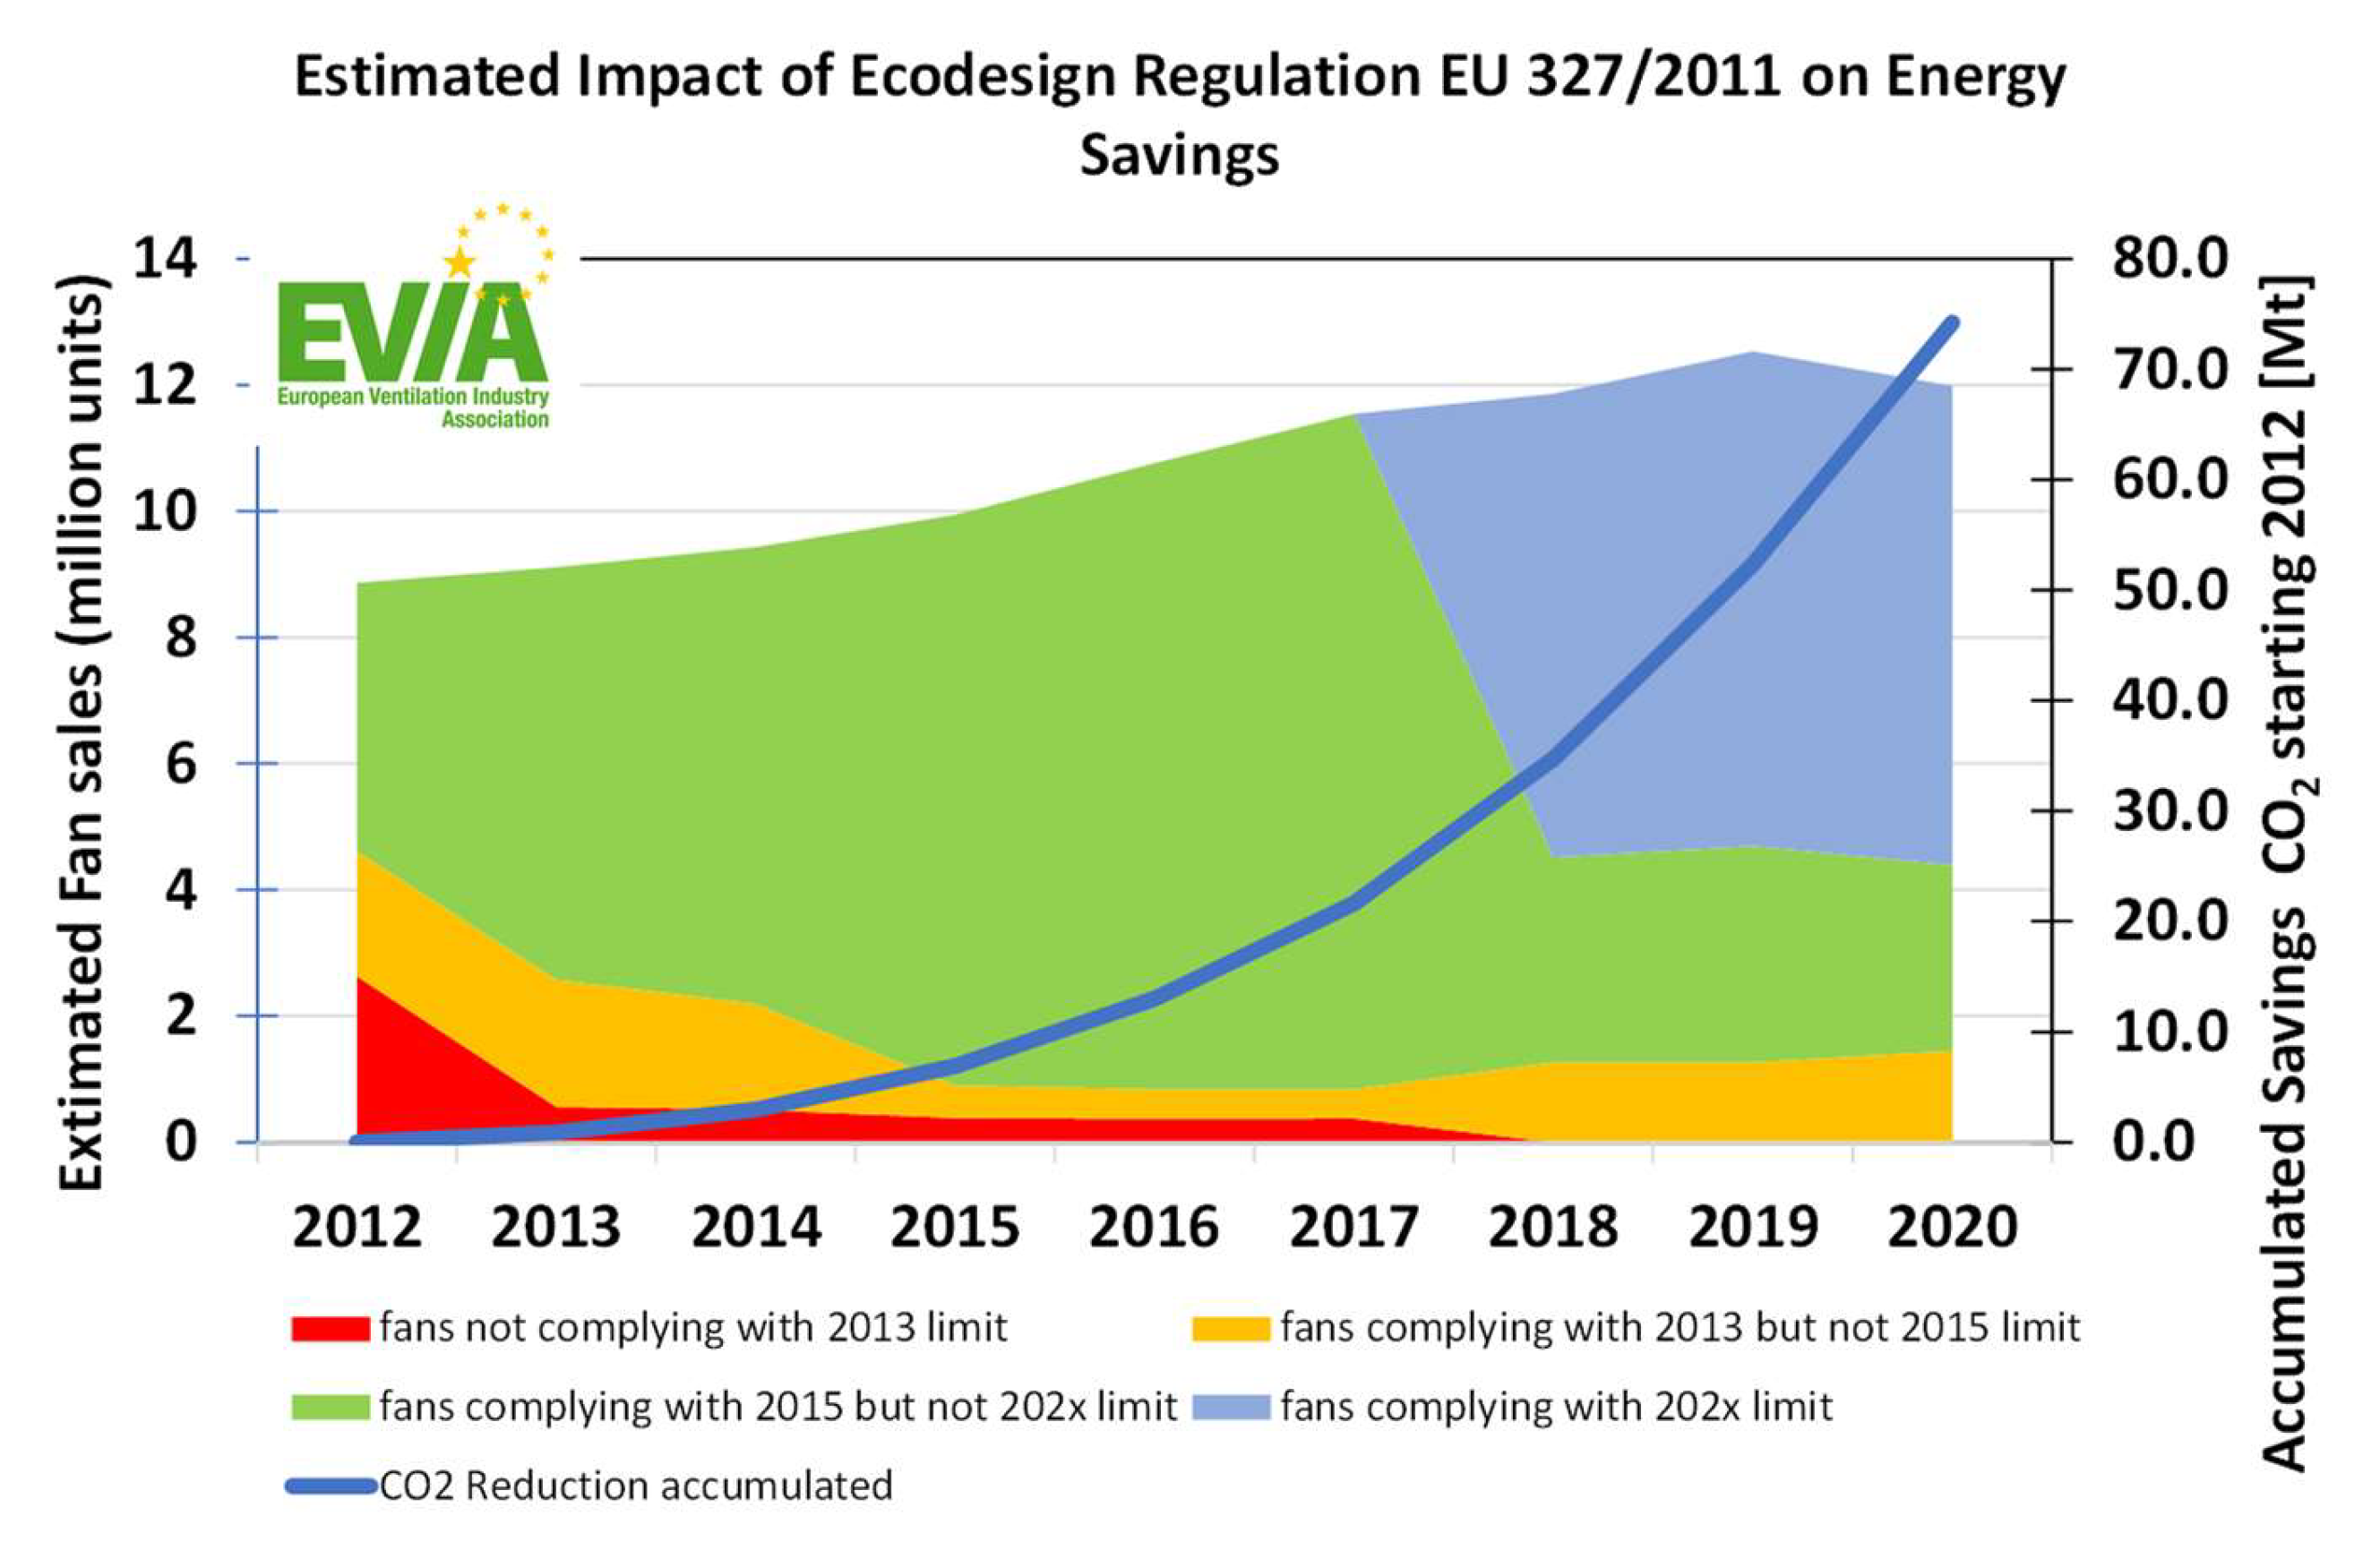
In 2012 approx. 8.8 million fans within the EU 327/2011 scope were placed on the market. We saw a steady growth of up to 12.5 million in 2019. In 2020, sales decreased slightly, possibly caused by the COVID-19 lockdowns (
Figure 2). In 2012, nearly 50% of the fans did not comply with the 2015 limits, which changed until 2015, where only a few fans did not comply. Considering exports outside of the EU for downstream products and spare parts, there was always a stock of noncomplying fans. The revision of the fan regulation EU 327/2011 was expected to come into force around 2018, so we saw a drastic change to the 202x compliant products in 2018. The correct shape could not be determined, because until 2017, the data could not be split into the 2015 and 202× limit (dotted line). It is remarkable that we saw no further replacement of the 2015 limit fans from 2018 and on. This is different from the situation we saw from 2012 to 2015. We assumed there was a push back situation because the market expected the revised regulation and it was not published (and it is not until now). We even saw a slight decrease in the 202x compliant fans.
3.2. Size and Design of the Fans
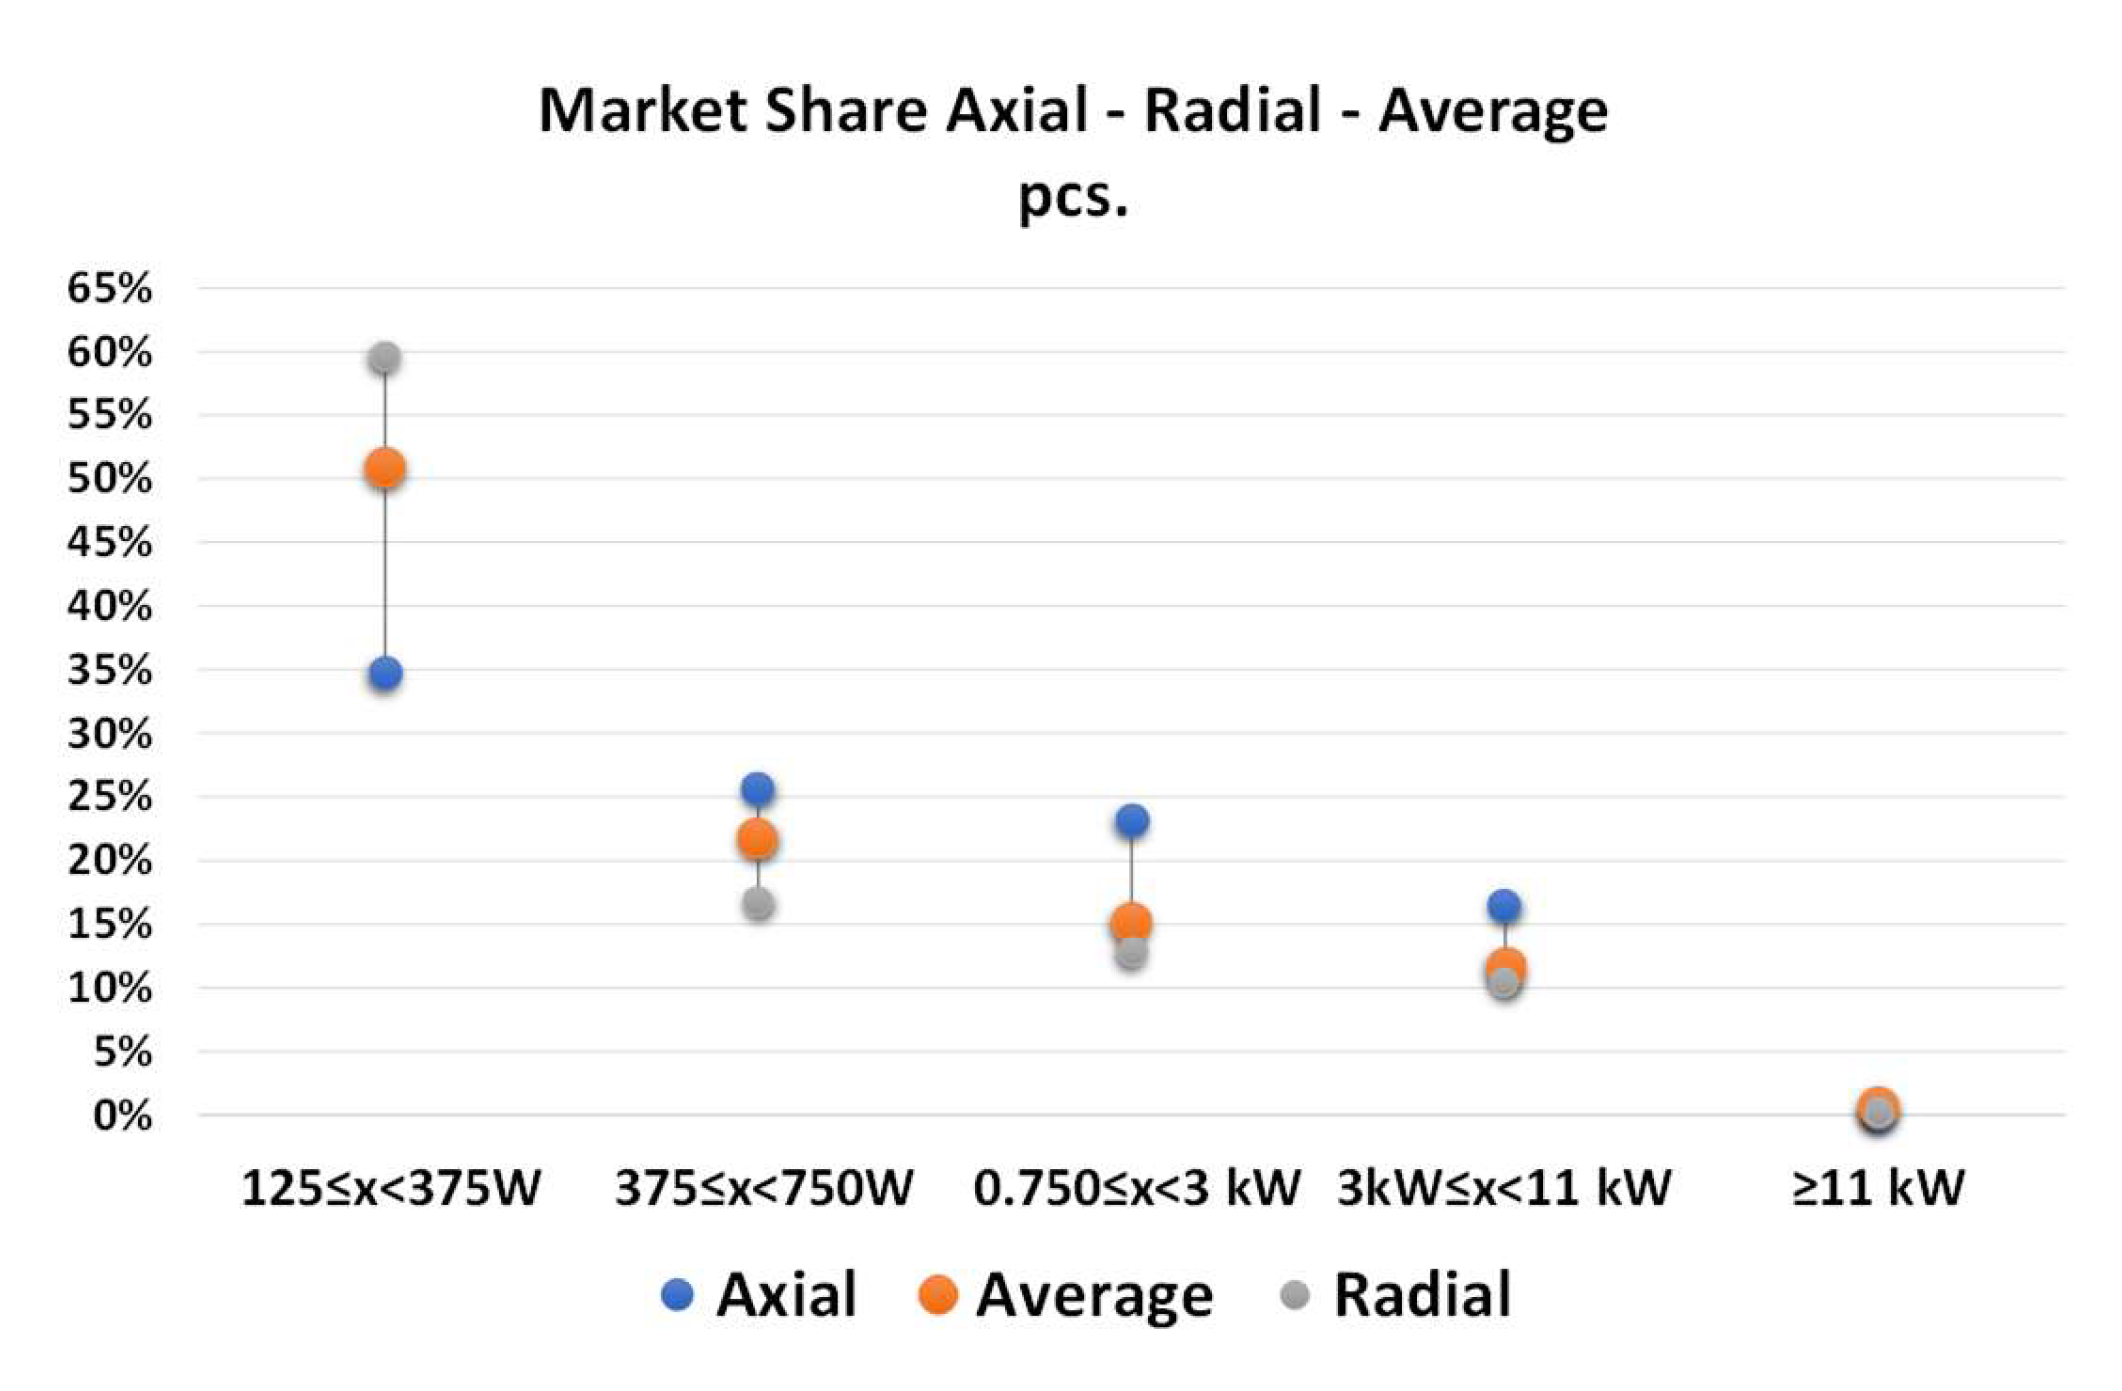
More than 50% of the fans placed on the market were between 125 and 375 W
el, but this does not reflect the energy impact of this size (
Figure 3).
Figure 4 shows the relative energy impact based on the pieces multiplied with the average power of each group. From an energy consumption perspective, the size from 3 to 11 kW was the domination group (approx. 15% in pieces but 60% in energy impact). Still reasonable is also the smaller product group caused by its high number of pieces. From a political perspective (regulating the energy dominating product group), the fan size from 0.75 to 11 kW was key. We did not question smaller sizes of fans below 125 W; therefore, we cannot provide any information on whether it would be reasonable to implement these fans in the regulation.
3.3. Savings Per Fan
The electrical power savings per fan were determined as follows. From 2012 to 2017, each participating company estimated example efficiency improvements in each size group for its product portfolio. The weighted average for all fans and companies was used for the energy savings calculation. From 2018 on, the savings per fan were calculated to the reference of 2013. This means that the fan efficiency was calculated for axial and radial fans in each size group using the 2013 limits as the basis. The improvement for each group was the efficiency difference of the 2015 or 202x limits to the 2013 limits weighted by the overall fans and companies. For an example using the axial fans, see
Table 2.
Summarizing and weighting for all fans, sizes, and companies,
Figure 5 shows the average savings for each fan placed on the market in each single year (orange line). This means that it shows the average savings for a fan placed in a year related to a refence fan in 2012. The blue line beyond shows the average savings summarised from 2012 for all fans placed on the market since 2012. This means it shows the average savings for all fans placed on the market up to each year related to a reference fan in 2012. Based on an outlook up to 2025 given by some companies, the scenario was extended up to 2025, and significant savings will be still possible.
3.4. Energetic Success of the Eco-Design Regulation since Coming into Force in 2013
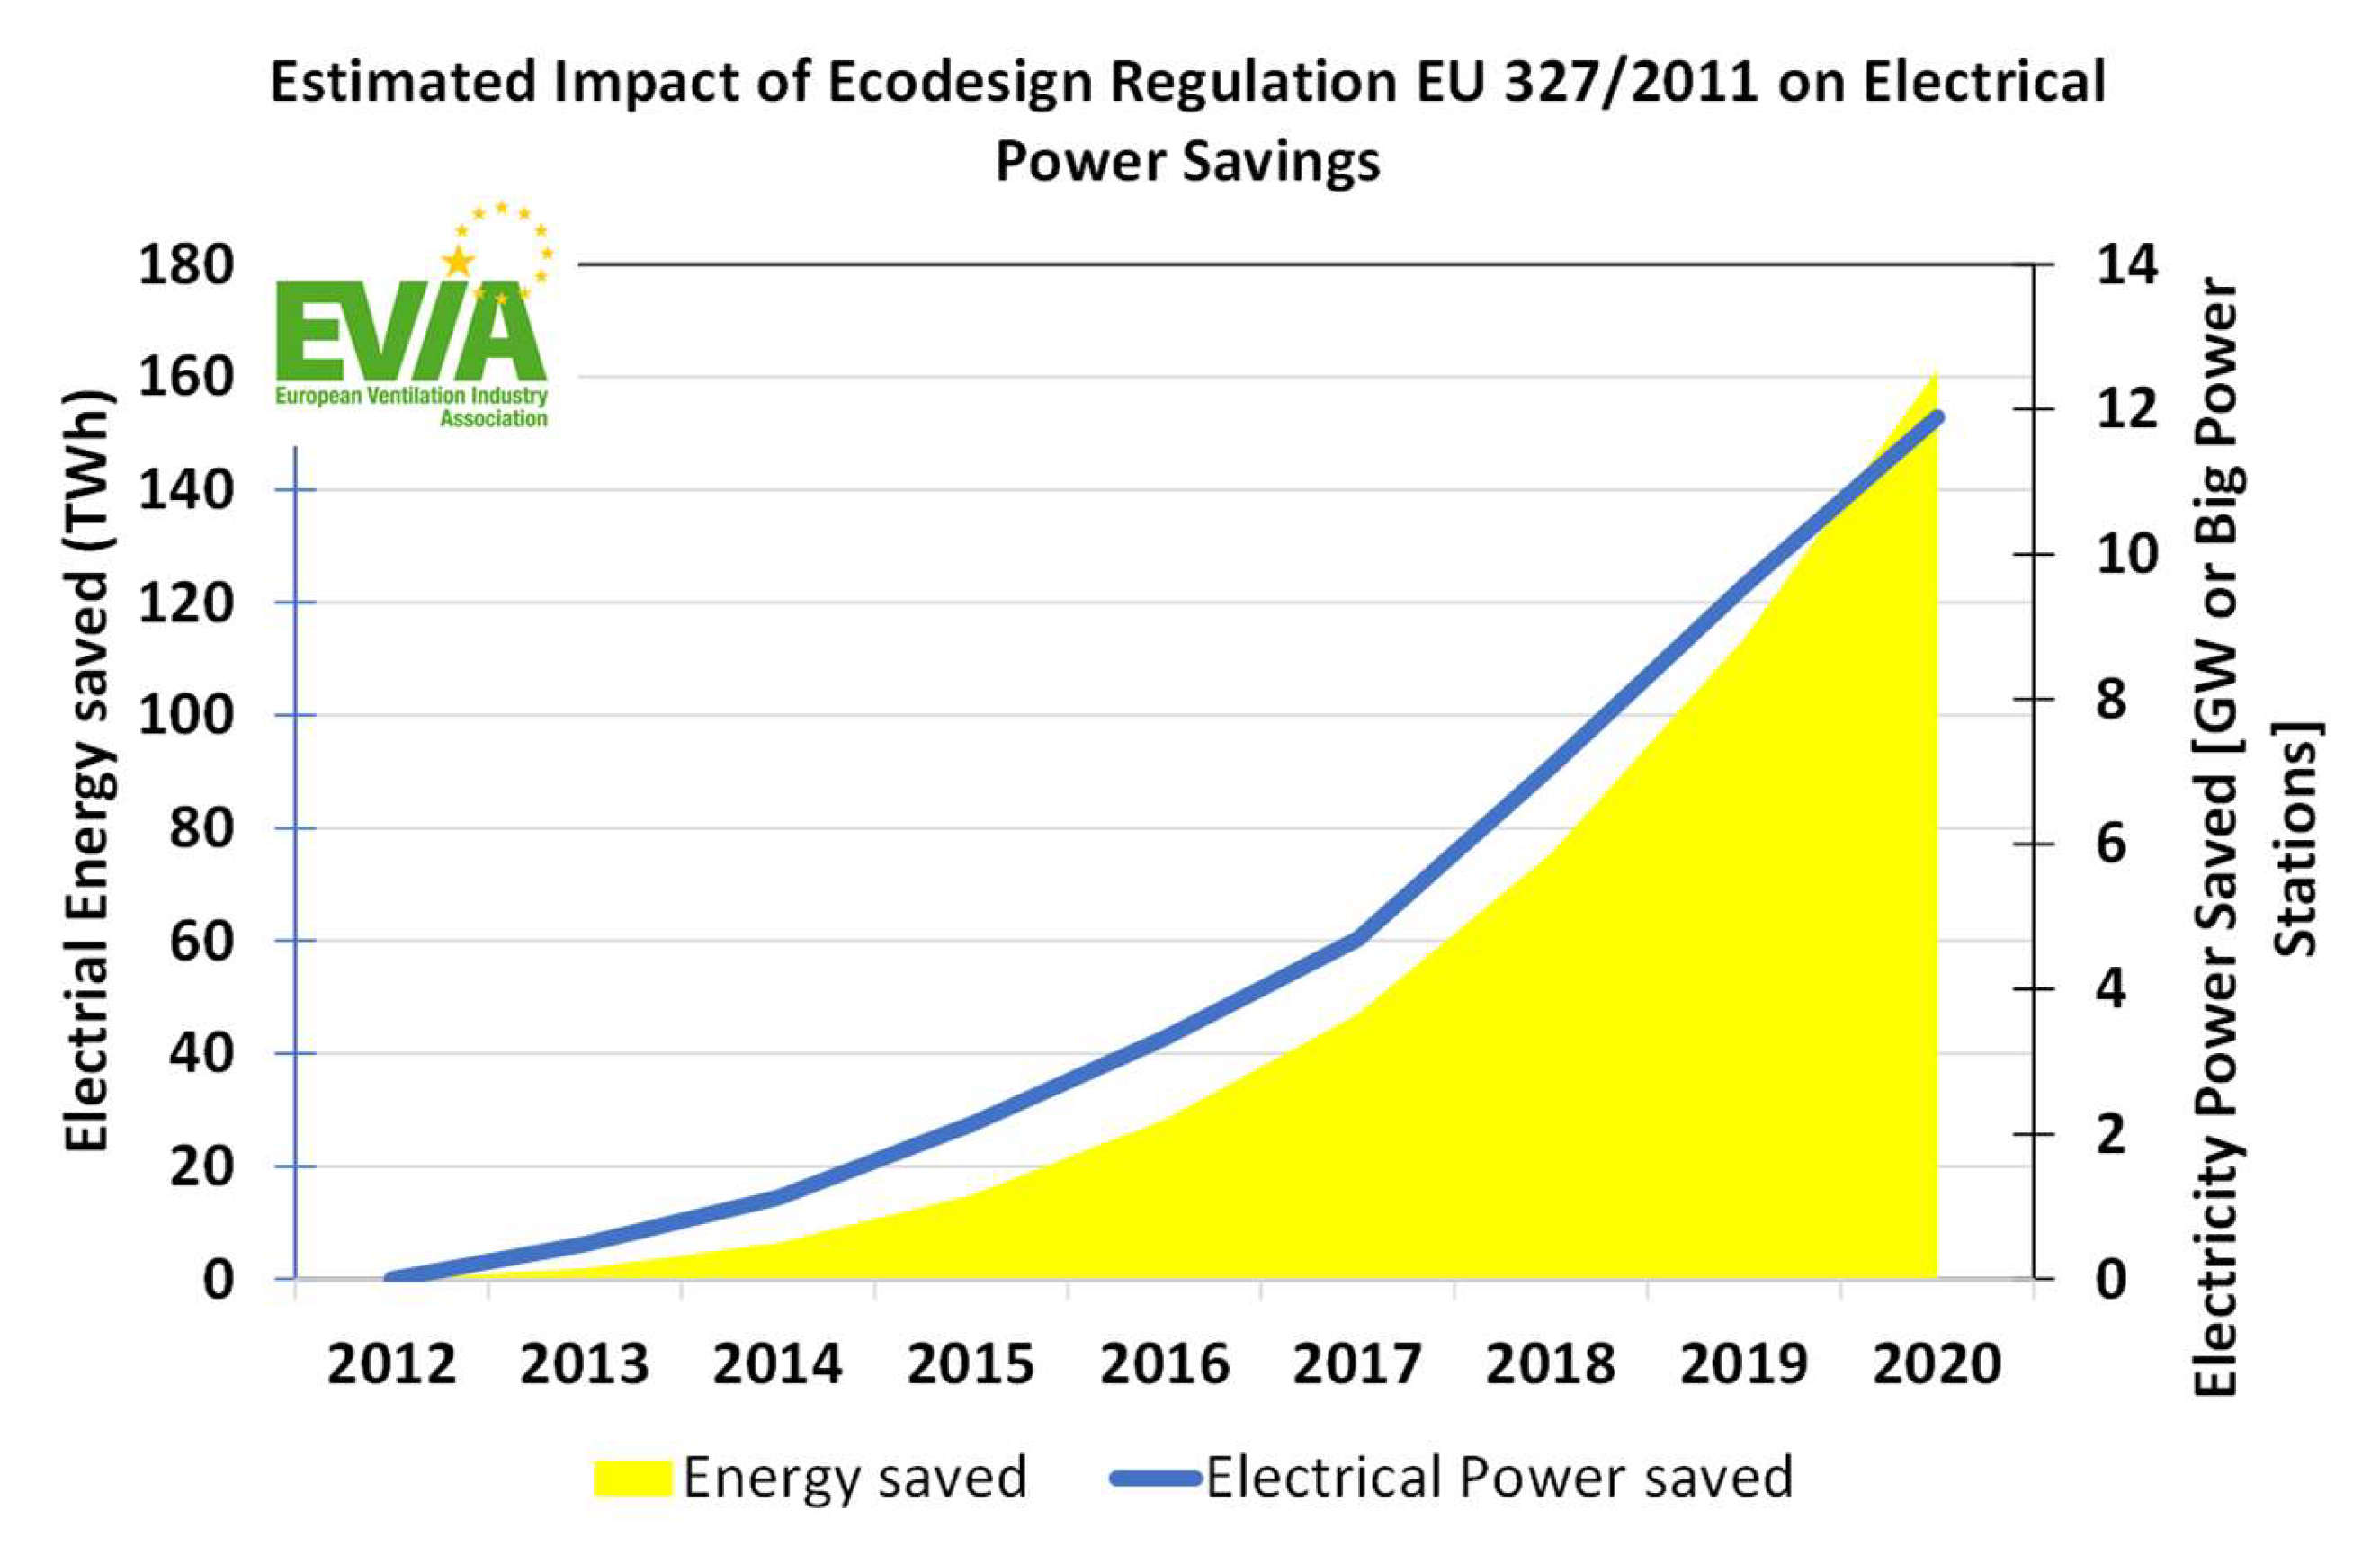
Since the beginning of the Eco-Design Regulation, the need to regulate a “component” such as a fan was challenged, because, mainly, it was not a final product placed on the market to be used as such. Most of fans are integrated somehow in other products or systems, which are partly covered by other regulations. Moreover, the average power saved per fan (over all sizes in the scope of the regulation) does not seem to be very high. However, we have to consider the huge number of fans (12.5 million in 2019) and their typically long operation time. A simple example for 2019: 12.5 million fans placed on the market, with a 200 W average savings, is 2500 MW electrical power savings in this year in the EU-28. Cumulating the achieved savings from 2012 (first tier of Eco-Design 3027/2011), it is 12 GW or 12 big power stations or 150 TWh of electricity saved (
Figure 6). The reduction in CO
2 emissions achieved since 2012 until 2020 is approx. 74 MT (
Figure 7).
4. Fans Implemented in Other Products
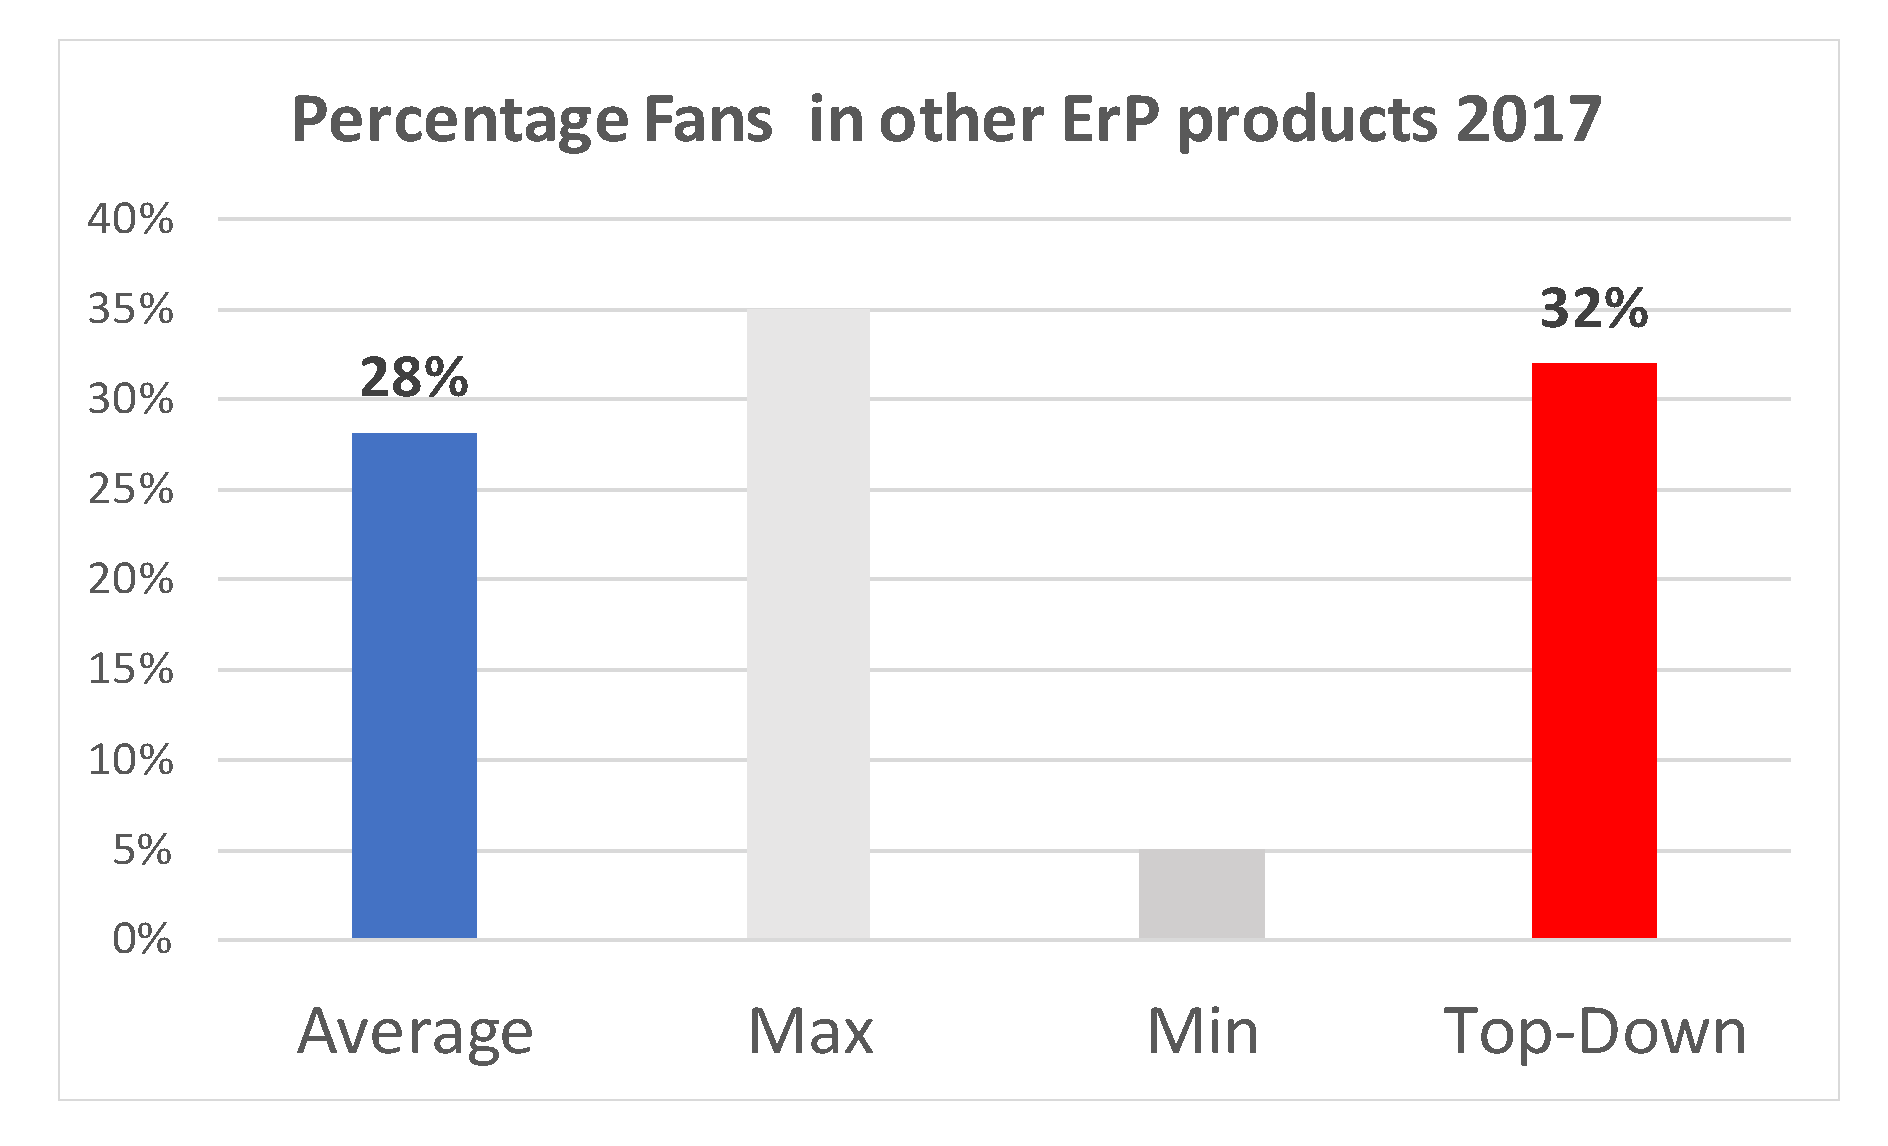
We asked manufacturers in 2017 and 2020, in a qualitative way, how much of their fan sales were estimated to be used or implemented in other eco-design-regulated products and how much are placed on the market to be implemented or used in non-regulated applications and products. This questionnaire had high uncertainty because some fans might be used in regulated or non-regulated products downstream. Thus, this was only a qualitative impression of the manufacturers’ that was weighted by their estimated market share.
Figure 8 shows the results of the questionnaire with an average of 28% of the fans integrated in other products. It was different for each fan manufacturer depending on their product range and customers, from 5 to 35%. A top-down approach was conducted by analysing the sales of their ErP products, with a significant number of fans implemented (i.e., ventilation units, air heating and chillers, heat pumps, room air conditioner, and professional refrigeration), resulting in 32% of the fans being implemented in ErP-regulated products. From the questionnaire there was 28% and from the top-down analysis there was 32 in the same range, so this seems reasonable.
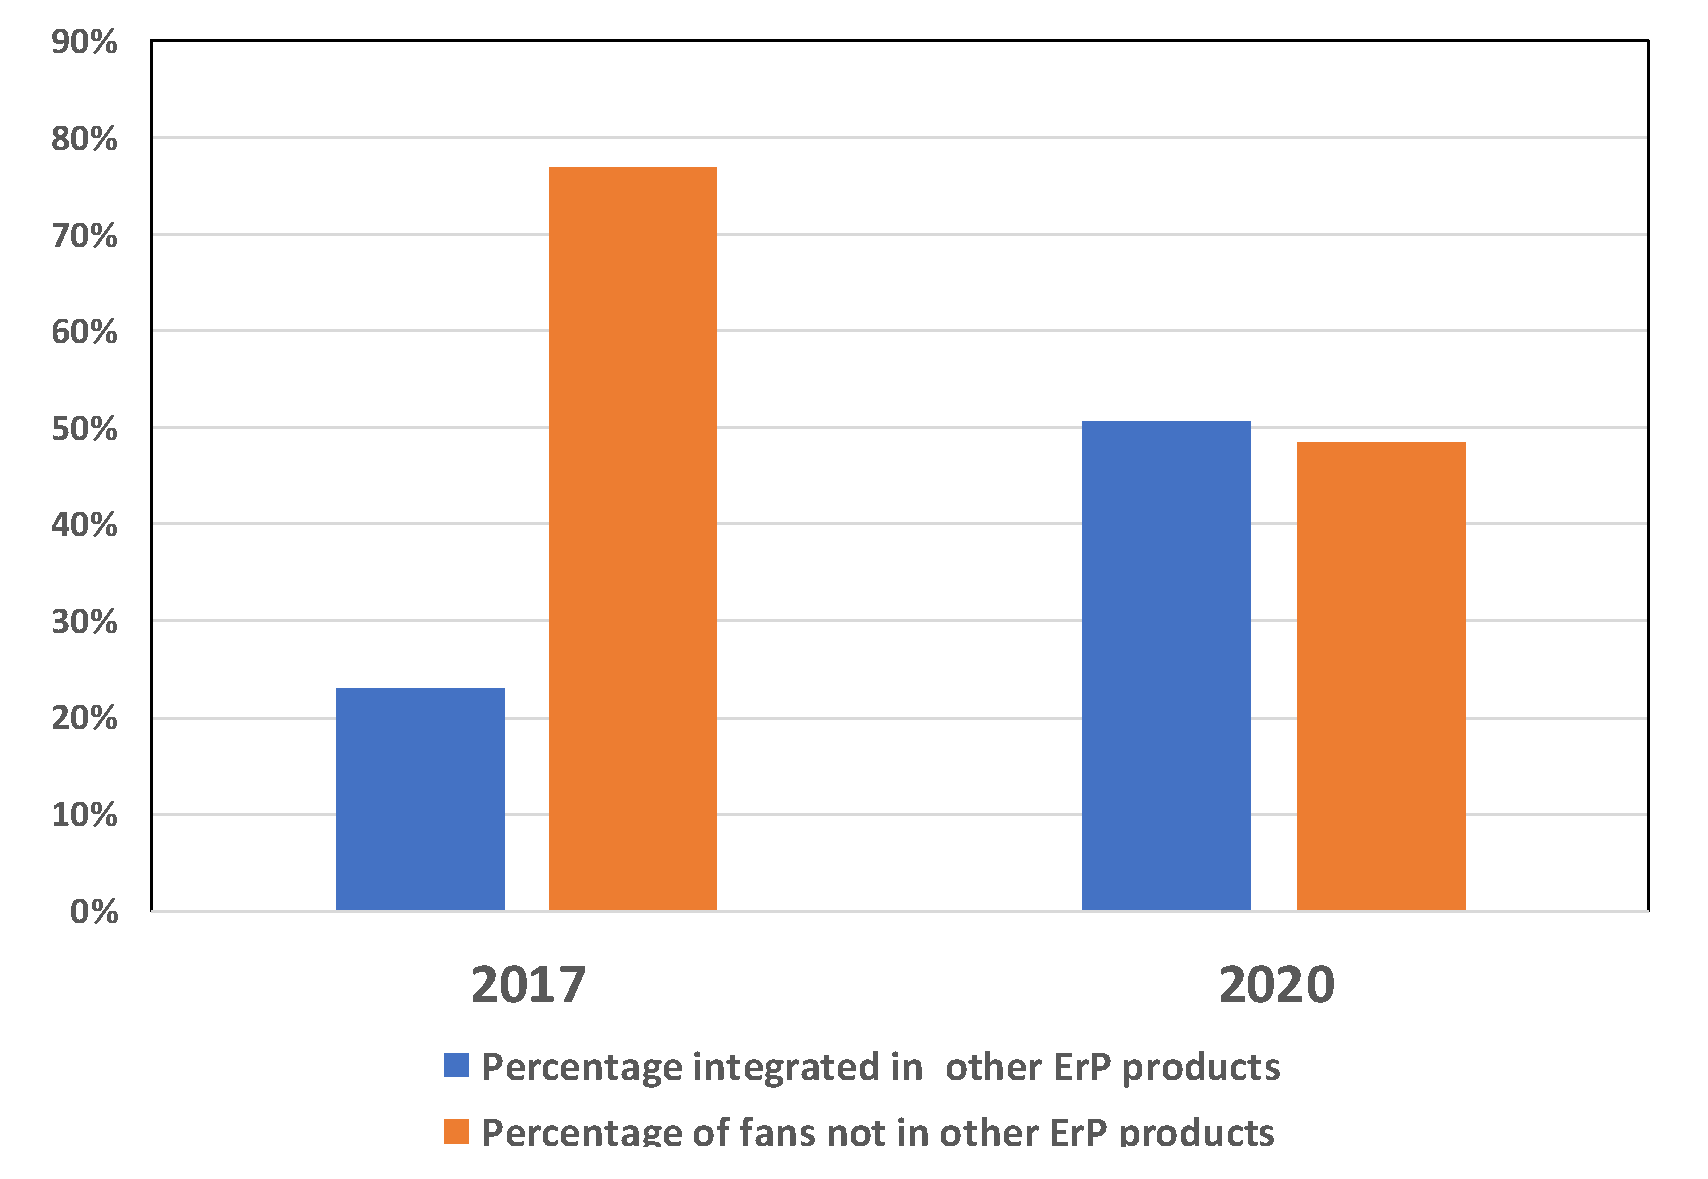
The 2020 questionnaire, as shown in
Figure 9, provided similar results as in 2017, and there was a shift to ~50% of fans being integrated in other ErP-regulated products. One of the reasons for this shift is that other regulations such as EU 2281/2016 on air heating and cooling devices, EU 1188/2015 on warm air heaters, and EU 1253/2014 on ventilation units came into force. Still, 50% of fans were integrated into nonregulated products.
5. Conclusions
This study shows that the Eco-Design Regulation on fans is an important driver of higher efficiency products and components. The transformation of the market to more efficient products was quite quick, but it clearly followed the upgrading of the regulation. We saw that a stop or interruption in the progress of the revision immediately stopped the transformation of the progress to more efficient fans. This occurred in 2018 when the planned revision of EU 327/2011 was interrupted for nearly 4 years until now.
It is important to regulate components such as fans even though they might be implemented in other energy-related products. The reasons for this include the availability of efficient products at reasonable prices, fewer options to bypass the regulation by implementing fans outside the EU market into other products, and significant savings would be lost.


