
Mapping Public-Planner Conflicts in SUDS Implementation Using Cultural Dimensions—A Case Study

Abstract
:1. Introduction
1.1. Climate Change and Urban Flooding
1.2. Sustainable Urban Drainage Systems, SUDS
1.3. Climate Adaptation within Norway: Implementation and Preception
1.4. Hofstede’s Cultural Dimensions Theory
1.5. Objective and Scope
- What variability exists between the scores of municipal actors and the public within Hofstede’s six dimensions?
- Does a thematic analysis of texts and interviews with municipal actors and local users verify the findings of the Hofstede cultural compass tool?
- What recommendations can be drawn from the discrepancies between the culture of the municipal planning office and the local public to better inform the decision making and planning processes of SUDS?
2. Case Studies: Brook Restorations in Trondheim, Norway
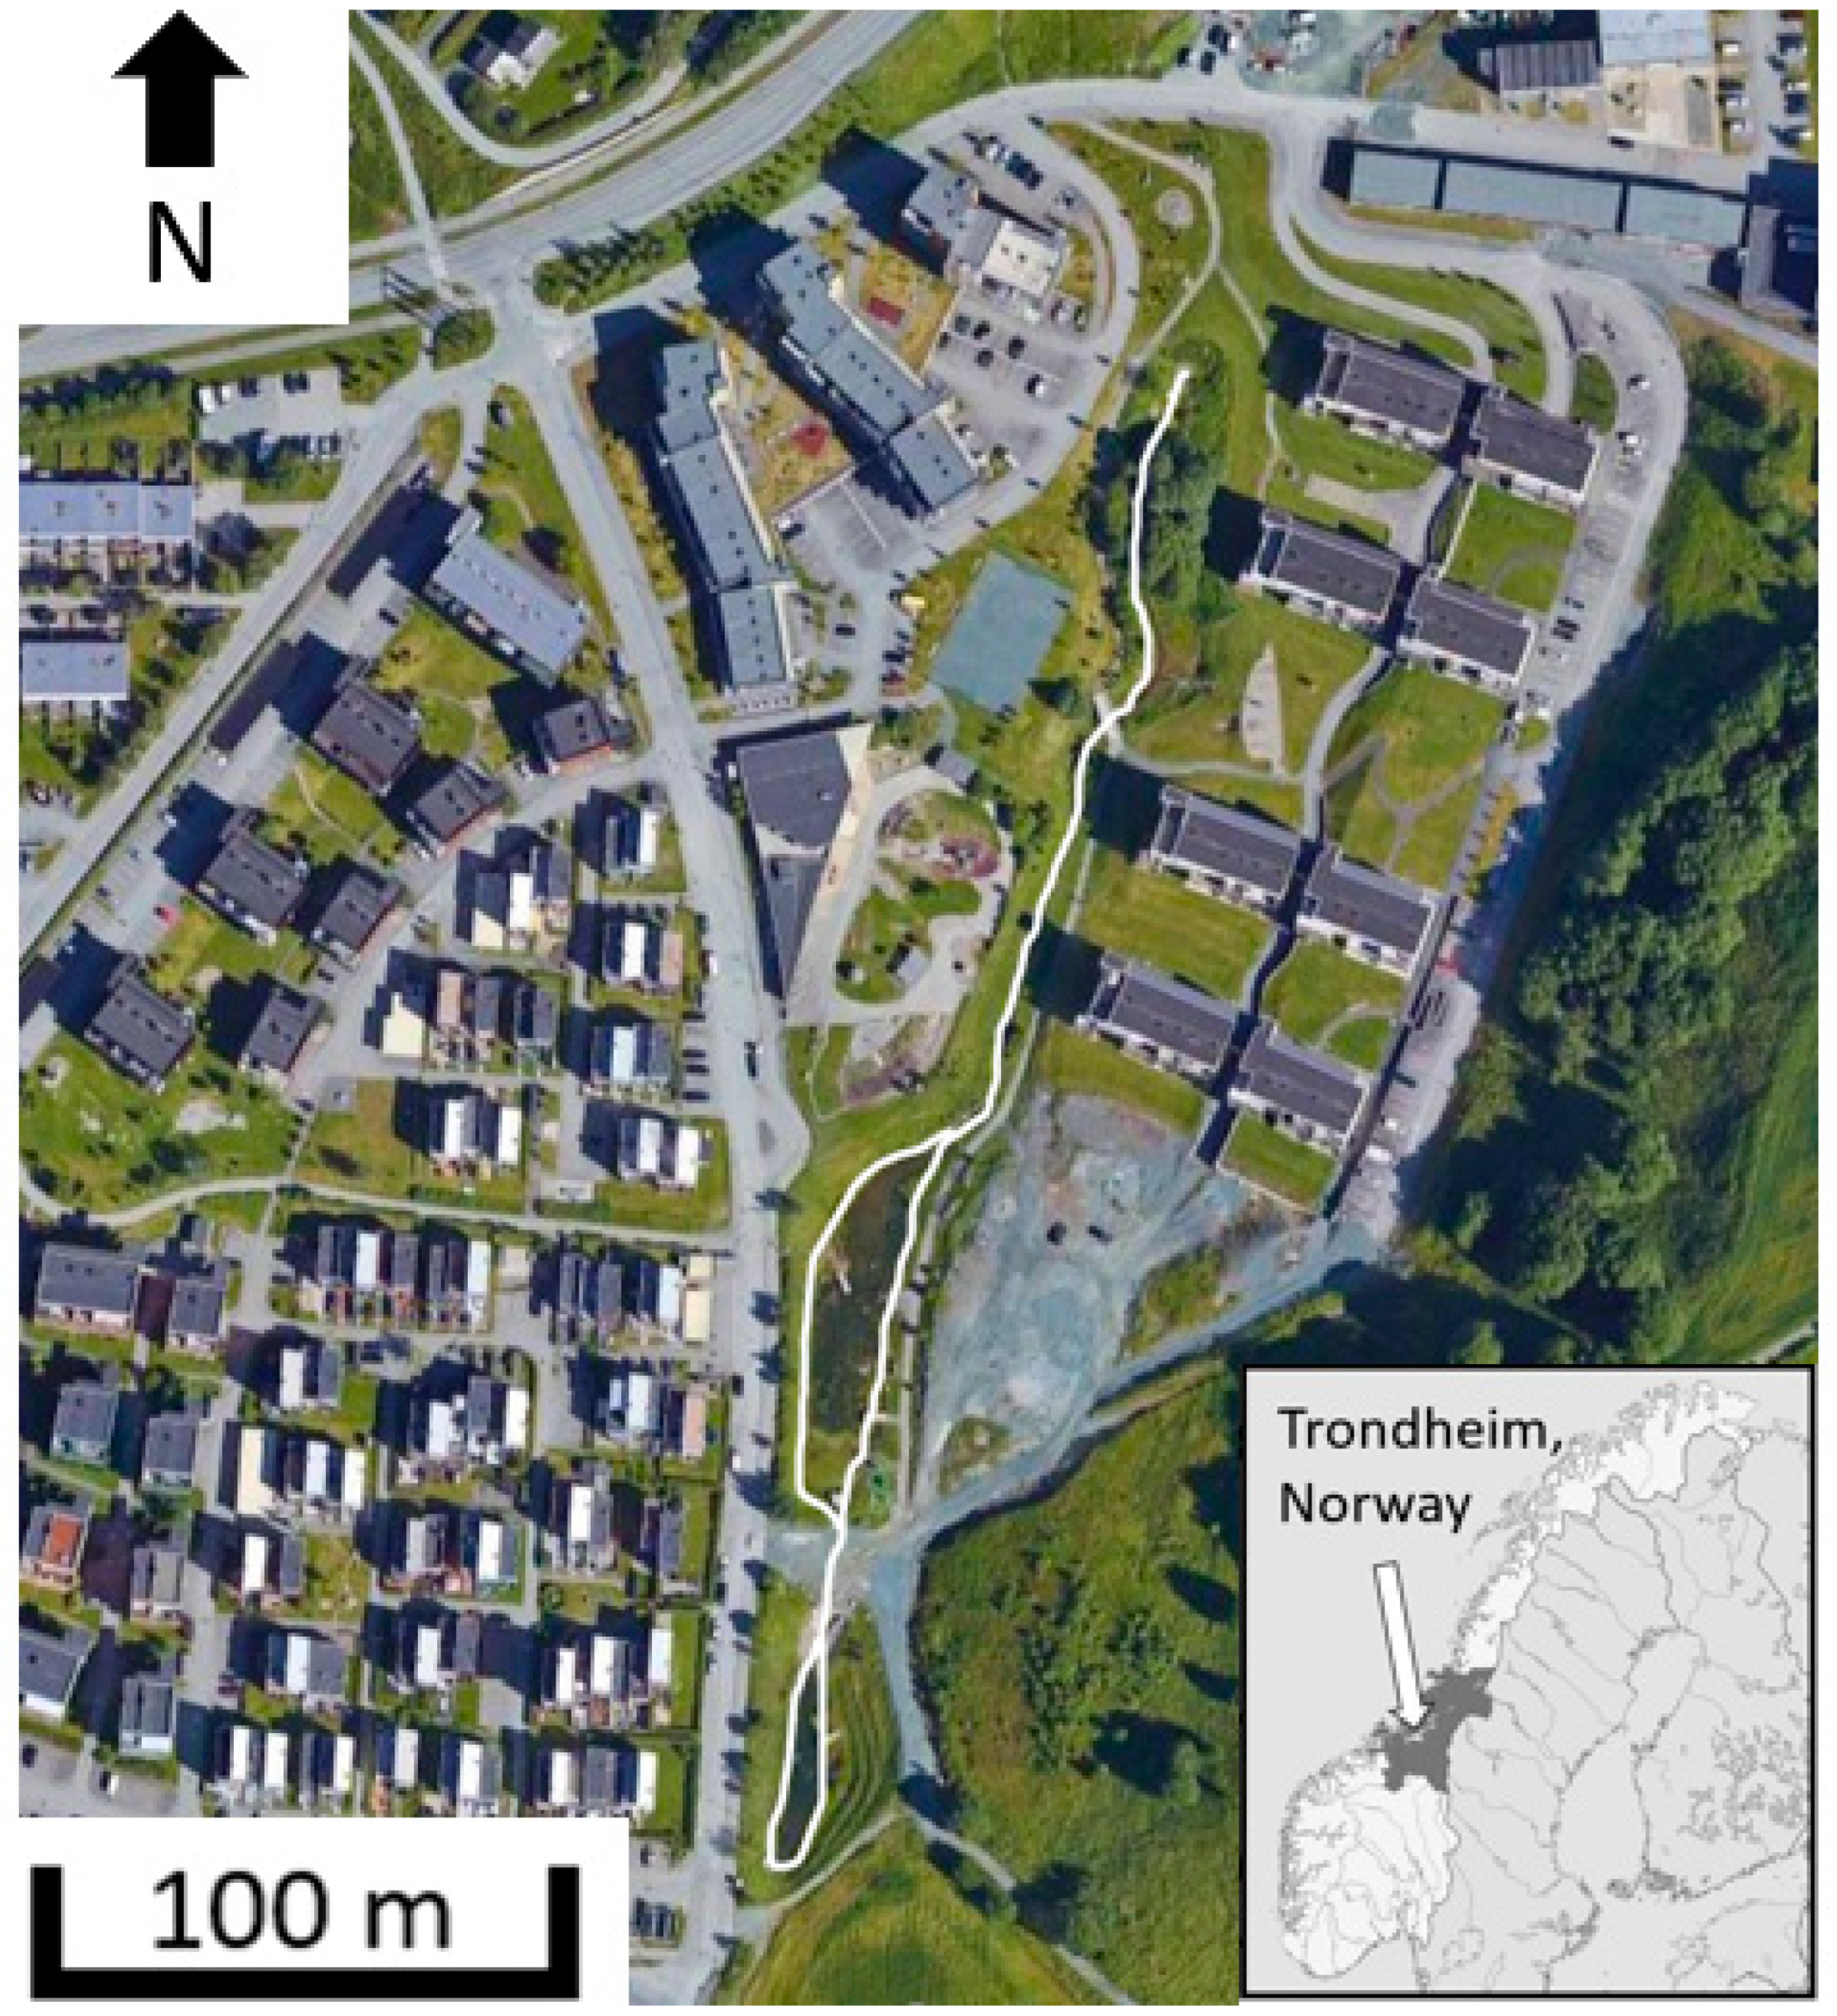
2.1. Blaklibekken
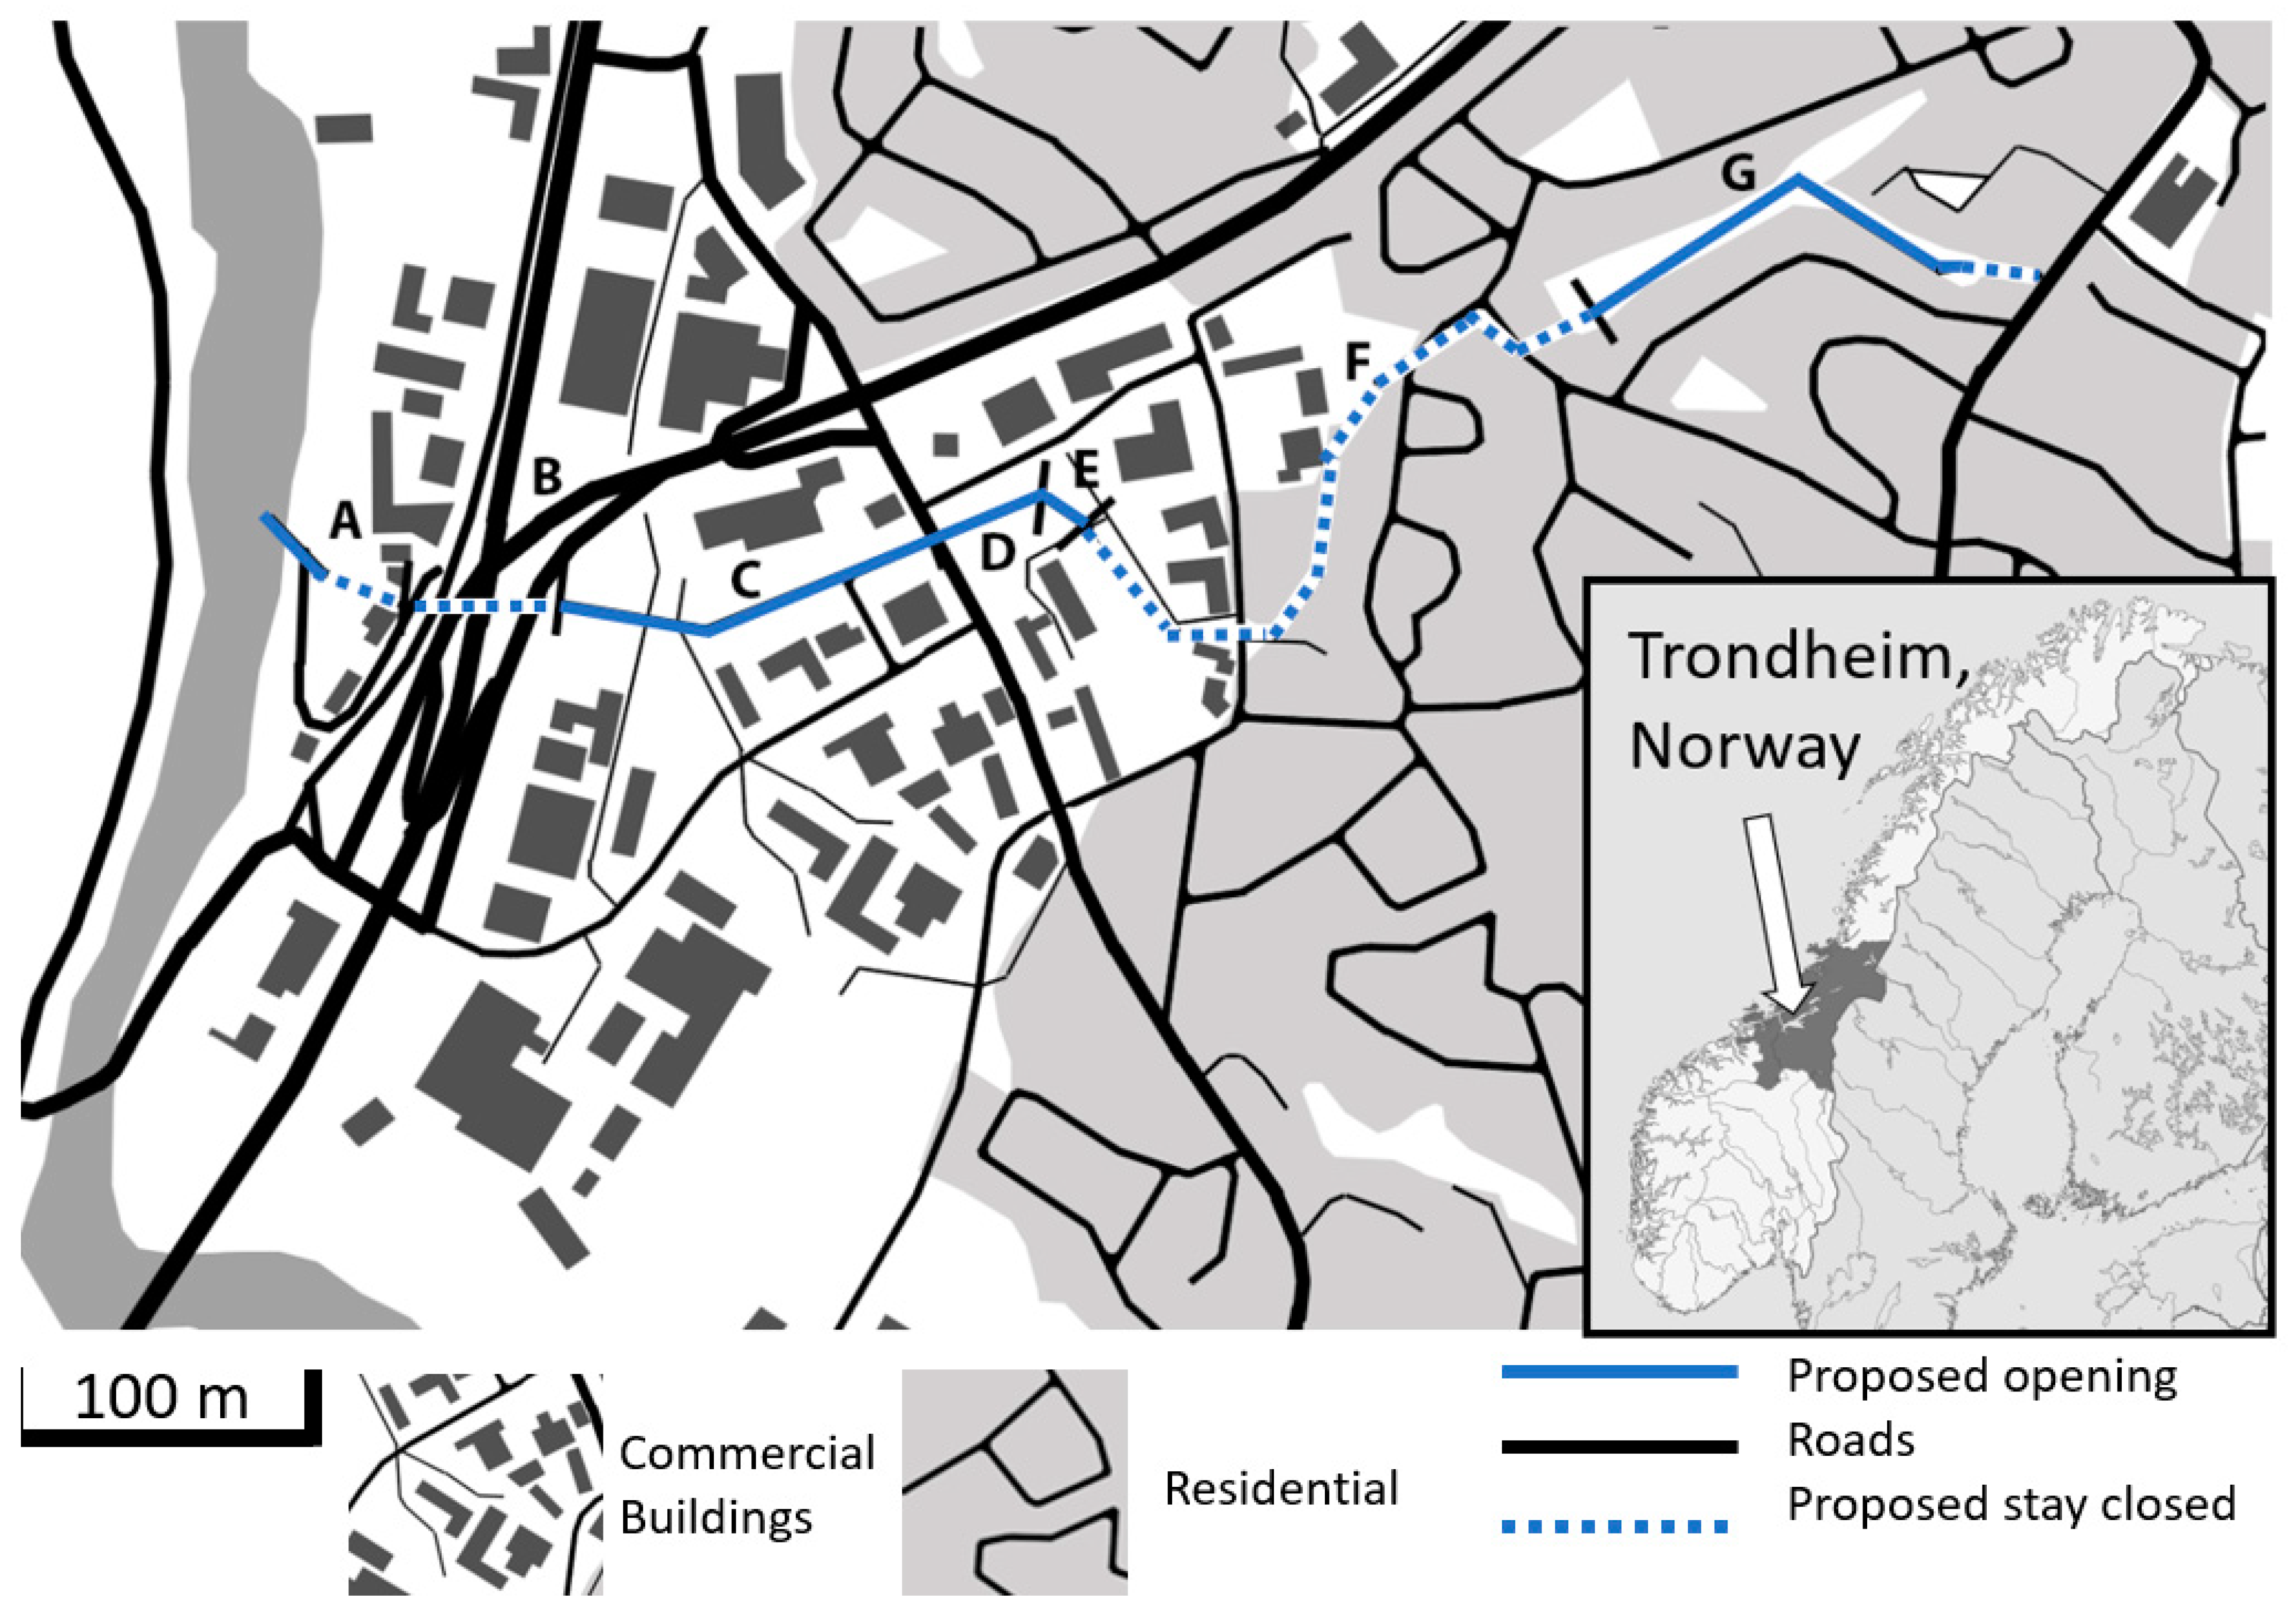
2.2. Fredlybekken
3. Theoretical Framework
3.1. Ethnography and Hofstede’s Cultural Dimensions
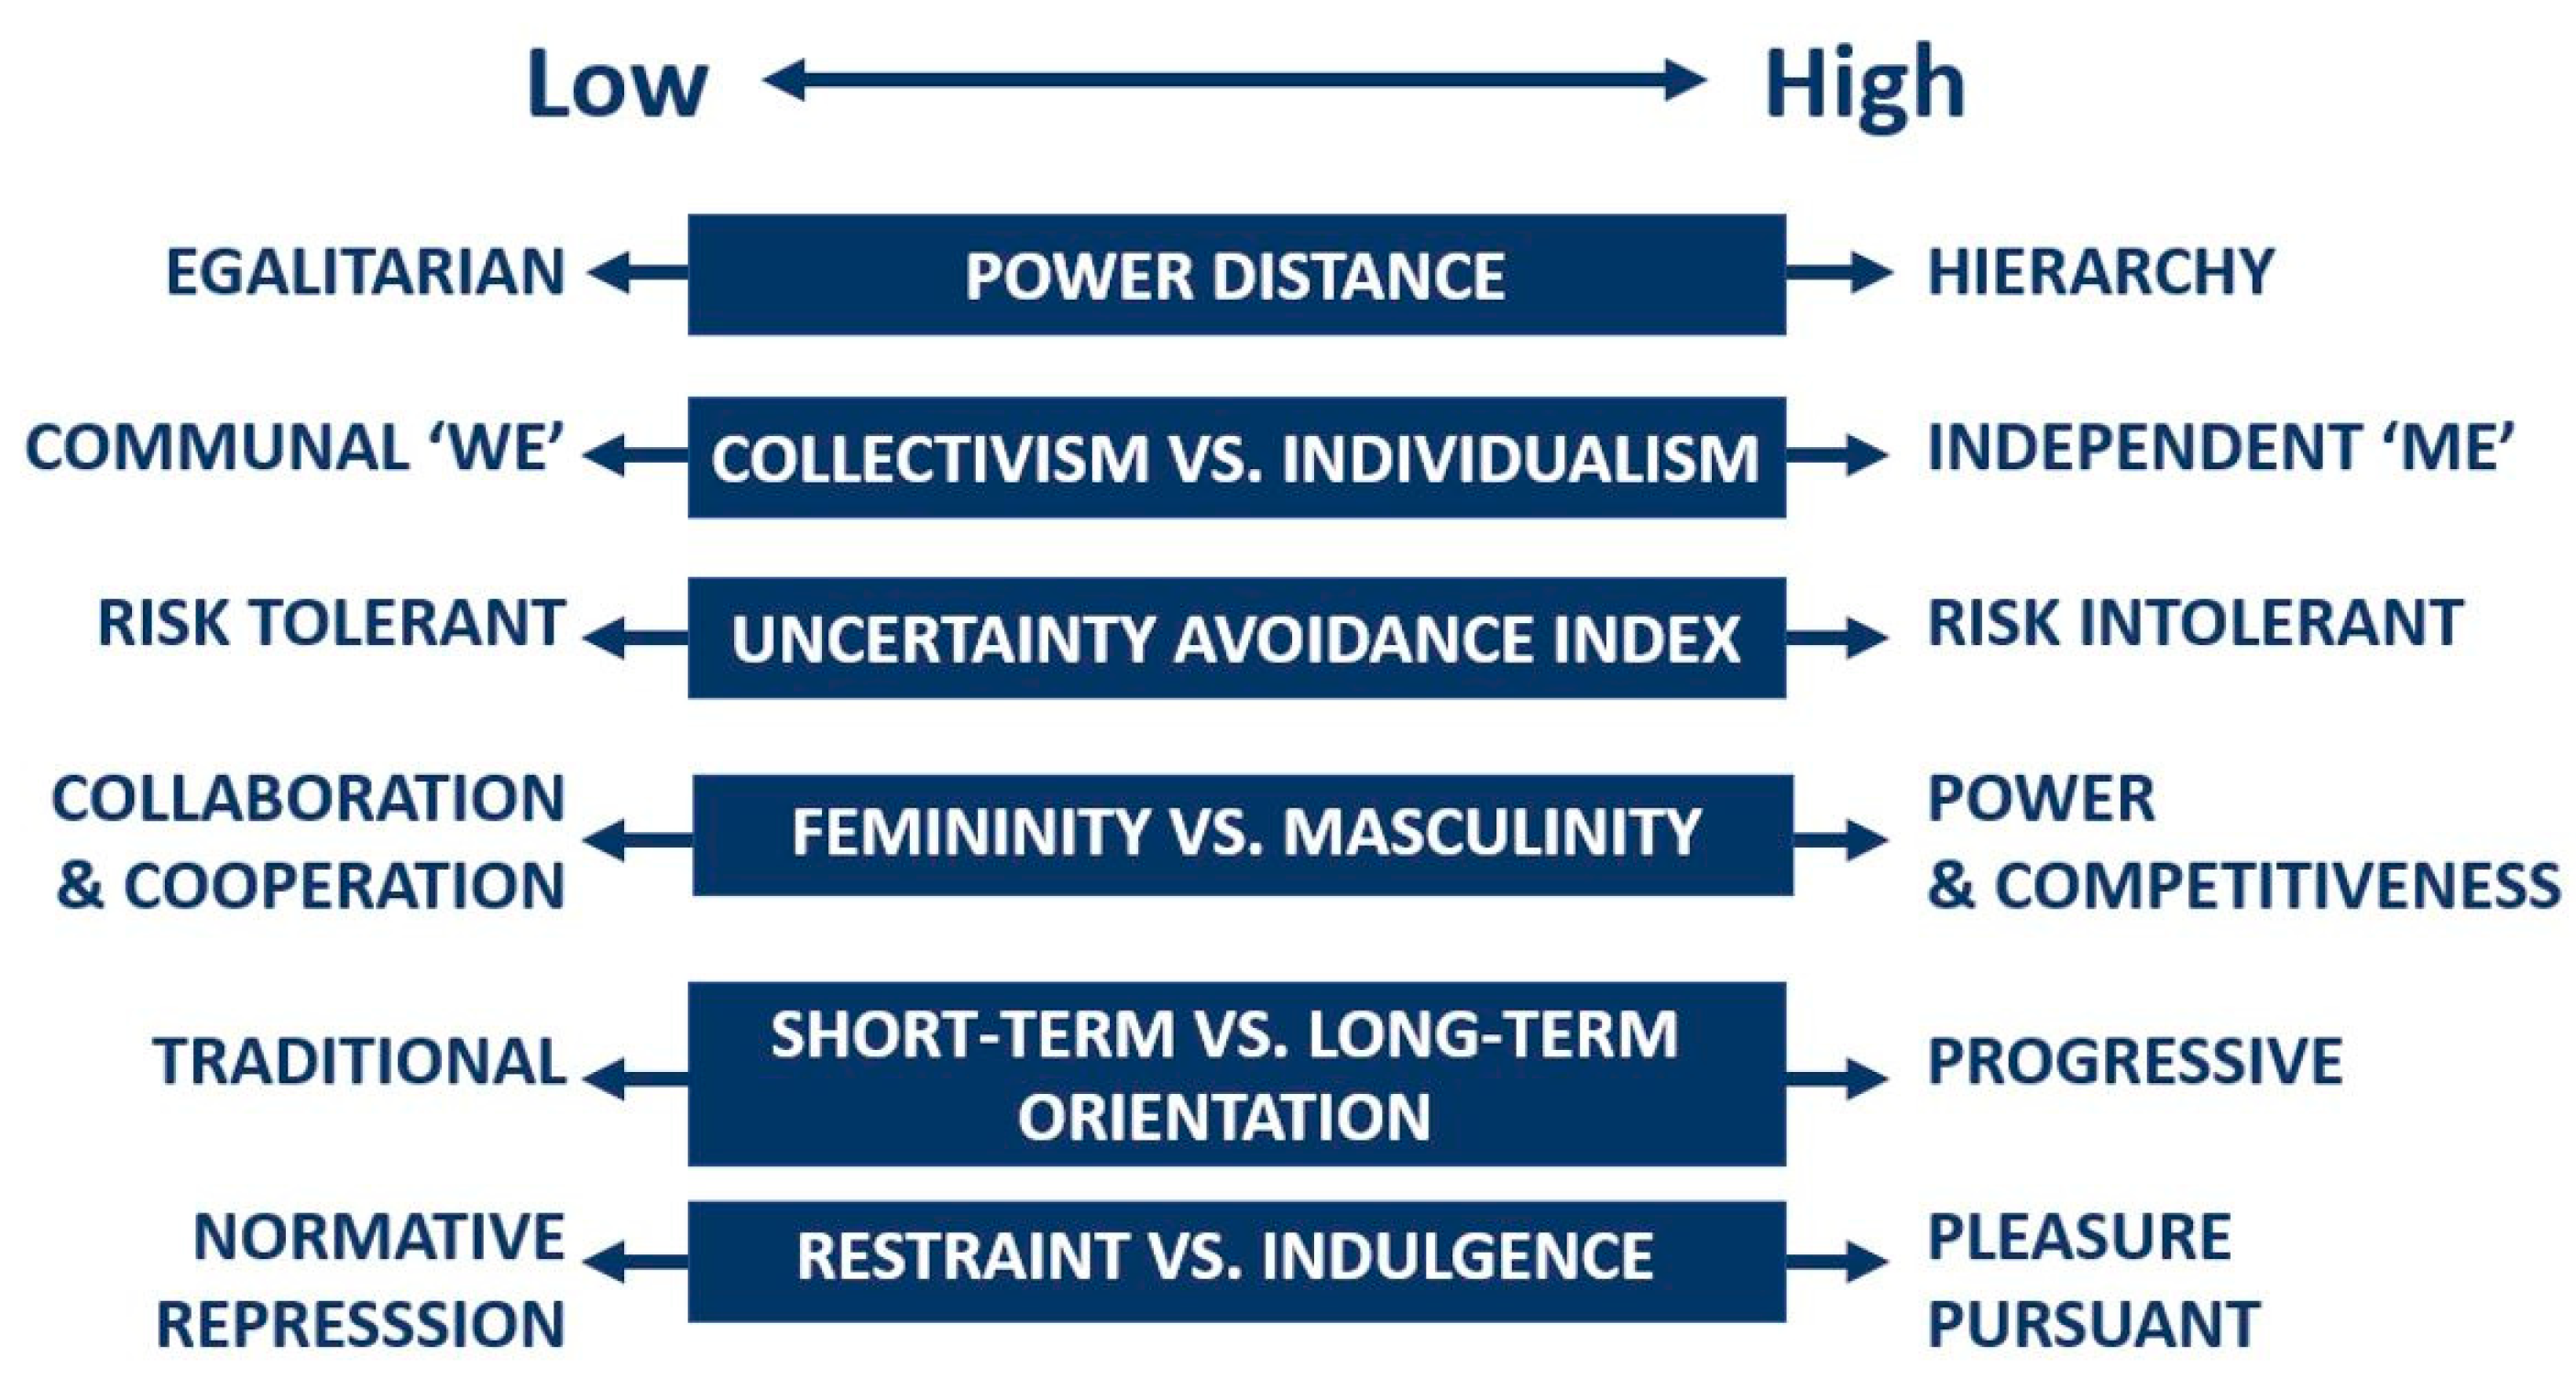
3.2. Hofstede’s Cultural Dimensions Model
4. Methodology
- Literature review;
- Document study;
- Interviews;
- Surveys;
- Thematic Analysis.
4.1. Literature Review
4.2. Document Study
- One consultancy evaluation [41];
- Nine Norwegian University of Science and Technology engineering evaluations;
- Seven municipal planning commission summaries;
- Six newspaper articles;
- One regional SUDS feasibility study;
- One national review evaluation;
- One municipal plan.
4.3. Interviews
4.3.1. Semi-Structured Interviews with the Municipality
4.3.2. Semi-Structured Interviews with Blaklibekken Area Users
4.3.3. Semi-Structured Interviews with Fredlybekken Residents
4.4. Hofstede Cultural Survey
4.5. Reflexive Thematic Analysis (TA)
- Step 1: Become familiar with the data
- Step 2: Generate initial codes
- Step 3: Search for themes
- Step 4: Review themes
- Step 5: Define themes
- Step 6: Write-up
4.6. Thematic Coding
5. Results
5.1. Literature Review
5.2. Hofstede Cultural Survey—General Public and Municipality
6. Variability, Verification, and Recommendations
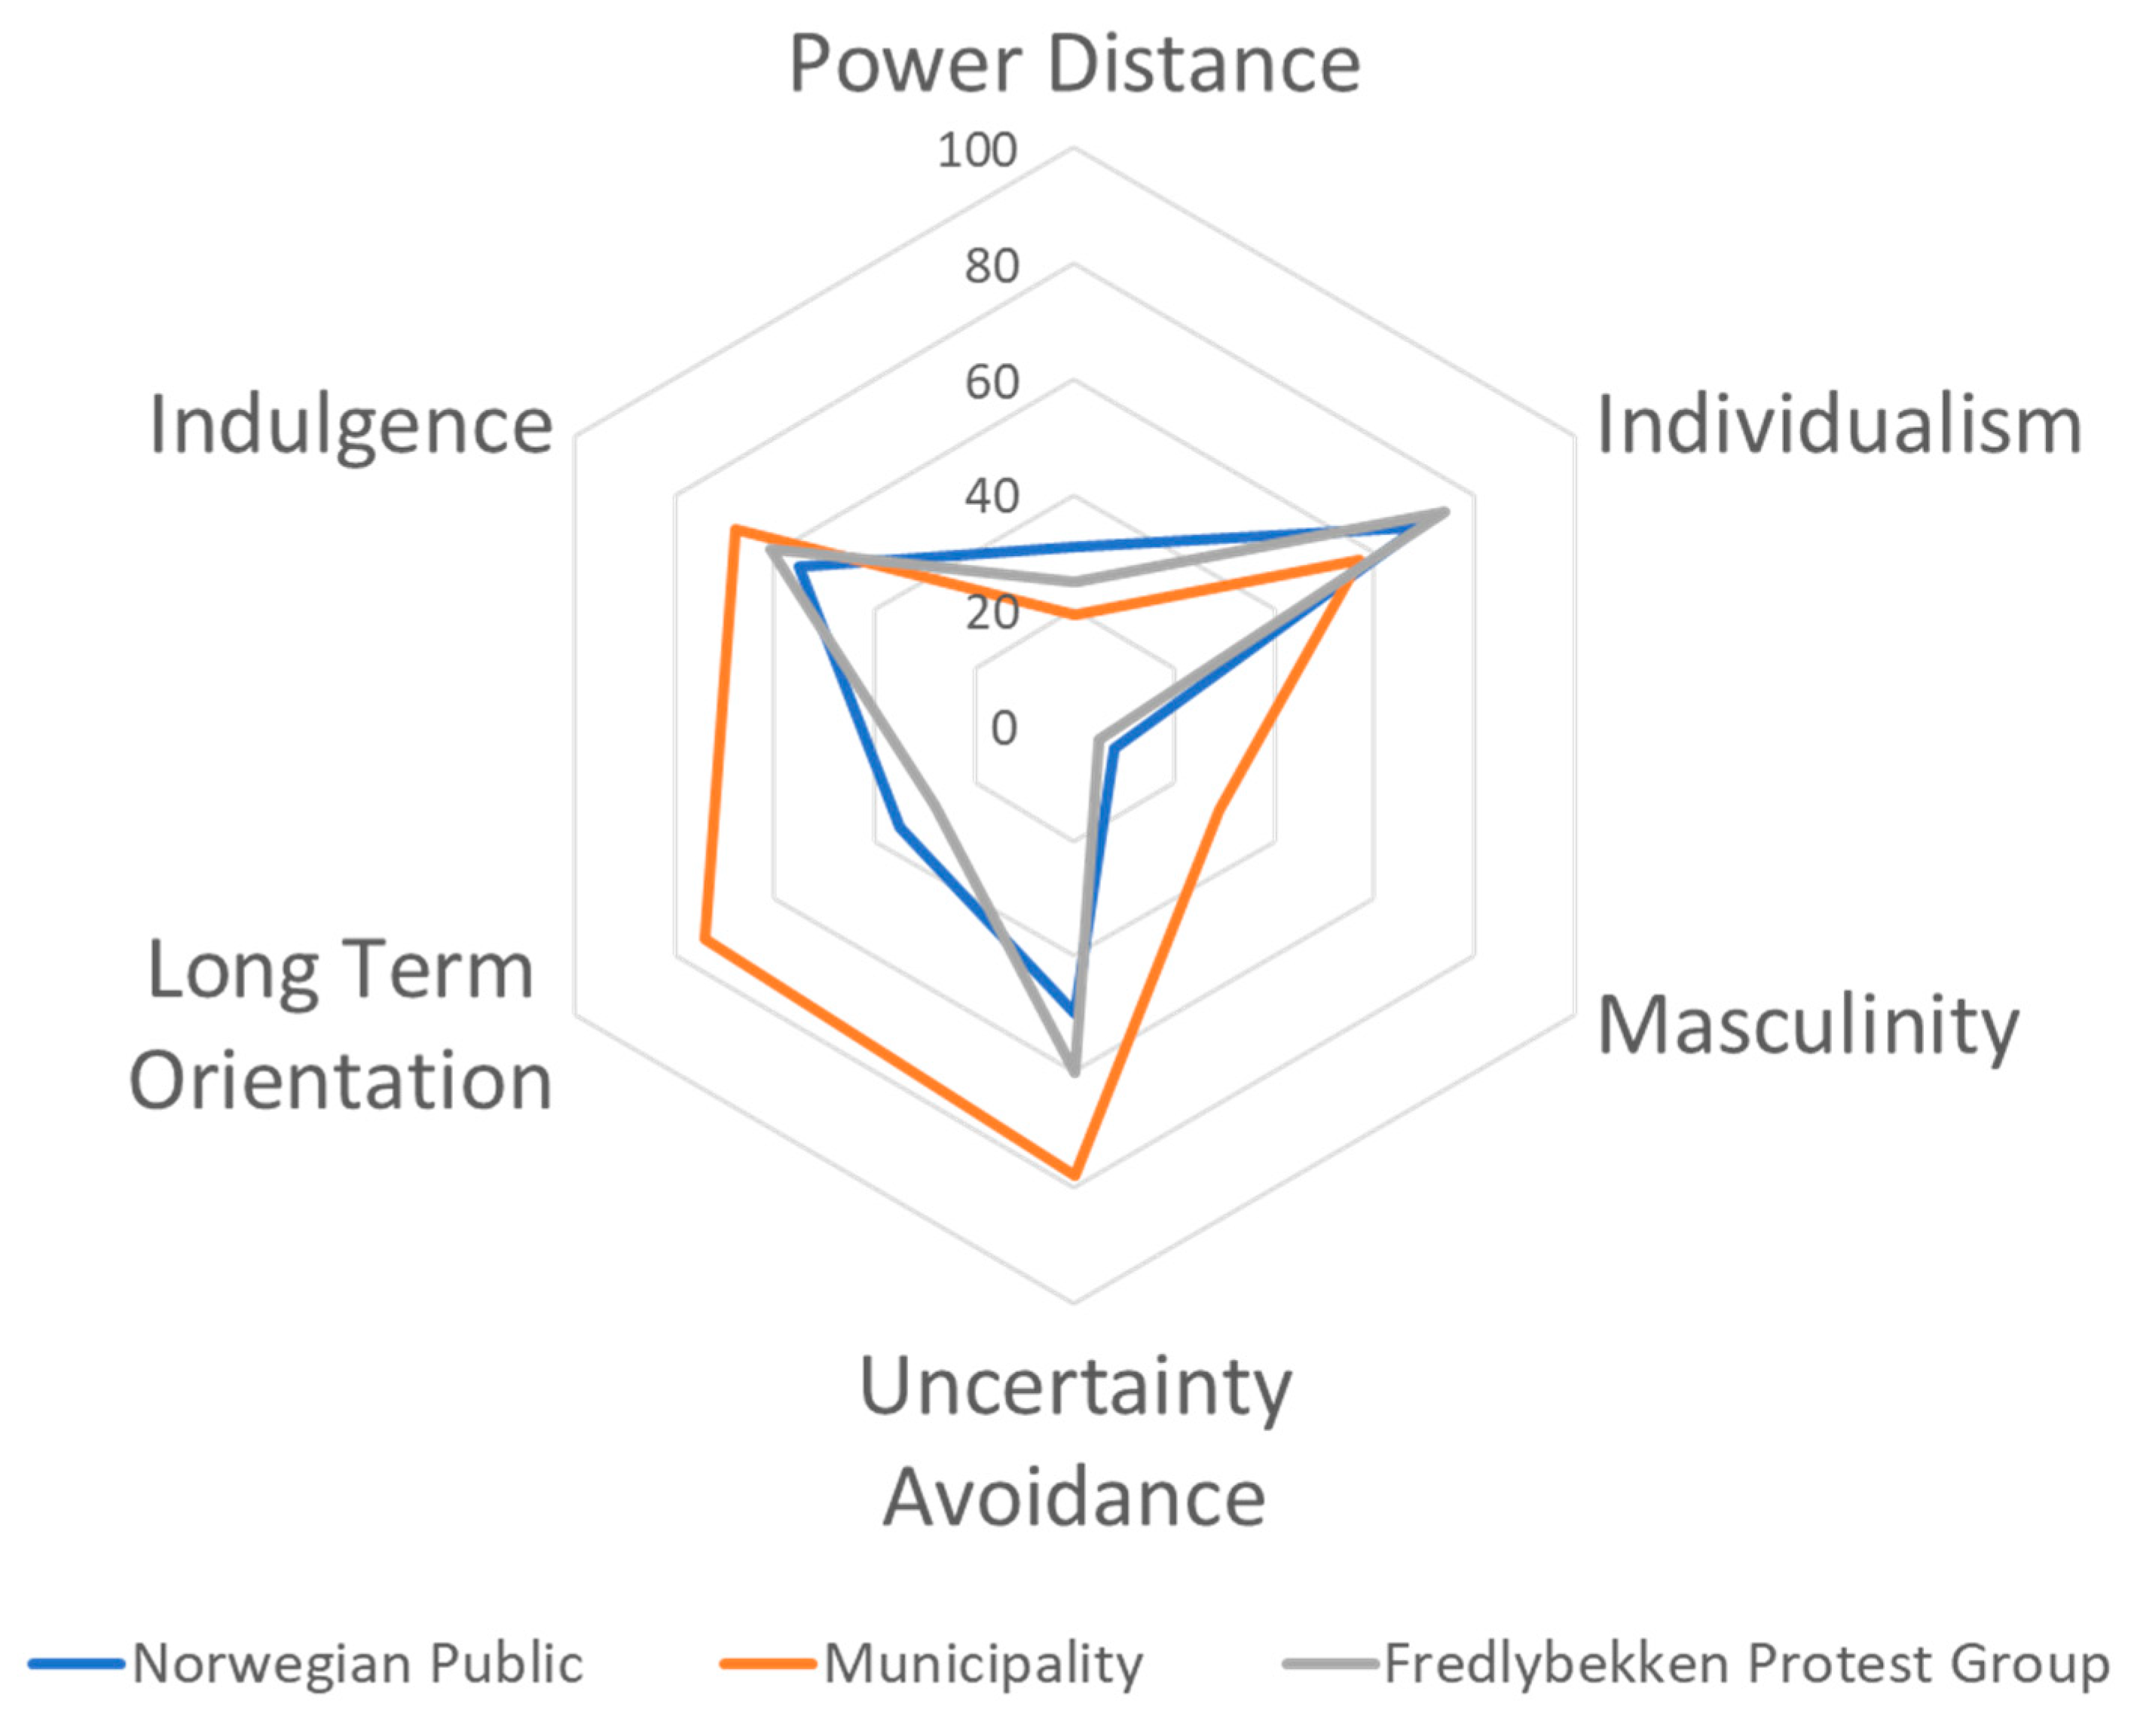
6.1. Long-Term Orientation versus Short-Term Normative Orientation (LTO)
- (1)
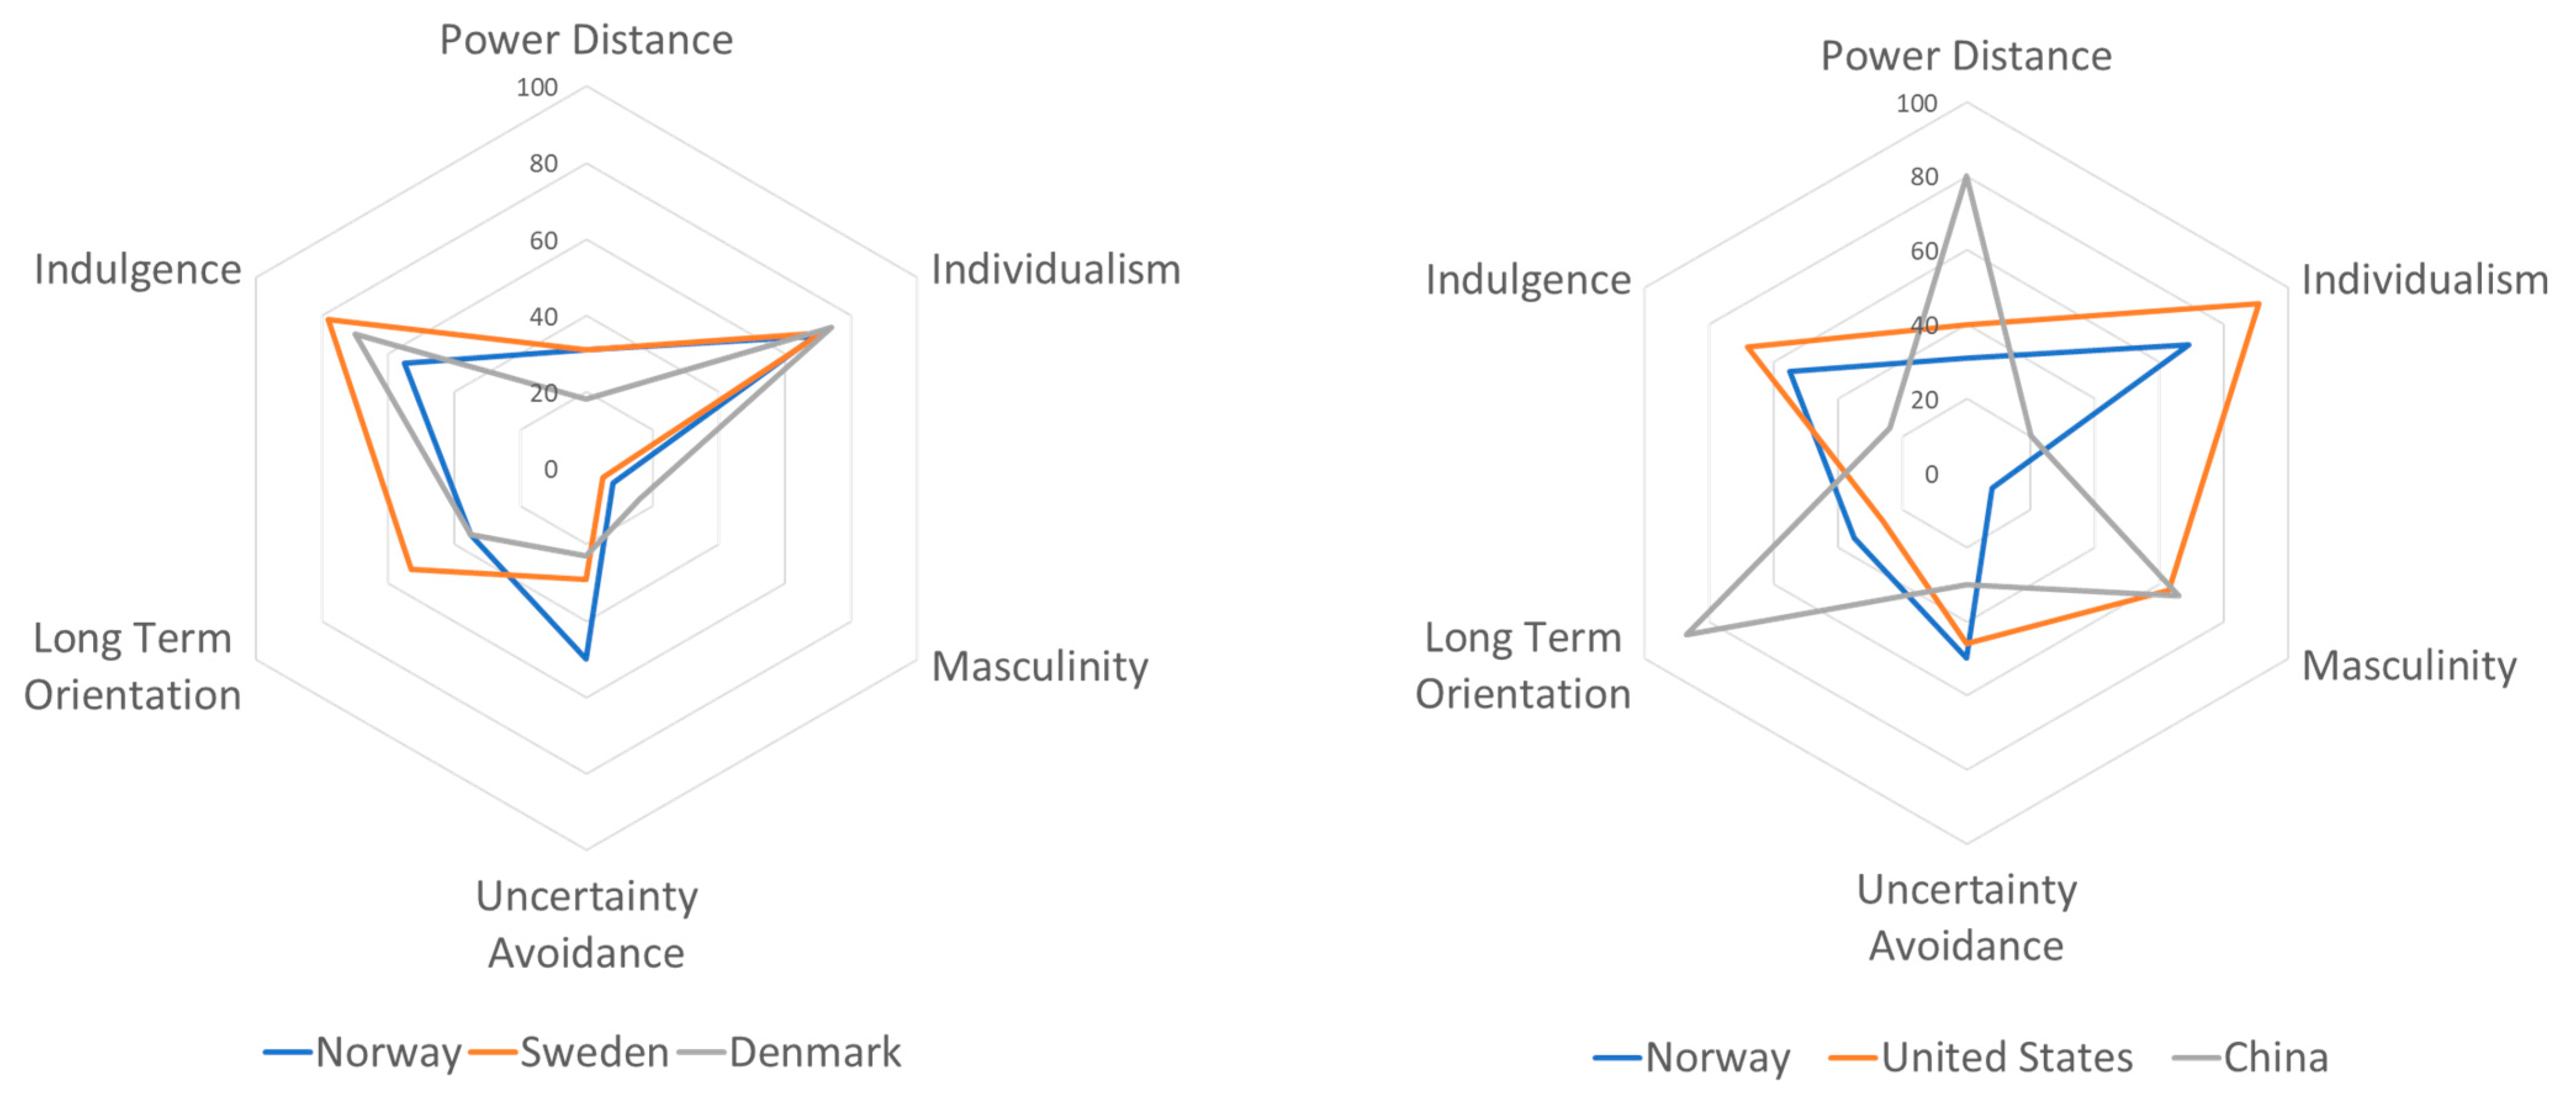
- The low score of 35 indicates that Norway has a more normative than pragmatic culture. People in such societies have a strong concern with establishing an absolute truth; they are normative in their thinking. They exhibit great respect for traditions and norms while viewing societal change with some suspicion. This score also correlates with a relatively small propensity to save for the future and a focus on achieving quick results. The municipal score of 74 is 39 points higher than the general population, which is of particular note as it is the largest divergence registered among all the dimensions. The municipal score reflects the municipality’s tendency to take more pragmatic approaches, encourage thrift, and make efforts to plan long-term to prepare for the future;
- (2)
- This dimension had the strongest correlation between the results of the survey and the thematic analysis of the transcripts. The results of Hofstede’s findings were confirmed, with 91% of the 47 statements affirming this divergence. Statements such as, “We don’t understand why they (municipality) had to change things?” (Resident interview #54), “It was fine the way it was before” (Resident interview #72), “They are frustrated because they (residents) expect quick results” (Municipal interview #2), and “I don’t think they (residents) necessarily understand the long-term benefits of these projects” (Municipal interview #1). A total of 100% of the municipal statements affirmed the findings of the LTO dimension, while only 75% of the public statements affirmed the findings. It is also of note that 65% of the total collected LTO statements were made by the municipality, which also confirms the municipality’s greater focus on LTO goals;
- (3)
- Based on these findings, the following recommendations, drawn from Hofstede’s cultural theories, are applied specifically to the Trondheim case.
- The municipality may be underestimating the importance of pleasant relations with the public and serving the public’s self-interests;
- Municipal actors may be annoyed by the fact that the public is not proactive concerning their desires and wishes.
- If the municipality offers inconsistent information to the public, they may no longer be credible, as the public thinks in exclusive, not inclusive, terms;
- Municipal actors may be upset by the outspoken way the public presents themselves, expecting them to show more humility.
- They may demotivate the public by overloading them with details without giving them the overall picture;
- Municipal actors may be upset that their wisdom is questioned by the public;
- Municipal actors may not feel that they are paid the respect they deserve.
6.2. Uncertainty Avoidance Index (UAI)
- (1)
- Norway scores 50 and thus does not indicate a clear preference in this dimension. The municipal score on uncertainty avoidance is 78, 28 points higher than the public’s, and is therefore of considerable note. High UAI scores reflect strong relationships with rigid codes of belief or behavior, are highly principled, and are intolerant of unorthodox behaviors and ideas. This score also reflects a lower tolerance for uncertainty and ambiguity and an interest in planning for and controlling an unknown future;
- (2)
- This dimension had the smallest collected sample of statements of the 3, and the results of Hofstede’s findings were confirmed, with 77% of the 18 statements affirming this divergence. It should be noted that 14 of the 18 statements were from the municipality, showing a one-sided awareness of uncertainty avoidance, further affirming the findings. Of the 4 statements collected from transcripts of the public, there was a 50% split between affirmations and divergences. Statements such as, “The projects are important to control the impacts of climate change” (Municipal interview #1), “I don’t think they (residents) understand the real purpose of the site” (Municipal interview #2), and “our goal is to building resiliency into our infrastructure” (Municipal interview #1). A thematic analysis of this dimension proved challenging. While both the municipality and the public reported an interest in controlling risk and an unknown future, the municipality’s and the public’s perspectives diverged greatly. The municipality’s concerns were long-term macro-planning for climate change and environmental sustainability, while the public’s interests were child safety around the water. So, both groups referenced uncertainty avoidance, but the scale and scope proved difficult to account for;
- (3)
- Based on these findings, the following recommendations, drawn from Hofstede’s cultural theories, are applied specifically to the Trondheim case.
- The municipality may alienate the public by not involving and educating residents about the purposes and uses of projects;
- The public may perceive the municipality as less knowledgeable than they are and question the municipality’s qualifications for executing strategic projects successfully.
- The municipality may come across as heavy-handed, which may cause the public to doubt whether they can be directly negotiated with;
- Engaging with the public may be undermined if negotiations are structured to such an extent that there is little flexibility to address unexpected issues;
- Public confidence may be undermined if the municipality does not emphasize its technical competence.
- The public may resist proposals and projects that have not allowed for public participation and active involvement;
- Public skepticism may increase if precise answers are not provided to all of their questions.
6.3. Masculine versus Feminine (MAS)
- (1)
- With a MAS score of 8, Norway is considered the second-most feminine society in the world after Sweden [48]. Taking care of the environment is important, and Norway is a society that prioritizes caring for others and quality of life, with a focus on “working in order to live”. Equality and solidarity are highly valued, and it is important to make sure that everyone is included. Interaction through dialog is valued, and decision making is expected to be achieved through involvement. Conflicts can be perceived as threatening because they endanger the well-being of everyone; they are expected to be resolved by compromise and negotiation. The municipal score of 29 is 21 points higher than the general population and therefore of particular interest. The divergence indicates that the municipality is more achievement-oriented and assertive;
- (2)
- Finally, this dimension also had a strong correlation between the results of the survey and the thematic analysis of transcripts. The results of Hofstede’s findings were confirmed, with 83% of the 123 statements affirming this divergence. While 72% of statements suggested an awareness of feminine preferences, such as “It is important that the residents understand the solution” (Municipal interview #2), the majority of public statements (86%) confirmed the discrepancy. With statements such as “I just wonder what the municipality is planning, how do they want it here?” (Resident interview #14), “without discussions or guidance by the municipality, they did not feel confident to act on their own” (article 32). Perhaps most directly said, “the municipality is constantly trying to push their agenda through and won’t listen to what the people who live here want” (article 30). In the thematic analysis, the researchers became aware of the tendency for statements to be made that affirm expected social understanding and norms. There was a disconnect between the municipality’s MAS score, municipal statements, and statements collected from the public. Statements made by the municipality diverged from their MAS score 72% of the time, while statements made by the public confirmed the municipality’s MAS score 86% of the time. The collected statements for MAS were also disproportionately attributed to the public, accounting for 78% of the collection. This may reflect a lack of self-awareness on the part of the municipality in their own priorities and approach;
- (3)
- Based on these findings, the following recommendations, drawn from Hofstede’s cultural theories, are applied specifically to the Trondheim case.
- The municipality may not like the expectations that the public has, e.g., involving them in all decisions that affect residents directly before taking such decisions;
- Municipal actors may feel limited in their ability to confront resistance “head on”;
- Presenting the municipal office’s prior accomplishments may not necessarily efficiently assure the public, as “one should not emphasize one’s personal successes”.
- Municipal actors may be upset by the blunt way the public expresses themselves;
- Municipal actors may be annoyed by the fact that the public seems to shy away from tackling conflicting demands head on;
- Municipal actors may feel disempowered by indirect negotiation tactics that residents might prefer.
- Municipal actors may be demotivated from rarely receiving positive feedback about their efforts and what they have accomplished;
- Residents may appear at first to be pushovers, as they seem to avoid conflicts and confrontations;
- The municipality should expect the public to keep a low-profile in public communications;
- Should municipal planners consider using the Hofstede cultural compass tool to inform the process of building consensus and public support?
6.4. Caveats to Current Application and Further Development
7. Conclusions
Author Contributions
Funding
Data Availability Statement
Conflicts of Interest
References
- Pachauri, R.K.; Allen, M.R.; Barros, V.R.; Broome, J.; Cramer, W.; Christ, R.; Church, J.A.; Clarke, L.; Dahe, Q.; Dasgupta, P. Climate Change 2014: Synthesis Report. Contribution of Working Groups I, II and III to the Fifth Assessment Report of the Intergovernmental Panel on Climate Change; IPCC: Geneva, Switzerland, 2014. [Google Scholar]
- Hanssen, G.S.; Mydske, P.K.; Dahle, E. Multi-level coordination of climate change adaptation: By national hierarchical steering or by regional network governance? Local Environ. 2013, 18, 869–887. [Google Scholar] [CrossRef]
- Hanssen-Bauer, I.; Førland, E.J.; Haddeland, I.; Hisdal, H.; Mayer, S.; Nesje, A.; Nilsen, J.E.Ø.; Sandven, S.; Sandø, A.B.; Sorteberg, A.; et al. Klima i Norge 2100—Kunnskapsgrunnlag for Klimatilpasning Oppdatert i 2015; Norwegian Environmental Agency/Norwegian Climate Service Center: Oslo, Norway, 2015. [Google Scholar]
- Wilby, R.L. A review of climate change impacts on the built environment. Built Environ. 2007, 33, 31–45. [Google Scholar] [CrossRef] [Green Version]
- Almås, A.-J.; Lisø, K.R.; Hygen, H.O.; Øyen, C.F.; Thue, J.V. An approach to impact assessments of buildings in a changing climate. Build. Res. Inf. 2011, 39, 227–238. [Google Scholar] [CrossRef]
- RIF Norges Tilstand [RIF Norway State of the Nation]; Rådgivende Ingeniørers Forening [Consulting Engineers’ Association]: Oslo, Norway, 2021.
- Stortinget. Klimatilpasning i Norge [Climate Adaptation in Norway]; Klima- og Miljødepartementet [Ministry of Climate and Environment]: Oslo, Norway, 2013. [Google Scholar]
- Rambøll. Følgeevaluering av Framtidens Byer—Sluttrapport; Rambøll Management Consulting: Oslo, Norway, 2015. [Google Scholar]
- Nilsen, V.; Lier, J.A.; Bjerkholt, J.T.; Lindholm, O.G. Analysing urban floods and combined sewer overflows in a changing climate. J. Water Clim. Chang. 2011, 2, 260–271. [Google Scholar] [CrossRef]
- Chen, Y.; Zhou, H.; Zhang, H.; Du, G.; Zhou, J. Urban flood risk warning under rapid urbanization. Environ. Res. 2015, 139, 3–10. [Google Scholar] [CrossRef]
- Richter, S.; Völker, J. Water Framework Directive—The Way Towards Healthy Waters. Results of the German River Basin Management Plans 2009; Nature Conservation and Nuclear Safety; Federal Ministry for the Environment: Bonn, Germany, 2010. [Google Scholar]
- European Commission, Directorate-General for Environment. The EU Water Framework Directive; Publications Office of the European Union: Luxembourg, 2014; ISBN 978-92-79-36449-5. [Google Scholar]
- European Commission. The Forms and Functions of Green Infrastructure. Available online: https://ec.europa.eu/environment/nature/ecosystems/benefits/index_en.htm (accessed on 4 February 2022).
- Burkhard, R.; Deletic, A.; Craig, A. Techniques for water and wastewater management: A review of techniques and their integration in planning. Urban Water 2000, 2, 197–221. [Google Scholar] [CrossRef]
- Braskerud, B.C.; Paus, K.H.; Ekle, A. Anlegging av regnbed. En billedkavalkade over 4 anlagte regnbed. NVE Rapp. 2013, 3, 2013. [Google Scholar]
- Muthanna, T.M.; Sivertsen, E.; Kliewer, D.; Jotta, L. Coupling field observations and Geographical Information System (GIS)-based analysis for improved Sustainable Urban Drainage Systems (SUDS) performance. Sustainability 2018, 10, 4683. [Google Scholar] [CrossRef] [Green Version]
- Fletcher, T.D.; Shuster, W.; Hunt, W.F.; Ashley, R.; Butler, D.; Arthur, S.; Trowsdale, S.; Barraud, S.; Semadeni-Davies, A.; Bertrand-Krajewski, J.-L.; et al. SUDS, LID, BMPs, WSUD and more—The evolution and application of terminology surrounding urban drainage. Urban Water J. 2015, 12, 525–542. [Google Scholar] [CrossRef]
- Berg, P.G.; Ignatieva, M.; Granvik, M.; Hedfors, P. Green-Blue Infrastructure in Urban-Rural Landscapes-Introducing Resilient Citylands. NA 2014, 25, 11–37. [Google Scholar]
- Miljøforvaltningen, K.K.T. Cph 2025 Climate Plan: A Green, Smart and Carbon Neutral City; The Technical and Environmental Administration: Copenhagen, Denmark, 2012. [Google Scholar]
- Johnson, D.; Geisendorf, S. Are Neighborhood-level SUDS Worth it? An Assessment of the Economic Value of Sustainable Urban Drainage System Scenarios Using Cost-Benefit Analyses. Ecol. Econ. 2019, 158, 194–205. [Google Scholar] [CrossRef]
- Everett, G.; Lamond, J.E.; Morzillo, A.T.; Matsler, A.M.; Chan, F.K.S. Delivering Green Streets: An exploration of changing perceptions and behaviours over time around bioswales in Portland, Oregon. J. Flood Risk Manag. 2018, 11, S973–S985. [Google Scholar] [CrossRef] [Green Version]
- Wagner, M.; Mager, C.; Schmidt, N.; Kiese, N.; Growe, A. Conflicts about Urban Green Spaces in Metropolitan Areas under Conditions of Climate Change: A Multidisciplinary Analysis of Stakeholders’ Perceptions of Planning Processes. Urban Sci. 2019, 3, 15. [Google Scholar] [CrossRef] [Green Version]
- Rassmusen, R.; Sæther, J.E. Fredlydalen Velforening. Available online: http://fredlydalen.synology.me/fdv/Blaklibekken/ (accessed on 4 June 2021).
- Sand, S. Skittfiske, Bokstavelig Talt; Adresseavisen: Trondheim, Norway, 2006. [Google Scholar]
- Thanem, T. Fortviler over Det Forfalte Friområdet i Trondheim: Det ser Ikke ut Her; Adresseavisen: Trondheim, Norway, 2020. [Google Scholar]
- Thodesen, B.; Time, B.; Kvande, T. Sustainable Urban Drainage Systems: Themes of Public Perception—A Case Study. Land 2022, 11, 589. [Google Scholar] [CrossRef]
- O’Connor, C.B.; Levin, P.S. Mental Models for Assessing Impacts of Stormwater on Urban Social–Ecological Systems. Urban Sci. 2023, 7, 14. [Google Scholar] [CrossRef]
- Vannforskriften. Forskrift om Rammer for Vannforvaltningen [Norwegian Regulations on Frameworks for Water Management]; Norwegian Ministry of Climate and Environment: Oslo, Norway, 2006. [Google Scholar]
- Vasseljen, S.; Haug, L.; Ødegård, I.M.; Knotten, V.; Zaccariotto, G. Overvann Som Ressurs. Økt Bruk av Overvann Som Miljøskapende Element i Byer og Tettsteder [Stormwater as a Resource. Increased Use of Stormwater as Environmentally Creating Element in Urban Areas]; Asplan Viak AS, NMBU: Ås, Norway, 2016; pp. 136–145. [Google Scholar]
- Øyen, C.F.; Mellegård, S.E.; Bøhlerengen, T.; Almås, A.-J.; Groven, K.; Aall, C. Bygninger og Infrastruktur-Sårbarhet og Tilpasningsevne til Klimaendringer; SINTEF FAG, Byggforsk: Oslo, Norway, 2014. [Google Scholar]
- Hauge, Å.L.; Almås, A.-J.; Flyen, C.; Stoknes, P.E.; Lohne, J. User guides for the climate adaptation of buildings and infrastructure in Norway–Characteristics and impact. Clim. Serv. 2017, 6, 23–33. [Google Scholar] [CrossRef]
- Rambøll; Kaupang, A. Gode Grep for å Løse Fremtidens Kommunaltekniske Oppgaver [Effective Approaches to solving Future Municipal Engineering Tasks]; Technical Report; Rambøll Norway: Oslo, Norway, 2016. [Google Scholar]
- Armento, S.; Guldhagen, J.F.; Åstebøl, S.O. Ny bydel Fagerheim i Haugesund. Hvordan overvann og blågrønne tiltak er ivaretatt i planleggingen [New district Fagerheim in Haugesund. How surface water and blue-green measures are taken care of in the planning]. In Proceedings of the Blå-Grønne Verdier Vårt Ansvar, Gardermoen, Norway, 6–7 May 2014. [Google Scholar]
- Christensen, R.H. Grøn Klimatilpasning: Udvikling af Københavns Grønne Struktur Gennem Klimatilpasning. [Green Climate Adaptation: Development of Copenhagen’s Green Structure through Climate Adaptation]; Teknik- og Miljøforvaltningen: Copenhagen, Denmark, 2014. [Google Scholar]
- Minkov, M.; Hofstede, G. The evolution of Hofstede’s doctrine. Cross Cult. Manag. Int. J. 2011, 18, 10–20. [Google Scholar] [CrossRef]
- Hofstede, G. Dimensionalizing cultures: The Hofstede model in context. Online Read. Psychol. Cult. 2011, 2, 2307-0919. [Google Scholar] [CrossRef]
- Thodesen, B.; Andenæs, E.; Kvande, T. Mapping municipal-public conflicts over brook restorations—Lessons learned from a case study in Norway. To be submitted.
- Trondheim Municipality Befolkningsstatistikk. Available online: https://www.trondheim.kommune.no/aktuelt/om-kommunen/statistikk/befolkningsstatistikk/ (accessed on 28 February 2023).
- RIF Engineers. State of the Nation—Norges Tilstand 2021; Norwegian Consulting Engineers’ Association: Oslo, Norway, 2021. [Google Scholar]
- Kilnes, C. Her Renner Dritten Fritt. Adressa.No 2011. Available online: https://www.adressa.no/nyheter/trondheim/i/Po9vmJ/her-renner-dritten-fritt (accessed on 24 May 2023).
- Multiconsult. Forstudie for Åpning av Fredlybekken; Trondheim Municipality: Trondheim, Norway, 2009. [Google Scholar]
- Rassmusen, R.; Sæther, J.E. Om Fredlydalen Velforening. Available online: http://fredlydalen.synology.me/fdv/OmVelforeningen (accessed on 4 June 2021).
- Clayton, S.; Devine-Wright, P.; Swim, J.; Bonnes, M.; Steg, L.; Whitmarsh, L.; Carrico, A. Expanding the role for psychology in addressing environmental challenges. Am. Psychol. 2016, 71, 199. [Google Scholar] [CrossRef]
- Nielsen, K.S.; Clayton, S.; Stern, P.C.; Dietz, T.; Capstick, S.; Whitmarsh, L. How psychology can help limit climate change. Am. Psychol. 2021, 76, 130. [Google Scholar] [CrossRef]
- Pearson, A.R.; Schuldt, J.P.; Romero-Canyas, R. Social climate science: A new vista for psychological science. Perspect. Psychol. Sci. 2016, 11, 632–650. [Google Scholar] [CrossRef] [PubMed]
- Tracy, K. Discourse analysis in communication. In The Handbook of Discourse Analysis; John Wiley & Sons: Hoboken, NJ, USA, 2005; pp. 725–749. [Google Scholar]
- Kvale, S.; Brinkmann, S. Interviews: Learning the Craft of Qualitative Research; Sage: Newcastle, UK, 2009. [Google Scholar]
- Hofstede Insights Compare Countries. Available online: https://www.hofstede-insights.com/fi/product/compare-countries/ (accessed on 14 February 2023).
- Wohlin, C. Guidelines for snowballing in systematic literature studies and a replication in software engineering. In Proceedings of the 18th International Conference on Evaluation and Assessment in Software Engineering—EASE’14, London, UK, 13–14 May 2014; ACM Press: London, UK, 2014; pp. 1–10. [Google Scholar]
- Yin, R.K. Case Study Research: Design and Methods; Sage: Newcastle, UK, 2009; Volume 5. [Google Scholar]
- Hofstede Insights Organisational Culture Consulting. Available online: https://www.hofstede-insights.com/ (accessed on 28 March 2023).
- Braun, V.; Clarke, V. Successful Qualitative Research: A Practical Guide for Beginners; Sage: Newcastle, UK, 2013. [Google Scholar]
- Clarke, V.; Braun, V.; Hayfield, N. Thematic analysis. J. Posit. Psychol. 2017, 12, 297–298. [Google Scholar] [CrossRef]
- Maguire, M.; Delahunt, B. Doing a thematic analysis: A practical, step-by-step guide for learning and teaching scholars. All Irel. J. High. Educ. 2017, 9, 3351. [Google Scholar]
- Qi, J.; Barclay, N. Social Barriers and the Hiatus from Successful Green Stormwater Infrastructure Implementation across the US. Hydrology 2021, 8, 10. [Google Scholar] [CrossRef]
- Feng, Y.; Nassauer, J. Community experiences of landscape-based stormwater management practices: A review. Ambio 2022, 51, 1837–1854. [Google Scholar] [CrossRef] [PubMed]
- Everett, G.; Adekola, O.; Lamond, J. Developing a blue-green infrastructure (BGI) community engagement framework template. Urban Des. Int. 2021. [Google Scholar] [CrossRef]
- Nassauer, J.I.; Kosek, S.E.; Corry, R.C. Meeting Public Expectations with Ecological Innovation in Riparian Landscapes. JAWRA J. Am. Water Resour. Assoc. 2001, 37, 1439–1443. [Google Scholar] [CrossRef] [Green Version]
- Lamond, J.; Everett, G. Sustainable Blue-Green Infrastructure: A social practice approach to understanding community preferences and stewardship. Landsc. Urban Plan. 2019, 191, 103639. [Google Scholar] [CrossRef]
- Ureta, J.; Motallebi, M.; Scaroni, A.E.; Lovelace, S.; Ureta, J.C. Understanding the public’s behavior in adopting green stormwater infrastructure. Sustain. Cities Soc. 2021, 69, 102815. [Google Scholar] [CrossRef]
- Lamond, J.; Everett, G. Willing to have, willing to help, or ready to own—Determinants of variants of stewardship social practices around Blue-Green Infrastructure in dense urban communities. Front. Water 2023, 5. [Google Scholar] [CrossRef]
- Keeley, M.; Koburger, A.; Dolowitz, D.P.; Medearis, D.; Nickel, D.; Shuster, W. Perspectives on the Use of Green Infrastructure for Stormwater Management in Cleveland and Milwaukee. Environ. Manag. 2013, 51, 1093–1108. [Google Scholar] [CrossRef]
- Darnthamrongkul, W.; Mozingo, L.A. Toward sustainable stormwater management: Understanding public appreciation and recognition of urban Low Impact Development (LID) in the San Francisco Bay Area. J. Environ. Manag. 2021, 300, 113716. [Google Scholar] [CrossRef]
- Junker, B.; Buchecker, M. Aesthetic preferences versus ecological objectives in river restorations. Landsc. Urban Plan. 2008, 85, 141–154. [Google Scholar] [CrossRef]
- O’Donnell, E.; Maskrey, S.; Everett, G.; Lamond, J. Developing the implicit association test to uncover hidden preferences for sustainable drainage systems. Philos. Trans. R. Soc. A Math. Phys. Eng. Sci. 2020, 378, 20190207. [Google Scholar] [CrossRef] [PubMed]
- Gazzard, M.; Booth, C.A. Perceptions of Teletubbyland: Public Opinions of SuDS Devices Installed at Eco-designed Motorway Service Areas. In Proceedings of the Sustainable Ecological Engineering Design, Ipswich, UK, 11–12 September 2019; Scott, L., Dastbaz, M., Gorse, C., Eds.; Springer International Publishing: Cham, Switzerland, 2020; pp. 105–116. [Google Scholar]
- Williams, J.B.; Jose, R.; Moobela, C.; Hutchinson, D.J.; Wise, R.; Gaterell, M. Residents’ perceptions of sustainable drainage systems as highly functional blue green infrastructure. Landsc. Urban Plan. 2019, 190, 103610. [Google Scholar] [CrossRef]
- Jarvie, J.; Arthur, S.; Beevers, L. Valuing Multiple Benefits, and the Public Perception of SUDS Ponds. Water 2017, 9, 128. [Google Scholar] [CrossRef] [Green Version]
- Zamanifard, H.; Morgan, E.A.; Hadwen, W.L. Community Perceptions and Knowledge of Modern Stormwater Treatment Assets. Urban Sci. 2021, 5, 5. [Google Scholar] [CrossRef]
- Bastien, N.R.P.; Arthur, S.; McLoughlin, M.J. Valuing amenity: Public perceptions of sustainable drainage systems ponds. Water Environ. J. 2012, 26, 19–29. [Google Scholar] [CrossRef]
- Hofstede Insights. How to Read [The Cultural Compass] Report; Hofstede Cultural Compass Survey User Guide; Hofstede Insights: Helsinki, Finland, 2022. [Google Scholar]


| Authors | Reference | Country | Type SUDS | SUDS Location | Study Method | Survey Size (Respondents) |
|---|---|---|---|---|---|---|
| Qi and Barclay | [55] | USA | - | - | Literature review | - |
| Feng and Nassauer | [56] | USA | - | - | Literature review | - |
| Everett et al. | [57] | UK | - | - | Literature review | - |
| Nassauer et al. | [58] | USA | Rivers | - | Literature review | - |
| Lamond and Everett | [59] | UK | Retention pond with reeds, renaturalized river | Residential area, park | Postal survey | 1750, 2467 (299, 329) |
| Ureta et al. | [60] | USA | Rain garden, rainwater barrels, downspout disconnection | Local to private residential properties | Survey | - (1031) |
| Lamond and Everett | [61] | UK | Rainwater barrels, permeable paving, rain gardens | Hypothetical | Face-to-face survey | 500 (500) |
| Keeley et al. | [62] | USA | Adaptation on a city level | - | Semi-structured interviews | 8 (8) |
| Darnthamrongkul and Mozingo | [63] | USA | Various | Various | Survey | 1341 (502) |
| Junker and Buchecker | [64] | Switzerland | Rivers | Hypothetical | Survey | 3500 (1005) |
| O’Donnell et al. | [65] | UK | SUDS Ponds | Public park | Survey | 250 (193) |
| Gazzard and Booth | [66] | UK | Filter trenches, ponds, swales, wetland | Motorway service area | Survey | - (86) |
| Williams et al. | [67] | UK | Various | Housing developments | Survey | 2916 (406) |
| Jarvie et al. | [68] | UK | Ponds (natural and man-made) | Parks, residential areas, woodland, nature reserve | Postal survey | 810 (144) |
| Zamanifard et al. | [69] | Australia | Bioretention basins | Close to residential areas | Survey | - (31) |
| Bastien et al. | [70] | UK | Detention ponds | Close to residential areas | Survey | 400 (108) |
Disclaimer/Publisher’s Note: The statements, opinions and data contained in all publications are solely those of the individual author(s) and contributor(s) and not of MDPI and/or the editor(s). MDPI and/or the editor(s) disclaim responsibility for any injury to people or property resulting from any ideas, methods, instructions or products referred to in the content. |
© 2023 by the authors. Licensee MDPI, Basel, Switzerland. This article is an open access article distributed under the terms and conditions of the Creative Commons Attribution (CC BY) license (https://creativecommons.org/licenses/by/4.0/).
Share and Cite
Thodesen, B.; Andenæs, E.; Bohne, R.A.; Kvande, T. Mapping Public-Planner Conflicts in SUDS Implementation Using Cultural Dimensions—A Case Study. Urban Sci. 2023, 7, 61. https://doi.org/10.3390/urbansci7020061
Thodesen B, Andenæs E, Bohne RA, Kvande T. Mapping Public-Planner Conflicts in SUDS Implementation Using Cultural Dimensions—A Case Study. Urban Science. 2023; 7(2):61. https://doi.org/10.3390/urbansci7020061
Chicago/Turabian StyleThodesen, Bridget, Erlend Andenæs, Rolf André Bohne, and Tore Kvande. 2023. "Mapping Public-Planner Conflicts in SUDS Implementation Using Cultural Dimensions—A Case Study" Urban Science 7, no. 2: 61. https://doi.org/10.3390/urbansci7020061